be equipped for tomorrow‘s materials. · rooted in the semiconductor market with their systems...
TRANSCRIPT
Annual Report 2014
Be equipped for tomorrow‘s materials.

IMPORTANT CONSOLIDATED FIGURES AT A GLANCE
EUR´0002014 2013 2012
adjusted2)
Sales revenues 71,880 64,075 103,252
Industrial Systems 35,572 28,712 44,102
Semiconductor Systems 36,308 35,363 59,150
Gross profit 13,824 8,530 24,442
in % sales revenues 19.2 13.3 23.7
R&D expenses 2,026 2,564 4,707
Operating result (EBIT) -6,305 -9,544 7,047
in % sales revenues -8.8 -14.9 6.8
Consolidated net result -9,974 -7,408 4,707
in % sales revenues -13.9 -11.6 4.6
Earnings per Share (EPS) in EUR1) -0.46 -0.35 0.21
Capital expenditure 918 1,116 2,232
Total assets 89,037 92,363 103,721
Shareholders‘ equity 38,815 50,307 59,866
Equity ratio in % 43.6 54.5 57.7
Employees as of 31.12. 391 424 514
Incoming orders 67,235 80,1333) 59,162
Order backlog 37,905 43,7893) 30,741
Book-to-bill-ratio 0.94 1.25 0.57
Cash Flow from operating activities -4,489 1,765 4,437
1) Circulating shares on average 21,749,988
2) Due to the amended IAS 19 and disclosure of interest the comparative figures have been adjusted.
3) Due to canceled orders the comparative figures have been adjusted.
Sales revenuesEUR´000
Operating result (EBIT)EUR´000
Consolidated net resultEUR´000
2010 2011 2012 2013 2014 2010 2011 2012
2014
2010 2011 2012
2014
120,366132,586
103,252
64,075 12,02714,140
7,047
-6,305
7,5149,141
4,707
-9,974
71,880
2013
-9,544
2013
-7,408

AS A VACUUM SPECIALIST FOR HIGH-TEMPERATURE AND PLASMA TREATMENT PROCESSES, PVA TEPLA AG IS ONE OF THE WORLD´S LEADING SYSTEM ENGINEERING COMPANIES IN THE FIELDS OF HARD METAL SINTERING, CRYSTAL GROWING, THE USE OF PLASMA SYSTEMS FOR SURFACE ACTIVATION AND ULTRA-FINE CLEANING AS WELL AS SYSTEMS FOR QUALITY INSPECTION.
INNOVATIVE DEVELOPMENTSWith its systems and services, PVA TePla enables and supports the innovative manufacturing processes and developments of its customers, primarily in the semiconductor, hard metal, electrical/electronic and optical industries – as well as in the energy, photovoltaic and environmental technologies.
INDIVIDUAL SOLUTIONS The company provides its customers with customized solutions from a single source. These range from technology development through tailor-made design and construction of production facilities right up to an after-sales service that covers all four corners of the globe.
JOINTLY WITH OUR CUSTOMERSThe company will use its systems to enter the latest fields of application jointly with its customers – be they next-generation wafers for use in the semiconductor or photovoltaic industries, powdered-metal technology, new crystals for the optoelectronic industry, fiber-optics for data transmission or the development of high-tech materials and surfaces.
PVA TePla AG
Foreword by the Management Board 4
PVA TEPLA IN FOCUS
Applications for the Semiconductor Industry 6
FOR OUR SHAREHOLDERS
Report from the Supervisory Board 12
PVA TePla on Capital Markets 16
COMBINED MANAGEMENT REPORT 19
GROUP FINANCIAL STATEMENTS 45
Group Notes 52
Responsibility Statement 90
Auditor‘s Report 91
6

4 PVA TePla AG Annual Report 2014
Foreword by the Management Board
DEAR SHAREHOLDERS AND BUSINESS PARTNERS OF PVA TEPLA,
This report provides in-depth information on business de-velopment at PVA TePla, the fiscal situation, and the com-pany as a whole. Let us start with a brief review of the situation:
PVA TePla is one of the world’s most renowned manufactu-rers of high-temperature process and analysis systems for the areas of hard metal, crystal growing, heat treatment, plasma, and the corresponding measuring technology. Our technology portfolio is unique. Over the past fiscal year, we expanded this technology portfolio through innovations. In the area of heat treatment systems, for example, the further development of what is known as a high-vacuum hot press (we are currently building the largest hot press in Europe) can promote the development of new user mar-kets for our systems, for example the aviation industry or the tool industry. New applications for plasma process systems were also developed in the semiconductor / life science / industrial areas, for example a high-speed system for wafer processing or a continuous system for surface coating with water-repellent – or hydrophobic – coats, and these new applications are currently attracting great inte-rest from customers.
We therefore look to the future with optimism. However, we are still far from where we want to go. Our profitability in particular displays a need for action: In the past year, we
again had to report an operating loss that was disappoin-tingly high. Our aim is to avoid the repeated misjudgment of market developments of the last two years, for example that of the solar market, by placing an even more consis-tent focus on our existing and potential customers in the future. This will allow us to establish the preconditions for us to return to profitability for the long term, and therefore also for a positive development of the stock price.
In the second half of the year under review, we initiated a far-reaching process of change in the entire company. This transformation process will improve our competitive edge permanently. All the measures involved in this process have one thing in common: We are seeking to become fas-ter, more flexible, more streamlined, and more efficient, and be characterized by proximity to customers in all that we do. This is why we converted the operating activities of the AG company into smaller, more powerful limited liabili-ty companies under German law (GmbHs) with effect from January 1, 2015, and reduced the number of our accoun-ting areas and administrative processes significantly.
At the same time, we improved our cost structures and initiated consolidation and personnel measures that will make a difference of approximately EUR 5 million in the future. With this strategic alignment of customer proximity and product innovation on the one hand, and cost reduc-tions to reduce break-even sales on the other hand, we are equipped to face the situation in our markets and to leave the losses behind us in 2015.

5
Fore
wor
d
We suffered some setbacks in the past fiscal year. In May, we had to adjust our original forecast for 2014 as a whole, since negotiated orders from Thailand and Russia that we had expected to process had to be removed from the or-der backlog. The difficult political and economic situation in these countries made it impossible to implement these or-ders. In fiscal 2014, this ultimately resulted in consolidated sales revenues of around EUR 72 million and operating ear-nings of EUR -6.3 million, which were due to, for example, the lost earnings contributions and the expenses for the restructuring measures. Nevertheless, our liquidity situa-tion remains positive; cash and cash equivalents amount to EUR 5.7 million, and the equity ratio is more than 43%.
Incoming orders were inconsistent in the past year. In the Vacuum Systems business unit, incoming orders were un-satisfactory due to slow business in the hard metal area. In China, one of our long-established and important markets, a distinct investment restraint was displayed. In contrast, we achieved a higher rate of incoming orders in the Semi-conductor Systems division as compared to the previous year. This is connected with the positive economic situati-on in the semiconductor industry, our product innovations, and a larger order of crystal growing systems from the wa-fer industry that PVA TePla had received in 2014.
For the current fiscal year, we are expecting revenues of between EUR 70 million and EUR 80 million and an EBIT in the order of a break-even result.
Ladies and gentlemen, we have great trust in our company. It is beyond doubt that PVA TePla has the potential to crea-te long-term, lasting value – for you, our shareholders, for our customers, and for our employees. We will put all our energy into implementing this potential, and would like to ask you to accompany us on this journey.
Sincerely,
Peter AbelChief Executive Officer
Oliver HöferChief Operating Officer
Henning DöringChief Financial Officer

Applications for the Semiconductor Industry
Together with software engineering and software application, the semicon-ductor industry will be one of the most important – if not the most impor-tant – driving force for the global economy in the future.


8 PVA TePla AG Annual Report 2014
Crystal Growing Systems for the semiconductor and photovoltaic industry

9
PVA
TeP
la in
Foc
us
The economy is on the threshold to the fourth Industrial Revolution, which is now also known as “Industry 4.0.” The first Industrial Revolution took place when water and steam power were used to mechanize processes that were previously performed by hand. It was followed by the second Industrial Revolution, which saw the arrival of conveyor belts and electric energy that made large-scale production possible. This, in turn, was followed by the third Industrial Revolution, the Digital Revolution, i.e. the use of electronics and IT for the further automation of production. The common understanding is that the fourth Industrial Revolution stands not only for the further digitization of the industry, which allows entire value networks to be cont-rolled and optimized faster, but also for the merging of the real world and the virtual world to an “Internet of Things.”
The companies of the PVA TePla Group have been deeply rooted in the semiconductor market with their systems for decades. Almost all renowned wafer and chip manufactu-rers are familiar with the systems for manufacturing high-purity semiconductor materials and producing electronic components.
The crystal growing system for manufacturing silicon car-bide, which was introduced on the market two years ago, can manufacture semiconductor crystals on an industrial scale; due to their special electronic properties and high temperature resistance, these crystals will be of great im-portance for high-performance electronics. The electronic components manufactured from these crystals will be in great demand on the future mass markets for electric ve-hicles and high efficiency solar cells.
The product range for the semiconductor market is round-ed off by plasma systems for cleaning and modifying wafer surfaces as well as systems for the non-destructive inspec-tion of semiconductor materials. These high-tech systems address markets with a great potential for growth.
THE SEMICONDUCTOR MARKET WILL GROW IN THE LONG TERM
Despite recurring fluctuations, the semiconductor market will continue to grow. The market volume doubled from USD 150 billion (2003) to roughly USD 300 billion (2013) in the last ten years alone, despite the falling prices of micro-chips. An ever-increasing number of applications will help
this development to continue in the future: In addition to in-formation and communication technology, these are, abo-ve all, the decentralized generation and supply of energy, the industry and robotics, the extensive field of electromo-bility including transportation, and LED technology.
IMPROVED SEMICONDUCTORS ARE AN IMPORTANT PREREQUISITE
Silicon carbide, gallium nitride and gallium arsenide are im-portant semiconductor materials. Their specific properties are urgently needed in sophisticated applications such as high-performance electronics. Rectifiers and transformers for photovoltaic systems or electric vehicles must process electric power between 100 and 500 kilowatts in a fast, fail-safe and efficient way and prevent the loss of energy as far as possible. IGBT modules on the basis of silicon carbide and gallium nitride in particular are used for this purpose today. They achieve efficiency levels close to 100%. Silicon carbide or gallium nitride modules only reach their limits at the absolute extremes, such as drive systems for trains, ships or turbines, where transmission capacities can reach up to one gigawatt.
A fully automated acoustic inspection system´s loading subsystem. Used for process control during the production of semiconductors.
10 PVA TePla AG Annual Report 2014
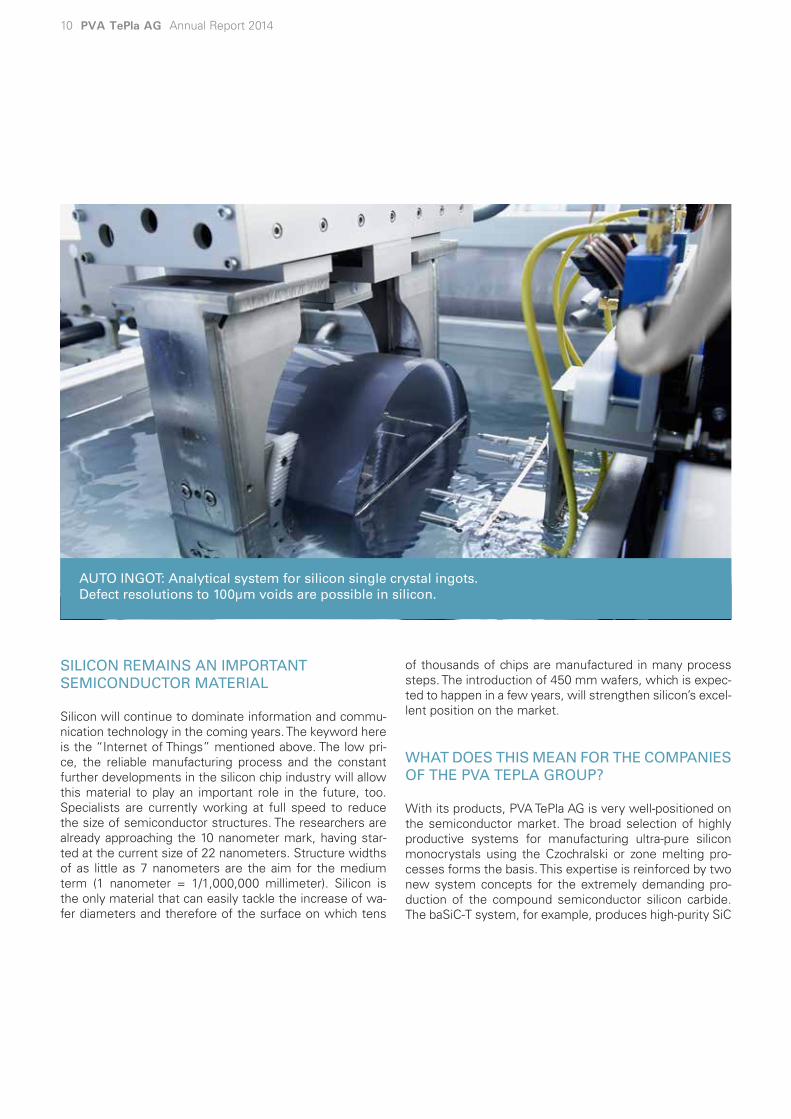
AUTO INGOT: Analytical system for silicon single crystal ingots. Defect resolutions to 100µm voids are possible in silicon.
SILICON REMAINS AN IMPORTANT SEMICONDUCTOR MATERIAL
Silicon will continue to dominate information and commu-nication technology in the coming years. The keyword here is the “Internet of Things” mentioned above. The low pri-ce, the reliable manufacturing process and the constant further developments in the silicon chip industry will allow this material to play an important role in the future, too. Specialists are currently working at full speed to reduce the size of semiconductor structures. The researchers are already approaching the 10 nanometer mark, having star-ted at the current size of 22 nanometers. Structure widths of as little as 7 nanometers are the aim for the medium term (1 nanometer = 1/1,000,000 millimeter). Silicon is the only material that can easily tackle the increase of wa-fer diameters and therefore of the surface on which tens
of thousands of chips are manufactured in many process steps. The introduction of 450 mm wafers, which is expec-ted to happen in a few years, will strengthen silicon’s excel-lent position on the market.
WHAT DOES THIS MEAN FOR THE COMPANIES OF THE PVA TEPLA GROUP?
With its products, PVA TePla AG is very well-positioned on the semiconductor market. The broad selection of highly productive systems for manufacturing ultra-pure silicon monocrystals using the Czochralski or zone melting pro-cesses forms the basis. This expertise is reinforced by two new system concepts for the extremely demanding pro-duction of the compound semiconductor silicon carbide. The baSiC-T system, for example, produces high-purity SiC
11
PVA
TeP
la in
Foc
us
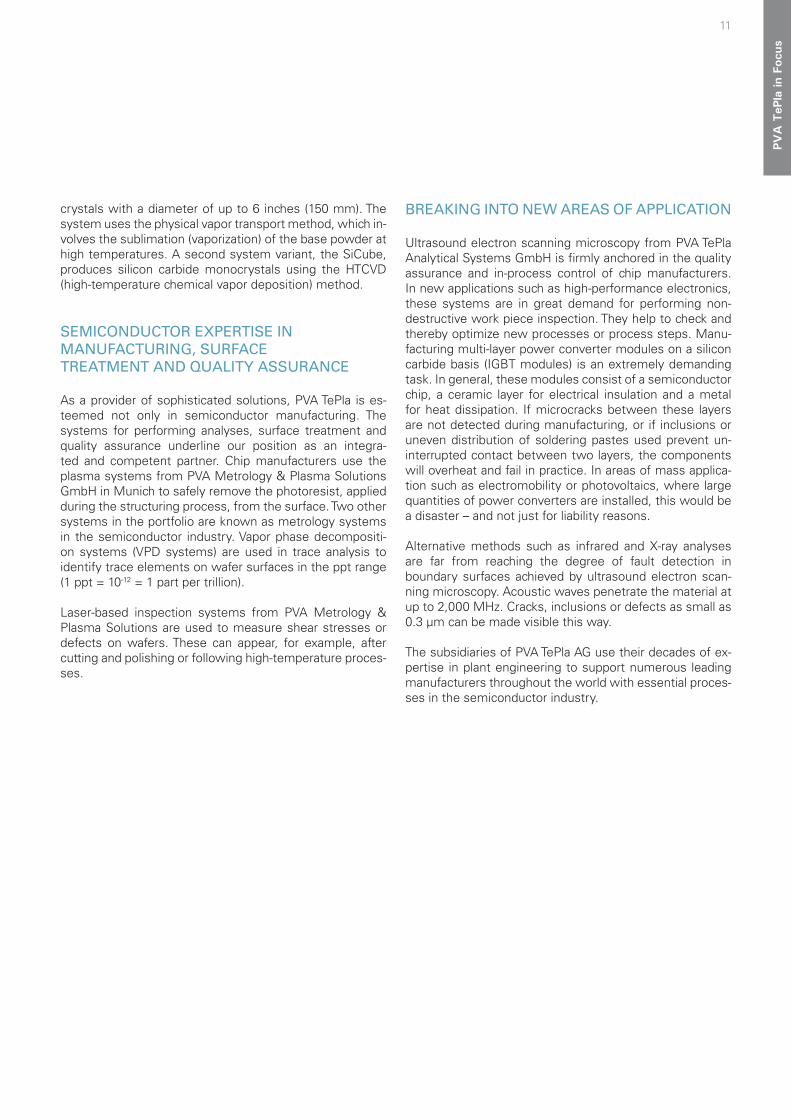
crystals with a diameter of up to 6 inches (150 mm). The system uses the physical vapor transport method, which in-volves the sublimation (vaporization) of the base powder at high temperatures. A second system variant, the SiCube, produces silicon carbide monocrystals using the HTCVD (high-temperature chemical vapor deposition) method.
SEMICONDUCTOR EXPERTISE IN MANUFACTURING, SURFACE TREATMENT AND QUALITY ASSURANCE
As a provider of sophisticated solutions, PVA TePla is es-teemed not only in semiconductor manufacturing. The systems for performing analyses, surface treatment and quality assurance underline our position as an integra-ted and competent partner. Chip manufacturers use the plasma systems from PVA Metrology & Plasma Solutions GmbH in Munich to safely remove the photoresist, applied during the structuring process, from the surface. Two other systems in the portfolio are known as metrology systems in the semiconductor industry. Vapor phase decompositi-on systems (VPD systems) are used in trace analysis to identify trace elements on wafer surfaces in the ppt range (1 ppt = 10-12 = 1 part per trillion).
Laser-based inspection systems from PVA Metrology & Plasma Solutions are used to measure shear stresses or defects on wafers. These can appear, for example, after cutting and polishing or following high-temperature proces-ses.
BREAKING INTO NEW AREAS OF APPLICATION
Ultrasound electron scanning microscopy from PVA TePla Analytical Systems GmbH is firmly anchored in the quality assurance and in-process control of chip manufacturers. In new applications such as high-performance electronics, these systems are in great demand for performing non-destructive work piece inspection. They help to check and thereby optimize new processes or process steps. Manu-facturing multi-layer power converter modules on a silicon carbide basis (IGBT modules) is an extremely demanding task. In general, these modules consist of a semiconductor chip, a ceramic layer for electrical insulation and a metal for heat dissipation. If microcracks between these layers are not detected during manufacturing, or if inclusions or uneven distribution of soldering pastes used prevent un-interrupted contact between two layers, the components will overheat and fail in practice. In areas of mass applica-tion such as electromobility or photovoltaics, where large quantities of power converters are installed, this would be a disaster – and not just for liability reasons.
Alternative methods such as infrared and X-ray analyses are far from reaching the degree of fault detection in boundary surfaces achieved by ultrasound electron scan-ning microscopy. Acoustic waves penetrate the material at up to 2,000 MHz. Cracks, inclusions or defects as small as 0.3 µm can be made visible this way.
The subsidiaries of PVA TePla AG use their decades of ex-pertise in plant engineering to support numerous leading manufacturers throughout the world with essential proces-ses in the semiconductor industry.

12 PVA TePla AG Annual Report 2014
Report from the Supervisory Board
In fiscal year 2014, the Supervisory Board performed all duties required of it according to the law and the Articles of Association, and continuously monitored the work of the Management Board of PVA TePla AG in addition to advising the Management Board on a regular basis. At all times, we had sufficient opportunity to critically address the propo-sed resolutions of the Management Board and put forward suggestions at Supervisory Board meetings on the basis of the detailed written and verbal reports. The Management Board regularly, promptly and comprehensively informed the Supervisory Board with regard to key economic figu-res of the Group and business areas, other fundamental aspects of corporate management and planning, strate-gy, risk management, and compliance. The Management Board informed the Supervisory Board of a variety of busi-ness transactions not requiring approval and discussed them with it. Key topics were the further development of the product portfolio, current developments of the Group companies, the market situation, restructuring issues as well as the reorganization of the Company. The Supervi-sory Board was involved in decisions of fundamental im-portance. The Management Board also regularly reported to the Supervisory Board on the economic development of the Company with monthly reports and risk reports. The Supervisory Board adopted the resolutions required according to the law or the Articles of Association. This was also done by circulation when necessary. In addition to the meetings and reports, my colleagues on the Supervisory Board and I as Chairman of the Supervisory Board also regularly obtained information on the current situation in discussions with the Management Board.
COOPERATION BETWEEN THE SUPERVISORY BOARD AND THE MANAGEMENT BOARD
The meetings of the Supervisory Board were characterized by open and intensive dialog with the Management Board.
The Supervisory Board members were able to compre-hensively prepare for resolutions on the basis of the docu-ments made available by the Management Board before the meetings.
The Supervisory Board met eight times in 2014 – four ordi-nary meetings and four extraordinary meetings. All mem-bers of the Supervisory Board participated in the ordinary and extraordinary meetings. No committees were formed due to the size of the Supervisory Board (three members). All matters that would have been addressed by commit-tees were addressed by the full Supervisory Board.
CONFLICTS OF INTEREST
There were no potential conflicts of interest of Manage-ment Board and Supervisory Board members requiring immediate disclosure to the Supervisory Board and notifi-cation to the Annual General Meeting.

13
For
Our
Sha
reho
lder
s
FOCAL POINTS OF ADVICE
At all of its ordinary meetings, the Supervisory Board dealt with continued weak incoming order situation over the course of 2014 in the product areas important to the PVA TePla Group. The market situation and competitive situati-on were discussed in detail with the Management Board and division heads. The 2013 consolidated financial state-ments and the future financing strategy were discussed in detail at the first ordinary Supervisory Board meeting on March 24. The implementation of the financing strategy was also the object of all subsequent Supervisory Board meetings. The reorganization of the PVA TePla Group resol-ved at the 2014 Annual General Meeting and the individual alternative scenarios for this were also discussed in detail. In addition to the general market outlook of the individual project areas, the quality of results of individual orders in the Vacuum Systems business unit in particular were dis-cussed at the Supervisory Board meeting on June 12/13, 2014. The Management Board explained the capacity utili-zation of the production facilities in Jena and Wettenberg and gave an overview of the status of the closing of the production facility in Frederikssund, Denmark. In the Su-pervisory Board meeting on September 26, the Supervi-sory Board was comprehensively presented with new sys-tem developments and their market potential. The budget for the current fiscal year and potential measures in case of a continuing underutilization of capacities were discussed
in detail. The focus of the Supervisory Board meeting on November 26 was Company planning for 2015 to 2017 for the individual subsidiaries after the reorganization and the effects of the restructuring measures in Wettenberg. The Management Board informed the Supervisory Board with a comprehensive budget planning of all subsidiaries for the coming years, among other items. The four extraordinary Supervisory Board meetings involved discussions on Ma-nagement Board issues, the acquisition of treasury shares, the range of compensation to be applied within the PVA TePla Group, the reorganization of the PVA TePla Group, the closing of the production site in Frederikssund, Den-mark, and the sales revenues and earnings expectations for 2014 and making corresponding resolutions on these items.
CORPORATE GOVERNANCE AND DECLARATION OF COMPLIANCE
At the meeting on November 26, 2014, the Management Board and Supervisory Board discussed items including the update of the declaration of compliance with the Ger-man Corporate Governance Code pursuant to Section 161 of the German Stock Corporation Act (AktG). The updated joint declaration of compliance was made permanently available to the public on the website www.pvatepla.com in the „Investor Relations – Corporate Governance“ section

14 PVA TePla AG Annual Report 2014
in December 2014. Deviations from this Code were dis-cussed intensively between the Management Board and Supervisory Board and justified. The Management Board reports on corporate governance, including for the Super-visory Board, in accordance with Item 3.10 of the Code on the Company‘s website at: http://www.pvatepla.com/pva-tepla-service/investor-relations/corporate-governance.
The election of the auditors „Ebner Stolz GmbH & Co. KG, Wirtschaftsprüfungsgesellschaft Steuerberatungsgesell-schaft“ to audit the financial statements and consolidated financial statements for fiscal year 2014 was proposed to the Annual General Meeting. The Supervisory Board satis-fied itself of the independence of the auditor in accordance with Section 107(3) Sentence 2 AktG, and obtained and assessed a corresponding declaration of independence. In line with a resolution by the Supervisory Board, the auditor performs no consultancy services for the Group. Following approval by the Annual General Meeting, the Supervisory Board issued the mandate to the auditor and set the audit fee. The main focal points of the audits of the annual and consolidated financial statements for 2014 were also coor-dinated between the Supervisory Board and the auditor.
The self-evaluation was performed on the basis of a de-tailed questionnaire and interviews, and the review of the efficiency of the Supervisory Board provided for in the Ger-man Corporate Governance Code was thus carried out.
DEPENDENT COMPANY REPORT
The Management Board prepared a dependent company report in accordance with Section 312(3) AktG. This report was audited by „Ebner Stolz GmbH & Co. KG, Wirtschafts-
prüfungsgesellschaft Steuerberatungsgesellschaft“ and issued with an unqualified audit opinion with the following wording: „In accordance with our duly performed audit and assessment, we confirm that 1) the factual statements in the report are correct, and that 2) the amounts paid by the Companies with respect to the legal transactions listed in the report were not unduly high.“ The dependent compa-ny report was submitted to the Supervisory Board, which subjected it and the legal transactions and measures lis-ted therein to an independent review pursuant to Section 314(2) AktG. This did not give rise to any objections. At the meeting on March 23, 2015, the auditor reported on the main findings of the audit.
ANNUAL FINANCIAL STATEMENTS
Ebner Stolz GmbH & Co. KG, Wirtschaftsprüfungsgesell-schaft Steuerberatungsgesellschaft audited the annual fi-nancial statements and consolidated financial statements to December 31, 2014 as well as the combined manage-ment report and Group management report for the fiscal year 2014 of PVA TePla AG. The auditor found that the pre-sent annual and consolidated financial statements were prepared in compliance with the German Commercial Code (HGB) and the International Financial Reporting Stan-dards (IFRS) and gave an accurate reflection of the actual net assets, financial position, and income situation. The an-nual and consolidated financial statements along with the combined management report and Group management report received an unqualified audit opinion. The financial statements together with the management reports and the respective audit reports by the auditor were sent to each member of the Supervisory Board. The Supervisory Board assessed them and discussed them in detail at the

15
For
Our
Sha
reho
lder
s
meeting on March 23, 2015. At this meeting, the auditor reported on the main findings of the audit. We examined the annual financial statements, the management report and the auditor‘s statement on the situation assessment by the Management Board as well as the recommendati-on for use of retained earnings, the consolidated financi-al statements and the Group management report. There were no objections. We therefore approve the results of the audit of the financial statements. We approve the an-nual financial statements and consolidated financial state-ments prepared by the Management Board. The annual financial statements are thus adopted in accordance with Section 172 Sentence 1 AktG. We are in agreement with the management reports and in particular the assessment of the future development of the Company. The Superviso-ry Board endorses the Management Board‘s proposal not to distribute a dividend due to the net loss for the year and to carry over the reported unappropriated surplus to new account.
COMPOSITION OF THE SUPERVISORY BOARD AND MANAGEMENT BOARD
There were a number of changes to the make-up of the Supervisory Board and the Management Board in the re-porting period. The term of office of the long-serving mem-ber of the Supervisory Board Prof. Günter Bräuer termi-nated at the end of the Annual General Meeting on June 13, 2014. Shareholder representatives elected Prof. Mar-kus Thoma, Head of the Plasma and Astronautics Group at the Institute of Physics of the Justus Liebig University, to the Board in place of Prof. Bräuer. The composition of the Management Board of PVA TePla AG also changed. CEO Dr. Arno Knebelkamp resigned with effect from the end of
the 2014 Annual General Meeting. The Supervisory Board appointed Management Board member Peter Abel as the new CEO as replacement. It has already appointed Hen-ning K.G. Döring as the member of the Management Board with responsibility for finance at the March 2014 meeting.
THANKS
In retrospect, the PVA TePla Group has put another difficult year behind it in 2014, which confronted the Company with a comprehensive staff cost program and a number of new product developments. Due to the restructuring of the Group that took effect in 2015 and an adjustment of the cost structure, the Supervisory Board is convinced that the basis for future profitable growth has been established.
The Supervisory Board will continue to give the Manage-ment Board constructive support in its work. The Supervi-sory Board wishes to thank the management and all em-ployees for their dedicated work in the 2014 fiscal year.
Wettenberg, March 2015
On behalf of the Supervisory Board
Alexander von WitzlebenChairman of the Supervisory Board of PVA TePla AG

16 PVA TePla AG Annual Report 2014
PVA TePla on Capital Markets
DEVELOPMENT OF PVA TEPLA SHARES
For the PVA TePla AG share, 2014 was a difficult year. Things began well at the start of the year. Initially, the share performed much better than the relevant indices. However, after the announcement of the revised sales revenues and earnings forecast, the PVA TePla share found things incre-asingly difficult from the end of May. PVA TePla operates in a generally difficult market environment – especially in the area of photovoltaics and vacuum technology – which is characterized by a trend to consolidation. Positive future business figures, the foundations of which were laid with past restructuring measures and the restructuring of the Group, will again considerably increase the appeal of the PVA TePla share. Since February 2015, the share price has stabilized again.
COMMUNICATION WITH THE CAPITAL MARKET
High transparency of our business activity on capital mar-kets is important for us. Key topics of discussions with private and institutional investors were the long-term per-spectives in the markets serviced by the PVA TePla Group, the restructuring measures taken in the last financial year, the reorganization of the corporate group and the technolo-gy development of products and their market perspectives.
The relevant company presentations are available for download on the company website www.pvatepla.com in the Investor Relations section.
ANNUAL GENERAL MEETING
The Annual General Meeting of PVA TePla AG was held at the Gießen Congress Center on June 13, 2014. The items on the agenda were passed with a large majority, and 40% of shareholders were in attendance. The focus of the mee-ting was the discussion on the restructuring of PVA TePla AG as of January 1, 2015 and the resulting streamlining of the company structures as well as the further reinforce-ment of customer orientation in the individual divisions.
PVA TePla shares key figures 2014 2013
Earnings per share (EPS) EUR -0.46 -0.35
Annual high EUR 3.30 2.99
Annual low EUR 1.56 1.85
Closing rate as of Dec. 31 EUR 1.62 2.55
Performance of PVA TePla shares % -36 +22
Performance of Technology All Share % +15 +41
Performance of DAXSubs. Advanced Industrial Equipment % -13 +60
Number of shares at year-end Mio. 21.75 21.75
Market capitalization at year-end Mio. EUR 35.2 55.5
Shareholding structure
Free float 73.4 %
PA Beteiligungsgesellschaft 26.6 %

17
For
Our
Sha
reho
lder
s50
60
70
80
90
100
110
120
130
140
150
PVA
Dax.Subs
Tec All Share
Performance of PVA TePla shares January 2014 – December 2014in % 1-day-interval
PVA TePla AGDAXSubs. Advanced Industrial Equipment
Tec All Share
2014


19
Com
bine
d M
anag
emen
t Rep
ort
COMBINED MANAGEMENT REPORT
1. BASIC PRINCIPLES OF THE GROUP 20
2. ECONOMIC REPORT 25
3. SUPPLEMENTARY REPORT 33
4. RISK, OPPORTUNITIES AND FORECAST REPORT 33
This financial report comprises the combined Management Report, the consolidated financial statements and the Group Notes. The combined Management Report includes PVA TePla AG as well as the Group, and notes based on the Ger-man Commercial Code. Moreover, the Company Management Declaration and the remuneration report available at http://www.pvatepla.com/pva-tepla-service/investor-relations/corporate-governance form an integral part of the combined Management Report.

20 PVA TePla AG Annual Report 2014
Combined Management Report
1. BASIC PRINCIPLES OF THE GROUP
Business Activities
The PVA TePla Group, headquartered in Wettenberg, Ger-many, offers its customers systems for the production and refinement of high-quality materials, which are processed under high temperature, vacuum and sometimes under pressure conditions and in plasma.
The market for these systems is closely tied to advanced state-of-the-art materials and surface treatment techno-logies including 300mm silicon (Si) wafer technology for semiconductors and high-purity (Si) wafers made of float zone materials as well as wafers made of silicon carbide (SiC) for high-performance electronics, mono- or poly-crys-talline Si wafers for photovoltaics, structural materials for aviation and aerospace, metal powder production techno-logies, such as for hard metals, micro-sensor production technologies (MEMS, Micro Electromechanical Systems) and luminous light sources made from semiconductor diodes (HB LED, High Brightness Light Emitting Diodes),
ultra-thin wafer production technology, and surface treat-ment systems for producing hydrophobic layers on elect-ronic components and for plastics in the life sciences in-dustry. The product portfolio also includes non-destructive inspection and analytical systems for the quality control of manufactured materials (metrology). This allows manufac-turers of high-tech materials and complex semiconductor components to ensure increasingly high quality standards.
Even in future, high-tech materials indisputably have to be produced under vacuum and high temperature conditions, providing PVA TePla with excellent sales opportunities for its products and technologies in the global market.
Reporting Segments
The PVA TePla Group is divided into two divisions: Indust-rial Systems and Semiconductor Systems. The chart provi-des an overview of the organizational units and how subsi-diaries are allocated to the divisions:
INDUSTRIAL SYSTEMS SEMICONDUCTOR SYSTEMS
PVA TePla AG / Vacuum Systems, Wettenberg
PVA Industrial Vacuum Systems GmbH, Wettenberg
PVA Control GmbH, Wettenberg
PVA Löt- und Werkstofftechnik GmbH, Jena
PlaTeG GmbH, Wettenberg
PVA TePla (China) Ltd., Beijing, PR China
PVA TePla AG / Crystal Growing Systems, Wettenberg
PVA Crystal Growing Systems GmbH, Wettenberg
PVA TePla Danmark, Frederikssund, Denmark
PVA TePla AG / Plasma Systems, Kirchheim
PVA Metrology & Plasma Solutions GmbH, Kirchheim
PVA TePla America Inc., Corona, California, USA
PVA TePla Singapore Pte. Ltd., Singapore
PVA TePla Analytical Systems GmbH, Westhausen
Munich Metrology GmbH, Kirchheim
PVA Vakuum Anlagenbau Jena GmbH, Jena
Xi‘an HuaDe CGS Ltd., Xi‘an, PR China
The areas with a grey background represent PVA TePla AG’s operating units.
21
Com
bine
d M
anag
emen
t Rep
ort
CHANGES TO THE REPORTING SEGMENTS
There have been a number of changes to the reporting segments in 2014 compared to the consolidated financial statements as of December 31, 2013. On the one hand, these are due to the previously reported continuation of the former Solar Systems division as a business unit in the Semiconductor Systems division starting in January 2014. The PVA TePla Group now only has two divisions as a re-sult. Two newly founded subsidiaries have also been added to prepare for the reorganization of the PVA TePla Group starting in 2015.
As part of the reorganization carried out as of January 1, 2015, which was approved at last year’s regular Annual Ge-neral Meeting, two subsidiaries were founded in 2014 with the objective of integrating the business operations of the Vacuum Systems and Crystal Growing Systems business units, including float zone systems, into these companies by way of company lease agreements. PVA Industrial Va-cuum Systems GmbH (PVA IVS) will carry on the Vacuum Systems and Plasma Nitriding Systems business units in the Industrial Systems division starting in January 2015. In the Semiconductor Systems division, PVA Crystal Growing Systems GmbH (PVA CGS) is going to carry on the Crystal Growing Systems business unit for the semiconductor and solar markets. The Plasma Systems business unit is being transferred to the existing subsidiary PVA TePla Metrology Systems GmbH, now renamed PVA Metrology & Plasma Solutions GmbH (PVA MPS).
PVA TePla AG will function solely as the management and functional holding company starting on January 1, 2015.
In the course of the reorganization and to further streamli-ne the company structures, JenaWave GmbH was merged with PVA Metrology & Plasma Solutions GmbH, and PVA Vakuum Anlagenbau Jena GmbH into the intermediate hol-ding PVA Jena Immobilien GmbH in 2014. The latter com-pany in turn was subsequently renamed PVA Vakuum Anla-genbau Jena GmbH. Activities ceased at the operating and
production facility for the construction of float zone crystal growing systems in Frederikssund, Denmark, at the end of 2014. Business operations will continue from Wettenberg.
PlaTeG GmbH and Munich Metrology GmbH are being merged with the operating units PVA IVS and PVA MPS with retroactive effect as of January 1, 2015. Due to the reduction in the number of subsidiaries and ac-counting areas, the Company’s organizational structure will be significantly streamlined going forward with a corres-ponding reduction of the cost base.
Corporate Management
Controlling in the PVA TePla Group is based on operational performance indicators related to the income statement (consolidated sales revenues, gross result (gross margin), EBIT (EBIT margin), net profit/loss for the period and seg-ment profit/loss), balance sheet figures such as the equity ratio and liquidity performance indicators such as liquidity position, the net financial position and liquidity reserves.
Most significant financial performance indicators for ma-naging results of operations are consolidated sales reve-nues, gross result and the operating result (EBIT) and the resulting EBIT margin. These figures are calculated on a monthly basis at segment level and represent an essential internal management tool.
The order situation is determined on a monthly basis using the relevant incoming orders and order backlog figures at segment level. The resulting book-to-bill ratio shows the ra-tio of incoming orders to sales revenues in a given period. A book-to-bill ratio above 1 indicates that incoming orders are higher than sales revenues, meaning a future increase in sales revenues can be expected. If the book-to-bill ratio is below 1, it means a decline in sales revenues is to be expected.

22 PVA TePla AG Annual Report 2014
In addition to the monitoring of customers’ and suppliers’ payment targets, liquidity and liquidity reserves in the form of credit and guarantee lines are ongoing monitored and a rolling cash flow forecast is calculated on a monthly basis in order to manage the liquidity situation. The net financial position, the balance of current and non-current financial liabilities and cash, is reported on a quarterly basis. The Group-wide and segment-related weighted average cost of capital (WACC) and average cost of debt are reviewed on an annual basis.
Research and Development
Research and development (R&D) expenses totaled EUR 2.0 million for the Group in the reporting period (previous year: EUR 2.6 million). This year-on-year decrease is due to the reduction in personnel at the crystal growing cen-ter in Wettenberg and at the Jena site in 2013. It should be noted here that the PVA TePla Group frequently carries out the further development of products and processes as part of customer orders, so that the related expenditures are not included in the research and development costs. A selection of R&D activities in the individual divisions is presented in the section below:
In the Industrial Systems division, R&D is largely conduc-ted based on paid customer orders; these costs are there-fore recorded under cost of sales and are not reported se-parately. The pro-rata R&D services are 10% of the total design engineering output. A total of 90% of the design engineering output is for customer-specific system re-quirements. In the course of several customer orders for high vacuum diffusion bonding furnaces with a hydraulic press (hot press), a process control system was developed which makes it possible to regulate the pressing forces while simultaneously limiting the path, respectively to con-trol the pressing stroke while limiting the pressing force – with extremely high precision. This gives the user control of the remaining forming in the diffusion welding process. These systems also incorporate the development of high-precision pressing force distribution (up to 250t) over the entire pressing surface of 600mm x 800mm. Three hot press diffusion bonding systems that were already orde-red are being retrofitted with these functions as well. The hot press is intended for the development and application of diffusion bonding processes of various materials in dif-ferent fields of application (material combinations without filler materials). Systems of this type can join larger work pieces as well as a broader range of harder materials. PVA TePla is currently developing Europe’s largest hot press for a customer order.
In the Plasma Systems business unit of the Semiconductor Systems division, development was concluded for a new high-speed system for activating and cleaning surfaces in low-pressure plasma for the system is to be sold and de-livered to one of Asia’s leading semiconductor manufactu-rers (Advanced Packaging). This inline system with a high throughput offers significantly higher productivity for the customer. The corresponding sensors and data capture are integral for quality assurance and product tracking: Every substrate that is processed – for example lead frames – is captured in the course of the process and made available for evaluation with the corresponding process parameters. This is increasingly demanded by the automobile industry
PVA TePla – Core Controlling ParametersProfitability Orders Liquidity
Sales revenues Incoming orders Net liquidity and liquidity reserves
Gross result (=sales revenue less cost of
sales)
Book-to-bill ratio (ratio of incoming
orders to sales revenues in a given
period)
Net financial positi-on (balance of cur-
rent and noncurrent financial liabilities
and cash)
Operating profit/loss (EBIT) Order backlog

23
Com
bine
d M
anag
emen
t Rep
ort
and manufacturers of mobile communication devices. The system clearly sets itself apart from the competition as a result. Another development supported by a customer or-der involves a single wafer system for wafer diameters up to a maximum of 200mm. This system is aimed in parti-cular at the important markets for power and compound semiconductors. For the power semiconductor and light emitting diode (LED) markets as well as the steadily gro-wing micro electromechanical systems market (MEMS) market, the Plasma Systems business unit developed a ful-ly automated microwave plasma system for removing pho-toresists. In the production of microelectronic components and system technology, these photoresists are needed for photolithography structuring in the sub-micrometer range. In the new “GIGAfab MODULAR” system, removal of the photoresists after the structuring processes is optimized by means of oxygen plasma with microwave excitation. The entire system is modular so that more process cham-bers can be added as the customer’s production capacity increases. The market launch of the GIGAfab MODULAR is planned for near the end of the first quarter of 2015.
In the Analytical Systems business unit, development work was completed on the new series of “dual gantry sys-tems” ultrasound microscopes in fully automated wafer in-spection systems. The dual gantry systems now available in the market support higher scanning speeds and espe-cially stable data capture. This is of increasingly high impor-tance in wafer inspection and in the field of semiconductor packaging (packaging: the chip is joined to a substrate, for example insertion into casing (package) and electrical con-tacting) and DCB module inspection (Direct Copper Bond = new technology for the production of integrated circuits) in the field of electric drive concepts in the automobile in-dustry. The first prototype of an automatic focus process system as well as a new user interface for ultrasound scan-ning microscopes in fault analysis systems were success-fully tested as well. Development also continued in this business unit in the field of acoustic transducers for ultra-sound measuring systems. The 200MHz to 300MHz tech-
nology model series which works with a resolution of 5 microns (µ) has been further adapted to the required uses and application-specific configuration is possible. The new GHz SAM (scanning acoustic microscope) is now equipped with much more precise control of the scanning system with further improvements to the graphical user interface.
Disclosures Relevant to the Right to Take Over
The required disclosures related to the right to take over pursuant to Section 289 (4) and Section 315 (4) of the Ger-man Commercial Code (HGB) are provided below.
COMPOSITION OF SHARE CAPITAL
As of 31 December 2014, the issued share capital of PVA TePla AG consisted of 21,749,988 individual no-par bearer shares with a nominal value of EUR 1.00 each .
RESTRICTIONS OF VOTING RIGHTS OR THE TRANSFER OF SHARES
There are no restrictions of voting rights or the sale/trans-ferability of shares.
SHAREHOLDINGS THAT EXCEED 10% OF VOTING RIGHTS
According to disclosures filed with the Company, PA Be-teiligungsgesellschaft mbH, Wettenberg helds a share of voting rights as of 31 December 2014, above the 10% threshold.

24 PVA TePla AG Annual Report 2014
SHARES WITH SPECIAL RIGHTS THAT IMPART THE RIGHT OF CONTROL
There were and are no shares with special rights that im-part the right of control.
CONTROL OF VOTING RIGHTS BY EMPLOYEES HOLDING SHARES IN THE COMPANY
There is no control of voting rights by employees holding shares in the Company.
APPOINTMENT AND REVOCATION OF MANAGEMENT BOARD MEMBERS
The appointment of PVA TePla AG Management Board members is done in accordance with Section 84 of the German Stock Corporation Act (AktG), and Section 6, Ar-ticles 2 and 3 of the PVA TePla AG Articles of Incorporation. The following is established therein:
» Article 2: The appointment of members of the Manage- ment Board, the revocation of their appointment as well as the concluding, the amendment and the termi- nation of contracts of employment with members of the Management Board are effected by the Supervisory Board. The same applies to the appointment of a member of the Management Board as chairman or as spokesman of the Management Board.» Article 3: The appointment of a member of the Manage- ment Board ends in every case with the completion of his/her 65th year.
AUTHORITY OF THE MANAGEMENT BOARD TO ISSUE OR REPURCHASE SHARES
As of December 31, 2014, the Management Board is au-thorized per Annual General Meeting resolution to issue new shares from authorized capital in the amount of EUR 10,874,994.00 through June 30, 2017. The Management Board is authorized per Annual General Meeting resolution to buy back shares amounting to 10% of authorized capital by June 18, 2018.
COMPANY AGREEMENTS CONTINGENT UPON A CHANGE OF CONTROL AS THE RESULT OF A TAKEOVER OFFER
The current master agreements with the banks are based on a largely unchanged shareholder structure and, in case of a change in control, calls for renegotiation or, in one case, specifies that the bank has a right to cancellation. The provisions for a publicly funded research and development project also include a special right to cancellation in case of a change in control. There are no other agreements that are contingent upon a change of control as the result of a takeover offer.
CHANGE OF CONTROL PROVISION
In the event of a change of control, Executive Board mem-bers receive benefits that should not exceed 150% of the severance payment cap (value of two years‘ compensation including benefits).
Company Management Declaration (Section 289a German Commercial Code)
The Company management declaration according to Sec-tion 289a of the German Commercial Code (HGB) with the remuneration report is part of the Corporate Governance Report, available on the PVA TePla AG website under “In-vestor Relations – Corporate Governance” or directly under this link: www.pvatepla.com/pva-tepla-service/investor-relations/corporate-governance. The remuneration report describes the basics of the remuneration system pursuant to Section 289 no. 5 HGB and also forms an integral part of the 2014 consolidated financial statements of PVA TePla AG.
Dependency Report
In 2014, PA Beteiligungsgesellschaft mbH held the majority of votes at the Annual General Meeting of PVA TePla AG. The Management Board of PVA TePla AG therefore prepa-red a dependency report for fiscal year 2014 pursuant to Section 312 of the AktG.

25
Com
bine
d M
anag
emen
t Rep
ort
The report for fiscal year 2014 contains the following final statement by the Management Board: “We declare that according to the information known to us at this time, our Company engaged in legal transactions with dependent companies pursuant to Section 312 of the AktG and recei-ved appropriate compensation in all cases. The Company did not take or fail to take any reportable measures.“
2. ECONOMIC REPORT
Macroeconomic and Sector Environment
MACROECONOMIC ENVIRONMENT
As a manufacturer of capital goods, the PVA TePla Group was affected by the continued weak development of the global economy last year. Below is a brief outline of the economic development in the PVA TePla Group’s key re-gions: » A slight GDP increase of 0.8% compared to the year before was seen in the Eurozone during 2014.» At 7.4%, GDP growth in China was lower in 2014 compared to previous years. » In the USA, the 2.5% year-on-year GDP increase in 2014 was still significantly below the average growth of 4.2% reached in the 10 years before the financial crisis.
SECTOR ENVIRONMENT
The PVA TePla Group was confronted with a continuing, extremely difficult market environment for some product groups in the past fiscal year. As previously the largest single market for the Vacuum Systems business unit, the hard metal market continued to stagnate so that system sales from the previous years could not be matched in the past fiscal year. Wafer prices continued to fall in the se-miconductor market. Since a lot of capacities for smaller wafer diameters have been taken out of the market, ma-nufacturers in the 300mm wafer segment are increasingly working at their capacity limits. Overall, equipment invest-ments in the semiconductor market increased significantly at around 16% in 2014. The photovoltaics market continued to be defined by a high level of excess capacity in 2014, as it was in previous years, since customers’ willingness to invest remains low.
» According to the German Engineering Federation (VDMA), the mechanical engineering sector in Germany generated a year-on-year increase of around 2% in in- coming orders for 2014. » Global asset investments in the semiconductor industry increased by around 13% in 2014 year on year. » Even with the significant increase of 18% in PV con- struction to 45GW in 2014, the photovoltaic market con- tinued to be defined by excess production capacities.
Business Development
SALES REVENUES
The PVA TePla Group generated 12.2% higher consolida-ted sales revenues of EUR 71.9 million in fiscal year 2014 (previous year: EUR 64.1 million). This increase in sales re-venues is due to higher incoming orders in the second half of 2013. Germany accounted for 29% of consolidated sa-les revenues (previous year: 30%). The importance of the Asian market remains very high and continued to grow as sales revenues increased in the semiconductor segment, with the region accounting for 52% of total sales revenues (previous year: 40%). 11% (previous year: 16%) of total sa-les revenues were generated in other European countries. North America accounted for 7% of total sales revenues (previous year: 10%). Other regions contributed 1% reve-nues (previous year: 4%).
Consolidated Sales Revenues by Region
Europe 11 %
North America 7 %
Other 1 %
Asia 52 %
Germany 29 %

26 PVA TePla AG Annual Report 2014
The section below provides a detailed discussion of sales revenues generated by the Industrial Systems and Semi-conductor Systems division.
The Industrial Systems division generated sales revenue of EUR 35.6 million (previous year: EUR 28.7 million). It accounted for 49% of total sales revenues for the Group. This increase is mainly due to the improvement of inco-ming orders in the second half of 2013. Graphite purifica-tion systems, which were in high demand in these markets during previous years, only made a very minor contribution to the sales revenues of the Industrial Systems division in 2014. Sinter systems for hard metal production accounted for around 50% of system sales in the Vacuum Systems business unit. Even in absolute figures, sales of this sys-tem type were higher than in fiscal year 2013. The sales of systems for brazing materials, such as vacuum disconnec-ting chambers for the electrical industry, remained stable in 2014. There was good news in the form of much high-er sales of melting and casting systems. Systems were delivered to a large German steel producer and a Russian customer.
Sales revenues in the Semiconductor Systems division to-taled EUR 36.3 million in 2014 (previous year: EUR 35.4 mil-lion), therefore contributing 51% of the PVA TePla Group’s total sales revenues. The slight increase in sales revenues is due to crystal growing systems for the semiconductor industry. Sales in the Metrology Systems and Plasma Sys-tems business units, important elements for technology companies along the entire chip production value chain, were on par with the previous year.
PVA TePla AG reported sales revenues of EUR 53.9 mil-lion (previous year: EUR 72.5 million) in its single-entity financial statements. The decline was due to the shift of the timing of revenue recognition according to HGB (with transfer of risk) and IFRS (acc. performance progress ac-cording to percentage-of-completion method) and the fluc-tuating orders.
INCOMING ORDERS
At EUR 67.2 million, total incoming orders for the Group in fiscal year 2014 were significantly lower compared to the previous year (EUR 80.1 million*). The book-to-bill ratio at Group level reflects this with a value of 0.9 (previous year: 1.2*). The development of incoming orders in the Indust-rial Systems division was much weaker compared to the previous year, while incoming orders in the Semiconductor Systems division were up slightly.
The Industrial Systems division recorded incoming orders of EUR 27.3 million (previous year: EUR 46.7 million), or 40% of total incoming orders. Incoming orders were much lower in 2014 compared to 2013 and virtually all areas were affected. A major order from India in 2013 related to the ITER fusion reactor has to be considered here. Around 80% of the orders for vacuum systems came from abroad, with Asian customers in turn accounting for over 50% of all orders. While systems for the production of hard metal still accounted for around 50% of incoming orders in 2014, the number of orders has declined due to the significant increase of capacity in the hard metal sector in the last few years. Incoming orders for brazing systems were not satis-factory either. Fortunately, orders for systems for graphite purification remained stable at the previous year’s level, caused in part by continuing investments in wafer produc-tion by the semiconductor industry.
At EUR 39.9 million, the Semiconductor Systems division recorded higher incoming orders in 2014 than in the pre-vious year (previous year: EUR 33.4 million*), accounting
Consolidated Sales Revenues by DivisionEUR million
Industrial Systems Semiconductor Systems
2013
35.4
28.7
64.1
2012
59.2
44.1
103.3
2014
36.3
35.6
71.9

27
Com
bine
d M
anag
emen
t Rep
ort
for 60% of the PVA TePla Group’s total incoming orders. Increasing system investments in the semiconductor mar-ket benefited the PVA TePla Group in 2014. Greater willing-ness to invest was evident in the Crystal Growing Systems business unit for the semiconductor industry, especially in regards to 300mm technology. Orders for plasma systems accounted for most of the incoming orders in the Semicon-ductor Systems division.
When viewing PVA TePla AG on its own, incoming orders decreased from EUR 62.1 million* in the previous year to EUR 49.8 million in 2014. This includes orders of EUR 4.3 million from other Group companies (previous year: EUR 3.2 million). This reduction of incoming orders was due in particular to lower demand in the Vacuum Systems busi-ness unit in 2014.
ORDER BACKLOG
The PVA TePla Group’s order backlog is reported after de-ducting sales revenues previously recognized applying the percentage of completion method (PoC). The Group’s or-der backlog totaled EUR 37.9 million as of December 31, 2014 (previous year: EUR 43.8* million). The order backlog in the Industrial Systems division as of December 31, 2014 stood at EUR 20.3 million (previous year: EUR 29.0 million). The order backlog of the Semiconductor Systems division stood at EUR 17.6 million (previous year: EUR 14.8 million).
The order backlog of PVA TePla AG – presented indivi-dually here as nominal values in accordance with German accounting principles – totaled EUR 45.7 million (previous year: EUR 55.4 million*).
PRODUCTION
In 2014, systems production and contract processing were performed in Germany at the Wettenberg, Westhausen and Jena locations. The production locations outside Germany were Corona in the USA and Frederikssund in Denmark. The Frederikssund production location was closed on De-cember 31, 2014 in the course of restructuring measures. Vertical integration remained low across all areas. Parts are manufactured in-house only to a minor extent. This means material costs are relatively high in percentage terms, but allows for rapid and flexible adjustment of production ca-pacity as necessary to meet potential changes in demand when the level of incoming orders fluctuates.
After dismissing the temporary workers and reducing staff in 2013, the production capacities at the Jena location were fully utilized in 2014. Due to lower incoming orders and the drop in order backlog, the reduction of personnel at the Wettenberg location was initiated at the end of 2014 in the course of a restructuring program effective starting in Fe-bruary 2015.
Order Income by DivisionEUR million
2012
29.9
29.3
59.2
2013
33.4
46.7
80.1
2014
39.9
27.3
67.2
Industrial Systems Semiconductor Systems
Order Backlog by DivisionEUR million
2012
19.6
11.2
30.7
2013
14.8
29.0
43.8
2014
17.6
20.3
37.9
Industrial Systems Semiconductor Systems
*As reported in the press release dated May 30, 2014, order backlog in the second quarter of 2014 was adjusted for orders that cannot be realized at this time. For this reason, the incoming orders of the Semiconductor Systems division and in the AG’s financial statements in the previous year were adjusted by EUR 8.5 million, and the division’s order backlog by EUR 10.1 million.

28 PVA TePla AG Annual Report 2014
Position
RESULTS OF OPERATIONS
In the second quarter of 2014, the sales revenues forecast for fiscal year 2014 was revised downwards from between EUR 90 million and EUR 100 million to between EUR 70 mil-lion and EUR 80 million. Various cost reduction measures were subsequently initiated in order to adapt break-even sales revenues to the adjusted range of sales revenues. In addition to closing the production location in Denmark, personnel reduction measures were initiated especially at the central Wettenberg production location. The related costs for severance and redundancy payments as well as value adjustments and closure costs negatively impacted the results by EUR 1.6 million. Operating results were also reduced by EUR 2.5 million due to value adjustments on a large solar order in China and order cancellations from Rus-sia and China as well as insolvencies in the solar segment.
Due to these measures and extraordinary influences, the operating loss (EBIT) in fiscal year 2014 was EUR -6.3 mil-lion (previous year: EUR -9.5 million) and the consolidated net result for the period was EUR -10.0 million (previous year: EUR -7.4 million). The EBIT margin amounted to -8.8% (previous year: -14.9%). The return on sales was -14.0% (previous year: -11.6%).
Based on consolidated sales revenues of EUR 71.9 million (previous year: EUR 64.1 million), gross profit amounted to EUR 13.8 million (previous year: EUR 8.5 million). The gross margin was 19.2% (previous year: 13.3%). This improve-ment is mainly due to the significant rise in capacity utiliza-tion thanks to the cost reduction measures implemented in previous years.
Selling and distributing expenses amounted to EUR 8.1 mil-lion (previous year: EUR 7.8 million). The slight increase is due to the higher volume of sales revenues, which resulted in a rise in sales commission. Selling and distributing ex-penses also include provisions for the personnel measures in Wettenberg at the end of 2014. Administrative expenses fell to EUR 7.1 million (previous year: EUR 8.2 million) due to the personnel measures commenced in 2013. They still include expenses for severance payments due to the per-sonnel measures implemented in Wettenberg at the end of 2014. R&D expenses declined to EUR 2.0 million (previous year: EUR 2.6 million). The net balance of other operating expenses and income came to EUR -2.9 million (previous year: EUR 0.5 million).
Other operating income of EUR 2.7 million (previous year: EUR 2.8 million) mainly consists of subsidies for R&D pro-jects, income from exchange rate differences and the re-lease of provisions.
As the operating result and the individual functional ex-penses were impacted by one-off expenses for severance payments, value adjustments and other restructuring on the one hand and income from the release of provisions on the other hand, the following breakdown provides an overview of the amount relating to the one-off effects and the structure of functional expenses:
The one-off effects totaled EUR 4.0 million and affected the cost of sales by EUR 1.0 million. This includes EUR 0.5 mil-lion in value adjustments on inventories of the former Den-mark location and EUR 0.5 million in severance payments for adjusting the personnel capacity to the reduced order backlog at the Denmark and Wettenberg locations. Selling and distributing expenses were increased by severance payments of EUR 0.1 million. Administrative expenses include one-time legal and consulting fees related to the reorganization that was initiated, and planned refinancing of EUR 0.3 million, severance payments of EUR 0.3 million and expenditures related to closing the Denmark location.
EUR‘000
Jan. 01 - Dec. 31,
2014
one-off effects
Total2014
adjusted
Sales revenues 71,880 0 71,880
Cost of sales -58,056 1,007 -57,049
Gross profit 13,824 1,007 14,831
Selling and distribu-ting expenses -8,074 136 -7,937
General adminis- trative expenses -7,098 672 -6,426
Research and deve-lopment expenses -2,026 0 -2,026
Other operating income 2,671 -889 1,782
Other operating expenses -5,602 3,077 -2,525
Operating result -6,305 4,003 -2,302
Gross margin 19.2 % 20.6 %Overhead-costs -20,129 -17,133
29
Com
bine
d M
anag
emen
t Rep
ort
Other operating expenses include value adjustments on fu-ture receivables from production orders for projects in the solar segment that will no longer be realized and Russia, in the amount of EUR 2.5 million, and value adjustments on trade receivables of EUR 0.5 million. The gross margin ad-justed for one-off effects in the past fiscal year was 20.6% and therefore 0.9% above the adjusted gross margin of the previous year (19.7%). Adjusted EBIT came to EUR -2.3 million (previous year: EUR -3.3 million).
The relatively low volume of sales revenues and the pre-viously mentioned restructuring measures affected both divisions. EBIT in the Industrial Systems division was EUR -0.9 million (previous year: EUR -3.0 million). The Semicon-ductor Systems division generated EBIT of EUR -5.4 milli-on (previous year: EUR -6.6 million).
The net balance of interest income and interest expenses came to a total of EUR -1.1 million (previous year: EUR -0.8 million). The results before taxes were EUR -7.5 million (previous year: EUR -10.3 million) and the consolidated net result for the year amounted to EUR -10.0 million (previous year: EUR -7.4 million). Income tax of EUR -2.5 million (pre-vious year: EUR +2.9 million) consists of the current tax ex-pense of EUR -0.1 million (previous year: EUR -1.2 million) and deferred tax expenses of EUR -2.4 million (previous year: EUR +4.1 million).
Due to volatility in the market environment and repeated budget deviations in the past years, the time period for de-termining whether loss carry-forwards can be realized was limited to three years. Insofar as the availment of loss-carry forwards appears realistic based on the current budget for 2015 through 2017, loss carry-forwards were recognized in deferred tax assets. Conversely, loss carry-forwards that are not expected to be realized until after 2017 were not or no longer capitalized. This limitation of the forecasting period resulted in a correction of deferred tax assets from loss carry-forwards that was expensed in the amount of EUR 2.4 million.
In fiscal year 2014, PVA TePla AG generated sales reve-nues of EUR 53.9 million (previous year: EUR 72.5 milli-on). Gross profit amounted to EUR 4.8 million (previous year: EUR 7.3 Mio. EUR) and the gross margin was 8.9% (previous year: 10.0%). Since the realization of profit using the percentage of completion method according to IAS 11 does not apply in the annual financial statements un-der commercial law, value adjustments of EUR 2.1 million on inventories for solar orders according to the German
Commercial Code (HGB) were not reported under other operating expenses but as production costs. These value adjustments reduced the gross margin by 3.9%. Selling and distribution expenses amounted to EUR 5.7 million, up on the previous year’s value of EUR 5.3 million. Admi-nistrative expenses were EUR 5.0 million (previous year: EUR 5.7 million). R&D expenses were EUR 1.0 million (previous year: EUR 1.2 million). At EUR 5.6 million, other operating income came in above the figure for the previous year (EUR 3.8 million), as did other operating expenses at EUR 4.7 million (previous year: EUR 3.5 million). Income transfer agreements with subsidiaries generated EUR 0.2 million (previous year: EUR 0.6 million). Income from sub-sidiary profit distribution amounted to EUR 1.6 million (pre-vious year: EUR 1.0 million). Income transfer agreements with subsidiaries resulted in expenses of EUR 0.9 million (previous year: EUR 2.7 million). Interest expenses totaled EUR 1.0 million (previous year: EUR 1.1 million). Interest income stood at EUR 0.6 million (previous year: EUR 0.7 million). Extraordinary income of EUR 0.2 million (pre-vious year: EUR 0.1 million) includes proceeds from the reinstatement of a waived loan with debtor warrant to a subsidiary. Income tax expenses totaled EUR 0.02 milli-on (previous year: EUR 1.2 million). Overall, PVA TePla AG’s result from ordinary business activities came to EUR -5.7 million (previous year: EUR -6.0 million) and its net loss for the year amounted to EUR -5.6 million (previous year: EUR -7.4 million). The results of operations of PVA TePla AG were largely impacted by the same reasons that were already explained regarding the results of operations of the Group.
Comparison of Results of Operations with Forecast for 2014
For fiscal year 2014, the Management Board of the PVA TePla Group had expected consolidated sales revenues of EUR 90 million to EUR 100 million and a positive operating result and EBIT margin of 2% to 4%. This forecast was supported by an order backlog of EUR 53.9 million on De-cember 31, 2013 and the assumption that anticipated inco-ming orders in the first half of 2014 would generate sales revenues and earnings. At the end of May 2014, it became apparent that two contractually guaranteed orders from the solar industry from 2013 would not be realized. The or-der backlog was then adjusted and a new sales revenues target in the range of EUR 70 million to EUR 80 million was released. During the first two quarters of 2014, it also became clear that incoming orders had lagged far behind expectations, especially in the Vacuum Systems business unit. The absence of contributions to earnings due to lo-

30 PVA TePla AG Annual Report 2014
wer consolidated sales revenues that resulted from this, as well as the poorer order situation for projects – mainly orders from the solar industry – meant the estimated ope-rating result also had to be revised and was now forecast to be in the range of EUR -6 million. In the course of further cost optimization in the Group, the Management Board also decided to close the operating and production facility for float zone crystal growing systems in Frederikssund, Denmark by the end of 2014 and to carry on the business in Wettenberg. These measures were followed by the re-structuring of the Wettenberg location in November 2014, with a significant reduction in personnel expenses. This re-duced the break-even point with the objective of remaining profitable even with lower sales revenues.
FINANCIAL POSITION
Capital Structure
PVA TePla AG was able to finance the operating costs and cash-effective special effects in fiscal year 2014 from its own resources and with bank loans. The net financial posi-tion (balance of cash and current and non-current financial liabilities) amounted to EUR -6.9 million at the end of the year. Compared to total assets, the net debt ratio is there-fore 8%.
The development during the course of the year and in par-ticular the cost savings and restructuring measures com-pelled us to cooperate more closely with our banks. In the second half of the year, one of our banks was commis-sioned to arrange a syndicated loan for a EUR 10 million mixed line (cash and guarantee lines) and EUR 25 million guarantee lines by mid-2015. Currently, the cash lines, with availment of only EUR 0.1 million on the reporting date, total EUR 14 million. The guarantee lines were EUR 37.5 million on the reporting date with availment of EUR 14.9 million.
Effective March 3, 2014, PVA TePla AG terminated two fixed-interest real estate loans, which were secured by charges and land, for a new building in Wettenberg for EUR 5,684 thousand and combined them into a new loan of EUR 6,000 thousand with a term until January 2023. The
termination of the loans resulted in one-off and non-cash-effective expense of EUR 216 thousand for the reversal of debt discounts in 2014. The refinancing was prompted by the low interest rate phase on the basis of a variable 6-month EURIBOR plus a margin of 0.65%. PVA TePla ex-pects considerable interest savings in the short and mid-term from these measures compared to the previous real estate financing.
The new loan was synchronized with existing interest hedging transactions for a total of EUR 6,000 thousand. However, effectiveness between the new underlying tran-sactions and existing hedging transactions could not be achieved on the reporting date according to IFRS. The ne-gative fair value of these hedging transactions was valued at EUR -972 thousand on December 31, 2014. Fair value changes are therefore recorded through profit or loss ac-cording to IFRS.
A credit line (December 31, 2014: EUR 5,333 thousand) secured by charges on land, which is available to the Com-pany until December 2022, was utilized in the course of the year.
Investments
At EUR 0.9 million (previous year: EUR 1.1 million), the ove-rall level of investments in 2014 was slightly lower than in the previous year. These investments mainly related to operating and office equipment, technical facilities and in-vestments in IT software.
From the perspective of PVA TePla AG as a single enti-ty, the value of investments in 2014 was EUR 3.6 million (previous year: EUR 0.5 million). The pronounced increase is due on the one hand to the addition of an unimpaired receivable of PVA TePla to the capital reserve of PVA TePla America in the amount of EUR 2.1 million, and on the other hand to the capital stock increases of the newly founded subsidiaries PVA Industrial Vacuum Systems GmbH and PVA Crystal Growing Systems GmbH as well as the sub-sidiary PVA Metrology & Plasma Solutions GmbH. Other smaller investments were made in CAD software and tech-nical facilities as well as in operating and office equipment.

31
Com
bine
d M
anag
emen
t Rep
ort
Liquidity
Operating cash flow was negative in 2014 at EUR -4.5 million (previous year: EUR +1.8 million). This was mainly due to two effects. The first was severance payments and the related payments for the restructuring programs in the amount of EUR 1.0 million. The second was incoming or-ders – especially for vacuum systems – which were lower in the second half of 2014 compared to the second half of 2013, so that advance payments on projects were also lower. Operating cash flow fluctuates heavily from one re-porting date to the next in the Vacuum Systems and Crystal Growing Systems business units due to the project struc-ture of orders and methods of payment. We receive con-siderable advance payments at the beginning of a project, which influence net cash flow positively if there are lar-ge orders. Cash flow is negative during order processing, whereas near the delivery date, the remaining amount due is paid, except for a small residual installment.
Due to the extent of the investment measures described above, cash flow from investing activities was EUR -0.9 million (previous year: EUR -1.2 million). Cash flow from financing activities was EUR +4.3 million (previous year: EUR -4.0 million) and – in addition to the disclosed refinan-cing of real estate – includes drawing down a real estate credit line for operating funds in the amount of EUR 5.3 million. Scheduled long-term loan amortization totaled EUR 1.4 million (previous year: EUR 1.2 million). Interest pay-ments totaled EUR 0.4 million (previous year: EUR 0.7 mil-lion). Total cash flow in fiscal year 2014 including exchange rate differences amounted to EUR -1.1 million (previous year: EUR -3.4 million). The liquidity position of the PVA TePla Group remains positive. The net financial position amounted to EUR -6.9 million.
ASSET POSITION
Total assets on December 31, 2014 at EUR 89.0 million were below the value on December 31, 2013 at EUR 92.4 million.
Non-current assets fell by around 7% to EUR 43.2 million (previous year: EUR 46.7 million). The value of property, plant and equipment at EUR 29.8 million (previous year:
EUR 31.0 million) declined slightly due to the investments described above in conjunction with scheduled deprecia-tion. The value of intangible assets was more or less un-changed at EUR 8.7 million (previous year: EUR 8.8 mil-lion); these assets include derivative goodwill of EUR 7.8 million, which is tested for impairment at least once a year. The largest change was caused by the decrease in defer-red tax assets to EUR 4.3 million (previous year: EUR 6.5 million) as the time period for determining the realizable va-lue of loss carry-forwards was limited to three years after the balance sheet date.
Current assets remained virtually unchanged at EUR 45.8 million (previous year: EUR 45.7 million). The largest change was caused by an increase in work in progress to EUR 11.9 million (previous year: EUR 8.1 million).
Due to future receivables from production orders in the so-lar market that were not recoverable, these were reclassi-fied to unfinished goods in the amount of EUR 3.9 million. Advance payments of EUR 3.1 million were received for these orders, which were offset in the previous year’s fi-nancial statements based on the percentage of completion according to IAS 11. This exit from the reporting method according to IAS 11 therefore resulted in a balance sheet extension of EUR 3.1 million. In addition to the reclassifica-tion mentioned above, the decrease in future receivables from production orders to EUR 7.5 million (previous year: EUR 8.1 million) was due to decreasing sales revenues in the fourth quarter of 2014. Weaker sales in the closing quar-ter also led to the decrease in trade receivables to EUR 7.7 million (previous year: EUR 9.6 million) and the decrease in raw materials, consumables and operating supplies to EUR 6.9 million (previous year: EUR 8.3 million). Raw materials, consumables and operating supplies were also negatively impacted by value adjustments of EUR 2.6 million. Cash and cash equivalents fell to EUR 5.7 million because of negative operating cash flow (previous year: EUR 6.6 milli-on). Other current receivables increased slightly to EUR 1.9 million (previous year: EUR 1.6 million), especially due to the receivables for input tax refunds and the recognition of accruals on the assets side. The tax refund claims totaled EUR 0.3 million (previous year: EUR 0.1 million).
On the liabilities side of the balance sheet, non-current lia-bilities (including non-current provisions) increased to EUR 21.8 million (previous year: EUR 20.5 million). The repor-

32 PVA TePla AG Annual Report 2014
ted pension provisions increased due to the low-interest phase and the resulting decrease in the discount rate by 1.2%-points to EUR 14.0 million (previous year: EUR 11.4 million). Non-current financial liabilities decreased to EUR 5.8 million (previous year: EUR 6.5 million) due to the sche-duled repayment of bank loans. Deferred tax liabilities de-creased to EUR 1.0 million (previous year: EUR 1.4 million). Other non-current provisions were reduced mainly by the payout of a long-term remuneration component after the resignation of the former CEO.
Current liabilities increased to EUR 28.4 million (previous year: EUR 21.5 million). Due to the negative operating cash flow, a previously unused long-term approved real estate credit line was used to finance working capital. Advance payments on orders rose to EUR 12.9 million (previous year: EUR 8.3 million). The rise was due in particular to the fact that construction contracts amounting to EUR 3.9 mil-lion arising from coming receivables on construction con-tracts were reclassified to work in progress. These orders were offset by advance payments received amounting to EUR 3.1 million, which were disclosed with the stage of completion in the previous year’s financial statements in accordance with IAS 11. It should be noted that only pay-ments received at the inception of the order or partial payments that do not correspond to the progress of com-pletion are presented separately as advance payments. Otherwise they are netted against construction contracts and reported under coming receivables on construction contracts (asset) or under obligations on construction or-ders (liability).
Trade payables fell significantly due to the reduction of in-coming orders, to EUR 1.6 million (previous year: EUR 3.2 million).
The value of other provisions fell slightly to EUR 1.6 million (previous year: EUR 1.9 million). Debt accruals fell to EUR 4.1 million (previous year: EUR 5.7 million) because of re-duced provisions for outstanding invoices and the drop in provisions for severance payments. Tax provisions are EUR 0.2 million (previous year: EUR 0.2 million) and include pro-visions for the payment of tax arrears for the assessment periods of 2007 through 2011 following the completion of a tax audit.
Shareholders’ equity decreased to EUR 38.8 million (pre-vious year: EUR 50.3 million) as a result of the net loss for the period of EUR -10.0 million (previous year: EUR -7.4 million) and due to changes in the value of pension provi-sions recorded directly in shareholders’ equity at EUR -1.7 million, which were partly offset by minor currency trans-lation effects. Together with lower total assets, the equity ratio decreased from 54.5% in the previous year to 43.6%.
Total assets of PVA TePla AG as of December 31, 2014 declined year on year from EUR 74.1 million to EUR 67.5 million.
Fixed assets amount to EUR 35.1 million (previous year: EUR 32.9 million). The value of intangible assets increased from EUR 0.1 million in the previous year to EUR 0.2 milli-on due to the addition of CAD software. Given the invest-ments described above, the value of property, plant and equipment declined slightly, from EUR 23.9 million in the previous year to EUR 23.1 million. Financial assets incre-ased by EUR 2.9 million year on year to EUR 11.7 million (previous year: EUR 8.8 million). This is due to the founding and capitalization of subsidiaries as part of the reorganizati-on. The companies PVA Industrial Vacuum Systems GmbH, PVA Crystal Growing Systems GmbH and PVA Metrology & Plasma Solutions GmbH each received EUR 0.25 milli-on in capital stock. An unimpaired receivable of PVA TePla in the amount of EUR 2.1 million was also transferred to the capital reserve of PVA TePla America Inc. At the level of PVA TePla, this led to a corresponding asset exchange and simultaneous increase in the carrying amount of the investment.
Total inventories came to EUR 6.0 million, up from the pre-vious-year figure of EUR 5.6 million. Of this amount, the fi-gure for finished products and goods remained unchanged at EUR 1.7 million (previous year: EUR 1.7 million). Work in progress increased to EUR 17.5 million due to the proces-sing of existing orders and the delivery of stock systems ordered within the Group (previous year: EUR 14.3 million). The value of raw materials, consumables and operating supplies fell to EUR 2.6 million (previous year: EUR 4.2 mil-lion) due to value adjustments, the decline in sales reve-nues during the fourth quarter and the intra-Group transfer of raw materials, consumables and operating supplies for

33
Com
bine
d M
anag
emen
t Rep
ort
the semiconductor segment to the Jena production loca-tion (internal Group sale at carrying amounts). The volume of deducted advance payments received on orders totaled EUR 16.4 million (previous year: EUR 15.2 million).
Trade receivables declined year on year from EUR 4.9 mil-lion to EUR 4.1 million due to the development of sales re-venues. Receivables from affiliated companies fell to EUR 18.9 million (previous year: EUR 24.5 million). Other assets increased to EUR 1.2 million (previous year: EUR 0.7 milli-on) primarily as a result of tax receivables. Cash and cash equivalents declined to EUR 2.1 million (previous year: EUR 5.0 million) as a result of cash flow developments.
On the liabilities side of the balance sheet, liabilities in-creased to EUR 16.1 million (previous year: EUR 14.0 mil-lion), primarily due to the rise in liabilities to banks after drawing down a real estate credit line for operating funds. The main reason for the decrease in payables to affiliated companies to EUR 3.7 million was the reduction in trade payables (previous year: EUR 6.4 million). The reduction in trade payables was due to the decline in incoming orders. Pension provisions increased to EUR 9.9 million (previous year: EUR 9.3 million) due to the lower discount rate. The underlying pension schemes were taken on from previous companies and contain only existing commitments. New pension obligations are generally no longer entered into. Tax provisions amounted to EUR 0.1 million (previous year: EUR 0.2 million). Other provisions fell to EUR 5.1 million (previous year: EUR 8.6 million) since provisions of EUR 1.8 million for potential losses relating to internal orders for stock systems were able to be offset against inventories after the systems were delivered.
Equity totaled EUR 36.4 million (previous year: EUR 42.1 million). The equity ratio is now 54.0% (previous year: 56.8%). Retained earnings amount to EUR 12.5 million (previous year: EUR 18.1 million).
EMPLOYEES
The Group had 391 employees on the balance sheet date (previous year: 424 employees). The number of employees has already dropped significantly as against December 31, 2013 due to measures implemented at the end of 2014 to
reduce personnel costs and as a result of natural turnover. All divisions were affected by these measures. The number of employees in the Industrial Systems division fell from 243 (previous year) to 231. In this division, the main effect of the personnel measures from the end of 2014 will only be felt in the course of the current fiscal year. In the Se-miconductor Systems division, the number of employees was reduced to 160 as of December 31, 2014 (previous year: 181*). From a regional perspective, the largest share of employees by far is in Europe at 346 (previous year: 377). There were 26 employees in the USA at the end of 2014 (previous year: 29), while 19 people were employed in Asia (previous year: 18). In fiscal year 2014, the number of apprentices in the PVA TePla Group amounted to eleven. These young men and women were being trained in com-mercial or industrial professions.
PVA TePla AG employed a workforce of 251 at the end of 2014 (previous year: 280). One of whom is employed in Frederikssund (Denmark) (previous year: 14). The activi-ties at the operating establishment located there ceased on December 31, 2014 and were relocated to Wettenberg.
3. SUPPLEMENTARY REPORT
There are no significant events to report after the end of the fiscal year.
4. RISK, OPPORTUNITIES AND FORECAST REPORT
Risk and Opportunities Report
The divisions of the PVA TePla Group are exposed to an array of risks that are inextricably linked to corporate acti-vities. Risk is understood to be the possibility of events or activities jeopardizing the ability of the Group or one of its divisions to reach its targets. At the same time, it is also important for the PVA TePla Group to identify opportunities
*The previous--year figure for the Semiconductor Systems division also includes the employees of the former Solar Systems division.

34 PVA TePla AG Annual Report 2014
for the company, take advantage of these opportunities and reinforce the Group’s competitive position. Risks and opportunities are not offset against one another. Risks and opportunities are presented as follows.
Risks are assessed on the basis of probability of occur-rence as either improbable, possible or probable, as well as in terms of the potential scale of the risk. In assessing the extent, the effect is considered before actions (gross risks) on principle in relation to the operating result (EBIT) of PVA TePla Group.
RISK AND OPPORTUNITIES STRATEGY
The risk and opportunity strategy is embedded in the corpo-rate strategy and is designed to secure the continuation of the Company as a going concern and guarantee its further development. The resulting strategy assesses the risk and opportunities of business activities. In the core activities of the Company/the Group, we make a conscious decision to enter into limited and containable risks, if they make appropriate compensation likely or are inevitable. In some cases, we allocate the risks to other parties. This mainly in-cludes concluding suitable insurance policies. This process is conducted in close cooperation with an experienced and specialized insurance broker. It is regularly reviewed for ef-ficiency and optimized where necessary.
Other risks, which are not related to core and support pro-cesses, are avoided as far as possible. A “Risk Manual” has been made available to the members of the Manage-ment Board and employees, which includes instructions on processes and a catalog of measures to safeguard approp-riate and sustainable risk management. The manual details
Assessment of probability of occurrence / Potential scale
Level Probability of occurrence
Improbable 0% < Probability of occurrence ≤ 20%
Possible 20% < Probability of occurrence ≤ 70%
Probable 70% < Probability of occurrence ≤ 100%
Level Potential scale
Low EUR 0 < Scale < EUR 500 thousand
Moderate EUR 500 thousand ≤ Scale < EUR 1.000 thousand
High Scale ≥ EUR 1.000 thousand
the concrete processes involved in risk management. It aims at the completeness of all risk-related activities and measures, i.e. the identification, assessment, controlling, reporting and monitoring of risks. Based on defined risk categories, risks at divisions, operating units as well as central units are identified and assessed according to their likelihood and potential damage.
RISK MANAGEMENT
Due to the organizational structure of the Company, risk management is carried out locally in the divisions and, in future, at the subsidiaries and business processes. The divisions’ managers, and future Managing Directors, are therefore responsible for central processes of the risk ma-nagement system. The main objective of the risk manage-ment system is the early recognition of risks, in order to regularly provide the Management Board with up to date information on the current risk situation within PVA TePla. The Management determines the limits for the reporting structure. The duties of those in charge include developing and where necessary installing measures to prevent, miti-gate and hedge against risks. The main risks as well as the implemented measures are regularly monitored.
The risk reports are regularly compiled and analyzed by central risk management and checked and discussed by the Management Board and Supervisory Board. In addition to regular reporting, a reporting system has been installed

35
Com
bine
d M
anag
emen
t Rep
ort
within the Group to immediately report the occurrence of unexpected risks. The system also includes an annual risk inventory, in which all of the risks relevant to the Group are reported and their relevance and possible effects as-sessed. Measures to reduce identified risk are defined and their implementation monitored.
The risk management system enables the Management Board to identify material risks at an early stage and to implement counter-measures. The key features of the risk management system described above are applied throug-hout the Group. As far as processes in financial disclosure are concerned, this means that identified risks are review-ed and assessed for their potential impact on disclosures in the respective financial reports. The idea is to provide important information at an early stage about potential changes in the fair value of assets and liabilities, possible impairments and important information to assess the ne-cessity of forming and reversing provisions.
The adequacy and efficiency of the risk management sys-tem is reviewed on a regular basis at Management Board level and adjusted where necessary.
In 2007 an internal audit system was also established. An auditing firm was commissioned to set this up. The Ma-nagement and Supervisory Boards agreed a medium-term plan, according to which all divisions of PVA TePla Group will be systematically audited.
INTERNAL CONTROL AND RISK MANAGEMENT SYSTEM FOR THE GROUP FINANCIAL DISCLOSURE PROCESS
The objective of the methods and measures we have put in place is to secure the assets of the Company and enhance operating efficiency. The internal control system that has been implemented is intended to ensure the reliability of accounting and reporting as well as compliance with inter-nal rules as well as legal regulations and the Articles of As-sociation. We assure the adequate separation of functions
and have also implemented appropriate spans of control. Furthermore, we make sure that responsibilities do not overlap and that tasks, expertise and responsibilities are bundled. We have also integrated controls into the work-flows. Key components of these structures and controls include strict compliance with the system of checks and balances for all essential accounting processes, effective and precisely defined access rights for our IT systems, spot checks of employees at all levels by the respective su-perior, the use of uniform Group-wide reporting and forms, and control over the structural and process organization including the key operational Company processes within the scope of our certified quality management system. The essential features of the internal control system described above apply to all functional areas. In the accounting pro-cess, the implementation of the structural and process organization controls within the internal control system assures data integrity for the information that flows into financial reporting.
In addition to these controls implemented in the organiza-tion, the individual functional areas are also monitored by superiors and the internal audit department. The internal audit department is responsible for reviewing the functio-ning and effectiveness of the internal control system. In order to conduct the audit, the internal audit department has comprehensive information and review rights.
Consolidation and the Group accounting process are based on the decentralized preparation of financial statements by each of the Group companies. These financial statements are prepared and submitted according to uniform Group-wide standards and data formats. The central accounting system is connected with the ERP system through nu-merous interfaces.
The consolidation of the financial statements is comple-ted in cooperation with an external service provider with suitable qualifications (financial auditor). The entire process is controlled and verified by the central Group Accounting and Controlling department. Here the data is also verified with regard to form and content. All of the employees in-volved in the process receive training at regular intervals.

36 PVA TePla AG Annual Report 2014
The parts of the internal control system relevant to financi-al reporting are reviewed in terms of effectiveness by the auditor as part of a risk-oriented approach.
In conclusion, we would like to point out that neither an internal control system nor a risk management system can ensure with absolute certainty that the related objectives will be achieved. Like all discretionary decisions, resolu-tions to implement suitable systems can also be incorrect in principle. Controls may not be adequate on a case by case basis due to simple errors or mistakes, or changes to environment variables may be recognized too late in spite of corresponding monitoring.
DESCRIPTION OF RISKS AND OPPORTUNITIES
The PVA TePla Group differentiates between business op-portunities and risks, operational and financial opportuni-ties and risks. These constitute the two pivotal areas for the Group. Opportunities and risks do not exist to the same extent in all subsegments.
Business opportunities and risks
Market RisksThe key risk in the markets in which PVA TePla operates is the fluctuation in customers’ investment activity, the global economy and political developments. Statements regarding future developments of individual markets or de-cisions relating to economic policy in emerging markets cannot be made with sufficient accuracy.
The semiconductor business, a key sector for the Group, is highly cyclical in nature. Although the semiconductor industry in recent decades has enjoyed average annual growth rates well above those of most so-called old eco-nomy industries, this average includes periods of both ro-bust growth and recession. Investment activity in the se-miconductor industry fell sharply between 2011 and 2013, before recording major growth rates in 2014 and early 2015. Investments in wafer capacities, an essential mar-ket segment for PVA TePla, ground practically to a halt in the past year, before experiencing significant recovery in the previous fiscal year – particularly in the area of 300mm technology.
The solar market, characterized by high overcapacities in the last few years, was dominated by Chinese suppliers. After years of exceptional growth, the solar market and its supplier industry have been hard hit. In response, PVA Te-Pla has closed down production capacities in Denmark in 2013 and 2014 and reduced staff numbers at all locations as a result of the market downturn. The residual carrying values of remaining solar systems on stock were deprecia-ted to their realizable value.
In the Industrial Systems division, the focus of business is on sintering hard metals, with a high percentage in China. Due to the weaker economy, including in China, and the considerable increase in capacity in the hard metal area in recent years, demand has slumped significantly since 2012 in this business unit. Customers were cautious about making large investments and numerous investment de-cisions were being postponed. There has been no change in the tense market situation in the area of hard metal in the past fiscal year. This basically applies to all other impor-tant business units in the Industrial Systems division. It has also been observed that PVA TePla has not lost any market share to competitors in the top segment for heat treat-ment systems. In fact, the market is currently shaped by consolidation, which has also affected other competitors.
Market OpportunitiesIn markets such as hard metal manufacturing, the semi-conductor industry and photovoltaics, PVA TePla provides process technologies that will remain a firm part of each respective value chain in the future. In the area of heat treatment furnaces, new user markets could be opened up through the development of heat treatment systems, with PVA TePla currently building the largest system in Euro-pe. Examples of these new markets, in which this type of system could be used, include the aviation industry or the tool industry. In the semiconductor industry, for example, process technologies could include systems for growing silicon crystals with a 300mm diameter, for growing high-purity silicon crystals or silicon carbide crystals for high performance electronics, or analytical systems for non-de-structive quality control in LED or MEMS production. De-mand for plasma and analysis systems is correlated with trends in semiconductor markets (e.g. MEMS, LED, OLED/PLED, IGBT). Further growth for these products of PVA TePla is expected due to the growth in the semiconductor market anticipated by all market research institutions and

37
Com
bine
d M
anag
emen
t Rep
ort
newly developed applications for plasma systems in the semiconductor/life science/industrial sectors, such as the newly developed 80 Plus High Speed inline system. The budget for 2015 includes moderate estimates in relation to sales revenues from new and further developments with small unit sales forecast. This was due to attempts to reduce the reliance on systems with a short product lifecycle that is difficult to forecast. No opportunities from major orders in the semiconductor market were taken into consideration in the budget.
Large overcapacity in the solar market and significant de-clines in sales prices across the entire supply chain of the solar industry resulted from significant investments to ex-pand capacity, particularly by Chinese providers. Outside of Europe, there is also a wide range of further important growth markets for the solar industry: India, Australia, Mo-rocco, the MENA region (Middle East and North Africa), as well as South Africa and South America. Opportunities also exist in markets where production capacities are set to expand because of economic policy considerations. However, these opportunities are often accompanied with problems in financing such projects. It is highly likely that a system technology will prevail that guarantees maximum efficiency and optimal cost of ownership. Given that PVA TePla can provide such systems, medium to long-term market prospects are cautiously optimistic, even given the difficult photovoltaics market at present. PVA TePla follows economic developments and individual markets closely. According to independent research institutes, existing pro-duction capacities are set to align again with demand for solar modules over the course of the fiscal year. This also opens up opportunities of new system orders for PVA TeP-la. However, as a precaution no major new orders or sales of warehousing facilities have been considered as part of the budget.
Economic RisksAnalysts forecast global GDP growth of between 2.9% and 3.7% in 2015. However, the overall economy remains highly uncertain despite this positive outlook. The debt cri-sis in the established industrialized countries continues to fester and may prove detrimental to the economies of the emerging markets, a key market for the PVA TePla Group. Weakening growth rates in emerging markets, particularly in China, are evidence of this problem. The Chinese market is extremely important to PVA TePla, especially in the area
of vacuum systems. The slowdown of economic develop-ment in China over the past few years and of the correlation between products manufactured using PVA TePla systems and the expansion of infrastructures means that there is a chance of customers being reluctant to invest. The sanc-tions imposed on Russia by the West concern a market that is essentially of interest to the PVA TePla Group, not least because Russian customers have recently showed a desire to expand and widen the country’s technological basis.
These market and economic risks are reduced by diversify-ing the range of products and services across different sec-tors including semiconductors, photovoltaic, tool making and hard metal technology, the production of high-quality metals and ceramics, the automotive and aerospace indus-tries, and the electrical and electronic engineering sectors. The effects of cyclical, foreseeable fluctuations in market volume are primarily offset by increasing or decreasing out-sourcing levels, although unexpectedly high demand can give rise to production bottlenecks. The strategy of maintai-ning a relatively low level of vertical integration allows rapid response in this regard. The PVA TePla Group also provi-des high-quality contract processing work – such as plas-ma treatment, high-vacuum brazing and heat treatment of components – in which greater customer demand has his-torically been seen in times of generally restrained capital expenditure. In fiscal years 2013 and 2014, PVA TePla was unable to strike a balance within the scope of this diversifi-cation and synergy strategy that kept the Group profitable on account of the strong degree of parallel development in the sales markets’ cycles. As a result, extensive consolida-tion measures were introduced affecting locations and em-ployee numbers. A sustained shortfall in terms of expected orders, particularly those from China, and the further lack of compensatory opportunities would open up the risk of further consolidation measures becoming necessary.
Risks from Technological DevelopmentsThe risk of losing orders due to a new, unexpected techno-logy appearing on the market (horizontal entry) is monito-red worldwide and assessed by continuous observation of the latest research and development and published studies specific to the various sectors, and by maintaining dialog with key customers and research institutes. In addition to ongoing development activities, technological product op-timization is further supported by, among other things, an

38 PVA TePla AG Annual Report 2014
in-house laboratory as well as the operation of in-house service centers in which materials are processed for cus-tomers. Here, the Company’s development department stays abreast of the latest material quality requirements of customers. The high level of technical complexity of our products and rapid technological advances pose research and development-related risks. Medium and long-term success is crucially dependent on developing marketable products and generating sufficient revenues within appro-priate time frames in order to provide adequate cash flow for the Group’s internal financing. The technical complexity of our products and the standards demanded by our cus-tomers may also give rise to quality-related risks that can generate increased warranty-related expenditures.
Opportunities from Technological DevelopmentsAs a supplier of technologies for the production and pro-cessing of materials and components for high-tech indust-ries, where a vacuum and high temperature play a key role
for production, new areas of application for materials pro-duced using our systems may result in additional demand. Moreover, research may define new requirements for ma-terials, requiring new types of systems.
Risks from Trade SanctionsAs an international Group with a high share of export busi-ness, PVA TePla is essentially susceptible to trade barriers or sanctions. Current geopolitical developments mean that the trend is going towards tighter sanctions. This currently concerns Russia in particular, but also “dual use” techno-logies in the MENA region. PVA Tepla continually reviews export licenses and, in the case of high-risk orders, hedges the political risk through capital goods credit insurances. A susceptibility to trade barriers will always remain, as con-tracts with insurance companies are only a limited option when political risks escalate.
Risk category Probability of occurrence Scale Category of opportunity Scale
Market Risks Possible High Market Opportunities High
Global economic risks Probable Moderate
China economic risks Possible High
Risks from Technological Developments Improbable High
Opportunities from Tech-nological Developments High
Risks from trade barriers Possible High

39
Com
bine
d M
anag
emen
t Rep
ort
Operating Opportunities and Risks
Risks from SuppliersThe probability of being affected by supplier capacity bot-tlenecks has decreased due to economic growth forecasts. Commodity prices (such as for stainless steel and copper) are trending downward, too. The risk of delivery delays and non-delivery is countered by identifying and prescreening additional suppliers in combination with close monitoring of existing suppliers. Dependence on individual suppliers is limited by having multiple qualified suppliers for key com-ponents and diversifying deliveries among them. The risk of supplier failure (e.g. as a result of insolvency) is substan-tially reduced by the systematic selection and evaluation of alternative domestic and international suppliers. Care is taken to ensure that all major suppliers have adequate qua-lity management systems and third-party liability insurance coverage in place.
Risks and Opportunities from Investments and M&ACooperation with subsidiaries (all operating business was transferred to subsidiaries from 1 January 2015) is abso-lutely vital at PVA TePla. Together with better access to growth markets and technologies thanks to more flexible subsidiary structures, investments also serve to capita-lize on synergies and optimize cost structures. Negative economic developments can endanger anticipated sales revenues and earnings targets under certain circumstan-ces. Resulting adjustments can lead to a reduction in pro-duction and personnel capacities at individual subsidiaries or locations. All subsidiaries are subject to a continuous monitoring process in order to ensure prompt support is given to the investments and that their profitability is gu-aranteed. The difficult market environment at the current time is causing many manufacturers of heat treatment sys-tems to consolidate. PVA TePla will also scrutinize potential acquisition targets. As a rule, acquisitions are only targeted in the case of companies that can usefully complement the PVA TePla Group either in terms of technology or in terms of market development.
Risks in Connection with Information TechnologyThe risk of IT equipment failures and the threat posed by software viruses and other malware (such as so-called Tro-jans) are reduced through regular and appropriate backups,
adopting suitable protective measures against external influences (e.g. up-to-date virus protection systems and firewalls) and maintaining suitable access control systems.
Natural Hazards and Environmental RisksOverall, appropriate insurance policies were concluded for natural hazards at PVA TePla AG locations. Due to the Company’s business structure, with its focus on enginee-ring and assembly and to a very limited extent its use of hazardous materials and other substances with risks for safety and the environment, the extent of environment risk posed by the activities of PVA TePla is very limited. Never-theless, an environmental liability and accidental damage insurance policy with adequate coverage was concluded for this, too.
Risks from Legal DisputesPVA TePla AG and its subsidiaries have a number of diffe-rent legal proceedings to contend with, most of which con-cern labor court proceedings over employee terminations during the fiscal year. As there is a great deal of uncertain-ty surrounding these proceedings, it is possible that pro-visions formed for legal disputes prove to be insufficient once the final ruling is made. This can lead to additional expenses being incurred. This also applies to legal procee-dings for which, in the current view of the Group, no provi-sions were to be formed. Even though the final outcome of individual legal proceedings can have an affect on earnings and cash flow at PVA TePla in a certain reporting period, the Group believes that the resulting liabilities will have no lasting influence on the financial position and profit or loss of PVA TePla.
Risk category Probability of occurrence Scale
Risks from suppliers Improbable High
Risks from investments and M&A Possible High
Risks in connection with information technology Possible Moderate
Natural hazards and environmental risks Improbable High
Legal disputes Possible Low

40 PVA TePla AG Annual Report 2014
Financial Opportunities and Risks
Liquidity risks and risks from rating changesThe Group has sufficient credit lines for short-term finan-cing operations, including the expansion of business volu-me, and sufficient guarantee lines for providing advance payment guarantees to customers. The negative business development since 2012 and the resulting rating downgra-des mean that there is a risk that short-term credit lines and guarantee lines are reduced or the terms become more expensive. At the moment, PVA TePla covers its credit line requirements through a long-term credit line related to in-vestment property of EUR 5.33 million. In order to secure a long-term loan commitment for further credit lines and guaranteed lines, PVA TePla tasked its bank in 2014 with negotiating and arranging a syndicated loan by mid-2015. Even though there are no indications at the current time that the syndicated loan cannot be realized, there remains a residual risk that, in case the syndicated loan is not able to be arranged and the budget is not secured, the credit lines and guaranteed lines could be significantly reduced. Given that the Group has sufficient financing alternatives even in this scenario, the Management Board does not believe that the PVA TePla Group is at risk of short- or me-dium-term insolvency. That being said, the rating downgra-des mean that the Group expects financing costs to rise.
Risks and Opportunities from Changes in Exchange RatesDespite hedging of exchange rate risks in individual tran-sactions, there is a risk that the EUR/USD exchange rate in particular may move unfavorably, eroding our competitive position in this currency zone and exerting pricing pressu-re. In principle, the risk of currency volatility is addressed by having local production in the US and increasing the le-vel of purchasing within the Dollar currency zone.
No hedging measures are taken in the Group in relation to changes in valuation relating to the conversion of net as-sets at foreign Group companies outside of the Eurozone and their income and expenses.
The tendency towards a “weaker” Euro compared to the US dollar observed over the past few months is strengthe-ning our position against competitors in the Dollar currency zone.
Risks from Tax IssuesBecause of the volume of major orders from abroad, the complexity of the related tax issues has increased. Pri-marily, these issues include intercompany prices for tran-sactions between companies in the PVA TePla Group, and sales taxes – especially on services – and tax rules for em-ployees sent abroad. We address these issues in close co-operation with our tax advisors and have not identified any material risks in this area. There are, however, increasing expenses with respect to these consultations, the internal administration and the implementation of regulations with the associated registrations.
Risk Reporting on the Use of Financial InstrumentsFinancial instruments arise as part of PVA TePla’s core busi-ness activities (e.g. trade receivables and payables). Finan-cial instruments are employed to finance business activities (e.g. loans from banks) or they arise from business activi-ties (e.g. investment of excess current liquidity). In additi-on, derivative financial instruments are utilized to eliminate or limit risks from operating activities (e.g. exchange rate risks) or from financing (e.g. interest rate risks). Financial instruments are not used in isolation without connection to actual business activities. Opportunities and risks in con-nection with the respective relevant financial instrument categories are presented below (for further information see note 29 of the Group notes):
Trade Receivables: Liquidity and credit risks involved in financing business operations are reduced, in the case of major orders, by means of customer/supplier financing. A contractual ins-tallment payment schedule is negotiated in most cases, starting at an average of 30% minimum due upon receipt

41
Com
bine
d M
anag
emen
t Rep
ort
of the order for a single system. Collateral arrangements (e.g. letters of credit) are also frequently required to protect against default on receivables, in combination with intensi-ve receivables monitoring. In contrast, the Group itself only has to make advance pay-ments to a few suppliers. In addition, the Group optimizes its external cash flow requirements through rolling cash flow forecasts for Group companies and short-term intra-Group loans.
Due to the short-term nature of the items, there is no sig-nificant market risk.
Other Receivables:Due to the short-term nature of the items, there is no sig-nificant market risk.
Payments in Advance:The individual Group companies primarily make payments in advance only to suppliers for larger deliveries/major components. On the purchasing side, advance payments are only made in return for a corresponding advance pay-ment guarantee. Such guarantees ensure that the Group does not incur any discernible risks.
Financial Liabilities:» This item primarily includes bank loans to finance investments.» These loans are all either agreed at fixed interest rates for the entire term or hedged accordingly in the case of loans with variable nominal interest rates, effectively rendering them synthetic fixed interest rate loans.» Effective March 3, 2014, two fixed-interest real estate loans, which were secured by charges and land, for a new building in Wettenberg for a total of EUR 5,684 thousand were terminated and combined into a new loan of EUR 6,000 thousand with a term until January 2023. The new loan has already been synchronized with existing interest hedges of EUR 6,000 thousand.
» As market interest rates at the balance sheet date were once again lower than the interest rates underlying the aforementioned hedging transactions, a provision for other liabilities was necessary totaling EUR 974 thousand (prior year: EUR 895 thousand) in the consolidated financial statements and a provision for impending losses totaling EUR 780 thousand (prior year: EUR 887 thousand) was necessary in the single-entity financial statements of PVA TePla AG.» A previously unutilized long-term loan to finance the buildings at the Wettenberg location was utilized for financing short-term working capital. This loan with a variable nominal interest rate and no underlying interest rate hedge offers a low market risk from changes to corresponding market interest rates.» Due to the extremely low interest rates environment at the moment and a no anticipated rise in market rates in the medium term, no interest hedge has been conclu- ded yet for this loan. » There is no risk from the failure to comply with financial covenants since such agreements have been avoided to date.
Trade Payables:» There are short-term items invoiced almost exclusively denominated in Euros. Hence there is no relevant market or credit risk.
Other Liabilities:Due to the short-term nature of the items, there is no sig-nificant market risk.
Exchange Rate Hedging:» A large proportion of Group sales revenues, including those of PVA TePla AG, are generated in foreign markets. Projects are predominantly billed in Euros, also for non- Eurozone countries. Otherwise, in each individual case, the hedging of currency risks is assured by means of forward exchange contracts. Since these are closed positions in relation to the underlying transaction with

42 PVA TePla AG Annual Report 2014
Risk category Probability of occurrence Scale
Risks from changes in exchange rates Improbable Low
Risks from tax issues Improbable Low
Risks from financial liabilities Improbable Moderate
Risks from trade payables Improbable Low
Liquidity risks Improbable High
Rating risks Probable Moderate
matching payment amounts and deadlines, there is no significant market risk. Calculations for the under- lying transactions are based on the respective hedged forward rates.» Due to the aforementioned selection of suppliers from around the world, some purchases are made in foreign currencies. US Dollar cash balances are used to a limited extent to meet payment obligations via natural hedging. Other foreign currency obligations and larger US Dollar payments are hedged with forward exchange transactions whose payment structure corresponds with the underlying transaction, thereby avoiding currency risk. Please refer to the explanations above for delivery/materials procurement risks.
Interest Rate Hedging:» Some of the loans to finance new facilities were concluded at variable nominal interest rates and the interest rate was hedged, effectively making these synthetic fixed interest rate loans.» For more details concerning risks arising from these financial instruments, please refer to the information above on financial liabilities.
GENERAL STATEMENT BY THE MANAGEMENT BOARD
The Management Board of PVA TePla AG is responsible for the risk management of the Group and assesses the Group’s risks and opportunities. They have come to the fol-lowing conclusion.
Summary
The Group’s risk profile increased in fiscal year 2014 com-pared to fiscal year 2013. The main risks stem from lasting weak development in certain markets as mentioned abo-ve and the related reticence of our customers to invest. This trend was reflected in a decline in incoming orders for vacuum systems, which the Group countered in 2014 by introducing restructuring measures at the primary pro-duction location in Wettenberg. The completed personnel reduction program will lead to lower breakeven sales re-venues in future. The Company also continued to work on increasing its sales activities in markets, which will become more attractive in future. The risk of trade barri-ers as well as the liquidity and rating risk were new ad-ditions to the risk situation. Risks potentially jeopardizing the continued existence of the Company and the Group as a going concern are monitored by means of suitable countermeasures. We consider all other risks to only have low residual risks on account of their low likelihood, their low potential damage or countermeasures that have been taken. The opportunities presented in this report constitute both untapped potential for PVA TePla but also significant challenges. The fundamentally flexible production structure means that PVA TePla Group companies are well equipped to capitalize on any opportunities that may arise.

43
Com
bine
d M
anag
emen
t Rep
ort
Forecast Report
The forecast report describes the expected business de-velopment of the PVA TePla Group in fiscal year 2015. The statements in this chapter were made on the basis of the current Group portfolio and customers’ portfolios and the above-mentioned assumptions on future macroeconomic and industry developments. The actual results may, as is often the case in the project business, deviate substantially from the forecast development if the underlying assump-tions later prove to be incorrect.
Sales revenues in the Industrial Systems division are ex-pected to remain on a par with the previous year in fiscal year 2015. Due to the positive development of the semi-conductor market and the rise in order backlog, sales reve-nues in the Semiconductor Systems division are expected to rise by a seven-figure sum year on year.
Based on the development of the gross margin in 2014 and the lower breakeven sales revenues, the gross margin is expected to be around 20% in 2015.
In view of the order backlog of EUR 37.9 million as at De-cember 31, 2014 and the fact that the orders received in the first half of 2015 may already be recognized in sales revenues and the result, the Management Board of PVA TePla forecasts consolidated sales revenues of EUR 70 mil-lion to EUR 80 million and EBIT on the scale of a balanced result for fiscal year 2015.
Focusing solely on PVA TePla AG, we anticipate a major decline in sales revenues in fiscal year 2015, which is sub-stantiated by the change in business purpose of PVA TePla AG. From January 1, 2015, PVA TePla AG merely acts as a management and functional holding company. Aside from the processing of orders received up until December 31, 2014, the sales revenues of PVA TePla AG include manage-ment and services for a limited range of functions in the
areas of marketing, IT, personnel, investment controlling, accounting and facility management. The scope of the ma-nagement and services is set to stand at EUR 5 million to EUR 6 million, including income from rental and business lease agreements. Sales revenues from earlier orders are set to another EUR 28 million to EUR 30 million. On that basis PVA TePla AG expects to make an operating profit be-fore profit and loss transfer agreements of EUR 4.0 million to EUR 5.0 million in 2015.
Wettenberg, March 17, 2015
PVA TePla AGVorstand
Peter AbelVorsitzender des Vorstands
Oliver HöferVorstand Produktion und Technologie
Henning DöringVorstand Finanzen

45
Gro
up F
inan
cial
Sta
tem
ents
CONSOLIDATED BALANCE SHEET 46
CONSOLIDATED INCOME STATEMENT 48
CONSOLIDATED STATEMENT OF COMPREHENSIVE INCOME 49
CONSOLIDATED CASH FLOW STATEMENT 50
CONSOLIDATED STATEMENTS OF CHANGES IN EQUITY 51
GROUP NOTES 52A. General information and
basis of presentation 52
B. Notes on individual balance sheet items 61
C. Notes on individual income statement items 70
D. Notes on the cash flow statement and on capital management 73
E. Additional disclosures 74
CONSOLIDATED STATEMENT OF CHANGES IN FIXED ASSETS 86
RESPONSIBILITY STATEMENT 90
AUDITOR‘S REPORT 91
GROUP FINANCIAL STATEMENTS

46 PVA TePla AG Annual Report 2014
Group Financial Statements
CONSOLIDATED BALANCE SHEET
ASSETS EUR´000 Notes Dec. 31, 2014 Dec. 31, 2013
Non-current assets
Intangible assets (4) 8,724 8,766
Goodwill 7,808 7,808
Other intangible assets 886 918
Payments in advance 30 40
Property, plant and equipment (5) 29,756 31,038
Land, property rights and buildings, including buildings on third party land 25,722 26,732
Plant and machinery 2,560 2,775
Other plant and equipment, fixtures and fittings 1,373 1,494
Advance payments and assets under construction 101 37
Investment property (6) 367 388
Non-current investments (7) 9 8
Deferred tax assets (12) 4,333 6,459
Total non-current assets 43,189 46,659
Current assets
Inventories (8) 21,370 18,832
Raw materials and operating supplies 6,891 8,335
Work in progress 11,877 8,075
Finished products and goods 2,602 2,422
Coming receivables on construction contracts (9) 7,490 8,081
Trade and other receivables (10) 10,977 12,149
Trade receivables 7,692 9,619
Payments in advance 1,412 883
Other receivables 1,873 1,647
Tax repayments 286 76
Cash (11) 5,725 6,566
Total current assets 45,848 45,704
Total 89,037 92,363
The following notes are an integral part of the Group Financial Statements.

47
Gro
up F
inan
cial
Sta
tem
ents
LIABILITIES AND SHAREHOLDERS‘ EQUITY EUR´000 Notes Dec. 31, 2014 Dec. 31, 2013
Shareholders‘ equity (13)
Share capital 21,750 21,750
Revenue reserves 20,799 30,771
Other reserves -3,649 -2,131
Minority interest -85 -83
Total shareholders‘ equity 38,815 50,307
Non-current liabilities
Non-current financial liabilities (15) 5,847 6,540
Other non-current liabilities (22) 755 688
Retirement pension provisions (16) 13,975 11,377
Deferred tax liabilities (25) 1,067 1,422
Other non-current provisions (17) 168 490
Total non-current liabilities 21,812 20,517
Current liabilities
Short-term financial liabilities (18) 6,739 1,080
Trade payables 1,563 3,219
Obligations on construction contracts (19) 41 97
Advance payments received on orders (20) 12,926 8,282
Accruals (21) 4,074 5,683
Other short-time liabilities (22) 1,279 1,059
Provisions for taxes 190 204
Other short-term provisions (17) 1,598 1,915
Total current liabilities 28,410 21,539
Total 89,037 92,363
The following notes are an integral part of the Group Financial Statements.
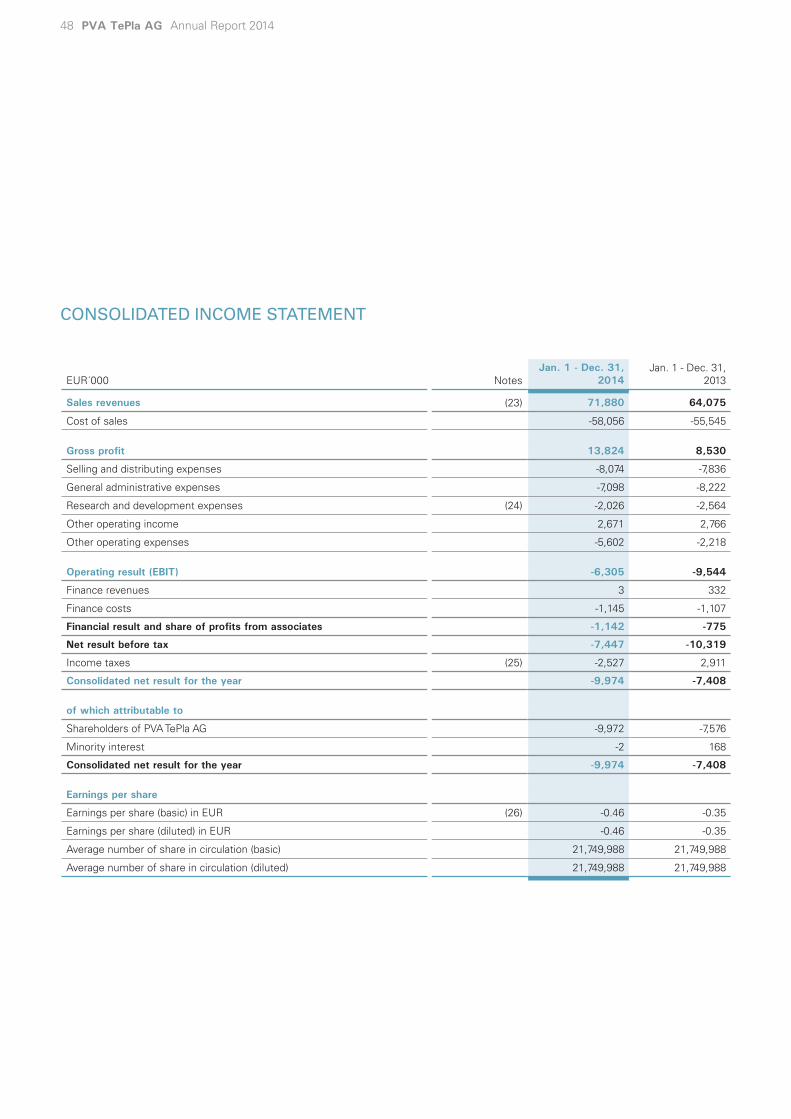
48 PVA TePla AG Annual Report 2014
CONSOLIDATED INCOME STATEMENT
EUR´000 NotesJan. 1 - Dec. 31,
2014Jan. 1 - Dec. 31,
2013
Sales revenues (23) 71,880 64,075
Cost of sales -58,056 -55,545
Gross profit 13,824 8,530
Selling and distributing expenses -8,074 -7,836
General administrative expenses -7,098 -8,222
Research and development expenses (24) -2,026 -2,564
Other operating income 2,671 2,766
Other operating expenses -5,602 -2,218
Operating result (EBIT) -6,305 -9,544
Finance revenues 3 332
Finance costs -1,145 -1,107
Financial result and share of profits from associates -1,142 -775
Net result before tax -7,447 -10,319
Income taxes (25) -2,527 2,911
Consolidated net result for the year -9,974 -7,408
of which attributable to
Shareholders of PVA TePla AG -9,972 -7,576
Minority interest -2 168
Consolidated net result for the year -9,974 -7,408
Earnings per share
Earnings per share (basic) in EUR (26) -0.46 -0.35
Earnings per share (diluted) in EUR -0.46 -0.35
Average number of share in circulation (basic) 21,749,988 21,749,988
Average number of share in circulation (diluted) 21,749,988 21,749,988

49
Gro
up F
inan
cial
Sta
tem
ents
CONSOLIDATED STATEMENT OF COMPREHENSIVE INCOME
EUR´000Jan. 1 - Dec. 31,
2014Jan. 1 - Dec. 31,
2013
Consolidated net result for the year -9,974 -7,408
of which attributable to shareholders of PVA TePla AG -9,972 -7,576
of which attributable to minority interest -2 168
Other comprehensive income
Items that may be reclassified to profit or loss
Currency changes 258 -185
Income taxes -72 52
Changes recognized outside profit or loss (currency changes) 186 -133
Changes in fair values of derivative financial instruments 6 11
Income taxes -2 -3
Changes recognized outside profit or loss (derivative financial instruments) 4 8
Total of items that may be reclassified to profit or loss 190 -125
Items that will never reclassified to profit or loss
Changes in pension provisions -2,371 206
Income taxes 663 -57
Changes recognized outside profit or loss (pension provisions) -1,708 149
Total of items that will never reclassified to profit or loss -1,708 149
Other comprehensive income after taxes (changes recognized outside profit or loss) -1,518 24
of which attributable to shareholders of PVA TePla AG -1,518 24
of which attributable to minority interest 0 0
Total comprehensive income -11,492 -7,384
of which attributable to shareholders of PVA TePla AG -11,490 -7,552
of which attributable to minority interest -2 168

50 PVA TePla AG Annual Report 2014
CONSOLIDATED CASH FLOW STATEMENT
EUR´000Jan. 1 - Dec. 31,
2014Jan. 1 - Dec. 31,
2013
Consolidated net result for the year -9,974 -7,408
Adjustments to the consolidated net result for the year for reconciliation to the cash flow operating activities:
+ Income taxes 2,527 -2,911
- Finance revenues -3 -332
+ Finance costs 1,145 1,107
= Operating result -6,305 -9,544
+/- Income tax payments -319 67
+ Amortization and depreciation 2,242 2,520
-/+ Gains/losses on disposals of non-current assets 5 114
+/- Other non-cash expenses/income 653 -14
-3,724 -6,857
-/+ Increase/decrease in inventories, trade receivables and other assets -825 7,908
+/- Increase/decrease in provisions -1,121 -460
+/- Increase/decrease in trade payables and other liabilities 1,181 1,174
= Cash flow from operating activities -4,489 1,765
- Payments for the acquisition of consolidated companies and other business units less acquired cash 0 -288
+ Proceeds from disposals of intangible assets and property, plant and equipment 32 4
- Payment of intangible assets and property, plant and equipment -918 -899
+ Interest receipts 3 27
= Cash flow from investing activities -883 -1,156
- Payments to shareholders (dividends and capital repayments) 0 -2,175
+ Proceeds from issuing bonds and the raising of loans 316 0
- Payments from redumption of debt and loans -1,354 -1,151
+/- Change in short-term bank liabilities 5,777 -2
- Payment of interest -441 -672
= Cash flow from financing activities 4,298 -4,000
Net change in cash -1,074 -3,391
+/- Effect of exchange rate fluctuations on cash 232 -52
+ Cash at the beginning of the period 6,566 10,009
= Cash at the end of the period 5,725 6,566

51
Gro
up F
inan
cial
Sta
tem
ents
CONSOLIDATED STATEMENT OF CHANGES IN EQUITY
EUR´000 Shared issuesRevenue reserves
Other equity com-
ponentsPension
provisions TotalMinority interest
Total share-
holders‘ interest
Number
As at January 1, 2013 21,749,988 21,750 40,522 -241 -1,914 60,117 -251 59,866
Total income -7,576 -125 149 -7,552 168 -7,384
Dividend -2,175 0 0 -2,175 0 -2,175
As at December 31, 2013 21,749,988 21,750 30,771 -366 -1,765 50,390 -83 50,307
As at January 1, 2014 21,749,988 21,750 30,771 -366 -1,765 50,390 -83 50,307
Total income -9,972 188 -1,706 -11,490 -2 -11,492
Dividend 0 0 0 0 0 0
As at December 31, 2014 21,749,988 21,750 20,799 -178 -3,471 38,900 -85 38,815

52 PVA TePla AG Annual Report 2014
Group NotesA. GENERAL INFORMATION AND BASIS OF PRESENTATION
1. GENERAL INFORMATION
Domicile and Legal Form of the CompanyPVA TePla AG is a stock corporation in accordance with German law. The Company is entered in the Commercial Register of the Giessen Local Court under HRB 6845. The registered address of the Company is 35435 Wettenberg, Germany.
Business ActivitiesPVA TePla AG and its subsidiaries (“PVA TePla” or the “Group”) operate as global systems suppliers for produ-cing, refining and processing high-quality materials such as metals, semiconductors, ceramics and glass as well as for performing controlled surface treatments of such materials and the widest range of plastic surfaces. Such production and treatment processes require stable, reproducible con-ditions. They therefore generally take place under vacuum conditions or inert gas atmospheres, at high temperatures and/or with the support of low-pressure plasma. Various systems are also used to monitor quality control for these high-grade materials.
PVA TePla supplies vacuum systems that produce and treat high-tech materials and surfaces in vacuum at high tem-peratures and in plasma. The market for these systems is closely tied to the latest developments in materials and surface treatment technologies around the world. A few examples include 300mm silicon (Si) wafer technology for semiconductors, mono- or multicrystalline Si wafers for photovoltaics, structural materials for space telescopes, production technologies for metal powder (e.g. for hard metals) and production technologies for flat-panel screens. This market will exist as long as high-tech materials are pro-duced and further developed. PVA TePla’s existing product range has been expanded with the creation of ultra-thin wafers and plasma nitration using the pulse plasma me-thod and plasma coating. The product portfolio is further complemented by nondestructive testing and quality con-trol systems for materials using optical and ultrasonic tech-nologies as well as analysis systems to determine surface contamination on wafers for the semiconductor industry.
PVA TePla’s markets are characterized by a limited number of suppliers, global dimensions and technologically advan-ced market niches.
With locations in Germany, the USA, China, Taiwan and Sin-gapore, PVA TePla maintains business relationships around the world.
The fiscal year for PVA TePla AG and its subsidiaries is the calendar year.
The business activities of the Group are divided into two divisions: Industrial Systems and Semiconductor Systems. The Group’s reporting is also organized according to this structure.
General Principles and Accounting StandardsAs a capital market-oriented parent company domiciled in a member state of the EU from fiscal year 2005 onwards, PVA TePla has been obliged to prepare and publish its con-solidated financial statements in accordance with Internati-onal Financial Reporting Standards (IFRS) and section 315a of the Handelsgesetzbuch (HGB – German Commercial Code). The consolidated financial statements of PVA TePla for the fiscal year from January 1 to December 31, 2014 have therefore been prepared in accordance with the IFRS regulations issued by the International Accounting Stan-dards Board (IASB) as of the balance sheet date and with the binding interpretations of the International Financial Reporting Interpretations Committee (IFRIC).
In addition, the notes to the financial statements contain certain disclosures to meet the requirements of section 315a (1) HGB. In accordance with section 315a HGB in conjunction with section 315 HGB, the consolidated finan-cial statements under IFRS have been supplemented by a Group management report.
The income statement has been prepared in accordance with the cost of sales method of presentation.
The consolidated financial statements convey a true and fair view of the net assets, financial position and results of operations of PVA TePla.

53
Gro
up F
inan
cial
Sta
tem
ents
New Statements Issued by the IASBThe IASB has issued the following standards, interpreta-tions and amendments to existing standards that could be relevant for the PVA TePla Group. Regulations that are not yet mandatory and not yet adopted by the European Com-mission have not been applied in advance by PVA TePla.
Standard/interpretation
Mandatory application
Adoption by the EU Commission* Effects
IAS 19Amendment to IAS 19, employee benefits July 1, 2014 No Nothing significant
IAS 27Equity method in single financial statements January 1, 2016 No Nothing significant
IFRS 9
Financial Instruments (amendment to IFRS 9 and IFRS 7 relating to the date of application and explanatory notes during transition and amendment to IFRS 9, IFRS 7 and IAS 39 relating to hedge accounting) January 1, 2018 No Additional note disclosures
IFRS 10 and IAS 28
Disposal or transfer of assets bet-ween an investor and an associated company or joint venture January 1, 2016 No None
IFRS 11Reporting of shares acquired from cooperations January 1, 2016 No None
IFRS 14 Regulatory deferral accounts January 1, 2016 No None
IAS 16 and IAS 38Methods of depreciation and amortisation January 1, 2016 No None
IAS 16 and IAS 41 Bearer plants January 1, 2016 No None
IFRS 15 Revenue recognition January 1, 2017 No
The assessment of implications of the application of IFRS 15 for the consolidated financial statements is not complete
Annual improvements to the IFRS cycle 2010-2012 July 1, 2014 No Nothing significant
Annual improvements to the IFRS cycle 2011-2013 July 1, 2014 No Nothing significant
Annual improvements to the IFRS cycle 2012-2014 January 1, 2016 No Nothing significant
IFRIC 21 Levies June 17, 2014 Yes Nothing significant
*As at March 2015
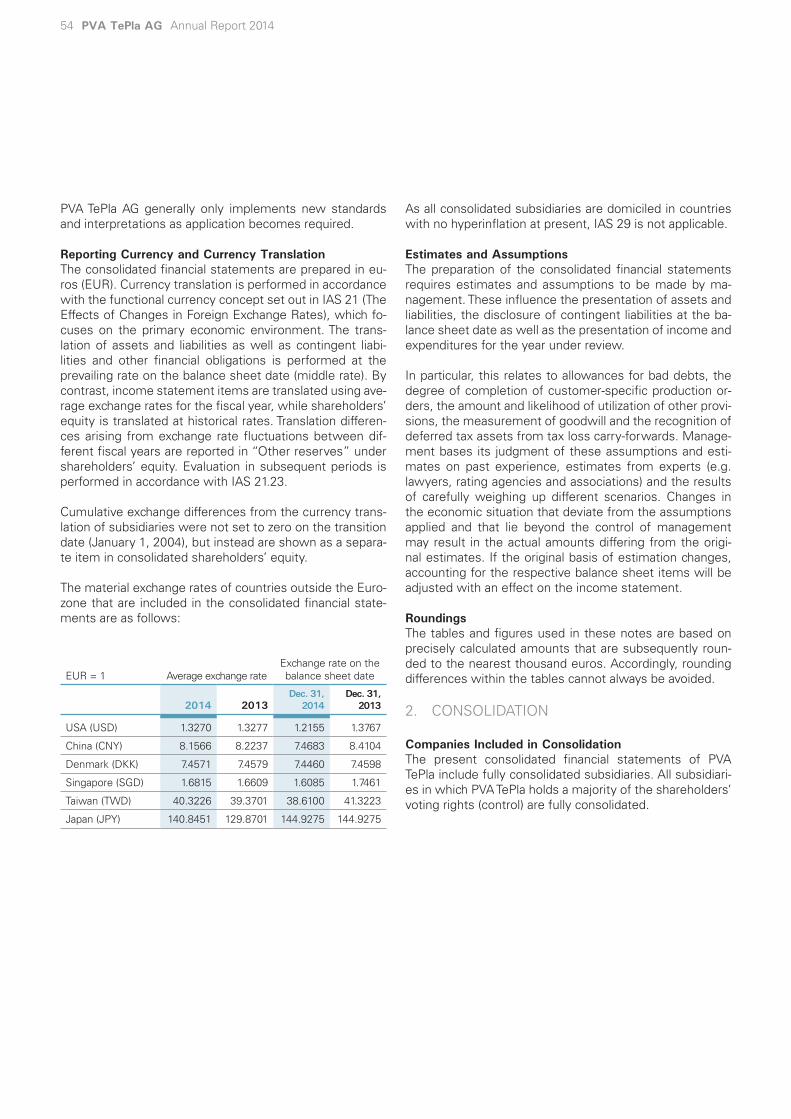
54 PVA TePla AG Annual Report 2014
PVA TePla AG generally only implements new standards and interpretations as application becomes required.
Reporting Currency and Currency TranslationThe consolidated financial statements are prepared in eu-ros (EUR). Currency translation is performed in accordance with the functional currency concept set out in IAS 21 (The Effects of Changes in Foreign Exchange Rates), which fo-cuses on the primary economic environment. The trans-lation of assets and liabilities as well as contingent liabi-lities and other financial obligations is performed at the prevailing rate on the balance sheet date (middle rate). By contrast, income statement items are translated using ave-rage exchange rates for the fiscal year, while shareholders’ equity is translated at historical rates. Translation differen-ces arising from exchange rate fluctuations between dif-ferent fiscal years are reported in “Other reserves” under shareholders’ equity. Evaluation in subsequent periods is performed in accordance with IAS 21.23.
Cumulative exchange differences from the currency trans-lation of subsidiaries were not set to zero on the transition date (January 1, 2004), but instead are shown as a separa-te item in consolidated shareholders’ equity.
The material exchange rates of countries outside the Euro-zone that are included in the consolidated financial state-ments are as follows:
As all consolidated subsidiaries are domiciled in countries with no hyperinflation at present, IAS 29 is not applicable.
Estimates and AssumptionsThe preparation of the consolidated financial statements requires estimates and assumptions to be made by ma-nagement. These influence the presentation of assets and liabilities, the disclosure of contingent liabilities at the ba-lance sheet date as well as the presentation of income and expenditures for the year under review.
In particular, this relates to allowances for bad debts, the degree of completion of customer-specific production or-ders, the amount and likelihood of utilization of other provi-sions, the measurement of goodwill and the recognition of deferred tax assets from tax loss carry-forwards. Manage-ment bases its judgment of these assumptions and esti-mates on past experience, estimates from experts (e.g. lawyers, rating agencies and associations) and the results of carefully weighing up different scenarios. Changes in the economic situation that deviate from the assumptions applied and that lie beyond the control of management may result in the actual amounts differing from the origi-nal estimates. If the original basis of estimation changes, accounting for the respective balance sheet items will be adjusted with an effect on the income statement.
RoundingsThe tables and figures used in these notes are based on precisely calculated amounts that are subsequently roun-ded to the nearest thousand euros. Accordingly, rounding differences within the tables cannot always be avoided.
2. CONSOLIDATION
Companies Included in ConsolidationThe present consolidated financial statements of PVA TePla include fully consolidated subsidiaries. All subsidiari-es in which PVA TePla holds a majority of the shareholders’ voting rights (control) are fully consolidated.
EUR = 1 Average exchange rateExchange rate on the balance sheet date
2014 2013Dec. 31,
2014Dec. 31,
2013
USA (USD) 1.3270 1.3277 1.2155 1.3767
China (CNY) 8.1566 8.2237 7.4683 8.4104
Denmark (DKK) 7.4571 7.4579 7.4460 7.4598
Singapore (SGD) 1.6815 1.6609 1.6085 1.7461
Taiwan (TWD) 40.3226 39.3701 38.6100 41.3223
Japan (JPY) 140.8451 129.8701 144.9275 144.9275

55
Gro
up F
inan
cial
Sta
tem
ents
NameCorporate domicile
Ownership interest
PVA TePla AG (parent company)Wettenberg, Germany
PVA TePla America Inc.Corona / CA, USA 100 %
PVA Vakuum Anlagenbau Jena GmbHJena, Germany 100 %
Xi‘an HuaDe CGS Ltd. Xi‘an, PR China 51 %
PVA Löt- und Werkstofftechnik GmbHJena,Germany 100 %
PVA Control GmbHWettenberg, Germany 100 %
PVA Metrology & Plasma Solutions GmbH
Kirchheim, Germany 100 %
PlaTeG GmbHWettenberg, Germany 100 %
PVA TePla Singapore Pte. Ltd. Singapore 100 %
PVA TePla Analytical Systems GmbHWesthausen, Germany 100 %
PVA TePla (China) Ltd.Beijing, PR China 100 %
Munich Metrology GmbHKirchheim, Germany 100 %
Munich Metrology Taiwan Ltd.Hsinchu, Taiwan 100 %
PVA Industrial Vacuum Systems GmbH
Wettenberg, Germany 100 %
PVA Crystal Growing Systems GmbH
Wettenberg, Germany 100 %
gly, management control is no longer exercised by PVA TePla. The carrying amounts of the interests in the Com-pany were written off in previous years. According to infor-mation from the liquidator on January 12, 2015, insolvency proceeding have not yet be concluded.
PVA Industrial Vacuum Systems GmbH, which was foun-ded in April 2014 with share capital of EUR 25 thousand, was included in the group of consolidated companies for the first time (December 31, 2014: EUR 250 thousand). The company is active in the development, production, distribu-tion, processes, goods, systems and services of material and vacuum technology. In fiscal year 2014, the company will serve only as a “shell company” under German corpo-rate law and will become operational as of January 1, 2015 when the reorganization commences.
PVA Crystal Growing Systems GmbH was also founded in April 2014 with share capital of EUR 25 thousand (Decem-ber 31, 2014: EUR 250 thousand). The company is active in the development, production, distribution of processes, goods, systems and services of material and crystal gro-wing technology. In fiscal year 2014, this company will also serve only as a “shell company” under German corporate law and will become operational as of January 1, 2015 when the reorganization commences.
Service company Munich Metrology USA Inc. was dissol-ved in the second quarter of 2014. No income or expenses arose in fiscal year 2014.
In September 2014, JenaWave GmbH was merged with PVA TePla Metrology Systems GmbH, Kirchheim, with ret-roactive effect as of January 1, 2014 and renamed PVA Me-trology & Plasma Solutions GmbH in October 2014 (share capital as of December 31, 2014: 250 EUR thousand). PVA Vakuum Anlagenbau Jena GmbH was also merged with PVA Jena Immobilien GmbH with retroactive effect as of January 1, 2014. PVA Jena Immobilien GmbH was then again renamed PVA Vakuum Anlagenbau Jena GmbH. Both mergers were intended to streamline the portfolio of interests without affecting the operating business.
The following companies are included in the consolidated financial statements as of December 31, 2014 on a fully consolidated basis:
Vakuum Anlagenbau Service GmbH, Hanau (shareholding: 100%) is not included in the consolidated financial state-ments. On April 25, 2003, insolvency proceedings were initiated with respect to the Company’s assets. Accordin-

56 PVA TePla AG Annual Report 2014
standard, providing the recognition criteria for intangible assets and contingent liabilities were met. Goodwill is not subject to amortization but instead is tested for impairment at least once a year or whenever there are indications of impairment and, if necessary, is written down to its lower fair value.
Other intangible assets with limited useful lives are carried at cost, reduced by normal straight-line amortization from the date on which they are first ready for use. Useful lives of three to eight years (for software: three to five years) are applied. Amortization of intangible assets is allocated to the functional areas utilizing the assets concerned. Useful lives are reviewed annually and, if necessary, adjusted to meet future expectations.
Internally generated intangible assets are capitalized when IAS 38 criteria are met. After they are capitalized for the first time, the asset is carried at cost less cumulative deprecia-tion and cumulative impairment. Capitalized development costs contain all directly attributable costs plus their share of overheads and are depreciated over their scheduled use-ful life. Internally generated intangible assets that are not yet complete are subject to an annual impairment test.
Property, Plant and EquipmentProperty, plant and equipment is carried at cost less cu-mulative depreciation. Depreciation is recognized on a straight-line basis over the expected useful life of the asset; in the case of tenants’ fixtures or leasehold impro-vements, if appropriate, in accordance with the shorter duration of the lease. Pursuant to IAS 20.24, investment subsidies and tax-free investment contributions received are deducted from the book value of the relevant assets. Borrowing costs that can be assigned directly to the ac-quisition, construction or production of a qualifying asset are capitalized as part of the acquisition or production cost of said asset. Expenditure for maintenance and repairs is expensed in the period in which it is incurred. The cost of an asset and the related cumulative depreciation are dere-cognized when assets are scrapped or disposed of, with any book gains or losses recognized in the income state-ment under “Other operating income” or “Other operating expenses”
No further changes have occurred since the 2013 consoli-dated financial statements.
Principles of ConsolidationThe financial statements of the companies included in the consolidated financial statements have been prepared in accordance with IAS 27 (Consolidated and Separate Finan-cial Statements) on the basis of uniform accounting and valuation principles.
Capital consolidation is performed in accordance with IFRS 3 (Business Combinations), under which the cost of acqui-sition of the participating interests are offset against the fair values of the assets and liabilities acquired. Any excess of cost over fair value is recognized as goodwill and subjec-ted to impairment testing at least once a year. If there is an excess of fair value over cost, this is recognized in income after the fair values of the assets and liabilities acquired have been reviewed. If less than 100% of the shares are acquired, the historical cost of the participating interest is offset against the proportionate fair values of the assets and liabilities acquired. Minority interests are recognized in shareholders’ equity at the amount of the remaining fair values, including profits and losses attributable to them.
If the percentage shareholding of the parent changes after control is acquired (step acquisition), any difference is re-cognized directly in equity without impact on the income statement.
3. ACCOUNTING AND VALUATION PRINCIPLES
Intangible AssetsIntangible assets primarily consist of the proportion of goodwill arising in connection with company acquisitions, which represents the excess of the purchase price over the net fair value of the net assets acquired.
The treatment of company mergers before the transition date was retained by invoking the exemption option under IFRS 1. In accordance with IFRS 1, goodwill amounts were transferred to the IFRS opening balance sheet at their car-rying amounts in accordance with the previous accounting

57
Gro
up F
inan
cial
Sta
tem
ents
Years
Buildings 25 - 33
Plant and machinery 3 - 20
Other plant and equipment, fixtures and fittings 2 - 14
Depreciation is conducted according to the following eco-nomic useful lives:
Accordingly, low-value assets with an acquisition value of no more than EUR 410 are fully depreciated in the year of acquisition. All other assets with acquisition values greater than this are capitalized and depreciated over their normal useful lives.
Depreciation of property, plant and equipment is allocated to the functional areas utilizing the respective assets.
Impairment and Write-downs of Intangible Assets and Property, Plant and EquipmentWhere the value of intangible assets or property, plant and equipment calculated using the principles described above is greater than the value attributed to them at the balance sheet date, impairment losses and write-downs are recog-nized accordingly. The fair value to be applied is calculated on the basis of either the net proceeds of sale or the pre-sent value of the estimated future cash flows from the use of the asset – whichever is higher. Impairment losses and write-downs are reported in other operating expenses.
In accordance with IFRS 3 (Business Combinations), the carrying amount of goodwill is reviewed by way of an im-pairment test at least once a year. This test must be com-pleted annually and whenever there is an indication that the value of the cash-generating unit has been impaired.
Goodwill is allocated to cash-generating units in accordance with IAS 36 (Impairment of Assets). In accordance with IAS 36.80 (b), each cash-generating unit may not be larger than a segment for the purposes of segment reporting. Goodwill is reported for the following divisions:
As in fiscal year 2013, PlaTeG GmbH is treated as a separa-te cash-generating unit in the Industrial Systems division.
Within the Semiconductor Systems division, impairment tests on goodwill are conducted in three cash-generating units. These include the Crystal Growing Systems business unit within PVA TePla AG, as well as the subsidiaries PVA TePla Analytical Systems GmbH with registered office in Westhausen and Munich Metrology GmbH in Munich. The companies are also controlled and managed as a whole.
This breakdown of cash-generating units also corresponds to the levels at which the related goodwill is monitored and managed.
The recoverable amount of each cash-generating unit is calculated as its value in use via the discounted cash flow method. Using this method, cash flows are discounted on the basis of the adopted medium-term business plan with a planning horizon of three years and an extrapolation of this plan in line with expected market trends. Underlying these discounted cash flow calculations are forecasts for each cash-generating unit, which are based on the finan-cial budgets approved by management and also used for internal purposes.
Key assumptions for the purpose of determining the fair value of each cash-generating unit by management inclu-de assumptions regarding the development of incoming orders, sales revenues, margins, investments and per-sonnel. The values of these parameters are based on past experience as well as foreseeable future developments. A
Cash Generating Units (CGU)GoodwillEUR‘000
PlaTeG GmbH 50
PVA TePla Analytical Systems GmbH 4,831
Business unit Crystal Growing Systems (PVA TePla AG) 2,734
Munich Metrology GmbH 193
Total 7,808

58 PVA TePla AG Annual Report 2014
growth rate of 1% was applied for the extrapolation of the budget figures when calculating the perpetual annuity for all cash-generating units.
The discount rate is based on the segment-specific weigh-ted average cost of capital of the companies (WACC ap-proach) and contains a reasonable risk premium. The para-meters market risk and beta have the largest effect on the calculation of impairment.
Necessary write-downs are identified by comparing the carrying amounts of the cash-generating units with the re-coverable amounts. If the carrying amount of a cash-gene-rating unit exceeds the recoverable amount, the carrying amount of that cash-generating unit is written down by the difference. The impairment loss will be allocated to good-will and higher amounts will be distributed proportionately between the assets of the cash-generating unit.
Impairment losses are reversed if the reasons for their recognition no longer exist. The reversal of an impairment loss is limited to the amortized carrying amount that would have resulted if no impairment losses had been recognized in the past. Income from such reversals is reported in “Other operating income”. Impairment losses on goodwill may not be reversed.
LeasingAll agreements under which the right to use an asset for a fixed period of time is transferred in exchange for payment are deemed to be leases. This also applies to agreements where the transfer of such a right is not expressly stated. Based on the risks and opportunities of leased item, an assessment is made whether the lessee (so-called finance leases) or the lessor (so-called operating leases) has the economic ownership of the leased item.
PVA TePla is the lessee of property, plant and equipment and lessor in connection with the leasing of its own buil-dings. In fiscal year 2014, as in the previous year, all leases of PVA TePla were treated as operating leases with lease installments expensed as incurred.
InventoriesInventories are recognized at cost in accordance with the weighted average cost method or net realizable value, whichever is lower. In accordance with IAS 2 (Inventories), cost includes not only directly attributable costs, but also production and material overheads as well as write-downs. Fixed overheads are taken into account on the basis of the normal capacity utilization of the production facilities. The cost of idle production capacity is recognized in income under “Cost of sales”. Write-downs are charged on inven-tories when their cost exceeds the expected net realizab-le value. The net realizable value is the expected disposal proceeds less any costs which are incurred until the sale.
Coming Receivables on Construction ContractsAs part of the partial recognition of sales revenues from customer-specific construction contracts based on the per-centage of completion, any amount due from customers for contract work is reported as an asset in accordance with IAS 11.42. These items are shown separately under “Coming receivables on construction contracts”.
Receivables Receivables are carried at their nominal amount.
Appropriate bad debt allowances are recognized for trade receivables in order to cover possible default risks.
Other Financial AssetsOther financial assets consist of interest-bearing securities with contractual maturities and redemption at nominal va-lue. The assets are carried at amortized cost less any write-downs if applicable.
CashCash comprises all freely available liquid funds such as cash in hand and cash in current accounts, as well as other current bank balances available.
Derivative Financial Instruments/Exchange Rate HedgingSome sales are concluded in foreign currencies. As a rule, forward exchange contracts are entered into to hedge ex-change rate risks in these cases.

59
Gro
up F
inan
cial
Sta
tem
ents
These cases are represented as fair value hedges. The measurement effects resulting from changes in exchange rates for assets (trade receivables) recognized in the balan-ce sheet or open sales transactions in foreign currencies are measured at fair value while the adjustment of the car-rying amount for reflecting the fair value is recognized in the income statement as a component of other operating expenses or income. In accordance with IFRS, hedging in-struments are also measured at fair value. If hedging is implemented completely, the opposing effects on earnings will compensate each other.
Derivative Financial Instruments/Interest Rate HedgingInterest rate hedges were concluded to hedge interest rate risks for the financing of investments in new buildings. If the hedge relationship is effective, the positive market value of these instruments is recognized under “Other re-ceivables”. In this case, the offsetting entry is reported in equity under “Other reserves.” The negative market value of these instruments is reported under other financial lia-bilities. The offsetting entry of the market value is reported in “Other reserves” without impact on the income state-ment.
For ineffective hedge relationships, changes in market va-lue are recognized in the income statement in the financial result (net finance revenue or net finance costs).
As in 2013, the negative market values of all financial de-rivatives in fiscal year 2014 were reported as expenses in net finance costs under other financial liabilities.
Deferred Investment Grants from Public FundsSome items of capital expenditure are supported by in-vestment subsidies and tax-free investment grants. In accordance with IAS 20.24, these amounts are deducted from the carrying amount of the relevant assets.
Presentation of EquityWith the publication of amendments to IAS 1, new regu-lations regarding the presentation of other comprehensive income were introduced, which are applicable for fiscal ye-ars beginning on or after July 1, 2012.
PVA TePla AG will keep the separate presentation of in-come statement and the statement of comprehensive income. The presentation of other comprehensive income was changed so that individual subtotals can be shown for those that can be reused and those that cannot.
PayablesIn accordance with IAS 39, liabilities are carried at amor-tized cost on the balance sheet date, which generally cor-responds to the amount due on settlement.
Obligations on Construction ContractsAs part of the partial recognition of sales revenues from customer-specific construction contracts based on the percentage of completion, any amount due to customers for contract work is reported as a liability in accordance with IAS 11.42. This results from the excess of invoiced amounts over the corresponding proportionate revenue. These items are reported separately under “Obligations on construction contracts” on the balance sheet in the same manner as “Coming receivables on construction contracts”.
Only partial payments that are due on the basis of the pro-gress of each individual system, and hence that meet the scope of progressive billing, are recognized as invoiced amounts. Payments received at the inception of the order or partial payments that do not correspond to the progress of completion are presented separately as advance pay-ments.
Obligations from Pension CommitmentsObligations from direct pension commitments are calcula-ted in accordance with IAS 19 (Employee Benefits) using the projected unit credit method while taking future salary and pension adjustments into account. Actuarial reports are obtained annually for this purpose. The service cost for pension beneficiaries is derived from the scheduled change in provisions for pension commitments.
Pension obligations in Germany are calculated on the basis of the biometric 2005 G mortality tables issued by Profes-sor Dr. Klaus Heubeck. There are no pension obligations outside Germany. Actuarial gains and losses have a direct impact on the consolidated balance sheet and are recog-nized in other comprehensive income.
60 PVA TePla AG Annual Report 2014
Deferred taxes are calculated on the basis of the tax rates in force or announced in the individual countries at the rea-lization date in accordance with the current legal situation.
Revenue RecognitionSales revenues are recognized as soon as the goods are delivered or the services are performed, the transfer of risk has taken place and no technical risks or specific opposing contractual regulations exist. All sales revenues are recog-nized on the date of delivery or performance, as manage-ment regards other services and sales arrangements, such as seminars and training, as immaterial to the serviceability of the systems. Income from services and repair work is recognized when the related projects are completed.
Income from customer-specific construction contracts is generally realized in accordance with IAS 11 (Construc-tion Contracts) on the basis of the progress of the work (percentage of completion method), as a reliable estimate of the outcome of the contract – the products to be deli-vered, the terms of payment and the manner in which the work is to progress – is clearly defined in the contracts and the fulfillment of the contractual arrangements by both the purchaser and the seller is considered to be probab-le. The degree of completion is determined as the ratio of the costs incurred at the balance sheet date to the esti-mated total costs (cost-to-cost method). Anticipated los-ses from long-term construction contracts are immediately expensed in full. When specific orders fail to meet all of the criteria listed above, billing for these contracts only takes place after performance is complete.
Warranty provisions are recognized at the balance sheet date for realized sales revenues. These provisions are based on estimates and past experience.
Research and Development ExpensesPVA TePla is engaged in high-tech mechanical engineering in single unit and small series production. The continued development of products is closely linked to research into new procedures and processes and the development of new product features. Activities in these two areas partially alternate in the course of a project. Accordingly, the sepa-
AccrualsAccruals are liabilities payable for goods or services recei-ved that are neither paid nor invoiced or formally agreed upon by the supplier at the balance sheet date. This also includes amounts owed to employees.
Other ProvisionsIn accordance with IAS 37 (Provisions, Contingent Liabili-ties and Contingent Assets), provisions for other financial obligations are recognized when a present obligation to-wards a third party arises from a past event, future settle-ment is probable and the amount can be reliably estima-ted. Non-current provisions with a remaining term of more than one year are recognized at the amount required to settle the obligation, discounted to the balance sheet date.
Deferred TaxesTaxes are deferred in accordance with IAS 12 (Income Taxes) for temporary differences arising between the amounts in the consolidated balance sheet and the tax base of the companies included in consolidation, as well as for consolidation adjustments and tax loss carry-forwards. Deferred tax assets and liabilities are also recognized for temporary differences arising from company acquisitions, with the exception of temporary differences on goodwill. Deferrals are recognized in the probable amount of the tax charge or relief in subsequent fiscal years. Tax assets from deferrals are only recognized if it is reasonably certain they will be recovered.
Tax loss carry-forwards are only included in tax deferrals to the extent that taxable income sufficient to recover the deferred tax assets is expected to be generated in the fu-ture. Deferred tax assets are reduced by amounts that are no longer likely to be utilized for tax purposes. Write-downs are recognized on deferred tax assets that are unlikely to be recovered. Given market volatility and recurring bud-get deviations in recent years, the period for determining if loss carry forwards can be realized has been limited to three years. Provided utilization of loss carry forwards ap-pears likely for 2015 to 2017, based on the current budget, loss carry forwards were reported in deferred tax assets. Conversely, loss carry forwards not expected to be realized until after 2017 were not or no longer recognized.

61
Gro
up F
inan
cial
Sta
tem
ents
ration of research and development activities, and hence the separation of the respective costs, does not generally offer sufficient information value. Similarly, an estimate of probable benefits is too unreliable in light of the uncertain-ties in future market trends.
This means that of the conditions specified in IAS 38 (Int-angible Assets) for the capitalization of development costs, two important criteria are not met. Accordingly, such costs are not capitalized. Research and development expenses are therefore usually expensed in the period in which they are incurred.
Prestigious research and development facilities have been working with us in a limited capacity in the form of coope-ration agreements (contracts of employment). Provided adequate indication as to the usability of the development results is available and the other IAS 38 conditions are met, internally generated intangible assets are capitalized.
InterestInterest and other borrowing costs are expensed in the pe-riod in which they are incurred.
Other Financial ObligationsA discount rate of 4.5% (previous year: 4.5%) has been applied in determining the present value of other financial commitments.
B. NOTES ON INDIVIDUAL BALANCE SHEET ITEMS
4. INTANGIBLE ASSETS
Changes in intangible assets in the year under review and in the previous year are shown in the consolidated state-ments of changes in fixed assets for 2014 and 2013, which are attached as an appendix.
EUR´000 Dec. 31, 2014 Dec. 31, 2013
Intangible assets
Goodwill 7,808 7,808
Other intangible assets 886 918
Payments in advance 30 40
Total 8,724 8.766
The carrying amounts of intangible assets are composed as follows:
The goodwill of the Industrial Systems division resulted from the takeover of Plasma Technik Grün GmbH by PlaTeG GmbH in the year 2006 (EUR 50 thousand).
In the Semiconductor Systems division, goodwill resulted from the increase of the shareholding in Crystal Growing Systems GmbH (CGS) in July 2002 (EUR 2,734 thousand), the takeover of the current PVA TePla Analytical Sys-tems GmbH, Westhausen in fiscal year 2007 (EUR 4,831 thousand) and the takeover of Munich Metrology GmbH, Munich in fiscal year 2012 (EUR 193 thousand).
In the course of impairment testing, the recoverable amount for each cash-generating unit was determined based on the value in use. To determine the value in use, a segment-specific cost of capital was calculated for dis-counting forecasted cash flows in order to take segment-specific risks more into account. The cost of capital in the fiscal year 2014 for the Industrial Systems and Semiconduc-tor Systems divisions is 10.44% and 11.01% respectively (discount rate in the previous year: 11.52% or 10.13%).
The underlying assumptions of key planning indicators (such as sales revenue growth, cash flows, discount rates) reflect past experience and are set according to external information sources. Planning is based on a financial plan-ning horizon of three years. For an impairment test, growth

62 PVA TePla AG Annual Report 2014
The “Land, property rights and buildings, including buil-dings on third-party land” item mainly consists of buildings in Wettenberg and Jena owned by the Group.
Depreciation of property, plant and equipment amounted to EUR 1,949 thousand in 2014 and EUR 2,168 thousand in 2013.
PVA Vakuum Anlagenbau Jena GmbH was merged with PVA Jena Immobilien GmbH with retroactive effect as of January 1, 2014. PVA Jena Immobilien GmbH was rena-med PVA Vakuum Anlagenbau Jena GmbH.
In order to secure the loans originally advanced to PVA Va-kuum Anlagenbau Jena GmbH for the financing of com-mercial property, land has been encumbered with a charge in the amount of EUR 4,929 thousand. The corresponding loans have remaining terms until March 2019 and were measured at EUR 643 thousand at the balance sheet date (previous year: EUR 1,037 thousand).
of 1% has been set for cash flow for the following period. The underlying USD/EUR exchange rate is 1.25. The cash flow is discounted according to cost of capital approach while taking into account specific tax effects of the divisi-ons.
For cash generating units with significant goodwill we have made the following assumptions:
Thanks to a wave of investment activity in the semiconduc-tor sector and the effect of increased sales activities, we forecast medium geometric sales revenue growth (CAGR) of 10% in the next three years in the Analytical Systems business unit. In the Crystal Growing Systems business unit we forecast a CAGR of 14% (previous year: 83%).
There were no impairment write-downs to the lower value in use for fiscal year 2014 (previous year: EUR 0 thousand).
Information on the approach and assumptions used for impairment testing are found under note 3 of the Group notes.
Amortization of other intangible assets amounted to EUR 271 thousand in 2014 and EUR 330 thousand in 2013 and were primarily reported in the cost of sales.
5. PROPERTY, PLANT AND EQUIPMENT
Changes in property, plant and equipment in the year un-der review and in the previous year are shown in the con-solidated statements of changes in fixed assets for 2014 and 2013, which are attached as an appendix.
The carrying amounts of property, plant and equipment are composed as follows:
EUR´000 Dec. 31, 2014 Dec. 31, 2013
Property, plant and equipment
Property, plant and equipment Land, property rights and buildings, including buildings on third party land 25,722 26,732
Plant and machinery 2,560 2,775
Other plant and equipment, fixtures and fittings 1,373 1,494
Advance payments and assets under construction 101 37
Total 29,756 31,038

63
Gro
up F
inan
cial
Sta
tem
ents
of the furnace was 599 thousand (previous year: EUR 668 thousand). The remaining carrying value of the loan howe-ver amounted to EUR 383 thousand (previous year: EUR 474 thousand) at year end.
In order to secure PVA TePla AG’s loan for the financing of the photovoltaic plant in Wettenberg, the plant was assig-ned as security. The carrying amount of the photovoltaic plant amounted to EUR 100 thousand as of December 31, 2014 (previous year: EUR 107 thousand). The loan has a remaining term to December 2018 and was valued at EUR 66 thousand at the balance sheet date (previous year: EUR 80 thousand).
There are no other material restrictions on ownership or tit-le in respect of the property, plant and equipment reported.
6. INVESTMENT PROPERTY
Following the capacity expansion at the Jena site, where new facilities were put in place, further internal use of the facilities in Kahla is no longer foreseeable and these facili-ties have already been leased out to a large extent. Accor-dingly, this real estate has been classified as investment property in accordance with IAS 40 since fiscal year 2007
Investment property was measured on the basis of the cost of acquisition less depreciation. The fair value of EUR 513 thousand (previous year: EUR 514 thousand) was calcula-ted using a best estimate of the achievable rental income in the course of an assessment of property yields, taking into consideration land value. At December 31, 2014, the fair value was up on the carrying amount of the real estate, meaning that there were no grounds for the recognition of impairment losses.
Land charges in the amount of EUR 2,401 thousand have been registered to secure the corresponding loans of for-mer PVA Jena Immobilien GmbH. The corresponding loans with remaining terms until December 2022 were measu-red at EUR 348 thousand at the balance sheet date (previ-ous year: EUR 466 thousand).
Land has been encumbered with a charge in the amount of EUR 18,000 thousand in order to secure the PVA TePla AG loans for the financing of new facilities in Wettenberg. One of these previously unused long-term loans was fully utilized for short-term working capital financing as of De-cember 31, 2014. Effective March 3, 2014, two of the fixed-interest real estate loans secured by charges on land for EUR 5,684 thousand were terminated and combined into a new loan of EUR 6,000 thousand. The value of these loans was EUR 11,000 thousand at the balance sheet date (previ-ous year: EUR 5,684 thousand) and they have a remaining term until January 2023.
In order to finance a brazing furnace for the subsidiary PVA Löt- und Werkstofftechnik GmbH, Jena, the financed furnace was assigned as collateral. The residual carrying amount of the furnace at the balance sheet date was EUR 198 thousand (previous year: EUR 270 thousand). The cor-responding loan has a remaining unsettled amount of EUR 60 thousand (previous year: EUR 128 thousand) and ends in October 2015.
Subsidiary PVA Löt- und Werkstofftechnik GmbH, Jena concluded an installment purchase contract in fiscal year 2010 to finance an additional brazing furnace, for which PVA TePla AG has issued a directly enforceable guarantee and an extended retention of title to the leasing company consists. As of December 31, 2014 the carrying amount

64 PVA TePla AG Annual Report 2014
loss-free valuation. In addition, demonstration and leasing systems are reserved in the Semiconductor Systems di-vision. As these can always be sold at short notice, they are reported in inventories. Scheduled write-downs were recognized to simulate depreciation over a useful life of 5 years. In addition, a lower-of-cost-or-market test is perfor-med based on net realizable sales proceeds. As part of the sales market-oriented valuation impairment, originally reco-gnized impairment losses were partially offset by reference to specific contract negotiations and ongoing purchase contracts. The amount of the reversal amounts to EUR 216 thousand.
See note 20 for the increase in work in progress.
Except for the retention of title by suppliers to the extent commonly accepted in the industry, there are no material claims to inventories on the balance sheet date.
9. COMING RECEIVABLES ON CONSTRUCTION CONTRACTS
Contract costs accounted for using the percentage of com-pletion method and revenues from work in progress in the system construction business are as follows:
Other advance payments for percentage of completion contracts amounting to EUR 7,410 thousand (previous year: EUR 4,646 thousand) are shown in “Current liabilities” un-der advance payments totaling EUR 12,926 thousand (pre-vious year: EUR 8,282 thousand). Obligations on construc-
In the past fiscal year 2014, rental income of EUR 41 thousand (previous year: EUR 40 thousand) was generated from the real estate (including the reimbursement of inci-dental costs). This income is offset by incidental costs and service and maintenance expenses in the amount of EUR 6 thousand (previous year: EUR 8 thousand).
The historical cost of the real estate totaled EUR 694 thousand for the land and buildings. At December 31, 2014, cumulative depreciation amounted to EUR 327 thousand (previous year: EUR 305 thousand). These figures are also presented in the consolidated statement of changes in fixed assets as of December 31, 2014.
Real estate is depreciated on a straight-line basis over a remaining useful life of 25 years.
7. NON-CURRENT INVESTMENTS
The carrying amounts of financial assets contain other receivables of EUR 9 thousand (previous year: EUR 8 thousand).
8. INVENTORIES
Inventories are composed as follows:
In 2014, inventories were subject to write-downs in the amount of EUR 9,711 thousand (previous year: EUR 7,457 thousand. Write-downs are primarily attributable to typi-cal write-downs for non-marketability and reductions for
EUR´000 Dec. 31, 2014 Dec. 31, 2013
Capitalized production costs including contract profits 11,069 15,035
for which advance payments received (progress billings) -3,579 -6,954
Total 7,490 8,081
EUR´000 Dec. 31, 2014 Dec. 31, 2013
Raw materials and operating supplies 6,891 8,335
Work in progress 11,877 8,075
Finished products and goods 2,602 2,422
Total 21,370 18,832
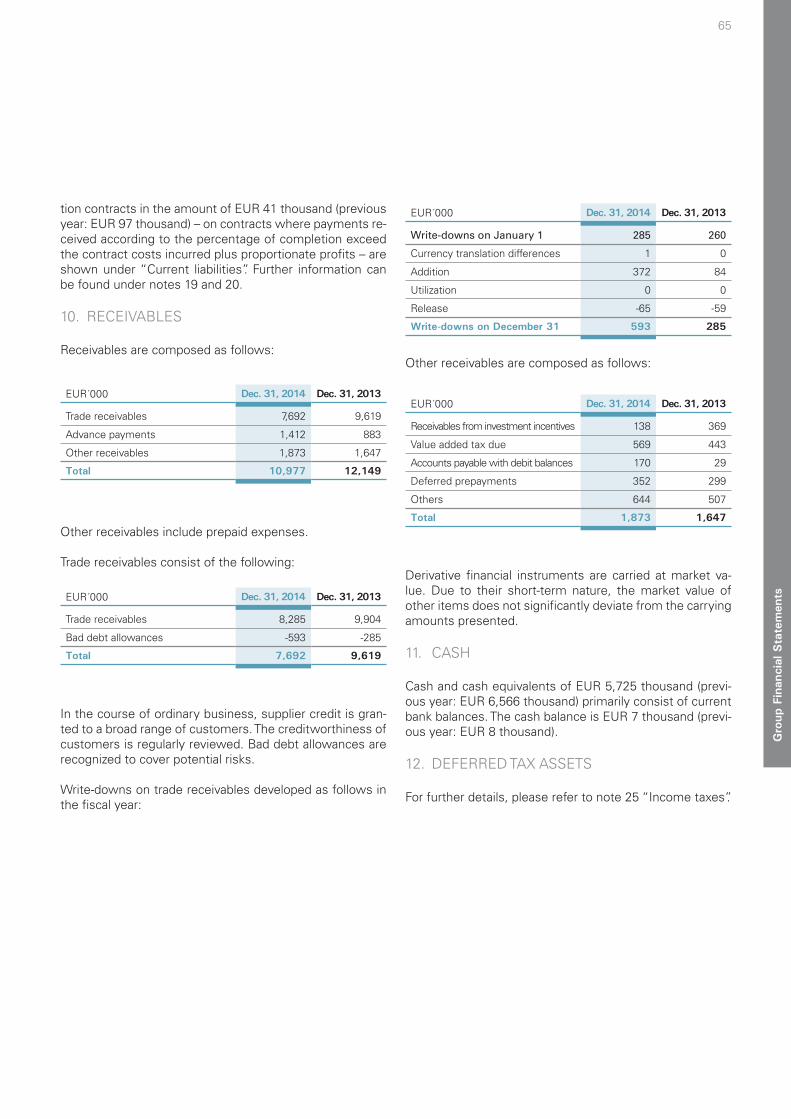
65
Gro
up F
inan
cial
Sta
tem
ents
EUR´000 Dec. 31, 2014 Dec. 31, 2013
Trade receivables 7,692 9,619
Advance payments 1,412 883
Other receivables 1,873 1,647
Total 10,977 12,149
EUR´000 Dec. 31, 2014 Dec. 31, 2013
Trade receivables 8,285 9,904
Bad debt allowances -593 -285
Total 7,692 9,619
EUR´000 Dec. 31, 2014 Dec. 31, 2013
Write-downs on January 1 285 260
Currency translation differences 1 0
Addition 372 84
Utilization 0 0
Release -65 -59
Write-downs on December 31 593 285
tion contracts in the amount of EUR 41 thousand (previous year: EUR 97 thousand) – on contracts where payments re-ceived according to the percentage of completion exceed the contract costs incurred plus proportionate profits – are shown under “Current liabilities”. Further information can be found under notes 19 and 20.
10. RECEIVABLES
Receivables are composed as follows:
Other receivables include prepaid expenses.
Trade receivables consist of the following:
In the course of ordinary business, supplier credit is gran-ted to a broad range of customers. The creditworthiness of customers is regularly reviewed. Bad debt allowances are recognized to cover potential risks.
Write-downs on trade receivables developed as follows in the fiscal year:
Other receivables are composed as follows:
Derivative financial instruments are carried at market va-lue. Due to their short-term nature, the market value of other items does not significantly deviate from the carrying amounts presented.
11. CASH
Cash and cash equivalents of EUR 5,725 thousand (previ-ous year: EUR 6,566 thousand) primarily consist of current bank balances. The cash balance is EUR 7 thousand (previ-ous year: EUR 8 thousand).
12. DEFERRED TAX ASSETS
For further details, please refer to note 25 “Income taxes”.
EUR´000 Dec. 31, 2014 Dec. 31, 2013
Receivables from investment incentives 138 369
Value added tax due 569 443
Accounts payable with debit balances 170 29
Deferred prepayments 352 299
Others 644 507
Total 1,873 1,647

66 PVA TePla AG Annual Report 2014
Non-current financial liabilities primarily relate to loans for the financing of construction measures in Wettenberg.
Non-current financial liabilities are composed as follows:
Non-current financial liabilities for the financing of const-ruction measures are all secured by charges on the land of the financed assets. In addition, the site in Jena is partially secured by the transfer of ownership of machines and fa-cilities. The carrying amount of this collateral amounted to EUR 27,674 thousand as of December 31, 2014 (previous year: EUR 28,789 thousand). This exceeded the total value of non-current financial liabilities as of the balance sheet date. Effective March 3, 2014, two fixed-interest real es-tate loans, which were secured by charges and land, for a new building in Wettenberg for EUR 5,684 thousand were terminated and combined into a new loan of EUR 6,000 thousand with a term until January 2023. Unlike the previ-ous year’s annual report, a previously unutilized loan to fi-nance the construction at the Wettenberg site was utilized to finance working capital in the short term.
The average weighted interest rate for non-current financi-al liabilities was 2.15% (previous year: 4.88%). Non-current financial liabilities declined to EUR 5,847 thousand (previ-ous year: EUR 6,540 thousand) due to a regularly sche-duled repayments of loans.
The repayment commitments for these non-current finan-cial liabilities are structured as follows:
13. SHAREHOLDERS‘ EQUITY
Share CapitalAs of December 31, 2014, PVA TePla AG had issued 21,749,988 no-par value shares each with a notional inte-rest in the share capital of EUR 1.00.
Contingent and Authorized CapitalThere was no contingent capital as of December 31, 2014.
At the Annual General Meeting on June 13, 2012, the for-mer authorization of the Management Board to increase the share capital of the Company effective until June 14, 2012 was revoked.
At the same time, the Annual General Meeting of PVA TePla AG authorized the Management Board to increase the Company’s share capital with approval of the Super-visory Board on one or more occasions during the period to June 30, 2017 by a total of up to EUR 10,874,994 by issuing up to 10,874,994 new, no-par value bearer shares against cash and/or non-cash contributions, with sharehol-ders’ subscription rights excluded to the extent permitted by law. No capital increases from this authorized capital were resolved in 2014.
14. DEFERRED INVESTMENT GRANTS FROM PUBLIC FUNDS
PVA TePla has received financial incentives from various public authorities under government business develop-ment programs, including funding for the construction of production facilities. Pursuant to IAS 20.24, investment subsidies and tax-free investment contributions received are deducted from the book value of the relevant assets.
15. NON-CURRENT FINANCIAL LIABILITIES
Non-current financial liabilities totaled EUR 5,847 thousand (previous year: EUR 6,540 thousand) – all of which were liabilities to banks.
EUR´000 Dec. 31, 2014 Dec. 31, 2013
Non-current financial liabilities 12,476 7,617
Portion of non-current financial liabilities due in less than one year -6,629 -1,077
Non-current financial liabilities less current portion 5,847 6,540

67
Gro
up F
inan
cial
Sta
tem
ents
Defined Benefit PlansProvisions for pension obligations are recognized on the basis of pension plans for commitments to pay retirement, invalidity and dependents’ benefits. The amount of benefit usually depends on the number of years of service and the salary of the respective employee.
Pension commitments in the form of defined benefit plans are in place for the eligible employees of PVA TePla AG and PVA Vakuum Anlagenbau Jena GmbH. The relevant pensi-on plans were taken over from previous companies in each case and only consist of previous benefit obligations. New pension obligations are generally no longer entered into.
Obligations are calculated using the projected unit credit method, under which future obligations are measured on the basis of the proportionate benefit entitlement acqui-red at the balance sheet date. Measurement takes into account assumptions on trends for the relevant factors af-fecting the amount of benefits.
There is no external financing via a pension fund. The resul-ting residual risks from accounting of pension obligations are related to risks from the change in actuarial parame-ters, which are shown in the table below. The largest risk is the interest rate, where we refer to the separate sensitivity analysis.
In detail, the calculation is based on the following actuarial premises:
EUR´000 2014 2013
Due
Up to 1 month 348 14
Between 1 and 3 months 84 68
Between 3 and 1 year 6,198 995
Between 1 and 5 years 3,459 3,023
More than 5 years 2,389 3,517
The loan for the financing of investments in machinery for the subsidiary PVA Löt- und Werkstofftechnik GmbH, Jena is secured through the transfer of ownership of the assets to be financed. The carrying amount of this collateral was EUR 797 thousand on December 31, 2014 (previous year: EUR 938 thousand).
The financial liabilities of PVA TePla AG are carried at amor-tized cost. As in the previous year, our banks were unable to provide us with the corresponding information, meaning that we were only able to approximate the actual market values using the present values of the principal repay-ments based on the yield curve at the balance sheet date plus a risk premium of 2.2%. This resulted in deviations between the conditions at the conclusion date and the ba-lance sheet date in the amount of EUR -57 thousand (pre-vious year: EUR -657 thousand).
16. PENSION PROVISIONS
Basic PrinciplesIn the area of company pension schemes, a distinction is made between defined benefit plans and defined contribu-tion plans. In the case of defined benefit plans, the Com-pany is obliged to pay defined benefits to active and former employees.
In the case of defined contribution plans, the Company does not enter into any additional obligations other than making earmarked contributions.
in % Dec. 31, 2014 Dec. 31, 2013
Income trend 3.00 3.00
Pension trend 1.25 1.25
Staff turnover 1.50 1.50
Interest rate for active staff 2.40 3.60
Interest rate for pensioners 1.90 3.20

68 PVA TePla AG Annual Report 2014
Changes in the present value of future pensions are as fol-lows:
Sensitivity AnalysisWhen keeping to the other assumptions, the changes reasonably assumed possible on the balance sheet date would have influenced the defined pension plans as fol-lows, based on actuarial gains and losses:
On December 31, 2014 the weighted average term of defi-ned pension plans was 16.4 years.
Overview of the present value of pension obligations for the current year and previous years:
Actuarial gains and losses have a direct impact on the con-solidated balance sheet and are only recognized in other comprehensive income.
Biometric parameters have been calculated on the basis of the 2005 G mortality tables issued by Professor Klaus Heubeck. The measurement of pension obligations is sup-ported by actuarial reports. The calculation is made using a mixed interest rate of 2.25% (previous year 3.5%) from the weighted average of the interest rate for active employees covered by the plan and pensioners.
The following amounts are recognized in the income state-ment:
Since fiscal year 2013, the interest portion included in pen-sion expenses is reported under net interest income.
Changes in recognized provisions for pensions are as fol-lows:
At the balance sheet date, it can be assumed that EUR 373 thousand (previous year: EUR 332 thousand) must be fulfilled within the next 12 months and that EUR 13,602 thousand (previous year: EUR 11,045 thousand) must be fulfilled at a later date (over a very long term for some por-tions).
EUR´000 2014 2013 2012 2011 2010
Pension obligations 13,975 11,377 11,338 8,759 8,254
Actuarial gains / losses 2,370 -206 2,296 178 444
Effect in EUR’000 on Dec. 31, 2014 Increase Reduction
Discount rate (0.25% change) -541 575
Future pension increases (0.25% change) 435 -416
EUR´000 2014 2013
Current service expenditures for services by employees in the current fiscal year; thereof 165 174
Cost of sales 140 128
Selling and distribution expenses 16 20
General administrative expenses 9 17
Research and development expenses 0 0
Other operating expenses 0 9
Interest expense 390 380
Total 555 554
EUR´000 2014 2013
Pension provisions on Jan. 1 11,377 11,338
Expenditure on retirement pensions 2,926 348
Pension payments -328 -309
Pension provisions on Dec. 31 13,975 11,377
EUR´000 2014 2013
Present value of future pensions on Jan. 1 11,377 11,338
Current service expense for services provided by employees in the fiscal year 165 174
Interest expense 390 380
Pension payments -328 -309
Actuarial gains and losses 2,370 -206
Present value of future pensions on Dec. 31 13,975 11,377

69
Gro
up F
inan
cial
Sta
tem
ents
Defined Contribution PlansThe only defined contribution plans of relevance to PVA TePla are the employer’s statutory pension insurance con-tributions and contributions to the pension fund. In fiscal year 2014, the corresponding expenditure amounted to EUR 1,953 thousand (previous year: EUR 2,171 thousand).
17. OTHER PROVISIONS
Other provisions amounted to EUR 1,820 thousand (pre-vious year: EUR 2,405 thousand) and changed during the reporting period as follows:
EUR´000 Jan. 1, 2014 Utilization Release Addition Dec. 31, 2014
Warranty 1,054 456 189 292 701
Subsequent costs 537 326 26 475 660
Archiving 182 8 74 1 101
Penalties 0 0 0 33 33
Others 632 488 96 223 270
Total 2,405 1,278 385 1,023 1,765
Provisions were recognized solely in respect of obligations to third parties where utilization is highly probable. Provi-sions are measured at the amount of probable utilization.
Other provisions comprise long-term components in the amount of EUR 168 thousand (previous year: EUR 490 thousand). These relate primarily to provisions for archi-ving as well as non-current payments in connection with long-term performance-based compensation for the Ma-nagement Board, and are shown separately in the balance sheet. Other non-current provisions declined primarily as a result of the payment of long-term remuneration compo-nents following the departure of the former CEO. All other provisions are short-term in nature.
18. CURRENT FINANCIAL LIABILITIES
Current financial liabilities are composed as follows:
Due to the current nature of these items, their market value does not deviate significantly from the carrying amounts presented.
19. OBLIGATIONS ON CONSTRUCTION CONTRACTS
Among other things, the PVA TePla Group manufactures large-scale systems under customer-specific contracts for which customers make payments in accordance with the progress of the contract. The negative balance resulting from sales revenues and progress billing, which is recor-ded on the basis of the percentage of completion, is pre-sented in the balance sheet as obligations on construction contracts.
Obligations on construction contracts are composed as follows:
EUR´000 Dec. 31, 2014 Dec. 31, 2013
Amounts owed to banks on current accounts 110 3
Current portion of non-current bank borrowings 6,629 1,077
Total 6,739 1,080
EUR´000 Dec. 31, 2014 Dec. 31, 2013
Advance payments received (progress billing) 684 393
less contract costs incurred (incl. share of profit) -643 -296
Total 41 97

70 PVA TePla AG Annual Report 2014
22. OTHER LIABILITIES
Of the other liabilities in the amount of EUR 2,034 thousand (previous year: EUR 1,747 thousand), EUR 1,279 thousand (previous year: EUR 1,059 thousand) are current and EUR 755 thousand (previous year: EUR 688 thousand) are non-current. Other current liabilities are mainly composed of EUR 554 thousand in tax liabilities (payroll, church and sa-les tax; previous year: EUR 491 thousand).
C. NOTES ON INDIVIDUAL INCOME STATEMENT ITEMS
23. SALES REVENUES
PVA TePla principally generates its sales revenues through the sale of systems. Additional sales revenues are genera-ted from services and by supplying spare parts (referred to collectively as after-sales service), as well as providing ser-vices for customers in the Company’s own facilities (con-tract processing, mainly carried out by PVA Lot- und Werk-stofftechnik GmbH and in the field of plasma treatment by PVA TePla America Inc. and PlaTeG GmbH). Sales revenues can be broken down into the following categories:
20. ADVANCE PAYMENTS RECEIVED ON ORDERS
The financing of the PVA TePla Group is largely based on advance and interim payments received from customers, particularly in the case of larger contracts. The value of the advance payments received as of December 31, 2014 was EUR 12,926 thousand (previous year: EUR 8,282 thousand). Given the irrecoverability of future receivables from construction contracts in the solar market, the servi-ces rendered for advance payments have been transferred to work in progress at EUR 3,478 thousand. These orders were offset by advance payments received amounting to EUR 2,578 thousand, which were disclosed with the stage of completion in the previous year’s financial statements in accordance with IAS 11. The “exit” from this accounting method led to a balance sheet extension of EUR 2,578 thousand.
21. ACCRUALS
Accruals are liabilities payable for goods or services recei-ved that are neither paid nor invoiced or formally agreed upon by the supplier at the balance sheet date. This also includes amounts owed to employees.
Accrued liabilities are composed as follows:
All of the reported amounts are short-term in nature.
EUR´000 2014 2013
Obligations to employees 2,154 2,859
Obligations to suppliers 1,595 2,443
Other commitments 325 381
Total 4,074 5,683
EUR´000 2014 in % 2013 in %
Systems 53,659 75 44,303 69
After-sales 13,557 19 14,628 23
Contract processing 3,025 4 3,657 6
Others 1,639 2 1,487 2
Total 71,880 100 64,075 100

71
Gro
up F
inan
cial
Sta
tem
ents
A tax rate of 28% is applied for domestic companies. This includes corporation tax of 15%, a solidarity surcharge of 5.5% on corporation tax, and trade tax of 12%.
Deferred taxes were measured after they had been incur-red using the tax rate stated above or country-specific tax rates for companies outside of Germany.
The actual tax charge is based on probable future tax liabi-lities and repayment claims.
Income taxes are broken down as follows:
Deferred taxes of EUR 590 thousand (previous year: EUR -8 thousand) were recognized directly in equity without affecting the income statement. These are attributable in full to effects recognized in equity for derivative financial instruments, pension provisions and currency translation differences.
The following table shows the reconciliation of expected and actual tax expense:
Sales revenues from customer-specific contract produc-tion amounted to EUR 50,551 thousand in the 2014 fiscal year (previous year: EUR 29,464 thousand). These orders were invoiced according to the percentage of completion method.
The following revenue from customer specific contract production resulted from the partial realization of sales re-venues in accordance with the percentage of completion method for customer-specific contracts already initiated by the balance sheet date and reported as future receivables on construction contracts or obligations on construction contracts:
24. RESEARCH AND DEVELOPMENT EXPENSES
Research and development expenses amounted to EUR 2,026 thousand in 2014 and EUR 2,564 thousand in 2013. Income from research and development project grants of EUR 376 thousand in 2014 and EUR 743 thousand in 2013 was recognized separately under “Other operating income”.
25. INCOME TAXES
Income taxes are calculated on a best estimate basis for the projected weighted average tax rate for the full fiscal year.
EUR´000 Dec. 31, 2014 Dec. 31, 2013
Revenue from customer-specific contract production 11,712 15,331
For which contract costs incurred -9,812 -12,171
Gains from customer-specific contract production 1,899 3,160
EUR´000 2014 2013
Actual tax expense / income -95 -1,239
Current tax expenses -65 -1,190
Prior-period tax charges -30 -49
Deferred tax expense / income -2,432 4,150
Credit from tax loss carry-forwards 2,239 2,650
Write-downs on deferred tax assets -4,322 0
Other deferred taxes -350 1,500
Income taxes -2,527 2,911
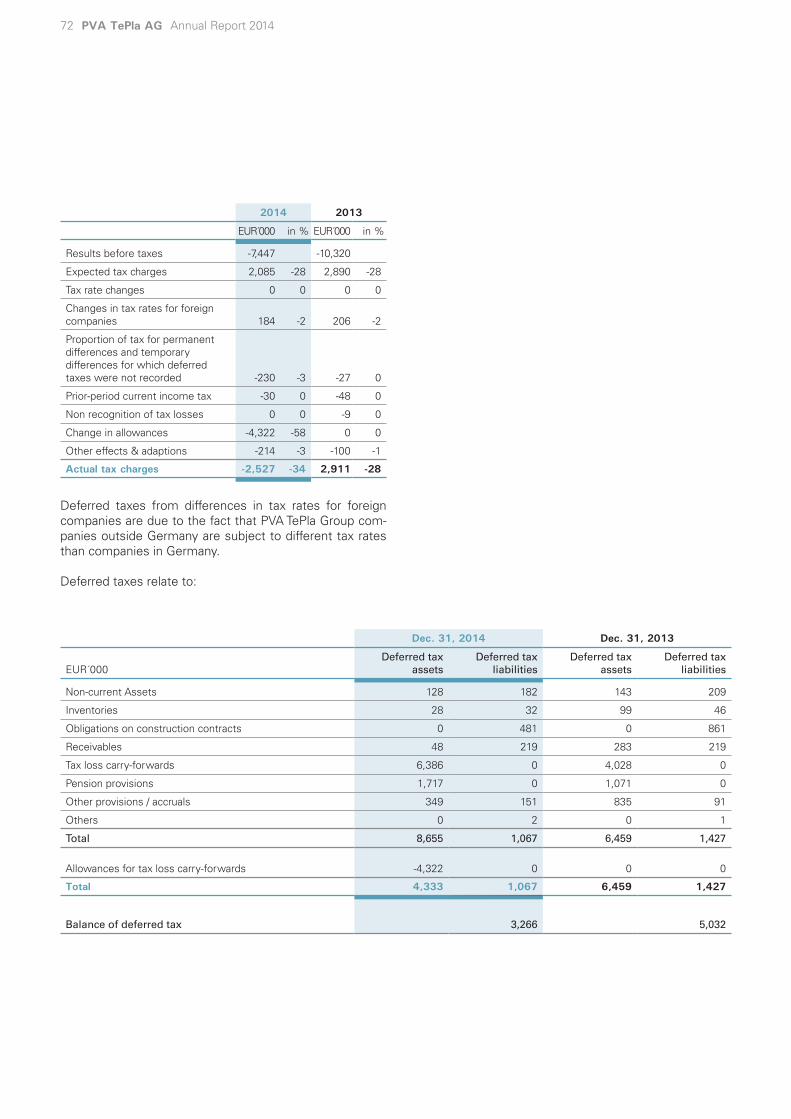
72 PVA TePla AG Annual Report 2014
Deferred taxes from differences in tax rates for foreign companies are due to the fact that PVA TePla Group com-panies outside Germany are subject to different tax rates than companies in Germany.
Deferred taxes relate to:
2014 2013
EUR´000 in % EUR´000 in %
Results before taxes -7,447 -10,320
Expected tax charges 2,085 -28 2,890 -28
Tax rate changes 0 0 0 0
Changes in tax rates for foreign companies 184 -2 206 -2
Proportion of tax for permanent differences and temporary differences for which deferred taxes were not recorded -230 -3 -27 0
Prior-period current income tax -30 0 -48 0
Non recognition of tax losses 0 0 -9 0
Change in allowances -4,322 -58 0 0
Other effects & adaptions -214 -3 -100 -1
Actual tax charges -2,527 -34 2,911 -28
Dec. 31, 2014 Dec. 31, 2013
EUR´000Deferred tax
assetsDeferred tax
liabilitiesDeferred tax
assetsDeferred tax
liabilities
Non-current Assets 128 182 143 209
Inventories 28 32 99 46
Obligations on construction contracts 0 481 0 861
Receivables 48 219 283 219
Tax loss carry-forwards 6,386 0 4,028 0
Pension provisions 1,717 0 1,071 0
Other provisions / accruals 349 151 835 91
Others 0 2 0 1
Total 8,655 1,067 6,459 1,427
Allowances for tax loss carry-forwards -4,322 0 0 0
Total 4,333 1,067 6,459 1,427
Balance of deferred tax 3,266 5,032

73
Gro
up F
inan
cial
Sta
tem
ents
Calculation of results per share for 2014 and 2013:
At the balance sheet date, no stock options were issued to employees and members of the Management and Super-visory Boards entitling them to purchase PVA TePla AG sha-res. As a result, there were no dilution effects in regards to earnings per share as of December 31, 2014.
27. APPROPRIATION OF NET PROFIT/ RETAINED EARNINGS
The single-entity financial statements of PVA TePla AG (under HGB) show a net loss for the year of EUR -5,624 thousand (previous year: EUR -7,350 thousand) and lower retained earnings of EUR 12,493 thousand (previous year: EUR 18,117 thousand) as of December 31, 2014. These re-tained earnings represent the distributable amount in ac-cordance with IAS 1.76(v).
In view of the net loss, the Management Board and Super-visory Board propose that the retained earnings reported in the 2014 annual financial statements amounting to EUR 12,493 thousand be carried forward to a new account at the same amount. There were no withdrawals from the share premium or retained earnings.
D. NOTES ON THE CASH FLOW STATEMENT AND ON CAPITAL MANAGEMENT
The cash flow statement has been prepared using the indirect method in accordance with IAS 7.20. The cash in the cash flow statement corresponds to the balance sheet item of the same name.
At December 31, 2014, the German companies had tax loss carry forwards totaling approximately EUR 19,024 thousand (previous year: EUR 11,157 thousand), which related exclusively to the subsidiaries Munich Metrology GmbH, Munich, and PlaTeG GmbH, Wettenberg.
Given the market volatility and recurring budget deviations in recent years, the period for determining the feasibility of loss carry forwards has been limited to three years. Pro-vided utilization of loss carry forwards appears likely for 2015 to 2017 based on the current budget, loss carry for-wards were reported in deferred tax assets. Conversely, loss carry forwards not expected to be realized until after 2017 were not or no longer recognized. Given the limited forecast period, only loss carry forwards of EUR 3,588 thousand were regarded as recoverable and relevant write-downs were carried out.
All other domestic Group companies are generating positi-ve results for tax purposes and no longer have unused tax loss carry forwards.
The tax loss carry forwards of PVA TePla America Inc. (USD 5.0 million for federal tax; USD 1.5 million for state tax) will gradually lapse from 2022 (federal tax) and 2016 (state tax) unless utilized prior to these dates and have been used only partially based on current budget. Due to the positive developments in fiscal year 2014, the recognized deferred tax assets in the amount of EUR 987 thousand (previous year: EUR 904 thousand) are considered to be recoverable on the basis of current earnings forecasts.
26. EARNINGS PER SHARE
The consolidated net result for the year before minority in-terests amounted to EUR -9,972 thousand (previous year: EUR -7,576 thousand). As in the previous year, an average of 21,749,988 no-par value shares was in circulation in fis-cal year 2014.
Results per share are calculated by dividing consolidated net result for the year before minority interests by the weighted average number of shares outstanding during the year.
2014 2013
Numerator: Consolidated net result for the year before minority interests (EUR´000) -9.972 -7,576
Denominator: Weighted number of shares outstanding - basic 21,749,988 21,749,988
Earnings per share (EUR) -0.46 -0,35

74 PVA TePla AG Annual Report 2014
Business transactions not affecting cash have not been in-cluded in the cash flow statement.
Payments for investments in intangible assets and proper-ty, plant and equipment include only cash effective acqui-sitions.
The primary objective of PVA TePla’s capital management is to ensure the financial flexibility required to reach the de-fined growth and yield targets, thereby enabling growth in the Company’s value. The contents of capital management cover shareholders’ equity and the external borrowing ne-cessary to finance the Company’s operations. The key in-dicator for capital management is the equity ratio. Actual management is performed by optimizing yields and setting limits on the commitment of funds. Further objectives of capital management include ensuring the Group’s liquidi-ty by agreeing appropriate and sufficient credit lines and maintaining the current ratio of advance payments, as well as optimizing the financial result in order to improve yields.
The capital management of PVA TePla therefore includes the following:
In fiscal year 2014, equity fell to EUR 38,815 thousand (pre-vious year EUR 50,715 thousand). Unlike the scheduled re-payment of financial liabilities, a credit line (December 31, 2014: EUR 5,333 thousand) secured by charges on land, which is available to the Company until December 2022, was utilized which reflects the increase in financial liabi-lities to EUR 12,586 thousand (previous year: EUR 7,620 thousand). The equity ratio deteriorated to 43.6% in 2014 (previous year: 54.5%).
E. ADDITIONAL DISCLOSURES
28. SEGMENT REPORTING
Performance is assessed and decisions regarding the as-signment of resources to the segments are made on the basis of PVA TePla AG’s two divisions. This means the segment reporting disclosures that follow are based on the Group’s organizational structure, which underlies the internal management reporting systems of the PVA TePla Group according to the two divisions: the Industrial Sys-tems division and Semiconductor Systems division.
The following tables gives an overview of PVA TePla AG’s segments. Segment reporting in accordance with IFRS 8 also includes a reconciliation of the total result of the seg-ments to the consolidated result for the year.
Sales revenues by divisions for fiscal years 2014 and 2013 are as follows:
Operating profit by segment for fiscal years 2014 and 2013 was as follows:
EUR´000 Dec. 31, 2014 Dec. 31, 2013
Shareholders‘ equity 38,815 50,307
Current and non-current financial liabilities 12,586 7,620
Advance payments received 12,926 8,282
Total amount 64,327 66,209
Total assets 89,037 92,363
Equity ratio 43.6% 54.5%
EUR´000 2014 2013
External sales
revenues
Internal sales
revenues
External sales
revenues
Internal sales
revenues
Segment revenues
Industrial Systems 35,572 921 28,712 816
Semiconductor Systems 36,308 362 35,363 433
Consolidated revenues 71,880 1,283 64,075 1,249
2014 2013
Operating profit by segment EUR‘000 in % EUR‘000 in %
Industrial Systems -942 -2.6 -2,978 -10.4
Semiconductor Systems -5,375 -14.8 -6.632 -18.8
Consolidation 12 66
Consolidated operating profit -6,305 -8.8 -9,544 -14.9

75
Gro
up F
inan
cial
Sta
tem
ents
The 2014 operating segment profit was reduced by one-off expenses for settlements and write-downs as follows: In the Industrial Systems division settlements of EUR 631 thousand were booked. Semiconductor Systems faced settlements of EUR 38 thousand.
The reconciliation of the segment results (EBIT) to the con-solidated net result for the period is as follows:
Other significant non cash-effective segment expenses were not incurred.
The following sales revenues were generated in fiscal ye-ars 2014 and 2013 by region:
Sales revenues are distributed among the different catego-ries as follows:
As a matter of principle, transactions involving interseg-ment sales and revenues are conducted at arm’s length conditions.
29. FINANCIAL INSTRUMENTS
This section contains a summary presentation of the Group’s financial instruments and derivative financial ins-truments. Details of the individual categories of financial instruments are provided in the notes on the respective balance sheet and income statement items.
Principles of the Risk Management SystemIn addition to default risk and liquidity risk, the Company’s assets, liabilities and planned transactions are subject to risks from changes in exchange rates and interest rates. The aim of financial risk management is to minimize these risks through ongoing operating and finance-oriented ac-tivities. Selected derivative instruments are employed to hedge market price risks, depending on the assessment of the respective risk. Derivative financial instruments are used solely as hedging instruments, meaning that they are not employed for trading or other speculative purpo-ses. The basic details of the financial policy are established annually by the Management Board and monitored by the Supervisory Board. The Management Board is directly res-ponsible for the implementation of the financial policy and ongoing risk management.
EUR´000 2014 2013
Total segment results -6,318 -9,610
Consolidation 13 66
Consolidated operating profit (EBIT) -6,305 -9,544
Financial result -1,142 -775
Results before taxes -7,447 -10,319
Income taxes -2,527 2,911
Consolidated net result -9,974 -7,408
EUR´000 2014 in % 2013 in %
Sales revenues by sales region
Germany 20,979 29 19,054 30
Europe (excluding Germany) 7,970 11 10,266 16
North America 4,655 7 6,292 10
Asia 37,242 52 25,809 40
Others 1,033 1 2,654 4
Consolidated revenues 71,880 100 64,075 100
EUR´000 2014 in % 2013 in %
Systems 53,659 75 44,303 69
After-sales 13,557 19 14,628 23
Contract processing 3,025 4 3,657 6
Others 1,639 2 1,487 2
Total 71,880 100 64,075 100

76 PVA TePla AG Annual Report 2014
Categories of Financial InstrumentsThe financial instruments held by the Group are allocated to the following categories:
Financial assets and liabilities
carried at fair value through profit / loss
affecting profit
Financial assets and liabilities
carried at fair value through profit / loss not affecting profit
Extended loans and receivables Financial liabilities PoC receivables
Fair value Fair value Amortized cost Amortized cost Amortized cost
EUR´000 2014 2013 2014 2013 2014 2013 2014 2013 2014 2013
Non-current assets
Investment property 0 0 0 0 367 388 0 0 0 0
Non-current financial assets 0 0 0 0 9 8 0 0 0 0
Current assets
Coming receivables on construction contracts 0 0 0 0 0 0 0 0 7,490 8,081
Trade receivables 0 0 0 0 7,689 9,619 0 0 0 0
Other receivables and assets 0 2 0 0 3,582 2,604 0 0 0 0
Cash 0 0 0 0 5,725 6,566 0 0 0 0
Other financial assets 0 0 0 0 0 0 0 0 0 0
Non-current liabilities
Financial liabilities 0 0 0 0 0 0 5,847 6,540 0 0
Other liabilities 754 685 0 0 0 0 1 3 0 0
Current liabilities
Financial liabilities 0 0 0 0 0 0 6,739 1,080 0 0
Trade payables 0 0 0 0 0 0 1,563 3,219 0 0
Other liabilities 249 202 2 8 0 0 18,292 15,123 0 0
Net finance cost / revenue -118 275 6 11 2 332 -510 -781 0 0

77
Gro
up F
inan
cial
Sta
tem
ents
With the exception of financial liabilities carried at amor-tized cost, the carrying amounts in the other categories largely correspond to the respective market values. No se-parate comparison of carrying amounts and market values is provided. In accordance with IFRS 7.27A, financial instru-ments measured at fair value must be assigned to different levels. PVA TePla AG’s financial instruments measured at fair value are allocated to “level 2” at which measurement is based on stock exchange or market prices of similar ins-truments or on measurement models based on input para-meters observable in the market.
The fair values of both forward exchange contracts and in-terest hedges were determined on the basis of discounted expected future cash flows, using market interest rates applicable to the remaining terms of the financial instru-ments.
The net loss from the financial assets and liabilities measu-red at fair value through profit or loss of EUR 118 thousand (previous year: net gain of EUR 275 thousand) comprises changes in the market value of derivative hedging instru-ments.
The net gain of EUR 11 thousand (previous year: net gain of EUR 6 thousand) from the financial assets and liabilities measured at fair value without affecting profit or loss com-prises changes in the market value of derivative hedging instruments.
The net gain from issued loans and receivables recognized at amortized cost of EUR 2 thousand (previous year: net gain of EUR 322 thousand) includes interest income and income from derivative financial instruments.
The net result on financial liabilities recognized at amor-tized cost includes interest expense of EUR 510 thousand (previous year: EUR 781 thousand).
Credit RiskThe Company is exposed to counterparty default risk as a result of its operating activities and certain financing acti-vities.
In its operating business, accounts receivable are monito-red on a decentralized, ongoing basis. Default risks are ta-ken into account through specific valuation allowances and flatrate specific valuation allowances.
For more information on the composition of receivables and the valuation allowances recognized, see note 10. Va-luation allowances are recognized in the amount of the ex-pected defaults on receivables.
Theoretically, the maximum default risk is shown by the car-rying amounts of the financial assets recognized in the ba-lance sheet. The PVA TePla Group recognized write-downs of EUR 593 thousand (previous year: EUR 285 thousand) on trade receivables to cover known risks. Risks from ad-vance payments are avoided with advance payment bonds. Risks from advance payments are avoided with advance payment bonds. There are no discernible risks from other receivables. The PVA TePla Group did not have any other material agreements which could reduce the maximum de-fault risk as of the balance sheet date.
Liquidity RiskRevolving liquidity planning is performed in order to ensure the Company’s solvency and financial flexibility at all times.
To the extent necessary, a liquidity reserve is held in the form of credit facilities and, if required, in cash.
For more information on the maturities of the individual financial liabilities, see the disclosures on the relevant ba-lance sheet items in note 15. The maturity analysis of the derivative financial liabilities can be found in the sections “Currency risks” and “Interest hedges”.
Market RiskWith regard to market price risk, the Company is exposed to currency risks, interest rate risks and other price risks.
Currency RisksThe Company’s currency risks primarily result from its ope-rating activities, financing measures and investments. For-eign currency risks with a significant impact on the Group’s cash flow are hedged.

78 PVA TePla AG Annual Report 2014
If the euro had increased (decreased) by 10% against the other relevant currencies for the Company as of December 31, 2014, other reserves in equity would have been EUR 51 thousand higher (EUR 42 thousand lower) (December 31, 2013: EUR 17 thousand higher (lower)).
Interest HedgesThe Company is mainly subject to interest rate risk in the Eurozone. Taking the existing and planned debt structure into account, the Company uses interest rate derivatives (interest rate swaps) in order to counteract interest rate risks.
In accordance with IFRS 7 interest rate risks are presented using sensitivity analyses. These represent the effects of changes in market interest rates on interest payments, in-terest income and expenses, other earnings components and, where applicable, shareholders’ equity.
As the Company has fixed interest rate agreements for its non-current primary financial instruments or variable inte-rest rate agreements that are hedged via cash flow hedges and its financial liabilities are recognized at amortized cost, only financial derivatives have an impact on other reserves in equity. Effects on profit / loss from any changes in inte-rest rates affecting the portion of current financial liabilities with variable interest rates totaling EUR 5,443 thousand (previous year: EUR 3 thousand) are negligible due to their maturity and current expectations for short-term interest rates.
Sensitivity analyses in accordance with IFRS 7 were per-formed for financial derivatives (swaps) not forming part of an effective hedge. If the market interest rate at December 31, 2014 had been 100 basis points higher, earnings would have increased by EUR 216 thousand (previous year: EUR 257 thousand). Conversely, if the market interest rate at December 31, 2014 had been 100 basis points lower, ear-nings would have decreased by EUR 232 thousand (previ-ous year: EUR 277 thousand).
Interest rate hedges with a total original volume of EUR 11,600 thousand were entered into in order to hedge the interest rate risk for the financing of investments in new buildings at the Wettenberg and Jena sites. The outstan-ding balance of these hedging transactions at December 31, 2014 is EUR 5,787 thousand (previous year: EUR 6,613 thousand). The interest hedges have a term to maturity of up to eight years. The expected net payments from inte-rest hedging instruments are as follows:
Foreign currency risks from operations primarily arise when planned transactions are settled in a currency other than the functional currency (EUR). These planned transac-tions relate in particular to expected future sales revenues invoiced in US dollars.
PVA TePla AG enters into forward exchange contracts to hedge its payment obligations. These derivative financial instruments have a term to maturity of less than one year and hedge payment obligations of EUR 854 thousand (pre-vious year: EUR 237 thousand) as of December 31, 2014. The expected net payments from currency hedging instru-ments are as follows:
Currency risks due to foreign currency invoices are main-ly hedged by forward exchange contracts, meaning that changes in exchange rates from foreign currency transac-tions have no significant effect on profit/loss or sharehol-ders’ equity.
For the prospective effectiveness measurement it is che-cked that key parameters of hedging instruments (nominal amount, term, etc.) match the hypothetical derivatives, and the cumulative dollar offset method is used for the retros-pective effectiveness measurement.
Interest income and expenses from financial instruments at the German companies are recognized in the functional currency (EUR). This means that foreign currency risks can only arise from the financial instruments and assets held by the individual companies outside Germany that would be taken directly to currency reserves in equity.
For this reason, only an equity-based sensitivity analysis is performed.
If the euro had increased (decreased) by 10% against the US dollar as of December 31, 2014, other reserves in equi-ty would have been EUR 66 thousand (EUR 54 thousand lower) (December 31, 2013: EUR 175 thousand lower (hig-her)).
Expected net payments EUR´000 (prior-year net payments received) Dec. 31, 2014 Dec. 31, 2013
Up to 1 month -5 2
Between 1 and 3 months -11 0
Between 3 months and 1 year -15 0
Between 1 and 5 years 0 0

79
Gro
up F
inan
cial
Sta
tem
ents
The market value of these hedging instruments as of De-cember 31, 2014 totals EUR -972 thousand (previous year: EUR -887 thousand), of which EUR 85 thousand was re-cognized in income under financing expenses through profit and loss in fiscal year 2014 (previous year: EUR 305 thousand in finance revenue).
Other Price RisksAs part of the description of market risks, IFRS 7 also re-quires disclosures on how hypothetical changes in other price risk variables would affect the prices of financial ins-truments. In particular, these risk variables include quoted prices and indices.
At December 31, 2014 and December 31, 2013, the Com-pany did not hold any significant financial instruments that were subject to other notable price risks.
30. LEASING
PVA TePla is the lessee of property, plant and equipment and lessor in connection with the leasing of its own buil-dings. The leasing arrangements entered into by PVA TePla are all classified as operating leases. There are two main groups of leasing arrangements:
Rent of BuildingsPVA TePla has rented premises for production and adminis-tration from third parties at its sites in Kirchheim, Munich, Jena, Westhausen, Frederikssund (Denmark), Corona / Ca-lifornia (USA), Beijing (China) and Xi’an (China) as well as in Singapore. In 2014, the monthly rent was EUR 10 thousand at the Kirchheim site (previous year: EUR 10 thousand), EUR 6 thousand at the Munich site (previous year: EUR 6 thousand), EUR 4 thousand at the Jena site (previous year: EUR 4 thousand), EUR 0 thousand at the Berlin site (previous year: EUR 3 thousand), EUR 7 thousand at the Westhausen site (previous year: EUR 7 thousand), EUR 10 thousand at the Frederikssund site (previous year: EUR 10 thousand), EUR 7 thousand at the Corona site (previous year: EUR 7 thousand), EUR 2 thousand at the Beijing site (previous year: EUR 2 thousand), EUR 9 thousand at the Singapore site (previous year: EUR 9 thousand) and EUR 1 thousand at the Xi’an site (previous year: EUR 0 thousand).
The relevant rental agreements are standard agreements for the rental of commercial premises. In 2014, a total of EUR 621 thousand was paid under these agreements (previous year: EUR 614 thousand). The minimum com-mitments for the coming years comprise the following amounts:
The interest hedging instruments and underlying loans were concluded in 2005 and 2007 on the basis of the cor-responding interest rates. They ensure long-term, highly flexible financing for the new construction measures in Jena and Wettenberg.
The market value of these instruments at December 31, 2014 was EUR -974 thousand (previous year: EUR -895 thousand) and is reported under other financial liabilities. The offsetting entry for the market value and the related deferred taxes are reported in equity under “Other reser-ves” for those interest derivatives that have an effective hedging relationship with a loan.
Effective March 3, 2014, PVA TePla AG terminated two fixed-interest real estate loans for a new building in Wet-tenberg for EUR 5,684 thousand and combined them into a new loan of EUR 6.0 million with a term until January 2023. The new loan with interest hedges of more than EUR 6 mil-lion is synchronized. An effective relationship between the underlying and hedging transactions under IFRS was not achieved by the reporting date. The negative market value of these hedges was valued at EUR -972 thousand as of December 31, 2014; changes in market value are reported as expenses.
The previously unutilized loan to finance the building at the Wettenberg site was fully utilized to finance working capital in the short-term at EUR 5,333 thousand as of December 31, 2014. Given the currently low interest rate levels which are not expected to increase in the medium term, this loan with a variable nominal interest rate without a correspon-ding interest rate hedge bears only a minimal market risk from changes in the corresponding market interest rates. For this reason, the interest rates for the loan will not be hedged.
The corresponding offsetting entry for the market value of the interest hedge and the related deferred taxes will be reported in other current and non-current financial liabilities as well as the deferred tax assets or liabilities, depending on the change in market value.
Expected net payments EUR´000 Dec. 31, 2014 Dec. 31, 2013
Up to 1 month -113 -107
Between 1 and 3 months -1 -2
Between 3 months and 1 year -106 -101
Between 1 and 5 years -588 -394

80 PVA TePla AG Annual Report 2014
31. OTHER FINANCIAL OBLIGATIONS
Commitments from Current AgreementsCommitments under rental and lease agreements are dis-cussed above (see note 30).
Total commitments from master purchase agreements can be broken down as follows:
Total commitments from other agreements (e.g. servicing agreements, security services) can be broken down as fol-lows:
32. COST OF MATERIALS
The cost of sales for fiscal years 2014 and 2013 contain expenditures on materials as follows:
Sublease of BuildingsLease agreements gave rise to income of EUR 82 thousand in 2014 (previous year: EUR 55 thousand). Income from lea-sing over the coming years can be broken down as follows:
Lease of VehiclesPVA TePla AG restricts the number of company vehicles to an absolute minimum. As a matter of principle, cars for private use are provided on a priority basis to members of the Management Board, heads of divisions and managing directors as well as individual employees with a great deal of external activities. Above and beyond this, fleet vehic-les are used for business travel. Since 2004, new vehic-les have been leased. In 2014, expenditures of EUR 181 thousand were incurred for such leases (previous year: EUR 191 thousand). Over the next few years, the minimum commitments can be broken down as follows:
Other LeasesIn addition to the aforementioned leases, the Company has other leases which mainly pertain to operating and of-fice equipment. In 2014, expenditures of EUR 70 thousand were incurred for such leases (previous year: EUR 138 thousand). Over the next few years, the minimum commit-ments can be broken down as follows:
EUR´000 Payments Present value
Remaining terms
Up to 1 year 78 75
Between 1 and 5 years 0 0
More than 5 years 0 0
EUR´000 Payments Present value
Remaining terms
Up to 1 year 482 461
Between 1 and 5 years 873 776
More than 5 years 21 16
EUR´000 Payments Present value
Remaining terms
Up to 1 year 103 99
Between 1 and 5 years 80 72
More than 5 years 0 0
EUR´000 Payments Present value
Remaining terms
Up to 1 year 45 43
Between 1 and 5 years 87 78
More than 5 years 0 0
EUR´000 Payments Present value
Remaining terms
Up to 1 year 615 589
Between 1 and 5 years 0 0
More than 5 years 0 0
EUR´000 Payments Present value
Remaining terms
Up to 1 year 854 817
Between 1 and 5 years 22 19
More than 5 years 0 0
EUR´000 2014 2013
Cost of raw materials, consuma-bles and supplies and of goods purchased and held for resales 34,037 20,495
Cost of purchased services 3,577 5,409
Total cost of materials 37,614 25,904

81
Gro
up F
inan
cial
Sta
tem
ents
The number of employees includes 7 assistants (previous year: 3).
34. AMORTIZATION AND DEPRECIATION
Depreciation and amortization are discussed in the disclo-sures on non-current assets (see notes 4 and 5).
35. RISK MANAGEMENT
The current risks and opportunities and PVA TePla’s risk management system are presented in detail in the ma-nagement report. Please refer to section 4 of the manage-ment report for more information.
36. EXECUTIVE BODIES OF THE COMPANY
Management BoardIn fiscal year 2014, the Management Board of PVA TePla AG consisted of the following persons:
Dr. Arno Knebelkamp, Mülheim (Chairman until June 13, 2014)
Managing Director of the following Group companies:» PVA TePla Analytical Systems GmbH, Westhausen (until June 12, 2014)
Membership in supervisory bodies:» PVA TePla America Inc., Corona, USA (Director) (until June 12, 2014)» Profine GmbH, Troisdorf (Deputy Chairman of the Supervisory Board)
Oliver Höfer, Jena (Chief Operating Officer/COO)
Managing Director of the following Group companies:» PVA Vakuum Anlagenbau Jena GmbH » PVA Jena Immobilien GmbH, Jena
Accordingly, the materials ratio (cost of materials to total sales revenues) amounted to 52.3% in fiscal year 2014, compared to 40.4% in the previous year.
33. PERSONNEL EXPENSES
Personnel expenses for fiscal years 2014 and 2013 consist of the following:
Personnel expenses of EUR 778 thousand include sever-ance and redundancy payments. Compared to sales reve-nues, personnel expenses therefore fell to 45,0% in fis-cal year 2014, compared with 50.6% in the previous year. The percentage decline is largely due to the increase in sales revenues. Social charges contain expenditure on re-tirement provisions in the amount of EUR 631 thousand (previous year: EUR 391 thousand).
The Group had a total of 391 employees at year-end (pre-vious year: 424) and an average of 407 employees for the year as a whole (previous year: 464).
Development in the number of employees at the following reporting dates:
The average number of employees by function has chan-ged compared to the previous year as follows:
EUR´000 2014 2013
Wages and salaries 27,195 27,340
Social charges 5,132 5,103
Total personnel expenses 32,327 32,443
EUR´000Dec. 31,
2013Q1/
2014Q2/
2014Q3/
2014Dec. 31,
2014
Administration 59 60 61 59 56
Sales 48 47 47 50 51
Engineering, research and development 92 88 89 90 85
Production and service 225 219 220 206 199
Total number of employees 424 414 417 405 391
Number of employees by function (average for the year) 2014 2013
Administration 59 61
Sales 49 51
Engineering, research and development 88 102
Production and service 211 250
Total number of employees 407 464

82 PVA TePla AG Annual Report 2014
(until August 25, 2014 – merger)» JenaWave GmbH, Jena (until August 25, 2014 – merger)» PVA Crystal Growing Systems GmbH, Wettenberg (since April 11, 2014)» PVA TePla Analytical Systems GmbH, Westhausen (since June 16, 2014)» PVA TePla Singapore Pte. Ltd., Singapore (since June 20, 2014)
Peter Abel, Wettenberg (since April 1, 2014 responsible for strategic corporate planning; since June 13, 2014 Chief Executive Officer)
Managing Director of the following Group companies:» PVA Industrial Vacuum Systems GmbH, Wettenberg (April 11 – October 22, 2014)» PVA Crystal Growing Systems GmbH, Wettenberg (since April 11, 2014)
and the following non-associated companies:» PA Beteiligungsgesellschaft mbH, Wettenberg
Membership in supervisory bodies:» Xian Huade CGS Corp., Xian, China (Chairman of the Supervisory Board)» SCHEBO Biotech AG, Gießen (until May 31, 2014 Chairman of the Supervisory Board) » 3D Präzisionstechnik AG, Asslar (Chairman of the Supervisory Board)
Henning Döring, Giessen (since April 1, 2014 Chief Financial Officer)
Managing Director of the following Group companies:» PVA TePla America Inc., Corona, USA (Director) (since June 19, 2014)» PVA Metrology & Plasma Solutions GmbH, Kirchheim (Managing Director since September 9, 2014)
The total remuneration paid to the members of the Ma-nagement Board in fiscal year 2014 was EUR 721 thousand (previous year: EUR 1,617 thousand). This remuneration consists of a non-performance related basic salary; other benefits (primarily non-cash benefits from the use of a company car, subsidies for health insurance premiums, as well as contributions to a pension fund); and performance-based, variable compensation in the form of bonus pay-ments. The smaller share of the bonus payment is mea-sured as a percentage of the annual net profit of the PVA TePla Group that exceeds a minimum of EUR 5 million. This
bonus may be no more than half of the respective basic salary. The greater portion is paid out in the form of a long-term bonus. The reference amount is converted into notio-nal shares using a current reference and is then calculated three years later using the reference exchange rate valid on that date. The long-term bonus may be no more than twice the fixed annual salary. This provision only applies to Chief Operating Officer/COO Oliver Höfer since December 2013. For the first seven months of fiscal year 2014, the performance-based component for Arnd Bohle was calcu-lated using a rule under which the bonus is fully calcula-ted pro rata for half of the basic salary. Henning Döring receives a variable bonus which amounts to a maximum of 30% of the fixed annual salary. The bonus for 2014 was determined at the beginning of the contract. From fiscal year 2015, the bonus for the respective fiscal year is di-vided between a long-term component and short-term components. It is based on a criteria catalogue comprising long and short-term objectives which are defined by the Supervisory Board annually. On this basis, members of the Management Board received the following remuneration in fiscal year 2014:
The performance-related component presented above contains amounts paid in 2014 for fiscal year 2013, as well as a deduction of the amounts recognized and reported as provisions in fiscal year 2013. Provisions established in 2014 for fiscal year 2014 are also included.
The performance related component of EUR 164 thousand is divided between a short and a long-term component. The long-term performance-related component for the Ma-nagement Board amounts to EUR 60 thousand. This share-
EUR´000 SalaryOther
benefits
Perfor-mance-related compo-
nentsTotal 2014
Total 2013
Abel (since April 1, 2014) 90 0 0 90 0
Höfer 180 9 70 259 49
Döring (since April 1, 2014) 98 0 24 122 0
Dr. Knebel-kamp (until July 31, 2014) 140 40 70 250 458

83
Gro
up F
inan
cial
Sta
tem
ents
Dr. Gernot Hebestreit, Leverkusen (Deputy Chairman)» Global Leader Business Development and Markets, Grant Thornton International Limited, London/UK
Member of the following other supervisory bodies:» Comvis AG, Essen (Deputy Chairman of the Supervisory Board)
Prof. Dr. Markus H. Thoma, Schöffengrund (since June 13, 2014) » Professor of Plasma and Astronautics at the University of Giessen
Prof. Dr. Günter Bräuer, Cremlingen (until June 13, 2014)» Director of the Fraunhofer Institute for Laminate and Surface Engineering (IST), Braunschweig, and Managing Director of the Institute for Surface Engineering (IOT) of Braunschweig Technical University
Member of the following other supervisory bodies:» Institut für Solarenergieforschung GmbH, Emmerthal (Member of the Scientific Advisory Board)
The Supervisory Board now receives a fixed total remune-ration of EUR 100 for its activities per fiscal year.
This total remuneration is divided between the members of the Supervisory Board in such a way that the Chairman of the Supervisory Board receives double the amount paid to each regular member of the Supervisory Board. Mem-bers who leave the Supervisory Board during the fiscal year receive pro rata remuneration for their period of service.
based remuneration component comes within the scope of IFRS 2 and was calculated on the basis of an option pricing model.
Non-current payments are due in connection with the long-term performance-based compensation mentioned above. All other remuneration listed above is payable over the short term. Employer contributions to pension insurance are not paid. Pension obligations exclusively consist of past obligations for CEO Peter Abel of EUR 722 thousand (previous year: EUR 581 thousand). Since his reentry into the Management Board, no other pension obligations have been agreed. There are no pension obligations for the other members of the Management Board.
No share options were granted to members of the Ma-nagement Board in fiscal year 2014. The contracts for the members of the Management Board foresees settlement payments in the event of the premature termination of ac-tivities as member of the Management Board, the amount of which – depending on contract of employment – is limi-ted up to two years’ salary (settlement cap). In the event of change of control and a subsequent premature termination of Management Board activities, the members receive re-muneration which should not exceed 150% of the settle-ment cap.
The Company has pension commitments to former mem-bers of the Management Board with present values of EUR 2.003 thousand (previous year: EUR 1,724 thousand). In 2014, pensions of EUR 64 thousand (previous year: EUR 64 thousand) were paid to former members of the Ma-nagement Board.
Supervisory BoardIn fiscal year 2014, the Supervisory Board of PVA TePla AG consisted of:
Alexander von Witzleben, Weimar (Chairman)» Feintool International Holding AG, Lyss (President of the Administration Board)
Member of the following other supervisory bodies:» VERBIO Vereinigte BioEnergie AG, Leipzig (Chairman of the Supervisory Board)» Siegwerk Druckfarben AG & Co. KGaA, Siegburg (Member of the Supervisory Board)» KAEFER Isoliertechnik GmbH & Co. KG, Bremen (Member of the Advisory Board)
EUR´000
Fixed remunera-tion 2014
Variable remunera-tion 2014
Fixed remunera-tion 2013
Variable remunera-tion 2013
von Witzleben (chairman) 50.0 0 50.0 0
Prof. Dr. Bräuer (until June 13, 2014) 11.3 0 25.0 0
Dr. Hebestreit 25.0 0 25.0 0
Prof. Dr. Thoma (since June 13, 2014) 13.7 0 0 0
Total 100.0 0 100.0 05
84 PVA TePla AG Annual Report 2014
39. DECLARATION OF COMPLIANCE WITH SECTION 161 AKTG
The declaration of compliance with the German Corporate Governance Code as required by Section 161 of the Ger-man Stock Corporation Act (AktG) was again submitted by the Management Board and the Supervisory Board in the course of the fiscal year.
This declaration forms part of the separate corporate governance report and is permanently accessible to share-holders on the Company’s Website (www.pvatepla.com) along with the declarations for previous fiscal years.
40. DISCLOSURES UNDER SECTION 160 (1) NO. 8 AKTG
As of December 31, 2014, PA Beteiligungsgesellschaft, based in Wettenberg and belonging to Peter Abel, held a participating interest in the Company of more than 25%.
Peter Abel, Wettenberg has notified us under Section 21 (1) and Section 22 (1) sentence 1 no. 1 and 2 of the Ger-man Securities Trade Act (WpHG) that his share of the vo-ting rights in our Company exceeded the threshold of 25% on November 5, 2002, and now amounts to 29.99%. Of that, 29.32% of the voting rights under Section 22 (1) no. 1 and 2 of the German Securities Trade Act (WpHG) are allocated to him.
ARGOS FUNDS Luxembourg, Luxembourg, notified us on October 10, 2013 under Section 21 (1) sentence 1 WpHG that its share of the voting rights in PVA TePla AG, Wetten-berg, Germany, exceeded the threshold of 5% on October 3, 2013 and that its total share of the voting rights in that company on that day amounted to 5.53%, corresponding to 1,202,890 of a total of 21,749,988 voting rights.
In addition, ARGOS INVESTMENT MANAGERS SA, Mey-rin, Switzerland, notified us on October 10, 2013 under Section 21 (1) sentence 1 WpHG that its share of the vo-ting rights in PVA TePla AG, Wettenberg, Germany, excee-ded the threshold of 5% on October 3, 2013 and that its total share of the voting rights in that company on that day
EUR´000 2014 2013
Audit of annual financial statements 221 212
Other assurance or valuation services 0 0
Tax consulting services 0 0
Other services 9 0
D&O insurance has been taken out to cover the liability of the members of executive bodies under civil law. In fiscal year 2014, a premium of EUR 11 thousand (previous year: EUR 14 thousand) was paid for this insurance.
37. RELATED PARTIES
Business transactions with related parties are on the one hand transactions with companies in which executive of-ficers of PVA TePla AG have significant shareholdings or over which they exercise significant influence. On the other hand, these are business transactions with compa-nies controlled by parties that may exercise significant in-fluence on PVA TePla (particularly via participating interests in the Company).
In the reporting period, only the relationship to the majority shareholder Peter Abel is relevant in this context. PVA TeP-la AG’s relevant transactions with related parties principally encompass purchases from IT companies. In fiscal year 2014, the value of purchases from these companies has so far totaled EUR 732 thousand (previous year: EUR 705 thousand) and the value of sales was EUR 33 thousand (previous year: EUR 1 thousand). The balance of outstan-ding receivables and liabilities at the balance sheet date on December 31, 2014 was EUR 0 thousand (previous year: EUR 0 thousand) and EUR 162 thousand (previous year: EUR 45 thousand), respectively. All transactions are con-ducted at arm’s length conditions.
38. AUDIT FEES (SECTION 314 HGB)
The auditors’ fees recognized as expenses for PVA TePla AG and the other companies of the PVA TePla Group amounted to:

85
Gro
up F
inan
cial
Sta
tem
ents
amounted to 5.53%, corresponding to 1,202,890 of a total of 21,749,988 voting rights. In accordance with Section 22 (1) sentence 1 no. 6 WpHG, this 5.53% (corresponding to 1,202,890 of a total of 21,749,988 voting rights) of ARGOS FUNDS, Luxembourg, is attributed to ARGOS INVEST-MENT MANAGERS SA.
Christian Graf Dürckheim, Switzerland, notified us on Sep-tember 18, 2014 under Section 21 (1) sentence 1 of the German Securities Trading Act (WpHG) that his share of the voting rights in PVA TePla AG, Wettenberg, Germany, fell below the threshold of 5% on September 8, 2014, and that his total share of the voting rights in that company on that day amounted to 4.01%, corresponding to 872,070 voting rights.
41. ADDITIONAL DISCLOSURES
The following companies included in the consolidated fi-nancial statements of PVA TePla AG have utilized the exem-ption pursuant to Section 264 (3) HGB:
» PVA Löt- und Werkstofftechnik GmbH» PVA Control GmbH» PVA TePla Analytical Systems GmbH» PVA Vakuum Anlagenbau Jena GmbH» PVA Industrial Vacuum Systems GmbH» PVA Crystal Growing Systems GmbH
42. AUTHORIZATION OF THE FINANCIAL STATEMENTS FOR PUBLICATION
On March 17, 2014, the Management Board of PVA TeP-la AG authorized the present consolidated financial state-ments for fiscal year 2014 to be released to the Superviso-ry Board. This represents the authorization for publication described in IAS 10.6.
43. SIGNIFICANT POST-BALANCE SHEET DATE EVENTS
Since the start of fiscal year 2015, there have been no sig-nificant changes in the Company’s situation or the industry in which it operates. Concerning the changes in the corpo-
rate structure since the beginning of fiscal 2015, we refer to the comments in the combined management report. In addition no major changes are planned in the structure, ad-ministration or legal form of the Group or its personnel.
Wettenberg, March 17, 2015
PVA TePla AG
Peter AbelVorsitzender des Vorstands
Oliver HöferVorstand Produktion und Technologie
Henning DöringVorstand Finanzen
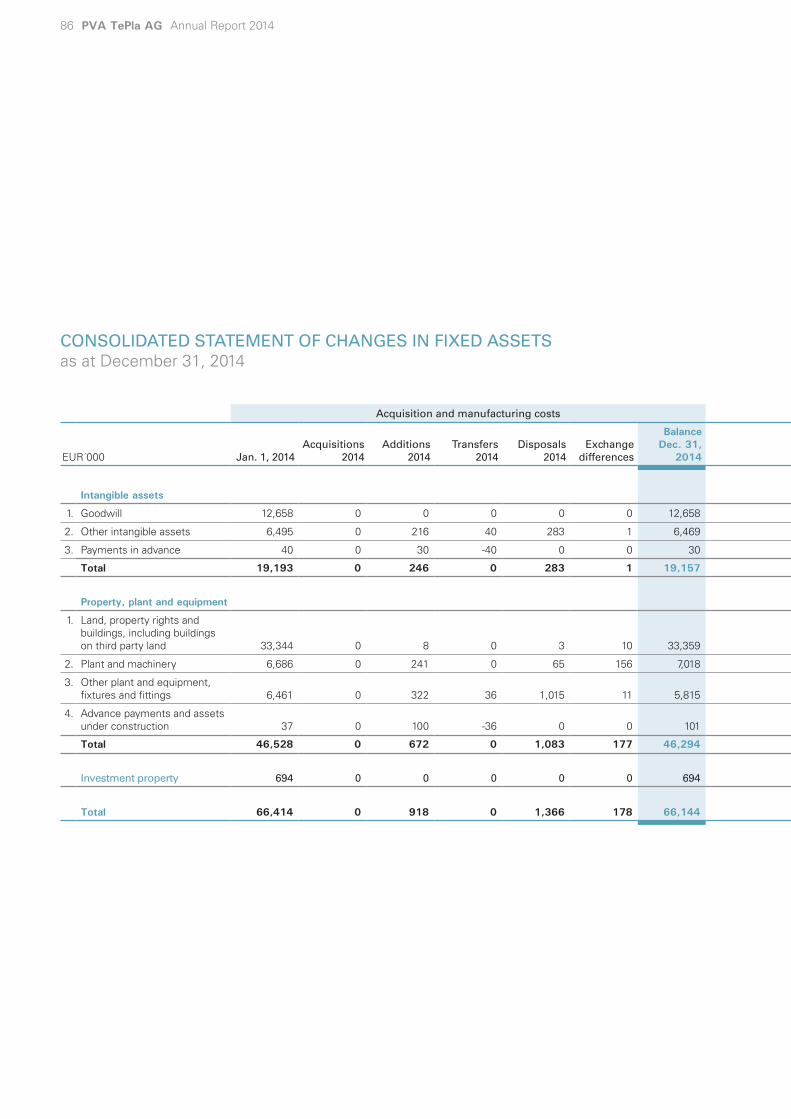
86 PVA TePla AG Annual Report 2014
Acquisition and manufacturing costs Accumulated amortization and depreciation Residual carrying values
EUR´000 Jan. 1, 2014Acquisitions
2014Additions
2014Transfers
2014Disposals
2014Exchange
differences
Balance Dec. 31,
2014Balance
Jan. 1, 2014Additions
2014Transfers
2014Disposals
2014Write-ups
2014Exchange
differences
Balance Dec. 31,
2014Dec. 31,
2014Dec. 31,
2013
Intangible assets
1. Goodwill 12,658 0 0 0 0 0 12,658 4,850 0 0 0 0 0 4,850 7,808 7,808
2. Other intangible assets 6,495 0 216 40 283 1 6,469 5,577 271 0 265 0 0 5,583 886 918
3. Payments in advance 40 0 30 -40 0 0 30 0 0 0 0 0 0 0 30 40
Total 19,193 0 246 0 283 1 19,157 10,472 271 0 265 0 0 10,433 8,724 8,766
Property, plant and equipment
1. Land, property rights and buildings, including buildings on third party land 33,344 0 8 0 3 10 33,359 6,612 1,017 0 0 0 10 7,638 25,722 26,732
2. Plant and machinery 6,686 0 241 0 65 156 7,018 3,911 470 0 65 0 142 4,458 2,560 2,775
3. Other plant and equipment, fixtures and fittings 6,461 0 322 36 1,015 11 5,815 4,967 462 0 999 0 10 4,441 1,373 1,494
4. Advance payments and assets under construction 37 0 100 -36 0 0 101 0 0 0 0 0 0 0 101 37
Total 46,528 0 672 0 1,083 177 46,294 15,490 1,949 0 1,063 0 162 16,537 29,756 31,038
Investment property 694 0 0 0 0 0 694 305 22 0 0 0 0 327 367 388
Total 66,414 0 918 0 1,366 178 66,144 26,222 2,242 0 1,328 0 162 27,298 38,847 40,192
CONSOLIDATED STATEMENT OF CHANGES IN FIXED ASSETSas at December 31, 2014

87
Gro
up F
inan
cial
Sta
tem
ents
Acquisition and manufacturing costs Accumulated amortization and depreciation Residual carrying values
EUR´000 Jan. 1, 2014Acquisitions
2014Additions
2014Transfers
2014Disposals
2014Exchange
differences
Balance Dec. 31,
2014Balance
Jan. 1, 2014Additions
2014Transfers
2014Disposals
2014Write-ups
2014Exchange
differences
Balance Dec. 31,
2014Dec. 31,
2014Dec. 31,
2013
Intangible assets
1. Goodwill 12,658 0 0 0 0 0 12,658 4,850 0 0 0 0 0 4,850 7,808 7,808
2. Other intangible assets 6,495 0 216 40 283 1 6,469 5,577 271 0 265 0 0 5,583 886 918
3. Payments in advance 40 0 30 -40 0 0 30 0 0 0 0 0 0 0 30 40
Total 19,193 0 246 0 283 1 19,157 10,472 271 0 265 0 0 10,433 8,724 8,766
Property, plant and equipment
1. Land, property rights and buildings, including buildings on third party land 33,344 0 8 0 3 10 33,359 6,612 1,017 0 0 0 10 7,638 25,722 26,732
2. Plant and machinery 6,686 0 241 0 65 156 7,018 3,911 470 0 65 0 142 4,458 2,560 2,775
3. Other plant and equipment, fixtures and fittings 6,461 0 322 36 1,015 11 5,815 4,967 462 0 999 0 10 4,441 1,373 1,494
4. Advance payments and assets under construction 37 0 100 -36 0 0 101 0 0 0 0 0 0 0 101 37
Total 46,528 0 672 0 1,083 177 46,294 15,490 1,949 0 1,063 0 162 16,537 29,756 31,038
Investment property 694 0 0 0 0 0 694 305 22 0 0 0 0 327 367 388
Total 66,414 0 918 0 1,366 178 66,144 26,222 2,242 0 1,328 0 162 27,298 38,847 40,192

88 PVA TePla AG Annual Report 2014
Acquisition and manufacturing costs Accumulated amortization and depreciation Residual carrying values
EUR´000 Jan. 1, 2013Acquisitions
2013Additions
2013Transfers
2013Disposals
2013Exchange
differences
Balance Dec. 31,
2013Balance
Jan. 1, 2013Additions
2013Transfers
2013Disposals
2013Write-ups
2013Exchange
differences
Balance Dec. 31,
2013Dec. 31,
2013Dec. 31,
2012
Intangible assets
1. Goodwill 12,658 0 0 0 0 0 12,658 4,850 0 0 0 0 0 4,850 7,808 7,808
2. Other intangible assets 6,294 90 111 0 0 0 6,495 5,247 330 0 0 0 0 5,577 918 1,047
3. Payments in advance 0 0 40 0 0 0 40 0 0 0 0 0 0 0 40 0
Total 18,952 90 151 0 0 0 19,193 10,097 330 0 0 0 0 10,427 8,766 8,855
Property, plant and equipment
1. Land, property rights and buildings, including buildings on third party land 33,349 0 50 0 52 -3 33,344 5,599 1,016 0 0 0 -3 6,612 26,732 27,750
2. Plant and machinery 6,585 77 120 0 53 -49 6,680 3,554 440 0 46 0 -43 3,905 2,775 3,031
3. Other plant and equipment, fixtures and fittings 6,314 50 541 0 441 -3 6,462 4,642 712 0 383 0 -3 4,968 1,494 1,672
4. Advance payments and assets under construction 0 0 37 0 0 0 37 0 0 0 0 0 0 0 37 0
Total 46,248 127 748 0 546 -55 46,522 13,795 2,168 0 429 0 -49 15,485 31,038 32,453
Investment property 694 0 0 0 0 0 694 283 22 0 0 0 0 305 388 410
Total 65,893 217 899 0 546 -55 66,409 24,176 2,520 0 429 0 -49 26,217 40,192 41,718
CONSOLIDATED STATEMENT OF CHANGES IN FIXED ASSETSas at December 31, 2013

89
Gro
up F
inan
cial
Sta
tem
ents
Acquisition and manufacturing costs Accumulated amortization and depreciation Residual carrying values
EUR´000 Jan. 1, 2013Acquisitions
2013Additions
2013Transfers
2013Disposals
2013Exchange
differences
Balance Dec. 31,
2013Balance
Jan. 1, 2013Additions
2013Transfers
2013Disposals
2013Write-ups
2013Exchange
differences
Balance Dec. 31,
2013Dec. 31,
2013Dec. 31,
2012
Intangible assets
1. Goodwill 12,658 0 0 0 0 0 12,658 4,850 0 0 0 0 0 4,850 7,808 7,808
2. Other intangible assets 6,294 90 111 0 0 0 6,495 5,247 330 0 0 0 0 5,577 918 1,047
3. Payments in advance 0 0 40 0 0 0 40 0 0 0 0 0 0 0 40 0
Total 18,952 90 151 0 0 0 19,193 10,097 330 0 0 0 0 10,427 8,766 8,855
Property, plant and equipment
1. Land, property rights and buildings, including buildings on third party land 33,349 0 50 0 52 -3 33,344 5,599 1,016 0 0 0 -3 6,612 26,732 27,750
2. Plant and machinery 6,585 77 120 0 53 -49 6,680 3,554 440 0 46 0 -43 3,905 2,775 3,031
3. Other plant and equipment, fixtures and fittings 6,314 50 541 0 441 -3 6,462 4,642 712 0 383 0 -3 4,968 1,494 1,672
4. Advance payments and assets under construction 0 0 37 0 0 0 37 0 0 0 0 0 0 0 37 0
Total 46,248 127 748 0 546 -55 46,522 13,795 2,168 0 429 0 -49 15,485 31,038 32,453
Investment property 694 0 0 0 0 0 694 283 22 0 0 0 0 305 388 410
Total 65,893 217 899 0 546 -55 66,409 24,176 2,520 0 429 0 -49 26,217 40,192 41,718

90 PVA TePla AG Annual Report 2014
Responsibility Statement
„To the best of our knowledge we assure that in accordance with the applicable reporting principles, the Consolidated Financial Statements give a true and fair view of the net assets, financial position and profit or loss of the Group, and the Group Management Report - which has been combined with the Management Report of PVA TePla AG - gives a true and fair view of the development and performance of the business and the position of the Group, together with a description of the principle opportunities and risks associated with the expected development of the group.“
Wettenberg, March 17, 2015
Peter Abel Oliver Höfer Henning DöringChief Executive Officer Chief Operating Officer Chief Financial Officer

91
Gro
up F
inan
cial
Sta
tem
ents
We have audited the consolidated financial statements of PVA TePla AG, Wettenberg – comprising the balance sheet, the statement of comprehensive income, the income statement, the statement of changes in equity, the cash flow statement and the notes to the consolidated financial statements as well as the combined management and group ma-nagement report for the fiscal year from January 1 to December 31, 2014. The preparation of the consolidated financial statements and the combined management and group management report in accordance with IFRS as adopted by the EU and the additional requirements of German commercial law pursuant to section 315a (1) of the German Commercial Code (HGB) is the responsibility of the Company’s legal representatives. Our responsibility is to express an opinion on the consolidated financial statements and the combined management and group management report based on our audit.
We conducted our audit of the consolidated financial statements according to Section 317 of the German Commercial Code (HGB) and the audit principles established by the Institut der Wirtschaftsprüfer (IDW) (Institute of Auditors in Germa-ny). Those standards require that we plan and perform the audit such that misstatements materially affecting the presen-tation of the net assets, financial position and results of operations in the consolidated financial statements in accordance with the applicable financial reporting framework and in the combined management and group management report are detected with reasonable assurance. Audit procedures are established based on our knowledge of the company’s busi-ness activities, the economic and legal environment in which the group operates, and expectations regarding possible errors. The effectiveness of the accounting-related internal control system and the evidence supporting the disclosures in the consolidated financial statements and the combined management and group management report are examined primarily on a test basis within the framework of the audit. The audit includes assessing the annual financial statements of those entities included in consolidation, the determination of entities to be included in consolidation, the accounting and consolidation principles used and significant estimates made by the legal representatives, as well as evaluating the overall presentation of the annual financial statements and the combined management and group management report. In our opinion, our audit provides a sufficiently secure basis to issue an opinion.
Our audit did not result in any objections.
In our opinion, based on the findings of our audit, the consolidated financial statements comply with IFRS as adopted by the EU and the additional requirements of German commercial law pursuant to section 315a (1) of the German Commer-cial Code (HGB) and give a true and fair view of the net assets, financial position and results of operations of the Group in accordance with these requirements. The combined management and group management report is consistent with the consolidated financial statements and, as a whole, provides a suitable understanding of the Company’s position and suitably presents the opportunities and risks of futuredevelopment.
Frankfurt/Main, March 18, 2015
Ebner Stolz GmbH & Co. KGAudit Firm Tax Consulting Firm
Christian Fuchs Carl-Markus GroßAuditor Auditor
Auditor‘s Report

FINANCIAL CALENDAR IMPRINT
PVA TePla AGIm Westpark 10 – 1235435 Wettenberg GermanyPhone +49 (0) 641 / 6 86 90 - 0Fax +49 (0) 641 / 6 86 90 - 800E-Mail [email protected] www.pvatepla.com
Investor RelationsDr. Gert FisahnPhone +49 (0) 641 / 6 86 90 - 400E-Mail [email protected]
Published byPVA TePla AG
This report is available for download in English and German on the Internet at www.pvatepla.com under Investor Relations / Reports. In case of doubt the German version shall be authoritative.
Date Advise
May 8, 2015Publication of the Q1 Report
June 12, 2015Annual Sharehol-ders Meeting
Congress Center Giessen
August 14, 2015Publication of the Q2 Report
November 6, 2015Publication of the Q3 Report
November 23-25, 2015German Equity Forum Frankfurt