bdc is the only bank dedicated exclusively · shareholder—which recognizes the economic benefits...
TRANSCRIPT

BDC.CA
ANNUAL REPORT 2015
DEDICATEDEXCLUSIVELY
BDC IS THEONLY BANK
TOENTREPRENEURS
Business Developm
ent Bank of Canada
Annual Report 2015

2 Message From the Chair of the Board of Directors
4 Message From the President and CEO
7 Management’s Discussion and Analysis
47 Consolidated Financial Statements
111 Corporate Governance
126 Additional Information
CG3
inc.
| Co
mm
unic
atio
ns |
Gra
phis
me
lul3
0-20
15E
Ce
docu
men
t est
aus
si di
spon
ible
en
franç
ais.
1209
-540
0
What We AreWe are the only bank in Canada that is dedicated exclusively to entrepreneurs.
> We promote entrepreneurship, with a special focus on small and medium-sized enterprises.
What We DoWe offer services that support Canadians who are creating, managing and growing small and medium-sized businesses:
> Financing > Capital > Consulting
We offer these services to entrepreneurs in every part of Canada and every sector of the economy.
Why We Do ItWhen entrepreneurs succeed, Canadians benefi t. The choices they make and the risks they take are incredibly important to the Canadian economy. They help decide how ideas become products and services, how jobs get created, and how Canada stays prosperous. From traditional companies to high-tech start-ups, every one of them is helping create value in Canada’s economy.

BDC is the only bank dedicated exclusively to entrepreneurs.
To learn more, visit BDC.ca.
BDC AR15 | 1
Dear Minister,
I am pleased to present BDC’s annual financial report for the fiscal year ended March 31, 2015. In summary BDC has had another very successful year.
Our clients are doing well and more entrepreneurs are using our services. We now directly support more than 32,000 of them across Canada. We also support an additional 7,000 through our securitization services.
Governance at BDC is solid. We board members provide oversight, insight and foresight. Our core functions relate to stewardship, the Bank’s strategic direction and the execution of strategy. This past year, we directors played a very active role. The main issues we dealt with were the renewal of BDC’s parliamentary mandate, its future strategic direction, its delivery of shareholder priorities and risk management.
In fiscal 2015, Parliament affirmed BDC’s mandate and its important role in creating the prosperity that Canada needs. The amended BDC Act, plus BDC’s reach—100 offices, 2,000 employees and 32,000 clients across the country—position BDC to be a leader in helping make Canadian companies the most competitive in the world.
We know that to meet the challenges of scale, innovation, productivity and globalization, Canada’s companies must become more competitive. Our aspiration is to help make them the most competitive in the world. This is the context in which we determine and refine BDC’s future strategic direction, and call upon the innovation and effectiveness of BDC’s lending, investments and advice.
BDC’s purpose and reach also allow it to deliver entrepreneurship-related priorities for its sole shareholder, the Government of Canada. At the request of the shareholder—which recognizes the economic benefits that successful tech-based firms create—BDC manages the Venture Capital Action Plan (VCAP). VCAP is working. It is helping attract new private sector investors, create larger, later-stage funds, and, ultimately, increase private sector venture capital investments to create jobs and long-term growth.
BDC is striving to better serve women entrepreneurs. With this objective in mind, we have earmarked $700 million over three years to lend to women controlled businesses. We have created a team of BDC development bankers and consulting managers from across Canada who have expertise and experience in supporting women entrepreneurs.
MESSAGE FROM THE CHAIR OF THE BOARD OF DIRECTORS
BDC AR15 | 2

We’ve launched four new awards that promote and recognize entrepreneurs for mentorship, innovation, resiliency and serial entrepreneurship. These are in addition to BDC’s hallmark contest, the BDC Young Entrepreneur Award, in which entrepreneurs aged 18 to 35 are invited to present a turning point their company has reached and the solution they propose to take it to the next level.
Finally, we continue our efforts to help deliver Digital Canada 150, the shareholder’s national digital strategy. While working to ensure that entrepreneurs understand the benefits of applying information and communications technologies to their businesses, we also support companies that create these technologies.
For more information on our success in supporting BDC as it refines its risk management, please see the appropriate sections of this report’s Management’s Discussion and Analysis.
Many thanks to Rick Perkins, who left the Board of Directors after several years of dedicated service.
This year, we welcomed Claude McMaster and Robert Pitfield. Together, the directors have the sense of duty, expertise, experience and vision needed to help BDC meet whatever challenges the future has in store for Canada’s entrepreneurs.
I want to thank everyone at BDC, from my board colleagues to the management team and employees. This—another successful year—is your doing. I offer very special thanks to outgoing president and chief executive officer Jean-René Halde. He leaves an admirable legacy: a strong and vibrant organization, a healthy culture, and a team of people rallied to BDC’s purpose to support entrepreneurs. This is an absolutely terrific base from which to help Canadian companies become the most competitive in the world.
Should you or any of your colleagues in Cabinet or in Parliament desire more information about BDC, I would be pleased to provide it.
Sincerely,
Samuel L. Duboc
BDC AR15 | 3

I am pleased to present BDC’s annual financial report for the year that ended March 31, 2015.
The year was another positive one. Our 32,000 entrepreneur clients, a record number, are doing well.
In fiscal 2015, their demand for BDC’s services was strong. This demand, combined with their financial health, fuelled our profitability. Indeed, we did better than anticipated; their financial health resulted in a lower-than-expected provision for credit losses. Fiscal 2015 was also notable in that it saw us invest more resources into non-financial support for entrepreneurs.
Specifically, BDC made a profit of $490.7 million. This shows that entrepreneurs judge our services to be relevant and valuable, and that we are efficient. This year’s results will permit a $62.9 million dividend payment to our sole shareholder, the Government of Canada.
Overall, I am very pleased with BDC’s performance in helping entrepreneurs and invite you to peruse the strategic performance measures on pages 10-15.
We offer loans, equity and advisory services for a broad spectrum of needs: from people who are creating a new business or launching a particular business project, to entrepreneurs who are leading their company’s efforts to tackle the big, persistent competitive challenges of scale, innovation, productivity and globalization.
We’re helping businesses of all sizes. I am proud to report that once again this year, we made more small loans and more loans to small businesses than ever before. Yet we also do larger loans to larger companies, as well as large syndicated loans. These loans range from fully secured to completely unsecured, covering the breadth of the risk/reward spectrum.
We help entrepreneurs at every stage of their company’s development: start-ups, high-growth firms and mature later-stage companies, as well as entrepreneurs who want to pass their business successfully into the hands of new owners. This year, to address the full spectrum of risk capital, we brought together the two BDC teams responsible for venture capital and growth and transition capital, creating BDC Capital. This new team is better positioned to serve entrepreneurs who require equity-type investments. It focuses on entrepreneurs’ needs: working capital for growth, transition capital and capital for acquisitions. BDC now exceeds $1 billion in venture capital commitments, and fiscal 2015 was profitable.
Because we know that business success takes expertise and advice as well as money, we continue to transform our consulting service, adding to its capacity for long-term impact. We hired more people—experienced, knowledgeable and business-savvy people—and improved processes and work practices. We also developed 14 standardized methodologies that serve as the basis of specific consulting services, notably those to help entrepreneurs increase their firms’ operational efficiency, integrate technology into their business models and activities, and globalize.
MESSAGE FROM THE PRESIDENT AND CEO We now support
32,000 entrepreneurs across Canada.
BDC AR15 | 4

Because we need to attract and keep the best, right people to serve entrepreneurs, we were gratified to be named—for the ninth consecutive year—one of Canada’s Top 100 Employers. And, given Canada’s diverse population, we were also gratified to be named one of Canada’s best diversity employers for the sixth time.
We offer entrepreneurs useful and free information, too. For example, our new online book—Buying an ERP system: How to avoid common pitfalls and maximize your ROI gives Canadian businesses our best tips for selecting the right software.
This is the last time I will present the annual financial report as president and chief executive officer of BDC. I am very proud of how its focus and high performance are serving Canada’s entrepreneurs. I am also very confident that it is solid and sophisticated enough to find new, innovative ways to help entrepreneurs tackle whatever competitive challenges and opportunities they will face in the future.
I have no doubt BDC will continue to serve Canadians well. Its purpose of helping entrepreneurs—which Parliament reaffirmed in 2014—is precise. Its authorities are appropriate and allow it to be nimble. Its organizational culture encourages flexibility and innovation.
The people who work here are extraordinarily capable, dedicated and well managed. They are motivated by the powerful sense of accomplishment that comes with being part of an organization that is making a meaningful, necessary contribution to society—that is, supporting the people who help create the prosperity Canada needs. I am very confident they will keep succeeding.
After 10 years, there are many people to thank. To our clients, let me say that I and everyone at BDC are proud to have won your trust and served you. To employees across Canada: Thank you for the countless ways in which, every day, you serve BDC’s clients. To my management colleagues: Thank you for the invaluable support you have given me over the past 10 years. And finally, to our board members and especially our chair, Sam Duboc: Thank you for your dedication, effort and ambitions for BDC.
Sincerely,
Jean-René Halde
BDC AR15 | 5

BDC AR15 | 6
Management’s Discussion and Analysis
1. The Canadian Economic Environment 92. Performance Measures 103. Analysis of Financial Results 174. Risk Management 375. Accounting and Control Matters 45
BDC AR15 | 7

In fiscal 2015, Canada’s economic environment was characterized by:
• moderate economic growth
• historically low interest rates
• weak business investment
BDC AR15 | 8

The pace of Canadian economic growth accelerated in 2014. Real GDP increased 2.5% following a 2.0% expansion the previous year.
Household spending rose a solid 2.8% and households continued to add debt. Low interest rates stimulated consumption and residential construction, which also grew 2.8%. The labour market recorded a net gain of 121,300 jobs, and the unemployment rate fell slightly to 6.7% at the end of the year.
For the fourth year in a row, the public sector did not contribute to economic growth in 2014. After supporting the economy during the recession, governments are now focusing on balancing their budgets.
Plummeting oil prices in the second half of the year began to impact the economies of certain regions of Canada in 2014, but the effects are expected to be broader in 2015. Nonetheless, the decline triggered the depreciation of the Canadian dollar, helping exports grow 5.4%, their biggest advance since 2010. The firming of the U.S. economy also contributed to this advance.
Mining and oil and gas extraction recorded the strongest growth in 2014 (6.4%). Transportation and warehousing, wholesaling and retailing, and finance and insurance also performed well, with output volume growing over 3.0%. Manufacturing, which saw output slip in 2013, rebounded in 2014, benefitting from a recovery in U.S. demand and the depreciation of the Canadian dollar.
Growth in non-residential investment by businesses, which had been rather weak in 2013 (2.2%), was anemic in 2014, rising only 0.2%. Investments in non-residential buildings fell 0.1%, while investments in machinery and equipment only inched up 0.7%.
Credit conditions remained very favourable in 2014, with interest rates still at historic lows. Credit granted to businesses by chartered banks was up 9.7% from the previous year.
In summary, Canadian economic activity improved in 2014. The strength of the U.S. economy and a more favourable exchange rate stimulated exports. The mining, gas and oil extraction sector recorded robust growth and manufacturing output rebounded. Unfortunately, non-residential investment by businesses did not increase despite still-attractive credit conditions.
1. The Canadian Economic Environment
BDC AR15 | 9
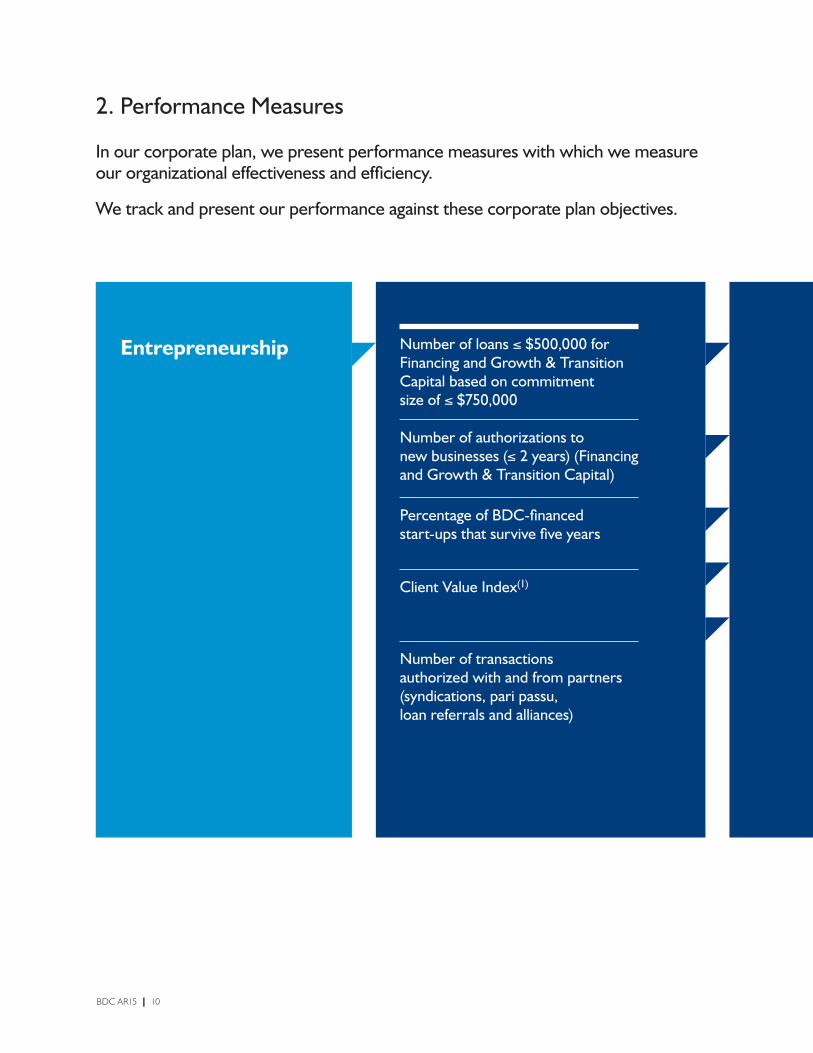
In our corporate plan, we present performance measures with which we measure our organizational effectiveness and efficiency.
We track and present our performance against these corporate plan objectives.
2. Performance Measures
Entrepreneurship Number of loans ≤ $500,000 for Financing and Growth & Transition Capital based on commitment size of ≤ $750,000
Number of authorizations to new businesses (≤ 2 years) (Financing and Growth & Transition Capital)
Percentage of BDC-financed start-ups that survive five years
Client Value Index(1)
Number of transactions authorized with and from partners (syndications, pari passu, loan referrals and alliances)
BDC AR15 | 10

Management’s Discussion and Analysis | Performance Measures
TARGET F2015 ACTUAL F2015
8,000 8,781 This result reflects BDC’s efforts to help small businesses and ensure their financing needs are met.
1,500 1,935 BDC supports new businesses because they are a critical part of a healthy entrepreneurial ecosystem.
65% 60% Today’s start-ups can be tomorrow’s champions; half of Canadian start-ups are still in business after five years. BDC helps ensure they succeed.
118 114 BDC continues to work to ensure clients receive efficient, professional and tailored support that meets their needs.
2,400 2,809 To reach more entrepreneurs, BDC is strengthening its efforts to work with private sector financial institutions and other partners.
BDC strives to measure its impact on Canadian entrepreneurs. As a result, its performance measures continue to evolve to properly capture public policy impacts.
(1) Starting in F2016, we will cease using this Index and replace it with a simpler indicator that measures our success using a barometer of “very satisfied” clients.
BDC AR15 | 11

Management’s Discussion and Analysis | Performance Measures
Growth We track the percentage of high-growth firms in our Growth & Transition Capital portfolio. (High-growth firms are defined as having annualized sales growth greater than 20% per year over a three-year period.)
Productivity We track the number of loans that we authorize that entrepreneurs use to purchase equipment for their businesses (Equipment Line and loans with “equipment purchase” as purpose).
BDC AR15 | 12
Management’s Discussion and Analysis | Performance Measures
TARGET F2015 ACTUAL F2015
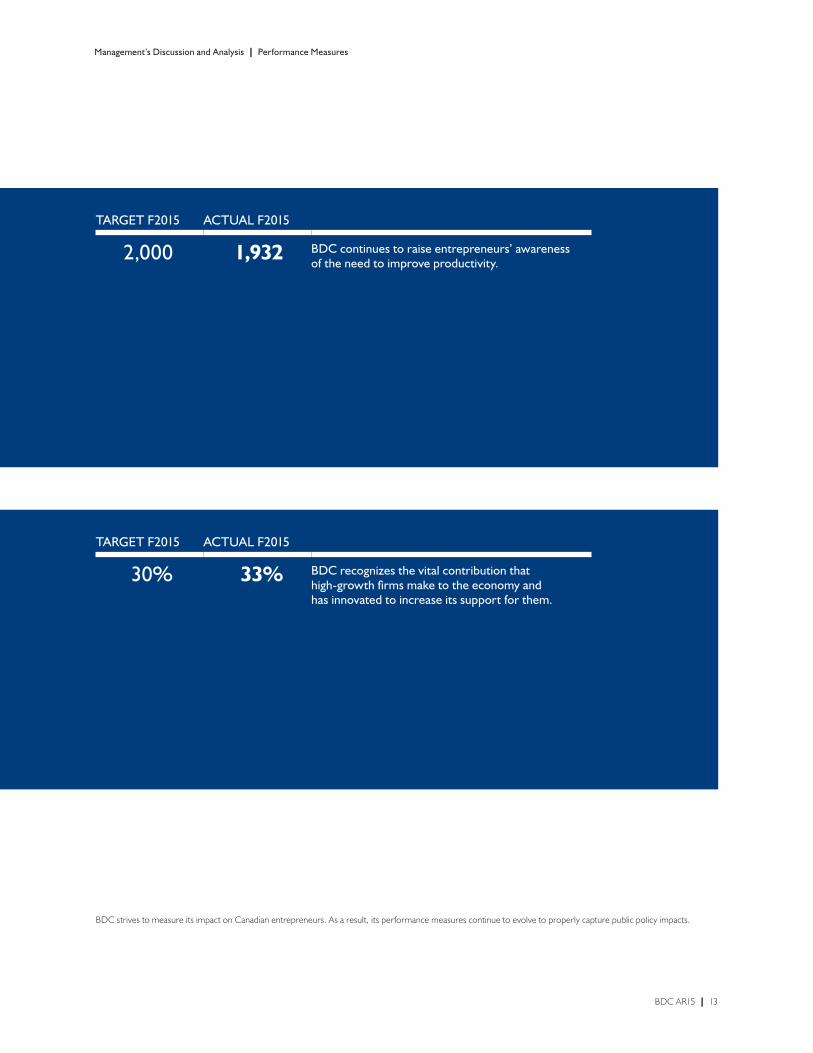
2,000 1,932 BDC continues to raise entrepreneurs’ awareness of the need to improve productivity.
TARGET F2015 ACTUAL F2015
30% 33% BDC recognizes the vital contribution that high-growth firms make to the economy and has innovated to increase its support for them.
BDC strives to measure its impact on Canadian entrepreneurs. As a result, its performance measures continue to evolve to properly capture public policy impacts.
BDC AR15 | 13
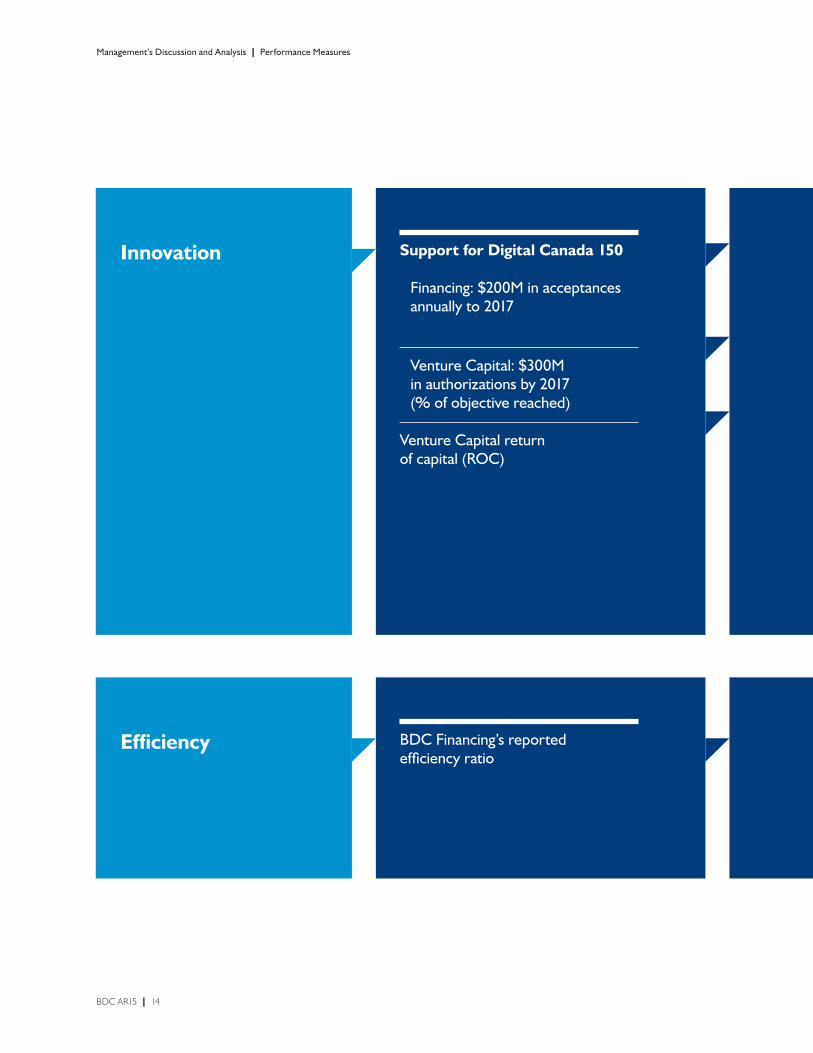
Efficiency BDC Financing’s reported efficiency ratio
Management’s Discussion and Analysis | Performance Measures
Innovation Support for Digital Canada 150
Financing: $200M in acceptances annually to 2017
Venture Capital: $300M in authorizations by 2017 (% of objective reached)
Venture Capital return of capital (ROC)
BDC AR15 | 14

Management’s Discussion and Analysis | Performance Measures
TARGET F2015 ACTUAL F2015
n/a $276.9M BDC works to ensure entrepreneurs understand the business benefits of information and communication technologies (ICT). It also supports companies that create ICT.
n/a 44% We allotted three years to authorize $300 million. We achieved 44% of this target in year one.
1.00 1.03 To attract private sector investors to the venture capital market, BDC has worked hard to demonstrate profitability in its VC operations.
TARGET F2015 ACTUAL F2015
39.7% 38.6% BDC’s efforts to make its operations more efficient have improved this ratio.
Note: A decrease represents improved productivity.
BDC strives to measure its impact on Canadian entrepreneurs. As a result, its performance measures continue to evolve to properly capture public policy impacts.
BDC AR15 | 15

Our support for entrepreneurs is financially sustainable.
BDC AR15 | 16
LINES OF BUSINESSBDC reports on six business lines: Financing, Growth & Transition Capital, Venture Capital, Consulting, Securitization and Venture Capital Action Plan (VCAP).
OPERATIONAL CONTEXT IN WHICH TO EXAMINE BDC’S FINANCIAL RESULTSIn 2014, the global economy recorded modest growth of 3.4%, just as in the previous year. The accelerated growth in all of the advanced countries was cancelled out by a global slowdown in the developing economies.
The economy of the United States strengthened considerably in 2014. Consumption, the main driver of growth, benefitted from the solid performance of the labour market: An average of 260,000 jobs per month were created in the United States, and the unemployment rate fell to 5.6% at the end of the year, closer to its pre-recession level of 4.6%. Consumption was also stimulated by rising incomes, lower oil prices and renewed consumer confidence.
In the euro zone, the recovery ran out of steam during the year. The unemployment rate remained high, and consumer and business confidence deteriorated. Even though the negative impact of the budget austerity measures abated, the state of public finances in many of the zone’s member countries remains a subject of concern. In Japan, economic growth was zero in 2014 due to flagging consumption following the hike in the value-added tax in April and to a decline in residential investment.
Growth slowed in all of the developing countries, but the outcomes differed from one country to another. Although the Chinese economy was still robust, it weakened in the second half of the year due to a correction in the real estate market. Conversely, growth accelerated in India in 2014. This country, which is a large oil importer, greatly benefitted from the slump in oil prices. However, that slump played against the oil-exporting countries, in particular Russia and Brazil.
Canada managed to hold its own in this global economic context. Its growth rose compared with the previous year. The economy benefitted from the strengthening of the U.S. economy, as may be seen from the upturn in factory shipments and the strength of exports bound for the United States in 2014. Furthermore, the oil price slump—which should curb economic growth in 2015—did not have any major negative impact on the Canadian economy in 2014. On the contrary, some sectors of the Canadian economy benefitted from the depreciation of the Canadian dollar that ensued.
The only cloud in the sky lies in non-residential business investment growth, which proved to be anemic in 2014 despite credit conditions that were still very favourable. As the population ages, Canada will increasingly have to rely on improved productivity to support its economic growth. Consequently, it is highly desirable that Canadian businesses invest more, particularly in machinery and equipment.
ACTIVITIESBDC plays an important role in helping Canadian small and medium-sized enterprises (SMEs) to become more competitive, innovate, increase their efficiency and explore new markets, at home and abroad. As a complementary long-term lender and investor that takes higher risks and offers greater flexibility, BDC works to ensure that SMEs have the opportunity to grow and succeed.
Financing plays a key role in fulfilling this mandate. Clients of Financing accepted a total of $4.7 billion in loans during the year, compared to $4.1 billion last year. Growth & Transition Capital continued to support the growth plans of Canadian entrepreneurs through its diverse product offering, with clients accepting a total of $231.5 million in financing this year, compared to $186.6 million last year. To support innovative Canadian companies and create the conditions for success in the venture capital ecosystem, Venture Capital authorized investments totalling $185.4 million, compared to $154.8 million last year. During the year, BDC continued the deployment of the Venture Capital Action Plan and authorized $114.8 million in investments. In late fiscal 2014, Consulting began operating under a new structure designed to better help SMEs improve their competitiveness by accelerating growth, improving productivity and building organizational capabilities. The first set of changes under the business transformation plan was launched during the first quarter of fiscal 2015 and therefore, as anticipated, consulting revenues, at $17.0 million, were lower than the $21.7 million recorded last year. BDC also remains active in the securitization market, where SMEs access financing for the vehicles and equipment they need to improve productivity. At March 31, 2015, total asset-backed securities (ABS) stood at $407.7 million with total disbursements of $210.7 million for the year.
BDC continued to focus on small loans, while also supporting the growth of medium-sized firms and participating in financial transactions with other financial institutions. During fiscal 2015, based on commitment size of $750,000 or less, 8,781 clients of Financing and Growth & Transition Capital accepted loans of $500,000 or less for a total of $879.5 million, compared to 8,011 clients and $775.0 million last year.
3. Analysis of Financial Results
BDC AR15 | 17

FINANCIAL RESULTS OVERVIEWFor the analysis of financial results, please also refer to Note 25—Segmented Information to the Consolidated Financial Statements.
CONSOLIDATED NET INCOMEBDC reported consolidated net income of $490.7 million this year, compared to $432.6 million in fiscal 2014. Net income attributable to BDC’s shareholder amounted to $490.5 million this year and $426.0 million in fiscal 2014, while that attributable to non-controlling interests amounted to $0.2 million in fiscal 2015 and $6.6 million in fiscal 2014. Non-controlling interests relate only to Growth & Transition Capital and Venture Capital operations.
Consolidated net income was generated mostly by Financing. Fiscal 2015’s increase in net income was mostly due to a higher net interest income as a result of the increase in the loans portfolio, a higher net change in unrealized appreciation of investments and higher net unrealized foreign exchange gains on investments.
Net income from Financing was $453.4 million, an increase of $19.6 million from last year. The increase in profitability was mainly due to higher net interest income, partially offset by higher provision for credit losses compared to fiscal 2014.
Net income from Growth & Transition Capital was $38.5 million, $15.2 million higher than last year. The increase was due mainly to a higher net change in unrealized appreciation of investments.
Venture Capital recorded $23.3 million in net income for the year, compared to a $12.0 million net loss recorded last year. The increase in net income this year was mostly attributable to a higher net change in unrealized appreciation of investments and to higher net unrealized foreign exchange gains on investments.
Consolidated Net Income—by Business Segmentfor the years ended March 31 ($ in millions)
2015 2014 2013 2012 2011
Financing 453.4 433.8 433.1 504.7 305.6 Growth & Transition Capital 38.5 23.3 34.7 36.2 20.4 Venture Capital 23.3 (12.0) (8.6) (42.7) (20.8)Consulting (24.2) (16.9) (12.4) (11.0) (8.9)Securitization 4.0 5.8 11.4 46.2 70.2 Venture Capital Action Plan (4.3) (1.4) – – – Net income 490.7 432.6 458.2 533.4 366.5
Net income attributable to:BDC's shareholder 490.5 426.0 454.7 520.3 360.3 Non-controlling interests 0.2 6.6 3.5 13.1 6.2 Net income 490.7 432.6 458.2 533.4 366.5
Management’s Discussion and Analysis | Analysis of Financial Results
BDC AR15 | 18
Consulting reported a net loss of $24.2 million, compared to a net loss of $16.9 million last year. As part of the transformation program, BDC has refined its approach and has improved client offerings. As a result, consulting revenues are expected to be lower during this transition period.
Net income from Securitization was $4.0 million, $1.8 million lower than last year, due to lower net interest and fee income as a result of a decrease in yields. However, the Funding Platform for Independent Lenders (F-PIL) continues to grow, with the principal amount increasing from $333.9 million to $403.4 million over the year, making a larger contribution to net income.
Venture Capital Action Plan recorded a net loss of $4.3 million, compared to a net loss of $1.4 million last year, mainly due to a net change in unrealized depreciation of investments.
Net income attributable to non-controlling interests was $0.2 million in fiscal 2015 ($2.2 million in net income from Growth & Transition Capital and $2.0 million in net loss from Venture Capital), and $6.6 million in fiscal 2014 ($7.3 million in net income from Growth & Transition Capital and $0.7 million in net loss from Venture Capital).
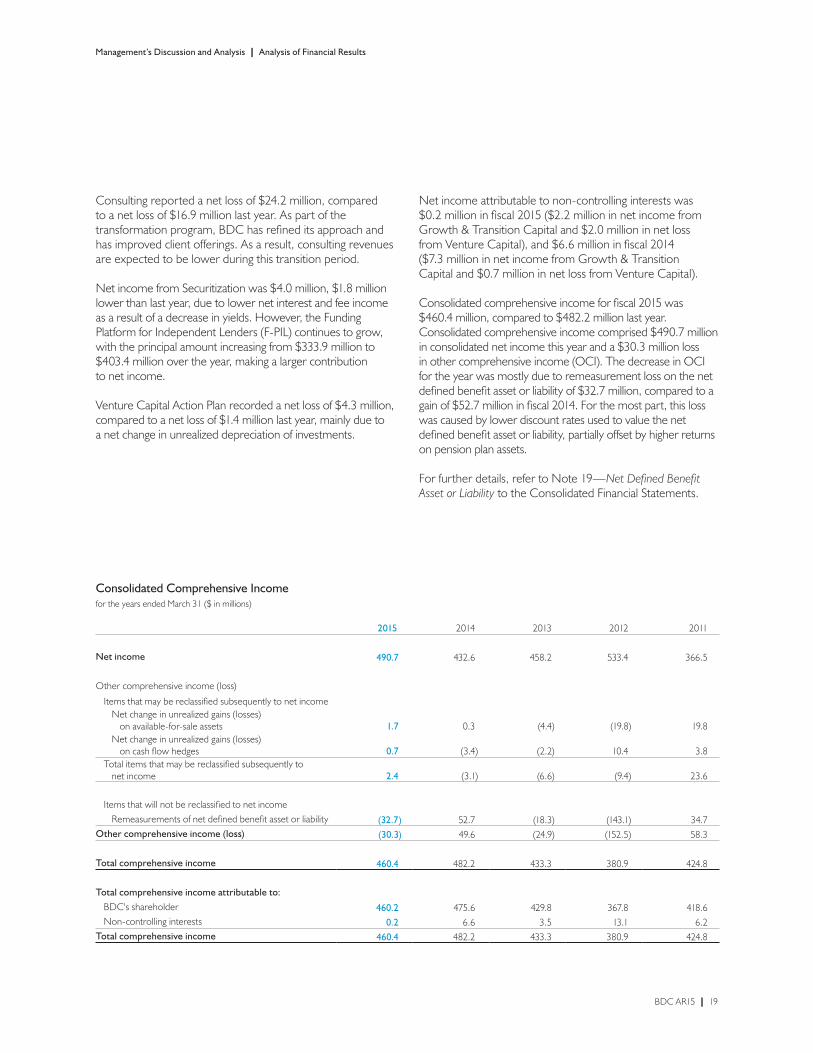
Consolidated comprehensive income for fiscal 2015 was $460.4 million, compared to $482.2 million last year. Consolidated comprehensive income comprised $490.7 million in consolidated net income this year and a $30.3 million loss in other comprehensive income (OCI). The decrease in OCI for the year was mostly due to remeasurement loss on the net defined benefit asset or liability of $32.7 million, compared to a gain of $52.7 million in fiscal 2014. For the most part, this loss was caused by lower discount rates used to value the net defined benefit asset or liability, partially offset by higher returns on pension plan assets.
For further details, refer to Note 19—Net Defined Benefit Asset or Liability to the Consolidated Financial Statements.
Consolidated Comprehensive Incomefor the years ended March 31 ($ in millions)
2015 2014 2013 2012 2011
Net income 490.7 432.6 458.2 533.4 366.5
Other comprehensive income (loss)
Items that may be reclassified subsequently to net income Net change in unrealized gains (losses) on available-for-sale assets 1.7 0.3 (4.4) (19.8) 19.8 Net change in unrealized gains (losses) on cash flow hedges 0.7 (3.4) (2.2) 10.4 3.8 Total items that may be reclassified subsequently to net income 2.4 (3.1) (6.6) (9.4) 23.6
Items that will not be reclassified to net income Remeasurements of net defined benefit asset or liability (32.7) 52.7 (18.3) (143.1) 34.7 Other comprehensive income (loss) (30.3) 49.6 (24.9) (152.5) 58.3
Total comprehensive income 460.4 482.2 433.3 380.9 424.8
Total comprehensive income attributable to: BDC's shareholder 460.2 475.6 429.8 367.8 418.6 Non-controlling interests 0.2 6.6 3.5 13.1 6.2 Total comprehensive income 460.4 482.2 433.3 380.9 424.8
Management’s Discussion and Analysis | Analysis of Financial Results
BDC AR15 | 19

PERFORMANCE AGAINST OBJECTIVESThe consolidated net income of $490.7 million was $172.4 million more than the corporate plan objective. Most of the variance is attributable to Financing, which recorded a net income of $453.4 million, $79.1 million higher than the corporate plan objective, primarily due to the lower-than-anticipated provision for credit losses on loans. Growth & Transition Capital’s net income of $38.5 million was $16.1 million higher than the corporate plan objective, mainly due to a lower-than-anticipated net change in unrealized depreciation of investments. Venture Capital’s net income of $23.3 million was $63.2 million better than the corporate plan objective, mainly because of a higher-than-anticipated net change in unrealized appreciation of investments and higher-than-anticipated net unrealized foreign exchange gains on investments. Consulting’s net loss of $24.2 million was $0.8 million better than expected, mainly as a result of lower-than-anticipated operating and administrative expenses. Securitization’s net income of $4.0 million was $2.2 million lower than expected, mostly due to lower net interest income. Venture Capital Action Plan’s net loss of $4.3 million was $15.5 million lower than expected, mostly due to the lower-than-anticipated net change in unrealized depreciation of investments.
FINANCINGFinancing offers entrepreneurs secured and unsecured term loans and specialized services tailored to support them as they create and grow their firms; develop and expand their markets; invest in intangible assets, such as information technology; buy equipment to increase productivity; or transfer their companies to a new generation of owners.
FINANCING PORTFOLIOFinancing’s loan portfolio, before allowance for credit losses, rose by 6.8% from $17.7 billion a year ago to $18.9 billion as at March 31, 2015, an increase of $1.2 billion. The closing portfolio comprised of $18.4 billion in performing loans and $0.5 billion in impaired loans. As at March 31, 2015, 79.1% of the performing portfolio was composed of floating-rate loans, higher than the fiscal 2014 level of 78.2%.
Financing Performing Portfolioas at March 31 ($ in millions)
21,000
18,000
15,000
12,000
9,000
6,000
3,000
00
3000
6000
9000
12000
15000
18000
21000
2011 2012 2013 2014 2015
n Fixed-rate performing portfolio 2,706 2,843 3,482 3,760 3,852
n Floating-rate performing portfolio 11,214 11,955 12,436 13,513 14,601
nnTotal performing portfolio 13,920 14,798 15,918 17,273 18,453
Total Financing portfolio 14,506 15,349 16,410 17,749 18,941
Management’s Discussion and Analysis | Analysis of Financial Results
BDC AR15 | 20

NET INTEREST AND FEE INCOMENet interest and fee income reflects interest income and fees less interest expense on borrowings. Net interest and fee income reached $900.0 million in fiscal 2015, compared to $845.2 million in fiscal 2014. The increase of $54.8 million was mainly the result of continued growth in the portfolio. The net interest and fee income margin, the ratio of net interest and fee income over the average loan portfolio, remained at the same level as last year.
Financing Net Interest and Fee Incomefor the years ended March 31 ($ in millions)
1,050
900
750
600
450
300
150
0
6%
5%
4%
3%
2%
1%
0%0
150
300
450
600
750
900
1050
0
1
2
3
4
5
6
2011 2012 2013 2014 2015
n Net interest and fee income 736.4 779.5 796.7 845.2 900.0
As a % of average loan portfolio5.25% 5.23% 5.01% 4.91% 4.90%
PROVISION FOR CREDIT LOSSESThe provision for credit losses is the amount charged to income to bring the total allowance for credit losses, including individual and collective allowances, to a level that represents management’s best estimate of losses incurred in the loan portfolio at the statement of financial position date. In fiscal 2015, Financing recorded a provision for credit losses of $95.9 million.
Provision for Credit Losses on Loansfor the years ended March 31 ($ in millions)
300
250
200
150
100
50
0
(50)
(100)
(150)
3.0%
2.5%
2.0%
1.5%
1.0%
0.5%
0.0%
(0.5)%
(1.0)%-150
-100
-50
0
50
100
150
200
250
300
-1.0
-0.5
0.0
0.5
1.0
1.5
2.0
2.5
3.0
2011 2012 2013 2014 2015
n Individual104.0 86.3 69.1 82.9 85.9
n Collective – (124.5) (50.0) (10.0) 10.0
nnProvision for credit losses on loans104.0 (38.2) 19.1 72.9 95.9
As a % of average loan portfolio0.7% (0.3%) 0.1% 0.4% 0.5%
Management’s Discussion and Analysis | Analysis of Financial Results
BDC AR15 | 21

A significant factor influencing the individual allowance is the level of loans that were downgraded from performing to impaired status. When financial conditions deteriorate, more loans default. When they default, we classify them as impaired and record an amount equal to the net exposure as individual allowance. The rate of these downgrades remained at 2.3% of the performing opening portfolio in 2015. Despite the increase in the provision for credit losses, the level of losses remained low at 0.5% of the average loan portfolio. The loan portfolio continued to perform better than our expected loss rate at origination.
BDC closely manages the $490.6 million in impaired loans, which increased by $14.7 million in fiscal 2015, and the watch list portfolio, which amounted to $724.6 million in fiscal 2015. The work performed to help entrepreneurs through difficult situations partly explains our low level of credit losses. Impaired loans represented 2.6% of the total portfolio on March 31, 2015, down from 2.7% on March 31, 2014.
BDC maintains the allowance for credit losses at a level judged adequate to absorb the credit losses in the portfolio. This allowance comprises the individual allowance and the collective allowance. Management determines the individual allowance by identifying and determining losses related to individual impaired loans. It determines the collective allowance by assessing impairments in the existing performing loan portfolio that are not yet identified.
Impaired Portfolio as at March 31 ($ in millions)
720
600
480
360
240
120
0
5%
4%
3%
2%
1%
0%0
120
240
360
480
600
720
2011 2012 2013 2014 2015
n Impaired portfolio 586.2 550.8 491.8 475.9 490.6
Impaired portfolio as a % of total loan portfolio4.0% 3.6% 3.0% 2.7% 2.6%
For the first time since fiscal 2011, both the individual and collective allowances for credit losses have increased, reaching a total of $529.9 million on March 31, 2015, compared to $508.3 million in fiscal 2014. However, the total allowance represented 2.8% of the total loans outstanding, slightly lower than the 2.9% recorded last year. The collective allowance was increased by $10.0 million during the fourth quarter of fiscal 2015 to reflect the growth of the portfolio, as well as the uncertainty resulting from the drop in oil prices.
BDC finances creditworthy projects that are, on average, riskier than the ones the private sector typically accepts. In the event of an economic slowdown, BDC stands ready to increase its response, if required.
To read more about credit risk management, please refer to Note 23—Risk Management to the Consolidated Financial Statements.
Management’s Discussion and Analysis | Analysis of Financial Results
BDC AR15 | 22
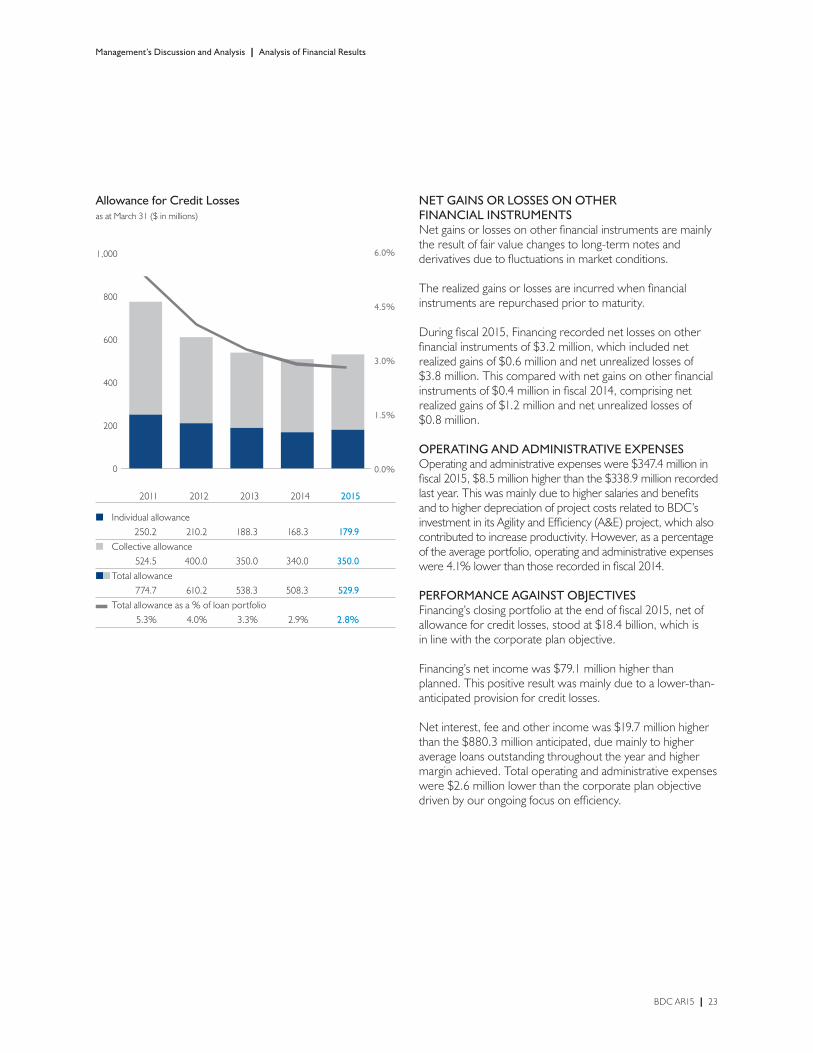
Allowance for Credit Losses as at March 31 ($ in millions)
1,000
800
600
400
200
00
200
400
600
800
1000
0.0
1.5
3.0
4.5
6.0
2011 2012 2013 2014 2015
n Individual allowance 250.2 210.2 188.3 168.3 179.9
n Collective allowance 524.5 400.0 350.0 340.0 350.0
nnTotal allowance 774.7 610.2 538.3 508.3 529.9
Total allowance as a % of loan portfolio5.3% 4.0% 3.3% 2.9% 2.8%
6.0%
4.5%
3.0%
1.5%
0.0%
NET GAINS OR LOSSES ON OTHER FINANCIAL INSTRUMENTSNet gains or losses on other financial instruments are mainly the result of fair value changes to long-term notes and derivatives due to fluctuations in market conditions.
The realized gains or losses are incurred when financial instruments are repurchased prior to maturity.
During fiscal 2015, Financing recorded net losses on other financial instruments of $3.2 million, which included net realized gains of $0.6 million and net unrealized losses of $3.8 million. This compared with net gains on other financial instruments of $0.4 million in fiscal 2014, comprising net realized gains of $1.2 million and net unrealized losses of $0.8 million.
OPERATING AND ADMINISTRATIVE EXPENSESOperating and administrative expenses were $347.4 million in fiscal 2015, $8.5 million higher than the $338.9 million recorded last year. This was mainly due to higher salaries and benefits and to higher depreciation of project costs related to BDC’s investment in its Agility and Efficiency (A&E) project, which also contributed to increase productivity. However, as a percentage of the average portfolio, operating and administrative expenses were 4.1% lower than those recorded in fiscal 2014.
PERFORMANCE AGAINST OBJECTIVESFinancing’s closing portfolio at the end of fiscal 2015, net of allowance for credit losses, stood at $18.4 billion, which is in line with the corporate plan objective.
Financing’s net income was $79.1 million higher than planned. This positive result was mainly due to a lower-than-anticipated provision for credit losses.
Net interest, fee and other income was $19.7 million higher than the $880.3 million anticipated, due mainly to higher average loans outstanding throughout the year and higher margin achieved. Total operating and administrative expenses were $2.6 million lower than the corporate plan objective driven by our ongoing focus on efficiency.
Management’s Discussion and Analysis | Analysis of Financial Results
BDC AR15 | 23
Management’s Discussion and Analysis | Analysis of Financial Results
GROWTH & TRANSITION CAPITALGrowth & Transition Capital supports high-potential, growth-oriented firms by providing flexible debt, with or without convertible features, and equity-type financing for entrepreneurs. It offers tailored solutions to help firms that are past the start-up phase and need money to sustain growth. It takes more risks by accepting less security and financing intangibles, which is important as the Canadian economy becomes more knowledge based, and entrepreneurs finance ideas and concepts rather than bricks and mortar. In addition, Growth & Transition Capital helps Canadian firms transition from one owner to the next.
Since fiscal 2004, Growth & Transition Capital activity has taken place via joint ventures with the Caisse de dépôt et placement du Québec (the Caisse), starting with a $300 million (BDC: $150 million) commitment with AlterInvest Fund L.P. This was followed by a $330 million (BDC: $165 million) commitment with AlterInvest II Fund L.P. BDC acts as the general partner of these funds and receives management fees. In November 2009, AlterInvest II Fund L.P. reached its authorized capacity and BDC began to fully fund new subordinate financing transactions through its wholly owned investment subsidiary, BDC Capital Inc.
By the end of fiscal 2014, AlterInvest Fund L.P. had completed the liquidation of all of its investments. Those investments that were not reimbursed were transferred into AlterInvest II Fund L.P. at fair value. Since the partners of both AlterInvest Fund L.P. and AlterInvest II Fund L.P. are the same, there was no change in ownership interest as a result of these transactions.
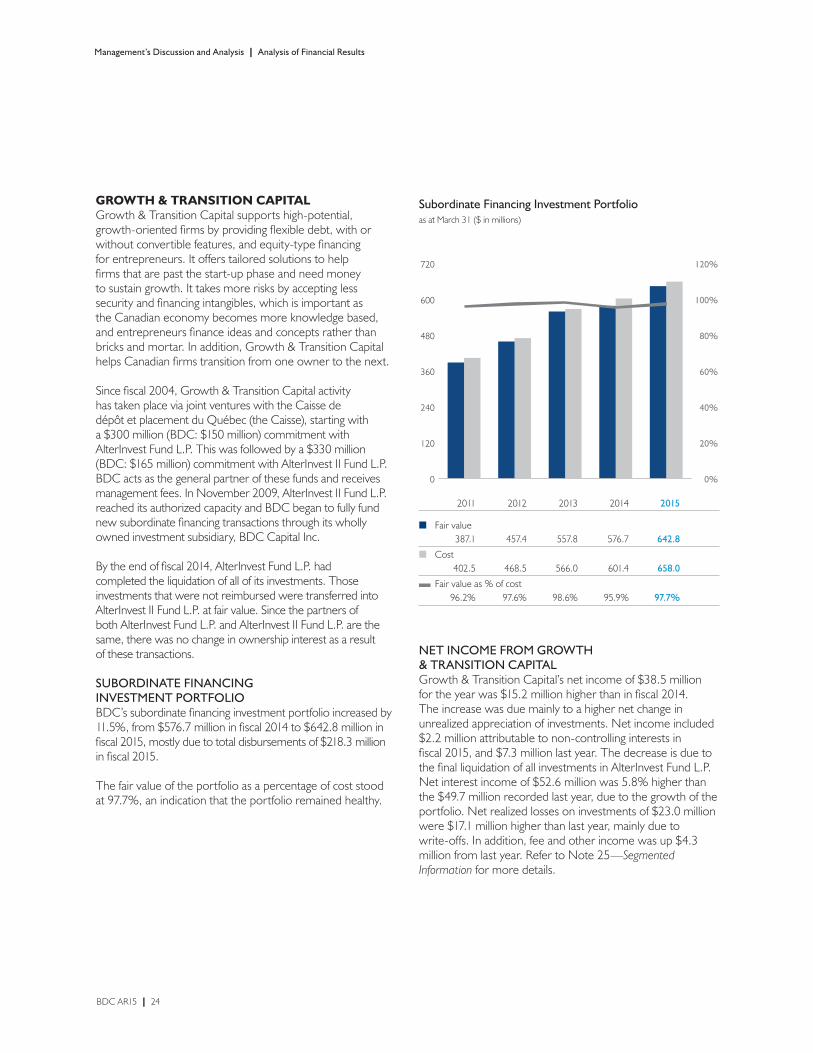
SUBORDINATE FINANCING INVESTMENT PORTFOLIOBDC’s subordinate financing investment portfolio increased by 11.5%, from $576.7 million in fiscal 2014 to $642.8 million in fiscal 2015, mostly due to total disbursements of $218.3 million in fiscal 2015.
The fair value of the portfolio as a percentage of cost stood at 97.7%, an indication that the portfolio remained healthy.
Subordinate Financing Investment Portfolioas at March 31 ($ in millions)
720
600
480
360
240
120
0
120%
100%
80%
60%
40%
20%
0%0
120
240
360
480
600
720
0
20
40
60
80
100
120
2011 2012 2013 2014 2015
n Fair value387.1 457.4 557.8 576.7 642.8
n Cost402.5 468.5 566.0 601.4 658.0
Fair value as % of cost96.2% 97.6% 98.6% 95.9% 97.7%
NET INCOME FROM GROWTH & TRANSITION CAPITALGrowth & Transition Capital’s net income of $38.5 million for the year was $15.2 million higher than in fiscal 2014. The increase was due mainly to a higher net change in unrealized appreciation of investments. Net income included $2.2 million attributable to non-controlling interests in fiscal 2015, and $7.3 million last year. The decrease is due to the final liquidation of all investments in AlterInvest Fund L.P. Net interest income of $52.6 million was 5.8% higher than the $49.7 million recorded last year, due to the growth of the portfolio. Net realized losses on investments of $23.0 million were $17.1 million higher than last year, mainly due to write-offs. In addition, fee and other income was up $4.3 million from last year. Refer to Note 25—Segmented Information for more details.
BDC AR15 | 24
Management’s Discussion and Analysis | Analysis of Financial Results
In fiscal 2015, Growth & Transition Capital recorded a net change in unrealized appreciation of investments of $9.5 million, a $26.1 million higher appreciation than the $16.6 million net change in unrealized depreciation recorded last year. The net change in unrealized appreciation of investments included:
> a $8.5 million net fair value depreciation of the portfolio ($16.7 million depreciation in 2014); and
> a reversal of net fair value depreciation due to realized losses totalling $18.0 million (a reversal of net fair value depreciation due to net realized losses of $0.1 million in 2014).
Operating and administrative expenses increased by $0.9 million from last year. Even with the growth in the portfolio, operating and administrative expenses as a percentage of the average portfolio outstanding have decreased from 4.6% to 4.5%, as BDC continues to find operational efficiencies, resulting in part from the Agility and Efficiency (A&E) project.
PERFORMANCE AGAINST OBJECTIVESNet income from Growth & Transition Capital of $38.5 million in fiscal 2015 was higher than the corporate plan objective of $22.4 million, as BDC continues to contribute to the success of entrepreneurs as it takes on more risks. This difference was mainly due to a lower-than-anticipated net change in unrealized depreciation of investments.
VENTURE CAPITALVenture Capital is a major investor in Canada, active at every stage of a firm’s development cycle, from seed through expansion. As the environment for venture capital (VC) remains challenging, Venture Capital’s objective is to help return the VC industry to health, where potential for profitability attracts private sector investors. To achieve this, it is investing in innovative, technology-driven Canadian companies directly; investing indirectly through external private sector venture funds; and undertaking strategic initiatives and making targeted investments.
In its direct investing activities, BDC focuses on innovative, technology-based companies that have high growth potential, offer unique products or services, and are positioned to become dominant players in their markets. Venture Capital invests primarily in companies involved in the areas of industrial/clean/energy-tech, health care and information technology sectors.
To help rebuild and re-energize the VC ecosystem, we created the Strategic Investments and Partnerships (SIP) team. It is developing innovative initiatives to reinforce key areas of the VC ecosystem and is making investments in specialized funds, accelerators and graduates of accelerators.
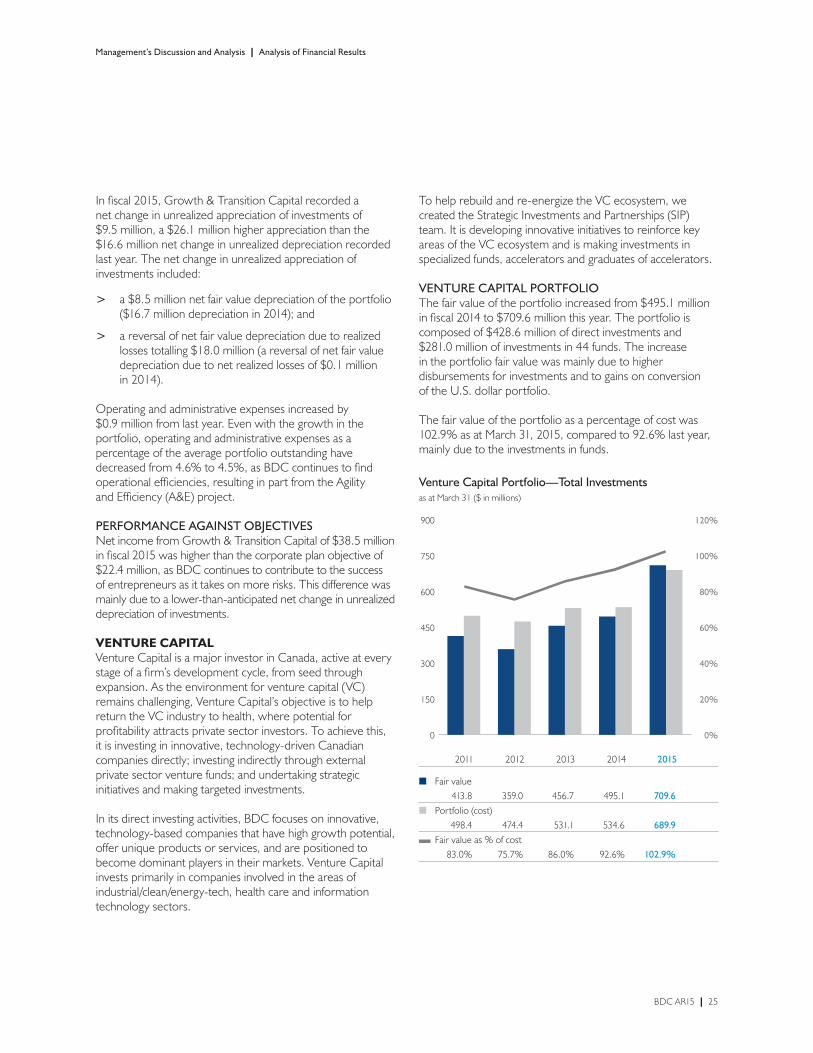
VENTURE CAPITAL PORTFOLIOThe fair value of the portfolio increased from $495.1 million in fiscal 2014 to $709.6 million this year. The portfolio is composed of $428.6 million of direct investments and $281.0 million of investments in 44 funds. The increase in the portfolio fair value was mainly due to higher disbursements for investments and to gains on conversion of the U.S. dollar portfolio.
The fair value of the portfolio as a percentage of cost was 102.9% as at March 31, 2015, compared to 92.6% last year, mainly due to the investments in funds.
Venture Capital Portfolio—Total Investmentsas at March 31 ($ in millions)
900
750
600
450
300
150
0
120%
100%
80%
60%
40%
20%
0%0
150
300
450
600
750
900
0
20
40
60
80
100
120
2011 2012 2013 2014 2015
n Fair value413.8 359.0 456.7 495.1 709.6
n Portfolio (cost)498.4 474.4 531.1 534.6 689.9
Fair value as % of cost83.0% 75.7% 86.0% 92.6% 102.9%
BDC AR15 | 25
Management’s Discussion and Analysis | Analysis of Financial Results
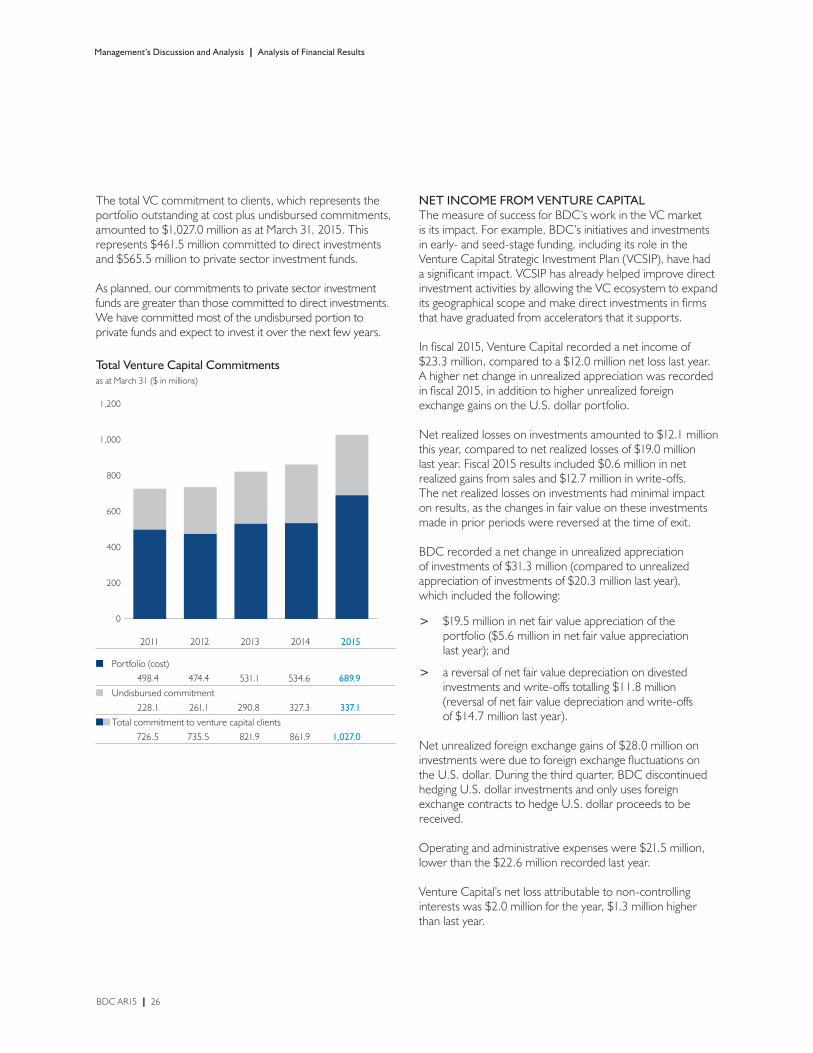
The total VC commitment to clients, which represents the portfolio outstanding at cost plus undisbursed commitments, amounted to $1,027.0 million as at March 31, 2015. This represents $461.5 million committed to direct investments and $565.5 million to private sector investment funds.
As planned, our commitments to private sector investment funds are greater than those committed to direct investments. We have committed most of the undisbursed portion to private funds and expect to invest it over the next few years.
Total Venture Capital Commitments as at March 31 ($ in millions)
1,200
1,000
800
600
400
200
00
200
400
600
800
1000
1200
2011 2012 2013 2014 2015
n Portfolio (cost)498.4 474.4 531.1 534.6 689.9
n Undisbursed commitment228.1 261.1 290.8 327.3 337.1
nnTotal commitment to venture capital clients 726.5 735.5 821.9 861.9 1,027.0
NET INCOME FROM VENTURE CAPITALThe measure of success for BDC’s work in the VC market is its impact. For example, BDC’s initiatives and investments in early- and seed-stage funding, including its role in the Venture Capital Strategic Investment Plan (VCSIP), have had a significant impact. VCSIP has already helped improve direct investment activities by allowing the VC ecosystem to expand its geographical scope and make direct investments in firms that have graduated from accelerators that it supports.
In fiscal 2015, Venture Capital recorded a net income of $23.3 million, compared to a $12.0 million net loss last year. A higher net change in unrealized appreciation was recorded in fiscal 2015, in addition to higher unrealized foreign exchange gains on the U.S. dollar portfolio.
Net realized losses on investments amounted to $12.1 million this year, compared to net realized losses of $19.0 million last year. Fiscal 2015 results included $0.6 million in net realized gains from sales and $12.7 million in write-offs. The net realized losses on investments had minimal impact on results, as the changes in fair value on these investments made in prior periods were reversed at the time of exit.
BDC recorded a net change in unrealized appreciation of investments of $31.3 million (compared to unrealized appreciation of investments of $20.3 million last year), which included the following:
> $19.5 million in net fair value appreciation of the portfolio ($5.6 million in net fair value appreciation last year); and
> a reversal of net fair value depreciation on divested investments and write-offs totalling $11.8 million (reversal of net fair value depreciation and write-offs of $14.7 million last year).
Net unrealized foreign exchange gains of $28.0 million on investments were due to foreign exchange fluctuations on the U.S. dollar. During the third quarter, BDC discontinued hedging U.S. dollar investments and only uses foreign exchange contracts to hedge U.S. dollar proceeds to be received.
Operating and administrative expenses were $21.5 million, lower than the $22.6 million recorded last year.
Venture Capital’s net loss attributable to non-controlling interests was $2.0 million for the year, $1.3 million higher than last year.
BDC AR15 | 26
Management’s Discussion and Analysis | Analysis of Financial Results
PERFORMANCE AGAINST OBJECTIVESVenture Capital’s net income of $23.3 million was higher than the $39.9 million net loss anticipated in the corporate plan. This was largely due to a higher-than-anticipated net change in unrealized appreciation on investments. Operating and administrative expenses were lower than the corporate plan objective. Net loss attributable to non-controlling interests of $2.0 million was $0.6 million higher than anticipated.
CONSULTINGConsulting offers business consulting services at a cost entrepreneurs can afford. It strives to provide entrepreneurs with the support they need to grow their business and enhance their competitiveness in local and global markets.
In late fiscal 2014, Consulting began operating under a new structure designed to better help small and medium-sized businesses improve their competitiveness by accelerating growth, improving productivity and building organizational capabilities. A multi-year business transformation plan was created, and the first set of changes was launched during the first quarter of fiscal 2015.
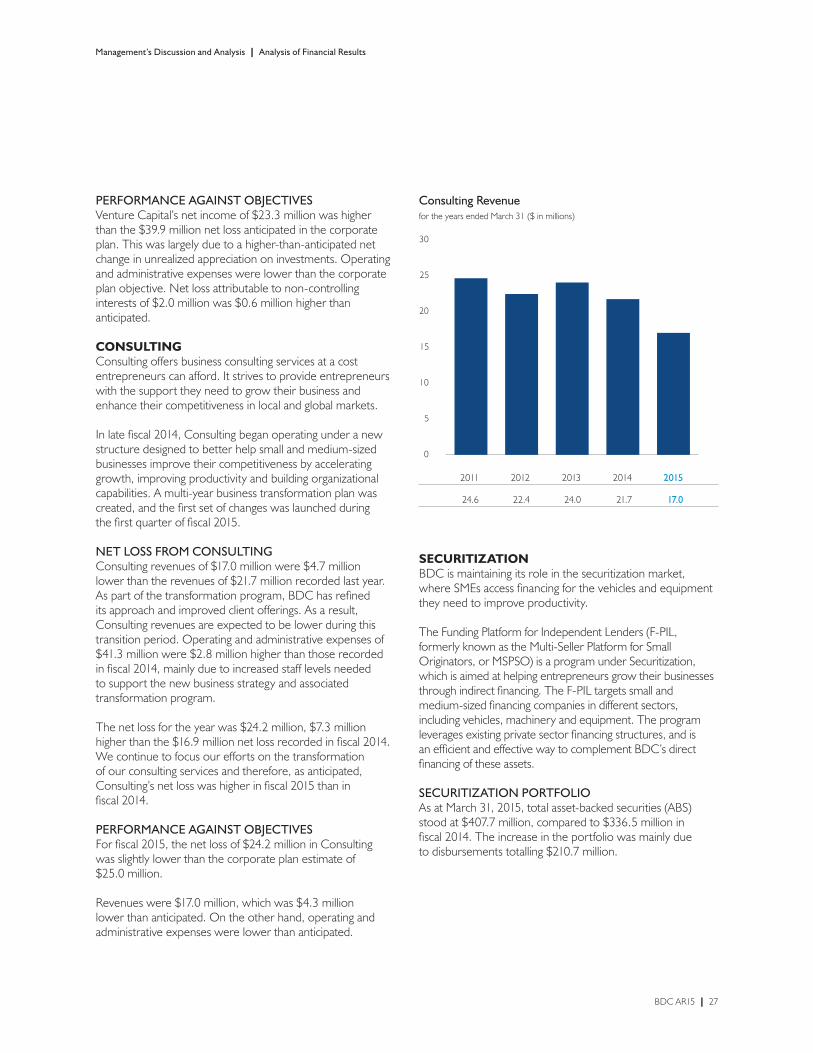
NET LOSS FROM CONSULTINGConsulting revenues of $17.0 million were $4.7 million lower than the revenues of $21.7 million recorded last year. As part of the transformation program, BDC has refined its approach and improved client offerings. As a result, Consulting revenues are expected to be lower during this transition period. Operating and administrative expenses of $41.3 million were $2.8 million higher than those recorded in fiscal 2014, mainly due to increased staff levels needed to support the new business strategy and associated transformation program.
The net loss for the year was $24.2 million, $7.3 million higher than the $16.9 million net loss recorded in fiscal 2014. We continue to focus our efforts on the transformation of our consulting services and therefore, as anticipated, Consulting’s net loss was higher in fiscal 2015 than in fiscal 2014.
PERFORMANCE AGAINST OBJECTIVESFor fiscal 2015, the net loss of $24.2 million in Consulting was slightly lower than the corporate plan estimate of $25.0 million.
Revenues were $17.0 million, which was $4.3 million lower than anticipated. On the other hand, operating and administrative expenses were lower than anticipated.
Consulting Revenuefor the years ended March 31 ($ in millions)
0
5
10
15
20
25
3030
25
20
15
10
5
0
2011 2012 2013 2014 2015
24.6 22.4 24.0 21.7 17.0
SECURITIZATIONBDC is maintaining its role in the securitization market, where SMEs access financing for the vehicles and equipment they need to improve productivity.
The Funding Platform for Independent Lenders (F-PIL, formerly known as the Multi-Seller Platform for Small Originators, or MSPSO) is a program under Securitization, which is aimed at helping entrepreneurs grow their businesses through indirect financing. The F-PIL targets small and medium-sized financing companies in different sectors, including vehicles, machinery and equipment. The program leverages existing private sector financing structures, and is an efficient and effective way to complement BDC’s direct financing of these assets.
SECURITIZATION PORTFOLIOAs at March 31, 2015, total asset-backed securities (ABS) stood at $407.7 million, compared to $336.5 million in fiscal 2014. The increase in the portfolio was mainly due to disbursements totalling $210.7 million.
BDC AR15 | 27

Management’s Discussion and Analysis | Analysis of Financial Results
NET INCOME FROM SECURITIZATIONSecuritization recorded net income of $4.0 million for the year, $1.8 million lower than last year, mainly due to lower net interest income as a result of a slight decrease in the yield. Operating and administrative expenses amounted to $2.0 million in fiscal 2015, slightly higher than last year.
PERFORMANCE AGAINST OBJECTIVESNet income of $4.0 million was $2.2 million lower than anticipated, mostly due to lower net interest income as a result of both lower-than-anticipated outstanding ABS and yield.
0
700
1400
2100
2800
35003,500
2,800
2,100
1,400
700
0
Asset-Backed Securities Portfolio as at March 31 ($ in millions)
2011 2012 2013 2014 2015
3,069 763 437 336 408
VENTURE CAPITAL ACTION PLANDuring fiscal 2015, BDC continued the deployment of the Venture Capital Action Plan (VCAP), a federal government initiative to invest $400 million to increase private sector venture capital financing through four funds of funds and four high-performing funds for high-potential, innovative Canadian businesses.
VENTURE CAPITAL ACTION PLAN PORTFOLIOVenture Capital Action Plan authorized $114.8 million in fiscal 2015, compared to $210.0 million last year. During fiscal 2015, three funds of funds and one high-performing fund were closed. As at March 31, 2015, the total portfolio stood at $47.6 million, up from $5.2 million last year.
NET LOSS FROM VENTURE CAPITAL ACTION PLANVenture Capital Action Plan recorded a net loss of $4.3 million, mostly as a result of a net change in unrealized depreciation of investments of $3.6 million. These losses were anticipated early in the program.
Operating and administrative expenses were $0.9 million, similar to last year’s level.
PERFORMANCE AGAINST OBJECTIVESNet loss of $4.3 million was $15.5 million better than anticipated, mostly due to a lower-than-anticipated net change in unrealized depreciation of investments as a result of lower disbursements.
CONSOLIDATED FINANCIAL POSITION AND STATEMENT OF CASH FLOWSTotal assets of $21.1 billion increased by $1.5 billion from a year ago, largely due to the $1.2 billion increase in our loans portfolio, combined with a $66.1 million increase in the subordinate financing investment portfolio, a $256.9 million increase in the venture capital and venture capital action plan investment portfolios, and a $71.2 million increase in ABS.
0
4000
8000
12000
16000
20000
2400024,000
20,000
16,000
12,000
8,000
4,000
0
Total Assets—BDC as at March 31 ($ in millions)
2011 2012 2013 2014 2015
18,400 17,220 18,184 19,570 21,129
BDC AR15 | 28
Management’s Discussion and Analysis | Analysis of Financial Results
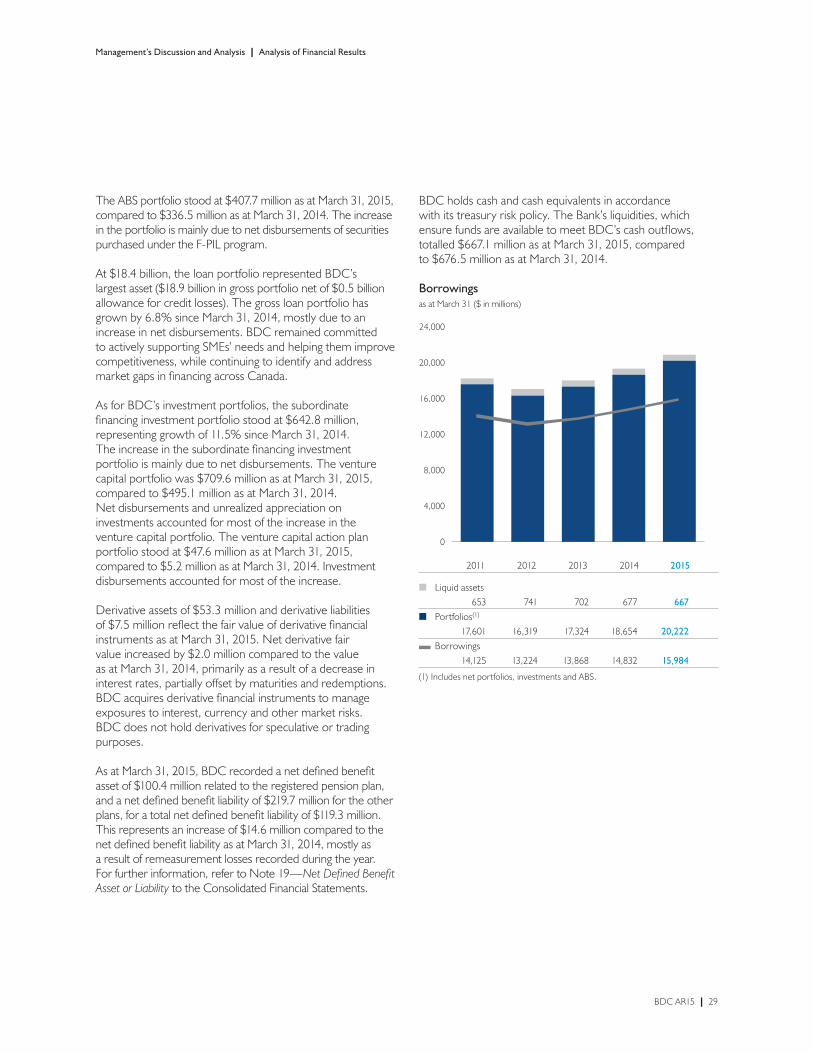
The ABS portfolio stood at $407.7 million as at March 31, 2015, compared to $336.5 million as at March 31, 2014. The increase in the portfolio is mainly due to net disbursements of securities purchased under the F-PIL program.
At $18.4 billion, the loan portfolio represented BDC’s largest asset ($18.9 billion in gross portfolio net of $0.5 billion allowance for credit losses). The gross loan portfolio has grown by 6.8% since March 31, 2014, mostly due to an increase in net disbursements. BDC remained committed to actively supporting SMEs’ needs and helping them improve competitiveness, while continuing to identify and address market gaps in financing across Canada.
As for BDC’s investment portfolios, the subordinate financing investment portfolio stood at $642.8 million, representing growth of 11.5% since March 31, 2014. The increase in the subordinate financing investment portfolio is mainly due to net disbursements. The venture capital portfolio was $709.6 million as at March 31, 2015, compared to $495.1 million as at March 31, 2014. Net disbursements and unrealized appreciation on investments accounted for most of the increase in the venture capital portfolio. The venture capital action plan portfolio stood at $47.6 million as at March 31, 2015, compared to $5.2 million as at March 31, 2014. Investment disbursements accounted for most of the increase.
Derivative assets of $53.3 million and derivative liabilities of $7.5 million reflect the fair value of derivative financial instruments as at March 31, 2015. Net derivative fair value increased by $2.0 million compared to the value as at March 31, 2014, primarily as a result of a decrease in interest rates, partially offset by maturities and redemptions. BDC acquires derivative financial instruments to manage exposures to interest, currency and other market risks. BDC does not hold derivatives for speculative or trading purposes.
As at March 31, 2015, BDC recorded a net defined benefit asset of $100.4 million related to the registered pension plan, and a net defined benefit liability of $219.7 million for the other plans, for a total net defined benefit liability of $119.3 million. This represents an increase of $14.6 million compared to the net defined benefit liability as at March 31, 2014, mostly as a result of remeasurement losses recorded during the year. For further information, refer to Note 19—Net Defined Benefit Asset or Liability to the Consolidated Financial Statements.
BDC holds cash and cash equivalents in accordance with its treasury risk policy. The Bank’s liquidities, which ensure funds are available to meet BDC’s cash outflows, totalled $667.1 million as at March 31, 2015, compared to $676.5 million as at March 31, 2014.
Borrowingsas at March 31 ($ in millions)
24,000
20,000
16,000
12,000
8,000
4,000
00
4000
8000
12000
16000
20000
24000
0
4000
8000
12000
16000
20000
24000
2011 2012 2013 2014 2015
n Liquid assets 653 741 702 677 667
n Portfolios(1)
17,601 16,319 17,324 18,654 20,222 Borrowings
14,125 13,224 13,868 14,832 15,984
(1) Includes net portfolios, investments and ABS.
BDC AR15 | 29
For the year ended March 31, 2015, cash flow used by investing activities amounted to $367.3 million. Financing activities provided $1,079.3 million in cash flow, as long-term notes were repaid for $384.2 million and short-term notes were issued for $1,380.3 million. Operating activities used $721.5 million in cash flows.
As at March 31, 2015, BDC funded its portfolios and liquidities with borrowings of $16.0 billion and total equity of $4.7 billion. Borrowings comprised $15.5 billion in short-term notes and $0.5 billion in long-term notes.
As at March 31, 2015, total equity consisted of $4.7 billion attributable to BDC’s shareholder and $34.5 million attributable to non-controlling interests.
BDC’s return on common equity (ROE) reached 10.6% in fiscal 2015, above our benchmark of the 10-year moving average cost of capital of 2.2% for the Government of Canada’s three-year bonds.
Total Equityas at March 31 ($ in millions)
2015 2014 2013 2012 2011
Equity Share capital 2,138.4 2,138.4 2,088.4 2,088.4 2,514.4 Contributed surplus 27.8 27.8 27.8 27.8 27.8 Retained earnings 2,570.5 2,167.3 1,748.1 1,378.6 1,046.4 Accumulated other comprehensive income 7.9 5.5 8.6 15.2 24.6Equity attributable to BDC’s shareholder 4,744.6 4,339.0 3,872.9 3,510.0 3,613.2 Non-controlling interests 34.5 51.1 82.8 115.3 146.6Total equity 4,779.1 4,390.1 3,955.7 3,625.3 3,759.8
ROE(2) 10.6% 10.2% 12.0% 13.7% 10.8%
(1) Based on IFRS, BDC’s $230 million in outstanding preferred shares as at March 31, 2011, were reclassified as liabilities. These preferred shares were fully repurchased in fiscal 2012.
(2) ROE is calculated based on equity attributable to BDC’s shareholder (see the glossary on page 134 for a detailed definition).
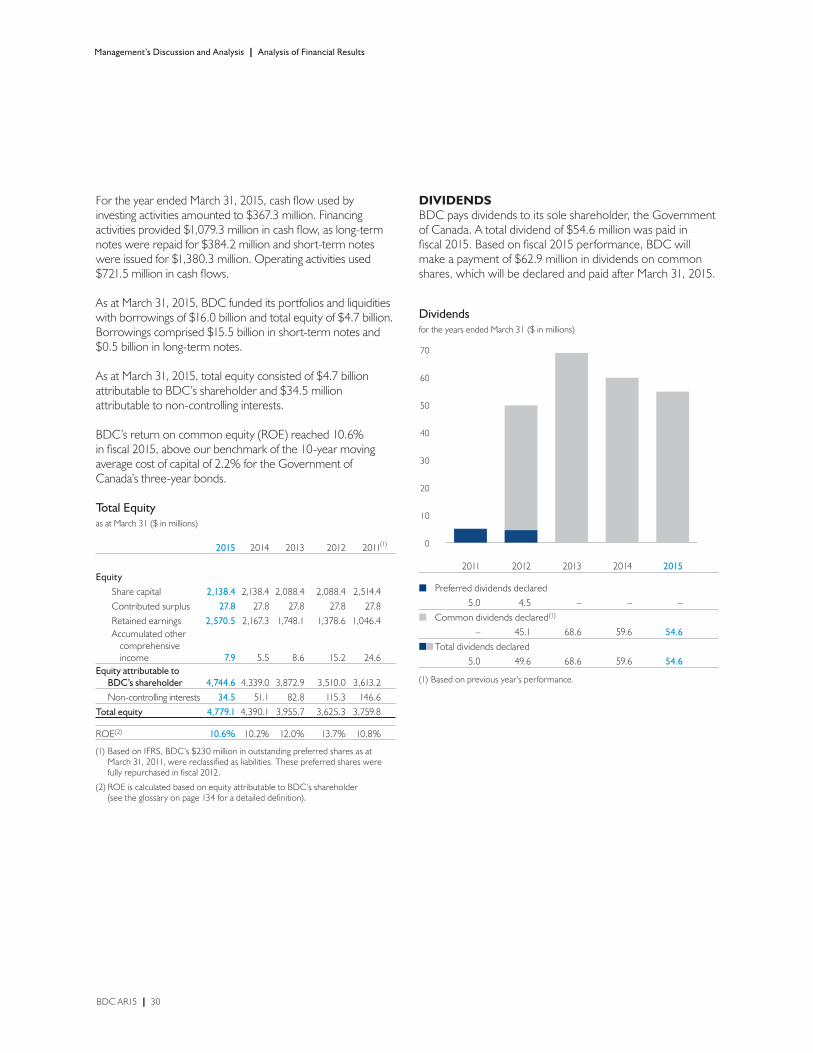
DIVIDENDSBDC pays dividends to its sole shareholder, the Government of Canada. A total dividend of $54.6 million was paid in fiscal 2015. Based on fiscal 2015 performance, BDC will make a payment of $62.9 million in dividends on common shares, which will be declared and paid after March 31, 2015.
Dividendsfor the years ended March 31 ($ in millions)
0
10
20
30
40
50
60
7070
60
50
40
30
20
10
0
2011 2012 2013 2014 2015
n Preferred dividends declared5.0 4.5 – – –
n Common dividends declared(1)
– 45.1 68.6 59.6 54.6nn Total dividends declared
5.0 49.6 68.6 59.6 54.6
(1) Based on previous year’s performance.
(1)
Management’s Discussion and Analysis | Analysis of Financial Results
BDC AR15 | 30

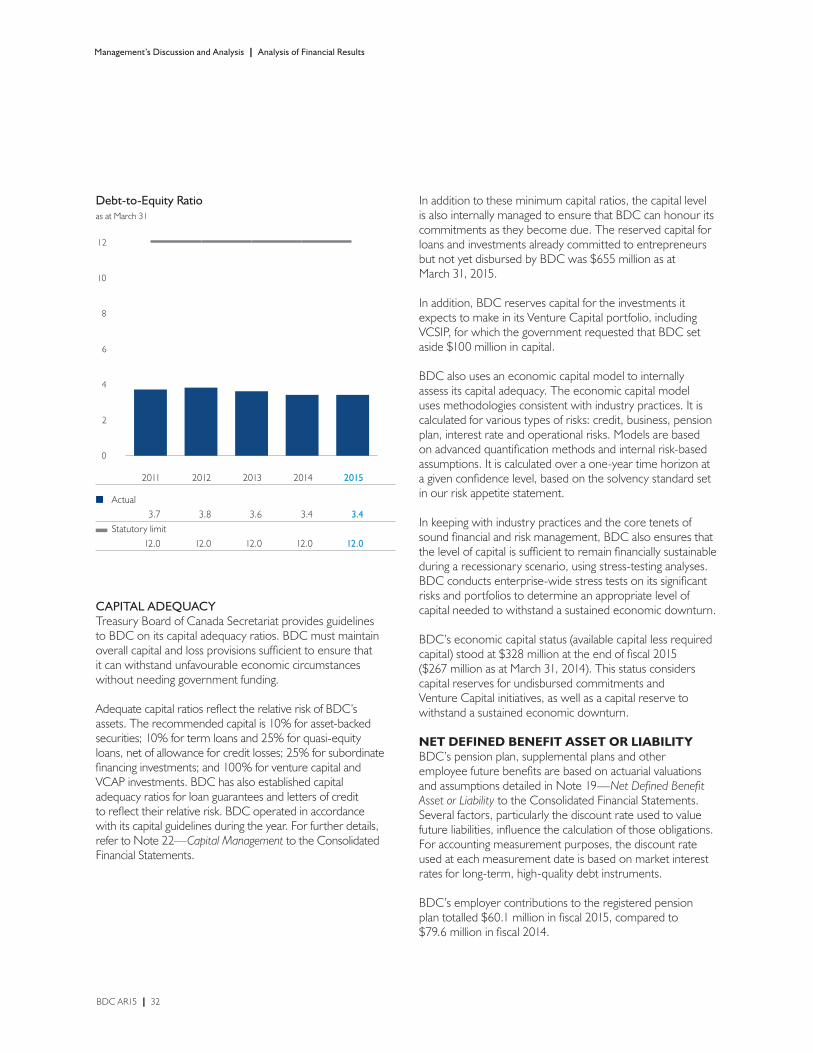
CAPITAL MANAGEMENT STATUTORY LIMITATIONSThe BDC Act requires that the aggregate of borrowings and contingent liabilities in the form of guarantees provided by BDC may not exceed 12 times its equity. This ratio excludes accumulated other comprehensive income. BDC’s debt-to-equity ratio as at March 31, 2015, was 3.4:1, unchanged from March 31, 2014.
In addition, the paid-in capital, the contributed surplus and any proceeds that have been prescribed as equity (such as hybrid capital instruments) must not at any time exceed $3.0 billion. As at March 31, 2015, these amounts totalled $2.2 billion, unchanged from March 31, 2014.
Cumulative Dividends Paidas at March 31 ($ in millions)
0
40
80
120
160
200
240
280
320
360
400
440
1998-2005 2006 2007 2008 2009 2010 2011 2012 2013 2014 2015
n Preferred dividends paid77.3 86.4 95.1 104.5 114.0 122.9 129.3 138.8 138.8 138.8 138.8
n Common dividends paid3.8 11.5 23.6 35.7 42.7 50.6 50.6 95.7 164.3 223.9 278.5
nnTotal dividends paid81.1 97.9 118.7 140.2 156.7 173.5 179.9 234.5 303.1 362.7 417.3
440
400
360
320
280
240
200
160
120
80
40
0
Management’s Discussion and Analysis | Analysis of Financial Results
BDC AR15 | 31
Management’s Discussion and Analysis | Analysis of Financial Results
Debt-to-Equity Ratioas at March 31
0
2
4
6
8
10
12
0
2
4
6
8
10
12
2011 2012 2013 2014 2015
n Actual3.7 3.8 3.6 3.4 3.4
Statutory limit12.0 12.0 12.0 12.0 12.0
12
10
8
6
4
2
0
CAPITAL ADEQUACYTreasury Board of Canada Secretariat provides guidelines to BDC on its capital adequacy ratios. BDC must maintain overall capital and loss provisions sufficient to ensure that it can withstand unfavourable economic circumstances without needing government funding.
Adequate capital ratios reflect the relative risk of BDC’s assets. The recommended capital is 10% for asset-backed securities; 10% for term loans and 25% for quasi-equity loans, net of allowance for credit losses; 25% for subordinate financing investments; and 100% for venture capital and VCAP investments. BDC has also established capital adequacy ratios for loan guarantees and letters of credit to reflect their relative risk. BDC operated in accordance with its capital guidelines during the year. For further details, refer to Note 22—Capital Management to the Consolidated Financial Statements.
In addition to these minimum capital ratios, the capital level is also internally managed to ensure that BDC can honour its commitments as they become due. The reserved capital for loans and investments already committed to entrepreneurs but not yet disbursed by BDC was $655 million as at March 31, 2015.
In addition, BDC reserves capital for the investments it expects to make in its Venture Capital portfolio, including VCSIP, for which the government requested that BDC set aside $100 million in capital.
BDC also uses an economic capital model to internally assess its capital adequacy. The economic capital model uses methodologies consistent with industry practices. It is calculated for various types of risks: credit, business, pension plan, interest rate and operational risks. Models are based on advanced quantification methods and internal risk-based assumptions. It is calculated over a one-year time horizon at a given confidence level, based on the solvency standard set in our risk appetite statement.
In keeping with industry practices and the core tenets of sound financial and risk management, BDC also ensures that the level of capital is sufficient to remain financially sustainable during a recessionary scenario, using stress-testing analyses. BDC conducts enterprise-wide stress tests on its significant risks and portfolios to determine an appropriate level of capital needed to withstand a sustained economic downturn.
BDC’s economic capital status (available capital less required capital) stood at $328 million at the end of fiscal 2015 ($267 million as at March 31, 2014). This status considers capital reserves for undisbursed commitments and Venture Capital initiatives, as well as a capital reserve to withstand a sustained economic downturn.
NET DEFINED BENEFIT ASSET OR LIABILITYBDC’s pension plan, supplemental plans and other employee future benefits are based on actuarial valuations and assumptions detailed in Note 19—Net Defined Benefit Asset or Liability to the Consolidated Financial Statements. Several factors, particularly the discount rate used to value future liabilities, influence the calculation of those obligations. For accounting measurement purposes, the discount rate used at each measurement date is based on market interest rates for long-term, high-quality debt instruments.
BDC’s employer contributions to the registered pension plan totalled $60.1 million in fiscal 2015, compared to $79.6 million in fiscal 2014.
BDC AR15 | 32
Management’s Discussion and Analysis | Analysis of Financial Results
We fund our registered pension plan in accordance with applicable federal pension legislation and actuarial standards of practice in Canada to ensure proper funding of employee benefit obligations. As of March 31, 2015, the funded status of the registered pension plan was in a surplus position on a going-concern basis and in a deficit position on a solvency basis. We will continue to contribute to the pension fund in future years to manage our funded status, as prescribed by the applicable federal pension legislation.
Since fiscal 2006, BDC has funded the supplemental plans on a voluntary basis. Other employee future benefits plans are unfunded.
OUTLOOK FOR 2016Canada’s growth in recent years has been modest. Even though the fall in oil prices will negatively impact the Canadian economy, a more robust U.S. economy and a lower Canadian dollar should benefit export-driven industries. With credit conditions remaining favourable to Canadian businesses, BDC will help to ensure that Canadian SMEs become more competitive and will continue to play its important complementary role.
BDC’s consolidated net income is expected to reach $423 million in fiscal 2016, of which $424 million will be attributable to BDC’s shareholder. The decrease in net income is mainly due to the higher expected losses in Venture Capital, VCAP and Consulting, as BDC makes the investments required to fully play its role in catalyzing the entrepreneurial ecosystem and supporting the competitiveness of Canadian SMEs. BDC is forecasting dividend payments of $60 million in 2016.
FINANCINGFinancing will continue to assist small businesses, including those that have difficulty accessing financing due to their location, sector or demographic. It is maintaining a focus on small loans, often for less than $250,000, to help entrepreneurs buy equipment to increase productivity, innovate through ICT, and grow and explore new markets. BDC expects net financing acceptances to increase by 2.1% to $4.8 billion in fiscal 2016, and the gross portfolio is expected to grow by 7.9% to $20.4 billion in fiscal 2016.
Financing is expected to generate net income of $458 million in fiscal 2016, reflecting the growth in the portfolio and the return of impairment losses to more typical levels. BDC projects the impairment losses on loans will amount to $138 million or 0.7% of the average outstanding financing portfolio. Net interest income is expected to increase to $958 million in fiscal 2016. As a result of BDC’s efforts to reduce costs and find efficiencies, including through its Agility and Efficiency (A&E) project, Financing’s operating expenses as a percentage of the average portfolio outstanding are expected to remain unchanged at 1.9%, even with additional investments made in support of Canada’s SMEs.
GROWTH & TRANSITION CAPITALGrowth & Transition Capital is playing an increasingly important role in supporting the growth plans of SMEs through flexible financing solutions and a diverse product offering.
Growth & Transition Capital will continue to address the needs of high-growth firms and companies in transition through its specialized subordinate financing products. The volume of acceptances is expected to reach $240 million in fiscal 2016, up from $232 million in fiscal 2015. The fair value of the portfolio is expected to grow from $643 million in fiscal 2015 to $732 million in fiscal 2016. Even with the growth in the portfolio, operating expenses as a percentage of the average outstanding portfolio will remain unchanged at 4.5% in fiscal 2016.
Net income from Growth & Transition Capital is projected to be $34 million. After a few years of exceptionally low losses on investments, losses are expected to be at more representative levels for the risk being taken in BDC’s subordinate financing portfolio.
BDC AR15 | 33

VENTURE CAPITALAs one of the most active investors in the market, Venture Capital is helping to demonstrate the viability of the Canadian VC industry, by carrying out its strategy of direct and indirect investing, and by creating the conditions for success through its Strategic Investments and Partnerships (SIP) team.
To support innovative Canadian companies and create the conditions for success in the VC ecosystem, Venture Capital estimates that, in fiscal 2016, it will authorize $210 million in investments, including $82 million in direct investments and $128 million in indirect investments. The fair value of the venture capital portfolio is forecast to be $668 million by March 31, 2016.
For fiscal 2016, Venture Capital forecasts a net loss of $14 million, including a net loss of $1 million attributable to non-controlling interests. Operating and administrative expenses are projected to be $24 million.
CONSULTINGBDC believes that entrepreneurs need to take advantage of professional, qualified advisory services to grow, innovate, create efficiencies and ultimately become more competitive. However, from its experience in the market, BDC has found that small business owners have unmet needs for a broad range of these services, and often have trouble identifying and addressing their own requirements. To address this market gap, BDC is investing in advisory services that will maximize its impact on the competitiveness of Canadian entrepreneurs by enabling them to take advantage of growth, productivity and innovation projects. In its role as a development bank, BDC assumes a portion of the costs associated with the provision of such services. This will ensure they are affordable and accessible to a variety of SMEs. As a result of the transition to the new approach, the net loss from BDC Consulting is expected to increase to $30 million for fiscal 2016.
SECURITIZATIONBy partnering with private sector financing companies in the securitization market, BDC improves the availability of financing and enables SMEs to purchase vehicles and equipment to support productivity. The Funding Platform for Independent Lenders (F-PIL) ensures that smaller financing companies can provide financing for the vehicle and equipment needs of businesses and consumers.
Under the F-PIL program, BDC forecasts authorizations of $450 million in fiscal 2016. Securitization’s total portfolio is expected to close at a fair value of $460 million as at March 31, 2016. Total net income for fiscal 2016 is projected to be $3 million.
VENTURE CAPITAL ACTION PLANRecognizing the importance of VC to Canada’s economic prosperity, in Economic Action Plan 2012, the government announced $400 million to help increase private sector investment in early-stage risk capital and to support the creation of large-scale VC funds led by the private sector. In January 2013, the Prime Minister announced the Venture Capital Action Plan (VCAP), a comprehensive strategy for deploying the new capital. BDC was asked to carry out certain duties and functions to support the operations of this new business line.
BDC will continue the deployment of the VCAP program. For fiscal 2016, BDC anticipates that $99 million will be disbursed and forecasts that it will incur losses of $21 million, as the VCAP program is in the early stages of implementation. BDC believes that the combined effect of VCAP, the Venture Capital Strategic Investment Plan and its own VC investing activities will have a significant positive impact on the VC market in Canada.
Management’s Discussion and Analysis | Analysis of Financial Results
BDC AR15 | 34

Management’s Discussion and Analysis | Analysis of Financial Results
OPERATIONAL EFFICIENCYAs can be seen in the graph, operational efficiency is a longstanding, ongoing objective at BDC.
Over the years, BDC has made a concerted effort to achieve efficiencies while fulfilling its role as a development bank. It is continuing this tradition and observing the intent of the government’s strategic review by carefully managing operating expenses, identifying and gaining efficiencies, and improving its efficiency ratio, that is, the expenses incurred to earn each dollar of revenue. (The lower the ratio, the better.) As a result, the financing efficiency ratio has improved from 41.4% in fiscal 2011 to 38.6% in fiscal 2015.
0
10
20
30
40
5050%
40%
30%
20%
10%
0%
Financing Efficiency Ratio(1)
for the years ended March 31
2011 2012 2013 2014 2015
41.4% 40.3% 43.5% 40.0% 38.6%
(1) A lower ratio indicates improved efficiency.
For the definition of efficiency ratio, refer to the Glossary on page 133.
BDC AR15 | 35

We take risk to support clients.
We price for this risk.
And we manage it well.
BDC AR15 | 36

BDC’S PRINCIPLES OF ENTERPRISE RISK MANAGEMENT
1. Risk management is everyone’s responsibility, from the Board of Directors to employees.
2. We manage risk by balancing it with appropriate return, in line with our risk appetite.
3. We integrate risk management into key business processes, such as strategic business and budget planning, lending, investing and consulting activities.
4. Risk Management
BDC takes on risk while remaining financially sustainable. Our strong risk management practices enable us to take appropriate risks while offering relevant services.
We manage our risks by using formal risk reviews and rigorous processes. These include defining our risk appetite, developing risk policies and setting delegated authorities and limits.
Risk is a defining, unavoidable feature of the financial services sector. It is inherent in virtually all of BDC’s activities.
Risk is also a defining feature of entrepreneurial activity. And as we enter into business relationships with Canada’s entrepreneurs, we must identify and manage several kinds of risk—to the greatest degree possible—for entrepreneurs to succeed.
BDC has strong risk management practices that emphasize risk identification, risk management, transparency and accountability.
Our Board of Directors provides essential, independent oversight of BDC’s exposure to risk.
ENTERPRISE RISK MANAGEMENT POLICYThe enterprise risk management (ERM) policy codifies the integrated, enterprise-wide process we use to identify, analyze, accept, mitigate, monitor and report risks. It also defines the roles and responsibilities of board members, management, functional units and employees in implementing the policy.
BDC’s Board of Directors reviews and approves the policy at least every two years.
RISK APPETITE STATEMENTOur ERM framework includes a risk appetite statement that enables us to articulate and continuously monitor our risk profile against our defined risk appetite and related limits, taking actions as needed to maintain an appropriate balance of risk and return.
BDC’s risk appetite statement articulates in written form, and communicates in qualitative statements and quantitative measures, the board’s vision for managing significant risks that BDC is willing to accept or avoid in the execution of its strategy.
BDC’s Board of Directors reviews and approves the risk appetite statement annually.
4. The ERM policy codifies a comprehensive, disciplined and continuous process that we use to identify, analyze, accept, mitigate, monitor and report risks within approved risk tolerances.
5. In the risk appetite statement and risk management-related policies, the board sets the acceptable levels of risk that BDC will tolerate.
6. BDC’s policies and processes are consistent with ERM best practices.
BDC AR15 | 37

Management’s Discussion and Analysis | Risk Management
THE BOARD OF DIRECTORS AND ITS GOVERNANCE
BOARD OF DIRECTORS
Senior Management Committee
BDC MANAGEMENT
RISK COMMITTEES RISK MANAGEMENT FUNCTIONS
Internal Audit
Disclosure Committee
Human Resources Committee
Governance and Nominating Committee
Board Investment Committee
Board Credit andRisk Committee
Pension Funds Investment Committee
Audit Committee
Risk Management
Credit Risk Management
Valuation
Credit RiskEnterprise Risk Management
Compliance and Security
Portfolio and Treasury Risk Management
President and Chief Executive Officer
BDC AR15 | 38

Management’s Discussion and Analysis | Risk Management
THE BOARD OF DIRECTORSThe board and its committees oversee governance and risk management.
In addition to approving the risk appetite statement, the board also approves risk policies and strategies; ensures BDC’s risk management is effective; reviews portfolio and treasury risks; reviews capital adequacy and stress-testing analysis; sets clear levels of delegation of authority for transactions; and ensures an appropriate link between risk and reward.
Although all committees consider risk in their deliberations, as appropriate, three committees—the Board Credit and Risk Committee, the Board Investment Committee and the Audit Committee—have specific responsibilities for managing risk. For full details on the board and its committees, please see the Corporate Governance section, starting on page 111.
The Board Credit and Risk Committee advises the board on how BDC is effectively identifying and managing significant risks and reviews reports on BDC’s risk profile, including the risk appetite statement measures, targets and limits. It regularly reviews risk management policies and reports. The committee also approves transactions above a certain threshold.
The Board Investment Committee advises the board on how effectively BDC is managing its Venture Capital, Venture Capital Action Plan and Growth & Transition Capital investment activities. It also approves transactions above a certain threshold.
The Audit Committee advises the board on BDC’s oversight and objective assessment of its financial performance and financial statements, internal controls, financial reporting, accounting standards and disclosure controls. It also keeps the board informed of the quality and independence of BDC’s internal and external audit functions.
BDC MANAGEMENT: RISK COMMITTEES AND FUNCTIONSThe Senior Management Committee (SMC) comprises the president and chief executive officer, the executive financial/risk and operating officers, and designated senior vice presidents. It ensures that BDC establishes and respects sound risk management strategies and practices. It makes sure that BDC has an integrated vision to address key strategic, financial (credit, market and liquidity) and operational risks. It also, through the Disclosure Committee, oversees BDC’s disclosure obligations and practices.
The Risk Management Committee includes senior key leaders from multiple business units. Its mandate focuses on oversight. As such, the committee ensures that BDC has an adequate and effective ERM framework to identify and evaluate trends in critical issues; to evaluate or quantify their probable impact; and to ensure that BDC is mitigating them within its risk appetite.
More specifically, the committee reviews the migration of risk and quality in the loan portfolio, the securitization portfolio, and venture capital and subordinate financing investments. It also reviews financial performance, capital adequacy and BDC’s risk appetite statement; ensures that treasury activities and related asset liability management comply with BDC policy; and oversees the investments of BDC’s pension funds.
The committee focuses on significant risks requiring immediate attention. It reports to the SMC and the board on these risks and plans to mitigate them.
The Credit Risk and Investment Committee includes senior key leaders. They adjudicate and approve transactions within prescribed limits. For larger transactions, they make recommendations to the Board Credit and Risk Committee or the Board Investment Committee.
The Valuation Committee oversees the assessment and determination of the fair value of a portfolio of investments. It includes senior key leaders and an external chartered business valuator.
The Compliance and Security Committee reviews and recommends actions related to security, information management, BDC’s policies and corporate directives framework, and compliance with applicable laws.
BDC AR15 | 39

BDC’s three risk management functions are ERM, credit risk management and portfolio risk management, which includes treasury risk management. These three functions:
> ensure that BDC applies appropriate risk management principles, policies and corporate directives to manage significant and emerging risks, according to risk thresholds;
> develop tools to measure, monitor and report on these risks; and
> provide timely and complete reports on these risks to the organization’s risk management committees.
The Internal Audit Department promotes sound risk management practices, which are outlined in BDC’s corporate risk management policies. Through its risk-based annual audit plan, it works to ensure that BDC follows these practices.
Using an ERM framework helps BDC protect itself by managing risk exposure, resolving uncertainty and building reputational equity. It ensures that BDC makes risk-related decisions in a methodical, consistent way.
The ERM policy outlines the way BDC manages risk by identifying and assessing significant risks, and managing them on an enterprise-wide basis, while our risk appetite statement ensures a consistent understanding of our risk tolerance and limits.
IDENTIFYEvery quarter, we identify, assess, document and classify risks at the corporate and functional levels. Then we present them to the Risk Management Committee, the SMC and the Board of Directors for discussion. We also assess and discuss risks related to all significant projects, new products or services, and policy changes.
ANALYZE AND MEASUREWe quantify and qualitatively assess the significant risks that our activities pose. BDC updates related tools and models, taking into consideration best practices in the financial services industry. We measure risks across the organization to ensure they reflect BDC’s policies, corporate directives, standards and tolerance limits. Board members and senior managers use this information to understand BDC’s risk profile and portfolio performance.
CONTROL AND MITIGATEWe set risk tolerance thresholds that reflect BDC’s objectives and strategies. We also use policies and guidelines to codify our governance and risk management culture.
BDC has the following lines of defence for mitigating its risks:
> adequate and clear roles, responsibilities, processes, policies, corporate directives and procedures;
> risk management functions and committees that provide oversight and monitoring;
> risk mitigation activities, such as hedging, insurance risk management, business continuity planning, information technology recovery planning, and anti-fraud and anti-money laundering programs; and
> business quality reviews and internal audits to ensure that BDC is using appropriate and sound risk management practices (every quarter, the Internal Audit Department presents the results of these audits to the Audit Committee).
Management’s Discussion and Analysis | Risk Management
Identify >
Analyze and measure
>
>
Mon
itor,
disc
lose
and
rep
ort >
RISK MANAGEMENT
THE ERM FRAMEWORK
Control and miti
gate
BDC AR15 | 40
MONITOR, DISCLOSE AND REPORTWe monitor activities affecting BDC’s risk profile, material risk exposures and loss events, and act to align risk exposures with risk appetites.
Risk process owners monitor, disclose and report risks, with support and oversight from the Risk Management Committee and risk management functions. They prepare monthly or quarterly reports on all significant risks, and they meet through risk management and board committees to report and discuss the risks they manage.
MAJOR RISK CATEGORIES
STRATEGIC RISKStrategic risk is the risk that BDC will set inappropriate objectives, will adopt strategies based on inaccurate knowledge of the market or will not allocate enough resources to achieve its objectives.
Managing strategic riskOur dedicated team annually updates our five-year corporate plan using a rigorous process. The plan reflects BDC’s knowledge, which is based on its research capacity and on its relationships with knowledgeable stakeholders and more than 32,000 entrepreneurs. Senior management, the Board of Directors and our shareholder, the Government of Canada, approve the plan. BDC releases a public summary of the plan.
Capital adequacyBDC ensures that it operates with an appropriate level of capital in accordance with the nature and level of risks taken. Our internal capital adequacy process evaluates capital adequacy on both a regulatory (Treasury Board guidelines) and an economic capital basis, and is used to establish capital thresholds in line with our risk appetite.
BDC allocates capital among lines of business based on needs and assessed risks in order to support new and existing corporate activities and to consider capital implications in its strategic and transactional decision-making.
In keeping with industry practices, and the core tenets of sound financial and risk management, BDC also ensures that the level of capital is sufficient to remain financially sustainable during a recessionary scenario, using stress-testing analyses. BDC conducts enterprise-wide stress tests on its significant risks and portfolios to determine an appropriate level of capital needed to withstand a sustained economic downturn.
BDC’s stress-testing framework seeks to ensure that we are adequately capitalized, given the risks we take, and supports the determination of limits that are used to manage the risk levels and capital requirements, in line with BDC’s risk appetite.
Please refer to page 32 of the annual report and Note 22—Capital Management to the Consolidated Financial Statements for additional information on BDC capital management and adequacy.
FINANCIAL RISKBDC is exposed to the following financial risks: credit risk, market risk and liquidity risk. This section should be read in conjunction with Note 23—Risk Management to the Consolidated Financial Statements, which details BDC’s financial risk management policies and measurements.
Credit riskCredit risk is the direct or indirect risk of loss related to an investee, or of loss due to default by a borrower, a counterparty with whom BDC does business or an asset issuer.
Managing credit riskThe most important risk for BDC to manage is the credit risk related to its commercial term lending—the largest part of BDC’s portfolio.
It is at the business centre level, with the support of credit risk adjudication, that we choose to take, mitigate or avoid risk on individual transactions. All of our managers are trained to assess overall credit risk. We base our decisions on our experience with similar clients, and we use policies, corporate directives, guidelines, business rules and risk assessment tools to help us make these decisions.
Our adjudication process includes assigning a borrower rating that reflects our estimate of the probability of default (PD) over the life of the loan. PD estimates are calibrated using a through-the-cycle approach. BDC uses internal risk classification and scoring systems that consider quantitative and qualitative criteria. Such criteria include an assessment of the borrower’s financial strength, management quality, financial flexibility and competitive strength. The quantitative model output can be modified in some cases by expert judgement, as prescribed within our credit policies. Our internal risk classification is also used for portfolio risk management, risk limit setting, product pricing and the determination of economic capital.
Management’s Discussion and Analysis | Risk Management
BDC AR15 | 41

The table below, based on the annual PD, maps our internal ratings to the ratings used by external ratings agencies.
While BDC follows leading risk management practices, we generally assume more risk than a typical financial institution, due to our mandate and risk appetite. As a result, most of BDC’s risk profile is non-investment grade. Please refer to Note 10—Loans to the Consolidated Financial Statements for further information on loans outstanding by grade equivalent.
BDC rating Annual PD Grade equivalent S&P equivalent Moody’s equivalent
0.5 - 1.0 0.1% - 0.3% Investment grade BBB+ to BBB- Baa1 to Baa31.5 - 2.0 0.3% - 10.1% Non-investment grade BB+ Ba12.5 - 4.0 BB to BB- Ba2 to Ba34.5 - 5.0 B+ to B- B1 to B35.5 10.1% - 99.9% Watchlist CCC+ to CC Caa1 to Ca6.0 or higher 100% Default D C
BDC Loans Performing Portfolio Classified by Credit Risk Exposureas at March 31, 2015 (as a percentage of gross performing financing portfolio)
0
15
30
45
60 60%
40%
20%
0%
BBB+ to BBB- BB+ BB to BB- B+ to B- CCC+ to CCInvestment grade Non-investment grade Watchlist
7% 26% 49% 14% 4%
BDC Loans Portfolio Credit Risk Exposure
Management’s Discussion and Analysis | Risk Management
BDC AR15 | 42

The most common method used to mitigate credit risk at the transaction level is to obtain quality collateral from borrowers. Obtaining collateral cannot replace a rigorous assessment of a borrower’s ability to meet its obligations, but it is an important complement. Collateral is not required in all cases; it depends upon the type of loan granted. Please refer to Note 10—Loans for further information about principal collateral pledged as security and our level of security coverage.
In addition to managing credit risk on an individual, transactional basis, BDC manages it on a portfolio basis. Through monitoring, analysis and risk reports, portfolio risk management ensures that the overall risk in the portfolio is well diversified and consistent with BDC fulfilling its mandate while achieving its financial objectives, in line with its risk appetite.
Market riskMarket risk is the risk of financial loss that may arise from developments in marketplace dynamics or from our inability to forecast poor economic conditions quickly enough to mitigate losses in our portfolio. It represents market value fluctuations of BDC’s assets and liabilities arising from volatility in interest rates, equity and foreign currency levels. For BDC, market risk also arises from volatile and unpredictable market events affecting the value of venture capital and venture capital action plan investments.
Managing market riskBDC applies a sound asset/liability framework in its funding strategy and uses derivatives to manage and mitigate exposure to equity markets, foreign currencies and interest rates.
Liquidity riskLiquidity risk is the risk that BDC could be unable to honour all of its contractual commitments as they become due.
Managing liquidity riskTo avoid business disruptions, BDC invests in highly liquid and high-quality securities with active secondary markets that it can sell to a wide range of counterparties.
OPERATIONAL RISKOperational risk is the risk of losses from day-to-day errors caused by people, breakdowns in processes or systems, or events beyond our control, such as natural disasters. It includes but is not limited to the following four categories of risk: human capital, reputational, environmental, and legal and regulatory risks.
Operational risk is present in all daily operations at BDC. As such, all of BDC’s policies and corporate directives help BDC identify, analyze, mitigate and monitor this risk. They govern the way BDC manages its human capital and processes, safeguards information, administers loans and investments, and carries out its business and corporate activities. These activities are subject to internal audits. In addition, BDC has implemented an internal control framework based on the Committee of Sponsoring Organizations of the Treadway Commission (COSO) and an internal control certification process.
Human capital riskBDC’s long-term business success depends on its people. Its ability to attract, develop and engage the right people dictates its organizational capacity and enables it to fulfill its mission to help Canadian entrepreneurs succeed.
Managing human capital riskTo achieve optimal performance levels, we continuously assess the workforce factors and human resources practices that could affect performance. We develop strategies and plans to address these issues, including appropriate compensation, and mitigate human capital risks.
Learning and development are powerful means to prepare employees to achieve their full professional potential, as well as foster engagement. They also ensure BDC has the right qualified people it needs to achieve its strategic objectives and adapt to the dynamic, challenging business environment.
Reputational riskReputational risk is the risk that the activities or relationships of BDC or its employees will breach, or appear to breach, its mandate, culture or values, or applicable laws. That could damage BDC’s reputation and affect its ability to do business.
Management’s Discussion and Analysis | Risk Management
BDC AR15 | 43

BDC must meet Canadians’ expectations in various ways, including:
> meeting the shareholder’s expectation that BDC will support entrepreneurship;
> carrying out its mandate effectively;
> meeting legal and broadly held ethical standards;
> refusing to support clients who fail to meet societal expectations of responsible behaviour; and
> doing business in an environmentally responsible manner.
Managing reputational riskComplying with BDC’s ERM principles is the cornerstone of managing reputational risk.
BDC uses its corporate social responsibility framework with strategic purpose and rigour to manage reputational risk.
At a corporate level, BDC tracks the interests of key opinion leaders and stakeholders through dialogue and media monitoring, including social media monitoring.
BDC considers reputational risk when considering potential loans or investments. It screens the potential client, and does due diligence for the potential transaction. Our procedures detect whether a potential client is involved in money laundering or terrorist activities. We also ensure he or she meets requirements related to transparency and disclosure, environmental performance, ethics, and credit eligibility.
Reputational risk management is part of our corporate risk policies and corporate directives, which include the following:
> the Board Code of Conduct;
> the BDC Employee Code of Conduct, Ethics and Values (including the policy on the disclosure of wrongdoing, the anti-fraud corporate directive, and the anti-money laundering and anti-terrorist financing corporate directive);
> the policy on personal trading for employees and the policy on personal trading for directors;
> the charter of client rights;
> the policy and corporate directives on authorization limits and levels of authority;
> the ERM policy;
> the credit risk management policy;
> the policy on the environment;
> the eligibility corporate directive, which includes the United Nations Global Compact principles and the OECD Guidelines for Multinational Corporations;
> the venture capital policy and corporate directive;
> the disclosure policy and corporate directive; and
> the policy on the handling of referrals and enquiries from members of Parliament, senators, ministerial staff and BDC directors.
Environmental riskEnvironmental risk is the risk of damage to the environment or reputational harm caused when BDC’s operations or financing fail to meet applicable laws or society’s expectations of environmental stewardship. It is often embedded in other risks, such as credit, legal or regulatory risk.
Managing environmental riskBDC has well-defined processes to identify, assess and mitigate environmental risk throughout the loan and investment lifecycle. These processes minimize direct losses due to environmental impairment of assets under BDC’s charge and ensure that BDC deals only with clients who respect environmental regulations and best practices. They also ensure that BDC, in accordance with its responsibilities under the Canadian Environmental Assessment Act, does not fund projects that could significantly harm the environment.
Legal and regulatory risk Legal and regulatory risk is the risk that our failure to comply with laws, regulations, public sector guidelines, industry codes, corporate governance or ethical standards will harm our business activities, earnings, regulatory relationships or reputation. It includes the effectiveness with which we prevent and handle litigation.
Managing legal and regulatory riskBDC’s Legal Affairs and Corporate Secretariat, through a legislative compliance framework, helps BDC employees and management comply with laws and regulations, and manages all litigation involving BDC. It gives the Board of Directors the information it needs to comply with laws and corporate governance, and to oversee BDC’s management of its legal and regulatory risk.
BDC is undergoing a review of risk management and governance practices by the Office of the Superintendent of Financial Institutions (OSFI). OSFI is the prudential regulator and supervisor for federally regulated financial institutions in Canada. Results from the review will be used to strengthen and enhance BDC’s management of risk.
Management’s Discussion and Analysis | Risk Management
BDC AR15 | 44

SIGNIFICANT ACCOUNTING POLICIES BDC’s significant accounting policies are described in Note 3 to the Consolidated Financial Statements. Certain of these policies, as well as estimates and assumptions made in applying such policies, are considered critical, as they require significant judgements by management. BDC has established control procedures, including formal representations and certification by senior officers, to ensure that accounting policies, estimates and assumptions are reviewed and applied consistently from period to period.
FUTURE CHANGES IN ACCOUNTING POLICIES The final version of IFRS 9, Financial Instruments, was published on July 24, 2014. IFRS 9 is effective for our fiscal year beginning on April 1, 2018. As a result, it has not been applied in preparing our Fiscal 2015 Consolidated Financial Statements.
On May 28, 2014, the final version of IFRS 15, Revenue from Contracts with Customers, was published. The new standard is effective for our fiscal year beginning on April 1, 2017. As a result, it has not been applied in preparing our Fiscal 2015 Consolidated Financial Statements.
Information on IFRS 9 and IFRS 15 is provided in Note 4 to the Consolidated Financial Statements.
JUDGEMENTS, ESTIMATES AND ASSUMPTIONS BDC’s significant accounting judgements, estimates and assumptions are described in Note 5 to the Consolidated Financial Statements. Critical accounting estimates that have the most significant effect on the amounts recognized in the Consolidated Financial Statements include those related to the allowance for credit losses, the fair value of financial instruments, qualifying hedge relationships, post-employment benefits, impairment of available-for-sale assets and consolidation.
CONTROLS AND PROCEDURESManagement is responsible for establishing and maintaining adequate internal control over financial reporting, as well as appropriate disclosure controls and procedures.
Internal control over financial reporting is designed to provide reasonable assurance regarding the reliability of financial reporting and of financial statements prepared for external purposes in accordance with IFRS. However, because of its inherent limitations, internal control over financial reporting may not prevent or detect misstatements.
Disclosure controls and procedures are designed to provide reasonable assurance that all relevant information is gathered and reported to senior management on a timely basis so that BDC can make appropriate decisions about public disclosure.
BDC has a certification regime to evaluate the design and effectiveness of our internal control over financial reporting and our disclosure controls and procedures. This certification regime is based on the Internal Control—Integrated Framework issued by the Committee of Sponsoring Organizations of the Treadway Commission (COSO).
BDC is using the updated Internal Control Framework dated May 14, 2013.
BDC has reached the following conclusion regarding the design and effectiveness of internal control over financial reporting:
As of March 31, 2015, certifying officers evaluated the design and effectiveness of internal control over financial reporting. Based on the results of the evaluation, they concluded that internal control over financial reporting is adequately designed and operates effectively to provide reasonable assurance about the reliability of financial reporting and of financial statements prepared in accordance with IFRS.
BDC has reached the following conclusion regarding the design and effectiveness of disclosure controls and procedures:
As of March 31, 2015, certifying officers evaluated the design and effectiveness of disclosure controls and procedures. Based on the results of the evaluation, they concluded that disclosure controls and procedures are adequately designed and operate effectively to provide reasonable assurance that material information disclosed is recorded, processed, summarized and presented within the requested timeframe, and that it is communicated to management on a timely basis for decision-making purposes.
5. Accounting and Control Matters
BDC AR15 | 45

BDC AR15 | 46

Consolidated Financial Statements
Management’s Responsibility for Financial Information 48Independent Auditors’ Report 49Consolidated Statement of Financial Position 50Consolidated Statement of Income 51Consolidated Statement of Comprehensive Income 52Consolidated Statement of Changes in Equity 53Consolidated Statement of Cash Flows 54Notes to the Consolidated Financial Statements 55
BDC AR15 | 47
The Consolidated Financial Statements of the Business Development Bank of Canada (BDC) were prepared and presented by management in accordance with International Financial Reporting Standards. The information contained therein normally includes amounts requiring estimations that have been made based upon informed judgement as to the expected results of current transactions and events. The financial information presented elsewhere in this annual report is consistent with the Consolidated Financial Statements.
In discharging its responsibility for the integrity, fairness and quality of the Consolidated Financial Statements and for the accounting systems from which they are derived, management maintains a system of internal control designed to provide reasonable assurance that transactions are authorized, assets are safeguarded and proper records are maintained. BDC has a certification regime to evaluate the design and effectiveness of its internal control over financial reporting and its disclosure controls and procedures. This certification regime is based on the Internal Control—Integrated Framework issued by the Committee of Sponsoring Organizations of the Treadway Commission (COSO). Refer to the Management’s Discussion and Analysis section of the annual report for additional information (p. 45).
The system of internal controls is supported by internal audit staff who conduct periodic reviews of different aspects of BDC’s operations. In addition, the Chief Audit Executive, Internal Audit and the external auditors have full and free access to the Audit Committee of the Board of Directors, which is responsible for overseeing and reviewing management’s internal control and reporting responsibilities. The Board of Directors, through the Audit Committee, which is entirely composed of independent directors, is responsible for reviewing and approving the audited annual Consolidated Financial Statements.
BDC’s independent auditors, Deloitte s.e.n.c.r.l., Chartered Professional Accountants, and the Auditor General of Canada have audited BDC’s Consolidated Financial Statements and their report indicates the scope of their audit and their opinion on the Consolidated Financial Statements.
Jean-René Halde President and Chief Executive Officer
Montreal, Canada June 10, 2015
Paul Buron, cpa, ca Executive Vice President and Chief Financial and Risk Officer (CFRO)
Consolidated Financial Statements
Management’s Responsibility for Financial Information
BDC AR15 | 48
Independent Auditors’ Report
Consolidated Financial Statements
To the Minister of Industry
Report on the Consolidated Financial StatementsWe have audited the accompanying consolidated financial statements of Business Development Bank of Canada, which comprise the consolidated statement of financial position as at 31 March 2015, and the consolidated statement of income, consolidated statement of comprehensive income, consolidated statement of changes in equity and consolidated statement of cash flows for the year then ended, and a summary of significant accounting policies and other explanatory information.
Management’s Responsibility for the Consolidated Financial StatementsManagement is responsible for the preparation and fair presentation of these consolidated financial statements in accordance with International Financial Reporting Standards, and for such internal control as management determines is necessary to enable the preparation of consolidated financial statements that are free from material misstatement, whether due to fraud or error.
Auditor’s ResponsibilityOur responsibility is to express an opinion on these consolidated financial statements based on our audit. We conducted our audit in accordance with Canadian generally accepted auditing standards. Those standards require that we comply with ethical requirements and plan and perform the audit to obtain reasonable assurance about whether the consolidated financial statements are free from material misstatement.
An audit involves performing procedures to obtain audit evidence about the amounts and disclosures in the consolidated financial statements. The procedures selected depend on the auditor’s judgment, including the assessment of the risks of material misstatement of the consolidated financial statements, whether due to fraud or error. In making those risk assessments, the auditor considers internal control relevant to the entity’s preparation and fair presentation of the consolidated financial statements in order to design audit procedures that are appropriate in the circumstances, but not for the purpose of expressing an opinion on the effectiveness of the entity’s internal control. An audit also includes evaluating the appropriateness of accounting policies used and the reasonableness of accounting estimates made by management, as well as evaluating the overall presentation of the consolidated financial statements.
We believe that the audit evidence we have obtained is sufficient and appropriate to provide a basis for our audit opinion.
OpinionIn our opinion, the consolidated financial statements present fairly, in all material respects, the financial position of Business Development Bank of Canada as at 31 March 2015, and its financial performance and its cash flows for the year then ended in accordance with International Financial Reporting Standards.
Other MatterThe consolidated financial statements of Business Development Bank of Canada for the year ended 31 March 2014 were audited by the Auditor General of Canada and another auditor who expressed an unmodified opinion on those consolidated statements on 11 June 2014.
Report on Other Legal and Regulatory RequirementsAs required by the Financial Administration Act, we report that, in our opinion, the accounting principles in International Financial Reporting Standards have been applied on a basis consistent with that of the preceding year.
Further, in our opinion, the transactions of Business Development Bank of Canada and its wholly-owned subsidiary that have come to our notice during our audit of the consolidated financial statements have, in all significant respects, been in accordance with Part X of the Financial Administration Act and regulations, the Business Development Bank of Canada Act, the charter and by-laws of the Business Development Bank of Canada and its wholly-owned subsidiary and the directives issued pursuant to Section 89 of the Financial Administration Act described in Notes 1 and 19 to the consolidated financial statements.
Maurice Laplante, CPA auditor, CAAssistant Auditor General for the Auditor General of Canada
10 June 2015 Montréal, Canada
1 CPA auditor, CA, public accountancy permit No. A116129
1
BDC AR15 | 49

(in thousands of Canadian dollars) Notes
March 31, 2015
March 31, 2014
ASSETS Cash and cash equivalents 7 667,084 676,529 Derivative assets 8 53,322 54,501 Loans and investments Asset-backed securities 9 407,731 336,477 Loans 10 18,414,044 17,241,064 Subordinate financing investments 11 642,810 576,677 Venture capital investments 12 709,639 495,096 Venture capital action plan investments 13 47,643 5,169 Total loans and investments 20,221,867 18,654,483 Property and equipment 14 24,435 26,418 Intangible assets 15 48,961 58,280 Net defined benefit asset 19 100,429 83,527 Other assets 16 12,919 16,219 Total assets 21,129,017 19,569,957
LIABILITIES AND EQUITYLiabilities Accounts payable and accrued liabilities 17 101,996 106,027 Derivative liabilities 8 7,515 10,706 Borrowings 18 Short-term notes 15,435,747 14,056,623 Long-term notes 548,709 775,340 Total borrowings 15,984,456 14,831,963 Net defined benefit liability 19 219,664 188,221 Other liabilities 20 36,266 42,991 Total liabilities 16,349,897 15,179,908
Equity Share capital 21 2,138,400 2,138,400 Contributed surplus 27,778 27,778 Retained earnings 2,570,454 2,167,279 Accumulated other comprehensive income 7,934 5,453 Equity attributable to BDC’s shareholder 4,744,566 4,338,910 Non-controlling interests 34,554 51,139 Total equity 4,779,120 4,390,049 Total liabilities and equity 21,129,017 19,569,957
Guarantees and contingent liabilities (Note 26) Commitments (Note 27)
The accompanying notes are an integral part of these Consolidated Financial Statements.
Brian Hayward Jean-René HaldeDirector Director Chairperson, Audit Committee President and Chief Executive Officer
Consolidated Financial Statements
Consolidated Statement of Financial Position
BDC AR15 | 50

For the year ended March 31 (in thousands of Canadian dollars)
2015 2014
Interest income 1,070,441 1,020,165 Interest expense 127,166 132,813 Net interest income 943,275 887,352 Net realized gains (losses) on investments (35,064) (24,885) Consulting revenue 17,044 21,684 Fee and other income 43,767 41,394 Net realized gains (losses) on other financial instruments (5,285) (8,031) Net revenue 963,737 917,514 Provision for credit losses (95,923) (72,881) Net change in unrealized appreciation (depreciation) of investments 37,217 3,201 Net unrealized foreign exchange gains (losses) on investments 27,974 14,584 Net unrealized gains (losses) on other financial instruments (2,076) (1,043) Income before operating and administrative expenses 930,929 861,375 Salaries and benefits 303,527 293,677 Premises and equipment 46,171 40,611 Other expenses 90,541 94,475 Operating and administrative expenses 440,239 428,763 Net income 490,690 432,612
Net income attributable to: BDC’s shareholder 490,516 425,968 Non-controlling interests 174 6,644 Net income 490,690 432,612
The accompanying notes are an integral part of these Consolidated Financial Statements. Note 24 provides additional information on the Consolidated Statement of Income and Note 25 provides segmented information.
Consolidated Financial Statements
Consolidated Statement of Income
BDC AR15 | 51

For the year ended March 31 (in thousands of Canadian dollars)
2015 2014
Net income 490,690 432,612
Other comprehensive income (loss) Items that may be reclassified subsequently to net income Net change in unrealized gains (losses) on available-for-sale assets 1,740 290
Net unrealized gains (losses) on cash flow hedges 1,155 (2,169) Reclassification to net income of losses (gains) on cash flow hedges (414) (1,236) Net change in unrealized gains (losses) on cash flow hedges 741 (3,405)
Total items that may be reclassified subsequently to net income 2,481 (3,115)
Items that will not be reclassified to net income Remeasurements of net defined benefit asset or liability (32,728) 52,748 Other comprehensive income (loss) (30,247) 49,633
Total comprehensive income 460,443 482,245
Total comprehensive income attributable to: BDC’s shareholder 460,269 475,601 Non-controlling interests 174 6,644 Total comprehensive income 460,443 482,245
The accompanying notes are an integral part of these Consolidated Financial Statements.
Consolidated Financial Statements
Consolidated Statement of Comprehensive Income
BDC AR15 | 52

Consolidated Statement of Changes in Equity
Consolidated Financial Statements
For the year ended March 31 (in thousands of Canadian dollars) Accumulated other comprehensive income (loss) Equity attributable to BDC’s shareholder
Non- controlling interests
Total equity
Share capital
Contributedsurplus
Retained earnings
Available- for-sale assets
Cash flowhedges Total
Balance as at March 31, 2014 2,138,400 27,778 2,167,279 2,207 3,246 5,453 4,338,910 51,139 4,390,049
Total comprehensive income
Net income 490,516 490,516 174 490,690
Other comprehensive income (loss) Net change in unrealized gains (losses) on available-for-sale assets 1,740 1,740 1,740 1,740 Net change in unrealized gains (losses) on cash flow hedges 741 741 741 741 Remeasurements of net defined benefit asset or liability (32,728) (32,728) (32,728) Other comprehensive income (loss) – – (32,728) 1,740 741 2,481 (30,247) – (30,247)
Total comprehensive income – – 457,788 1,740 741 2,481 460,269 174 460,443
Dividends on common shares (54,613) (54,613) (54,613)Distributions to non-controlling interests (20,163) (20,163)Capital injections from non-controlling interests 3,404 3,404 Transactions with owner, recorded directly in equity – – (54,613) – – – (54,613) (16,759) (71,372)
Balance as at March 31, 2015 2,138,400 27,778 2,570,454 3,947 3,987 7,934 4,744,566 34,554 4,779,120
Contributedsurplus
Accumulated other comprehensive income (loss) Equity attributable to BDC’s shareholder
Non- controlling interests
Total equity
Share capital
Retained earnings
Available- for-sale assets
Cash flowhedges Total
Balance as at March 31, 2013 2,088,400 27,778 1,748,156 1,917 6,651 8,568 3,872,902 82,773 3,955,675
Total comprehensive income
Net income 425,968 425,968 6,644 432,612
Other comprehensive income (loss) Net change in unrealized gains (losses) on available-for-sale assets 290 290 290 290 Net change in unrealized gains (losses) on cash flow hedges (3,405) (3,405) (3,405) (3,405) Remeasurements of net defined benefit asset or liability 52,748 52,748 52,748 Other comprehensive income (loss) – – 52,748 290 (3,405) (3,115) 49,633 – 49,633
Total comprehensive income – – 478,716 290 (3,405) (3,115) 475,601 6,644 482,245
Dividends on common shares (59,593) (59,593) (59,593)Distributions to non-controlling interests (41,232) (41,232)Capital injections from non-controlling interests 2,954 2,954 Issuance of common shares 50,000 50,000 50,000 Transactions with owner, recorded directly in equity 50,000 – (59,593) – – – (9,593) (38,278) (47,871)
Balance as at March 31, 2014 2,138,400 27,778 2,167,279 2,207 3,246 5,453 4,338,910 51,139 4,390,049
The accompanying notes are an integral part of these Consolidated Financial Statements.
BDC AR15 | 53
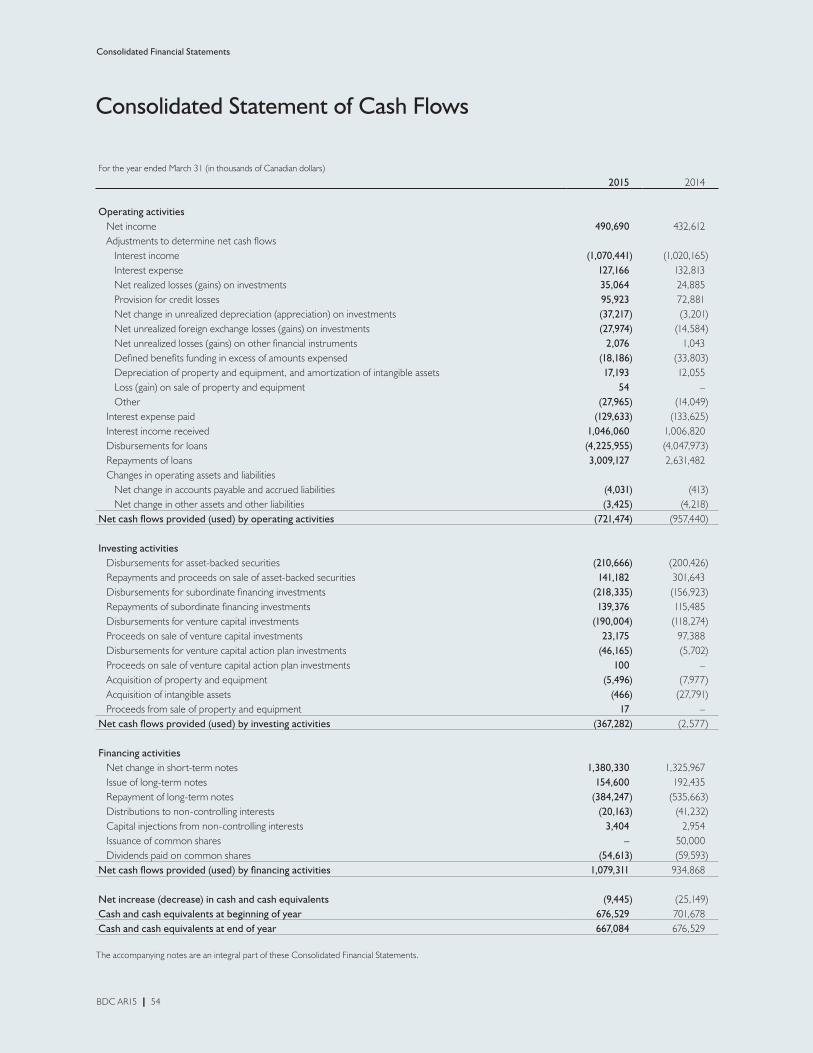
Consolidated Financial Statements
Consolidated Statement of Cash Flows
For the year ended March 31 (in thousands of Canadian dollars)
2015 2014
Operating activities Net income 490,690 432,612 Adjustments to determine net cash flows Interest income (1,070,441) (1,020,165) Interest expense 127,166 132,813 Net realized losses (gains) on investments 35,064 24,885 Provision for credit losses 95,923 72,881 Net change in unrealized depreciation (appreciation) on investments (37,217) (3,201) Net unrealized foreign exchange losses (gains) on investments (27,974) (14,584) Net unrealized losses (gains) on other financial instruments 2,076 1,043 Defined benefits funding in excess of amounts expensed (18,186) (33,803) Depreciation of property and equipment, and amortization of intangible assets 17,193 12,055 Loss (gain) on sale of property and equipment 54 – Other (27,965) (14,049) Interest expense paid (129,633) (133,625) Interest income received 1,046,060 1,006,820 Disbursements for loans (4,225,955) (4,047,973) Repayments of loans 3,009,127 2,631,482 Changes in operating assets and liabilities Net change in accounts payable and accrued liabilities (4,031) (413) Net change in other assets and other liabilities (3,425) (4,218)Net cash flows provided (used) by operating activities (721,474) (957,440)
Investing activities Disbursements for asset-backed securities (210,666) (200,426) Repayments and proceeds on sale of asset-backed securities 141,182 301,643 Disbursements for subordinate financing investments (218,335) (156,923) Repayments of subordinate financing investments 139,376 115,485 Disbursements for venture capital investments (190,004) (118,274) Proceeds on sale of venture capital investments 23,175 97,388 Disbursements for venture capital action plan investments (46,165) (5,702) Proceeds on sale of venture capital action plan investments 100 – Acquisition of property and equipment (5,496) (7,977) Acquisition of intangible assets (466) (27,791) Proceeds from sale of property and equipment 17 –Net cash flows provided (used) by investing activities (367,282) (2,577)
Financing activities Net change in short-term notes 1,380,330 1,325,967 Issue of long-term notes 154,600 192,435 Repayment of long-term notes (384,247) (535,663) Distributions to non-controlling interests (20,163) (41,232) Capital injections from non-controlling interests 3,404 2,954 Issuance of common shares – 50,000 Dividends paid on common shares (54,613) (59,593)Net cash flows provided (used) by financing activities 1,079,311 934,868
Net increase (decrease) in cash and cash equivalents (9,445) (25,149)Cash and cash equivalents at beginning of year 676,529 701,678 Cash and cash equivalents at end of year 667,084 676,529
The accompanying notes are an integral part of these Consolidated Financial Statements.
BDC AR15 | 54
1.ACT OF INCORPORATION, OBJECTIVES AND OPERATIONS OF THE CORPORATION
The Business Development Bank of Canada is a Crown corporation that was established by an Act of Parliament on December 20, 1974, as the Federal Business Development Bank and continued under its current name by an Act of Parliament that was enacted on July 13, 1995. The Business Development Bank of Canada is incorporated in Canada and wholly owned by the Government of Canada. The Corporation’s head office is located at 5 Place Ville Marie, Suite 400, Montreal, Quebec, Canada.
The objectives of the Business Development Bank of Canada and its subsidiaries (together, BDC) are to promote and assist in the establishment and development of business enterprises in Canada, with a focus on small and medium-sized enterprises, by providing a range of complementary lending, investment and consulting services. BDC offers Canadian companies services tailored to meet their current needs while earning an appropriate return on equity, which is used to further BDC’s activities.
BDC does not receive appropriations from the Government of Canada. To finance its objectives, BDC borrows funds from Her Majesty the Queen in Right of Canada acting through the Minister of Finance. Prior to April 21, 2008, BDC issued debt instruments, which were secured by the Government of Canada. The Business Development Bank of Canada Act (BDC Act) also allows the use of hybrid capital instruments to provide the capital required for its operations. The Crown would not be liable for payment of amounts owing under such capital instruments, none of which were outstanding as at March 31, 2015, and March 31, 2014.
BDC is for all purposes an agent of Her Majesty the Queen in Right of Canada. BDC is also named in Part I of Schedule III to the Financial Administration Act (FAA) and is accountable for its affairs to Parliament through the Minister of Industry. Pursuant to section 89 of the FAA, BDC, together with a number of other Crown corporations, has to comply with a directive issued in 2008 to ensure that Crown corporations give due consideration to the personal integrity of those they lend to or provide benefits to, in accordance with the government’s policy to improve the accountability and integrity of federal institutions. In fiscal 2009, BDC completed the implementation of the requirements of section 89 and confirms that the directive has been met since then.
2.BASIS OF PREPARATION
STATEMENT OF COMPLIANCE
BDC has prepared its Consolidated Financial Statements in accordance with International Financial Reporting Standards (IFRS). These Consolidated Financial Statements were approved for issue by the Board of Directors on June 10, 2015.
BASIS OF PRESENTATION AND MEASUREMENT
The Consolidated Financial Statements have been prepared on a historical cost basis, except for the following:
> available-for-sale financial assets, financial assets and financial liabilities at fair value through profit or loss, and derivative financial instruments have been measured at fair value; and
> the net defined benefit asset or liability in respect of post-employment benefits has been recognized as the present value of the defined benefit obligation less the fair value of the plans’ assets.
These Consolidated Financial Statements are presented in Canadian dollars, which is BDC’s functional currency as well as the functional currency of its subsidiaries. Unless otherwise specified, the figures presented in the Consolidated Financial Statements are stated in thousands of Canadian dollars.
Notes to the Consolidated Financial StatementsFor the year ended March 31, 2015(in thousands of Canadian dollars)
BDC AR15 | 55

2. BASIS OF PREPARATION (continued)
BASIS OF CONSOLIDATION
BDC conducts business through a variety of entities, including a wholly owned subsidiary, and several investment funds and other entities that are considered to be subsidiaries for financial reporting purposes.
The Consolidated Financial Statements of BDC comprise the financial statements of the parent entity and the consolidated financial statements of the subsidiaries referred to above as of March 31, 2015 and March 31, 2014. The financial statements of the subsidiaries are prepared using uniform accounting policies and valuation methods for similar transactions.
SUBSIDIARIES
For financial reporting purposes, subsidiaries are defined as entities controlled by BDC. BDC controls an entity when it is exposed to, or has rights to, variable returns from its involvement with the entity and has the ability to affect those returns through its power over the entity. Control is presumed when BDC directly or indirectly holds the majority of the voting rights. The existence and effect of potential voting rights are considered when assessing whether BDC controls another entity.
In instances where BDC does not hold a majority of the voting rights, further analysis is performed to determine whether or not BDC has control of the entity. BDC is deemed to have control when, according to the terms of the shareholder’s and/or limited partnership agreements, it makes most of the decisions affecting relevant activities.
Subsidiaries are fully consolidated from the date that control begins until the date that control ceases. No subsidiary has been acquired or disposed of during the reporting periods. Intercompany transactions and balances are eliminated upon consolidation.
The following entities have been consolidated in BDC’s Consolidated Financial Statements.
Entity Principal activity
Country of incorporation and residence
Proportion of ownership and voting power held Basis of control
BDC Capital Inc. Holding company structure
for investment activitiesCanada 100% Voting power
AlterInvest Investment Fund Inc. Investments in subordinate financing
Canada 50% Voting power and contractual agreements
AlterInvest Fund L.P. Investments in subordinate financing
Canada 50% Voting power and contractual agreements
AlterInvest II Fund L.P. Investments in subordinate financing
Canada 50% Voting power and contractual agreements
Go Capital L.P. Investments in venture capital
Canada 20% Voting power and contractual agreements
GO CAPITAL L.P.
Although BDC owns less than half of Go Capital L.P. and holds less than half of the voting power, management has determined, based on the terms of the agreement under which Go Capital L.P. was established, that BDC controls this entity. As the general partner, BDC has the current ability to direct the relevant activities of Go Capital L.P. and has the power to affect the variable returns, to which BDC is exposed.
Go Capital L.P.’s year-end date is December 31, as agreed upon by the partners at the time this entity was established. Consequently, additional financial information regarding this entity is prepared for the interim period for the purposes of consolidation.
Notes to the Consolidated Financial StatementsFor the year ended March 31, 2015(in thousands of Canadian dollars)
BDC AR15 | 56

2. BASIS OF PREPARATION (continued)
ALTERINVEST II FUND L.P.
During fiscal 2014, having reached the end of their intended lives, AlterInvest Fund L.P. and AlterInvest Investment Fund Inc. began liquidating their investments. Those investments that were not reimbursed by their respective clients were transferred into AlterInvest II Fund L.P. As each partner has equal interest in all of the funds, their partnership interest in AlterInvest II Fund L.P. did not change as a result of these transactions. During fiscal 2015, all investments were fully liquidated, and these entities will be dissolved.
As at March 31, 2014, the total fair value of investments transferred to AlterInvest II Fund L.P. was $5.6 million (cost $7.7 million), calculated as per the fair value methodology described in Note 3—Significant Accounting Policies. These transactions were non-cash and had no impact on profit or loss.
During fiscal 2015, there were no investments transferred to AlterInvest II Fund L.P.
NON-CONTROLLING INTERESTS
Interests in the equity of subsidiaries not attributable to the parent entity are reported in consolidated equity as non-controlling interests. Net income and each component of other comprehensive income are attributed to BDC’s shareholder and to non-controlling interests in accordance with their respective shareholdings, even if this results in the non-controlling interests having a deficit balance.
ASSOCIATES
Associates are those entities in which BDC has significant influence, but not control, over the financial and operating policies. Subordinate financing and venture capital investments in associates that are held as part of BDC’s investment portfolio by BDC Capital Inc. are carried in the Consolidated Statement of Financial Position at fair value. This treatment is permitted by International Accounting Standard (IAS) 28, Investments in Associates, which permits investments in an associate held by an entity that is a venture capital organization or other similar entity to elect to measure these investments at fair value through profit or loss in accordance with IAS 39, Financial Instruments: Recognition and Measurement.
3.SIGNIFICANT ACCOUNTING POLICIES
The principal accounting policies applied in the preparation of these Consolidated Financial Statements are set out below. These policies have been consistently applied to all periods presented in these Consolidated Financial Statements and have been applied consistently by all entities consolidated by BDC.
FINANCIAL INSTRUMENTS
RECOGNITION AND MEASUREMENT OF FINANCIAL INSTRUMENTSFinancial assets and financial liabilities are recognized when BDC becomes party to the contractual provisions of the financial instrument.
Financial assets are derecognized when the contractual rights to the cash flows from the financial asset expire, or when the financial asset and all substantial risks and rewards are transferred. A financial liability is derecognized when the related contractual obligation is extinguished, discharged or cancelled, or when it expires.
Financial instruments are recognized and derecognized using settlement date accounting.
On initial recognition, financial instruments are measured at fair value. Fair value on initial recognition includes transaction costs directly attributable to the acquisition or issue of financial instruments, except for financial instruments carried at fair value through profit or loss, for which transaction costs are recognized in net income in the period when they are incurred.
Notes to the Consolidated Financial StatementsFor the year ended March 31, 2015(in thousands of Canadian dollars)
BDC AR15 | 57

3. SIGNIFICANT ACCOUNTING POLICIES (continued)
FINANCIAL INSTRUMENTS (continued)
RECOGNITION AND MEASUREMENT OF FINANCIAL INSTRUMENTS (continued)
Financial instruments are measured in subsequent periods either at fair value or at amortized cost using the effective interest rate method, depending on the financial instrument classification.
The effective interest rate is the rate that exactly discounts the estimated future cash payments and receipts through the expected life of the financial asset or liability to its carrying amount. When calculating the effective interest rate, BDC estimates future cash flows, considering all contractual terms of the financial instrument.
CLASSIFICATION OF FINANCIAL INSTRUMENTSFair value through profit or lossFinancial instruments carried at fair value through profit or loss include financial instruments that are either (i) classified as held-for-trading, or (ii) designated as at fair value through profit or loss upon initial recognition if they meet certain conditions.
Financial instruments classified as held-for-tradingA financial instrument is classified as held-for-trading if:
> it is acquired or incurred principally for the purpose of selling or repurchasing instruments in the near term; or
> at initial recognition, it is part of a portfolio of identified financial instruments that are managed together and for which there is evidence of a recent actual pattern of short-term profit-taking.
Derivative financial instruments are also classified as held-for-trading unless they are designated as hedging instruments.
Financial instruments designated as at fair value through profit or lossA financial instrument can be designated as at fair value through profit or loss in the following circumstances:
> the asset or liability is managed, evaluated and reported internally on a fair value basis;
> the designation eliminates or significantly reduces an accounting mismatch that would otherwise arise; or
> the asset or liability contains an embedded derivative that is separable and significantly modifies the cash flows that would otherwise be required under the contract.
A description of the basis for each designation is set out in the major types of financial instruments section of this note.
Subsequent to initial recognition, financial instruments classified or designated as at fair value through profit or loss are measured at fair value with the variation of unrealized gains or losses being recognized in the Consolidated Statement of Income as:
> net change in unrealized appreciation or depreciation of investments, or net unrealized foreign exchange gains or losses on investments, when related to asset-backed securities, subordinate financing, venture capital investments and venture capital action plan investments; or
> net unrealized gains or losses on other financial instruments when related to derivatives and borrowings.
Gains and losses upon the sale, disposal or write-off of these financial instruments are included directly in the Consolidated Statement of Income and are reported as:
> net realized gains or losses on investments when related to asset-backed securities, subordinate financing, venture capital investments and venture capital action plan investments; or
> net realized gains or losses on other financial instruments when related to derivatives and borrowings.
Notes to the Consolidated Financial StatementsFor the year ended March 31, 2015(in thousands of Canadian dollars)
BDC AR15 | 58
3. SIGNIFICANT ACCOUNTING POLICIES (continued)
FINANCIAL INSTRUMENTS (continued)
CLASSIFICATION OF FINANCIAL INSTRUMENTS (continued)
Available-for-sale financial assetsAvailable-for-sale assets are non-derivative financial assets that are:
> intended to be held for an indefinite period of time and that may be sold in response to needs for liquidity, or changes in interest rates, exchange rates or equity prices; and
> not classified as loans and receivables, held-to-maturity investments or financial assets at fair value through profit or loss.
Subsequent to initial recognition, available-for-sale assets are measured at fair value, with unrealized gains and losses recorded in other comprehensive income (OCI) until the asset is derecognized, with the exception of impairment losses, which are recorded in the Consolidated Statement of Income during the period in which the asset is determined to have become impaired.
Upon disposal of available-for-sale assets, the accumulated fair value adjustments recognized in OCI are reclassified to the Consolidated Statement of Income and are reported as net realized gains or losses on investments.
Cash flow hedgesBDC designates certain derivatives held for risk management as cash flow hedges. BDC documents all hedging relationships and its risk management objectives, along with its strategy for carrying out the hedge transactions. BDC assesses whether the derivatives used in hedging transactions are highly effective in offsetting changes in cash flow of hedged items, both at inception and over the life of the hedge.
Subsequent to initial recognition, derivatives designated as cash flow hedges are measured at fair value. The effective portion of changes in fair value of these derivatives is recognized in OCI and accumulated other comprehensive income (AOCI), while changes related to the ineffective portion are recorded in the Consolidated Statement of Income as net unrealized gains or losses on other financial instruments. Amounts in AOCI are recycled to the Consolidated Statement of Income in the periods where the hedged items affect net income. They are recorded in the financial statement lines associated with the related hedged items.
If these hedging instruments expire, are sold or no longer meet the criteria for hedge accounting, the amounts previously recognized in OCI are reclassified to the Consolidated Statement of Income as net realized gains or losses on other financial instruments during the periods when the variability in the cash flows of the hedged item affects net income. However, if a forecasted transaction is no longer expected to occur, the cumulative gain or loss that was reported in equity is immediately transferred to the Consolidated Statement of Income under net realized gains or losses on other financial instruments.
Loans and receivablesLoans and receivables are non-derivative financial assets with fixed or determinable payments that are not quoted in an active market. Subsequent to initial recognition, loans and receivables are measured at amortized cost using the effective interest rate method.
Financial liabilities measured at amortized costFinancial liabilities that are not carried at fair value through profit or loss fall into the financial liabilities category and are measured subsequently at amortized cost using the effective interest rate method.
Notes to the Consolidated Financial StatementsFor the year ended March 31, 2015(in thousands of Canadian dollars)
BDC AR15 | 59

3. SIGNIFICANT ACCOUNTING POLICIES (continued)
FINANCIAL INSTRUMENTS (continued)
MAJOR TYPES OF FINANCIAL INSTRUMENTSCash equivalentsCash equivalents include short-term bank notes that, at the original acquisition date, have maturities of less than three months and are used to manage liquidity risk.
Cash equivalents have been classified as loans and receivables.
Asset-backed securitiesThe asset-backed securities (ABS) portfolio consists of investment-grade senior and subordinated notes issued by way of prospectus or private placement.
Investment-grade senior ABS are classified as available-for-sale assets and subordinated ABS notes are designated as at fair value through profit or loss on the basis that they are reported to and evaluated by senior management on a fair value basis. ABS presented on the Consolidated Statement of Financial Position include accrued interest receivable.
The fair value of ABS is calculated using forecasted cash flows and an estimated yield curve that is derived from the Canadian government yield curve and ABS spread for comparable transactions. The result is adjusted to reflect the risk of the underlying assets and deal structure.
A loss or gain on initial recognition of ABS is recorded if there is a difference between the security’s yield and the market-demanded yield for similar investments. This loss or gain is deferred and amortized over the life of the security using the effective interest rate method and recognized in interest income.
Impairment of asset-backed securitiesAt each reporting date, BDC reviews ABS classified as available-for-sale for possible impairments or reversals of previously recognized impairments. BDC determines that ABS are impaired when there is objective evidence of impairment as a result of one or more events that occurred after the initial recognition of the asset and when that loss event (or events) has an impact on the estimated future cash flows of the financial asset or group of financial assets that can be reliably estimated. Refer to Note 5—Significant Accounting Judgements, Estimates and Assumptions, for more information regarding the criteria used to determine whether an impairment has occurred.
Impairment losses and reversals of impairment losses are recognized in the Consolidated Statement of Income during the period in which objective evidence of impairment or reversal of impairment is identified.
LoansLoans are classified as loans and receivables. They are measured at amortized cost using the effective interest rate method, less allowance for credit losses. Loans presented on the Consolidated Statement of Financial Position include accrued interest receivable.
Allowance for credit lossesThe allowance for credit losses is maintained at a level considered adequate to absorb the credit losses existing in the portfolio at the financial reporting date. Allowances for credit losses are established at both the individual and collective levels.
BDC reviews its loan portfolio on an individual asset basis to assess credit risk and determines whether there is any objective evidence of impairment for which a loss should be recognized in the Consolidated Statement of Income. For BDC, there is objective evidence of impairment when the interest or principal of the loan is more than three consecutive months in arrears or if there is reason to believe that a portion of the principal or interest cannot be collected.
Notes to the Consolidated Financial StatementsFor the year ended March 31, 2015(in thousands of Canadian dollars)
BDC AR15 | 60

3. SIGNIFICANT ACCOUNTING POLICIES (continued)
FINANCIAL INSTRUMENTS (continued)
MAJOR TYPES OF FINANCIAL INSTRUMENTS (continued)
Loans (continued)
Allowance for credit losses (continued)
When a loan is deemed impaired, interest accrual recognition ceases and the carrying amount of the loan is reduced to the present value of its estimated future cash flows discounted using (i) the initial effective interest rate of the loan for fixed rate loans or (ii) the rate at time of impairment for floating rate loans. If cash flows cannot be reasonably determined, the estimated fair value of any underlying collateral is used, whether or not foreclosure is probable.
The carrying amounts of impaired loans are first reduced through the use of an allowance account, and then written off if and when all collection efforts have been exhausted and no further prospect of recovery is likely. The amounts of the initial impairment losses, as well as any subsequent increases or reversals of these impairment losses, are recognized in the provision for credit losses in the Consolidated Statement of Income.
Loans for which an individual allowance has not been established are then included in groups of assets having similar credit risk characteristics and collectively assessed for any impairment that has been incurred but not yet identified.
Refer to Note 5—Significant Accounting Judgements, Estimates and Assumptions, for more information regarding the criteria used to determine the amount of the allowance.
Subordinate financing, venture capital and venture capital action plan investmentsUpon initial recognition, subordinate financing, venture capital and venture capital action plan (VCAP) investments are designated as at fair value through profit or loss on the basis that they are part of a portfolio that is reported to and evaluated by senior management on a fair value basis, in accordance with a documented investment and risk management strategy.
BDC’s valuation process for fair value measurement of subordinate financing, venture capital and VCAP investments has been derived from the International Private Equity and Venture Capital Valuation Guidelines. Based on the type of investments being valued, BDC uses (i) market-based methodologies, such as the quoted share price or the price of recent similar investments; (ii) discounted earnings or cash flow approaches; or (iii) liquidation or asset-based methods. These fair values are updated at least twice a year by internal valuators and are then reviewed by a valuation committee, which includes an external member who is a Chartered Business Valuator. VCAP includes fund-of-fund transactions that provide for certain other limited partners to receive a preferred return on the initial cost of their investment, later timing of cash calls and preference in the distributions. The impact of these terms and conditions is taken into account in the fair value calculation by applying an adjustment to the attributed net asset value of each fund.
BorrowingsShort-term notes are measured at amortized cost.
BDC has two types of long-term notes: unstructured and structured. Unstructured long-term notes are recorded at amortized cost. Structured notes are notes for which interest or principal, or both, are linked to fluctuations in equity indices, currency rates, swap rates and other market references. These structured notes have been designated as at fair value through profit or loss, as they contain embedded derivatives that would otherwise need to be separated, given that they significantly modify the cash flows required under the host debt contract.
The fair value of structured notes is determined by using observable market data together with recognized valuation techniques. Observable market data are sourced from leading inter-dealer brokers and include interest rates, foreign exchange rates, equity prices and other market references.
Interest accrued on borrowings is included in the carrying amount of both short- and long-term notes.
Notes to the Consolidated Financial StatementsFor the year ended March 31, 2015(in thousands of Canadian dollars)
BDC AR15 | 61
3. SIGNIFICANT ACCOUNTING POLICIES (continued)
FINANCIAL INSTRUMENTS (continued)
MAJOR TYPES OF FINANCIAL INSTRUMENTS (continued)
DerivativesDerivative financial instruments are financial contracts that derive their value from underlying changes in interest rates, foreign exchange rates, stock market indices, commodity prices or other financial instrument measures. BDC acquires derivative financial instruments to manage exposures to interest, currency and other market risks. BDC does not hold derivatives for speculative or trading purposes. Derivatives are either designated as cash flow hedges or classified as held-for-trading.
All BDC derivatives are over-the-counter and are mainly composed of swaps and foreign exchange forwards. The fair value of swaps is determined using pricing models that take into account current market and contractual prices of the underlying instrument, as well as time value, the yield curve, or volatility factors underlying the position and embedded options. The fair value of foreign exchange forwards is calculated by discounting the notional amount using the yield curves of the respective currencies. Inputs to both these calculations are market-observable data sourced from leading inter-dealer brokers, together with industry-standard valuation models for estimating fair value.
Embedded derivatives that are not closely related to the host contract must be separated and classified as held-for-trading financial instruments, unless the hybrid instrument is designated as at fair value through profit or loss. As at March 31, 2015, and March 31, 2014, BDC had no embedded derivatives that needed to be separated from a host contract.
INTEREST INCOME, INTEREST EXPENSE AND FEE INCOME
Interest income and expense for interest-bearing financial instruments are recognized in interest income and interest expense in the Consolidated Statement of Income using the effective interest rate method, with the exception of subordinate financing investments, for which interest income is recognized using the contractual rate of the instrument. Interest on impaired loans continues to be recognized based on the reduced carrying amount using the interest rate used to discount the future cash flows for the purposes of measuring the impairment loss.
Subordinate financing investments also bear non-interest returns, such as royalties and interest bonuses, which are recognized in fee and other income in the Consolidated Statement of Income when it is probable that they will be received and the amounts can be measured reliably.
Fees that are integral to originating or renegotiating a loan are deferred and recognized as interest income over the expected term of the loan using the effective interest rate method. All other fees are recognized in net income as the related services are performed.
Premiums and discounts on borrowings are amortized in interest expense over the life of the obligation using the effective interest rate.
CONSULTING REVENUE
Consulting provides advisory services to entrepreneurs. Consulting revenues are recognized as revenue when the services are rendered.
Notes to the Consolidated Financial StatementsFor the year ended March 31, 2015(in thousands of Canadian dollars)
BDC AR15 | 62

3. SIGNIFICANT ACCOUNTING POLICIES (continued)
PROPERTY AND EQUIPMENT AND INTANGIBLE ASSETS
Property and equipment and intangible assets are carried at cost less accumulated depreciation, accumulated amortization and accumulated impairment losses, if any.
The cost of an item of property and equipment includes its purchase price and any costs directly attributable to bringing the asset to the location and condition necessary for it to operate in the manner intended by management.
Property and equipment are depreciated using the straight-line method over the estimated useful life of the asset, as follows:
> computer and telecommunications equipment 4 years > furniture, fixtures and equipment 10 years > leasehold improvements lease term
Intangible assets primarily comprise systems and software applications, the cost of which includes the purchase price plus any costs incurred to prepare them for their intended internal use. The intangible assets’ lives are finite and are amortized using the straight-line method over their estimated useful economic lives, which range from three to seven years. Costs related to projects in progress are not subject to amortization until the related intangible asset is available for use. The amortization expense is included in the premises and equipment expense in the Consolidated Statement of Income.
The residual values, depreciation and amortization methods, as well as useful lives of items of property and equipment and intangible assets, are reviewed, and adjusted if appropriate, at least at each financial reporting date.
These assets are also reviewed for impairment whenever events or changes in circumstances indicate that the carrying amount may not be recoverable. Irrespective of whether there is any indication of impairment, an impairment test is also performed annually for projects in progress related to intangible assets. When impairment tests indicate that the carrying amount of an asset (or group of assets) is greater than its estimated recoverable amount, the carrying amount is written down immediately to its recoverable amount. The recoverable amount is the higher of the asset’s fair value less costs to sell and its value in use.
NET DEFINED BENEFIT ASSET OR LIABILITY
BDC maintains a registered defined benefit pension plan, supplemental defined benefit pension plans and other post-employment defined benefits (which include health, dental, critical illness and life insurance coverage) for eligible employees.
The net defined benefit asset or liability is the present value of the defined benefit obligation less the fair value of plan assets.
BDC’s defined benefit obligation in respect of retirement benefit plans is calculated separately for each plan by estimating the amount of future benefits employees have earned in return for their services in the current and prior periods.
The defined benefit obligation is calculated for each plan using the projected unit credit method. In determining the present value of its defined benefit obligation, and the related current service cost and past service cost, BDC attributes the benefit to periods of service under the plan’s benefit formula. The present value of the defined benefit obligation is calculated by discounting the estimated future cash outflows using interest rates of high-quality corporate and provincial bonds that have terms to maturity approximating the terms of the obligation.
BDC determines the net interest expense (income) on the net defined benefit asset or liability for the period by applying the discount rate used to measure the defined benefit obligation at the beginning of the annual reporting period to both the defined benefit obligation and the plan assets. When the benefits of a plan are changed, or when a plan is curtailed, the portion of the changed benefit related to past service by employees, or the gain or loss on curtailment, is recognized immediately in profit or loss when the plan amendment or curtailment occurs.
Remeasurements, which include actuarial gains and losses, as well as differences between the return on plan assets and interest income on plan assets, are recognized immediately in OCI. Remeasurements recognized in OCI are reflected immediately in retained earnings and are not reclassified to net income. Current service costs, past service costs, gain or loss on curtailment, and net interest on the net defined benefit asset or liability are recognized in net income.
Notes to the Consolidated Financial StatementsFor the year ended March 31, 2015(in thousands of Canadian dollars)
BDC AR15 | 63
3. SIGNIFICANT ACCOUNTING POLICIES (continued)
EQUITY ATTRIBUTABLE TO BDC’S SHAREHOLDER
Share capital represents the par value of common shares issued and in circulation. Contributed surplus represents the value of assets transferred to BDC by the shareholder without issuance of shares.
Unrealized gains and losses on financial instruments classified as available-for-sale assets are included in AOCI until such time as the financial instruments are derecognized or impaired, at which time these gains or losses are reclassified to net income. Unrealized gains and losses on derivative financial instruments designated as hedging instruments are included in AOCI until such time as the hedged forecasted cash flows are reclassified to net income.
Retained earnings include all current and prior periods’ net income and remeasurements of net defined benefit asset or liability, net of dividends paid.
TRANSLATION OF FOREIGN CURRENCIES
Assets and liabilities denominated in foreign currencies, all of which are monetary, are translated into Canadian dollars at exchange rates prevailing at the reporting date. Revenues and expenses denominated in foreign currencies are translated into Canadian dollars using the exchange rate at the date of each transaction. Foreign exchange gains and losses are included in net income.
SEGMENTED INFORMATION
BDC has the following operating segments, which are based on differences in products and services: Financing, Growth & Transition Capital, Venture Capital, Consulting, Securitization, and Venture Capital Action Plan.
The operating segments are reported in a manner consistent with the way BDC presents and discloses information that is regularly reviewed by the senior management team and the Board of Directors in assessing performance.
All transactions between business segments are recognized on an arm’s-length basis. Income and expenses directly associated with each segment are included in determining business segment performance.
4.FUTURE ACCOUNTING CHANGES
At the date of authorization of these financial statements, certain new standards, amendments and interpretations to existing standards had been published by the International Accounting Standards Board (IASB) but were not yet effective and had not been adopted early by BDC. These standards include IFRS 9, Financial Instruments and IFRS 15, Revenue from Contracts with Customers, described below. Certain other new standards and interpretations have been issued but are not expected to have a material impact on BDC’s financial statements.
IFRS 9, FINANCIAL INSTRUMENTSOn July 24, 2014, the IASB issued the final version of IFRS 9, Financial Instruments, bringing together the classification and measurement, impairment, and hedge accounting phases of the IASB’s project to replace IAS 39, Financial Instruments: Recognition and Measurement and all previous versions of IFRS 9. It amends classification and measurement of financial assets, adds new requirements for the accounting of financial liabilities and for general hedge accounting, and introduces a new expected loss impairment model. The IASB is continuing to work on its macro hedge accounting project. IFRS 9 is effective for annual periods beginning on or after January 1, 2018, and shall be applied retrospectively, subject to certain exceptions.
BDC is currently assessing the impact of the adoption of IFRS 9.
Notes to the Consolidated Financial StatementsFor the year ended March 31, 2015(in thousands of Canadian dollars)
BDC AR15 | 64
4. FUTURE ACCOUNTING CHANGES (continued)
IFRS 15, REVENUE FROM CONTRACTS WITH CUSTOMERSOn May 28, 2014, the IASB issued a new standard, IFRS 15, Revenue from Contracts with Customers, replacing IAS 18, Revenue. The new standard is effective for annual periods beginning on or after January 1, 2017. The core principle of the standard is that an entity will recognize revenue when it transfers promised goods or services to customers, in an amount that reflects the consideration to which the entity is expected to be entitled in exchange for those goods and services.
BDC is currently assessing the impact of the adoption of IFRS 15.
5.SIGNIFICANT ACCOUNTING JUDGEMENTS, ESTIMATES AND ASSUMPTIONS
Preparation of the Consolidated Financial Statements as per IFRS requires management to make judgements and use estimates and assumptions that affect the application of accounting policies and the reported amounts of assets, liabilities, income and expenses.
Significant changes in the underlying assumptions could result in significant changes to these estimates. Consequently, management reviews these assumptions regularly. Revisions to accounting estimates are recognized in the period in which the estimates are revised and in any future period affected.
Information about the significant judgements, estimates and assumptions that have the most significant effect on the amounts recognized in the Consolidated Financial Statements are summarized below.
ESTIMATES AND ASSUMPTIONS
ALLOWANCE FOR CREDIT LOSSESThe allowance for credit losses on loans represents management’s estimate of the losses incurred in the loan portfolio at the reporting date and is established at both the individual and collective asset levels.
BDC reviews its significant loans individually to assess whether an impairment loss should be recorded. The process requires BDC to make assumptions and judgements by carrying out certain activities, including assessing the impaired status and risk of a loan, and estimating future cash flows and collateral values.
Loans that have been assessed individually and found not to be impaired, and all other loans, are then collectively assessed for any impairment that has been incurred but not yet identified. In assessing collective impairment, BDC uses statistical modelling of historical portfolio trends, such as default rates and loss rates, adjusted to reflect management’s judgement as to whether current economic and credit conditions are such that the actual losses are likely to be greater or less than suggested by historical modelling.
Changes in these assumptions, or the use of other reasonable judgements, can materially affect the allowance level. Refer to Note 10—Loans, for more information on the allowance for credit losses.
Notes to the Consolidated Financial StatementsFor the year ended March 31, 2015(in thousands of Canadian dollars)
BDC AR15 | 65
5. SIGNIFICANT ACCOUNTING JUDGEMENTS, ESTIMATES AND ASSUMPTIONS (continued)
ESTIMATES AND ASSUMPTIONS (continued)
FAIR VALUE OF FINANCIAL INSTRUMENTSWhere the fair value of financial assets and financial liabilities recorded in the Consolidated Statement of Financial Position cannot be derived from active markets (i.e., from quoted market prices or dealer price quotations), it is determined using valuation techniques, including discounted cash flow models.
The inputs to these models, such as interest rate yield curves, equity prices, commodity and currency prices and yields, volatilities of underlying assumptions, and correlations between inputs, are taken from observable markets where possible. Where this is not feasible, a degree of judgement is required in establishing fair values.
These judgements include considerations of inputs such as the discount rate, the expected rate of return by level of risk and the weighted forecast of cash flows. Changes to these inputs could affect the reported fair value of financial instruments. Refer to Note 3—Significant Accounting Policies, for more information about the valuation techniques used for each type of financial instrument and to Note 6—Classification and Fair Value of Financial Instruments, for additional information on fair value hierarchy levels.
QUALIFYING HEDGE RELATIONSHIPSIn designating financial instruments in qualifying hedge relationships, BDC has determined that it expects the hedges to be highly effective over the period of the hedging relationship. In accounting for derivatives as cash flow hedges, BDC has determined that the hedged cash flow exposure relates to highly probable future cash flows.
NET DEFINED BENEFIT ASSET OR LIABILITYThe cost of defined benefit pension plans and other post-employment benefits, and the present value of the related obligations, are determined using actuarial valuations. The actuarial valuation involves making assumptions about discount rates used to measure the obligations, expected future salary increases, expected retirement age, expected mortality rates, expected health care cost trends, expected inflation and expected future pension increases. Due to the long-term nature of these plans, such estimates are subject to significant uncertainty. Actual results will differ from results that are estimated based on assumptions.
Refer to Note 19—Net Defined Benefit Asset or Liability, for additional information about the key assumptions.
JUDGEMENTS
IMPAIRMENT OF AVAILABLE-FOR-SALE ASSETSBDC determines that asset-backed securities are impaired when there is objective evidence of impairment. Objective evidence that a financial asset or group of assets is impaired may include such events as the financial difficulty or probable bankruptcy or financial reorganization of the issuer, a default or adverse change in status or concession with respect to payments, measurable decreases in the estimated future cash flows from the assets, and a deterioration of correlated economic conditions. Since a combination of factors may cause an impairment, management judgement is required to determine if and when an impairment must be recognized.
CONSOLIDATIONA key judgement that has been used in the preparation of the Consolidated Financial Statements is that BDC has the power to control certain investment funds (refer to Note 2—Basis of Preparation, for additional information). BDC has assessed that it has the current ability to direct the funds’ activities that most significantly affects their returns, and that BDC is exposed to these returns. Consequently, these funds have been fully consolidated rather than accounted for using the equity accounting approach.
Notes to the Consolidated Financial StatementsFor the year ended March 31, 2015(in thousands of Canadian dollars)
BDC AR15 | 66

6.CLASSIFICATION AND FAIR VALUE OF FINANCIAL INSTRUMENTS
CLASSIFICATION OF FINANCIAL INSTRUMENTS
The following tables summarize the classification of BDC’s financial instruments as at March 31, 2015, and March 31, 2014.
March 31, 2015Measured at fair value Measured at amortized cost
FVTPL(1)
Note Held-for- trading
Designated as at FVTPL
Available- for-sale
Cash flowhedges
Loans and receivables
Financial liabilities Total
Financial assetsCash and cash equivalents 7 667,084 667,084 Derivative assets 8 49,666 3,656 53,322 Asset-backed securities 9 3,688 404,043 407,731 Loans 10 18,414,044 18,414,044 Subordinate financing investments 11 642,810 642,810 Venture capital investments 12 709,639 709,639 Venture capital action plan investments 13 47,643 47,643 Other assets(2) 16 8,200 8,200 Total financial assets 49,666 1,403,780 404,043 3,656 19,089,328 – 20,950,473
Financial liabilities Accounts payable and accrued liabilities 17 101,996 101,996 Derivative liabilities 8 7,515 7,515 Short-term notes 18 15,435,747 15,435,747 Long-term notes 18 304,453 244,256 548,709 Other liabilities(2) 20 27,568 27,568 Total financial liabilities 7,515 304,453 – – – 15,809,567 16,121,535
(1) Fair value through profit or loss.(2) Certain items within the other assets and other liabilities categories on the Consolidated Statement of Financial Position are not considered to be financial instruments.
Notes to the Consolidated Financial StatementsFor the year ended March 31, 2015(in thousands of Canadian dollars)
BDC AR15 | 67
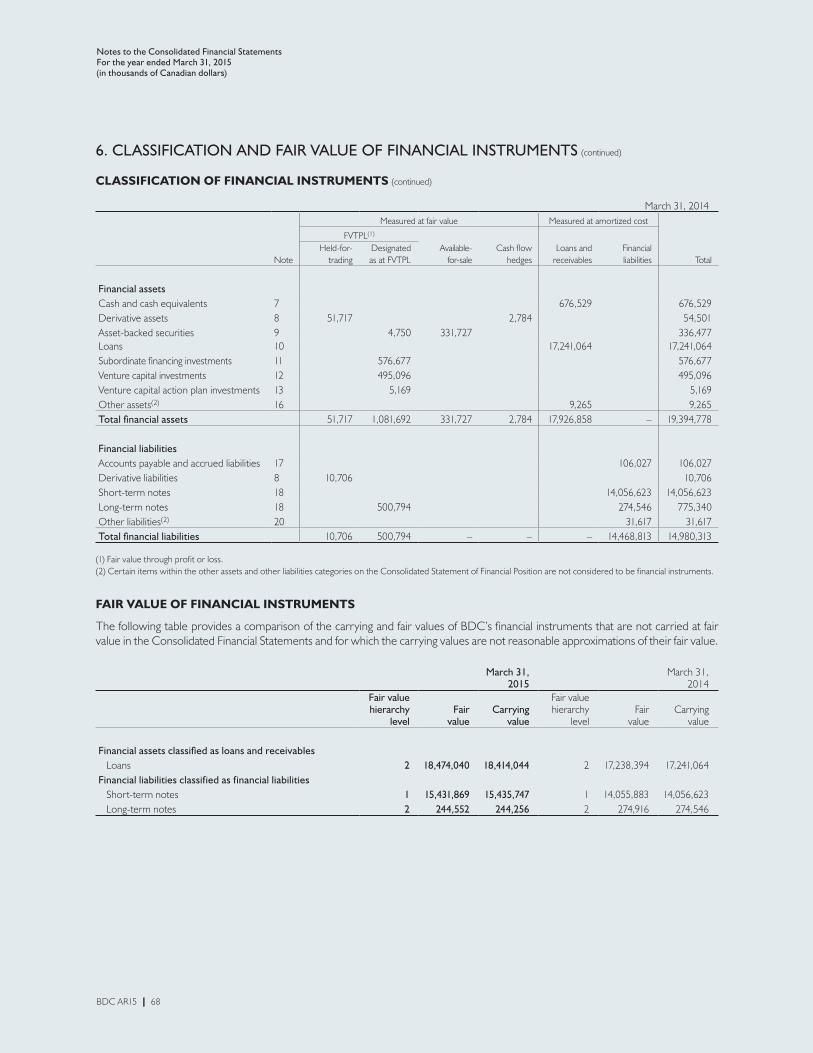
6. CLASSIFICATION AND FAIR VALUE OF FINANCIAL INSTRUMENTS (continued)
CLASSIFICATION OF FINANCIAL INSTRUMENTS (continued)
March 31, 2014Measured at fair value Measured at amortized cost
FVTPL(1)
Note Held-for- trading
Designated as at FVTPL
Available- for-sale
Cash flowhedges
Loans and receivables
Financial liabilities Total
Financial assetsCash and cash equivalents 7 676,529 676,529 Derivative assets 8 51,717 2,784 54,501 Asset-backed securities 9 4,750 331,727 336,477 Loans 10 17,241,064 17,241,064 Subordinate financing investments 11 576,677 576,677 Venture capital investments 12 495,096 495,096 Venture capital action plan investments 13 5,169 5,169 Other assets(2) 16 9,265 9,265 Total financial assets 51,717 1,081,692 331,727 2,784 17,926,858 – 19,394,778
Financial liabilities Accounts payable and accrued liabilities 17 106,027 106,027 Derivative liabilities 8 10,706 10,706 Short-term notes 18 14,056,623 14,056,623 Long-term notes 18 500,794 274,546 775,340 Other liabilities(2) 20 31,617 31,617 Total financial liabilities 10,706 500,794 – – – 14,468,813 14,980,313
(1) Fair value through profit or loss.(2) Certain items within the other assets and other liabilities categories on the Consolidated Statement of Financial Position are not considered to be financial instruments.
FAIR VALUE OF FINANCIAL INSTRUMENTS
The following table provides a comparison of the carrying and fair values of BDC’s financial instruments that are not carried at fair value in the Consolidated Financial Statements and for which the carrying values are not reasonable approximations of their fair value.
March 31, 2015
March 31, 2014
Fair value hierarchy
levelFair
valueCarrying
value
Fair value hierarchy
levelFair
valueCarrying
value
Financial assets classified as loans and receivables Loans 2 18,474,040 18,414,044 2 17,238,394 17,241,064 Financial liabilities classified as financial liabilities Short-term notes 1 15,431,869 15,435,747 1 14,055,883 14,056,623 Long-term notes 2 244,552 244,256 2 274,916 274,546
Notes to the Consolidated Financial StatementsFor the year ended March 31, 2015(in thousands of Canadian dollars)
BDC AR15 | 68

6. CLASSIFICATION AND FAIR VALUE OF FINANCIAL INSTRUMENTS (continued)
FAIR VALUE OF FINANCIAL INSTRUMENTS (continued)
FINANCIAL INSTRUMENTS CARRIED AT AMORTIZED COST Loans classified as loans and receivablesThe carrying value of performing floating-rate loans is a reasonable approximation of their fair value because the carrying value reflects changes in interest rates since the loan was originated. For performing fixed-rate loans, fair value is determined using a discounted cash flow calculation that uses market interest rates prevailing at the end of the period charged for similar new loans with corresponding remaining maturity.
For impaired loans, the fair value is equal to the carrying value determined in accordance with the valuation methods described in Note 3—Significant Accounting Policies, under the heading Allowance for credit losses.
Short-term notes classified as financial liabilitiesThe fair value of short-term notes classified as financial liabilities is determined using a quoted market price.
Long-term notes classified as financial liabilitiesThe fair value of long-term notes classified as financial liabilities is determined using a discount cash flow calculation that uses market interest rates based on the remaining time to maturity.
FINANCIAL INSTRUMENTS MEASURED AT FAIR VALUEThe assumptions and methods used to estimate the fair value of those financial assets and liabilities that are measured at fair value are disclosed in Note 3—Significant Accounting Policies.
All financial instruments measured at fair value must be categorized into one of three hierarchy levels for disclosure purposes. Each level is based on the observability of the inputs used to measure the fair value of assets and liabilities, and is defined below:
> Level 1—Fair values based on quoted prices (unadjusted) observed in active markets for identical assets or liabilities;
> Level 2—Fair values based on inputs other than quoted prices in active markets that are either directly or indirectly observable; and
> Level 3—Fair values based on valuation techniques with one or more significant unobservable market inputs.
There have been no transfers between levels 1 and 2 or between levels 2 and 3 in the reporting periods. BDC’s policy is to recognize transfers between levels 1 and 3 when private investments become publicly traded or public investments become private investments during the reporting periods.
Notes to the Consolidated Financial StatementsFor the year ended March 31, 2015(in thousands of Canadian dollars)
BDC AR15 | 69

6. CLASSIFICATION AND FAIR VALUE OF FINANCIAL INSTRUMENTS (continued)
FAIR VALUE OF FINANCIAL INSTRUMENTS (continued)
FINANCIAL INSTRUMENTS MEASURED AT FAIR VALUE (continued)
The following tables present financial instruments carried at fair value categorized by hierarchy levels.
March 31, 2015 Fair value measurements using Total
fair valueLevel 1 Level 2 Level 3
Assets Derivative assets 53,322 53,322 Asset-backed securities 407,731 407,731 Subordinate financing investments 607 642,203 642,810 Venture capital investments 1,871 707,768 709,639 Venture capital action plan investments 47,643 47,643
2,478 461,053 1,397,614 1,861,145 Liabilities Derivative liabilities 7,515 7,515 Long-term notes designated as at fair value through profit or loss 304,453 304,453
– 311,968 – 311,968
March 31, 2014 Fair value measurements using Total
fair valueLevel 1 Level 2 Level 3
Assets Derivative assets 54,501 54,501 Asset-backed securities 336,477 336,477 Subordinate financing investments 684 575,993 576,677 Venture capital investments 6,058 489,038 495,096 Venture capital action plan investments 5,169 5,169
6,742 390,978 1,070,200 1,467,920 Liabilities Derivative liabilities 10,706 10,706 Long-term notes designated as at fair value through profit or loss 500,794 500,794
– 511,500 – 511,500
Notes to the Consolidated Financial StatementsFor the year ended March 31, 2015(in thousands of Canadian dollars)
BDC AR15 | 70

6. CLASSIFICATION AND FAIR VALUE OF FINANCIAL INSTRUMENTS (continued)
FAIR VALUE OF FINANCIAL INSTRUMENTS (continued)
FINANCIAL INSTRUMENTS MEASURED AT FAIR VALUE (continued)
The following table presents the changes in fair value measurement for financial instruments included in level 3 of the fair value hierarchy.
The procedures and valuation techniques used to determine the fair values of subordinate financing, venture capital and venture capital action plan investments included in level 3 are described in Note 3—Significant Accounting Policies. These valuation techniques draw upon diverse unobservable inputs, none of which, with the exception of the risk-free interest rate, is individually significant enough to have a material impact on BDC’s net earnings if it varied within reasonable possible ranges. For subordinate financing investments, the impact of a 1% variation in the risk-free rate would result in a gain or loss of $9.8 million in the current period and an equivalent change in retained earnings ($10.6 million in 2014). Venture capital and venture capital action plan investments are not risk-free rate sensitive.
March 31, 2015Subordinate
financing investments
Venture capital
investments
Venture capitalaction plan
investments Total
Fair value at April 1, 2014 575,993 489,038 5,169 1,070,200 Net realized gains (losses) on investments (23,010) (8,873) – (31,883)Net change in unrealized appreciation (depreciation) of investments 9,600 30,118 (3,591) 36,127 Net unrealized foreign exchange gains (losses) on investments – 27,737 – 27,737 Disbursements for investments 218,335 190,004 46,165 454,504 Repayments of investments and other (138,715) (16,385) (100) (155,200)Transfers from level 3 to level 1 – (3,871) – (3,871)Fair value as at March 31, 2015 642,203 707,768 47,643 1,397,614
March 31, 2014
Subordinate financing
investments
Venture capital
investments
Venture capitalaction plan
investments Total
Fair value at April 1, 2013 556,031 424,047 – 980,078 Net realized gains (losses) on investments (9,970) (22,027) – (31,997)Net change in unrealized appreciation (depreciation) of investments (16,582) 21,762 (533) 4,647 Net unrealized foreign exchange gains (losses) on investments – 13,454 – 13,454 Disbursements for investments 156,239 118,274 5,702 280,215 Repayments of investments and other (109,725) (62,718) – (172,443)Transfers from level 3 to level 1 – (3,754) – (3,754)Fair value as at March 31, 2014 575,993 489,038 5,169 1,070,200
The following table presents total gains or losses for financial instruments included in level 3 that can be attributable to assets held at the end of the reporting periods.
2015 2014
Net realized gains (losses) on investments (2,271) (52,049)Net change in unrealized appreciation (depreciation) of investments 28,230 24,471 Net unrealized foreign exchange gains (losses) on investments 27,784 12,693 Total gains (losses) related to level 3 assets still held at the end of the reporting period 53,743 (14,885)
Notes to the Consolidated Financial StatementsFor the year ended March 31, 2015(in thousands of Canadian dollars)
BDC AR15 | 71

7.CASH AND CASH EQUIVALENTS
As at March 31, 2015, and March 31, 2014, there are no restrictions on cash and cash equivalents. Cash and cash equivalents include the following components.
March 31, 2015 March 31, 2014
Cash 10,576 16,977 Short-term bank notes, commercial paper and other 656,508 659,552 Cash and cash equivalents 667,084 676,529
8.DERIVATIVE FINANCIAL INSTRUMENTS
In compliance with BDC’s treasury risk policy, BDC uses the following derivative financial instruments to mitigate its foreign exchange rate risk, as well as its interest rate and equity market risk. BDC’s policy is not to use derivative financial instruments for speculative purposes. BDC enters into master netting agreements with counterparties but does not proceed with netting financial assets and liabilities.
SWAPS
Swaps are contractual obligations to exchange a series of cash flows on a specific notional amount for a predetermined period. The various swap agreements that BDC enters into are as follows:
> interest rate swaps, which involve exchange of fixed- and floating-rate interest payments;
> cross-currency interest rate swaps, which involve the exchange of both interest and notional amounts in two different currencies;
> equity-linked swaps, where one of the payments exchanged represents the variation in an equity index over time, and the other is based on agreed fixed or floating rates; and
> futures swaps, where the return of the swap is linked to the performance of a portfolio of futures contracts and bonds.
The main risk associated with these instruments is related to movements in interest rates, foreign currencies and equity prices.
FORWARDS
Forwards are contractual agreements to either buy or sell currencies or financial instruments at specified prices and dates in the future. They are customized contracts transacted in the over-the-counter market.
The main risks associated with these instruments arise from the possible inability of over-the-counter counterparties to meet the terms of the contracts, and from movements in interest rates and foreign exchange rates.
FOREIGN EXCHANGE RATE RISKBDC economically hedges its long-term borrowings with cross-currency interest-rate swaps, and its loans and subordinate financing investments with foreign exchange forward contracts. These instruments have been classified as held-for-trading. Venture capital investments are economically hedged following the occurrence of a liquidity event.
Notes to the Consolidated Financial StatementsFor the year ended March 31, 2015(in thousands of Canadian dollars)
BDC AR15 | 72

8. DERIVATIVE FINANCIAL INSTRUMENTS (continued)
INTEREST RATE AND EQUITY MARKET RISKSBDC enters into interest rate swaps to hedge the financial impact of future interest rate fluctuations in relation to changes in the loan portfolio mix. These contracts have been designated as cash flow hedges. There was no significant ineffectiveness of cash flow hedges in 2015 and 2014.
BDC also uses derivative financial instruments as an economic hedge for its structured notes. These instruments include interest rate swaps, cross-currency interest rate swaps, equity-linked swaps, and futures swaps. These instruments have been classified as held-for-trading.
The following tables provide the fair value of BDC’s derivatives portfolio as represented by gross assets and gross liabilities values.
March 31, 2015Gross assets Gross liabilities Net amount
Hedging Interest rate swap contracts 3,656 – 3,656 Total hedging 3,656 – 3,656
Held-for-trading Interest rate swap contracts 48,423 5,793 42,630 Cross-currency interest rate swap contracts 824 228 596 Foreign exchange forward contracts 419 1,494 (1,075)Total held-for-trading 49,666 7,515 42,151
Total 53,322 7,515 45,807
March 31, 2014Gross assets Gross liabilities Net amount
Hedging Interest rate swap contracts 2,784 – 2,784 Total hedging 2,784 – 2,784
Held-for-trading Interest rate swap contracts 49,838 6,584 43,254 Equity-linked swap contracts 244 309 (65) Cross-currency interest rate swap contracts 1,175 1,835 (660) Foreign exchange forward contracts 460 1,978 (1,518)Total held-for-trading 51,717 10,706 41,011
Total 54,501 10,706 43,795
Notes to the Consolidated Financial StatementsFor the year ended March 31, 2015(in thousands of Canadian dollars)
BDC AR15 | 73

8. DERIVATIVE FINANCIAL INSTRUMENTS (continued)
The following table summarizes the notional amount, by term to maturity or repricing date, of derivative instruments. Notional amounts, which are provided solely for comparative purposes, are not recorded as assets or liabilities on the Consolidated Statement of Financial Position, as they represent the face amount of the contract to which a rate or a price is applied to determine the amount of cash flows to be exchanged.
Term to maturity or repricing March 31, 2015
March 31, 2014
Within1 year
1 to 3years
3 to 5years
Over 5 years
Notionalamount
Notionalamount
HedgingInterest rate swap contracts$CDN receivable-fixed 173,000 55,000 120,000 348,000 213,000 % receivable-fixed 2.19 1.31 1.42 Total hedging 173,000 55,000 120,000 – 348,000 213,000
Held-for-tradingInterest rate swap contracts$CDN payable-fixed 60,000 60,000 110,000 % payable-fixed 4.17 $CDN receivable-fixed 16,222 223,288 239,510 326,341 % receivable-fixed 4.38 4.61 Equity-linked swap contracts – 105,650
16,222 60,000 – 223,288 299,510 541,991
Cross-currency interest rate swap contracts 10,875 7,254 18,129 25,196 16,222 70,875 – 230,542 317,639 567,187
Foreign exchange forward contracts 190,664 190,664 257,534 Total held-for-trading 206,886 70,875 – 230,542 508,303 824,721 Total 379,886 125,875 120,000 230,542 856,303 1,037,721
The rates represent the weighted average interest rates that BDC has contracted to pay or to receive up to maturity or repricing. The floating side for almost all of the Canadian dollar swap contracts is based on one- or three-month Canadian bankers’ acceptance rates. All amounts in foreign currencies are converted into the Canadian dollar equivalent using the rate of exchange of the derivative contracts.
Notes to the Consolidated Financial StatementsFor the year ended March 31, 2015(in thousands of Canadian dollars)
BDC AR15 | 74

9.ASSET-BACKED SECURITIES
The following table summarizes asset-backed securities by classification of financial instruments. As at March 31, 2015, no asset-backed securities had maturities of less than five years (none as at March 31, 2014) and $407,731 had maturities over five years ($336,477 as at March 31, 2014). The asset-backed securities may be redeemed by the issuing trust at par depending on the terms of the securitization deal if the balance of the underlying assets or, in some cases, the balance of the notes, amortizes below 10% of the original balance at issuance. No asset-backed securities were impaired as at March 31, 2015, and 2014. Refer to Note 23—Risk Management, for additional information on credit risk associated with the asset-backed securities portfolio.
March 31, 2015 March 31, 2014
Available-for-sale Principal amount 400,096 329,521 Cumulative fair value appreciation (depreciation) 3,947 2,206 Carrying value 404,043 331,727 Yield 2.02% 2.24%Fair value through profit or loss Principal amount 3,609 4,651 Cumulative fair value appreciation (depreciation) 79 99 Carrying value 3,688 4,750 Yield 7.65% 8.06%Asset-backed securities 407,731 336,477
10.LOANS
The following tables summarize loans outstanding by contractual maturity date.2015
Within 1 year
1 to 5 years
Over 5 years
Total gross amount
Collective allowance
Individual allowance
Total allowance
Total net amount
Performing 186,646 2,078,792 16,187,973 18,453,411 (350,000) – (350,000) 18,103,411 Impaired 7,856 62,270 420,430 490,556 – (179,923) (179,923) 310,633 Loans as at March 31, 2015 194,502 2,141,062 16,608,403 18,943,967 (350,000) (179,923) (529,923) 18,414,044
2014 Within 1 year
1 to 5 years
Over 5 years
Total gross amount
Collective allowance
Individual allowance
Total allowance
Total net amount
Performing 166,594 1,865,370 15,241,401 17,273,365 (340,000) – (340,000) 16,933,365 Impaired 9,226 49,330 417,393 475,949 – (168,250) (168,250) 307,699 Loans as at March 31, 2014 175,820 1,914,700 15,658,794 17,749,314 (340,000) (168,250) (508,250) 17,241,064
Notes to the Consolidated Financial StatementsFor the year ended March 31, 2015(in thousands of Canadian dollars)
BDC AR15 | 75

10. LOANS (continued)
IMPAIRED LOANS March 31, 2015 March 31, 2014
Impaired at beginning of year 475,949 491,774 Downgraded 392,313 362,517 Upgraded (87,493) (104,835)Write-offs (71,983) (103,258)Liquidation and other (218,230) (170,249)Balance at end of year 490,556 475,949
ALLOWANCE FOR CREDIT LOSSESMarch 31, 2015 March 31, 2014
Balance at beginning of year 508,250 538,338 Write-offs (71,983) (103,258)Effect of discounting (12,788) (12,485)Recoveries and other 10,521 12,774
434,000 435,369 Provision for credit losses 95,923 72,881 Balance at end of year 529,923 508,250
CREDIT RISK
The principal collaterals pledged as security if a loan defaults and other credit enhancements for loans include (i) various security on assets; (ii) personal and corporate guarantees; (iii) letters of credit; (iv) assignments of life insurance; (v) assignments or hypothec of third-party loans; and (vi) assignments of lease.
As at March 31, 2015, $28.4 million ($30.9 million as at March 31, 2014) of the impaired loans was secured by assets that BDC had the power to sell in order to satisfy borrower commitments. BDC’s policy is to have these assets sold when other avenues of resolution have been exhausted.
The following table summarizes performing loans outstanding by client credit risk exposure based on BDC classification.
BDC rating Grade equivalent March 31, 2015 March 31, 2014
0.5 to 1.0 Investment grade 1,358,539 7% 1,004,868 6%1.5 to 2.0 Non-investment grade 4,732,851 26% 3,847,699 22%2.5 to 4.0 9,080,623 49% 9,474,214 55%4.5 to 5.0 2,556,838 14% 2,237,592 13%5.5 Watchlist 724,560 4% 708,992 4%Performing loans outstanding 18,453,411 100% 17,273,365 100%
The following table summarizes performing loans outstanding, classified by secured risk exposure coverage.
Secured risk exposure March 31, 2015 March 31, 2014
Secured financing(1) 14,557,282 79% 13,848,368 80%Partially secured financing(2) 1,852,881 10% 1,684,851 10%Leverage financing(3) 2,043,248 11% 1,740,146 10%Performing loans outstanding 18,453,411 100% 17,273,365 100%
(1) % of security shortfall at authorization is less than 30%.(2) % of security shortfall at authorization is between 31% and 60%.(3) % of security shortfall at authorization is over 60%.
Notes to the Consolidated Financial StatementsFor the year ended March 31, 2015(in thousands of Canadian dollars)
BDC AR15 | 76

10. LOANS (continued)
CREDIT RISK (continued)
BDC considers a loan past due when a client has not made a payment by the contractual due date. The following table presents the carrying value of loans that are past due but not classified as impaired because they are either less than three months past due or collection efforts are reasonably expected to result in repayment.
Loans past due but not impaired Within 1 month
1 to 3 months
Over 3 months Total
As at March 31, 2015 90,282 48,802 29,275 168,359As at March 31, 2014 93,139 39,995 18,935 152,069
Concentrations of the total loans outstanding, by province and territory and by industry sector, are set out in the tables below. The largest concentration in one individual or closely related group of clients was less than 1% as at March 31, 2015, and March 31, 2014.
Geographic distribution March 31, 2015
March 31, 2014
Newfoundland and Labrador 790,243 741,843 Prince Edward Island 53,344 44,517 Nova Scotia 490,936 447,837 New Brunswick 469,044 486,006 Quebec 6,243,857 5,977,771 Ontario 4,812,779 4,681,243 Manitoba 600,946 502,059 Saskatchewan 633,566 532,345 Alberta 2,644,485 2,325,621 British Columbia 2,080,226 1,881,972 Yukon 97,397 97,598 Northwest Territories and Nunavut 27,144 30,502 Total loans outstanding 18,943,967 17,749,314
Industry sector March 31, 2015
March 31, 2014
Manufacturing 4,186,626 4,025,056 Wholesale and retail trade 3,843,068 3,578,289 Tourism 2,491,385 2,305,724 Service industries 2,455,093 2,278,685 Commercial properties 2,183,966 2,050,634 Construction 1,560,146 1,478,046 Transportation and storage 1,089,428 1,023,372 Resources 680,730 584,266 Other 453,525 425,242 Total loans outstanding 18,943,967 17,749,314
Notes to the Consolidated Financial StatementsFor the year ended March 31, 2015(in thousands of Canadian dollars)
BDC AR15 | 77

11.SUBORDINATE FINANCING INVESTMENTS
BDC maintains a medium- to high-risk portfolio of subordinate financing investments. The following table summarizes outstanding subordinate financing investments by their contractual maturity date. Both floating- and fixed-rate investments are classified based on their contractual maturity date.
Within 1 year
1 to 5 years
Over 5 years
Total cost
Total fair value
As at March 31, 2015 80,350 480,167 97,460 657,977 642,810 As at March 31, 2014 77,268 442,633 81,477 601,378 576,677
Subordinate financing investments have subordinate status in relationship to the other debt issued by a company. The principal collaterals pledged as security and other credit enhancements related to subordinate financing investments include (i) various security on assets; (ii) personal and corporate guarantees; (iii) assignments of life insurance; and (iv) postponements of third-party loans. When possible, BDC security also includes a first-rank lien on the intellectual property of the borrower.
The concentrations of subordinate financing investments by geographic and industry distribution are set out in the tables below. The largest concentration in one individual or closely related group of clients as at March 31, 2015, was 2.3% of total subordinate financing investments at cost (2.5% as at March 31, 2014). Subordinate financing’s portfolio is composed primarily of debentures.
March 31, 2015
March 31, 2014
Geographic distribution Fair value Cost Fair value Cost
Newfoundland and Labrador 5,063 3,831 8,033 6,697 Nova Scotia 15,888 16,592 13,297 14,636 New Brunswick 22,352 20,355 11,756 11,806 Quebec 253,105 269,482 249,660 271,927 Ontario 212,234 212,103 182,588 186,901 Manitoba 11,617 8,270 8,050 6,062 Saskatchewan 6,462 5,485 5,108 3,659 Alberta 88,517 92,540 72,071 73,103 British Columbia 23,855 25,470 22,173 22,417 Yukon 2,613 2,744 2,715 2,915 Northwest Territories and Nunavut 1,104 1,105 1,226 1,255 Subordinate financing investments 642,810 657,977 576,677 601,378
March 31, 2015
March 31, 2014
Industry sector Fair value Cost Fair value Cost
Manufacturing 223,059 225,962 204,022 205,280 Service industries 135,614 142,482 114,686 129,493 Wholesale and retail trade 107,962 108,233 97,007 99,523 Construction 51,697 47,244 44,004 46,798 Resources 48,732 52,293 34,524 35,346 Information industries 21,526 24,068 21,079 22,552 Transportation and storage 11,071 11,494 9,426 10,138 Tourism 9,756 10,111 12,808 11,882 Educational services 4,038 3,922 7,130 7,674 Real estate and rental and leasing 3,033 3,128 8,918 8,539 Other 26,322 29,040 23,073 24,153 Subordinate financing investments 642,810 657,977 576,677 601,378
Notes to the Consolidated Financial StatementsFor the year ended March 31, 2015(in thousands of Canadian dollars)
BDC AR15 | 78

12.VENTURE CAPITAL INVESTMENTS
BDC maintains a high-risk portfolio of venture capital investments that is focused on early-stage and fast-growing technology companies having promising positions in their respective marketplaces and strong growth potential. Venture capital investments, which are held for a longer term, are non-current assets. The concentrations by industry sector are listed below. The largest single investment within these sectors as at March 31, 2015, was 7.41% of total venture capital investments at cost (7.86% as at March 31, 2014).
March 31, 2015
March 31, 2014
Industry sector Fair value Cost Fair value Cost
Information technology 160,551 151,208 106,228 114,000 Electronics 89,219 91,774 77,976 78,241 Biotechnology and pharmacology 73,709 81,218 53,383 62,834 Medical and health 40,121 45,522 33,765 42,485 Communications 32,241 33,664 25,872 24,282 Energy 16,628 20,635 8,259 16,065 Industrial 12,673 18,331 9,690 14,042 Other 3,447 2,512 500 500 Total direct investments 428,589 444,864 315,673 352,449
Funds 281,050 245,021 179,423 182,173 Venture capital investments 709,639 689,885 495,096 534,622
The following table presents a summary of the venture capital portfolio, by type of investment.
March 31, 2015
March 31, 2014
Investment type Fair value Cost Fair value Cost
Common shares 40,061 70,027 29,340 68,745 Preferred shares 336,898 321,239 248,090 243,132 Debentures 51,630 53,598 38,243 40,572 Total direct investments 428,589 444,864 315,673 352,449
Funds 281,050 245,021 179,423 182,173 Venture capital investments 709,639 689,885 495,096 534,622
13.VENTURE CAPITAL ACTION PLAN INVESTMENTS
Venture Capital Action Plan is a federal government initiative to invest $400 million to increase private sector venture capital financing for high-potential, innovative Canadian businesses.
Venture Capital Action Plan invests primarily in early-stage and mid-stage venture capital funds, and directly in companies across Canada. Venture Capital Action Plan supports the creation of large private sector-led funds of funds and also assists existing high-performing funds in partnership with institutional investors, corporate strategic investors and interested provinces.
As at March 31, 2015, the fair value of venture capital action plan investments stood at $47,643 ($5,169 as at March 31, 2014), and their cost was $51,767 ($5,702 as at March 31, 2014).
Notes to the Consolidated Financial StatementsFor the year ended March 31, 2015(in thousands of Canadian dollars)
BDC AR15 | 79
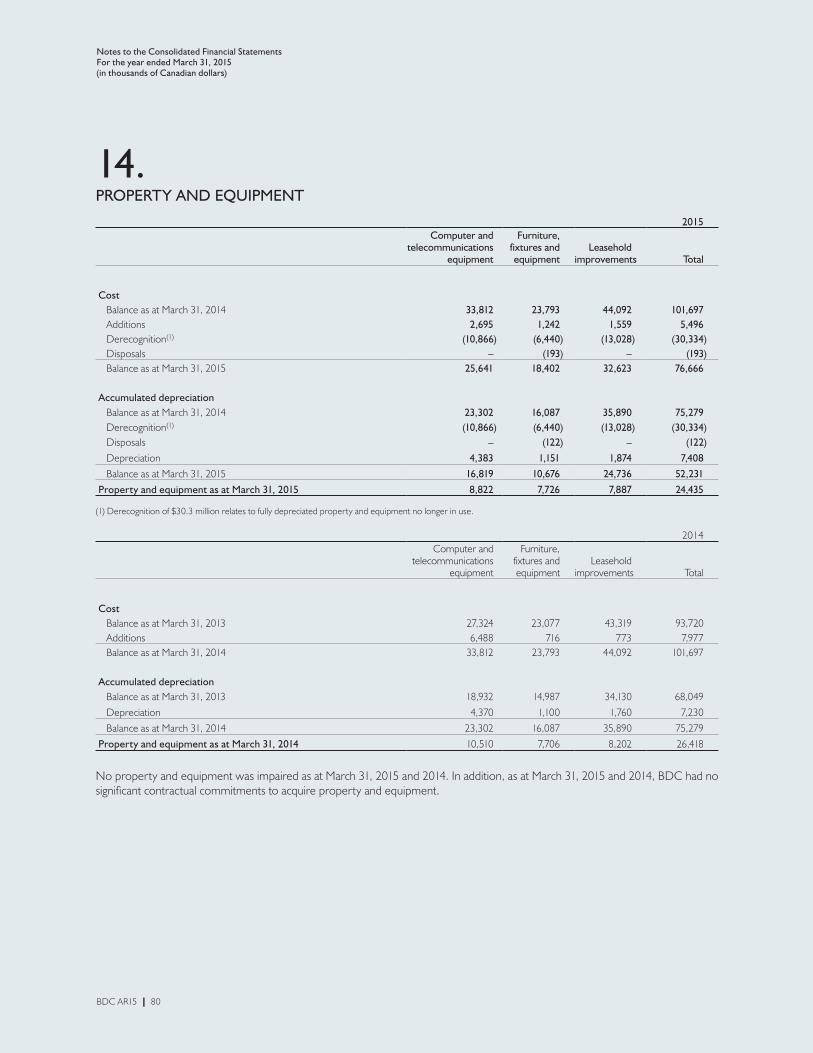
14.PROPERTY AND EQUIPMENT
2015 Computer and telecommunications equipment
Furniture, fixtures and equipment
Leasehold improvements Total
Cost Balance as at March 31, 2014 33,812 23,793 44,092 101,697 Additions 2,695 1,242 1,559 5,496 Derecognition(1) (10,866) (6,440) (13,028) (30,334) Disposals – (193) – (193) Balance as at March 31, 2015 25,641 18,402 32,623 76,666
Accumulated depreciation Balance as at March 31, 2014 23,302 16,087 35,890 75,279 Derecognition(1) (10,866) (6,440) (13,028) (30,334) Disposals – (122) – (122) Depreciation 4,383 1,151 1,874 7,408 Balance as at March 31, 2015 16,819 10,676 24,736 52,231 Property and equipment as at March 31, 2015 8,822 7,726 7,887 24,435
(1) Derecognition of $30.3 million relates to fully depreciated property and equipment no longer in use.
2014 Computer and telecommunications equipment
Furniture, fixtures and equipment
Leasehold improvements Total
Cost Balance as at March 31, 2013 27,324 23,077 43,319 93,720 Additions 6,488 716 773 7,977 Balance as at March 31, 2014 33,812 23,793 44,092 101,697
Accumulated depreciation Balance as at March 31, 2013 18,932 14,987 34,130 68,049 Depreciation 4,370 1,100 1,760 7,230 Balance as at March 31, 2014 23,302 16,087 35,890 75,279 Property and equipment as at March 31, 2014 10,510 7,706 8,202 26,418
No property and equipment was impaired as at March 31, 2015 and 2014. In addition, as at March 31, 2015 and 2014, BDC had no significant contractual commitments to acquire property and equipment.
Notes to the Consolidated Financial StatementsFor the year ended March 31, 2015(in thousands of Canadian dollars)
BDC AR15 | 80
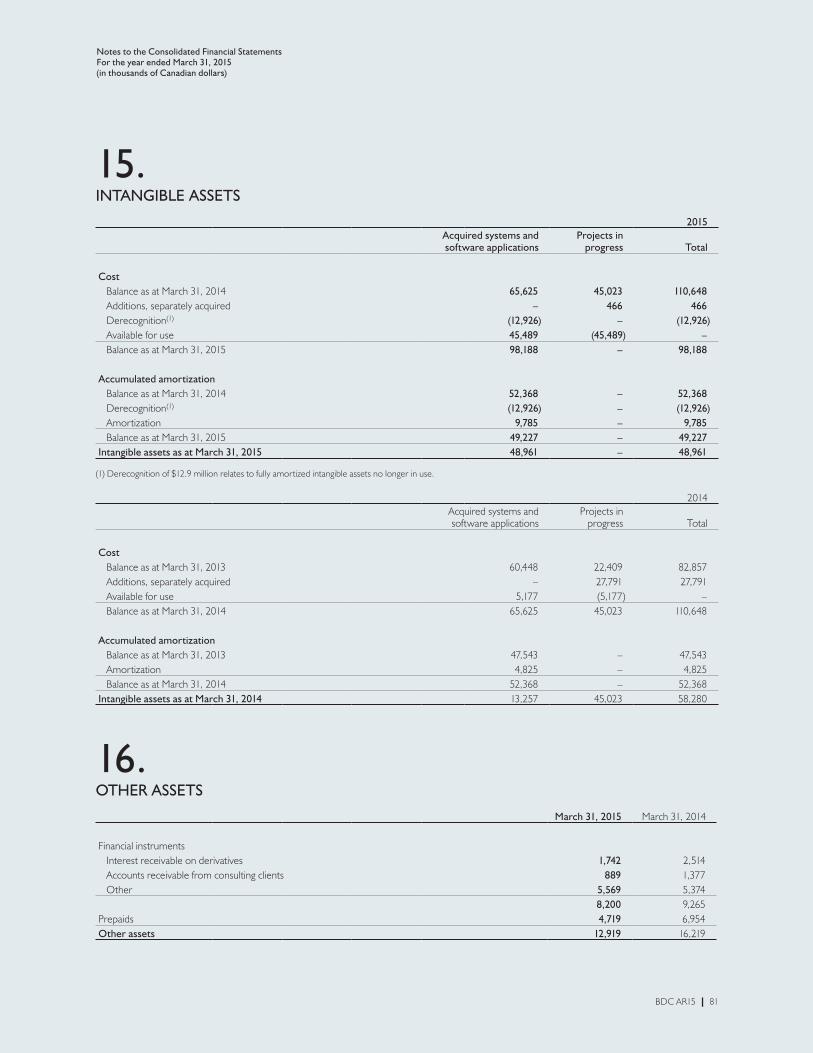
15.INTANGIBLE ASSETS
2015Acquired systems and software applications
Projects in progress Total
Cost Balance as at March 31, 2014 65,625 45,023 110,648 Additions, separately acquired – 466 466 Derecognition(1) (12,926) – (12,926) Available for use 45,489 (45,489) – Balance as at March 31, 2015 98,188 – 98,188 Accumulated amortization Balance as at March 31, 2014 52,368 – 52,368 Derecognition(1) (12,926) – (12,926) Amortization 9,785 – 9,785 Balance as at March 31, 2015 49,227 – 49,227 Intangible assets as at March 31, 2015 48,961 – 48,961
(1) Derecognition of $12.9 million relates to fully amortized intangible assets no longer in use.
2014Acquired systems and software applications
Projects in progress Total
Cost Balance as at March 31, 2013 60,448 22,409 82,857 Additions, separately acquired – 27,791 27,791 Available for use 5,177 (5,177) – Balance as at March 31, 2014 65,625 45,023 110,648 Accumulated amortization Balance as at March 31, 2013 47,543 – 47,543 Amortization 4,825 – 4,825 Balance as at March 31, 2014 52,368 – 52,368 Intangible assets as at March 31, 2014 13,257 45,023 58,280
16.OTHER ASSETS
March 31, 2015 March 31, 2014
Financial instruments Interest receivable on derivatives 1,742 2,514 Accounts receivable from consulting clients 889 1,377 Other 5,569 5,374 8,200 9,265 Prepaids 4,719 6,954 Other assets 12,919 16,219
Notes to the Consolidated Financial StatementsFor the year ended March 31, 2015(in thousands of Canadian dollars)
BDC AR15 | 81
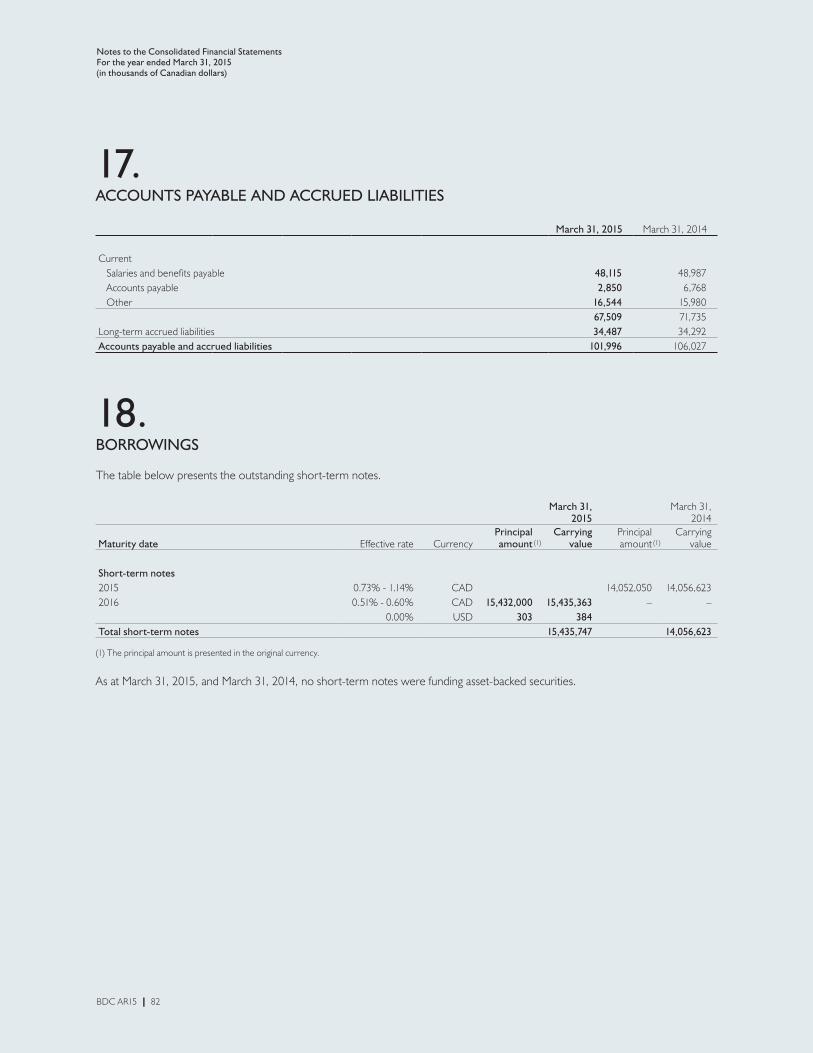
17.ACCOUNTS PAYABLE AND ACCRUED LIABILITIES
March 31, 2015 March 31, 2014
Current Salaries and benefits payable 48,115 48,987 Accounts payable 2,850 6,768 Other 16,544 15,980 67,509 71,735 Long-term accrued liabilities 34,487 34,292 Accounts payable and accrued liabilities 101,996 106,027
18.BORROWINGS
The table below presents the outstanding short-term notes.
March 31, 2015
March 31, 2014
Maturity date Effective rate CurrencyPrincipalamount
Carryingvalue
Principalamount
Carryingvalue
Short-term notes2015 0.73% - 1.14% CAD 14,052,050 14,056,623 2016 0.51% - 0.60% CAD 15,432,000 15,435,363 – –
0.00% USD 303 384 Total short-term notes 15,435,747 14,056,623
(1) The principal amount is presented in the original currency.
As at March 31, 2015, and March 31, 2014, no short-term notes were funding asset-backed securities.
(1) (1)
Notes to the Consolidated Financial StatementsFor the year ended March 31, 2015(in thousands of Canadian dollars)
BDC AR15 | 82
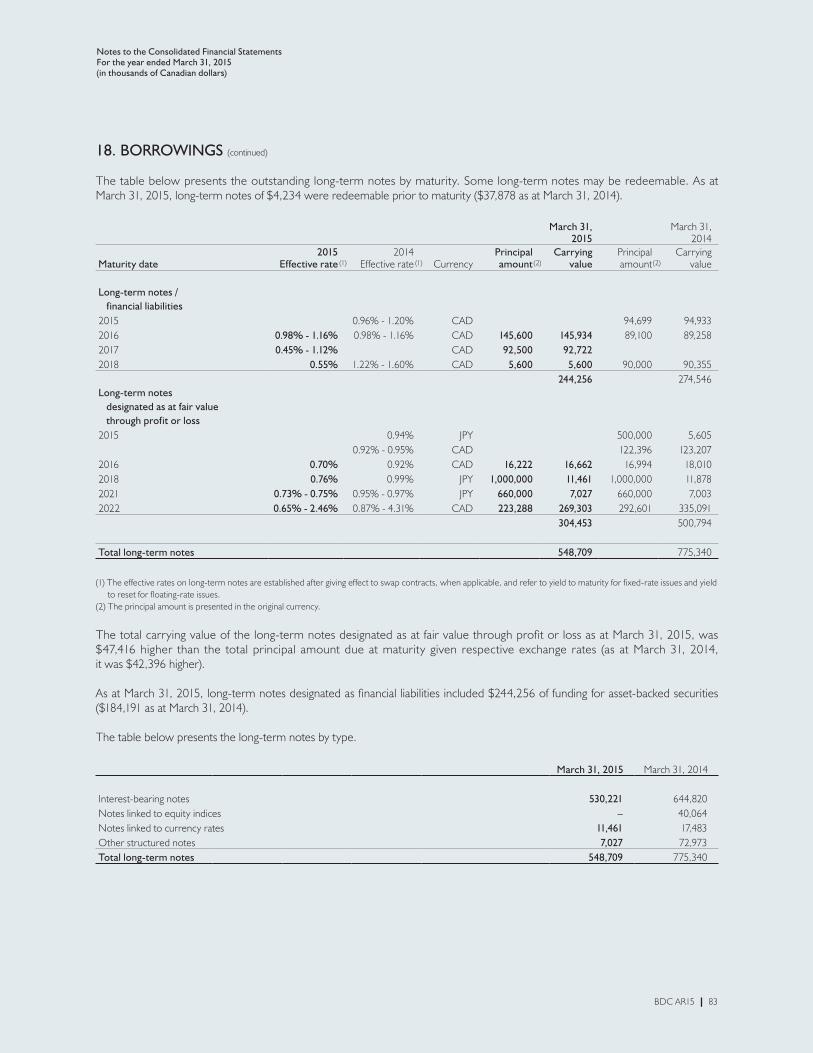
18. BORROWINGS (continued)
The table below presents the outstanding long-term notes by maturity. Some long-term notes may be redeemable. As at March 31, 2015, long-term notes of $4,234 were redeemable prior to maturity ($37,878 as at March 31, 2014).
March 31, 2015
March 31, 2014
Maturity date2015
Effective rate2014
Effective rate CurrencyPrincipalamount
Carryingvalue
Principalamount
Carryingvalue
Long-term notes / financial liabilities2015 0.96% - 1.20% CAD 94,699 94,933 2016 0.98% - 1.16% 0.98% - 1.16% CAD 145,600 145,934 89,100 89,258 2017 0.45% - 1.12% CAD 92,500 92,722 2018 0.55% 1.22% - 1.60% CAD 5,600 5,600 90,000 90,355
244,256 274,546 Long-term notes designated as at fair value through profit or loss2015 0.94% JPY 500,000 5,605
0.92% - 0.95% CAD 122,396 123,207 2016 0.70% 0.92% CAD 16,222 16,662 16,994 18,010 2018 0.76% 0.99% JPY 1,000,000 11,461 1,000,000 11,878 2021 0.73% - 0.75% 0.95% - 0.97% JPY 660,000 7,027 660,000 7,003 2022 0.65% - 2.46% 0.87% - 4.31% CAD 223,288 269,303 292,601 335,091
304,453 500,794
Total long-term notes 548,709 775,340
(1) The effective rates on long-term notes are established after giving effect to swap contracts, when applicable, and refer to yield to maturity for fixed-rate issues and yield to reset for floating-rate issues.
(2) The principal amount is presented in the original currency.
The total carrying value of the long-term notes designated as at fair value through profit or loss as at March 31, 2015, was $47,416 higher than the total principal amount due at maturity given respective exchange rates (as at March 31, 2014, it was $42,396 higher).
As at March 31, 2015, long-term notes designated as financial liabilities included $244,256 of funding for asset-backed securities ($184,191 as at March 31, 2014).
The table below presents the long-term notes by type.
March 31, 2015 March 31, 2014
Interest-bearing notes 530,221 644,820 Notes linked to equity indices – 40,064 Notes linked to currency rates 11,461 17,483 Other structured notes 7,027 72,973 Total long-term notes 548,709 775,340
(1) (1) (2) (2)
Notes to the Consolidated Financial StatementsFor the year ended March 31, 2015(in thousands of Canadian dollars)
BDC AR15 | 83
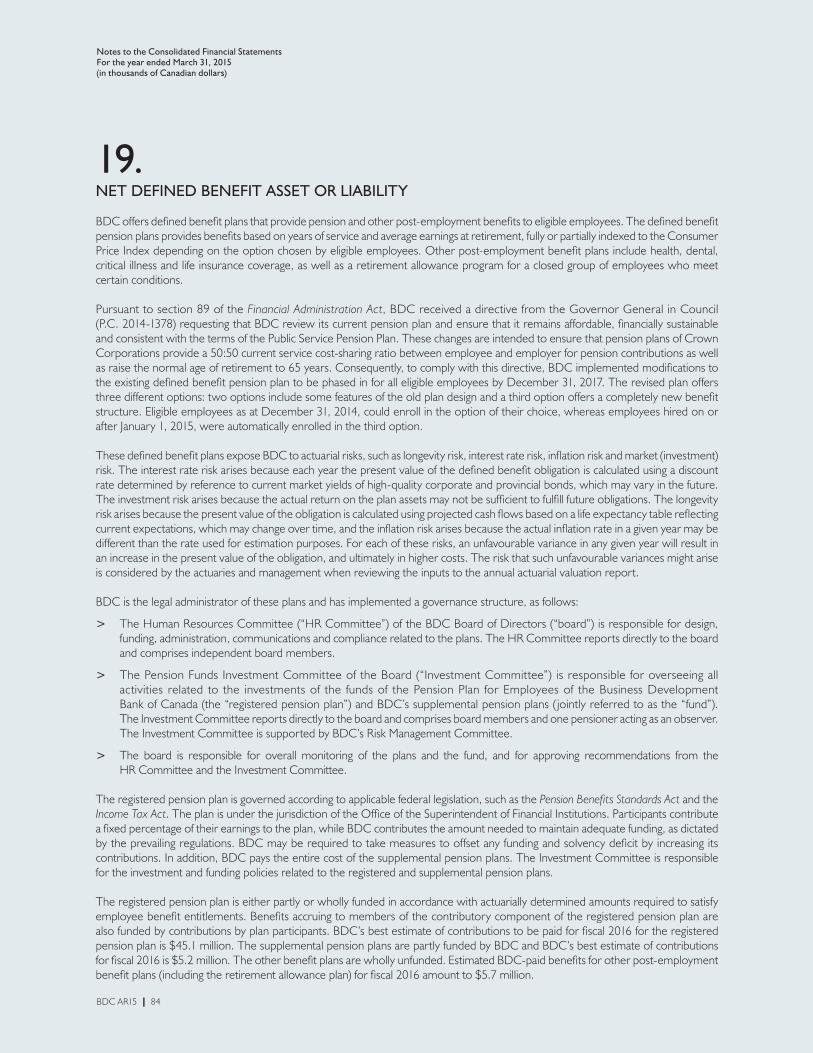
19.NET DEFINED BENEFIT ASSET OR LIABILITY
BDC offers defined benefit plans that provide pension and other post-employment benefits to eligible employees. The defined benefit pension plans provides benefits based on years of service and average earnings at retirement, fully or partially indexed to the Consumer Price Index depending on the option chosen by eligible employees. Other post-employment benefit plans include health, dental, critical illness and life insurance coverage, as well as a retirement allowance program for a closed group of employees who meet certain conditions.
Pursuant to section 89 of the Financial Administration Act, BDC received a directive from the Governor General in Council (P.C. 2014-1378) requesting that BDC review its current pension plan and ensure that it remains affordable, financially sustainable and consistent with the terms of the Public Service Pension Plan. These changes are intended to ensure that pension plans of Crown Corporations provide a 50:50 current service cost-sharing ratio between employee and employer for pension contributions as well as raise the normal age of retirement to 65 years. Consequently, to comply with this directive, BDC implemented modifications to the existing defined benefit pension plan to be phased in for all eligible employees by December 31, 2017. The revised plan offers three different options: two options include some features of the old plan design and a third option offers a completely new benefit structure. Eligible employees as at December 31, 2014, could enroll in the option of their choice, whereas employees hired on or after January 1, 2015, were automatically enrolled in the third option.
These defined benefit plans expose BDC to actuarial risks, such as longevity risk, interest rate risk, inflation risk and market (investment) risk. The interest rate risk arises because each year the present value of the defined benefit obligation is calculated using a discount rate determined by reference to current market yields of high-quality corporate and provincial bonds, which may vary in the future. The investment risk arises because the actual return on the plan assets may not be sufficient to fulfill future obligations. The longevity risk arises because the present value of the obligation is calculated using projected cash flows based on a life expectancy table reflecting current expectations, which may change over time, and the inflation risk arises because the actual inflation rate in a given year may be different than the rate used for estimation purposes. For each of these risks, an unfavourable variance in any given year will result in an increase in the present value of the obligation, and ultimately in higher costs. The risk that such unfavourable variances might arise is considered by the actuaries and management when reviewing the inputs to the annual actuarial valuation report.
BDC is the legal administrator of these plans and has implemented a governance structure, as follows:
> The Human Resources Committee (“HR Committee”) of the BDC Board of Directors (“board”) is responsible for design, funding, administration, communications and compliance related to the plans. The HR Committee reports directly to the board and comprises independent board members.
> The Pension Funds Investment Committee of the Board (“Investment Committee”) is responsible for overseeing all activities related to the investments of the funds of the Pension Plan for Employees of the Business Development Bank of Canada (the “registered pension plan”) and BDC’s supplemental pension plans (jointly referred to as the “fund”). The Investment Committee reports directly to the board and comprises board members and one pensioner acting as an observer. The Investment Committee is supported by BDC’s Risk Management Committee.
> The board is responsible for overall monitoring of the plans and the fund, and for approving recommendations from the HR Committee and the Investment Committee.
The registered pension plan is governed according to applicable federal legislation, such as the Pension Benefits Standards Act and the Income Tax Act. The plan is under the jurisdiction of the Office of the Superintendent of Financial Institutions. Participants contribute a fixed percentage of their earnings to the plan, while BDC contributes the amount needed to maintain adequate funding, as dictated by the prevailing regulations. BDC may be required to take measures to offset any funding and solvency deficit by increasing its contributions. In addition, BDC pays the entire cost of the supplemental pension plans. The Investment Committee is responsible for the investment and funding policies related to the registered and supplemental pension plans.
The registered pension plan is either partly or wholly funded in accordance with actuarially determined amounts required to satisfy employee benefit entitlements. Benefits accruing to members of the contributory component of the registered pension plan are also funded by contributions by plan participants. BDC’s best estimate of contributions to be paid for fiscal 2016 for the registered pension plan is $45.1 million. The supplemental pension plans are partly funded by BDC and BDC’s best estimate of contributions for fiscal 2016 is $5.2 million. The other benefit plans are wholly unfunded. Estimated BDC-paid benefits for other post-employment benefit plans (including the retirement allowance plan) for fiscal 2016 amount to $5.7 million.
Notes to the Consolidated Financial StatementsFor the year ended March 31, 2015(in thousands of Canadian dollars)
BDC AR15 | 84

19. NET DEFINED BENEFIT ASSET OR LIABILITY (continued)
The following tables present, in aggregate, information concerning the defined benefit plans.
Registered pension plan
Supplemental pension plans Other plans Total
2015 2014 2015 2014 2015 2014 2015 2014
Defined benefit obligation at beginning of year 1,029,218 948,111 99,642 92,131 143,607 134,308 1,272,467 1,174,550 Current service cost 40,145 40,767 2,449 2,193 5,174 4,645 47,768 47,605 Interest expense 46,385 40,964 4,503 3,981 6,480 5,788 57,368 50,733 Benefit payments from plan (41,675) (34,211) (3,500) (3,343) – – (45,175) (37,554)Benefit payments from employer – – – – (4,384) (4,424) (4,384) (4,424)Participant contributions 11,198 10,699 – – – – 11,198 10,699 Remeasurements Effect of changes in demographic assumptions 4,214 61,239 135 6,950 (4,452) 9,077 (103) 77,266 Effect of changes in financial assumptions 109,662 (45,575) 10,903 (3,056) 18,913 (4,411) 139,478 (53,042) Effect of experience adjustments 6,377 7,224 3,437 786 (2,025) (1,376) 7,789 6,634 Defined benefit obligation at end of year 1,205,524 1,029,218 117,569 99,642 163,313 143,607 1,486,406 1,272,467 Fair value of plan assets at beginning of year 1,112,745 934,894 55,028 48,411 – – 1,167,773 983,305 Interest income 51,838 42,343 2,647 2,215 – – 54,485 44,558 Employer contributions 60,075 79,617 5,813 4,890 – – 65,888 84,507 Participant contributions 11,198 10,699 – – – – 11,198 10,699 Benefit payments from plan (41,675) (34,211) (3,500) (3,343) – – (45,175) (37,554)Administrative expenses paid from plan assets (1,275) (1,231) (159) (117) – – (1,434) (1,348)Remeasurements Return on plan assets (excluding interest income) 113,047 80,634 1,389 2,972 – – 114,436 83,606 Fair value of plan assets at end of year 1,305,953 1,112,745 61,218 55,028 – – 1,367,171 1,167,773 Total net defined benefit (asset) (100,429) (83,527) – – – – (100,429) (83,527)Total net defined benefit liability – – 56,351 44,614 163,313 143,607 219,664 188,221
Notes to the Consolidated Financial StatementsFor the year ended March 31, 2015(in thousands of Canadian dollars)
BDC AR15 | 85

19. NET DEFINED BENEFIT ASSET OR LIABILITY (continued)
Registered pension plan
Supplemental pension plans Other plans Total
2015 2014 2015 2014 2015 2014 2015 2014
Expense recognized in net income Current service cost 40,145 40,767 2,449 2,193 5,174 4,645 47,768 47,605 Interest expense on defined benefit obligation 46,385 40,964 4,503 3,981 6,480 5,788 57,368 50,733 Interest income on plan assets (51,838) (42,343) (2,647) (2,215) – – (54,485) (44,558) Administrative expenses 1,275 1,231 159 117 – – 1,434 1,348 Expense recognized in net income 35,967 40,619 4,464 4,076 11,654 10,433 52,085 55,128 Remeasurements recognized in OCI Effect of changes in demographic assumptions 4,214 61,239 135 6,950 (4,452) 9,077 (103) 77,266 Effect of changes in financial assumptions 109,662 (45,575) 10,903 (3,056) 18,913 (4,411) 139,478 (53,042) Effect of experience adjustments 6,377 7,224 3,437 786 (2,025) (1,376) 7,789 6,634 Return on plan assets (excluding interest income) (113,047) (80,634) (1,389) (2,972) – – (114,436) (83,606)Remeasurement loss (gain) recognized in OCI 7,206 (57,746) 13,086 1,708 12,436 3,290 32,728 (52,748)
Notes to the Consolidated Financial StatementsFor the year ended March 31, 2015(in thousands of Canadian dollars)
BDC AR15 | 86

19. NET DEFINED BENEFIT ASSET OR LIABILITY (continued)
Plan assets for BDC’s registered and supplemental pension plans can be broken down into the following major categories of investments.
March 31,2015
March 31,2014
Investment type
Quotedon active market Unquoted Total
Quotedon active market Unquoted Total
Cash 24,651 – 24,651 21,537 – 21,537 Short-term investments 17,327 17,327 – 8,039 8,039 Bonds Government of Canada – 288,127 288,127 – 237,697 237,697 Canadian provinces – 168,598 168,598 – 124,625 124,625 Canadian corporate and municipal – 56,870 56,870 – 47,458 47,458 Equity investments Canadian equities 208,783 208,783 197,933 – 197,933 U.S. equities 104,145 104,145 97,825 – 97,825 Foreign equities 70,385 70,385 70,178 – 70,178 Pooled equity funds – 383,714 383,714 – 314,017 314,017 Private equity – 17,950 17,950 – 19,687 19,687 Derivatives – (1,598) (1,598) – 2,483 2,483 Other – 28,219 28,219 – 26,294 26,294 Fair value of plan assets 407,964 959,207 1,367,171 387,473 780,300 1,167,773
The investment objective for the plan assets of the registered pension plan is to outperform, in the long term, the pension obligation growth rate to compensate for the risk taken. The Pension Funds Investment Committee has established an investment policy that stipulates a diversification strategy, an acceptable level of investment risk and a commensurate rate of return. The policy allows the use of derivatives for the purpose of managing currency risks. The plan assets must be invested in a portfolio of diversified securities, according to the investment policy established and approved by the Investment Committee. These investments must be well diversified by industrial sector, based on the industry classification of specific identified indices. According to the policy, the portfolio can be divided into two large categories of investments: equity and fixed income assets. The target for fixed income assets is set at 40% of the fair market value of the portfolio. Investments in equity should represent approximately 60% of the fund’s investments (30% in foreign equity, 27.5% in domestic equity and 2.5% in private markets, the latter planned to increase to 7.5%). The positioning of the asset mix is reviewed on a monthly basis to assess the need for a rebalancing exercise.
Notes to the Consolidated Financial StatementsFor the year ended March 31, 2015(in thousands of Canadian dollars)
BDC AR15 | 87
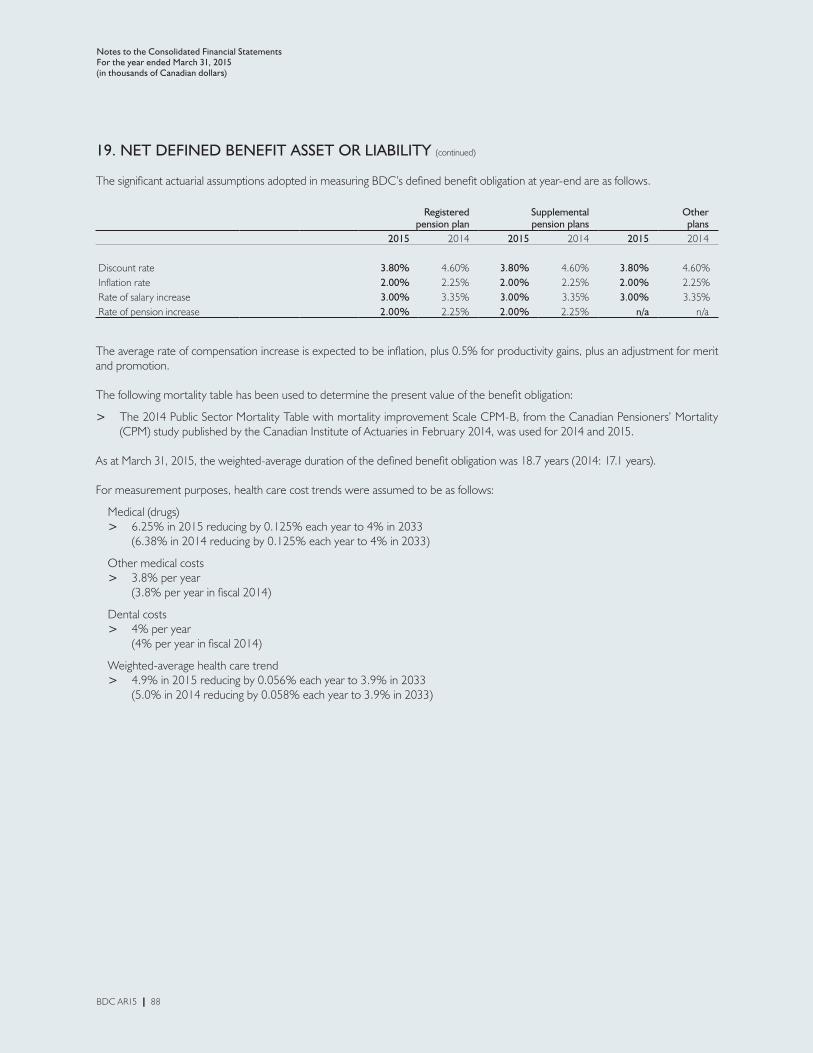
19. NET DEFINED BENEFIT ASSET OR LIABILITY (continued)
The significant actuarial assumptions adopted in measuring BDC’s defined benefit obligation at year-end are as follows.
Registered pension plan
Supplemental pension plans
Other plans
2015 2014 2015 2014 2015 2014
Discount rate 3.80% 4.60% 3.80% 4.60% 3.80% 4.60% Inflation rate 2.00% 2.25% 2.00% 2.25% 2.00% 2.25% Rate of salary increase 3.00% 3.35% 3.00% 3.35% 3.00% 3.35% Rate of pension increase 2.00% 2.25% 2.00% 2.25% n/a n/a
The average rate of compensation increase is expected to be inflation, plus 0.5% for productivity gains, plus an adjustment for merit and promotion.
The following mortality table has been used to determine the present value of the benefit obligation:
> The 2014 Public Sector Mortality Table with mortality improvement Scale CPM-B, from the Canadian Pensioners’ Mortality (CPM) study published by the Canadian Institute of Actuaries in February 2014, was used for 2014 and 2015.
As at March 31, 2015, the weighted-average duration of the defined benefit obligation was 18.7 years (2014: 17.1 years).
For measurement purposes, health care cost trends were assumed to be as follows:
Medical (drugs) > 6.25% in 2015 reducing by 0.125% each year to 4% in 2033
(6.38% in 2014 reducing by 0.125% each year to 4% in 2033)
Other medical costs > 3.8% per year
(3.8% per year in fiscal 2014)
Dental costs > 4% per year
(4% per year in fiscal 2014)
Weighted-average health care trend > 4.9% in 2015 reducing by 0.056% each year to 3.9% in 2033
(5.0% in 2014 reducing by 0.058% each year to 3.9% in 2033)
Notes to the Consolidated Financial StatementsFor the year ended March 31, 2015(in thousands of Canadian dollars)
BDC AR15 | 88
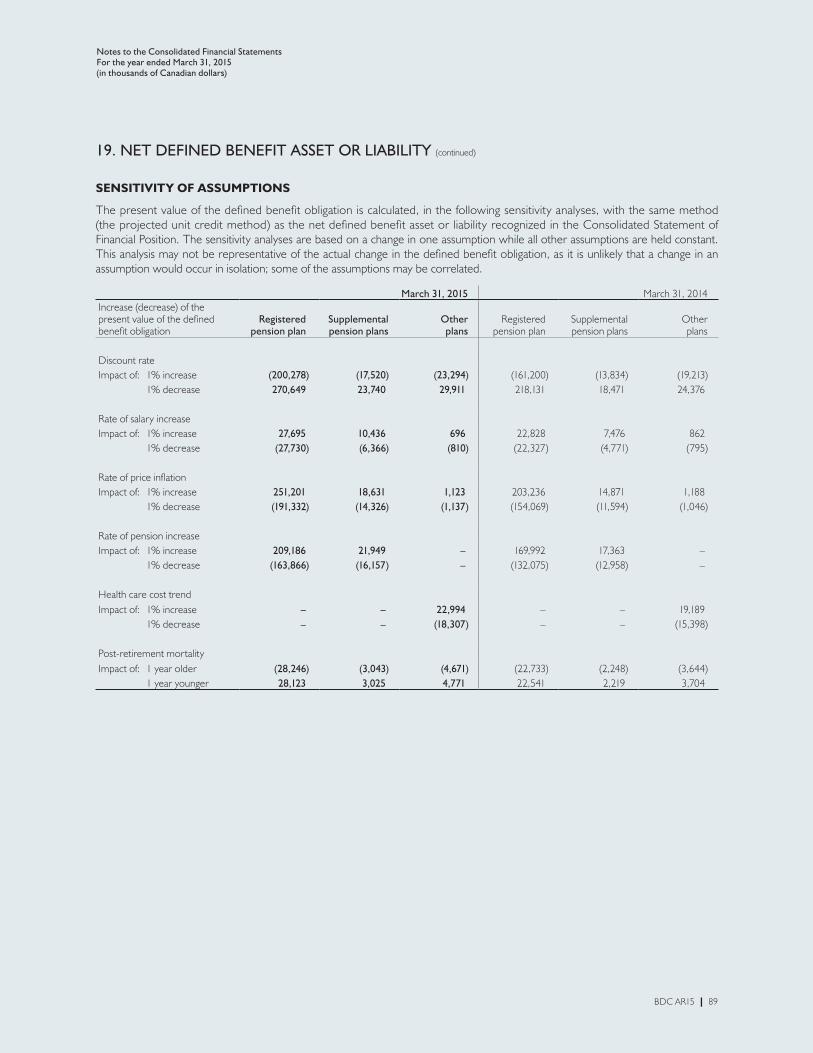
19. NET DEFINED BENEFIT ASSET OR LIABILITY (continued)
SENSITIVITY OF ASSUMPTIONS
The present value of the defined benefit obligation is calculated, in the following sensitivity analyses, with the same method (the projected unit credit method) as the net defined benefit asset or liability recognized in the Consolidated Statement of Financial Position. The sensitivity analyses are based on a change in one assumption while all other assumptions are held constant. This analysis may not be representative of the actual change in the defined benefit obligation, as it is unlikely that a change in an assumption would occur in isolation; some of the assumptions may be correlated.
March 31, 2015 March 31, 2014Increase (decrease) of the present value of the defined benefit obligation
Registeredpension plan
Supplemental pension plans
Otherplans
Registeredpension plan
Supplemental pension plans
Otherplans
Discount rate Impact of: 1% increase (200,278) (17,520) (23,294) (161,200) (13,834) (19,213) 1% decrease 270,649 23,740 29,911 218,131 18,471 24,376
Rate of salary increaseImpact of: 1% increase 27,695 10,436 696 22,828 7,476 862 1% decrease (27,730) (6,366) (810) (22,327) (4,771) (795)
Rate of price inflationImpact of: 1% increase 251,201 18,631 1,123 203,236 14,871 1,188 1% decrease (191,332) (14,326) (1,137) (154,069) (11,594) (1,046)
Rate of pension increaseImpact of: 1% increase 209,186 21,949 – 169,992 17,363 – 1% decrease (163,866) (16,157) – (132,075) (12,958) –
Health care cost trendImpact of: 1% increase – – 22,994 – – 19,189 1% decrease – – (18,307) – – (15,398)
Post-retirement mortalityImpact of: 1 year older (28,246) (3,043) (4,671) (22,733) (2,248) (3,644) 1 year younger 28,123 3,025 4,771 22,541 2,219 3,704
Notes to the Consolidated Financial StatementsFor the year ended March 31, 2015(in thousands of Canadian dollars)
BDC AR15 | 89

20.OTHER LIABILITIES
March 31, 2015 March 31, 2014Financial instruments Deposits from clients 25,144 24,957 Other(1) 2,424 6,660
27,568 31,617
Deferred income 3,937 5,822 Other(1) 4,761 5,552 Total other liabilities 36,266 42,991
(1) All other liabilities are non-current.
21.SHARE CAPITAL
An unlimited number of common shares, having a par value of $100 each, is authorized. As at March 31, 2015, there were 21,384,000 common shares outstanding (21,384,000 as at March 31, 2014).
On June 4, 2015, before the date of approval of the fiscal 2015 Consolidated Financial Statements, 1,500,000 common shares for $150.0 million were issued by BDC. On the date of approval of the fiscal 2015 Consolidated Financial Statements, a dividend in respect of common shares of $62.9 million was declared, based on fiscal 2015 performance ($54.6 million in 2014). These transactions had no impact on the fiscal 2015 Consolidated Financial Statements.
In fiscal 2015, no common shares were issued by BDC (500,000 in 2014).
RECONCILIATION OF THE NUMBER OF COMMON SHARES ISSUED AND OUSTANDING
2015 2014
As at the beginning of the year 21,384,000 20,884,000 Shares issued – 500,000 As at the end of the year 21,384,000 21,384,000
Notes to the Consolidated Financial StatementsFor the year ended March 31, 2015(in thousands of Canadian dollars)
BDC AR15 | 90

22.CAPITAL MANAGEMENT
STATUTORY LIMITATIONS
As per the BDC Act, the debt-to-equity ratio of BDC may not exceed 12:1. This ratio is defined as the aggregate of borrowings recognized in the Consolidated Statement of Financial Position and contingent liabilities that exist in the form of financial guarantees issued by BDC over equity attributable to BDC’s shareholder, which excludes accumulated other comprehensive income. BDC’s ratio as at March 31, 2015, was 3.4:1 (3.4:1 as at March 31, 2014).
In addition, the paid-in capital, the contributed surplus and any proceeds that have been prescribed as equity (such as hybrid capital instruments) must not at any time exceed $3.0 billion. As at March 31, 2015, these amounts totalled $2.2 billion ($2.2 billion as at March 31, 2014).
During 2015 and 2014, BDC met both of these statutory limitations.
CAPITAL ADEQUACY
Treasury Board of Canada Secretariat provides guidelines to BDC on its capital adequacy ratios. BDC must maintain overall capital and allowance for credit losses sufficient to ensure that BDC can withstand unfavourable economic circumstances without requiring additional government funding. These capital adequacy ratios reflect the relative risk of BDC’s assets.
The recommended capital is 10% for the Funding Platform for Independent Lenders; 10% for term loans and 25% for quasi-equity loans, net of allowance for credit losses; 25% for subordinate financing investments; 100% for venture capital investments; and 100% for venture capital action plan investments. BDC has also established capital adequacy ratios for loan guarantees and letters of credit to reflect their relative risks (refer to Note 26—Guarantees and Contingent Liabilities, for additional information).
In addition to these minimum capital ratios, the capital level is also internally managed to ensure that BDC can honour its commitments as they become due (refer to Note 27—Commitments, for additional information) and that the level of capital is also sufficient to remain financially sustainable during a recessionary scenario, using stress-testing analysis. Note that BDC also uses an economic capital model to internally assess its capital adequacy. Economic capital is calculated for various types of risk, and models are based on advanced quantification methods and internal risk-based assumptions.
The available capital represents the equity attributable to BDC’s shareholder and is adjusted to exclude accumulated other comprehensive income on cash flow hedges. In fiscal 2015, BDC has refined its definition of available capital to deduct any net defined benefit asset in order to minimize the volatility resulting from immediate recognition of actuarial gains and losses. Fiscal 2014 available capital amount has been revised accordingly.
Notes to the Consolidated Financial StatementsFor the year ended March 31, 2015(in thousands of Canadian dollars)
BDC AR15 | 91
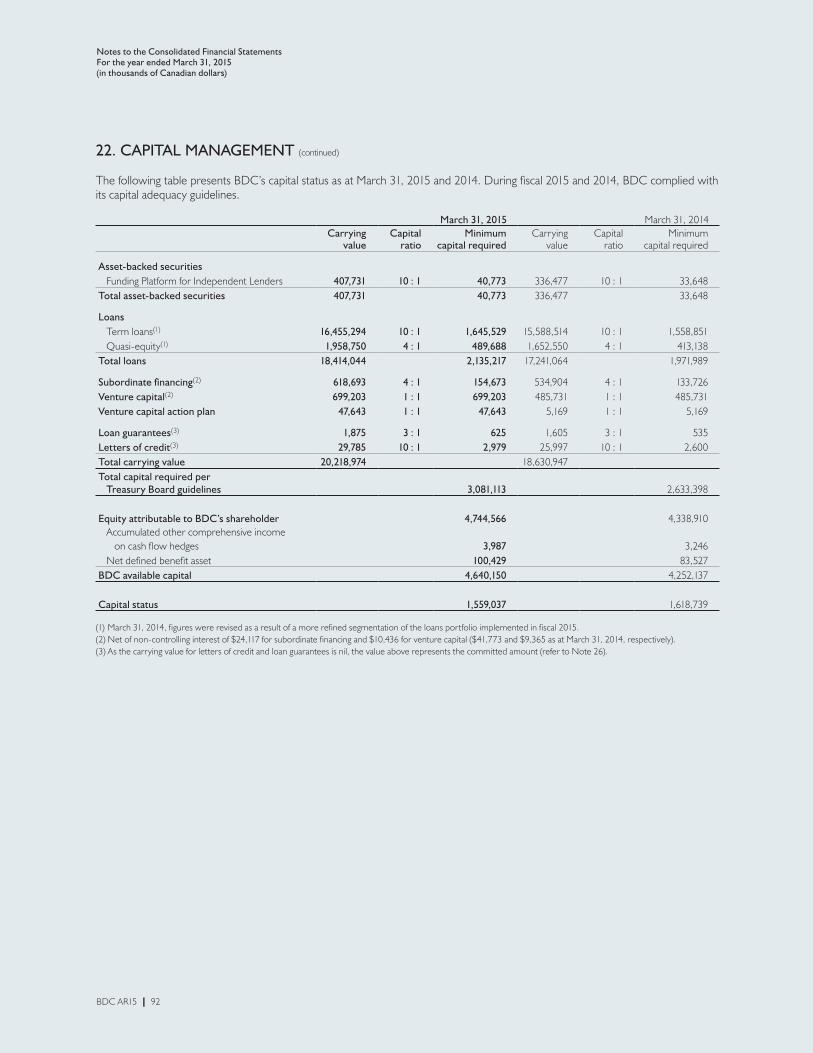
22. CAPITAL MANAGEMENT (continued)
The following table presents BDC’s capital status as at March 31, 2015 and 2014. During fiscal 2015 and 2014, BDC complied with its capital adequacy guidelines.
March 31, 2015 March 31, 2014Carrying
valueCapital
ratio Minimum capital required
Carrying value
Capital ratio
Minimum capital required
Asset-backed securities Funding Platform for Independent Lenders 407,731 10 : 1 40,773 336,477 10 : 1 33,648 Total asset-backed securities 407,731 40,773 336,477 33,648
Loans Term loans(1) 16,455,294 10 : 1 1,645,529 15,588,514 10 : 1 1,558,851 Quasi-equity(1) 1,958,750 4 : 1 489,688 1,652,550 4 : 1 413,138 Total loans 18,414,044 2,135,217 17,241,064 1,971,989
Subordinate financing(2) 618,693 4 : 1 154,673 534,904 4 : 1 133,726 Venture capital(2) 699,203 1 : 1 699,203 485,731 1 : 1 485,731 Venture capital action plan 47,643 1 : 1 47,643 5,169 1 : 1 5,169
Loan guarantees(3) 1,875 3 : 1 625 1,605 3 : 1 535 Letters of credit(3) 29,785 10 : 1 2,979 25,997 10 : 1 2,600 Total carrying value 20,218,974 18,630,947 Total capital required per Treasury Board guidelines 3,081,113 2,633,398
Equity attributable to BDC’s shareholder 4,744,566 4,338,910 Accumulated other comprehensive income on cash flow hedges 3,987 3,246 Net defined benefit asset 100,429 83,527 BDC available capital 4,640,150 4,252,137
Capital status 1,559,037 1,618,739
(1) March 31, 2014, figures were revised as a result of a more refined segmentation of the loans portfolio implemented in fiscal 2015.(2) Net of non-controlling interest of $24,117 for subordinate financing and $10,436 for venture capital ($41,773 and $9,365 as at March 31, 2014, respectively).(3) As the carrying value for letters of credit and loan guarantees is nil, the value above represents the committed amount (refer to Note 26).
Notes to the Consolidated Financial StatementsFor the year ended March 31, 2015(in thousands of Canadian dollars)
BDC AR15 | 92

23.RISK MANAGEMENT
GOVERNANCE
Risk is an inherent feature of the financial sector. BDC has strong risk management practices that emphasize risk identification, risk management, transparency and accountability.
NATURE AND EXTENT OF RISKS ARISING FROM FINANCIAL INSTRUMENTS
BDC is exposed to the following financial risks: credit risk, market risk and liquidity risk. This note provides the definitions of these risks and describes BDC’s risk management policies and risk measurements.
CREDIT RISKCredit risk is the risk that a financial loss will be incurred due to the failure of a counterparty in discharging its contractual commitment or obligation to BDC. For the purposes of credit risk management activities, BDC distinguishes between credit risk arising from asset-backed securities issuers, borrowers and investees, and counterparties to treasury activities.
Asset-backed securities issuersThe ABS portfolio consists of investment-grade senior and subordinated notes issued by way of private placement. ABS are fully backed by security consisting of portfolios of loans and leases on vehicles and equipment, as well as dealer floor plan loans, for which there is no significant concentration risk.
In order to mitigate the credit risk on the underlying asset portfolio, generally, there are structural or credit protections. Also, the face value of the subordinated notes does not exceed 10% of the senior notes. In addition, securities purchased must be of a certain grade. At time of purchase, senior note investments purchased by way of private placement must be, at a minimum, an implied investment grade. The implied rating is calculated by BDC using the same scale as rating agencies. The rating is derived by evaluating the transaction structure and the credit enhancement supporting the securities.
Subsequently, BDC receives portfolio reports that describe the performance of the securities, along with the cash flows associated with the collateral, in order to evaluate the securities. In addition, for ABS that were issued by way of private placements, BDC uses an internal risk rating system to monitor credit risk.
As at March 31, 2015 and 2014, none of the notes were past due and none had suffered a deterioration in their credit rating. The maximum exposure to credit risk of ABS is limited to the carrying value of the securities. Refer to Note 9—Asset-Backed Securities, for additional information on this portfolio.
Notes to the Consolidated Financial StatementsFor the year ended March 31, 2015(in thousands of Canadian dollars)
BDC AR15 | 93
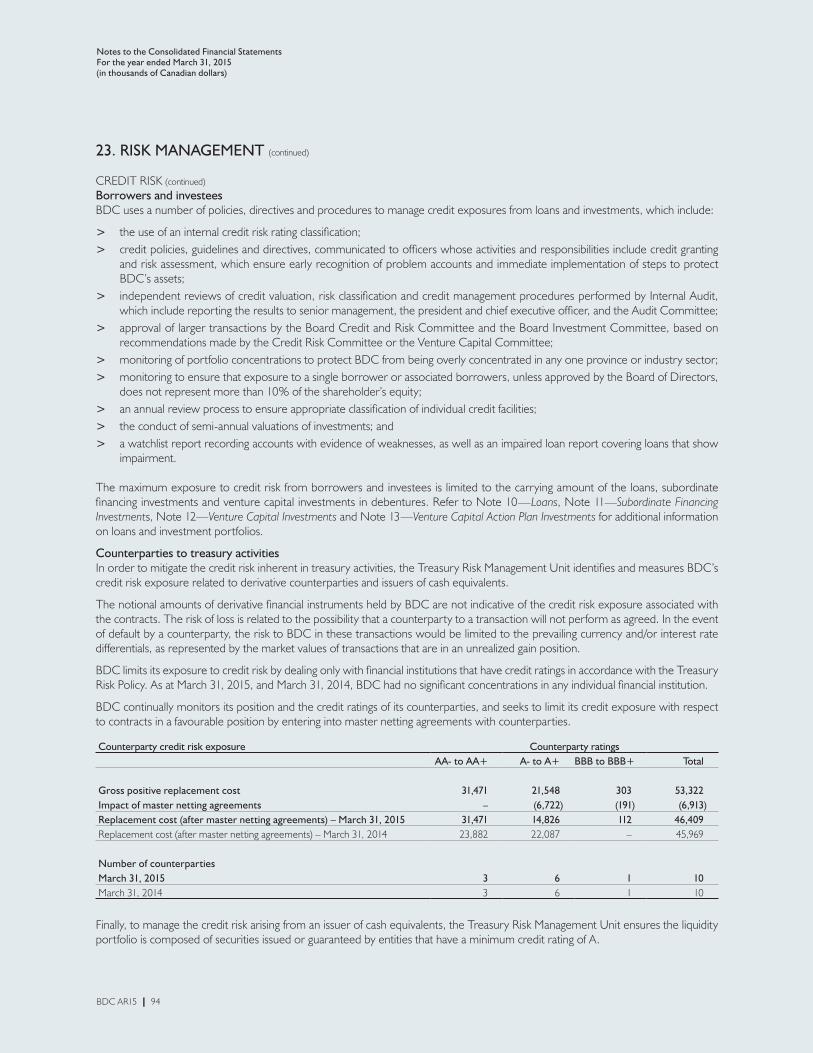
23. RISK MANAGEMENT (continued)
CREDIT RISK (continued)
Borrowers and investeesBDC uses a number of policies, directives and procedures to manage credit exposures from loans and investments, which include:
> the use of an internal credit risk rating classification; > credit policies, guidelines and directives, communicated to officers whose activities and responsibilities include credit granting
and risk assessment, which ensure early recognition of problem accounts and immediate implementation of steps to protect BDC’s assets;
> independent reviews of credit valuation, risk classification and credit management procedures performed by Internal Audit, which include reporting the results to senior management, the president and chief executive officer, and the Audit Committee;
> approval of larger transactions by the Board Credit and Risk Committee and the Board Investment Committee, based on recommendations made by the Credit Risk Committee or the Venture Capital Committee;
> monitoring of portfolio concentrations to protect BDC from being overly concentrated in any one province or industry sector; > monitoring to ensure that exposure to a single borrower or associated borrowers, unless approved by the Board of Directors,
does not represent more than 10% of the shareholder’s equity; > an annual review process to ensure appropriate classification of individual credit facilities; > the conduct of semi-annual valuations of investments; and > a watchlist report recording accounts with evidence of weaknesses, as well as an impaired loan report covering loans that show
impairment.
The maximum exposure to credit risk from borrowers and investees is limited to the carrying amount of the loans, subordinate financing investments and venture capital investments in debentures. Refer to Note 10—Loans, Note 11—Subordinate Financing Investments, Note 12—Venture Capital Investments and Note 13—Venture Capital Action Plan Investments for additional information on loans and investment portfolios.
Counterparties to treasury activitiesIn order to mitigate the credit risk inherent in treasury activities, the Treasury Risk Management Unit identifies and measures BDC’s credit risk exposure related to derivative counterparties and issuers of cash equivalents.
The notional amounts of derivative financial instruments held by BDC are not indicative of the credit risk exposure associated with the contracts. The risk of loss is related to the possibility that a counterparty to a transaction will not perform as agreed. In the event of default by a counterparty, the risk to BDC in these transactions would be limited to the prevailing currency and/or interest rate differentials, as represented by the market values of transactions that are in an unrealized gain position.
BDC limits its exposure to credit risk by dealing only with financial institutions that have credit ratings in accordance with the Treasury Risk Policy. As at March 31, 2015, and March 31, 2014, BDC had no significant concentrations in any individual financial institution.
BDC continually monitors its position and the credit ratings of its counterparties, and seeks to limit its credit exposure with respect to contracts in a favourable position by entering into master netting agreements with counterparties.
Counterparty credit risk exposure Counterparty ratingsAA- to AA+ A- to A+ BBB to BBB+ Total
Gross positive replacement cost 31,471 21,548 303 53,322 Impact of master netting agreements – (6,722) (191) (6,913)Replacement cost (after master netting agreements) – March 31, 2015 31,471 14,826 112 46,409 Replacement cost (after master netting agreements) – March 31, 2014 23,882 22,087 – 45,969
Number of counterpartiesMarch 31, 2015 3 6 1 10 March 31, 2014 3 6 1 10
Finally, to manage the credit risk arising from an issuer of cash equivalents, the Treasury Risk Management Unit ensures the liquidity portfolio is composed of securities issued or guaranteed by entities that have a minimum credit rating of A.
Notes to the Consolidated Financial StatementsFor the year ended March 31, 2015(in thousands of Canadian dollars)
BDC AR15 | 94

23. RISK MANAGEMENT (continued)
MARKET RISKMarket risk is defined as the risk that the fair value or future cash flows of a financial instrument will fluctuate as a result of changes in financial market variables, such as interest and foreign exchange rates, as well as equity and commodity prices. Market risk for BDC also arises from volatile unpredictable market events affecting the value of venture capital investments.
Equity market riskAs set out in the treasury risk policy, BDC manages market risk by matching the terms of assets and liabilities. As a result, BDC structured notes are economically hedged, using derivatives, to eliminate market risks such as exposure to interest rates in foreign markets, equity prices, and commodity or index fluctuations (refer to Note 8—Derivative Financial Instruments, for additional information). Therefore, BDC is not exposed to equity price risk, except for its venture capital investments, which is further explained in the venture capital market risk section of this note.
Interest rate riskInterest rate risk is defined as the risk that the fair value or future cash flows of a financial instrument will fluctuate as a result of changes in market interest rates. For BDC, the risk and potential variability in earnings arise primarily when cash flows associated with interest-sensitive assets and liabilities have different repricing dates. A positive interest rate gap exists when interest-sensitive assets exceed interest-sensitive liabilities for a specific maturity or repricing period. A positive gap will result in an increase in net interest income when market interest rates rise, since assets reprice earlier than liabilities. The opposite impact will occur when market interest rates fall.
To manage the interest rate gap on its asset-backed securities, BDC funds each issuance of asset-backed securities with specific long-term borrowings. Long-term borrowings have similar payment schedules and repricing periods to mitigate interest rate risk. Refer to Note 18—Borrowings, for additional information.
To manage the interest rate gap on its other interest-sensitive assets and interest-sensitive liabilities, BDC establishes policy guidelines for interest rate gap positions, regularly monitors the Bank’s situation and decides future strategies in light of changing market conditions. The objective is to manage the interest rate risk using sound and prudent guidelines. Interest rate risk policies included in the Treasury Risk Policy are approved and reviewed at least annually by the Board of Directors.
Exposure to interest rate risk is controlled by managing the size of the static gap positions between interest-sensitive assets and interest-sensitive liabilities. Gap analysis is supplemented by computer simulation of the asset liability portfolio structure and by a duration analysis. The interest rate gap is measured daily.
Exposure to interest rate risk is also monitored using a net interest income sensitivity stress test. A parallel and sustainable 200-basis-point shock on the Canadian yield curve is simulated and the impact on net interest income has to be less than 10%. As at March 31, 2015, the impact was 5% or $44 million on net income and equity (5% or $45 million as at March 31, 2014).
Notes to the Consolidated Financial StatementsFor the year ended March 31, 2015(in thousands of Canadian dollars)
BDC AR15 | 95

23. RISK MANAGEMENT (continued)
MARKET RISK (continued)
Interest rate risk (continued)
The following tables summarize BDC’s interest rate sensitivity position based on the difference between the carrying value of assets and the carrying value of liabilities and equity, grouped by the earlier of contractual repricing or maturity date. The effective yield represents the weighted-average effective yield based on the earlier of contractual repricing or maturity date. This gap analysis is a static measurement of interest rate-sensitive gaps at a specific time. These gaps can change significantly in a short period of time.
Canadian dollar transactions
Floating rate Within 3 months
4 to 12 months
1 to 5 years
Over 5 years
Non-rate- sensitive
Allowance and fair value Total
AssetsCash and cash equivalents 8,704 656,508 665,212 Effective yield (%) 0.85 Derivative assets 52,079 52,079 Asset-backed securities 407,731 407,731 Effective yield (%) 2.07 Loans 14,464,132 225,867 436,123 2,385,029 805,440 490,556 (527,331) 18,279,816 Effective yield (%) 5.06 4.88 5.09 5.04 5.33 Subordinate financing investments 147,722 17,456 46,242 314,071 24,530 103,965 (15,236) 638,750 Effective yield(1) (%) 10.33 11.72 10.77 10.32 11.01 Venture capital investments 475,097 475,097 Venture capital action plan investments 47,643 47,643 Other 186,744 186,744
14,620,558 951,910 482,365 2,699,100 1,237,701 1,304,005 (542,567) 20,753,072
Liabilities and equityDerivative liabilities 5,793 5,793 Short-term notes 15,435,363 15,435,363 Effective yield (%) 0.54 Long-term notes 19,782 142,814 98,322 269,303 530,221 Effective yield (%) 1.12 1.00 0.91 1.64 Other 357,819 357,819 Total equity 4,779,120 4,779,120
– 15,455,145 142,814 104,115 269,303 5,136,939 – 21,108,316
Total gap position before derivativesMarch 31, 2015 14,620,558 (14,503,235) 339,551 2,594,985 968,398 (3,832,934) (542,567) (355,244)March 31, 2014 13,488,587 (13,056,087) 397,709 2,253,339 936,387 (3,741,081) (532,951) (254,097)
Total derivative position – (527,510) 189,222 115,000 223,288 – – – Total gap position March 31, 2015 14,620,558 (15,030,745) 528,773 2,709,985 1,191,686 (3,832,934) (542,567) (355,244)Total gap position March 31, 2014 13,488,587 (13,591,078) 454,455 2,333,333 1,228,988 (3,635,431) (532,951) (254,097)
(1) Excludes non-interest return.(2) This grouping includes asset-backed securities, short-term and long-term notes for which interest rates reset monthly. The short-term and long-term notes are used
to fund floating-rate assets.(3) Assets, liabilities and equities that are non-rate sensitive have no specific maturity.
(2) (3)
Notes to the Consolidated Financial StatementsFor the year ended March 31, 2015(in thousands of Canadian dollars)
BDC AR15 | 96

23. RISK MANAGEMENT (continued)
MARKET RISK (continued)
Interest rate risk (continued)
Foreign currency transactions, expressed in Canadian dollars
Floating rate Within 3 months
4 to 12 months
1 to 5 years
Over 5 years
Non-rate- sensitive
Allowance and fair value Total
AssetsCash and cash equivalents 1,872 1,872
Effective yield (%)Derivative assets 824 419 1,243 Loans 136,820 (2,592) 134,228
Effective yield (%) 3.77 Subordinate financing investments 3,991 69 4,060
Effective yield(1) (%) 10.03 Venture capital investments 234,542 234,542
142,683 824 – – – 234,961 (2,523) 375,945
Liabilities and equityDerivative liabilities 228 1,494 1,722 Short-term notes 384 384 Effective yield (%) 0.00Long-term notes 18,488 18,488
Effective yield (%) 0.75 Other 107 107
– 612 – 18,488 – 1,601 – 20,701
Total gap position before derivativesMarch 31, 2015 142,683 212 – (18,488) – 233,360 (2,523) 355,244 March 31, 2014 103,992 (659) – (17,483) (7,003) 175,250 – 254,097
Total derivative position – (18,731) – 11,192 7,539 – – – Total gap position March 31, 2015 142,683 (18,519) – (7,296) 7,539 233,360 (2,523) 355,244 Total gap position March 31, 2014 103,992 (23,788) 5,354 (6,775) 64 175,250 – 254,097
(1) Excludes non-interest return.(2) This grouping includes asset-backed securities, short-term and long-term notes for which interest rates reset monthly. The short-term and long-term notes are used
to fund floating-rate assets.(3) Assets, liabilities and equities that are non-rate sensitive have no specific maturity.
Total transactions, expressed in Canadian dollars
Floating rate Within 3 months
4 to 12 months
1 to 5 years
Over 5 years
Non-rate- sensitive
Allowance and fair value Total
Total gap position for Canadian dollar transactions 14,620,558 (15,030,745) 528,773 2,709,985 1,191,686 (3,832,934) (542,567) (355,244)Total gap position for foreign currency transactions 142,683 (18,519) – (7,296) 7,539 233,360 (2,523) 355,244 Total gap position March 31, 2015 14,763,241 (15,049,264) 528,773 2,702,689 1,199,225 (3,599,574) (545,090) – Total gap position March 31, 2014 13,592,579 (13,614,866) 459,809 2,326,558 1,229,052 (3,460,181) (532,951) –
(2) (3)
Notes to the Consolidated Financial StatementsFor the year ended March 31, 2015(in thousands of Canadian dollars)
BDC AR15 | 97

23. RISK MANAGEMENT (continued)
MARKET RISK (continued)
Foreign exchange riskForeign exchange risk arises when there is a difference between assets and liabilities held in foreign currencies. Foreign exchange risk is defined as the risk that the fair value or future cash flows of a financial instrument will fluctuate as a result of changes in foreign exchange rates. BDC’s policy and practice are to economically hedge borrowings, subordinate financing investments and loans in foreign currencies so that the residual exposure to foreign exchange risk is not significant. Venture capital investments are hedged following the occurrence of a liquidity event. Refer to Note 8—Derivative Financial Instruments, for more information.
Venture capital market riskUnpredictable financial markets, as well as the presence and appetite of buyers, dictate the timing of venture capital divestitures. This timing, in turn, affects the value of BDC venture capital investments. To manage this risk, BDC uses a rigorous selection process of investments and works closely with its investee companies. BDC also lowers the risk of its venture capital and venture capital action plan investments by applying conservative valuations when purchasing participation in a company, co-investing with other venture capital investors and monitoring investments regularly.
The Internal Risk Committees, composed of senior managers, review all investment transactions and approve those within their delegated limits. For larger transactions, these committees make recommendations to the Venture Capital Investment and Risk Committee of the board for approval.
LIQUIDITY RISKLiquidity risk is the risk that BDC will be unable to honour all its contractual cash outflows as they become due. Contractual payments for BDC represent (i) repayment of debt; (ii) timely disbursement of committed loans, investments and asset-backed securities; and (iii) payments of dividends, and operating and administrative expenses.
Notes to the Consolidated Financial StatementsFor the year ended March 31, 2015(in thousands of Canadian dollars)
BDC AR15 | 98

23. RISK MANAGEMENT (continued)
LIQUIDITY RISK (continued)
The following tables present contractual maturities of financial liabilities and commitments and are based on notional amounts, which may differ from carrying values.
Within 1 year 1 to 5 years
Over 5 years
No fixed maturity Total
Accounts payable and accrued liabilities 67,509 34,487 – – 101,996 Derivative liabilities(1) 2,501 5,001 – – 7,502 Short-term notes(2) 15,463,311 – – – 15,463,311 Long-term notes(2) 237,535 446,947 324,123 – 1,008,605 Other financial liabilities – – – 27,568 27,568 Commitments Loans 2,255,240 – – – 2,255,240 Subordinate financing investments 67,661 – – – 67,661 Venture capital investments – – – 337,082 337,082 Venture capital action plan investments – – – 272,979 272,979 Asset-backed securities 227,000 – – – 227,000 Letters of credit and loan guarantees – – – 31,660 31,660 Total as at March 31, 2015 18,320,757 486,435 324,123 669,289 19,800,604
Within 1 year 1 to 5 years
Over 5 years
No fixed maturity Total
Accounts payable and accrued liabilities 71,735 34,292 – – 106,027 Derivative liabilities(1) 3,579 7,501 – – 11,080 Short-term notes(2) 14,095,026 – – – 14,095,026 Long-term notes(2) 415,189 523,712 495,523 – 1,434,424 Other financial liabilities – – – 31,617 31,617 Commitments Loans 1,896,622 – – – 1,896,622 Subordinate financing investments 53,721 – – – 53,721 Venture capital investments – – – 327,259 327,259 Venture capital action plan investments – – – 204,298 204,298 Asset-backed securities 196,000 – – – 196,000 Letters of credit and loan guarantees – – – 27,602 27,602 Total as at March 31, 2014 16,731,872 565,505 495,523 590,776 18,383,676
(1) Derivative liabilities reflect the interest payments to maturity of derivatives.(2) Short-term and long-term notes reflect the notional amount that will be paid as per the contractual note agreements.
Notes to the Consolidated Financial StatementsFor the year ended March 31, 2015(in thousands of Canadian dollars)
BDC AR15 | 99

23. RISK MANAGEMENT (continued)
LIQUIDITY RISK (continued)
A lack of marketability could make it expensive or even impossible to liquidate the securities held by BDC, which could also compromise the short-term continuity of normal business. To avoid any liquidity-related disruptions, BDC ensures that cash is invested in highly liquid and high-quality securities that can be sold to a wide range of counterparties without incurring a substantial discount.
BDC’s liquidity risk management objective is to mitigate this risk by:
> providing for a minimum level of short-term assets over short-term liabilities to cover commitment, market, systemic and operational risks;
> minimizing the unproductive cash balance in the cash account; and
> achieving a return on liquid assets in excess of cost while protecting BDC’s capital.
The treasury risk policy establishes risk tolerance parameters, provides delegation of authority to BDC’s Treasury Department to transact in approved products and provides limits related to specific measures. The policy governs management, measurement, monitoring and reporting requirements related to liquidity. Paragraph 18(3) of the BDC Act defines the instruments in which BDC may invest its liquidity.
BDC’s liquidity management practices and processes reinforce its risk mitigation strategies by assigning prudent liquidity levels, concentration requirements and maturity profile requirements, as outlined below:
> The minimum liquidity level covers at least the net outflows scheduled for the next five working days. The maximum liquidity level is not to exceed 15 days of net cash outflows.
> The maturity profile requires 75% of the total liquidity to be invested in securities maturing within 100 days.
> The concentration profile requires that no more than 50% of the portfolio be invested in securities issued or guaranteed by Canadian provinces.
The cash and cash equivalents received from derivative counterparties to cover credit risk exposure as per the Credit Support Annex of the International Swap and Derivatives Association agreements are not included in the liquidity level and limits. As of March 31, 2015, the carrying amount of these collaterals was $384 ($6,050 as at March 31, 2014).
Liquidity risk for asset-backed securities is managed on a transaction basis due to the large size of each investment included in this portfolio. Consequently, asset-backed securities are excluded from the regular liquidity management practices and processes.
The following tables show the results of BDC’s liquidity risk management.
Liquidity level (in millions of Canadian dollars)Minimum Actual Maximum
As at March 31, 2015 364 657 1,432 As at March 31, 2014 544 654 1,576
Maturity and concentration limits Limits March 31, 2015 March 31, 2014
Cash and cash equivalents maturing within 100 days Min 75% 100% 100%Cash and cash equivalents in Canadian provinces Max 50% 0% 0%
The Treasury Risk Management Unit identifies, measures and monitors these liquidity limits daily. It reports any deviations from these liquidity limits to the Board of Directors. The Treasury Risk Management Unit determines whether the limits remain valid or whether changes to assumptions and limits are required in light of internal or external developments. This process ensures that close links are maintained between liquidity, market and credit risks.
Notes to the Consolidated Financial StatementsFor the year ended March 31, 2015(in thousands of Canadian dollars)
BDC AR15 | 100
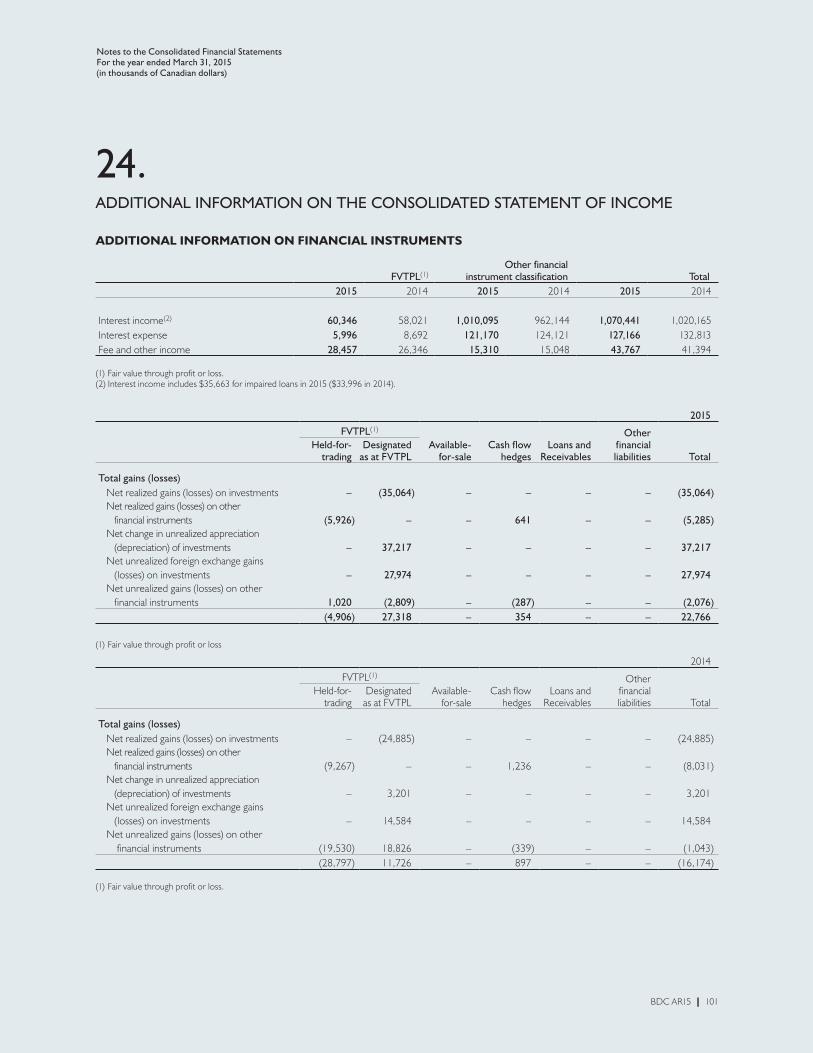
24.ADDITIONAL INFORMATION ON THE CONSOLIDATED STATEMENT OF INCOME
ADDITIONAL INFORMATION ON FINANCIAL INSTRUMENTS
FVTPL(1) Other financial instrument classification Total
2015 2014 2015 2014 2015 2014
Interest income(2) 60,346 58,021 1,010,095 962,144 1,070,441 1,020,165 Interest expense 5,996 8,692 121,170 124,121 127,166 132,813 Fee and other income 28,457 26,346 15,310 15,048 43,767 41,394
(1) Fair value through profit or loss.(2) Interest income includes $35,663 for impaired loans in 2015 ($33,996 in 2014).
2015
FVTPL(1)
Available- for-sale
Cash flow hedges
Loans and Receivables
Other financialliabilities Total
Held-for- trading
Designated as at FVTPL
Total gains (losses) Net realized gains (losses) on investments – (35,064) – – – – (35,064) Net realized gains (losses) on other financial instruments (5,926) – – 641 – – (5,285) Net change in unrealized appreciation (depreciation) of investments – 37,217 – – – – 37,217 Net unrealized foreign exchange gains (losses) on investments – 27,974 – – – – 27,974 Net unrealized gains (losses) on other financial instruments 1,020 (2,809) – (287) – – (2,076)
(4,906) 27,318 – 354 – – 22,766
(1) Fair value through profit or loss
2014
FVTPL(1)
Available- for-sale
Cash flow hedges
Loans and Receivables
Other financialliabilities Total
Held-for- trading
Designated as at FVTPL
Total gains (losses) Net realized gains (losses) on investments – (24,885) – – – – (24,885) Net realized gains (losses) on other financial instruments (9,267) – – 1,236 – – (8,031) Net change in unrealized appreciation (depreciation) of investments – 3,201 – – – – 3,201 Net unrealized foreign exchange gains (losses) on investments – 14,584 – – – – 14,584 Net unrealized gains (losses) on other financial instruments (19,530) 18,826 – (339) – – (1,043)
(28,797) 11,726 – 897 – – (16,174)
(1) Fair value through profit or loss.
Notes to the Consolidated Financial StatementsFor the year ended March 31, 2015(in thousands of Canadian dollars)
BDC AR15 | 101

24. ADDITIONAL INFORMATION ON
THE CONSOLIDATED STATEMENT OF INCOME (continued)
OTHER ADDITIONAL INFORMATION
2015 2014
Amortization/depreciation of Loss on initial recognition of asset-backed securities included in interest income – (41) Property and equipment included in operating and administrative expenses 7,408 7,230 Intangible assets included in operating and administrative expenses 9,785 4,825
Salaries and benefits Salaries and other benefits 251,442 238,549 Defined benefit plan expense (Note 19) 52,085 55,128
303,527 293,677
25.SEGMENTED INFORMATION
BDC has six reportable segments, as described below, which are the Bank’s business lines. Each business line offers different products and services, and is managed separately based on BDC’s management and internal reporting structure.
The following summary describes the operations in each of the Bank’s reportable segments.
> Financing provides secured, partially secured and unsecured loans with a focus on small and medium-sized enterprises across Canada.
> Growth & Transition Capital provides subordinate financing by way of flexible debt with or without convertible features and equity-type financing.
> Venture Capital provides investments to cover every stage of a technology-based company’s development cycle, from seed funding to expansion. BDC also makes indirect investments via venture capital investment funds.
> Consulting provides consulting services, group programs and other services related to business activities.
> Securitization purchases investments in asset-backed securities through the Funding Platform for Independent Lenders (F-PIL, formerly known as the Multi-Seller Platform for Small Originators) and until October 2013 managed the Canadian Secured Credit Facility investment portfolio. These securities are backed by vehicle and equipment loans and leases, as well as dealer floor plan loans. BDC also provides fully secured loans to small- and medium-sized finance and leasing companies.
> Venture Capital Action Plan supports the creation of large private sector-led funds of funds and also assists existing high-performing funds in partnership with institutional investors, corporate strategic investors and interested provinces.
The assumptions and methodologies used in BDC’s reporting framework are periodically reviewed by management to ensure they remain valid. The main allocation methods used by BDC are described below.
Interest expense is allocated to each operating segment based on its business portfolio and the capital attributed to the segment. The attribution of capital to BDC’s business segments is maintained in accordance with the capital adequacy ratios provided by Treasury Board of Canada Secretariat and is consistently aligned to the economic risks of each specific business segment. Refer to Note 22—Capital Management, for more information.
Operating and administrative expenses include costs that were incurred directly by the business segments. Indirect costs incurred at the enterprise level are attributed to each segment using management’s internal reporting framework.
Loan and investment portfolios are managed separately based on BDC’s business segments. None of the other assets or liabilities are managed by segment.
Notes to the Consolidated Financial StatementsFor the year ended March 31, 2015(in thousands of Canadian dollars)
BDC AR15 | 102
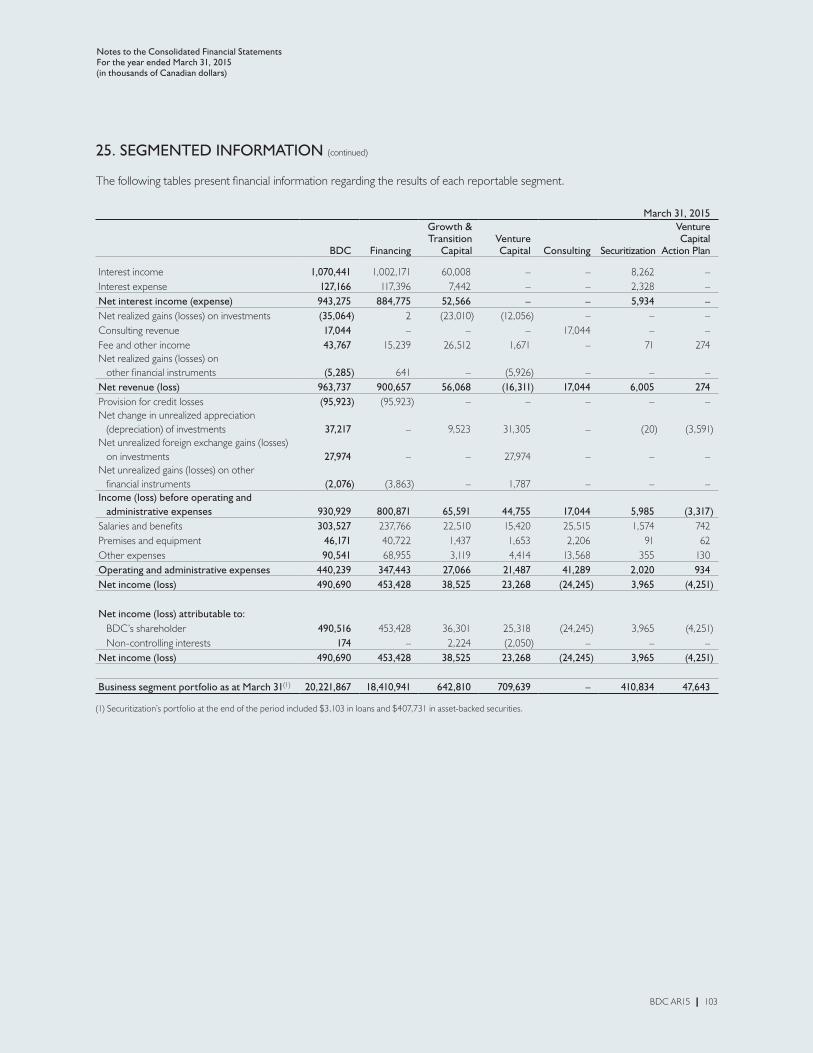
25. SEGMENTED INFORMATION (continued)
The following tables present financial information regarding the results of each reportable segment.
March 31, 2015
BDC Financing
Growth & Transition Capital
VentureCapital Consulting Securitization
Venture Capital
Action Plan
Interest income 1,070,441 1,002,171 60,008 – – 8,262 – Interest expense 127,166 117,396 7,442 – – 2,328 – Net interest income (expense) 943,275 884,775 52,566 – – 5,934 – Net realized gains (losses) on investments (35,064) 2 (23,010) (12,056) – – – Consulting revenue 17,044 – – – 17,044 – – Fee and other income 43,767 15,239 26,512 1,671 – 71 274 Net realized gains (losses) on other financial instruments (5,285) 641 – (5,926) – – – Net revenue (loss) 963,737 900,657 56,068 (16,311) 17,044 6,005 274 Provision for credit losses (95,923) (95,923) – – – – – Net change in unrealized appreciation (depreciation) of investments 37,217 – 9,523 31,305 – (20) (3,591)Net unrealized foreign exchange gains (losses) on investments 27,974 – – 27,974 – – – Net unrealized gains (losses) on other financial instruments (2,076) (3,863) – 1,787 – – – Income (loss) before operating and administrative expenses 930,929 800,871 65,591 44,755 17,044 5,985 (3,317)Salaries and benefits 303,527 237,766 22,510 15,420 25,515 1,574 742 Premises and equipment 46,171 40,722 1,437 1,653 2,206 91 62 Other expenses 90,541 68,955 3,119 4,414 13,568 355 130 Operating and administrative expenses 440,239 347,443 27,066 21,487 41,289 2,020 934 Net income (loss) 490,690 453,428 38,525 23,268 (24,245) 3,965 (4,251)
Net income (loss) attributable to: BDC’s shareholder 490,516 453,428 36,301 25,318 (24,245) 3,965 (4,251) Non-controlling interests 174 – 2,224 (2,050) – – – Net income (loss) 490,690 453,428 38,525 23,268 (24,245) 3,965 (4,251)
Business segment portfolio as at March 31(1) 20,221,867 18,410,941 642,810 709,639 – 410,834 47,643
(1) Securitization’s portfolio at the end of the period included $3,103 in loans and $407,731 in asset-backed securities.
Notes to the Consolidated Financial StatementsFor the year ended March 31, 2015(in thousands of Canadian dollars)
BDC AR15 | 103
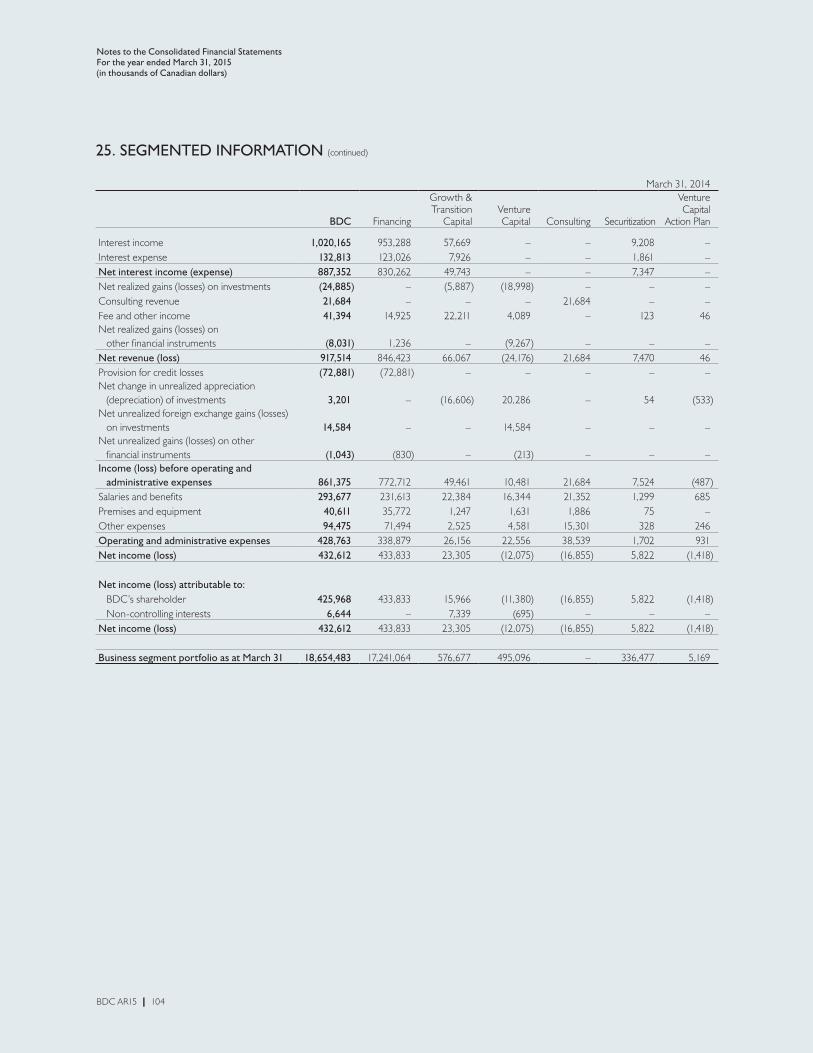
25. SEGMENTED INFORMATION (continued)
March 31, 2014
BDC Financing
Growth & Transition Capital
VentureCapital Consulting Securitization
Venture Capital
Action Plan
Interest income 1,020,165 953,288 57,669 – – 9,208 – Interest expense 132,813 123,026 7,926 – – 1,861 – Net interest income (expense) 887,352 830,262 49,743 – – 7,347 – Net realized gains (losses) on investments (24,885) – (5,887) (18,998) – – – Consulting revenue 21,684 – – – 21,684 – – Fee and other income 41,394 14,925 22,211 4,089 – 123 46 Net realized gains (losses) on other financial instruments (8,031) 1,236 – (9,267) – – – Net revenue (loss) 917,514 846,423 66,067 (24,176) 21,684 7,470 46 Provision for credit losses (72,881) (72,881) – – – – – Net change in unrealized appreciation (depreciation) of investments 3,201 – (16,606) 20,286 – 54 (533)Net unrealized foreign exchange gains (losses) on investments 14,584 – – 14,584 – – – Net unrealized gains (losses) on other financial instruments (1,043) (830) – (213) – – – Income (loss) before operating and administrative expenses 861,375 772,712 49,461 10,481 21,684 7,524 (487)Salaries and benefits 293,677 231,613 22,384 16,344 21,352 1,299 685 Premises and equipment 40,611 35,772 1,247 1,631 1,886 75 – Other expenses 94,475 71,494 2,525 4,581 15,301 328 246 Operating and administrative expenses 428,763 338,879 26,156 22,556 38,539 1,702 931 Net income (loss) 432,612 433,833 23,305 (12,075) (16,855) 5,822 (1,418)
Net income (loss) attributable to: BDC’s shareholder 425,968 433,833 15,966 (11,380) (16,855) 5,822 (1,418) Non-controlling interests 6,644 – 7,339 (695) – – – Net income (loss) 432,612 433,833 23,305 (12,075) (16,855) 5,822 (1,418)
Business segment portfolio as at March 31 18,654,483 17,241,064 576,677 495,096 – 336,477 5,169
Notes to the Consolidated Financial StatementsFor the year ended March 31, 2015(in thousands of Canadian dollars)
BDC AR15 | 104

26.GUARANTEES AND CONTINGENT LIABILITIES
FINANCIAL GUARANTEES
LETTERS OF CREDIT AND LOAN GUARANTEESBDC issues “letters of credit and loan guarantees” (guarantees) to support businesses. Those guarantees represent BDC’s obligation to make payments to third parties if clients are unable to meet their contractual commitments. Collateral requirements for letters of credit and loan guarantees are consistent with BDC collateral requirements for loans. The fee income earned is calculated on a straight-line basis over the life of the instrument and recognized in fee and other income in the Consolidated Statement of Income. The maximum amount payable under the guarantees totalled $31.7 million as at March 31, 2015 ($27.6 million as at March 31, 2014) and the existing terms expire within 39 months (within 39 months as at March 31, 2014). The total contractual amount is not representative of the maximum potential amount of future payments to be required for these commitments.
These financial guarantees were initially recognized at fair value on the date the guarantees were given. The fair value was considered nil, as all guarantees were agreed to on arm’s-length terms and no initial fee was received. In addition, no receivable for the future expected fees was recognized. Subsequent recognition of a liability will only occur when it becomes more likely than not that a client will not meet its contractual commitments. As at March 31, 2015 and 2014, there were no liabilities recognized in BDC’s Consolidated Statement of Financial Position related to these guarantees.
INDEMNIFICATION AGREEMENTSIn the ordinary course of business, BDC enters into many contracts that contain indemnification provisions, such as purchase contracts, employment contracts, service agreements and leasing arrangements. In such contracts, BDC may indemnify counterparties to the contracts for certain aspects of BDC’s past conduct if other parties fail to perform, or if certain events occur, such as changes in laws and regulations (including tax legislation), changes in the financial condition of third parties, infringements and breaches of representations and warranties, undisclosed liabilities, and loss caused by the actions of third parties, or as a result of litigation claims by third parties.
These indemnification obligations will vary based upon each contract. In many cases, there are no predetermined amounts or limits included in these contracts, and the occurrence of contingent events that will trigger payment under them is difficult to predict. The nature of these indemnification contracts is such that BDC cannot reasonably estimate the maximum potential future amount that may be payable to counterparties. Historically, BDC has not made any significant payments under these indemnities and there were no significant provisions for indemnities as of March 31, 2015 and 2014.
CONTINGENT LIABILITIES
Various legal proceedings arising from the normal course of business are pending against BDC. Management believes that should BDC be found liable pursuant to one or more of these proceedings, the aggregate liability resulting from such proceedings would not be material.
Notes to the Consolidated Financial StatementsFor the year ended March 31, 2015(in thousands of Canadian dollars)
BDC AR15 | 105

27.COMMITMENTS
LOANS AND INVESTMENTS
LOANSUndisbursed amounts of authorized loans were $2,255,240 as at March 31, 2015 ($447,183 fixed rate; $1,808,057 floating rate) and are expected to be disbursed within the next 12 months. The weighted-average effective interest rate was 4.62% on loan commitments (4.78% as at March 31, 2014). The following tables present undisbursed amounts of authorized loans by location and industry.
Commitments, by geographic distribution March 31, 2015 March 31, 2014
Newfoundland and Labrador 88,431 64,956 Prince Edward Island 525 4,448 Nova Scotia 55,930 60,085 New Brunswick 22,499 19,685 Quebec 545,479 547,558 Ontario 643,218 500,665 Manitoba 67,579 56,729 Saskatchewan 66,173 96,904 Alberta 568,549 352,070 British Columbia 193,659 191,288 Yukon 2,172 1,834 Northwest Territories and Nunavut 1,026 400 Total 2,255,240 1,896,622
Commitments, by industry sector March 31, 2015 March 31, 2014
Manufacturing 519,240 404,133 Tourism 322,222 263,457 Wholesale and retail trade 319,899 259,707 Resources 254,214 204,556 Service industries 248,614 228,533 Construction 247,874 247,274 Commercial properties 103,386 130,645 Transportation and storage 91,765 121,206 Other 148,026 37,111 Total 2,255,240 1,896,622
SUBORDINATE FINANCING INVESTMENTSUndisbursed amounts of authorized subordinate financing investments were $67,661 as at March 31, 2015 ($25,687 fixed rate; $41,974 floating rate) and are expected to be disbursed within the next 12 months. The weighted-average effective interest rate was 9.87% on subordinate financing commitments (8.83% as at March 31, 2014), excluding non-interest return. The following tables present undisbursed amounts of authorized subordinate financing investments, by location and industry.
Commitments, by geographic distribution March 31, 2015 March 31, 2014
Newfoundland and Labrador 255 – Nova Scotia – 3,554 New Brunswick – 1,750 Quebec 23,570 13,600 Ontario 32,556 24,442 Saskatchewan 4,400 625 Alberta 2,650 6,100 British Columbia 4,230 3,650 Total 67,661 53,721
Notes to the Consolidated Financial StatementsFor the year ended March 31, 2015(in thousands of Canadian dollars)
BDC AR15 | 106
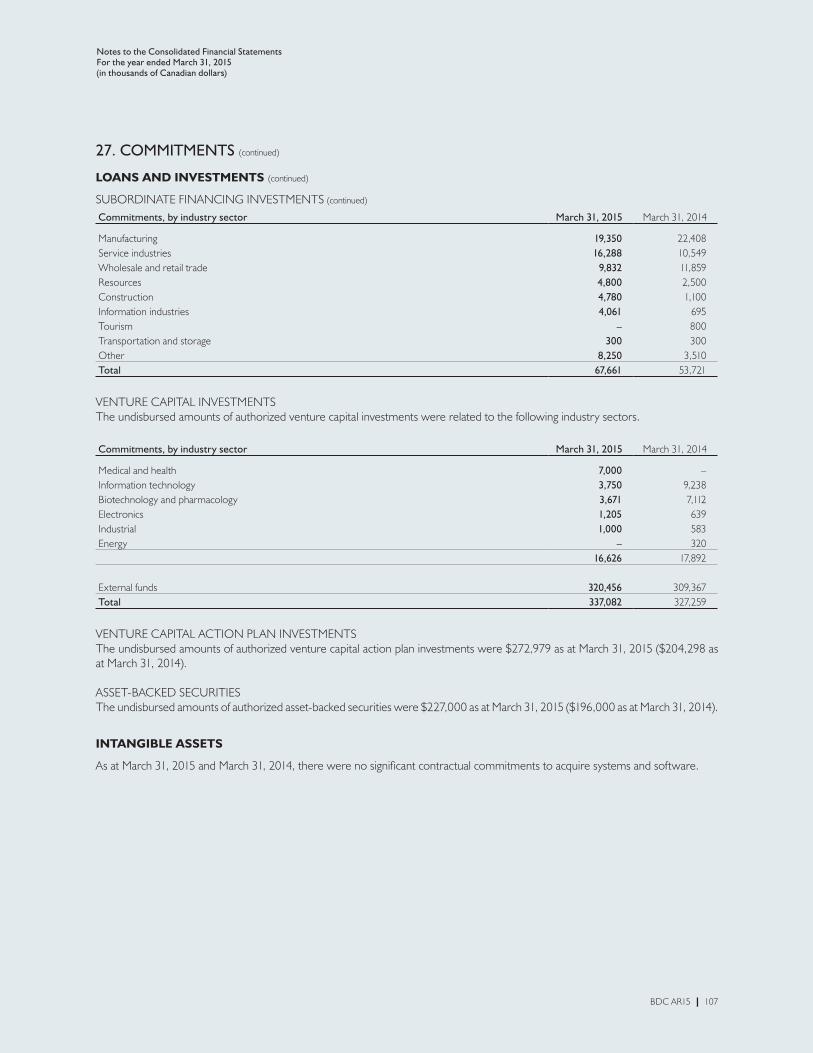
27. COMMITMENTS (continued)
LOANS AND INVESTMENTS (continued)
SUBORDINATE FINANCING INVESTMENTS (continued)
Commitments, by industry sector March 31, 2015 March 31, 2014
Manufacturing 19,350 22,408 Service industries 16,288 10,549 Wholesale and retail trade 9,832 11,859 Resources 4,800 2,500 Construction 4,780 1,100 Information industries 4,061 695 Tourism – 800 Transportation and storage 300 300 Other 8,250 3,510 Total 67,661 53,721
VENTURE CAPITAL INVESTMENTSThe undisbursed amounts of authorized venture capital investments were related to the following industry sectors.
Commitments, by industry sector March 31, 2015 March 31, 2014
Medical and health 7,000 – Information technology 3,750 9,238 Biotechnology and pharmacology 3,671 7,112 Electronics 1,205 639 Industrial 1,000 583 Energy – 320
16,626 17,892
External funds 320,456 309,367 Total 337,082 327,259
VENTURE CAPITAL ACTION PLAN INVESTMENTSThe undisbursed amounts of authorized venture capital action plan investments were $272,979 as at March 31, 2015 ($204,298 as at March 31, 2014).
ASSET-BACKED SECURITIESThe undisbursed amounts of authorized asset-backed securities were $227,000 as at March 31, 2015 ($196,000 as at March 31, 2014).
INTANGIBLE ASSETS
As at March 31, 2015 and March 31, 2014, there were no significant contractual commitments to acquire systems and software.
Notes to the Consolidated Financial StatementsFor the year ended March 31, 2015(in thousands of Canadian dollars)
BDC AR15 | 107

27. COMMITMENTS (continued)
LEASES
BDC entered into a number of lease agreements to provide office space for its head office and business centres. BDC’s future minimum lease commitments under operating leases related to the rental of premises are approximately as follows.
March 31, 2015 March 31, 2014
Within 1 year 28,041 27,636 1 to 5 years 87,272 95,255 After 5 years 20,734 23,145 Total 136,047 146,036
In addition, on June 8, 2015 BDC entered into a new lease agreement covering a fifteen year period commencing in fiscal 2020. Minimum lease commitments for the fifteen year period amount to approximately $163.6 million.
During the year, lease payments recognized as an expense amounted to $26.3 million ($25.8 million in 2014). This amount consists of minimum lease payments. No significant sublease payments or contingent rent payments were made or received.
28.RELATED PARTY TRANSACTIONS
BDC is a Crown corporation that is wholly owned by the Government of Canada and is accountable for its affairs through the Minister of Industry. BDC is also related to all Government of Canada-created departments, agencies and Crown corporations. BDC enters into transactions with these entities in the normal course of business, under terms and conditions similar to those that apply to unrelated parties.
The defined benefit plans referred to in Note 19—Net Defined Benefit Asset or Liability, are also related parties. BDC’s transactions with these funds include contributions paid to the plans, which are disclosed in Note 19. BDC has no other transactions or balances related to these defined benefit plans.
BORROWINGS WITH THE MINISTER OF FINANCE
During the reporting periods, BDC has borrowed funds from Her Majesty the Queen in Right of Canada acting through the Minister of Finance. This borrowing is in accordance with the FAA and the BDC Act and is compliant with (i) BDC’s borrowing plan, which is approved by the Minister of Finance; and (ii) the Crown Borrowing Program Framework.
The following table presents the transactions and outstanding balances related to the borrowings with the Minister of Finance. Refer to Note 18—Borrowings, for additional information on short-term and long-term notes.
Short-term notes Long-term notes Total2015 2014 2015 2014 2015 2014
Balance at beginning of year 14,050,567 12,714,261 274,546 506,018 14,325,113 13,220,279 Net change in short-term notes 1,386,000 1,337,413 – – 1,386,000 1,337,413 Net change in accrued interest (1,204) (1,107) (191) 384 (1,395) (723)Issuance of long-term notes – – 154,600 192,435 154,600 192,435 Repayment of long-term notes – – (184,699) (424,291) (184,699) (424,291)Balance at end of year 15,435,363 14,050,567 244,256 274,546 15,679,619 14,325,113
During the year, BDC recorded $127.0 million in interest expense related to these borrowings ($129.0 million in 2014). In addition, in order to comply with BDC’s risk management policies, certain short-term and long-term notes with the Minister of Finance were repaid prior to maturity (none were repaid in 2014). This resulted in a net realized loss of $0.5 million in fiscal 2015 (no realized gain or loss in fiscal 2014).
Notes to the Consolidated Financial StatementsFor the year ended March 31, 2015(in thousands of Canadian dollars)
BDC AR15 | 108
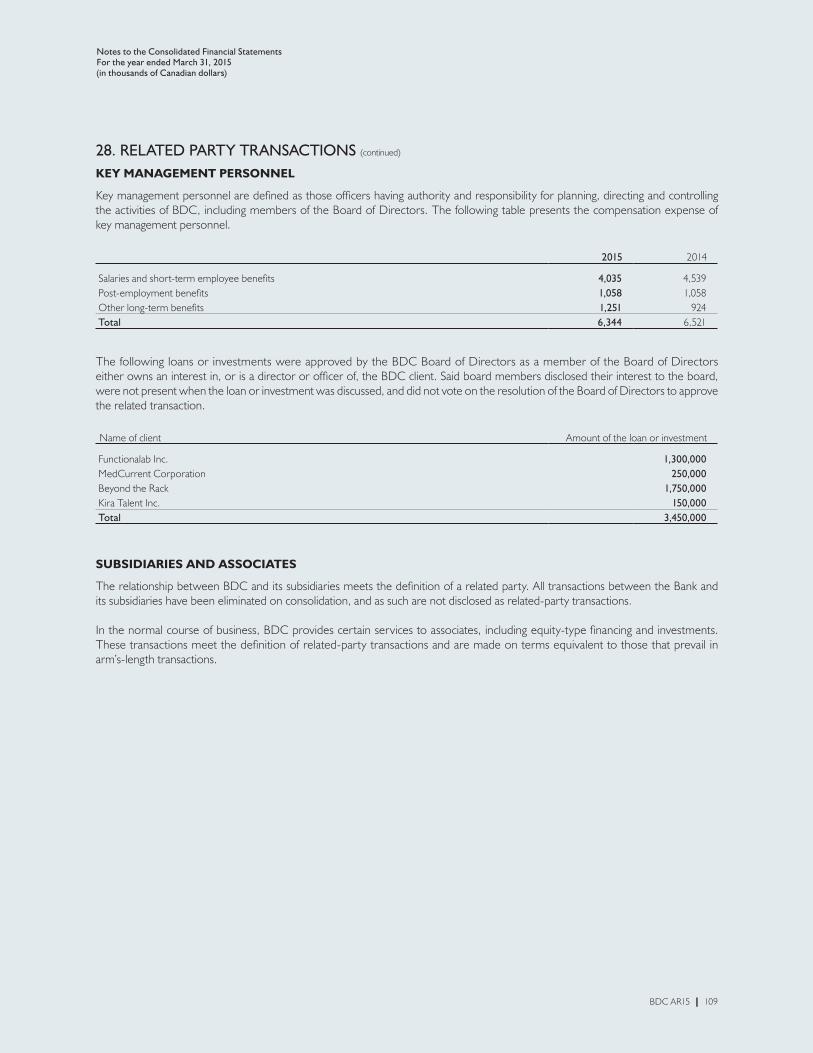
28. RELATED PARTY TRANSACTIONS (continued)
KEY MANAGEMENT PERSONNEL
Key management personnel are defined as those officers having authority and responsibility for planning, directing and controlling the activities of BDC, including members of the Board of Directors. The following table presents the compensation expense of key management personnel.
2015 2014
Salaries and short-term employee benefits 4,035 4,539 Post-employment benefits 1,058 1,058 Other long-term benefits 1,251 924 Total 6,344 6,521
The following loans or investments were approved by the BDC Board of Directors as a member of the Board of Directors either owns an interest in, or is a director or officer of, the BDC client. Said board members disclosed their interest to the board, were not present when the loan or investment was discussed, and did not vote on the resolution of the Board of Directors to approve the related transaction.
Name of client Amount of the loan or investment
Functionalab Inc. 1,300,000 MedCurrent Corporation 250,000 Beyond the Rack 1,750,000 Kira Talent Inc. 150,000 Total 3,450,000
SUBSIDIARIES AND ASSOCIATES
The relationship between BDC and its subsidiaries meets the definition of a related party. All transactions between the Bank and its subsidiaries have been eliminated on consolidation, and as such are not disclosed as related-party transactions.
In the normal course of business, BDC provides certain services to associates, including equity-type financing and investments. These transactions meet the definition of related-party transactions and are made on terms equivalent to those that prevail in arm’s-length transactions.
Notes to the Consolidated Financial StatementsFor the year ended March 31, 2015(in thousands of Canadian dollars)
BDC AR15 | 109

BDC AR15 | 110

Corporate Governance
Committees 115
Board and Board Committee Meetings and Attendance 118
Board of Directors 119
BDC AR15 | 111

Corporate Governance
CORPORATE GOVERNANCE: ENTREPRENEURS AND TRUST
BDC’s economic responsibility is to dedicate itself exclusively—and effectively—to entrepreneurs. Its social responsibility is to do this in a manner that builds public trust. As the Board of Directors oversees BDC’s efforts to fulfill both responsibilities, robust corporate governance is critically important.
WHAT IS ROBUST CORPORATE GOVERNANCE? Robust corporate governance begins with a clear mandate; BDC’s mandate to promote entrepreneurship while remaining complementary, with a special focus on small and medium-sized enterprises, is precise and well understood. It is enabled by a transparent board governance framework that clearly defines roles, decision-making and accountability. It is carried out by a team of dedicated, hard-working people at the board level whose expertise, integrity and commitment to ethical business conduct transform principles into policies, decisions and actions that build trust.
Samuel L. Duboc has provided decisive leadership as Chairperson of the Board. He has guided the board through an active year that saw the successful coming into force of the revised Business Development Bank of Canada Act (BDC Act), the initiation of BDC Advantage, the formalization of BDC’s Risk Appetite Statement and significant progress on the Venture Capital strategy.
There were other notable achievements. All of BDC’s operations in fiscal 2014–15 were within the risk limits set forth in the Bank’s Risk Appetite Statement, and all of its activities complied with BDC’s Enterprise Risk Management Policy and Treasury Risk Policy. As well, the corporate compliance function implemented a framework that assigned accountability for defined laws to business owners, to ensure BDC remains compliant.
Most importantly, the Board recommended criteria to the Governor-in-Council that would help it to select the best candidate for the position of President and CEO of the Bank, as Jean-René Halde chose to retire at the end of the term in June 2015. BDC sent out a request for proposal to engage a recruitment firm and the Privy Council Office created a selection committee to search for a new President and CEO. The process is ongoing.
In addition, BDC worked with the Minister to recommend potential board members with the profile and skills to provide the diversity and talent required to steward BDC. Robert H. Pitfield, a seasoned banker with strong risk management expertise, joined the Board on May 9, 2014, and became the Chairperson of the Board Credit and Risk Committee. Mary-Alice Vuicic, who has extensive experience in human resources, became the Chairperson of the Human Resources Committee. Claude McMaster, an entrepreneur and financial expert, joined the Board on March 26, 2015. Rick Perkins, who served seven years on the Board, left.
BDC AR15 | 112
Corporate Governance
STATEMENT FROM THE BOARD OF DIRECTORS
We set BDC’s strategic direction. We also hold senior management accountable by overseeing its activities to ensure it achieves its statutory mandate while respecting its role, all in accordance with the highest standards of corporate governance.
Except for the President and CEO, we are all independent of management. We have first-hand experience in governance, finance, business management, entrepreneurship, risk management, information systems and human resources. Together, we have the required mix of skills and experience needed for our stewardship role.
Our core challenge is to manage the tension associated with BDC’s role as a development bank to support entrepreneurs—an inherently risky activity—while prudently managing risk and remaining commercially viable.
BOARD GOVERNANCEThe board’s mandate and Code of Conduct, and the terms of reference for board committees, define the board’s governance. We had eight board meetings in fiscal 2014–15. They were held across Canada so that BDC clients could meet and seek guidance directly from board members and so that members could learn more about the unique challenges Canadian entrepreneurs face in different regions. In addition, we held 51 committee meetings by conference call to approve loans and investments. We also held our customary annual public meeting to support our outreach to entrepreneurs.
We work very closely with senior management but also meet regularly in camera without their presence.
Board committees conduct in-depth reviews of their areas of responsibility and provide regular reports to us. We regularly review and revise our Board Profile and the membership of board committees to ensure that board members have the skills required to guide the Bank effectively. Board members have appropriately high levels of financial literacy, as well as the broader skills and competencies needed to oversee the management of a large financial organization.
All committee members are independent, with the exception of the President and CEO, who is a member of the Board Credit and Risk Committee and of the Board Investment Committee. These committees review strategies, new products, and activities, and authorize larger transactions within defined limits. All committee members disclose their holdings and any potential conflicts of interest upon joining the Board and annually thereafter, as part of their regular affirmation of compliance with the Board Code of Conduct. We keep abreast of best practices and review our policies, corporate directives and codes of conduct regularly to continuously improve BDC’s corporate governance.
OUR DUTIESWithin the parameters set by Parliament and government, our duties are to:
> approve BDC’s strategic direction and corporate plan to meet its public policy mandate
> set performance targets and monitor progress
> ensure that BDC is identifying and managing its risks
> ensure the highest standards of corporate governance
> establish compensation policies
> review and approve management’s succession plan, including approving appointments to the senior management team
> set the President and CEO’s performance objectives and evaluate his performance
> review BDC’s internal controls and management information systems
> oversee communications and public disclosure
> oversee BDC’s pension plans, and establish its fund policies and practices
> approve financing and investment activities beyond management’s authority
> review the complementarity of BDC’s market approach and activities
BDC AR15 | 113
Corporate Governance
BDC’S CORPORATE GOVERNANCE FRAMEWORKOur principal guidelines derive from parliamentary statutes. The BDC Act sets out BDC’s purpose, powers and duties. The Financial Administration Act, sets out the control and accountability regime for Crown corporations. BDC’s by-laws prescribe the rules for the functioning of the Bank.
We look to Treasury Board of Canada Secretariat and to private financial institutions for guidance and expertise on public sector governance practices. BDC meets or exceeds all of the governance standards recommended by Treasury Board.
Like other Crown corporations, BDC is subject to many laws and has developed a Legislative Compliance Framework to identify key laws and regulations that affect our mandate, operations and sustainability. The Legislative Compliance Policy provides for a corporate compliance function led by the Chief Compliance Officer, who is the Senior Vice President, Legal Affairs and Corporate Secretary, and in this role reports directly to the Audit Committee. The mandate of the corporate compliance function is to implement and maintain the risk-based Legislative Compliance Framework; monitor compliance with all applicable legislation and regulations; maintain a thorough understanding of BDC’s obligations under relevant legislation and regulations, and develop a Legislative Inventory; identify areas of vulnerability and assess compliance risk; and assume accountability for enterprise-wide compliance with legislative or regulatory requirements that apply to the Bank.
Every year, Parliament receives an update of BDC’s five-year corporate plan, which has been approved by the Board of Directors, Treasury Board of Canada Secretariat and the Minister of Industry. Also every year, Parliament receives BDC’s annual report. This report contains financial statements that have been audited by both the Auditor General of Canada and an external audit firm.
The Auditor General of Canada does a special examination of BDC at least once every 10 years. This examination is a performance audit that goes beyond strictly financial issues to examine systems and practices related to economy, efficiency and effectiveness. In the most recent examination report (2009), the auditors favourably reviewed BDC, writing that it has “sound systems and practices in areas such as governance, strategic planning, human resources and financing activities.”
At 10-year intervals, the Minister of Industry must review the provisions and operation of the BDC Act, in consultation with the Minister of Finance. The Legislative Review was completed in 2014 and the Act was revised to allow BDC to increase support for Canadian entrepreneurs who are
expanding internationally, to help the Canadian economy become more competitive. BDC was given more flexibility to adjust its powers through regulations, to help entrepreneurs indirectly through not-for-profit organizations and to enhance its non-financial support through activities such as consulting.
The Senior Management Committee and management committees have clearly defined roles, and are an integral part of BDC’s Corporate Governance Framework.
BDC has a Documentation Framework and governance structure that provides for all policies to be approved by the Board. The President and CEO or his delegate approves corporate directives.
Key policies include the Enterprise Risk Management Policy, the Risk Appetite Statement, the Delegation of Authority Policy and the Legislative Compliance Policy. There are 35 corporate directives covering all areas of BDC’s operations, including information technology (IT) governance and risk management.
Lastly, we rely on the three lines of defence model for risk management: (i) management controls and internal control measures; (ii) financial control, security, risk management, quality, inspection and compliance; and (iii) internal audit.
KEY GOVERNANCE PILLARS: CODES OF CONDUCTThe Employee Code of Conduct, Ethics and Values affirms BDC’s fundamental tenets: ethical behaviour, client connection, team spirit, accountability and work/life balance. The Code applies to all employees and they certify their compliance with it annually. It sets out the principles that guide and shape our business activities: compliance with the law, trust, fairness, objectivity, integrity, and corporate social and individual responsibility. It is supported by policies on personal trading, disclosure of wrongdoing, anti-fraud, anti-money laundering and anti-terrorism financing.
The Board Code of Conduct incorporates the same basic principles as the Employee Code of Conduct, Ethics and Values. Every year, all board members affirm that we have complied with the Code. The segregated roles and responsibilities of the Chairman and the President, already documented, reflect current best practices. The Code is supported by policies on personal trading, director orientation and continuing education. We have robust procedures in place to disclose and track potential conflicts of interest. During the year, the Board also conducted a very thorough board assessment on the effectiveness of the Board, its committees and individual members. This included a peer-to-peer review.
BDC AR15 | 114
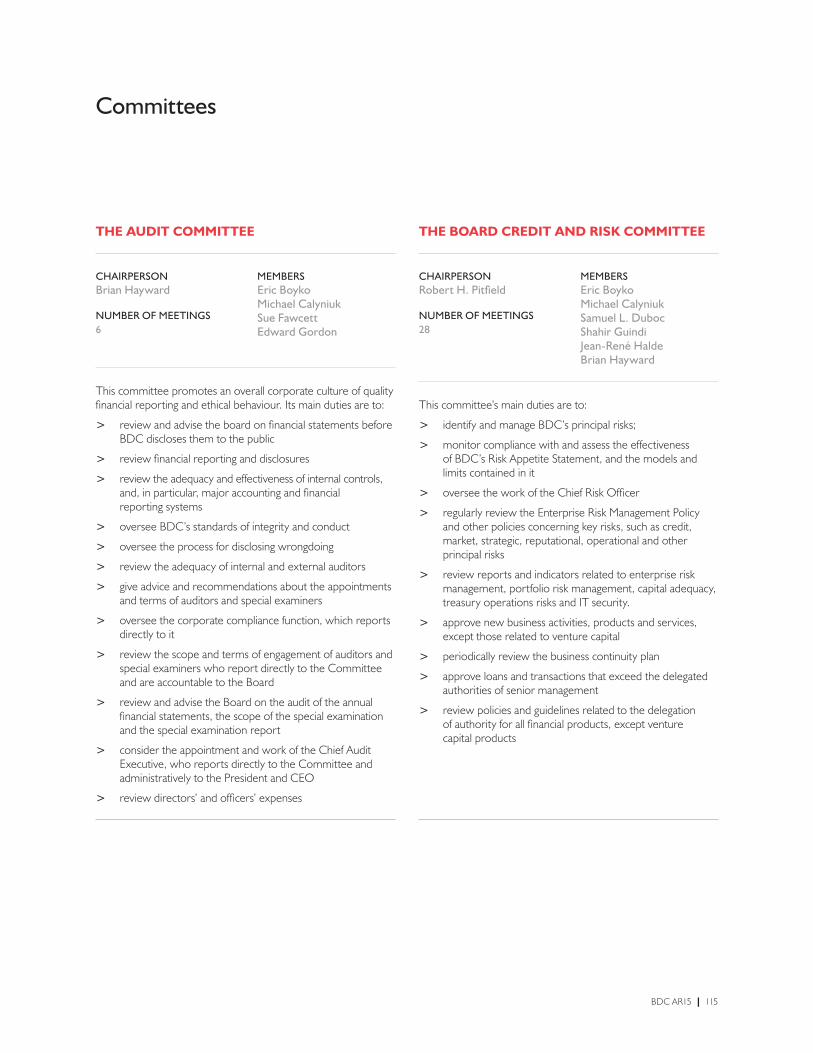
THE AUDIT COMMITTEE
CHAIRPERSONBrian Hayward
NUMBER OF MEETINGS6
MEMBERSEric BoykoMichael CalyniukSue FawcettEdward Gordon
This committee promotes an overall corporate culture of quality financial reporting and ethical behaviour. Its main duties are to:
> review and advise the board on financial statements before BDC discloses them to the public
> review financial reporting and disclosures
> review the adequacy and effectiveness of internal controls, and, in particular, major accounting and financial reporting systems
> oversee BDC’s standards of integrity and conduct
> oversee the process for disclosing wrongdoing
> review the adequacy of internal and external auditors
> give advice and recommendations about the appointments and terms of auditors and special examiners
> oversee the corporate compliance function, which reports directly to it
> review the scope and terms of engagement of auditors and special examiners who report directly to the Committee and are accountable to the Board
> review and advise the Board on the audit of the annual financial statements, the scope of the special examination and the special examination report
> consider the appointment and work of the Chief Audit Executive, who reports directly to the Committee and administratively to the President and CEO
> review directors’ and officers’ expenses
THE BOARD CREDIT AND RISK COMMITTEE
CHAIRPERSONRobert H. Pitfield
NUMBER OF MEETINGS28
MEMBERSEric BoykoMichael CalyniukSamuel L. DubocShahir GuindiJean-René Halde Brian Hayward
This committee’s main duties are to:
> identify and manage BDC’s principal risks;
> monitor compliance with and assess the effectiveness of BDC’s Risk Appetite Statement, and the models and limits contained in it
> oversee the work of the Chief Risk Officer
> regularly review the Enterprise Risk Management Policy and other policies concerning key risks, such as credit, market, strategic, reputational, operational and other principal risks
> review reports and indicators related to enterprise risk management, portfolio risk management, capital adequacy, treasury operations risks and IT security.
> approve new business activities, products and services, except those related to venture capital
> periodically review the business continuity plan
> approve loans and transactions that exceed the delegated authorities of senior management
> review policies and guidelines related to the delegation of authority for all financial products, except venture capital products
Committees
BDC AR15 | 115

Corporate Governance | Committees
THE GOVERNANCE AND NOMINATING COMMITTEE
CHAIRPERSONSamuel L. Duboc
NUMBER OF MEETINGS6
MEMBERSBrian HaywardPrashant PathakMary-Alice Vuicic
This committee helps the Board fulfill its corporate governance oversight responsibilities. Its main duties are to:
> continually review best practices and regulations related to governance in Canada and, if necessary, recommend changes to BDC’s approach
> annually review BDC’s corporate governance policies, including the Board Code of Conduct, and the Employee Code of Conduct, Ethics and Values
> annually assess the board’s compliance with these policies
> monitor procedures established to detect and manage potential conflicts of interest
> regularly review the mandates, structures and memberships of the Board and its committees
> develop selection criteria for the President and CEO position
> recommend to the Board, for the consideration of the Minister of Industry, the reappointment of the Chairperson, the President and CEO, and members
> retain a search firm to identify candidates for the positions of the Chairperson, the President and CEO, and members
> review and annually approve the list of skills directors require
> develop processes to assess the performance of the Board, its committees and its individual members
> ensure that comprehensive director orientation and continuous training programs are in place
THE HUMAN RESOURCES COMMITTEE
CHAIRPERSONMary-Alice Vuicic
NUMBER OF MEETINGS6
MEMBERSShahir GuindiPrashant PathakRobert H. Pitfield
This committee’s main duties are to:
> assess the “tone at the top” established by senior management with respect to integrity and ethics
> oversee the human resources strategy to ensure it is aligned with the corporate plan
> review—and, if appropriate, recommend to the Board for approval—the CEO’s recommendations for appointments of senior management committee members, the Chief Audit Executive and the Ombudsman, as well as any CEO proposal for major changes to the organization’s structure
> assess the CEO’s objectives and performance
> review compensation for senior executives
> review and approve the design of compensation programs and material payments
> approve performance measures and metrics
> receive and examine actuarial evaluation reports and financial statements related to BDC pension plans, as well as recommend funding contributions
> ensure there is a valid succession plan in place
BDC AR15 | 116

Corporate Governance | Committees
THE PENSION FUNDS INVESTMENT COMMITTEE
CHAIRPERSONRosemary Zigrossi
NUMBER OF MEETINGS7
MEMBERSSue FawcettEdward GordonAlan Marquis (observer and representative for BDC retirees)
This committee’s main duties are to:
> monitor, and advise the Board on, all matters related to the investment of the funds’ assets
> recommend asset allocation and investment policies and strategies
> ensure that investments comply with established policies
> recommend to the Board the appointment, termination and replacement of external investment managers
> review the funds’ actuarial valuation reports and financial statements
> monitor the performance of the funds and the managers
BOARD INVESTMENT COMMITTEE (AND VCIC)
CHAIRPERSONPrashant Pathak
NUMBER OF MEETINGS23
MEMBERSEric BoykoSue FawcettJean-René HaldeRosemary Zigrossi
This committee’s duties are to:
> regularly review the Investment Policy, and other policies and processes for investment activities and related risks
> review all strategies, guardrails and capital allocations for all material investment activities, including venture capital and private equity
> approve the business plan of the three venture capital internal funds, as well as investment strategies, the capital allocation and guardrails
> review strategic initiatives aimed at improving the venture capital ecosystem
> review and recommend delegations of authority
> monitor portfolio performance
> approve investments that exceed the delegated authorities of senior management
For the mandates of the board committees, please see www.bdc.ca.
BDC AR15 | 117

Board and Board Committee Meetings and Attendance
Board Audit BCRC GovernanceHuman
ResourcesPension Funds
Investment VCIC/BIC Committee Meetings
Directors Attendance Total Percentage Attendance Total Attendance Total Attendance Total Attendance Total Attendance Total Attendance Total Attendance Total Percentage
Samuel L. Duboc(1) 8 8 100% 0 0 22 28 6 6 0 0 0 0 0 0 28 34 82%Eric Boyko(2) 7 8 88% 3 6 19 28 0 0 0 0 0 0 13 23 35 57 61%Michael Calyniuk 8 8 100% 6 6 28 28 0 0 0 0 0 0 0 0 34 34 100%Sue Fawcett 8 8 100% 6 6 0 0 0 0 0 0 7 7 23 23 36 36 100%Edward Gordon 8 8 100% 6 6 0 0 0 0 0 0 7 7 0 0 13 13 100%Shahir Guindi 8 8 100% 0 0 26 28 0 0 6 6 0 0 0 0 32 34 94%Jean-René Halde(2) 8 8 100% 0 0 20 28 0 0 0 0 0 0 20 23 40 51 78%Brian Hayward 7 8 88% 6 6 24 28 6 6 0 0 0 0 0 0 36 40 90%Prashant Pathak 7 8 88% 0 0 0 0 5 6 5 6 0 0 20 23 30 35 86%Rick Perkins(3) 7 8 88% 0 0 0 0 6 6 5 6 6 7 0 0 17 19 89%Robert H. Pitfield(4) 7 7 100% 0 0 21 22 0 0 4 4 0 0 0 0 25 26 96%Mary-Alice Vuicic 8 8 100% 0 0 0 0 6 6 6 6 0 0 0 0 12 12 100%Rosemary Zigrossi 8 8 100% 0 0 0 0 0 0 0 0 7 7 19 23 26 30 87%Claude McMaster(5)
(1) As Chairperson of the Board, Mr. Duboc regularly attends additional Board Committee meetings.
(2) Mr. Eric Boyko and Mr. Jean-René Halde are the only Directors who are members of both the Board Investment and Board Credit and Risk Committees, resulting in a higher number of Committee meetings to attend per year.
(3) Mr. Perkins ceased to be a Director of the Bank on March 26, 2015.
(4) Mr. Robert H. Pitfield was appointed to the Board effective May 9, 2014, and on June 11, 2014, he was appointed as a member of the Board Credit and Risk Committee and the Human Resources Committee.
(5) Mr. Claude Mc Master was appointed as a Director of the Bank on March 26, 2015, replacing Mr. Rick Perkins. There were no Board or Committee meetings held in F2015 after his appointment date.
(6) On February 12, 2015, the Venture Capital Investment Committee (VCIC) was renamed the Board Investment Committee (BIC).
(6)
BDC AR15 | 118

SAMUEL L. DUBOCChairperson of the BoardBDCToronto, Ontario
JEAN-RENÉ HALDEPresident and Chief Executive Officer BDC Montreal, Quebec
Samuel L. Duboc joined the BDC Board of Directors as Chairperson in January 2014.
Mr. Duboc has a wealth of experience as an entrepreneur, investor, venture capitalist and board chair.
He is co-founder and CEO of EdgeStone Capital Partners, a private equity firm. Recently, Mr. Duboc served as the Clifford Clark Visiting Economist and Special Advisor on Venture Capital for the Department of Finance Canada, leading a team in designing and implementing the Government of Canada’s Venture Capital Action Plan.
Prior to this, he was a managing director at CIBC Capital Partners and co-founder and COO of the Loyalty Group Inc., the parent of the AIR MILES Reward Program.
Mr Duboc is Chair of Stephenson’s Rental Services Inc. and a member of the board of directors of Porter Aviation Holdings Inc. and EZShield Parent, Inc.
He is an active member of the community and serves as Chair of a number of not-for-profit organizations (some of which he co-founded), including Pathways to Education Canada and the Pecaut Centre for Social Impact.
Mr. Duboc holds a Bachelor of Science in Chemical Engineering from Tufts University and an MBA from Harvard Business School. In 2000, he was recognized as one of Canada’s Top 40 under 40 and in 2005 he was chosen as one of the 10 “most influential” alumni of the program.
Chairperson of the Governance and Nominating Committee and member of the Board Credit and Risk Committee. As Chairperson of the Board, he is an ex officio member of all committees.
Jean-René Halde joined BDC as President and CEO in 2005 and was reappointed in 2010 for a term of five years.
Mr. Halde brought more than 30 years of management and entrepreneurial experience to BDC. He has held CEO positions at several leading companies, including Metro-Richelieu Inc., Culinar Inc. and Livingston Group Inc.
He currently serves as Past Chairman as well as Chair of the Governance Committee of the Conference Board of Canada, and sits on the Board of the Montreal General Hospital Foundation. He is also a member of the World Presidents’ Organization (WPO), a global organization of more than 8,000 business leaders.
Mr. Halde has served as a director of a number of for-profit companies, including CCL Industries Inc., Gaz Metropolitain Inc., Groupe Vidéotron Ltée and Provigo Inc.; he has also served with numerous non-profit organizations and acted as Chairman of the Montreal Heart Institute, the Grocery Products Manufacturers of Canada and the Association des MBA du Québec.
Mr. Halde holds a Master of Arts in Economics from the University of Western Ontario and an MBA from Harvard Business School. He also holds the Corporate Director (ICD.D) designation from the Institute of Corporate Directors.
Member of the Board Credit and Risk Committee and member of the Board Investment Committee.
Board of Directors (March 31, 2015)
CURRENT MEMBERS
BDC AR15 | 119

Corporate Governance | Board of Directors
Eric Boyko joined the BDC Board of Directors in 2007 and was reappointed in 2011.
An entrepreneur with nearly two decades of experience with start-ups, Mr. Boyko has extensive expertise in early-stage business innovations.
He is President and CEO of Stingray Digital Inc., the leading multi-platform music service provider in the world, with more than 100 million subscribers in 113 countries.
Previously, Mr. Boyko founded and was President of eFundraising.com Corporation, which became a leading player in the North American fundraising industry. In 2006, he was named one of Canada’s Top 40 Under 40TM.
Mr. Boyko is also a board member of the Montreal Development Program, the Young Presidents’ Organization (YPO), the Montreal Economic Institute and the Société de développement économique Ville-Marie (SDEVM). He sits on the board of the Angel Investors of the Junior Chamber of Commerce of Montreal (JCCM).
A graduate with great distinction of McGill University, he holds a Bachelor of Commerce, with a specialization in Accounting and Entrepreneurship. Mr. Boyko became a Certified General Accountant (CGA) in 1997.
Member of the Audit Committee, member of the Board Credit and Risk Committee, and member of the Board Investment Committee.
Michael Calyniuk joined the BDC Board of Directors in February 2013.
Mr. Calyniuk has broad audit and consulting experience in finance, accounting, business processes and technology, and has directed a large portion of his efforts toward working with Canadian small and medium-sized enterprises.
He is a strategic advisor or director of a number of companies.
Mr. Calyniuk is a retired Partner of PricewaterhouseCoopers LLP, having held various senior local and global management positions during his career with the firm, including Global Chief Information Officer.
He currently serves as Independent Director, Chair of the Audit Committee and member of the Governance and Nomination Committee of Mundoro Capital Inc. He is also the B.C. chapter chair of the Institute of Corporate Directors (ICD) and Chairman of the board of the Maple Leaf Junior Golf Tour.
Mr. Calyniuk has previously served as Chairman of the board of the B.C. Advanced Systems Institute and as Co-Chair of the B.C. Innovation Council.
A Chartered Accountant, Mr. Calyniuk was named a fellow by the B.C. Institute of Chartered Accountants (FCA) in 2009. He holds a Bachelor of Commerce, with an Information Systems major, from the University of British Columbia and is a graduate of the Institute of Corporate Directors (ICD) program.
Member of the Audit Committee and member of the Board Credit and Risk Committee.
ERIC BOYKOPresident and CEO Stingray Digital Inc. Montreal, Quebec
MICHAEL CALYNIUKPresident MEC Dynamics Inc. Vancouver, British Columbia
BDC AR15 | 120

Corporate Governance | Board of Directors
SUE FAWCETTPresident Fawcett Financial Inc. Calgary, Alberta
Sue Fawcett joined the BDC Board of Directors in 2008.
Ms. Fawcett has more than 25 years of experience in the financial industry in Canada and Asia (Singapore).
She is President of Fawcett Financial Inc., a private firm that works closely with angel investors and provides strategic advice to early-stage companies.
Previously a vice president and advisor with CIBC Wood Gundy, Ms. Fawcett is an associate of Independent Review Inc., advising Canada’s prominent investment fund companies on governance issues pertaining to the setting up and running of independent review committees.
Ms. Fawcett sits on the board of the Alberta Economic Development Authority, which provides recommendations and long-term strategic advice on key economic issues to the premier and cabinet.
Ms. Fawcett has previously served on the boards of the Ottawa-Carleton Economic Development Corporation, the Riverside Hospital Foundation and the Ottawa Ballet.
She holds a Bachelor of Commerce from the University of Calgary and the Corporate Director (ICD.D) designation from the Institute of Corporate Directors. Ms. Fawcett is also a Chartered Financial Analyst (CFA).
Member of the Audit Committee, the Pension Funds Investment Committee and the Board Investment Committee.
Edward (Ted) Gordon joined the BDC Board of Directors in December 2013.
Mr. Gordon has more than 35 years of business experience focusing on financial management, primarily with Northern Telecom and as a principal with the Cartier Consulting Group.
He is a financial security advisor with Freedom 55 Financial in Ottawa, a division of the London Life Insurance Company, where he supports clients through the protection and growth of their wealth.
Mr. Gordon currently sits on the board of directors of the Perley and Rideau Veterans’ Health Centre.
He was one of 13 Canadians on the federal government’s Task Force on Financial Literacy, with the mandate to create a national strategy to improve the financial literacy of Canadians. The task force report, titled Canadians and Their Money, was delivered to the Minister of Finance in December 2010.
He is a former member of the board of directors of the Queensway Carleton Hospital, where he chaired the Audit Committee. He was also a member of the board of directors of the Ottawa Congress Centre (now the Ottawa Convention Centre) and the Log Farm Trust Society.
He was a professor in the School of Part-Time Studies at Algonquin College, where he designed and taught a non-credit, personal interest course called Personal Financial Literacy.
Mr. Gordon holds an Honours Business Administration (HBA) degree from the Ivey School of Business at the University of Western Ontario, as well as the Chartered Professional Accountant (CPA) and Chartered Accountant (CA) designations.
Member of the Audit Committee and the Pension Funds Investment Committee.
EDWARD (TED) GORDONFinancial Security AdvisorFreedom 55 FinancialOttawa, Ontario
BDC AR15 | 121

Corporate Governance | Board of Directors
Brian Hayward joined the BDC Board of Directors in 2008 and was reappointed in 2011.
Mr. Hayward has over 16 years of experience as a Chief Executive Officer in large Canadian companies. He is an accomplished senior executive with a proven track record in driving large-scale financial and cultural change to build organizational effectiveness and profitable growth.
He is President of Aldare Resources, a business consultancy that provides business advisory and governance services.
From 2001 until 2007, Mr. Hayward was CEO of Agricore United, one of the largest agribusinesses in Canada, exporting to over 50 countries and generating annual sales of about $4 billion.
Before that, he was CEO of United Grain Growers, the second-largest agribusiness in Western Canada. In this position, he successfully negotiated on behalf of his company the merger that led to the creation of Agricore United.
Mr. Hayward has extensive board experience, serving on public and private company boards, including those of Glacier Media Inc. and Ridley Inc. He has also provided leadership to a number of non-profit organizations, including the Royal Winnipeg Ballet, the Conference Board of Canada and the Arthritis Society.
Mr. Hayward has a Master of Agricultural Economics degree from McGill University. He also holds the Chartered Director (C.Dir.) designation from the Directors College of McMaster University’s DeGroote School of Business.
Chairperson of the Audit Committee, member of the Board Credit and Risk Committee, and member of the Governance and Nominating Committee.
BRIAN HAYWARDPresident Aldare Resources Winnipeg, Manitoba
SHAHIR GUINDIManaging Partner Osler, Hoskin & Harcourt LLP Montreal, Quebec
Shahir Guindi joined the BDC Board of Directors in December 2012.
Mr. Guindi is a Montreal lawyer with an extensive background in mergers and acquisitions, corporate finance and private equity, and venture capital investments and fund formation, including in the technology and life science sectors. He has significant experience in cross-border and international transactions for both Canadian and international clients.
He is currently the Managing Partner of the Montreal office of Osler, Hoskin & Harcourt LLP and Co-Chair of Réseau Capital, Quebec’s venture capital and private equity industry association. He also sits on the boards of several companies and not-for-profit organizations, such as the St. Peter and St. Paul Coptic Orthodox Church.
Mr. Guindi is a recipient of the Lexpert® Rising Stars: Leading Lawyers Under 40 award. He has received significant industry recognition, including top rankings in six categories of the Canadian Legal Lexpert® Directory (including M&A, corporate finance, private equity and corporate mid-market), and Lawyer of the Year honours in information technology law and technology law from The Best Lawyers in Canada® 2013. He was also named Montreal Technology Lawyer of the Year by The Best Lawyers in Canada® 2012.
Mr. Guindi was admitted to the Barreau du Quebec and the New York State Bar Association in 1990 and is a member of the Canadian Bar Association.
A graduate of McGill University, Mr. Guindi has degrees in Civil Law (B.C.L.) and Common Law (LL.B.).
Member of the Board Credit and Risk Committee and member of the Human Resources Committee.
BDC AR15 | 122

Corporate Governance | Board of Directors
PRASHANT PATHAKPresident and Chief Executive Officer Ekagrata Inc. Toronto, Ontario
Managing Partner ReichmannHauer Capital Partners Toronto, Ontario
Claude McMaster joined the BDC Board of Directors in March 2015.
Mr. McMaster has more than 20 years of experience in corporate finance, international business growth, strategic alliances, mergers and acquisitions, and divestitures, primarily in the technology and life sciences sectors.
He is President and Chief Executive Officer of D-BOX Technologies Inc., a company designing, manufacturing and commercializing motion simulation systems intended for the entertainment and industrial markets.
Previously, he worked at Ernst & Young as Vice-President, Finance, Mergers and Acquisitions where he led international projects and multidisciplinary teams, forged strategic alliances and guided the growth of companies.
Mr. McMaster also founded and headed the management consulting firm AVINGCO, which was sold to Arthur Andersen in 1998.
He currently serves on the boards of D-BOX Technologies, Montreal Heart Institute and he is a former board member of the Biron Groupe Santé. He is also on the advisory board of Nexio Group.
Mr. McMaster is a member of Ernst & Young’s alumni advisory board, Business Development. He is also a member of the QG100 Network which supports an exclusive group of Quebec CEOs in their global strategies.
In 2011, Mr. McMaster was named SGF CEO of the Year, an award presented to CEOs of Quebec technology companies.
Mr. McMaster holds university degrees in engineering, business administration and law from Montreal’s École Polytechnique, Laval University and the University of Montreal. He has completed executive programs in global financial management, corporate governance and advanced corporate finance from renowned institutions such as Harvard Business School, McGill University and INSEAD.
Prashant Pathak joined the BDC Board of Directors in 2008.
Mr. Pathak has extensive international management and operational experience, having worked in Europe, the Middle East, Southeast Asia and North Asia.
He is President and CEO of Ekagrata Inc., a private investment company. He is also Managing Partner of ReichmannHauer Capital Partners, a private investment firm, where he is focused on addressing all strategic, financial, operational and organizational aspects of investments to drive superior returns.
In 2008, he was named one of Canada’s Top 40 Under 40.
Previously, he was a partner at McKinsey & Company Inc. where, for six years, he advised executives of global corporations.
Before joining McKinsey, he held several management and operational positions in the energy services industry at Halliburton and Schlumberger.
Mr. Pathak is a member of the Young Presidents’ Organization (YPO). In his role as Senior Advisor to Project Beyshick, he supports a program for driving entrepreneurship among First Nations youth.
He is a former member of the board of the North York General Hospital and was a charter member of TiE, the world’s largest non-profit network dedicated to the advancement of entrepreneurship.
Mr. Pathak holds an MBA with distinction from INSEAD, and a Bachelor of Technology degree in Electrical Engineering and a diploma in Fuzzy Logic from the Indian Institute of Technology (IIT).
Chairperson of the Board Investment Committee, member of the Governance and Nominating Committee, and member of the Human Resources Committee.
CLAUDE McMASTERPresident and CEOD-BOX Technologies Inc.Longueuil, Quebec
BDC AR15 | 123

Corporate Governance | Board of Directors
ROBERT H. PITFIELDExecutive Chairman of the BoardTravelEdge GroupToronto, Ontario
MARY-ALICE VUICICExecutive Vice President, Human Resources and Labour RelationsLoblaw Companies Ltd.Toronto, Ontario
Robert Pitfield joined the BDC Board of Directors in May 2014.
Mr. Pitfield has extensive knowledge of the banking sector, having spent 30 years in the financial services industry, overseeing international banking, wealth management and risk at Scotiabank.
He is Executive Chairman of the Board of TravelEdge, a privately owned travel company with approximately $1 billion in sales and over $100 million in operating revenues.
Prior to joining TravelEdge he was Group Head, Risk and Chief Risk Officer for Scotiabank.
A former member of the board of Junior Achievement and of HRH Youth Business International, Mr. Pitfield currently sits on the board of President’s Circle at the University of Ottawa.
Mr. Pitfield has a Bachelor of Arts from the University of Toronto, a law degree from the University of Ottawa, and is a member of the Law Society of Upper Canada.
Chairperson of the Board Credit and Risk Committee and member of the Human Resources Committee.
Mary-Alice Vuicic joined the BDC Board of Directors in October 2013.
Ms. Vuicic has more than 20 years of experience working with large national and international organizations, and family-owned entrepreneurial businesses.
She is Executive Vice President, Human Resources and Labour Relations, at Loblaw Companies Ltd.
Most recently Executive Vice President, Human Resources and Labour Relations at Shoppers Drug Mart, she took on her current position following the acquisition of Shoppers by Loblaw Companies Ltd. in 2014. Ms. Vuicic joined Shoppers Drug Mart in 2007 as Senior Vice President, Human Resources and Organizational Development, after leading the human resources function at Walmart Canada as Vice President, People.
Previously, she held human resources executive and management positions at Chapters/Indigo and Wendy’s International, Inc.
She is an active member in the community and supports health and professional causes.
A Certified Human Resources Professional (CHRP), Ms. Vuicic holds a Bachelor of Arts degree from the University of Windsor and an Advanced Human Resources certificate from the University of Toronto, and has completed Harvard Business School’s Advanced Management Program.
Chairperson of the Human Resources Committee and member of the Governance and Nominating Committee.
BDC AR15 | 124

Corporate Governance | Board of Directors
ROSEMARY ZIGROSSIConsultantPromontory Financial GroupToronto, Ontario
Rosemary Zigrossi joined the BDC Board of Directors in 2008.
Ms. Zigrossi has almost 30 years of experience in the financial sector, both in investments and in financial reporting and analysis at leading Canadian organizations.
Ms. Zigrossi is currently a consultant with Promontory Financial Group, LLC, a consulting firm for global financial services companies.
Previously, she was with the Ontario Teachers’ Pension Plan, the largest single-profession pension plan in Canada. Over the course of 19 years, she held various positions, including Vice President, Asset Mix and Risk; Vice President, Venture Capital (a program she initiated); and Controller. Before that, Ms. Zigrossi was with J.P. Morgan Bank of Canada and KPMG.
She currently serves on the boards of directors of Sprott Asset Management and Russell Investment Corporate Class Inc., and the board of trustees of the McMichael Canadian Art Collection. She is also a member of the Investment Committee of Sustainable Development Technology Canada.
A past governor of Trent University, Ms. Zigrossi currently serves on its investment and pension committee. She is a former member of the Council of Canadian Academies Expert Panel on the State of Industrial Research and Development in Canada and a former member of the board of the Canadian Venture Capital Association, and she has served as a member of the board and chairman of a number of start-up companies.
Ms. Zigrossi is a Chartered Accountant (CA) and a Chartered Financial Analyst (CFA), and holds the Corporate Director (ICD.D) designation from the Institute of Corporate Directors. She earned a Bachelor of Commerce from the University of Toronto and has completed the Harvard Business School program for management development.
Chairperson of the Pension Funds Investment Committee and member of the Board Investment Committee.
BDC AR15 | 125

Senior Management Team
JEAN-RENÉ HALDEPresident and Chief Executive Officer
Jean-René Halde joined BDC as President and CEO in 2005 and was reappointed in 2010 for a term of five years.
Mr. Halde brought more than 30 years of management and entrepreneurial experience to BDC. He has held CEO positions at several leading companies, including Metro-Richelieu Inc., Culinar Inc. and Livingston Group Inc.
He currently serves as Past Chairman as well as Chair of the Governance Committee of the Conference Board of Canada, and sits on the Board of the Montreal General Hospital Foundation. He is also a member of the World Presidents’ Organization (WPO), a global organization of more than 8,000 business leaders.
Mr. Halde has served as a director of a number of for-profit companies, including CCL Industries Inc., Gaz Metropolitain Inc., Groupe Vidéotron Ltée and Provigo Inc.; he has also served with numerous non-profit organizations and acted as Chairman of the Montreal Heart Institute, the Grocery Products Manufacturers of Canada and the Association des MBA du Québec.
Mr. Halde holds a Master of Arts in Economics from the University of Western Ontario and an MBA from Harvard Business School. He also holds the Corporate Director (ICD.D) designation from the Institute of Corporate Directors.
CHANTAL BELZILESenior Vice President and Chief Information Officer
Chantal Belzile was appointed Senior Vice President and Chief Information Officer in 2012.
In this role, she has overall responsibility for developing and implementing the Bank’s information technology strategy and services. This includes corporate project portfolio management, information security and compliance, and information technology management and solutions delivery.
Ms. Belzile has over 25 years of experience in technology and project management roles within large companies, and joined BDC in 2007 as Vice President, Information Technology.
Before this, she held various senior management positions at Air Canada, where she was responsible for aircanada.com and was involved in key initiatives, including the airline’s merger with Canadian Airlines and the implementation of Six Sigma.
Ms. Belzile began her career working for a major information technology consulting firm, where she had the opportunity to learn about various industries.
She is a board member of the Montreal Women’s Y Foundation.
Ms. Belzile holds a Bachelor of Computer Science degree from the University of New Brunswick and a Master of Science degree from Queen’s University.
BDC AR15 | 126

PAUL BURONExecutive Vice President and Chief Financial and Risk Officer (CFRO)
Paul Buron joined BDC in 2006 as Executive Vice President and Chief Financial Officer. In 2015 he was given the additional appointment of Chief Risk Officer.
He is responsible for finance, risk management and treasury, as well as corporate strategy and planning.
In the fall of 2011, Mr. Buron was also appointed Interim Executive Vice President, Financing and Consulting. For the following year, he was responsible for financing, consulting, corporate financing, global expansion services for entrepreneurs, and operations support across the bank, in addition to his CFO responsibilities.
Mr. Buron has over 30 years of experience in finance. Before joining BDC, he held leadership positions in major corporations, such as Société générale de financement du Québec, Donohue Inc. and the TVA Group Inc., where he assumed responsibility for television operations and regional stations in addition to his role as Senior Vice President and Chief Financial Officer.
He holds a Bachelor of Business Administration from HEC Montréal and is a member of the Ordre des comptables agréés du Québec.
Additional Information | Senior Management Team
MICHEL BERGERONSenior Vice President, Marketing and Public Affairs
Michel Bergeron was appointed Senior Vice President, Marketing and Public Affairs in 2012.
He oversees branding and advertising, client experience, economic analysis, government relations, internal and corporate communications, marketing, public and media relations, research, strategic alliances and partnerships, and web strategy.
Mr. Bergeron has over 20 years of private, public and parapublic experience, dealing with financial sector issues, strategic planning, communication, branding and international trade matters.
He joined BDC in 1999 and has held a variety of field and corporate positions during his career with the bank, including Senior Manager, Loans; Director, Corporate Planning; Director, Strategic and Business Solutions; and Vice President of Corporate Relations.
Mr. Bergeron began his career in the federal government, where he worked in international trade negotiations for the Department of Finance.
He is a board member of Futurpreneur (formerly the CYBF) and also Chairman of The Montreal Group, an international association of development banks.
Mr. Bergeron holds Law degrees from Laval University and Dalhousie University, and a Master of International Relations degree from Laval University. He also holds the Corporate Director (ICD.D) designation from the Institute of Corporate Directors.
BDC AR15 | 127

Additional Information | Senior Management Team
MARY KARAMANOSSenior Vice President, Human Resources
Mary Karamanos was appointed Senior Vice President, Human Resources in 2004.
In this role, she works closely with other members of the senior management team and is responsible for the development and implementation of BDC’s human capital strategies, including talent management and leadership development.
Over a 30-year career in business, she has acquired extensive experience in strategic human resources in both entrepreneurial companies and large global organizations in the retail, consumer goods and financial sectors.
Ms. Karamanos joined BDC in October 2002 as Vice President, Human Resources. Prior to this, she held executive positions at Corby Distilleries in Montreal and Toronto, and Allied Domecq, Spirits and Wine in Westport, Connecticut.
A native of Montreal, she is a graduate of McGill University and holds a Bachelor of Arts degree in Industrial Relations and a Certified Compensation Professional (CCP) designation from World at Work. She is active in the community and supports children’s charities.
PIERRE DUBREUILExecutive Vice President, Financing
Pierre Dubreuil joined BDC in 2012. He is Executive Vice President, Financing.
In this role, he is responsible for financing, consulting and operations support across the bank.
Mr. Dubreuil has over 30 years of commercial and general banking experience.
Before joining BDC, he was Senior Vice President, International, at National Bank of Canada. During his 18-year tenure, he held executive positions in key functions such as syndication, credit, commercial lending, marketing and business solutions.
After beginning his career with the Federal Business Development Bank, he also worked at Export Development Canada and as Vice President, Business Development, at the Industrial Bank of Japan in Toronto.
Mr. Dubreuil holds a Bachelor of Business Administration from Laval University and has completed various leadership and management programs.
BDC AR15 | 128

Additional Information | Senior Management Team
JÉRÔME NYCZExecutive Vice President, BDC Capital
Jérôme Nycz was appointed Executive Vice President, BDC Capital in 2013.
In this role, he leads the activities of BDC Capital, a subsidiary of BDC that offers venture capital, equity as well as growth and business transition capital. He also oversees BDC’s deployment of the Venture Capital Action Plan.
Mr. Nycz has over 20 years of experience in the financial and public sectors.
He joined BDC in 2002, overseeing corporate strategy and planning, and shareholder relations. In subsequent years, he added responsibility for enterprise risk management, economic analysis and knowledge management to his portfolio. During this time, he conducted several internal strategic reviews, including subordinate financing and venture capital (taking on the additional role of Interim, Executive Vice President, Venture Capital in 2011), and led a multidisciplinary team that prepared the Bank’s submission for the 2010 legislative review of the BDC Act.
Prior to his current role, he was Senior Vice President, Corporate Strategy and Subordinate Financing.
Mr. Nycz began his career with the federal government as a senior economist and policy advisor at the Department of Finance, Industry Canada and National Defence. He also worked at Export Development Canada and as an investment officer at the Canadian Consulate in Boston.
Mr. Nycz is a board member of Canada’s Venture Capital and Private Equity Association (CVCA), Réseau Capital and CIRANO.
He holds a Bachelor of Arts in Economics and Political Science from Concordia University and an IMBA from Hartford University.
New photo on the website
MICHAEL R. McADOOExecutive Vice President, BDC Advantage
Michael R. McAdoo was appointed Executive Vice President, BDC Advantage in 2015.
In this role, he is responsible for BDC’s offering of consulting and other non-financial services to entrepreneurs.
Over a 30-year period as an entrepreneur, consultant and executive, Mr. McAdoo has acquired significant experience in the areas of strategy, international business and operations.
Before joining BDC, he held several senior strategy and operational roles during 13 years at Bombardier Inc. and Bombardier Aerospace, including managing a manufacturing facility in Mexico. Most recently, he was Vice President, Strategy and International Business Development at Bombardier Aerospace. Prior to Bombardier, he was a Principal at the Boston Consulting Group specializing in manufacturing, retail economics, distribution and globalization, serving clients in the NAFTA region and Europe.
He comes from a family of entrepreneurs whose businesses included retail, distribution, light manufacturing and real estate. Mr. McAdoo also started his own small business while still an undergraduate, and ran it for many years while pursuing his professional career.
He is a co-founder of the Banff Forum, an annual non-partisan public policy conference. He also serves as a board member of the Montreal Chamber Music Festival.
Mr. McAdoo holds a Bachelor of Arts in Political Studies from Queen’s University, as well as graduate degrees in International Affairs and Journalism from Columbia University.
BDC AR15 | 129

Additional Information | Senior Management Team
LOUISE PARADISSenior Vice President, Legal Affairs and Corporate Secretary
Louise Paradis was appointed Senior Vice President of Legal Affairs and Corporate Secretary in 2006. She is also BDC’s Chief Compliance Officer.
She provides legal support to all business units, as well as the Board of Directors, and is responsible for developing and implementing strategies on records management.
Over a 35-year career in the financial sector, Ms. Paradis has acquired extensive experience in legal, administration and compliance matters, as well as human resources, finance and operations.
Ms. Paradis began her career at BDC in 1976 as Legal Counsel and re-joined BDC in 2004 as Vice President of Legal Affairs and Corporate Secretary. Previously, she was responsible for legal affairs, human resources, the corporate secretariat and administration at the Canadian office of Société Générale, and was Director of Operations at Société Générale for two years.
Ms. Paradis holds a licence in Law from McGill University and is a member of the Barreau du Québec.
BDC AR15 | 130

Five-Year Operational and Financial Summary
Operational Statistics 2015 2014 2013 2012 2011
Loans Committed to clients(1)
as at March 31 Amount 21,256,479 19,723,747 18,341,604 16,956,675 15,913,193 Number of clients 32,213 29,929 28,056 27,582 27,989
Acceptances Amount 4,711,675 4,102,065 4,110,703 3,623,075 3,244,713 Number 12,012 10,976 9,195 6,926 9,795
Subordinate Financing(includes both BDC and Caisse portion)Committed to clients(1)
as at March 31 Amount 706,866 636,277 583,816 498,670 414,394 Number of clients 471 427 400 385 352
Acceptances Amount 231,514 186,606 189,757 163,775 106,451 Number 177 126 113 137 97
Venture Capital(2)
Committed to clients(1)
as at March 31 Amount 1,026,967 861,881 821,882 735,454 726,431 Number of clients 209 183 149 103 104
Authorizations Amount 185,421 154,754 145,267 126,751 99,377 Number 101 94 87 45 45
Asset-backed securitiesAmount committed to clients(1) 630,000 530,000 907,048 1,110,024 3,193,441 as at March 31Amount authorized (cancelled) 100,000 (175,000) 265,000 290,000 150,000
Venture Capital Action Plan Commited to clients(1)
as at March 31 324,746 210,000 – – – Amount 8 5 – – – Number of clients
Authorizations Amount 114,845 210,000 – – – Number 3 5 – – –
BDCTotal committed to clients 23,945,058 21,961,905 20,654,350 19,300,823 20,247,459
(1) Amount committed to clients represents portfolio outstanding and amount undisbursed, at cost.(2) For venture capital commitment to clients, please see Note 12-Venture Capital Investments and Note 27-Commitments to the Consolidated Financial Statements.(3) Amount cancelled includes $25,000 in authorizations and $200,000 in cancellations.
(3)
for the years ended March 31 (in thousands of Canadian dollars)
BDC AR15 | 131

Additional Information | Five-Year Operational and Financial Summary
Financial Information 2015 2014 2013 2012 2011
Net Income and Comprehensive Income – by Business Segments(1)
for the years ended March 31
Financing 453,428 433,833 433,124 504,736 305,603 Growth & Transition Capital 38,525 23,305 34,685 36,212 20,400 Venture Capital 23,268 (12,075) (8,559) (42,640) (20,765)Consulting (24,245) (16,855) (12,450) (11,020) (8,883)Securitization 3,965 5,822 11,355 46,159 70,166 Venture Capital Action Plan (4,251) (1,418) – – –
Net income 490,690 432,612 458,155 533,447 366,521
Net income attributable to:BDC's shareholder 490,516 425,968 454,661 520,335 360,292
Non-controlling interests 174 6,644 3,494 13,112 6,229
Net income 490,690 432,612 458,155 533,447 366,521
Other comprehensive income (loss)(2) (30,247) 49,633 (24,906) (152,486) 58,317
Total comprehensive income 460,443 482,245 433,249 380,961 424,838
Total comprehensive income attributable to:BDC's shareholder 460,269 475,601 429,755 367,849 418,609 Non-controlling interests 174 6,644 3,494 13,112 6,229
Total comprehensive income 460,443 482,245 433,249 380,961 424,838
Financial Position Informationas at March 31
Asset-backed securities 407,731 336,477 437,453 763,200 3,068,949 Loans, net of allowance for credit losses 18,414,044 17,241,064 15,871,635 14,739,271 13,731,011 Subordinate financing investments 642,810 576,677 557,840 457,369 387,091 Venture capital investments 709,639 495,096 456,708 358,951 413,782 Venture capital action plan investments 47,643 5,169 – – – Total assets 21,129,017 19,569,957 18,183,905 17,219,882 18,399,578 Total liabilities 16,349,897 15,179,908 14,228,230 13,594,621 14,639,731
Total equity attributable to: BDC’s shareholder 4,744,566 4,338,910 3,872,902 3,509,980 3,613,202 Non-controlling interests 34,554 51,139 82,773 115,281 146,645
Total equity 4,779,120 4,390,049 3,955,675 3,625,261 3,759,847
(1) For detailed information on fiscal 2015 and fiscal 2014 segmented information, please also refer to Note 25—Segmented Information to the Consolidated Financial Statements.
(2) For detailed information on fiscal 2015 and fiscal 2014 other comprehensive income, please refer to the Consolidated Statement of Comprehensive Income (p.52).
(in thousands of Canadian dollars)
BDC AR15 | 132
ACCEPTANCEThe point at which the client has agreed to the authorized financing terms and conditions that BDC has offered him or her. Client acceptance follows BDC authorization. (Information on acceptances disclosed in this report is net of cancellations or reductions after client acceptance.)
ALLOWANCE FOR CREDIT LOSSES Represents an amount that management deems adequate to fully provide for impairment in the existing loan portfolio. Allowance for credit losses can be individual or collective, and is recorded on the financial position as a deduction from loans.
ASSET-BACKED SECURITIES Securities created through the securitization of a pool of assets. For example, BDC’s securitization contains Canadian AAA-rated term securities backed by loans and leases on vehicles and equipment, as well as dealer floor plan loans.
AUTHORIZATIONThe point at which BDC has completed its due diligence and approved the financing request or venture capital investment. Authorization precedes acceptance. (Information on authorizations disclosed in this report is net of cancellations or reductions after BDC authorization.)
COLLECTIVE ALLOWANCEEstablished by management to recognize credit losses in the existing performing loan portfolio that have occurred as at the financial position date but have not yet been specifically identified on an individual loan basis.
CONSULTING REVENUEFees from services provided by BDC’s national network of consultants to assess, plan and implement management solutions.
CROSS-CURRENCY SWAPSAgreements to exchange payments in different currencies over pre-determined periods of time.
DEBT-TO-EQUITY RATIOA measure to ensure BDC operates within its statutory limitations on debts, calculated as the aggregate of borrowings and contingent liabilities over the equity attributable to BDC’s shareholder. It also includes preferred shares classified as liabilities, and excludes accumulated other comprehensive income or loss. The statutory limit of BDC’s debt-to-equity ratio is 12:1.
DERIVATIVE FINANCIAL INSTRUMENTSContracts whose value is “derived” from movements in interest or foreign exchange rates, or equity or commodity prices. Use of derivatives allows for the transfer, modification or reduction of current or expected risks from changes in rates and prices.
DIRECT INVESTMENTSInvestments BDC makes directly in investee companies.
EFFICIENCY RATIOA measure of the efficiency with which BDC incurs expenses to generate income on its financing operations. It is calculated as operating and administrative expenses, as a percentage of net interest and other income. Other income includes fee income and net realized gains or losses on other financial instruments. A lower ratio indicates improved efficiency.
FAIR VALUEThe price that knowledgeable, willing parties—under no compulsion to act—would agree to in an arm’s-length transaction. Fair value represents management’s best estimate of the net worth of an investment at the financial position date and may not reflect the ultimate realizable value upon disposal of the investment.
HEDGINGA risk management technique used to insulate financial results from market, interest rate or foreign currency exchange risk (exposure) arising from normal banking operations.
IMPAIRED LOANSLoans where, in management’s opinion, credit quality has deteriorated so much that there is no longer reasonable assurance that BDC can collect the full amount of principal and interest on time.
Glossary
BDC AR15 | 133
Additional Information | Glossary
INDIVIDUAL ALLOWANCE An allowance that management establishes to recognize credit losses in the existing loan portfolios that have occurred and are identified on an individual loan basis, as at the financial position date.
INTEREST RATE SWAPSAgreements to exchange streams of interest payments—typically, one at a floating rate and the other at a fixed rate—over a specified period, based on notional principal amounts.
LOSS ON INITIAL RECOGNITIONRepresents the difference between the fair value of a financial instrument and its cost at the time of purchase. Loss on initial recognition is recognized in net income at the time of purchase and subsequently amortized through interest income over the life of the financial instrument, using the effective interest rate method.
MASTER NETTING AGREEMENTA standard bilateral contract that enables trading counterparties to agree to net collateral requirements and, in a close-out situation, settlement amounts related to underlying master trading contracts for sales and purchases of financial instruments. The master netting agreement offsets positive balances of one transaction with negative balances of another.
NET CHANGE IN UNREALIZED APPRECIATION OR DEPRECIATION OF INVESTMENTSAmount included in income resulting from movements in the fair value of investments for the period.
NET INTEREST INCOMEThe difference between interest revenues generated by interest-bearing portfolios, as well as cash equivalents and securities, and the cost of borrowings to fund these assets.
NET REALIZED GAINS OR LOSSES ON INVESTMENTSGains realized, net of realized capital losses, upon sale or write-off of investments, excluding the net change in unrealized appreciation or depreciation of venture capital and subordinate financing investments.
NET REALIZED GAINS OR LOSSES ON OTHER FINANCIAL INSTRUMENTSAmounts that are related to structured notes and their associated derivatives. Realized gains or losses occur when financial instruments are repurchased prior to maturity at a price higher or lower than the original purchase price.
NET UNREALIZED GAINS OR LOSSES ON OTHER FINANCIAL INSTRUMENTSAmounts that are related to structured notes and their associated derivatives. These represent the amounts included in income resulting from movements in the fair value of financial instruments for the period.
NON-CONTROLLING INTERESTThe equity in a subsidiary not attributable, directly or indirectly, to BDC.
PERFORMING PORTFOLIOLoans for which there is reasonable assurance that BDC can collect the principal and interest on time.
PROVISION FOR CREDIT LOSSESA charge to income that represents an amount that management deems adequate to fully provide for impairment in the existing loan portfolios, given the composition of the loan portfolios, the probability of default on the loans, the economic environment and the allowance for credit losses already established.
RETURN ON COMMON EQUITY (ROE)Net income, less preferred share dividends, expressed as a percentage of average common equity. It excludes other comprehensive income or loss on post-employment benefits, accumulated other comprehensive income or loss, and non-controlling interest.
START-UPA business that is being established for the first time. Also included in this category are existing enterprises that have not yet registered 12 consecutive months of sales.
SUBORDINATE FINANCINGA hybrid instrument that brings together some features of both debt financing and equity financing.
BDC AR15 | 134

2 Message From the Chair of the Board of Directors
4 Message From the President and CEO
7 Management’s Discussion and Analysis
47 Consolidated Financial Statements
111 Corporate Governance
126 Additional Information
CG3
inc.
| Co
mm
unic
atio
ns |
Gra
phis
me
lul3
0-20
15E
Ce
docu
men
t est
aus
si di
spon
ible
en
franç
ais.
1209
-540
0
What We AreWe are the only bank in Canada that is dedicated exclusively to entrepreneurs.
> We promote entrepreneurship, with a special focus on small and medium-sized enterprises.
What We DoWe offer services that support Canadians who are creating, managing and growing small and medium-sized businesses:
> Financing > Capital > Consulting
We offer these services to entrepreneurs in every part of Canada and every sector of the economy.
Why We Do ItWhen entrepreneurs succeed, Canadians benefi t. The choices they make and the risks they take are incredibly important to the Canadian economy. They help decide how ideas become products and services, how jobs get created, and how Canada stays prosperous. From traditional companies to high-tech start-ups, every one of them is helping create value in Canada’s economy.
lul3
0-20
15E-
Ce
docu
men
t est
aus
si di
spon
ible
en
franç
ais.
1495
-672
1

BDC.CA
ANNUAL REPORT 2015
DEDICATEDEXCLUSIVELY
BDC IS THEONLY BANK
TOENTREPRENEURS
Business Developm
ent Bank of Canada
Annual Report 2015