bcs-based biowaivers: risks and opportunities
TRANSCRIPT
BCS-based biowaivers: risks and opportunities
Dissertation
zur Erlangung des Grades
„Doktor der Naturwissenschaften“
im Promotionsfach Pharmazie
am Fachbereich Chemie, Pharmazie und Geowissenschaften
der Johannes Gutenberg-Universität
in Mainz
Maartje Elizabeth (Marlies) Kubbinga
geb. in Amsterdam
Mainz, den 02.05.2016
2
D77 (Mainzer Dissertation)
Dekan: ...
1. Berichterstatter: ...
2. Berichterstatter: ...
Tag der mündlichen Prüfung: 02.05.2016

3
Voor Dirk
Voor de tsjilpers
4
TABLE OF CONTENTS
1. INTRODUCTION: BIOAVAILABILITY, BIOEQUIVALENCE AND BIOWAIVERS .............. 8
1.1. Regulatory context and definitions ................................................................................................. 8
Bioequivalence of oral dosage forms with systemic action .......................................................... 10
1.2. Scientific context .................................................................................................................................. 11
API characteristics and bioavailability ................................................................................................... 11
Formulation and excipient effects .......................................................................................................... 12
Models as a surrogate for in vivo bioavailability and bioequivalence testing ....................... 15
1.3. Practical experience from both scientific and regulatory perspective ............................. 17
1.4. Aims and outline of this thesis........................................................................................................ 18
2. MATERIALS AND METHODS ........................................................................................... 19
2.1. Evaluation of the regulatory context ............................................................................................ 19
2.2. Study of potential excipient effects .............................................................................................. 19
3. RESULTS ........................................................................................................................... 20
3.1. Risk analysis in bioequivalence and biowaiver decisions ..................................................... 21
Abstract ............................................................................................................................................................. 21
Introduction ..................................................................................................................................................... 21
Material and methods.................................................................................................................................. 23
Results ............................................................................................................................................................... 24
Discussion ........................................................................................................................................................ 28
Conclusion ....................................................................................................................................................... 31
3.2. The impact of the EMA change in definition of “dose” on the BCS dose/solubility ratio: a
review of the biowaiver monographs ........................................................................................................ 32
Abstract ............................................................................................................................................................. 32
Introduction ..................................................................................................................................................... 32
Methods ............................................................................................................................................................ 34
Results and discussion ................................................................................................................................ 34
Conclusion ....................................................................................................................................................... 40
5
3.3. Novel insights into excipient effects on the biopharmaceutics of APIs from different BCS
classes: lactose in solid oral dosage forms .............................................................................................. 42
Abstract ............................................................................................................................................................. 42
Introduction ..................................................................................................................................................... 42
Methods ............................................................................................................................................................ 44
Results ............................................................................................................................................................... 45
Discussion ........................................................................................................................................................ 48
Conclusion ....................................................................................................................................................... 51
3.4. The influence of chitosan on the oral bioavailability of acyclovir – a comparative
bioavailability study in humans .................................................................................................................... 52
Abstract ............................................................................................................................................................. 52
Introduction ..................................................................................................................................................... 52
Materials and methods ................................................................................................................................ 53
Results ............................................................................................................................................................... 56
Discussion ........................................................................................................................................................ 62
Conclusion ....................................................................................................................................................... 65
3.5. The effect of chitosan on the bioaccessibility and intestinal permeability of acyclovir – in
vitro studies .......................................................................................................................................................... 66
Abstract ............................................................................................................................................................. 66
Introduction ..................................................................................................................................................... 66
Materials and methods ................................................................................................................................ 67
Results ............................................................................................................................................................... 73
Discussion ........................................................................................................................................................ 78
Conclusion ....................................................................................................................................................... 83
4. GENERAL DISCUSSION ................................................................................................... 84
4.1. Biowaiver extensions from a risk-based perspective. ............................................................ 84
Incidence .......................................................................................................................................................... 84
Detection .......................................................................................................................................................... 87
Severity .............................................................................................................................................................. 89
4.2. Regulatory perspective ...................................................................................................................... 90
6
4.3. Overall evaluation and future perspectives ............................................................................... 91
5. SUMMARY ........................................................................................................................ 92
5.1. Summary.................................................................................................................................................. 92
5.2. Zusammenfassung ............................................................................................................................... 93
5.3. Samenvatting ......................................................................................................................................... 94
6. REFERENCES ..................................................................................................................... 95
7. APPENDICES .................................................................................................................. 106
7.1. Supplementary information to section 3.4: Bioanalytical method validation .............106
7.2. Supplementary information to section 3.4: Individual plasma profiles ........................110
8. LIST OF PUBLICATIONS ................................................................................................ 113
9. CONFLICTS OF INTEREST AND FINANCIAL DISCLOSURES ....................................... 114
10. ACKNOWLEDGEMENTS/DANKWOORD/DANKSAGUNG .......................................... 115
11. CURRICULUM VITAE ..................................................................................................... 119

7
LIST OF ABBREVIATIONS
API active pharmaceutical ingredient
AUC area under the curve
BCS Biopharmaceutics Classification System
CI confidence interval
Cmax peak plasma concentration
CV coefficient of variation
D dose
DD degree of deacetylation
DMEM Dulbecco's modified Eagle's medium
EMA European Medicines Agency
FDA Food and Drug Authority
FMEA failure mode and effects analysis
GMR geometric mean ratio
HBSS Hank's balanced salt solution
HCl hydrochloride
HEPES 4-(2-hydroxyethyl)-1-piperazineethanesulfonic acid
kDa kiloDalton
KRB Krebs-Ringer-Bicarbonate buffer
LC liquid chromatography
MES 4-morpholine ethane sulfonic acid
MS mass spectrometry
MW molecular weight
NTI narrow therapeutic index
Papp apparent permeability
PD potential difference
P-gp P-glycoprotein
Ph.Eur. European Pharmacopoeia
Rf transsegmental electrical resistance
S solubility
SmPC summary of product characteristics
TEER transepithelial electrical resistance
TIM-1 TNO gastrointestinal model 1
Tmax time point at which the maximum concentration is measured
Chapter 1 | Introduction
8
1. INTRODUCTION: BIOAVAILABILITY, BIOEQUIVALENCE AND BIOWAIVERS
1.1. Regulatory context and definitions
The oral route is the most commonly applied and a preferred route of administration for
medicines. The success of drug candidate selection and development of a pharmaceutical
formulation for oral administration is highly dependent on the characteristics of the compound at
issue. High Throughput Screening (HTS) based on Structure Activity relationship (SAR) analysis may
result in pharmacological leads. The biopharmaceutic characteristics of the compound determine
its intrinsic oral bioavailability and thus its potential administration via the oral route.
The US regulation 21CFR320 (1) as applied by the Food and Drug Agency (FDA) defines
bioavailability as “the rate and extent to which the active ingredient or active moiety is absorbed
from a drug product and becomes available at the site of action. For drug products that are not
intended to be absorbed into the bloodstream, bioavailability may be assessed by measurements
intended to reflect the rate and extent to which the active ingredient or active moiety becomes
available at the site of action.” European Directive 2001/83/EC as amended, does not provide such
explicit definition of the term ‘bioavailability’ (2).
During development of a new product, several dosage forms may be tested and the composition
of the product can change accordingly. In the post-marketing phase, a formulation may be
optimized, e.g. by introducing a new excipient. The bioavailability of the active pharmaceutical
ingredient of the product may change as a result of such changes and a comparative bioavailability
study may be needed to demonstrate that the plasma profiles of the drug are still equivalent i.e.
bioequivalent. Consideration of bioequivalence issues thus plays a role from the early development
of a formulation to the marketed stage. This applies both to the innovators and to generic
products. For generics, demonstration of bioequivalence to the innovator is the key issue at any
time during product development.
In the late 1960s, drug product equivalence issues attracted public interest as doubts arose on the
equivalence of products and their respective innovators. Explicit evaluation of bioequivalence was
first introduced in the US. In the 1970s, the FDA started asking for bioavailability information. A
drug bioequivalence panel was established in the US in 1971 forming the start of current
regulatory guidance on bioequivalence (3).
Abbreviated application procedures were introduced in the 1980s: preclinical and clinical tests
need not be repeated for generic copies of existing approved drugs. In the US this was laid down
Chapter 1 | Introduction
9
in the Hatch-Waxman Act in 1984 (Drug Price Competition and Patent Term Restoration Act ; US
drug regulation since 1962) (4).
Today, a generic medicine must fulfil the following criteria to gain FDA approval:
• contain the same active ingredient as the originator medicine (inactive ingredients may vary)
• be identical in strength, dosage form, and route of administration
• have the same use indications
• be bioequivalent
• meet the same batch requirements for identity, strength, purity, and quality
• be manufactured under the same strict standards of FDA's good manufacturing practice
regulations required for originator products (5).
The FDA works according to 21CFR320.1 which states that “Bioequivalence means the absence of a
significant difference in the rate and extent to which the active ingredient or active moiety in
pharmaceutical equivalents or pharmaceutical alternatives becomes available at the site of drug
action when administered at the same molar dose under similar conditions in an appropriately
designed study.” (1) The FDA publishes an overview of ‘Approved Drug Products with Therapeutic
Equivalence Evaluations’ also known as the ‘Orange Book’ (6).
In Europe, regulatory arrangements to control market access of (generic) drugs developed in
parallel. Directive 65/65/EEC was the first European law on the registration of medicinal products
by the national competent authorities. Its amendments by Directive 87/21/EEC described an
“abridged application procedure” for a “medicinal product [that] is essentially similar to a product
which has been authorised within the Community, in accordance with Community provisions in
force, for not less than six years and is marketed in the Member State for which the application is
made […]. In such a case, “the applicant shall not be required to provide the results of
pharmacological and toxicological tests or the results of clinical trials…”
A formal definition of a generic product was introduced in the EU legislation only in 2004 (Directive
2004/27 amending 2001/83): “generic medicinal product” shall mean a medicinal product which
has the same qualitative and quantitative composition in active substances and the same
pharmaceutical form as the reference medicinal product, and whose bioequivalence with the
reference medicinal product has been demonstrated by appropriate bioavailability studies. The
different salts, esters, ethers, isomers, mixtures of isomers, complexes or derivatives of an active
substance shall be considered to be the same active substance, unless they differ significantly in
properties with regard to safety and/or efficacy. In such cases, additional information providing
proof of the safety and/or efficacy of the various salts, esters or derivatives of an authorised active
Chapter 1 | Introduction
10
substance must be supplied by the applicant. The various immediate-release oral pharmaceutical
forms shall be considered to be one and the same pharmaceutical form. Bioavailability studies
need not be required of the applicant if he can demonstrate that the generic medicinal product
meets the relevant criteria as defined in the appropriate detailed guidelines (2).
Current European bioequivalence guidance defines “two medicinal products containing the same
active substance as bioequivalent if they are pharmaceutically equivalent or pharmaceutical
alternatives and their bioavailabilities (rate and extent) after administration in the same molar dose
lie within acceptable predefined limits. These limits are set to ensure comparable in vivo
performance, i.e. similarity in terms of safety and efficacy”(7). So, although the work definitions are
not identical in the two regions, similar principles apply in practice.
Bioequivalence of oral dosage forms with systemic action
For solid oral dosage forms of an active substance with systemic action, both EU and US guidance
describe how the plasma-concentration versus time curve can be used as surrogate for efficacy and
safety studies. In vivo bioequivalence studies based on this principle are the gold standard for
demonstration of bioequivalence. During such studies, healthy volunteers receive the test and
reference product in a cross-over design and the blood plasma levels of the API are measured for
statistical comparison of the relevant pharmacokinetic parameters. The area under the curve (AUC)
and maximum plasma concentration Cmax are the main pharmacokinetic parameters at issue.
Detailed regulatory guidance on the conduct and evaluation of bioequivalence studies of oral drug
products is given in documents published by the regulatory authorities (7, 8).
According to EMA and FDA guidance, in vivo bioequivalence studies may be waived if an
assumption of equivalence in in vivo performance can be justified by satisfactory in vitro data. A
so-called BCS-based biowaiver approach is meant to reduce in vivo bioequivalence studies and
may represent a surrogate for in vivo bioequivalence (7).
The introduction of the concept of ‘generic’ medicinal products in US and EU laws led to reduction
of the need for clinical and non-clinical trials involving test animals and human subjects, thereby
improving drug legislation from an ethical point of view. The biowaiver approach offers even more
reduction of human testing.
From an economic and social perspective these subsequent options in the regulatory system
facilitated market access and consequential availability of affordable (generally cheaper than the
innovator) generic medicines. Generic pharmaceutical industry, of course, confirms these

Chapter 1 | Introduction
11
advantages e.g. on websites like http://www.egagenerics.com and http://www.gphaonline.org.
However, the actual generic market is complicated by patent laws, national health systems and
reimbursement policies and last but not least, by the individual patient or consumer. The patient
may perhaps be convinced of the regulatory equivalence of generics with the innovator. However,
he or she is generally less happy with insurance companies translating this equivalence directly to
mandatory interchangeability/substitutability of generics and brand name drugs.
1.2. Scientific context
When developing a formulation that is bioequivalent to the reference product, the goal is to
achieve the same systemic availability as this reference product. The systemic availability (Fsys) of an
active compound is determined by the product of the fraction absorbed (Fa), the fraction
metabolized (Fm) and the hepatic clearance (Fh). Assuming minor metabolism in the gut, and a
constant hepatic clearance independent of the formulation, the main parameter to manipulate is
the fraction absorbed. In cases of relevant metabolism during gastrointestinal residence, this
aspect should of course also be taken into account (9). Both the API’s characteristics as well as the
formulation’s characteristics will influence the fraction absorbed.
API characteristics and bioavailability
Many systems to assess and classify relevant API characteristics exist. For example, partition
coefficients like the octanol-water partition coefficient (logP) have a long history of use in relation
to predictions on hydrophilicity and lipophilicity (10). From the 1990s on, other systematic
approaches to characterize compounds were developed. Lipinski’s rule of five as published in 1997
aimed at facilitating drug candidate selection in early development by combining experimental
and computational data to predict the bioavailability of a compound. It predicts that poor
absorption or permeation is more likely when there are more than 5 H-bond donors, 10 H-bond
acceptors, the molecular weight is greater than 500 and the calculated LogP (CLogP) is greater
than 5 (11). The review as compiled by Bergström et al. lists additional and alternative
physicochemical profiling tools that are currently used to characterize the API in preclinical
development (12). The authors also identify several aspects that may be improved including
development of adequate in silico models, miniaturized methods and optimization of the in vivo
relevance of available tools for additional characterization of APIs.
Chapter 1 | Introduction
12
A system well-known in current regulatory context is the Biopharmaceutics Classification System
(BCS) as introduced by Amidon et al. in 1995 in the context of drug formulation development. The
BCS classifies active substances according to their solubility and permeability, based on the applied
dose. It also aims at correlating in vitro dissolution to in vivo bioavailability (13).
The BCS simplified the concepts of biopharmaceutic thinking while offering possibilities of risk-
based approaches to bioequivalence testing. Formulations including APIs for which the risk of
bioinequivalence is considered unlikely to depend on any other mechanism than the release of the
API from the dosage form, could now be exempted from the obligation to perform a comparative
bioequivalence study (BCS based biowaiver). A positive comparative dissolution test is deemed
sufficient.
Wu and Benet proposed a modified BCS in 2005: the Biopharmaceutic Drug Disposition
Classification System (BDDCS), which categorizes drug substances using the major route of drug
elimination or the extent of drug metabolism. The cut-off value for “extensive metabolism” was
originally set at 50% but it was later recommended to apply 90% as a cut-off value for regulatory
waivers of in vivo bioequivalence studies (14, 15). In 2013, Benet described how the BCS and
BDDCS co-exist each with their own function. “The purpose of BCS is to characterize drugs for
which products of those drugs may be eligible for a biowaiver of in vivo bioequivalence studies.
The purpose of BDDCS is to predict drug disposition and potential drug-drug interactions in the
intestine and the liver, and potentially the kidney and brain.” Both systems apply regulatory
definitions of solubility to differentiate between high and low solubility drugs. The definitions of
permeability differ: the BCS focuses on extent of intestinal absorption and the BDDCS uses the
permeability rate and relates it to the extent of metabolism (16). Current regulatory biowaiver
guidance offers the option to exempt from in vivo testing for immediate release products
containing an API with a high fraction of dose absorbed (optionally determined taking into account
the extent of metabolism). Values of 85% (EMA) or 90% (FDA) are used as cut-off value to
differentiate between high and low extent of absorption.
Formulation and excipient effects
Formulation effects
The planned performance of the formulation can be summarized in a quality target product profile
(QTPP). The most suitable formulation starts by the characteristics of the API. In addition to the
substance-based BCS or BDDCS, aspects like particle size and polymorphic form as well as
potential interactions with excipients should be taken into account.
Chapter 1 | Introduction
13
Pharmaceutical industries have developed aids for (pre-)formulation development decisions using
BCS and/or other classification strategies as starting point (17-20). The review published within the
IMI financed Orbito project describes some of these current strategies (12). With the new quality
paradigm (ICH Q8-9-10) early involvement of pre-formulation specialists in development of the
final formulation becomes more common and explicit (21).
Here again, the research on technical formulation strategies in early development and the
discussion from a regulatory viewpoint need to be distinguished. Butler and Dressman proposed
the developability classification system (DCS) in 2010 (22). They presented this system in a more
regulatory context with reference to Quality by Design concepts and the offer of a scientific
framework for discussion with regulators as to the risk of bioinequivalence.
In parallel, discussions on the concept of a drug product Manufacturing Classification System (MCS)
are ongoing. As stated in the program of an event in September 2014: The MCS is intended as a
tool for pharmaceutical scientists to rank the feasibility of different processing routes for the
manufacture of oral solid dosage forms, based on selected properties of the Active Pharmaceutical
Ingredient (API) and the needs of the formulation. The proposed MCS could be used to develop a
risk assessment for manufacturing based on “ideal” ranges for API physical properties and
therefore indicate how robust a manufacturing process is likely to be in relation to those properties
(23).
Excipients
Excipients are relevant for the performance of the drug product in many ways. Technically, their use
should lead to the foreseen product characteristics. Chemically, incompatibilities of selected
excipients with the active ingredient are to be avoided (24). From a biopharmaceutic viewpoint,
excipients may play a relevant role in the absorption of the active ingredient from the formulation
(25, 26) and excipients may also exert physiological effects that change the pharmacokinetics of
the API.
First, drug release from the dosage form may be affected. A physical effect on the stability of the
polymorphic form or the effective surface are of the API may influence solubility of the API (27-29),
while the dissolution rate of the active substance can be affected by disintegrants or wetting
agents (30). An effect on stomach physiology can then lead to increased residence time using
floating agents or bioadhesion or to delayed gastric emptying (31-34).

Chapter 1 | Introduction
14
Modulation of GI fluids is possible by affecting pH of the gastrointestinal tract (35) or a change in
the composition of the matrix in which the drug is transported e.g. through an effect on bile or
mucus production. Examples of this last option have not been identified so far.
Enzymatic metabolism and physical stability determine the fraction of the dose that is available for
absorption. It can be affected by excipients like nonionic surfactants and polymers (36-43) while
intestinal enzymatic or chemical degradation processes could be prevented by protecting agents
(44-46). Changes to GI transit and motility affect the available time for absorption: increased
intestinal motility by osmotic agents like mannitol and xylitol as well as lactulose (47-51) was
shown to reduce the transit times, while oleic acids and lipids have the potential to delay the
transit times (52-54).
Several physical and physiological mechanisms have been described in relation to modulation of
membrane transport through transcellular and paracellular transport routes. Agents like mucolytica
or surfactants may non-specifically damage the intestinal mucosa. (55-57) Physically reduced
microparticles or nanoparticles have shown to enhance bioavailability of heparin while lipid
complex formation may also improve heparin’s membrane transport; the paracellular or
transcellular route depended on the applied technique (58). The paracellular route can be
modulated through opening of the tight junctions; numerous potential modulators have been
investigated with this purpose (59, 60). The influence of excipients on transporter-mediated
absorption has lately been reviewed by Grube and Langguth and by Goole et al. (61, 62). Finally,
Guan et al. described complexation of bergenin with phospholipid which was postulated to be
transported across enterocytes by both passive diffusion and active transport by receptor-
mediated endocytosis (63).
The interplay of individual effects of the API itself and excipients, their potential interactions and
the characteristics of the final formulation resulting from the manufacturing process, will define the
final bioavailability of the API. Consequently, many mechanisms by which an excipient may affect
the bioavailability of an API are conceivable. The clinical relevance of each of these possibilities
depends on the specific substances, their combinations and physiological context at issue.
Generally, there is a lack of human pharmacokinetic data to evaluate this relevance. A public,
systematic approach to classify excipient effects is also not available. In this thesis, possibilities to
systematically improve our excipient understanding with regard to their potential effect on the
absorption of the active pharmaceutical ingredient will be further discussed.

Chapter 1 | Introduction
15
Models as a surrogate for in vivo bioavailability and bioequivalence testing
Excipient effects on bioavailability are best shown by in vivo bioavailability studies in humans.
Knowledge of these excipient effects is especially relevant in the context of comparative studies:
formulation A versus formulation B containing different excipients. In many situations, comparative
bioavailability studies are needed for new formulations to demonstrate equivalence.
Understanding of intended or unintended effects of excipients on the pharmacokinetics of a drug
substance is particularly interesting from the perspective of waiving in vivo bioequivalence (BE)
studies for oral immediate release dosage forms with systemic action.
Current EU Guidance states that BE studies for oral solutions of multisource drug products may be
waived. However, a BE study should be conducted if the excipients in the dosage forms involved
affect gastrointestinal transit (e.g. sorbitol, mannitol, etc.), absorption (e.g. surfactants or excipients
that may affect transport proteins), in vivo solubility (e.g. co-solvents) or in vivo stability of the
active substance, unless the differences in the amounts of these excipients can be adequately
justified by reference to other data (7).
A BCS-based biowaiver may be considered for BCS class I and III (in the EU) drug compounds. As a
general rule, for both BCS class I and III drug substances, well-established excipients in usual
amounts should be employed and possible interactions affecting drug bioavailability and/or
solubility characteristics should be considered and discussed. A description of the function of the
excipients is required with a justification whether the amount of each excipient is within the normal
range.
To study the effects of excipients on the bioavailability the pharmaceutical industry and academia
apply different techniques, each with their own limitations. In vitro dissolution testing as a model
for in vivo bioavailability of orally administered products was first introduced in the 1960’s (64).
Yet, both in EU and US specific research projects acknowledge that a lot is still unknown or can be
improved. An FDA sponsored project in the US plans to publish a white paper on in vivo predictive
dissolution testing (IPD) (65, 66). IPD is regarded as a product development tool to be applied as a
basis for but not necessarily as an alternative to QC dissolution testing (67, 68).
At the same time, an EU project (see http://www.imi.europa.eu/content/orbito) aims at
streamlining and optimizing the development of orally administered drug products with a strong
focus to develop novel experimental and theoretical models to increase our knowledge of
biopharmaceutical factors and their interplay with the dynamic gastrointestinal physiology (69).
In the context of this OrBiTo project, in vitro models for drug absorption testing were reviewed by
Kostewicz et al., (70) whereas alternative in vivo models were discussed by Sjögren et al. (26).
Chapter 1 | Introduction
16
Kostewicz et al. describe how the biorelevance of the applied models remains a continuously
developing study area. In addition, the in vitro models themselves are evolving with the
development of new formulation techniques. The authors identified the need to improve the
accessibility of the available ‘toolbox’ to facilitate useful application of the available models.
Sjögren et al. mention how current understanding of the human GI tract and its effects on the
absorption processes of an API from an oral dosage form still has its limitations, which limits the
use of in vitro models as reliable alternative.
The drug regulatory field could benefit from improvement of the use of such models. Indeed,
adequately validated models might be used as a surrogate for an in vivo bioavailability or
bioequivalence tests in humans.The current regulatory biowaiver guidance limits itself to the first
step in the GI absorption of the API from an immediate release solid oral dosage form: drug
release tested using an in vitro dissolution model (1, 2, 7).
Animal models are commonly applied by pharmaceutical industry to test differences in drug
release from pharmaceutical formulations. However, in the context of BE questions, these models
do play a limited role: animal models are not approved as models for biowaivers. From a
regulatory perspective, a human volunteer is the only acceptable ‘model’ for comparative
bioavailability testing when biowaiver conditions are not met and in absence of an in vivo in vitro
correlation of the dissolution versus plasma data.
Cell culture models for testing permeability effects are well-known while in vitro digestion models
and enzyme interaction models also exist. However, none of these are approved to confirm
bioequivalence of formulations. The gastrointestinal transit of APIs can be studied using different
in vivo techniques, but comparative in vitro models validated for their biorelevance of this
parameter are not known to the authors either. In conclusion, apart from the dissolution test, there
is no comparative in vitro test model validated and approved for comparative testing of disposition
effects.
The regulatory guidance is limited as to allowed (difference in) levels of excipients: as a general
rule for BCS-class I and III drug substances well-established excipients in usual amounts should be
employed and possible interactions affecting drug bioavailability and/or solubility characteristics
should be excluded. Even in the case of Class I drugs it is advisable to use similar amounts of the
same excipients in the composition of test like in the reference product. If a biowaiver is applied
for a BCS-class III drug substance, excipients have to be qualitatively the same and quantitatively
very similar (7). Effects on disintegration or dissolution could be tested by the pharmacopoeial
models. However, no specific excipient information or other details are given on the evaluation of
any test outcome.

Chapter 1 | Introduction
17
1.3. Practical experience from both scientific and regulatory perspective
Public information on individual bioequivalence studies is scarce. Van der Meersch et al. screened
publications on BE trials in the time period 2005-2008 and concluded that the quality of the
available reports can be improved by inclusion of information on and reference to the applied
guidance and acceptance criteria. The authors plead for increased transparency on such studies
(71). An exploratory literature study [data not shown] indeed confirmed a publication gap in
studies demonstrating bioinequivalence.
Ramirez et al. evaluated the outcome of 124 BE trials with a total of 80 APIs at the same study site
by BCS class (72). Results not meeting the bioequivalence criteria were available for all BCS classes:
35 failed with respect to Cmax and for 15 the AUC did not comply. For BCS class 1 about 15% of the
trials failed; non-BE was always due to a difference in Cmax. A similar percentage (14%) of BCS
class III failed on Cmax and 9% on AUC. BCS class II compound failed in 50% of the cases on Cmax
and in 25% on AUC. Eight BCS class IV products were tested of which 8% failed on Cmax. These
results were comparable to those presented by Lamouche et al. (73).
Cristofoletti and Dressman showed the ratio of failed bioequivalence trials per BCS class as
deduced from 500 BE studies in the database of the Brazilian regulatory authorities (74). The
relative risk of obtaining a non-BE result was about four times lower for drugs in classes 1 and 3 of
BCS or BDDCS when compared with class 2 drugs. All three publications concluded that the
outcome of a bioequivalence study seems to be strongly influenced by the solubility of the drug.
Cristofolleti and Dressman note that solubility seems to outweigh any effect of the extent of
intestinal permeability or extent of metabolism.
On the other hand, Butler deduced from their results that dissolution testing alone can be
biopredictive only for BCS class II compounds as these are the only class for which dissolution is
the most relevant rate limiting factor(64). The biorelevance of the in vitro dissolution test
conditions will determine the probability of actually detecting bioinequivalence by an in-vitro test.
Indeed, Ramirez et al noted how QC dissolution methods, although not developed for this
purpose, were often not sufficiently biopredictive (72). More specifically, BCS class II compound
ibuprofen has been under discussion as the usual comparative biowaiver dissolution tests seemed
not to be biopredictive (75, 76). With this case in mind, Tsume et al. presented a sub-classification
of the BCS, based on the pKa of the API (acid, base and neutral) for classes II and IV which would
facilitate the selection of biorelevant dissolution conditions (68).
Nair et al. reported the BCS class of generic drugs approved by FDA in 2001-2011 (77). They
concluded that the majority of the generics for which the BCS class could be confirmed, concerned
Chapter 1 | Introduction
18
BCS class I (42%), followed by BCS class 3 (37%) and BCS class 2 (21%). A list of common
deficiencies in applications based on biowaivers was provided. Although the number of biowaivers
granted was not stated, the authors hoped to promote application of the biowaiver concept, which
suggests a limited number of dossiers including a biowaiver during that decade. In Europe, a
limited application of the biowaiver approach was also suggested by the EMA Concept paper on
BCS based biowaiver (78).
In 2015, the Global Bioequivalence Harmonisation Initiative was started by the European
Federation for Pharmaceutical Sciences (EUFEPS) with the aim of reaching a global harmonized
approach in bioequivalence guidance. At the conference in March, it was recognized that joint
efforts from industry and regulators are needed to improve the application of the biowaiver
concept. In May of this same year, the FDA published an updated draft guidance on the “Waiver of
In Vivo Bioavailability and Bioequivalence Studies for Immediate-Release Solid Oral Dosage Forms
Based on a Biopharmaceutics Classification System”. This version is more aligned with the EMA
guidance with regard to the new possibility of biowaivers for BCS class 3 substances and the pH
range to be applied for biowaiver purposes. In addition, the criteria for high permeability and high
solubility were adjusted.
1.4. Aims and outline of this thesis
This thesis will evaluate the regulatory conditions biowaivers from a risk-based perspective. It has
the aim to contribute to a better understanding of the biowaiver concept and to support public
health by identifying ways of expanding the application of the biowaiver concept.
As outlined in the introduction above, risk analysis in biowaiver context can be addressed from
different perspectives, including scientific and regulatory perspective. The Biothree project
originated from a regulatory question: how to improve the application of the biowaiver concept.
Scientifically, the project was aligned with the Orbito project. First, the regulatory conditions were
studied into more detail from a scientific perspective, in order to identify potential regulatory gaps
and possibilities for extension of the biowaiver approach. Subsequently, specific studies focused on
potential excipient effects with the aim to expand possibilities for biowaivers in case of differences
in excipient content between test and reference product.
Chapter 2 | Materials and methods
19
2. MATERIALS AND METHODS
2.1. Evaluation of the regulatory context
The regulatory guidance was evaluated in two steps. First, a review of regulatory biowaiver
guidance in the US, EU and WHO was performed from a risk-based perspective. Then the effect of
deviating regulatory guidance on application of the biowaiver concept was studied based on a
recently introduced difference in definition of “Dose”.
2.2. Study of potential excipient effects
The potential effect of differences in excipient content between test and reference product was
evaluated based on two case studies. A new, top-down approach, using the data of approved
products was applied to lactose.
A more traditional bottom-up approach was applied to the potential excipient chitosan
hydrochloride. An in vivo study was performed to study the actual effect of this substance on the
bioavailability of the model API acyclovir. The results of this study were compared to the outcome
of in vitro and animal model data.
For detailed information on applied methods and materials, reference is made to the individual
sections.
Chapter 3 | Results
20
3. RESULTS
This chapter describes the results as obtained from the studies of various aspects of the biowaiver
approach. The topics are presented as a cumulative overview of the five related publications. The
subsections will cover the following topics:
Evaluation of regulatory guidance:
1. Evaluation of regulatory biowaiver guidance from a risk-based perspective:
• Risk analysis in bioequivalence and biowaiver decisions
2. Effect of deviating regulatory definitions on biowaiver application:
• The impact of the EMA change in definition of “dose” on the BCS dose/solubility ratio: a
review of the biowaiver monographs
Potential excipient effects:
3. A top-down approach - database research:
• Novel insights into excipient effects on the biopharmaceutics of APIs from different BCS
classes: lactose in solid oral dosage forms
4. A bottom-up approach - an in vivo study:
• The influence of chitosan on the oral bioavailability of acyclovir: a comparative
bioavailability study in humans
5. A bottom-up approach - in vitro and animal studies
• The effect of chitosan on the bioaccessibility and intestinal permeability of acyclovir
Sections 3.1 to 3.4 are in line with the published manuscripts; section 3.5 represents the manuscript
in preparation for publication. Adaptations are limited to those needed to fit the format of this
thesis.
Chapter 3 | Results
21
3.1. Risk analysis in bioequivalence and biowaiver decisions
Based on:
Kubbinga M, Langguth P, Barends D. Risk analysis in bioequivalence and biowaiver decisions. Biopharm Drug
Dispos. 2013;34(5):254-61.
Abstract
This article evaluates the current biowaiver guidance documents published by FDA, EU and WHO
from a risk based perspective. The authors introduce the use of a Failure Mode and Effect Analysis
(FMEA) risk calculation tool to show that current regulatory documents implicitly limit the risk for
bioinequivalence after granting a biowaiver by reduction of the incidence, improving the detection,
and limiting the severity of any unforeseen bioinequivalent product. In addition, the authors use
the risk calculation to expose yet unexplored options for future extension of comparative in vitro
tools for biowaivers.
Introduction
The risk of therapeutic inequivalence of two immediate release products can never be reduced to
zero, even if a full clinical study would be performed. The conclusion of comparative clinical
studies, in vivo bioequivalence studies, in vitro equivalence tests and biowaivers is based on
statistics and scientific data that are assumed to be representative for the products at issue.
The aim of biowaiver guidance is to reduce the risk of bioinequivalence to an acceptable level.
Pharmaceutical development work aims at reducing the probability of manufacturing inequivalent
formulations taking into account the critical aspects of the product at issue. In this context, the
absorption phase is regarded as the critical process determining the equivalence of the
pharmacokinetic profiles and thereby the therapeutic equivalence of the test and reference
product (13, 79).
The characteristics of the API (Biopharmaceutical Classification System, BCS, class, physicochemical
characteristics) affect the probability of incidence of bioinequivalence by affecting solubility,
dissolution and permeability. BCS classification combined with available data on bioequivalence
studies of a certain drug may be used to consider the risk for bioinequivalence of two products.
The International Pharmaceutical Federation (FIP) applies this principle in its biowaiver

Chapter 3 | Results
22
monographs (80). Note that studies failing to show bioequivalence may not always or perhaps not
usually be published. Therefore, publicly available data should be interpreted with caution, as these
may be an underestimation of the actual experience with bioinequivalence. Literature evidence also
illustrates how excipients may affect the fraction of dose absorbed by modulating disintegration,
solubilization or stabilizing a specific polymorphic form thereby changing the dissolution
characteristics of the API (81-83). And, although permeability modulators are not common in
marketed oral drug products, these have been described in literature as well (61, 84).Furthermore,
the stability and thus the accessibility of an active substance in the gastrointestinal tract could be
changed by specific formulations such as nanopharmaceutic dosage forms or by addition of
carboxymethyl-starch excipients and enzyme inhibitors to the formulation (44, 45). The transit time
of the active pharmaceutical ingredient (API) in the gastrointestinal (GI) tract also influences its
availability for absorption; it can be reduced by excipients such as sorbitol and polyethylene glycol
(85, 86).
It is evident that modulation of the above-mentioned parameters can affect the fraction of dose
absorbed and/or the rate of absorption and thereby increase the risk for bioinequivalence. In this
paper four potential causes for bioinequivalence are identified, based on the pharmacokinetic
profile of the API: dissolution of the API from the formulation (1), absorption of the API from the GI
tract (2), bioaccessibility of the API for absorption (3) and transit time of the API in the
gastrointestinal tract (4). In the context of bioequivalence studies, the physiological conditions are
considered constant and the pharmacokinetic parameters metabolism and elimination of the API
are considered to be independent on the formulation.
This article introduces well-known risk calculation equations in the context of biowaiving.
Biowaiver guidance documents published by FDA, EU and WHO will be evaluated from a risk based
perspective and yet unexplored options for future extension of comparative in vitro tools will be
exposed.
Chapter 3 | Results
23
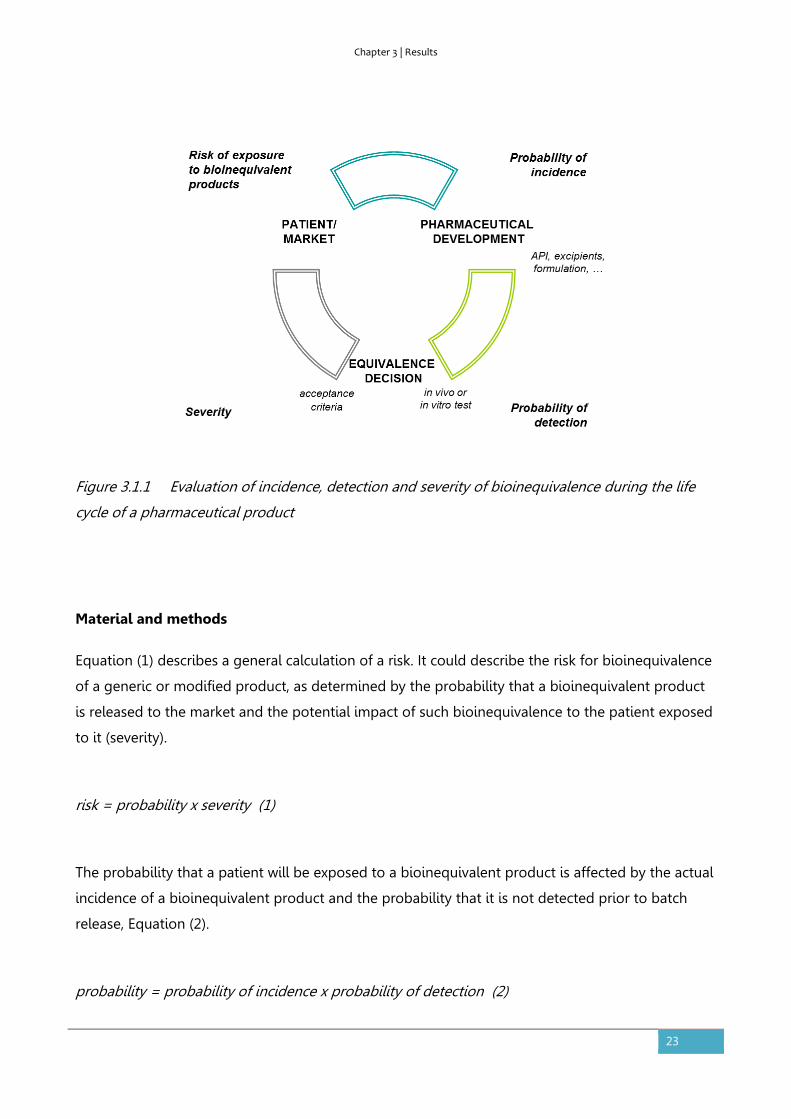
Figure 3.1.1 Evaluation of incidence, detection and severity of bioinequivalence during the life
cycle of a pharmaceutical product
Material and methods
Equation (1) describes a general calculation of a risk. It could describe the risk for bioinequivalence
of a generic or modified product, as determined by the probability that a bioinequivalent product
is released to the market and the potential impact of such bioinequivalence to the patient exposed
to it (severity).
risk = probability x severity (1)
The probability that a patient will be exposed to a bioinequivalent product is affected by the actual
incidence of a bioinequivalent product and the probability that it is not detected prior to batch
release, Equation (2).
probability = probability of incidence x probability of detection (2)
Chapter 3 | Results
24
The incidence describes the probability of producing a product that really is bioinequivalent to the
comparator. The probability of detection is a measure for the ability to detect (and reject) the
bioinequivalent products prior to marketing: the higher the probability of detection, the lower the
factor to be included in the risk equation.
Equations (1) and (2) can be combined to Equation (3), which is a well-known equation used to
calculate a risk priority number (RPN) in Failure Mode and Effects Analysis (FMEA) (87, 88).
risk = probability of incidence x probability of detection x severity (3)
Severity refers to the potential impact of exposure of a patient to a bioinequivalent product, or the
risk to public health. In this paper, Equation (3) will be used in a qualitative way. The probability of
incidence and detection and severity will be ranked as ‘high’ or ‘low’ without numerical calculation
of RPNs.
Results
Figure 3.1.1 shows the relation between incidence, detection and severity and the risk that a
patient is exposed to a bioinequivalent product. The guidelines aim at limiting this risk to an
acceptable level. Gupta et al. reviewed the available guidance in 2006 (89). Table 3.1.1 summarizes
the conditions laid down by the current (updated) guidance documents as published by FDA, EMA
and WHO (7, 90, 91). The considerations, as laid down in the guidance documents, will be
interpreted by the authors in the context of the FMEA calculation: incidence, detection and severity.
For the sake of clarity of the exercise, the Japanese guidance will not be reviewed into detail as
Japan does not accept biowaivers for generic applications.
Chapter 3 | Results
25
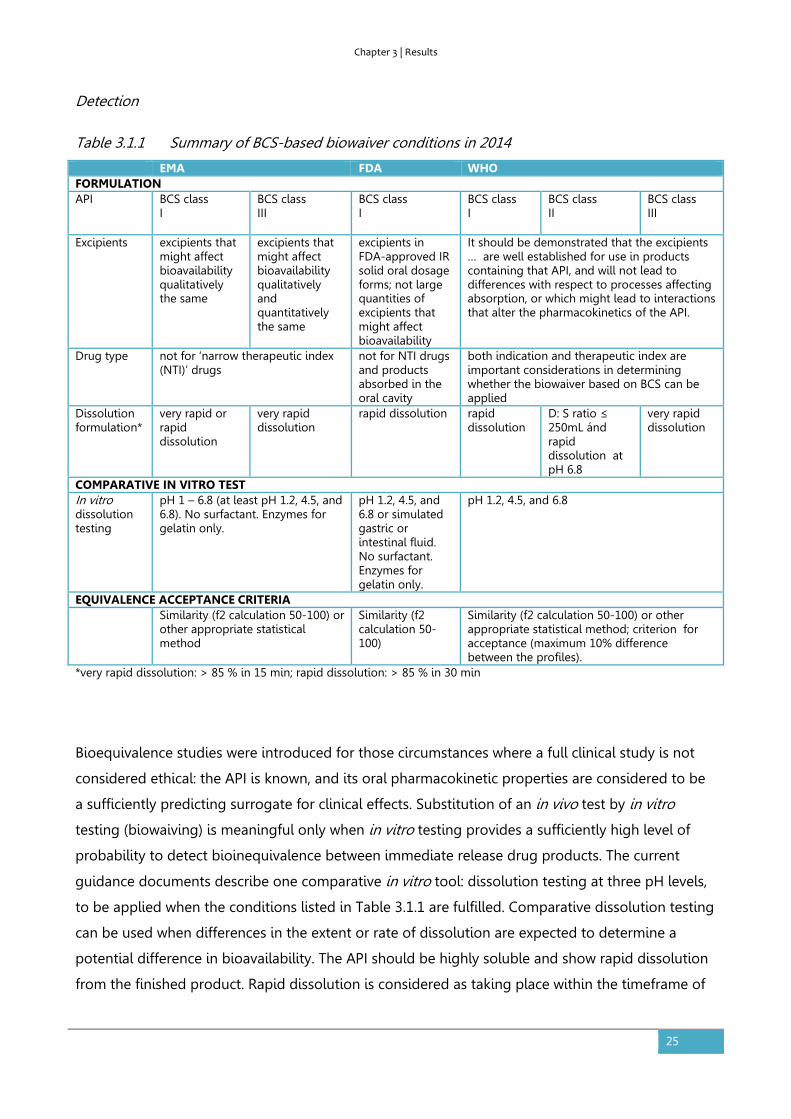
Detection
Table 3.1.1 Summary of BCS-based biowaiver conditions in 2014
EMA FDA WHO FORMULATION API BCS class
I BCS class III
BCS class I
BCS class I
BCS class II
BCS class III
Excipients excipients that might affect bioavailability qualitatively the same
excipients that might affect bioavailability qualitatively and quantitatively the same
excipients in FDA-approved IR solid oral dosage forms; not large quantities of excipients that might affect bioavailability
It should be demonstrated that the excipients … are well established for use in products containing that API, and will not lead to differences with respect to processes affecting absorption, or which might lead to interactions that alter the pharmacokinetics of the API.
Drug type not for ‘narrow therapeutic index (NTI)’ drugs
not for NTI drugs and products absorbed in the oral cavity
both indication and therapeutic index are important considerations in determining whether the biowaiver based on BCS can be applied
Dissolution formulation*
very rapid or rapid dissolution
very rapid dissolution
rapid dissolution rapid dissolution
D: S ratio ≤ 250mL ánd rapid dissolution at pH 6.8
very rapid dissolution
COMPARATIVE IN VITRO TEST In vitro dissolution testing
pH 1 – 6.8 (at least pH 1.2, 4.5, and 6.8). No surfactant. Enzymes for gelatin only.
pH 1.2, 4.5, and 6.8 or simulated gastric or intestinal fluid. No surfactant. Enzymes for gelatin only.
pH 1.2, 4.5, and 6.8
EQUIVALENCE ACCEPTANCE CRITERIA Similarity (f2 calculation 50-100) or
other appropriate statistical method
Similarity (f2 calculation 50-100)
Similarity (f2 calculation 50-100) or other appropriate statistical method; criterion for acceptance (maximum 10% difference between the profiles).
*very rapid dissolution: > 85 % in 15 min; rapid dissolution: > 85 % in 30 min
Bioequivalence studies were introduced for those circumstances where a full clinical study is not
considered ethical: the API is known, and its oral pharmacokinetic properties are considered to be
a sufficiently predicting surrogate for clinical effects. Substitution of an in vivo test by in vitro
testing (biowaiving) is meaningful only when in vitro testing provides a sufficiently high level of
probability to detect bioinequivalence between immediate release drug products. The current
guidance documents describe one comparative in vitro tool: dissolution testing at three pH levels,
to be applied when the conditions listed in Table 3.1.1 are fulfilled. Comparative dissolution testing
can be used when differences in the extent or rate of dissolution are expected to determine a
potential difference in bioavailability. The API should be highly soluble and show rapid dissolution
from the finished product. Rapid dissolution is considered as taking place within the timeframe of

Chapter 3 | Results
26
gastric emptying. In addition, the excipients present should not be expected to have an effect on
the bioavailability of the API via mechanisms other than dissolution or disintegration.
Incidence
Appropriate pharmaceutical development should limit the actual incidence (or occurrence) of
bioinequivalent products; in vivo bioequivalence testing will not reduce it. Restrictions posed by
the guidelines do however limit the incidence of bioinequivalent products that get access to
biowaiving. All guidelines agree that BCS class I APIs are open for biowaivers; BCS class III
substances are considered by EMA and WHO guidance as well. Products containing API’s with low
solubility are considered to have a higher risk of being bioinequivalent and dissolution testing may
not be sufficiently discriminating. BCS class II and IV compounds are therefore not open for
applying for a biowaiver according the EMA and FDA. Only WHO considers biowaivers for BCS class
II compounds with specific characteristics.
Severity
The safety of biowaiving is evaluated based on the therapeutic consequences of a potential
difference in bioavailability. Acceptance criteria define the accepted difference between two
dissolution profiles and thus indirectly limit the severity of a potential difference. For example, the
severity of any occurring and undetected bioinequivalence of two narrow therapeutic index (NTI)
drugs is ranked higher than that of other drugs and the dissolution test and limits are not to be
applied for such products.
Table 3.1.2. Exemplary test and reference formulations
Composition (mg) Reference Test
API 10.0 10.0 Mannitol 50.0 60.0
Croscarmellose sodium 5.0 12.0 Microcrystalline cellulose 15.5 10.0
Magnesium stearate 2.5 3.5 f2> 50; rapid dissolution
Application of the risk calculation
We first consider the situation for highly soluble drugs. Table 3.1.2 contains a theoretical reference
product and test product which have the same qualitative composition but a different quantitative
composition.

Chapter 3 | Results
27
When the API is of BCS class I, say propranolol, a biowaiver could be acceptable based on the
guideline of the EMA, FDA and WHO, if appropriately justified. Assuming that mannitol is present
in a quantity from which no effect on the bioavailability of propranolol is expected, the risk
calculation would then result in low incidence (BCS class I, rapid dissolution, acceptable excipients)
× high detection (dissolution testing possible) × low severity (not NTI) = OK. The overview of
available FIP biowaiver monographs confirms that, for the APIs categorized as BCS class I, indeed a
positive biowaiver recommendation was given (92).
If the API is of BCS class III, say acyclovir, the biowaiver is less straightforward. From the FDA side,
the biowaiver will not be accepted due to the BCS classification. From the WHO and EMA
perspective, the discussion would probably focus on the presence of mannitol. Is it expected to
affect bioavailability? If so, a biowaiver would only be acceptable, in the case that all excipients
were qualitatively and quantitatively the same. Alternatively, if it is argued that mannitol is present
in a quantity from which no effect on the bioavailability of acyclovir is expected (as assumed
above), a biowaiver may be considered acceptable. The risk calculation would then be as above
and the discussion would concern the probability of incidence: is it acceptably low? The overview
of the available FIP biowaiver monographs includes several APIs classified as BCS class III. For most
of these, the authors indeed recommended a biowaiver based on literature reviews, except for
those APIs that are narrow therapeutic index drugs.
Lamouche et al. (73) conducted a retrospective analysis on 918 bioequivalence studies to
determine if the BCS may help predict in vivo bioequivalence (BE) outcome. They showed that BE
failure rate was generally low and similar (~11%) for BCS class I and III compounds. In addition,
solubility appeared to be the most discriminating factor with regards to BE outcome. These data
confirm the approach taken by the EMA and WHO, allowing biowaivers for highly soluble BCS class
I and III compounds, while requiring comparative dissolution studies as a surrogate in vitro test.
The situation is different for low soluble drugs. If the API is of BCS class II, a biowaiver could be
considered based on the WHO guidance only. An example of an API of this class could be
ibuprofen. The biowaiver monograph as published by Potthast et al., indeed recommended a
biowaiver for this substance (93). However, according Lamouche et al., highly variable Class II
compounds showed the highest BE failure rate (54%) (73). For ibuprofen, this is supported by
Alvarez et al. who showed how ibuprofen formulations were equivalent in vitro but did not meet
bioequivalence criteria in vivo (76). On the other hand, Shohin et al. showed that approved
ibuprofen tablets may show inequivalent dissolution profiles pointing to a situation that the quality
control dissolution method used for ibuprofen tablets may indeed not be biopredictive, as has
been pointed out in a recent paper by Tsume et al. (75, 94). If a biowaiver for a BCS class II

Chapter 3 | Results
28
compound is considered, additional factors such as physical characteristics of the API, excipients
and formulation aspects should thus be critically evaluated and the biopredictive power of the
applied dissolution media should be reconsidered. In line with these findings, the EMA and FDA
consider the potential effects of excipients and formulation on the in vivo pharmacokinetics as
insufficiently covered by a dissolution test. Translating these aspects to the FMEA calculation, the
probability of detection is the risk factor of note for these APIs.
A biowaiver for an API of BCS class IV would not be accepted by any of the guidelines. The
potential effects of excipients on the in vivo solubility and dissolution of the API from the
formulation as well as potential effects on the absorption, accessibility and transit time are
considered too complex to allow for a biowaiver approach. The risk of bioinequivalence, when
applying the dissolution test only, is considered too high. A low probability of detection thus leads
to an unacceptably high outcome of the risk calculation. It is of note that Lamouche et al. showed a
surprisingly low failure rate (10%) for Class IV compounds when tested in in vivo bioequivalence
studies. (73) This does not necessarily mean that the assumptions of the guideline are not correct,
as their conclusion was not discussed in relation to dissolution data. Furthermore, adequate and
perhaps relatively intensive product development studies could reduce the risk for a
bioinequivalence of a product containing a BCS class IV API.
Regardless of the BCS classification, all guidelines exclude narrow therapeutic index drugs from
biowaiving. The severity of undetected bioequivalence would be higher. In addition, in vitro testing
is not considered sufficiently sensitive to detect bioinequivalence for narrow therapeutic index
drugs and consequentially, narrow therapeutic index drugs are excluded from the option of a
biowaiver. Translating this to the risk calculation means that the probability of detection of
bioinequivalence of narrow therapeutic index drugs is considered too low with the currently
available dissolution test ánd the severity of undetected bioequivalence is considered too high,
both factors leading to an unacceptably high risk.
Discussion
A complete waiver for an in vivo (clinical or bioequivalence) study can be granted when a suitable
in vitro alternative or surrogate test is available to allow detection of a bioinequivalent formulation.
Currently only dissolution testing is described as surrogate test. The incidence of a bioinequivalent
formulation after granting a biowaiver is limited by defining criteria for API and excipients as well
as dissolution of the formulation. The severity of a ‘passing’ bioinequivalent formulation is limited
Chapter 3 | Results
29
by exclusion of narrow therapeutic index drugs from the option of a biowaiver and setting
appropriate acceptance criteria.
Extending the options for biowaiving may be of interest both from ethical and economic point of
view (95). The authors identified several factors that could be improved in order to facilitate
application of the biowaiver concept.
The bioequivalence guidelines are based on the assumption that the risk of bioinequivalence is
related to the BCS classification of the active substance. To check the validity of this assumption,
one would have to consider a sufficiently large but random sample of bioequivalence studies
including products of all four BCS classes. Such data may be available at pharmaceutical industry or
contract research organizations but reviews in public literature are scarce. Ramirez et al. published
an overview of 124 bioequivalence studies but were not able to define differential characteristics of
each class. The authors took into account the dissolution data obtained using the test dissolution
methodology proposed as quality control, but pharmaceutical products with active substances
from all four BCS classes showed non-BE studies (72). It is noted that not only BCS classification
may be relevant, but also the composition of the formulations compared and the dissolution data
of the formulations in the physiological pH range in addition to those obtained at quality control
conditions. Lamouche et al. presented an overview of data based on 918 studies as discussed
above (73). Publication of more such reviews including relevant supporting data would increase the
public understanding of the BCS concept in relation to the biowaiver approach.
BCS classification involves testing of solubility and permeability and the outcome may differ
depending on the conditions and calculations applied. In addition, the definition of dose used for
determination of the BCS classification is ambivalent; maximum dose strength (FDA) and maximum
administered single dose (EMA and WHO) are both applied. A generally accepted database on BCS
classification of APIs does not exist. This thus introduces an uncertainty factor in this classification
and in the risk evaluation. A public database and consensus on BCS classification would also
facilitate review of available bioequivalence data and allow improved understanding of the system
in the context of biowaivers.
The effect of excipients is strictly limited by the guidance documents: qualitative differences in
excipients from which an effect on the bioavailability could be expected, are not accepted whereas
scientific reasoning may justify larger and still safe deviations. In the above example, replacing
mannitol by lactose in one of the formulations would probably not be of relevance for the
bioavailability of the API. There is, however, no generally accepted source to which applicants may
refer in this respect: development of a ‘safe list’ of excipients would be helpful. The inactive
Chapter 3 | Results
30
ingredient database as published by the FDA could perhaps serve as a basis, preferably combined
with information on the levels of excipients in combination with specific API’s (96).
So, the application of biowaivers may be facilitated by the set-up of generally accepted databases
based on public scientific data. The eligibility of substances and formulations for biowaivers may
thus be clarified and the risk for bioinequivalence will be clarified through better understanding of
the probability of incidence.
The probability of detection of bioinequivalence is currently only linked to dissolution testing at
three pHs. This method could be improved e.g. for BCS class II APIs. It could also be considered to
fine-tune the acceptance criteria. For example, the Japanese guideline adapts the criteria for f2
based on the average dissolution of the reference product: values of 42, 46 and 53 are used as
differentiated acceptance criteria in relation to demonstration of similarity of dissolution curves of
oral conventional release dosage forms (97). Publication of method details for approved products
would facilitate application for specific API’s as suggested earlier (95, 98).
The probability of detection of bioinequivalence due to factors other than solubility and
dissolution is currently not covered by the guidelines. For example, the risk for bioequivalence due
to effect of excipients on permeability is currently limited by restrictions on the difference in
excipients between test and reference product. The development of a comparative in vitro
permeability test could support a biowaiver for those products for which a potential difference in
bioavailability may be based on a difference in permeability. Especially BCS class III substances may
profit from this, as these have high solubility and low fraction of dose absorbed due to a low
permeability.
Other factors for which a surrogate in vitro test may be envisaged are the stability and thus the
accessibility of an active substance in the gastrointestinal tract and the transit time effects. In vitro
models could be developed to compare the transit time, in vivo degradation and bioaccessibility of
test and reference formulations. Existing models may be optimized for this purpose (99-101). The
introduction of such comparative models could allow more flexibility with regard to excipient use
while limiting the probability of bioinequivalence at an acceptable level and allowing a biowaiver
based on in vitro testing.
To reduce the severity of an incorrectly applied biowaiver, narrow therapeutic index drugs are
excluded. However, the guidelines do not give a clear definition of a narrow therapeutic index
drug, leaving room for individual discussion. According to the EMA, it is not possible to define a
set of criteria to categorize drugs as narrow therapeutic index drugs and it must be decided case
by case. This seems helpful from a scientific point of view and at the same time it may restrict the

Chapter 3 | Results
31
number of biowaivers in case a drug is categorized as narrow therapeutic index drug but in vitro
dissolution testing would be sufficient. It may be possible to develop a biopredictive in vitro test
with appropriate (tighter) acceptance criteria for narrow therapeutic index drugs as well.
Conclusion
Several authors pointed out that relaxing the biowaiver guidelines, introduction of additional
comparative test methods, global harmonization and publication of requirements may facilitate the
availability of reliable and affordable (generic) medicines (89, 95, 102). The aim of biowaiver
guidance is to reduce the risk of bioinequivalence due to an incorrect biowaiver decision to an
acceptable level. Using the FMEA risk calculation approach, the authors showed how clarification of
regulatory classifications and definitions could facilitate applications for a biowaiver while still
consciously controlling the risk of bioinequivalence based on scientific data. In addition, new
options for surrogate in vitro testing are open for further investigations, offering possibilities for
yet unexplored areas of potential biowaivers. Validation of such models against in vivo testing will
show which of the options will be of practical value for biowaiving.
Chapter 3 | Results
32
3.2. The impact of the EMA change in definition of “dose” on the BCS
dose/solubility ratio: a review of the biowaiver monographs
Based on:
Sediq A, Kubbinga M, Langguth P, Dressman J. The impact of the EMA change in definition of "dose" on the
BCS dose-solubility ratio: a review of the biowaiver monographs. J Pharm Sci. 2014;103(1):65-70.
The authors A.S. and M.K. both equally contributed to this work.
Abstract
The Biopharmaceutics Classification System (BCS) defines the solubility characteristics of an active
pharmaceutical substance based on its Dose-Solubility ratio: for highly soluble drugs, this ratio is
less than 250ml over a defined pH-range. Prior to the revision of the EMA guideline in 2010, the
“Dose” in this ratio was consistently defined by the FDA, the EMA (formerly EMEA) and the WHO
biowaiver guidelines as the highest dosage strength. However, in the revised EMA guideline the
Dose is defined as the highest single dose administered according to the Summary of Product
Characteristics. The new EMA criterion for highly soluble may be closer to the actual conditions of
use, but it is not in line with the Dose that would be used in the in vivo bioequivalence study. This
paper evaluates the impact on the BCS classification of the APIs of the published biowaiver
monographs and discusses the consequences of the possible change in classification on biowaiver
recommendations. Using the current definition of Dose by the EMA, the biowaiver
recommendations for metoclopramide hydrochloride and verapamil hydrochloride are no longer
valid according to EMA criteria. For prednisolone and prednisone, a re-evaluation of the biowaiver
recommendation, taking into account usual dosing levels, seems appropriate.
Introduction
Since the introduction of the Biopharmaceutics Classification System (BCS) (13), most regulatory
authorities have started to apply this system for bioequivalence (BE) guidance. The BCS is based on
two important processes for the absorption of a drug substance, namely its solubility and hence
ease of dissolution in the upper gastrointestinal (GI) tract and its permeation through the
membrane wall. The BCS classifies the characteristics of these processes by categorizing these
parameters as high or low. The various regulatory authorities have somewhat different criteria for
categorizing the solubility and permeability. The solubility of an active pharmaceutical ingredient
Chapter 3 | Results
33
(API) is in all cases defined by calculating the Dose-Solubility ratio (D/S) expressed by volume (ml),
i.e. the volume sufficient to dissolve the Dose, but the Dose and the range of conditions over which
the solubility is determined may differ from jurisdiction to jurisdiction.
An important application of BCS in the regulatory documents is the use of BCS in the guidances for
biowaiver procedures. One of the most important criteria for deciding whether a BCS-based
biowaiver is appropriate is the BCS class of the API. For instance, products containing BCS class IV
APIs are excluded from the BCS-based biowaiver procedure. Additionally, products containing class
III APIs cannot, as of this writing, be approved in the USA by the biowaiver procedure. In the EU
and countries using the WHO criteria, products containing Class III APIs are only eligible for
biowaiving if they are very rapidly dissolving. Class II APIs are only eligible for the biowaiver
procedure in countries using the WHO criteria and then only in case of a weak acid which is highly
soluble at pH 6.8. By contrast, Class I APIs are eligible for the biowaiver procedure in all
jurisdictions which apply it (Japan, notably, is a country which does not yet allow approval of drug
products using the BCS-based biowaiver procedure). In general, the regulatory authorities consider
an API highly soluble if its D/S-ratio is less than 250ml.
The former European Medicines Agency guideline (EMEA, 2001) and the present FDA (2000)
Guidance define Dose as the highest dosage strength marketed as an oral immediate release (IR)
dosage form, i.e. the tablet or capsule with the highest content of API (8, 103)in. However, the
revised EMA (2010) guideline defines Dose as the highest single oral IR dose recommended for
administration in the Summary of Product characteristics (also known as the Prescribers’
Information) (7). The WHO has a more flexible definition. If the API appears on the WHO Model List
of Essential Medicines (EML), the highest dose recommended in that list is to be applied for D/S-
ratio calculation. For APIs not on the EML, the highest dosage strength available on the market as
an oral solid dosage form is used (104).
Since the BCS classification is an important parameter for biowaiver eligibility, it is important to
unambiguously understand how the D/S ratio is calculated. To demonstrate the differences that
can arise as a result of the differences in definition of Dose, we evaluated its impact on the BCS
classification of the APIs for which biowaiver monographs were published up to 2011. This chapter
identifies changes in BCS classification for this set of APIs and discusses the impact of the change
on the API’s eligibility for the BCS-based biowaiver. The results are also addressed in the context of
patient use and in the framework of other regulations relating to bioequivalence.

Chapter 3 | Results
34
Methods
The impact of the change in definition of D on the D/S ratio and hence the BCS classification was
evaluated for the 27 APIs for which a biowaiver monograph was published up to June 2011. The
highest single dose administered as an immediate release (IR) oral drug product was obtained
from Summaries of Product Characteristics (SmPCs) on the website of the Dutch Medicines
Evaluation Board and Martindale Extra Pharmacopoeia. Where no SmPC was available from the
Dutch Medicines Evaluation Board, the SmPC as published on the company’s website was taken
and compared with the Martindale information. The solubility value S was taken from the
respective biowaiver monographs: to evaluate whether the D/S met the solubility criterion, the
worst-case solubility values were used i.e. the lowest value in the pH range 1 to 6.8, the range
applied by the EMA. With these values for solubility and dose, the ‘new’ worst-case D/S ratios were
calculated for each active substance.
Results and discussion
Figure 3.2.1 summarizes the results for all APIs evaluated. Table 3.2.1 lists the 24 APIs for which the
D/S ratio was recalculated. As the authors of the biowaiver monographs for lamuvidine,
levofloxacin and metronidazole had already taken the different dose definition into the calculation
of D/S into consideration, results for these three APIs are not tabulated.
For acyclovir, atenolol, cimetidine, ciprofloxacin, furosemide, ibuprofen, lamivudine, levofloxacin,
and ranitidine the highest single dose recommended for administration in the SmPC is equal to the
highest dosage strength available, so for these drugs, the BCS classification and hence the
biowaiver recommendation is not altered (93, 105-112). The solubility values for acetaminophen
(paracetamol), chloroquine salts, doxycycline, ethambutol, isoniazid, metronidazole, propranolol,
pyrazinamide and quinidine are all very high. Thus, even though the highest single dose
recommended in the SmPC is higher than the highest dosage strength available, the D/S-ratio is
still beneath 250ml. Therefore, neither the BCS classification nor the biowaiver recommendation is
changed for these APIs (106, 113-120).
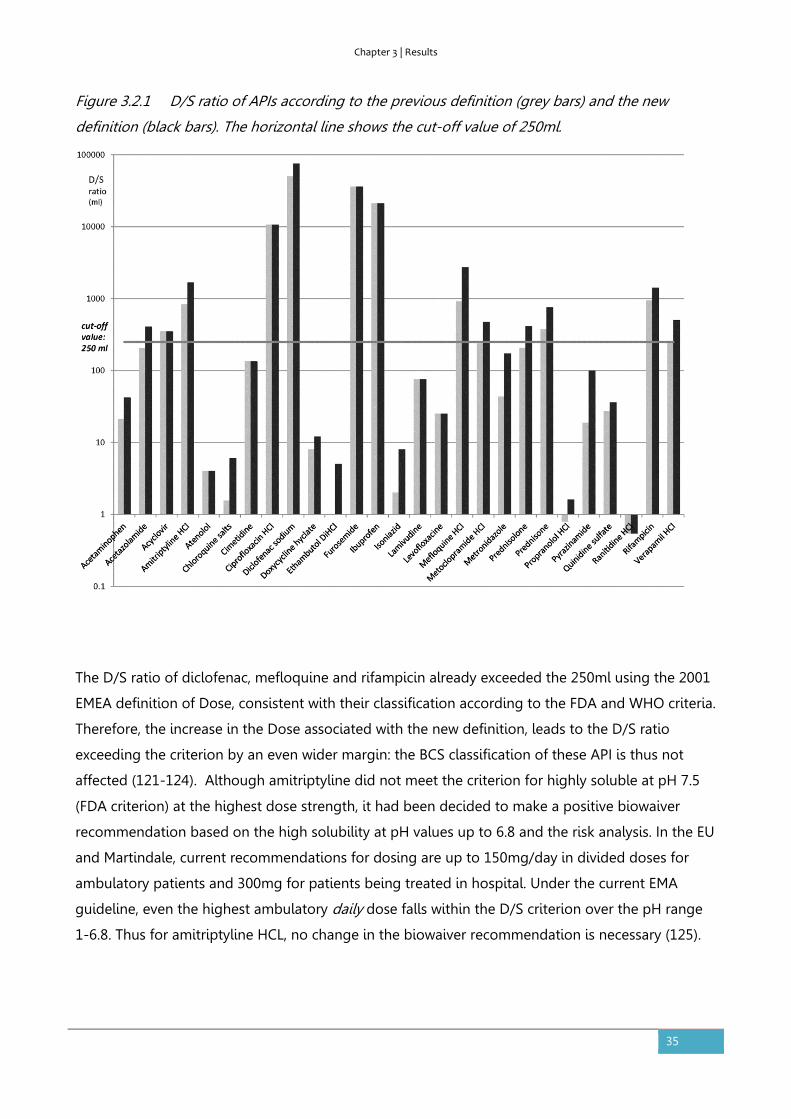
Chapter 3 | Results
35
Figure 3.2.1 D/S ratio of APIs according to the previous definition (grey bars) and the new
definition (black bars). The horizontal line shows the cut-off value of 250ml.
The D/S ratio of diclofenac, mefloquine and rifampicin already exceeded the 250ml using the 2001
EMEA definition of Dose, consistent with their classification according to the FDA and WHO criteria.
Therefore, the increase in the Dose associated with the new definition, leads to the D/S ratio
exceeding the criterion by an even wider margin: the BCS classification of these API is thus not
affected (121-124). Although amitriptyline did not meet the criterion for highly soluble at pH 7.5
(FDA criterion) at the highest dose strength, it had been decided to make a positive biowaiver
recommendation based on the high solubility at pH values up to 6.8 and the risk analysis. In the EU
and Martindale, current recommendations for dosing are up to 150mg/day in divided doses for
ambulatory patients and 300mg for patients being treated in hospital. Under the current EMA
guideline, even the highest ambulatory daily dose falls within the D/S criterion over the pH range
1-6.8. Thus for amitriptyline HCL, no change in the biowaiver recommendation is necessary (125).
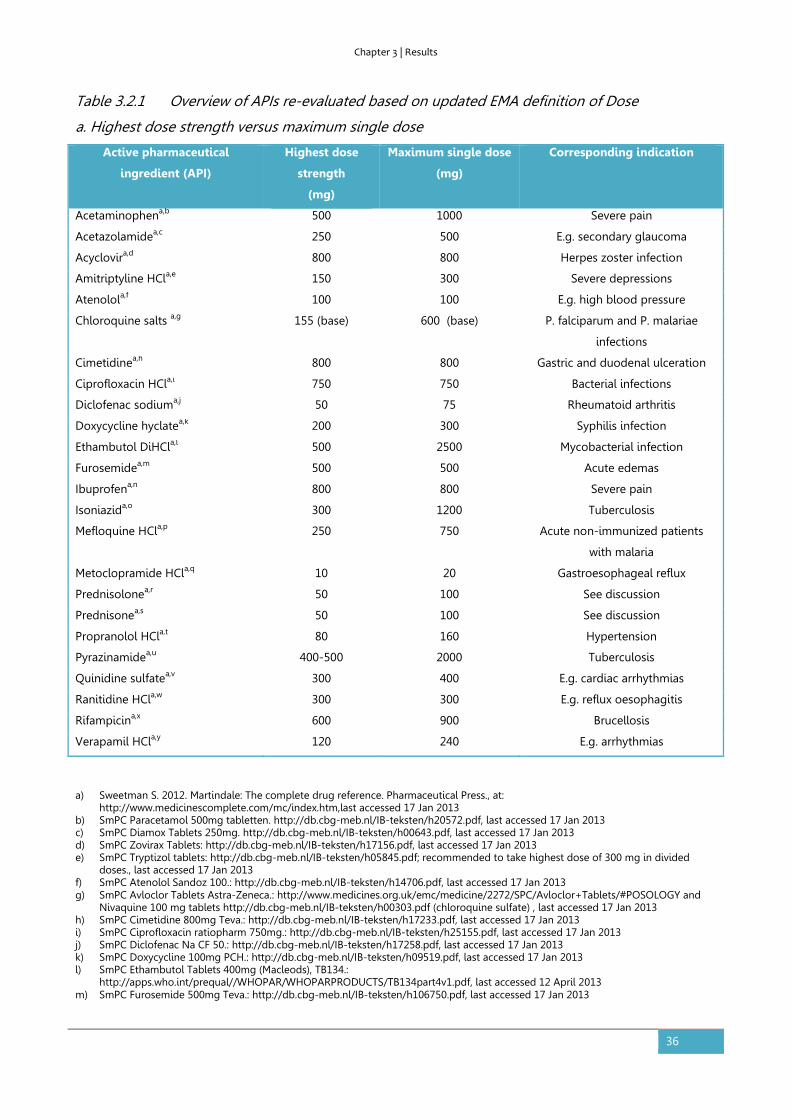
Chapter 3 | Results
36
Table 3.2.1 Overview of APIs re-evaluated based on updated EMA definition of Dose
a. Highest dose strength versus maximum single dose
Active pharmaceutical
ingredient (API)
Highest dose
strength
(mg)
Maximum single dose
(mg)
Corresponding indication
Acetaminophena,b 500 1000 Severe pain
Acetazolamidea,c 250 500 E.g. secondary glaucoma
Acyclovira,d 800 800 Herpes zoster infection
Amitriptyline HCla,e 150 300 Severe depressions
Atenolola,f 100 100 E.g. high blood pressure
Chloroquine salts a,g 155 (base) 600 (base) P. falciparum and P. malariae
infections
Cimetidinea,h 800 800 Gastric and duodenal ulceration
Ciprofloxacin HCla,i 750 750 Bacterial infections
Diclofenac sodiuma,j 50 75 Rheumatoid arthritis
Doxycycline hyclatea,k 200 300 Syphilis infection
Ethambutol DiHCla,l 500 2500 Mycobacterial infection
Furosemidea,m 500 500 Acute edemas
Ibuprofena,n 800 800 Severe pain
Isoniazida,o 300 1200 Tuberculosis
Mefloquine HCla,p 250 750 Acute non-immunized patients
with malaria
Metoclopramide HCla,q 10 20 Gastroesophageal reflux
Prednisolonea,r 50 100 See discussion
Prednisonea,s 50 100 See discussion
Propranolol HCla,t 80 160 Hypertension
Pyrazinamidea,u 400-500 2000 Tuberculosis
Quinidine sulfatea,v 300 400 E.g. cardiac arrhythmias
Ranitidine HCla,w 300 300 E.g. reflux oesophagitis
Rifampicina,x 600 900 Brucellosis
Verapamil HCla,y 120 240 E.g. arrhythmias
a) Sweetman S. 2012. Martindale: The complete drug reference. Pharmaceutical Press., at: http://www.medicinescomplete.com/mc/index.htm,last accessed 17 Jan 2013
b) SmPC Paracetamol 500mg tabletten. http://db.cbg-meb.nl/IB-teksten/h20572.pdf, last accessed 17 Jan 2013 c) SmPC Diamox Tablets 250mg. http://db.cbg-meb.nl/IB-teksten/h00643.pdf, last accessed 17 Jan 2013 d) SmPC Zovirax Tablets: http://db.cbg-meb.nl/IB-teksten/h17156.pdf, last accessed 17 Jan 2013 e) SmPC Tryptizol tablets: http://db.cbg-meb.nl/IB-teksten/h05845.pdf; recommended to take highest dose of 300 mg in divided
doses., last accessed 17 Jan 2013 f) SmPC Atenolol Sandoz 100.: http://db.cbg-meb.nl/IB-teksten/h14706.pdf, last accessed 17 Jan 2013 g) SmPC Avloclor Tablets Astra-Zeneca.: http://www.medicines.org.uk/emc/medicine/2272/SPC/Avloclor+Tablets/#POSOLOGY and
Nivaquine 100 mg tablets http://db.cbg-meb.nl/IB-teksten/h00303.pdf (chloroquine sulfate) , last accessed 17 Jan 2013 h) SmPC Cimetidine 800mg Teva.: http://db.cbg-meb.nl/IB-teksten/h17233.pdf, last accessed 17 Jan 2013 i) SmPC Ciprofloxacin ratiopharm 750mg.: http://db.cbg-meb.nl/IB-teksten/h25155.pdf, last accessed 17 Jan 2013 j) SmPC Diclofenac Na CF 50.: http://db.cbg-meb.nl/IB-teksten/h17258.pdf, last accessed 17 Jan 2013 k) SmPC Doxycycline 100mg PCH.: http://db.cbg-meb.nl/IB-teksten/h09519.pdf, last accessed 17 Jan 2013 l) SmPC Ethambutol Tablets 400mg (Macleods), TB134.:
http://apps.who.int/prequal//WHOPAR/WHOPARPRODUCTS/TB134part4v1.pdf, last accessed 12 April 2013 m) SmPC Furosemide 500mg Teva.: http://db.cbg-meb.nl/IB-teksten/h106750.pdf, last accessed 17 Jan 2013
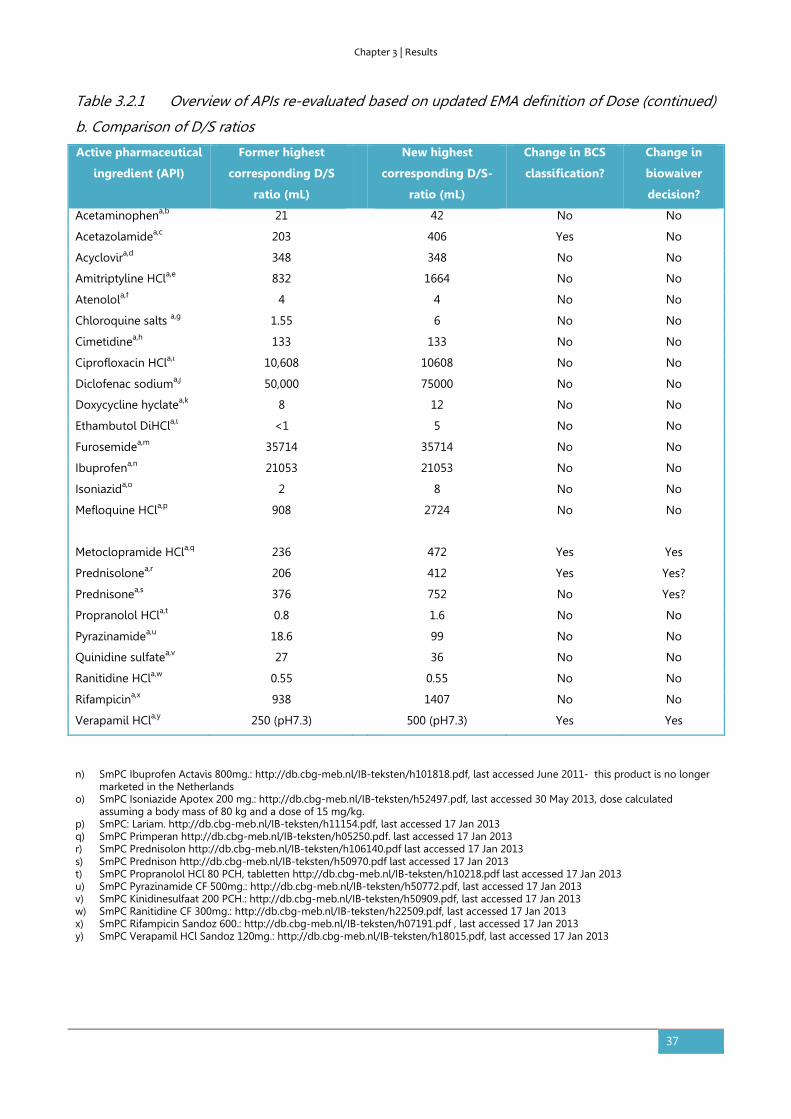
Chapter 3 | Results
37
Table 3.2.1 Overview of APIs re-evaluated based on updated EMA definition of Dose (continued)
b. Comparison of D/S ratios
Active pharmaceutical
ingredient (API)
Former highest
corresponding D/S
ratio (mL)
New highest
corresponding D/S-
ratio (mL)
Change in BCS
classification?
Change in
biowaiver
decision?
Acetaminophena,b 21 42 No No
Acetazolamidea,c 203 406 Yes No
Acyclovira,d 348 348 No No
Amitriptyline HCla,e 832 1664 No No
Atenolola,f 4 4 No No
Chloroquine salts a,g 1.55 6 No No
Cimetidinea,h 133 133 No No
Ciprofloxacin HCla,i 10,608 10608 No No
Diclofenac sodiuma,j 50,000 75000 No No
Doxycycline hyclatea,k 8 12 No No
Ethambutol DiHCla,l <1 5 No No
Furosemidea,m 35714 35714 No No
Ibuprofena,n 21053 21053 No No
Isoniazida,o 2 8 No No
Mefloquine HCla,p
908 2724 No No
Metoclopramide HCla,q 236 472 Yes Yes
Prednisolonea,r 206 412 Yes Yes?
Prednisonea,s 376 752 No Yes?
Propranolol HCla,t 0.8 1.6 No No
Pyrazinamidea,u 18.6 99 No No
Quinidine sulfatea,v 27 36 No No
Ranitidine HCla,w 0.55 0.55 No No
Rifampicina,x 938 1407 No No
Verapamil HCla,y 250 (pH7.3) 500 (pH7.3) Yes Yes
n) SmPC Ibuprofen Actavis 800mg.: http://db.cbg-meb.nl/IB-teksten/h101818.pdf, last accessed June 2011- this product is no longer marketed in the Netherlands
o) SmPC Isoniazide Apotex 200 mg.: http://db.cbg-meb.nl/IB-teksten/h52497.pdf, last accessed 30 May 2013, dose calculated assuming a body mass of 80 kg and a dose of 15 mg/kg.
p) SmPC: Lariam. http://db.cbg-meb.nl/IB-teksten/h11154.pdf, last accessed 17 Jan 2013 q) SmPC Primperan http://db.cbg-meb.nl/IB-teksten/h05250.pdf. last accessed 17 Jan 2013 r) SmPC Prednisolon http://db.cbg-meb.nl/IB-teksten/h106140.pdf last accessed 17 Jan 2013 s) SmPC Prednison http://db.cbg-meb.nl/IB-teksten/h50970.pdf last accessed 17 Jan 2013 t) SmPC Propranolol HCl 80 PCH, tabletten http://db.cbg-meb.nl/IB-teksten/h10218.pdf last accessed 17 Jan 2013 u) SmPC Pyrazinamide CF 500mg.: http://db.cbg-meb.nl/IB-teksten/h50772.pdf, last accessed 17 Jan 2013 v) SmPC Kinidinesulfaat 200 PCH.: http://db.cbg-meb.nl/IB-teksten/h50909.pdf, last accessed 17 Jan 2013 w) SmPC Ranitidine CF 300mg.: http://db.cbg-meb.nl/IB-teksten/h22509.pdf, last accessed 17 Jan 2013 x) SmPC Rifampicin Sandoz 600.: http://db.cbg-meb.nl/IB-teksten/h07191.pdf , last accessed 17 Jan 2013 y) SmPC Verapamil HCl Sandoz 120mg.: http://db.cbg-meb.nl/IB-teksten/h18015.pdf, last accessed 17 Jan 2013
Chapter 3 | Results
38
For the 22 APIs considered above, the new definition of D/S by the EMA has thus no impact on the
BCS classification or biowaiver recommendation for the API at all. The five remaining APIs require
some additional discussion.
For acetazolamide the BCS classification is affected, as indicated in Table 3.2.1, but the biowaiver
decision is not. The highest administered dose of acetazolamide is twice the highest dose strength.
This leads to a shift in the classification of acetazolamide to from highly soluble to not highly
soluble i.e. Class I/III to Class II/IV. Because of uncertainty about the permeability and dissolution
data, the authors of the biowaiver monograph came to the conclusion that acetazolamide was not
a good candidate for the biowaiver procedure (126). Application of the EMA 2010 criterion for D/S
would underscore this decision.
At the highest dosage strength for metoclopramide hydrochloride, 10mg, the D/S is 236ml. The
maximum single dose recommended in the SmPC, 20 mg, leads to a “new” D/S of 472ml,
considerably higher than the cut-off value of 250 ml. According to the EMA guideline,
metoclopramide would be reclassified as a class IV drug and therefore would not be eligible for a
biowaiver in European jurisdictions (127).
Similarly, while the highest dosage strength for verapamil hydrochloride, 120 mg, leads to a
D/S≈250ml, the highest recommended single dose is 240 mg, leading to a D/S≈500ml. Thus,
verapamil, like metoclopramide, would no longer be eligible for a biowaiver according to the EMA
guideline (106).
For prednisolone, the daily dose can vary over a large range: according to Martindale usual oral
doses range from 2.5 to 60 mg daily in divided doses, as a single daily dose after breakfast, or as a
double dose on alternate days. The maximum dosage strength commercially available in Europe
was 50mg according to the biowaiver monograph. At 100 mg, which would be an unusually high
dose, the D/S ratio exceeds the cut-off of 250ml, formally rendering it ineligible for a biowaiver,
even though it is “highly soluble” over the usual, lower dose range. The situation is similar for
prednisone, noting that it is less soluble than prednisolone and thus at the same dose, will have a
less favorable D/S ratio. Strictly adhering to the D/S ratio and considering a maximum single dose
of about 100 mg, the 250ml threshold is exceeded and prednisone would formally fail to qualify for
a BCS-based biowaiver.
In the biowaiver monographs (123, 128), it had been argued that the higher doses may not be the
most clinically relevant ones to apply to the D/S ratio calculation, noting that when these APIs are
given at the higher doses, these are often split up over the day rather than being given as a single
Chapter 3 | Results
39
dose. Basing the calculation on the more commonly applied lower doses would keep the option of
biowaiving open for prednisolone and perhaps also for prednisone.
So, the BCS classification of four of the 27 APIs considered was changed when the current EMA
definition of Dose was applied. The biowaiver recommendations for two of these are no longer
valid according to EMA criteria, one remains negative. For the fourth one, prednisolone, a re-
evaluation of the biowaiver recommendation seems appropriate, which may be considered for
related API prednisone as well. More recent biowaiver monographs that already took account of
the current EMA guideline, identified quinine sulfate as an additional API for which BCS
classification may depend on the regional requirements (129). These examples illustrate the
relevance of a case-by-case review of biowaivers, especially for substances with borderline
solubility characteristics.
It is of note that the new definition of Dose in the EMA regulatory guideline for biowaiving is based
on the “worst-case” situation that might occur in clinical practice. The examples show that, quite
often, the the maximum single dose recommended for administration is twice as high (or more)
than the highest dose strength available on the market. At the highest administered single dose,
there will be the greatest level of challenge for the entire dose to be dissolved in the fluids
available. The fluid volume used in the BCS calculation is based on fasted state administration.
Depending on the recommendation for conditions of administration, this may also be a “worst-
case” situation, since when the drug product is administered with or after a meal, volumes available
in the stomach will often be considerably higher than the 250 ml used for the calculation. With the
EMA definition, access to biowaiving has thus become more conservative, with the result that APIs
with borderline solubilities may be transferred from BCS class I to class II or from class III to IV,
rendering them ineligible for the biowaiver procedure.
Interestingly, the new definition of Dose is not in line with the dosing requirements for in vivo
bioequivalence studies, as set out in the very same EMA 2010 guideline. In the section of the
guideline addressing in vivo studies, it states that these are generally to be carried out with the
highest dose strength of API commercially available. The overview of comments on the draft
guideline clarifies that this was so decided for feasibility (practical and ethical) reasons, although
the highest administered dose was originally preferred from a scientific point of view (130).
Likewise, in the section dealing with biowaivers for lower doses, it is expected that a
bioequivalence study has been carried out at the highest dosage strength, not at the highest single
dose recommended in the SmPC. Considering that the biowaiver procedure is clearly to be
regarded as a surrogate for an in vivo bioequivalence study, it appears that the different
Chapter 3 | Results
40
recommendations for the dose to be used in different sections of the guideline are somewhat
inconsistent.
The discussion of the deviation of the EMA Dose also raises the question of what is actually the
relevant single dose. As illustrated by the case of prednisolone and prednisone, the situation can
arise that just a few of the indications or a loading dose could require an exceptionally high dose,
whereas for most indications and/or for long term therapy a much lower dose would be
appropriate. To select the appropriate dose for calculation of the D/S ratio, one could take into
account the prevalence of the various indications to assess how frequently the API would be
administered at an exceptionally high single dose level. Another aspect of this risk analysis would
be the environment (ambulatory or hospitalized) in which the indication is usually treated. The
prevalence of the indication combined with an evaluation of the risk of using a bioinequivalent
formulation for that specific indication could be used to define ‘unusual’ and ‘usual’ doses, as
illustrated above.
Of course, the regulatory consequences of such a risk evaluation on a generic application would
need to be taken into account. The bioequivalence guidelines are in principle aimed at obtaining
therapeutic equivalence of reference and test product at all claimed indications, including those
with for which several doses are administered together. If conclusions are made based on a lower
dose, a risk of undetected lack of equivalence for the higher doses will exist. However, the current
EMA guideline, as well as the FDA and WHO guidance documents, already implicitly accept this risk
as negligible since they all recommend that the in vivo bioequivalence study should in general be
conducted at the highest dosage strength, not the highest recommended single dose.
Diverging biowaiver recommendations in the regions do not facilitate the application of biowaivers
by pharmaceutical industry in daily regulatory practice. For this and the foregoing reasons, it seems
that the dose definition used by FDA and the WHO is more straightforward to implement and is
more consistent with the bioequivalence guidelines in general, whose intent after all is to test the
therapeutic equivalence of two given drug products.
Conclusion
The change in definition of the Dose, and hence D/S in the BCS classification calculation by the
EMA has an impact on the BCS-based biowaiver recommendation for four of the 27 APIs examined.
With the change in definition of Dose made by the EMA, the biowaiver recommendations for
metoclopramide and verapamil are no longer valid in European jurisdictions. For prednisolone and

Chapter 3 | Results
41
perhaps also for prednisone, a re-evaluation of the biowaiver recommendation, taking into account
usual dosing levels, would be appropriate.
The new definition of Dose in the EMA regulatory guideline for biowaiving is based on clinical
considerations. However, this definition is not yet applied in other bioequivalence guidelines nor is
it in line with the dose definition for in vivo bioequivalence studies. It would be helpful if the
regulatory authorities would clarify these aspects.

Chapter 3 | Results
42
3.3. Novel insights into excipient effects on the biopharmaceutics of APIs from
different BCS classes: lactose in solid oral dosage forms
Based on:
Kubbinga M, Moghani L, Langguth P. Novel insights into excipient effects on the biopharmaceutics of APIs
from different BCS classes: Lactose in solid oral dosage forms. Eur J Pharm Sci. 2014;61:27-31.
Abstract
Excipients encompass a wide range of properties that are of importance for the resulting drug
product. Regulatory guidelines on biowaivers for immediate release formulations require an in
depth understanding of the biopharmaceutic effects of excipients in order to establish
bioequivalence between two different products carrying the same API based on dissolution tests
alone. This paper describes a new approach in evaluating biopharmaceutic excipient effects.
Actually used quantities of a model excipient, lactose, formulated in combination with APIs from
different BCS classes were evaluated. The results suggest that companies use different (relative)
amounts depending on the characteristics of the API. The probability of bioinequivalence due to a
difference in lactose content between test and reference products was classified as low for BCS
class I APIs and medium for BCS class II and III APIs, whereas a high probability was assigned to the
combination of lactose and BCS class IV APIs. If repeated for other excipients, this retrospective,
top-down approach may lead to a new database and more widespread applications of the
biowaiver approach.
Introduction
Excipients encompass a wide range of properties that are of importance for the resulting drug
product. The properties of the final dosage form, such as bioavailability and stability of the active
pharmaceutical ingredient (API) are highly dependent on the excipients chosen and their
concentrations (24, 25). No longer can excipients be regarded simply as inert or inactive
ingredients and a detailed knowledge of these materials is essential for formulators throughout the
world.
European and US regulatory guidelines on biowaivers for immediate release formulations require
an in-depth understanding of the biopharmaceutic effects of excipients in order to establish
bioequivalence between two different products carrying the same API based on dissolution tests

Chapter 3 | Results
43
alone (7, 8, 103). Figure 3.3.1 summarizes biopharmaceutic processes that may be affected by
excipients. The guidance documents mention some critical excipients like sweeteners or
surfactants. However, many excipients are not mentioned and new mechanisms for potential
interactions are still being discovered (47, 131-138).
Figure 3.3.1: Biopharmaceutic processes that may be modulated by excipients
There is a frequent lack of well-controlled studies regarding modulation of biopharmaceutic drug
properties by excipients. Scientific literature describing the effects observed in laboratories, in vitro
studies, animal studies and mechanistic studies is available (bottom-up approach). However, a
systematic evaluation of these data versus the clinically relevant effects in (approved) medicinal
products is less common and literature data confirming unwanted excipient effects in in vivo
human studies is scarce.
The top-down approach presented in this paper involves retrospective analysis of approved
generic drug products containing different amounts of the same excipient. Lactose was used as a
Chapter 3 | Results
44
model excipient since it is commonly applied and information on its quantitative content is
publicly available from the Summary of Product Characteristics (SmPC). This paper illustrates how
information on the actually applied ranges of an excipient like lactose may be used for improved
biopharmaceutic understanding in pharmaceutical product development.
Methods
Literature
Literature evidence on the potential effects that lactose may have on the bioavailability of active
substances from solid oral dosage forms was collected using Pubmed and Scopus.
Product selection
Immediate release solid oral dosage forms (tablets, film-coated tablets and capsules) containing
lactose and approved after the enforcement of the relevant bioequivalence requirements (January
2002) were selected from the database of the Dutch Medicines Evaluation Board (MEB). From the
resulting lists, a random selection of APIs was made, representing all four BCS classes. The BCS
class was determined using public literature and the database published by TSRL(
www.tsrlinc.com).
Lactose content: data collection
The quantitative amount of lactose per product was obtained from paragraph 2 of the SmPC, as
available on the website of the MEB (www.cbg-meb.nl) in September 2013. The lactose ranges were
then grouped per API, using all available product strengths for all available manufacturing
authorization holders. These data were grouped per BCS class, taking the minimum and maximum
values found.
The differences in lactose content between the generic products and the corresponding innovator
products were determined based on the highest comparable dose strengths. The absolute
difference in lactose content in milligrams and the relative lactose content compared to the
selected dose strength of the API (set as 100%) were calculated. Where differences between the
available dose ranges for the innovator and the generics or between the different ranges of generic
products exist, the highest matching dose strength was used for comparative evaluation.
Chapter 3 | Results
45
Results
Lactose
Lactose is a well-known excipient, widely used as diluent, filler or bulking agent in solid oral
dosage forms. Various grades are available, with different physical properties that allow selection
of the most appropriate grade for a specific formulation (139-142). In view of chemical
interactions, lactose cannot be used in combination with all APIs or excipients (24, 142). Literature
data show potential biopharmaceutic effects of lactose in the field of solubility and dissolution of
APIs (143-147). Effects of lactose on the permeability of an API were not reported when tested, nor
were effects on luminal reactions or transit time of specific APIs reported in literature (148). Lactose
intolerance may cause gastrointestinal and systemic effects and affect an individual patient’s
preference for a specific product (without lactose) (149, 150).
Lactose ranges per BCS class
The database search resulted in 1103 tablets, 1940 film-coated tablets, and 208 capsules
authorized since 2002. A random selection of 13 APIs was made, representing all four BCS classes
and covering 302 generic products. The SmPC of 268 of these products contained quantitative
information on lactose content. Table 3.3.1 summarizes the ranges of lactose per BCS class. The
ranges for the BCS class I and class III APIs overlap almost completely (1-254 and 4-232mg
respectively). The observed values for the BCS class IV APIs are lower: 34-171mg, whereas the
absolute ranges for BCS class II APIs are higher than for the other BCS classes, up to 576mg.

Chapter 3 | Results
46
Table 3.3.1: Quantity of lactose in generic products
BCS class API Nr of groupsa
(nr of products)
Range per API
(mg)
Range per BCS class
(mg)
I Amlodipine 4 (8) 140 -151.60 1 - 254
Bisoprolol 6 (26) 1.26 -136
Enalapril 3 (8) 78 -253.60
II Clozapine 3 (7)b 32.44 -281.62 32 - 576
Loratadine 3 (3) b 62.5 - 75
Nevirapine 3 (3) 168 - 464
Simvastatin 23 (78) 35 -576.24
III Capecitabine 16 (36) 7 - 68.95 4 - 232
Fluconazole 7 (27) b 16.6 -210
Levofloxacin 3 (6) 3.6 -26.54
Losartan 18 (57) 4.5 - 231.6
IV Azathioprine 3 (6)# 34.36 -116 34 - 171
Allopurinol 1 (3) 57 - 171 a Definition of group: Range of strengths with the same product name e.g. the amlodipine Mylan 5 mg and 10 mg tablets
are considered as one group. This number generally corresponds to the number of different manufacturing authorization
holders. b Excluded are 12 clozapine products, 8 loratadine products, 10 fluconazol products and 4 azathioprin products which
were selected but did not mention lactose content in the SmPC.
Comparison of generics and innovator
Table 3.3.2 provides comparative data for the highest comparable dose strength. The maximum
absolute difference of lactose content between the generics and the respective innovators for BCS
class I, II and III ranges from 145 to180mg. The maximum difference for the BCS class IV
compounds is lower: 5-21 mg. Expressed in percentage, the maximum difference is infinite for two
of the three BCS class I substances (the innovators do not contain lactose). The maximum
difference varies from 6-47% for BCS class II APIs and from 52% to infinity for the four BCS class III
APIs considered. The percentage difference for BCS class IV APIs azathioprine and allopurinol is
within the range of 7-14%.
The two last columns of Table 3.3.2 show the relative lactose in percent to that of the dose of the
API: varying from 0 to 1452% in BCS class I products, 84-750% for BCS class II, 0-232% for BCS class
III and 50-148% for BCS class IV.
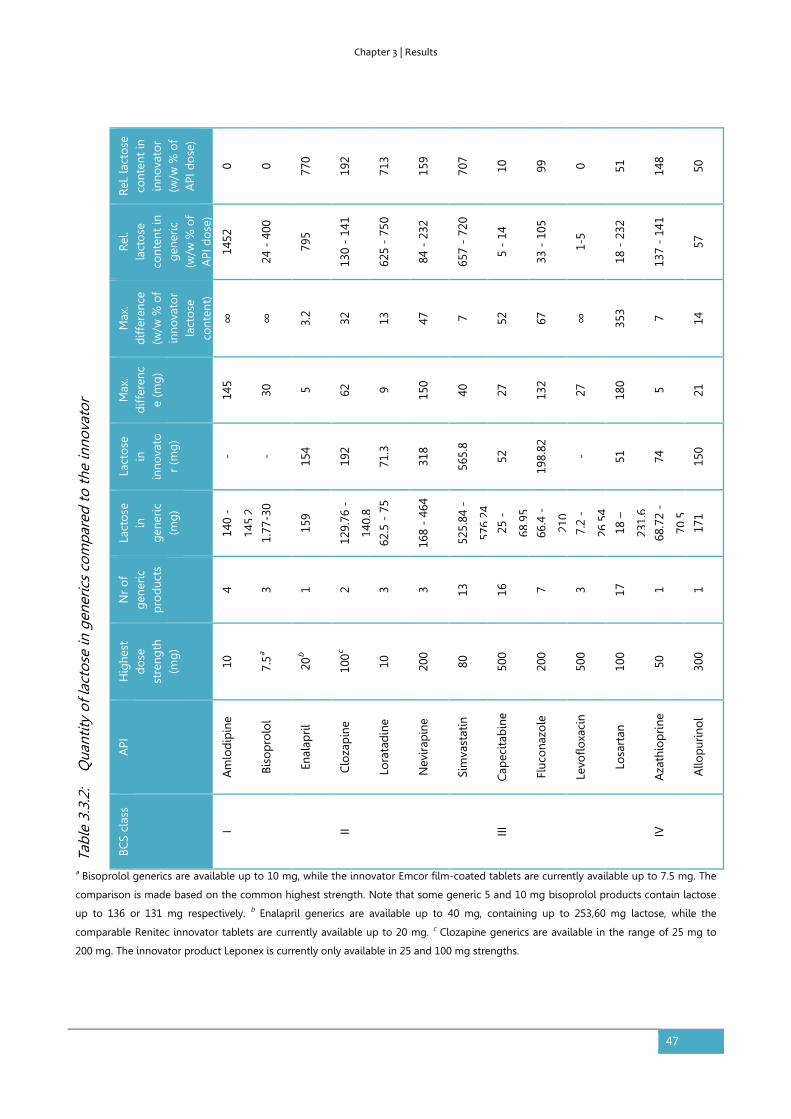
Chapter 3 | Results
47
a Bisoprolol generics are available up to 10 mg, while the innovator Emcor film-coated tablets are currently available up to 7.5 mg. The
comparison is made based on the common highest strength. Note that some generic 5 and 10 mg bisoprolol products contain lactose
up to 136 or 131 mg respectively. b Enalapril generics are available up to 40 mg, containing up to 253,60 mg lactose, while the
comparable Renitec innovator tablets are currently available up to 20 mg. c Clozapine generics are available in the range of 25 mg to
200 mg. The innovator product Leponex is currently only available in 25 and 100 mg strengths.
Tabl
e 3.
3.2:
Q
uant
ity o
f lac
tose
in g
ener
ics
com
pare
d to
the
inno
vato
r
Rel
. lac
tose
co
nten
t in
in
nova
tor
(w/w
% o
f A
PI d
ose
)
0 0 770
192
713
159
707
10
99
0 51
148
50
Rel
. la
cto
se
cont
ent
in
gen
eric
(w
/w %
of
API
do
se)
1452
24 -
400
795
130
- 14
1
625
- 75
0
84 -
232
657
- 72
0
5 -
14
33 -
105
1-5
18 -
232
137
- 14
1
57
Max
. d
iffer
ence
(w
/w %
of
in
nova
tor
la
cto
se
cont
ent)
∞
∞
3.2
32
13
47
7 52
67
∞
353 7 14
Max
. d
iffer
enc
e (m
g)
145
30
5 62
9 150
40
27
132
27
180 5 21
Lact
ose
in
in
nova
tor
(mg
)
- -
154
192
71.3
318
565.
8
52
198.
82
- 51
74
150
Lact
ose
in
g
ener
ic
(mg
)
140
-
145.
2
1.77
-30
159
129.
76 -
140.
8
62.5
- 7
5
168
- 46
4
525.
84 -
576.
24
25 -
68.9
5
66.4
-
210
7.2
-
26.5
4
18 –
231.
6
68.7
2 -
70.5
171
Nr
of
gen
eric
p
rod
ucts
4 3 1 2 3 3 13
16
7 3 17
1 1
Hig
hest
d
ose
st
reng
th
(mg
)
10
7.5a
20b
100c
10
200
80
500
200
500
100
50
300
API
Am
lod
ipin
e
Biso
pro
lol
Enal
apri
l
Clo
zap
ine
Lora
tad
ine
Nev
irap
ine
Sim
vast
atin
Cap
ecit
abin
e
Fluc
ona
zole
Levo
floxa
cin
Losa
rtan
Aza
thio
pri
ne
Allo
pur
ino
l
BCS
clas
s
I II III IV
Chapter 3 | Results
48
Discussion
Lactose as potential bioavailability modulator
Literature data identify lactose as a potential solubility or dissolution modulator. Individual
considerations or preferences for a product without lactose, e.g. due to lactose intolerance, are not
taken into account in the context of (population) bioequivalence questions.
As described earlier, the probability that a patient will be exposed to a bioinequivalent product is
determined by the actual incidence of a bioinequivalent product and the probability that it is not
detected prior to batch release (151). The comparative dissolution test described in regulatory
guidance is suitable to detect the potential effects of lactose identified. Therefore, the probability
of detection of bioinequivalence due to a difference of lactose content is considered high (low
probability number). For lactose, development of additional comparative in vitro test methods
does not appear necessary.
Lactose ranges per BCS class
The observed range of lactose (1 – 576mg) is considered valid as it is well within the maximum
potency values listed for immediate release solid oral dosage forms in FDA’s Inactive Ingredient
Database (35.19 - 1020mg) and the average of the maximum contents of the individual APIs listed
is 212mg compared to 256mg of the relevant products in that database (96).
Lactose is present in products from all BCS classes. The relatively high upper value used with BCS
class II APIs may be due to formulation strategies that aim at aiding the dissolution of the low
solubility of this class, as expected based on literature. Overlapping ranges do not suggest a
difference in formulation strategies for BCS class I and III APIs. For BCS class IV APIs, no difference
compared to the other three classes is identified either.
Comparison of lactose content of generics and innovator
The highest dose strength was used as this strength is generally used in a bioequivalence study.
The relative content of lactose vs. the API is usually the same or very similar for a dose range from
the same manufacturer. Moreover, in case of a dose-dependent effect, the highest strength
represents the worst-case situation.

Chapter 3 | Results
49
The variability and overlap of the absolute and relative differences in lactose content between
generics and innovator suggest limited dependence of the BCS class. The large differences
observed for BCS class I and III APIs suggest a low criticality of any difference in lactose content
between formulations containing APIs from these classes, as expected for highly soluble drugs. The
data for BCS class II and IV APIs show smaller relative differences, which may be due to the
potential effects on the solubility and/or dissolution of the API.
Relative lactose content related to the dose of the API
The relative lactose content in percent compared to that of the dose of the API suggests a
decrease with increasing BCS class. However, the dose strengths of the BCS class I APIs are
relatively low, whereas higher values are e.g. observed for BCS class III APIs. The values thus seem
to largely depend on the absolute value of the dose of the API and confirm absence of a dose-
dependent effect of the excipient.
Probability of bioinequivalence due to lactose per BCS class
Table 3.3.3 summarizes the biopharmaceutic classification of lactose. The probability of
bioinequivalence of an immediate release solid oral dosage form containing a BCS class I API and
lactose is classified as low, due to low occurrence. A change in lactose content of 145 mg or 1452%
did not affect the bioequivalence. Lactose levels up to 254 mg did not show a relevant effect on
bioavailability, irrespective of the lactose content of the innovator and the dose of the API. In case
of larger differences, comparative dissolution studies seem sufficient to support any change.
The probability of bioinequivalence of a formulation containing a BCS class II API and lactose is
classified as medium. The absolute and relative content of lactose with respect to the API were
both found to be quite high. However, the relative difference between generic and innovator
remained at 47% suggesting limited freedom of changes, translated to medium probability of
occurrence of bioinequivalence. Lactose seems to be usable within a range of about X ± 150 mg,
where X denotes the absolute amount of lactose used in the innovator product. Comparative
dissolution studies seem advisable to support any change.
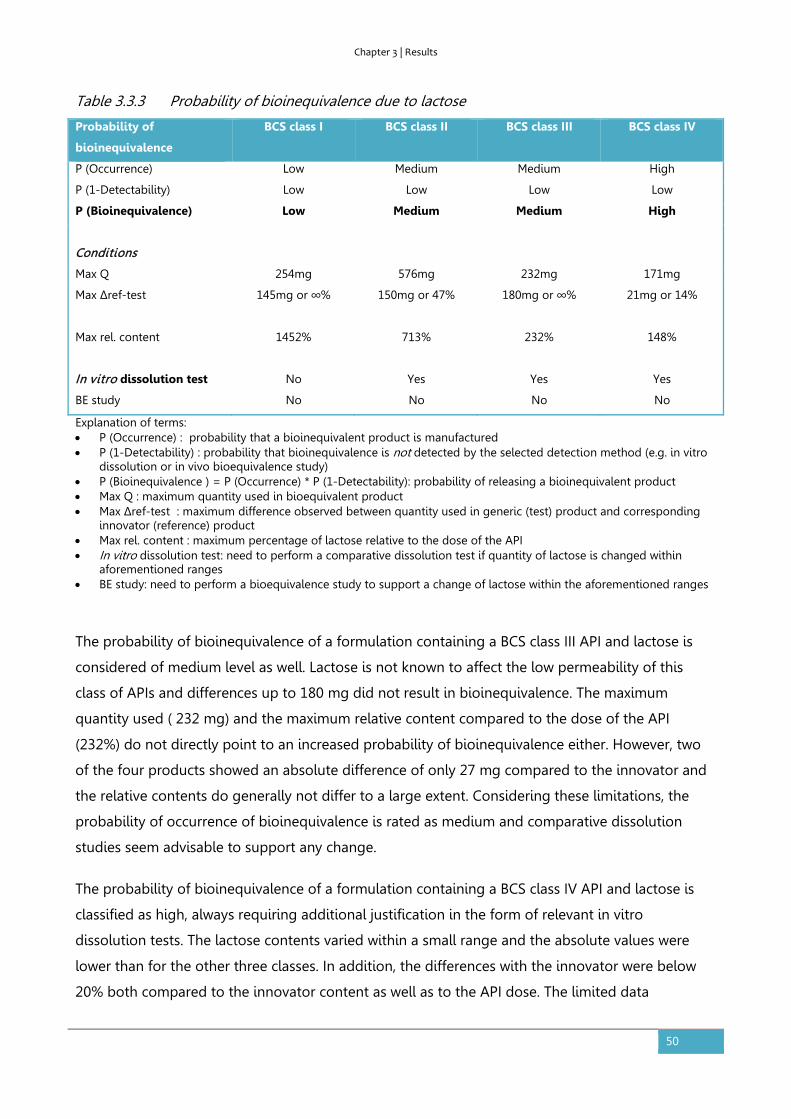
Chapter 3 | Results
50
Table 3.3.3 Probability of bioinequivalence due to lactose
Probability of
bioinequivalence
BCS class I BCS class II BCS class III BCS class IV
P (Occurrence) Low Medium Medium High
P (1-Detectability) Low Low Low Low
P (Bioinequivalence) Low Medium Medium High
Conditions
Max Q 254mg 576mg 232mg 171mg
Max Δref-test 145mg or ∞% 150mg or 47%
180mg or ∞% 21mg or 14%
Max rel. content 1452%
713% 232% 148%
In vitro dissolution test No Yes Yes Yes
BE study No No No No
Explanation of terms: • P (Occurrence) : probability that a bioinequivalent product is manufactured • P (1-Detectability) : probability that bioinequivalence is not detected by the selected detection method (e.g. in vitro
dissolution or in vivo bioequivalence study) • P (Bioinequivalence ) = P (Occurrence) * P (1-Detectability): probability of releasing a bioinequivalent product • Max Q : maximum quantity used in bioequivalent product • Max Δref-test : maximum difference observed between quantity used in generic (test) product and corresponding
innovator (reference) product • Max rel. content : maximum percentage of lactose relative to the dose of the API • In vitro dissolution test: need to perform a comparative dissolution test if quantity of lactose is changed within
aforementioned ranges • BE study: need to perform a bioequivalence study to support a change of lactose within the aforementioned ranges
The probability of bioinequivalence of a formulation containing a BCS class III API and lactose is
considered of medium level as well. Lactose is not known to affect the low permeability of this
class of APIs and differences up to 180 mg did not result in bioinequivalence. The maximum
quantity used ( 232 mg) and the maximum relative content compared to the dose of the API
(232%) do not directly point to an increased probability of bioinequivalence either. However, two
of the four products showed an absolute difference of only 27 mg compared to the innovator and
the relative contents do generally not differ to a large extent. Considering these limitations, the
probability of occurrence of bioinequivalence is rated as medium and comparative dissolution
studies seem advisable to support any change.
The probability of bioinequivalence of a formulation containing a BCS class IV API and lactose is
classified as high, always requiring additional justification in the form of relevant in vitro
dissolution tests. The lactose contents varied within a small range and the absolute values were
lower than for the other three classes. In addition, the differences with the innovator were below
20% both compared to the innovator content as well as to the API dose. The limited data
Chapter 3 | Results
51
considered thus provide insufficient supporting evidence of safety of differences in lactose
between innovator and generic.
Evaluation of the presented methodology
The applied methodology combines knowledge contained in the databases of approved medicinal
products with literature evidence for evaluation of critical biopharmaceutic effect levels of specific
excipients. This data mining is more specific than FDA’s database on inactive ingredients, which
lists levels of excipients for specific routes of administration and dosage forms, but does not
mention the API. It is also of additional value to the FDA Guidance for industry on Scale-Up and
Postapproval Changes (SUPAC) of immediate release solid oral dosage forms, which prescribes
comparative studies depending on the type of excipient and the total drug product weight. E.g. the
difference of 145.2 mg observed for BCS class I APIs exceeds the criterion of 10% tolerable
variation of lactose (as a filler), while there seems to be no added value of a confirmatory
bioequivalence study (152). The approach is of complementary value to FIP’s biowaiver
monographs, which list excipients in multisource drug products with the API at issue, but do not
address specific excipient levels in relation to bioequivalence.
The methodology focuses on the probability of bioinequivalence due to differences in lactose
content between two supposedly bioequivalent products. The risk of bioequivalence was
previously defined as probability × severity (151).The severity of any occurring bioinequivalence
and the assessment of the risk related to a difference in AUC and/or Cmax depends on the
therapeutic characteristics of the API and is to be evaluated case-by-case.
Conclusion
Progress in biowaiver opportunities requires the definition of critical biopharmaceutic excipient
parameters affecting drug bioavailability (including regulatory acceptable preclinical test systems)
and safe levels of excipients in drug products need to be defined. The methodology applied in this
paper could be extrapolated to more products and other excipients, building a database of
biopharmaceutic understanding of excipients. This may lead to more widespread applications of
the biowaiver approach as information on biopharmaceutic role of excipients will increase
formulation opportunities and limit unsuccessful trial-and-error approaches.
Chapter 3 | Results
52
3.4. The influence of chitosan on the oral bioavailability of acyclovir – a
comparative bioavailability study in humans
Based on:
Kubbinga M, Nguyen MA, Staubach P, Teerenstra S, Langguth P. The influence of chitosan on the oral
bioavailability of acyclovir-a comparative bioavailability study in humans. Pharm Res. 2015. Jul;32(7):2241-9.
Abstract
Purpose: The effects of chitosan hydrochloride on the oral absorption of acyclovir in humans were
studied to confirm the absorption enhancing effects reported for in vitro and rat studies,
respectively.
Methods: A controlled, open-label, randomized, 3-phase study was conducted in twelve healthy
human volunteers. Zovirax 200 mg dispersible tablets co-administered with doses of 400 mg and
1000 mg chitosan HCl were compared with Zovirax only.
Results: The expected increased absorption of acyclovir was not observed. On the contrary, mean
area under the plasma concentration-time curve (AUC0-12h) and maximal plasma concentration
(Cmax) decreased following concomitant chitosan intake (1402 versus 1017 and 982.0 ng∙h/ml and
373 versus 208 and 235 ng/ml, respectively). In addition, Tmax increased significantly in presence of
1000 mg of chitosan from 1 to 2 hours.
Conclusions: The results of this study in human volunteers did not confirm an absorption
enhancing effect of chitosan. Reference values were comparable to literature data, whereas
addition of chitosan resulted in significant opposite effects on Cmax, Tmax and AUC. Additional
studies are needed to investigate the cause of the discrepancy. The observed variability and
complex potential interactions may complicate the use of chitosan HCl in oral pharmaceutical
formulations.
Introduction
Permeation enhancement has been a research topic in pharmaceutics for decades. Increasing the
absorption of drugs with low permeability may for instance aid the reduction of the variability in
bioavailability as well as reduce the administered dose of an active substance. Examples of

Chapter 3 | Results
53
absorption modulators are acetylcystein, supposedly acting via reduction of the mucous layer by
disrupting disulfide bridges; surfactants, polymers and chelating agents potentially interfering with
the tight junctions, and substances interfering with absorption or efflux transporters (56, 61, 153).
Chitosan and its derivatives have been described as potential permeability enhancers acting via a
disruptive effect on the tight junctions between the epithelial cells (59, 154-158). Chitosan is a
heteropolysaccharide derived from natural source; characterized by variable molecular weights,
degrees of deacetylation (DD) and salt forms (159).
Acyclovir is a BCS class III substance that is predominantly absorbed via the paracellullar route and
has a low and variable bioavailability of 10-30% (160, 161). Some studies suggest the existence of a
saturable carrier system or a limited absorption window. Most of the drug is renally excreted in
untransformed state (162, 163). Chitosan was shown to increase the in vitro permeability of
acyclovir across Caco-2 monolayers and the absorption of acyclovir in the rat (164-166). In the
absence of clinical studies in humans, the translation of these effects in cell culture and animal
models to humans currently remains unclear. The aim of the study presented here was to test the
effects of chitosan hydrochloride on the oral absorption of acyclovir in human volunteers.
Materials and methods
Materials
Zovirax 200 mg dispersible tablets (GlaxoSmithKline, Austrian license number 1-18043) were used
as reference product. Chitosan hydrochloride (chitosan HCl) of pharmacopoeial quality was
obtained from Heppe Medical, Halle; degree of deacetylation (DD) 93.05%, viscosity 1% in water at
20°C 5.9 mPas, molecular weight (MW) 30-400kDa. It was dispensed into quantities of 400 mg and
1000 mg and labeled by Löwen Apotheke in Hochspeyer, Germany. The powders released by the
Department of Pharmaceutical Technology and Biopharmaceutics of the Johannes Gutenberg
University in Mainz, Germany. Acyclovir reference material was purchased from Fagron. All other
materials were purchased from Sigma Aldrich.
Study design
A controlled, open-label, randomized, 3-phase study was conducted at the Clinical Research Center
of the University Hospital in Mainz, Germany. The clinical trial protocol (EudraCT-Nr. 2010-023882-
22) was approved by both the relevant Ethics Committee (Landesärztekammer Rheinland-Pfalz)
Chapter 3 | Results
54
and the German competent authorities (Bundesinstitut für Arzneimittel und Medizinprodukte,
BfArM) and the study was performed in accordance with the Declaration of Helsinki. Adult, male
and female healthy volunteers were included after a health check based on interview, blood
pressure, blood parameters and ECG. Taking into account the variation coefficients as presented
previously by Vergin et al. in a bioequivalence study with 200 mg acyclovir products and
considering an estimated minimum effect size of 30% as potentially clinically relevant, a number of
twelve volunteers was selected for this exploratory study (167). Participants did not take part in
another clinical study in parallel and did not take part in one within the preceding 90 days. Other
exclusion criteria were: alcohol abuse or medication dependency in anamnesis, known
hypersensitivity to study medication, active liver disease or unexplained increased levels of serum
transaminases, intake of prescription drugs in the last 1-2 months, a recent (90 days) history of
cytomegalovirus or systemic herpes infection(s) or recurrent systemic infections of herpes viruses,
pregnancy and lactation, renal dysfunction. The subjects received Zovirax on the first trial day and
were then randomly assigned to either the sequence 1000mg followed by 400 mg chitosan HCl or
vice versa. This resulted in a 2-treatment (400 vs 1000 mg chitosan HCl), 2-sequence crossover
design with pretreatment by Zovirax. This study design allowed evaluation of the pharmacokinetics
of acyclovir, without potential interference of chitosan. A wash-out phase of 7 days was applied for
each treatment.
Zovirax tablets were used as reference and the same tablets, co-administered with a known
quantity of chitosan HCl were used as test ‘formulations’. All products were dispersed in 100 mL
water and administered with another 150 mL, resulting in a total volume of 250 mL water. Start
concentrations of 1.6 g/L (0.16%) and 4.0 g/L (0.4%) chitosan HCl were thus obtained, in line with
those described in literature (0.1%-0.5%) (164, 165). The maximum chitosan dose was limited to 1
g in view of the practical feasibility of oral intake of the quantity as a single dose and the related
limited relevance of higher quantities as a potential excipient in an actual solid oral dosage form.
Subjects entered the studies fasting for at least 9.5 hours. The first meal was offered 4 hours post-
dose. The medication was administered with a total of 250 mLwater; subjects had access to more
water from 1 hour post-dose on and consumed at least 1.4 L mineral water during the 12 hour trial.
Blood samples were collected prior to administration of the product(s) and at 0.25, 0.5, 0.75, 1, 1.5,
2, 2.5, 3, 4, 6, 8 and 12 hours after dosing. Blood samples were centrifuged for separation of plasma
and stored at -20°C or lower prior to analysis.
Chapter 3 | Results
55
HPLC assay
Plasma samples of 500µl were prepared for analysis by solid phase extraction, using Oasis HLB 1cc
cartridges (30mg) supplied by Waters. The column was washed with 500ml water and then eluted
with 500µl acetonitrile. The extract was centrifuged at 14000 rpm for 10 minutes at -5°C and the
concentration of acyclovir was determined by LC-MS/MS using a sample injection volume of 10 µl.
The bioanalytical method was modified from previously reported methods (165, 168, 169).
Validation data are included as supplementary material. The HPLC consisted of a Prontosil C18;
100*2,00mm; 5µm column, using an Agilent 1100 LC binary pump. A gradient elution was used
with mobile phase A and B where A consisted of 15mM ammonium acetate + 0.1375% formic acid
at pH 3.5 and B was acetonitrile + 0.1375% formic acid. Details of the gradient:
Step Total Time(min) Flow Rate(µl/min) A (%) B (%)
0 0.00 300 97.0 3.0
1 0.50 300 97.0 3.0
2 0.60 300 5.0 95.0
3 1.20 300 5.0 95.0
4 2.00 300 97.0 3.0
5 5.50 300 97.0 3.0
Detection took place by a triple quadrupole LC-MS/MS mass spectrometer, API 3000 manufactured
by AB Sciex Instruments, using multiple reactions monitoring with transitions Q1/Q3: 255,992→
151,873. Source temperature was 500°C, overall run time was 5.5 minutes. The method was linear
in a range of 10 to 800 ng/ml, with a detection limit of 1 ng/ml. QC samples were analyzed with
the plasma samples to monitor method accuracy and precision.
Pharmacokinetic and statistical analysis
The data were analyzed using Microsoft Excel 2010 and IBM SPSS Statistics version 19. Maximum
plasma concentration, Cmax, and the time point at which this was measured, Tmax, were manually
selected from the data. The areas under the curve, AUC(0-t) and AUC(0-∞), were estimated using the
linear trapezoidal method as available in PKSolver2.0 with automatic calculation of the terminal
elimination slope using the regression with the largest adjusted R2 based on at least three of the
last time points (170).

Chapter 3 | Results
56
The complete dataset was analyzed for sequence or period effects on Cmax and AUC using a
general linear model with period, treatment, sequence and subject within sequence as fixed effects.
The difference between related parameters was considered statistically significant if p ≤ 0.05.
Parametric 90% confidence intervals were calculated based on the univariate ANOVA of the mean
ratio of test versus reference using log-transformed Cmax and AUC data. An increase of the
bioavailability of more than 30% was predefined as clinically significant. In addition, the products
were evaluated based on the European Guideline on bioequivalence. Test and reference products
were considered bioequivalent if the ln-transformed ratios of Cmax and AUC and their confidence
intervals were within the equivalence range of 80-125% (7).
Tmax was analysed using the nonparametric Wilcoxon signed rank test, where p ≤ 0.05 was
considered statistically significant.
Tolerability
Tolerability was assessed by monitoring electrocardiogram and blood parameters before and after
the study and by subject interviews during the study.
Results
Tolerability
The formulations were well tolerated. No adverse events were reported.
Table 3.4.1 P- values for effects on AUC(0-12), AUC(0-∞) and Cmax
p-values (α= 0.1)
Source AUC(0-12) AUC(0-∞) Cmax
Treatment 0.883 0.713 0.913
Period 0.900 0.975 0.544
Sequence 0.285 0.208 0.218
Subject within sequence 0.686 0.487 0.594
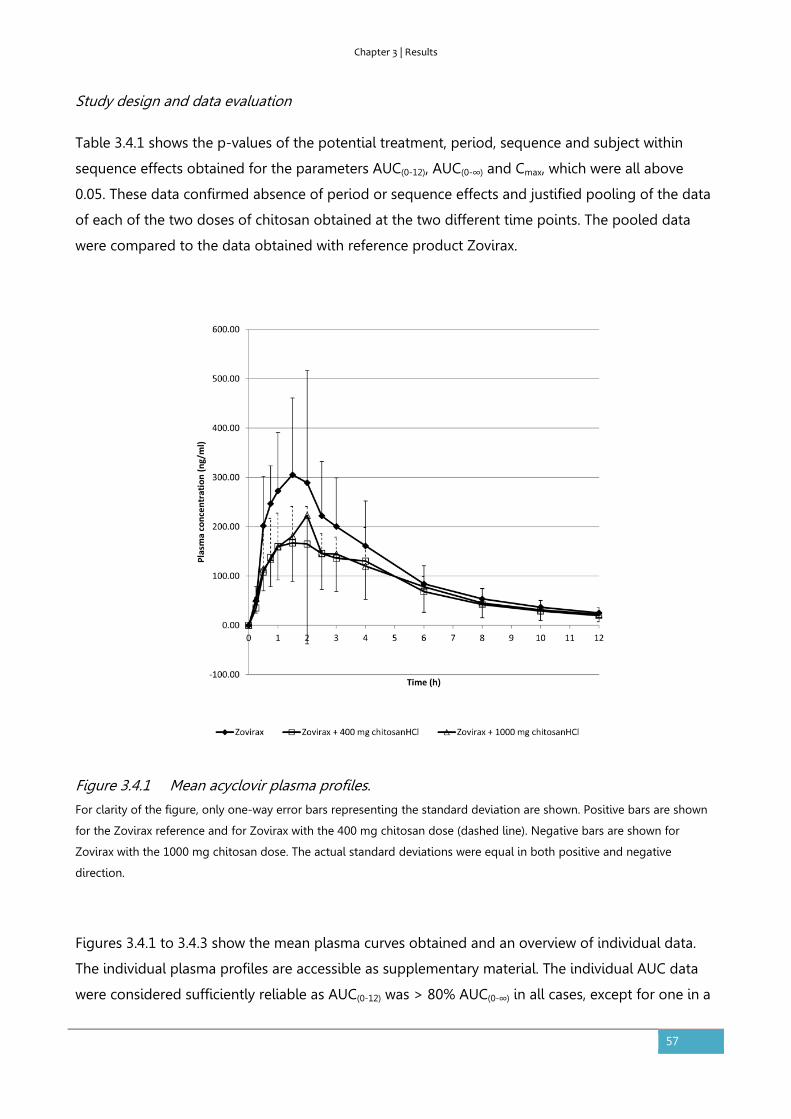
Chapter 3 | Results
57
Study design and data evaluation
Table 3.4.1 shows the p-values of the potential treatment, period, sequence and subject within
sequence effects obtained for the parameters AUC(0-12), AUC(0-∞) and Cmax, which were all above
0.05. These data confirmed absence of period or sequence effects and justified pooling of the data
of each of the two doses of chitosan obtained at the two different time points. The pooled data
were compared to the data obtained with reference product Zovirax.
Figure 3.4.1 Mean acyclovir plasma profiles.
For clarity of the figure, only one-way error bars representing the standard deviation are shown. Positive bars are shown
for the Zovirax reference and for Zovirax with the 400 mg chitosan dose (dashed line). Negative bars are shown for
Zovirax with the 1000 mg chitosan dose. The actual standard deviations were equal in both positive and negative
direction.
Figures 3.4.1 to 3.4.3 show the mean plasma curves obtained and an overview of individual data.
The individual plasma profiles are accessible as supplementary material. The individual AUC data
were considered sufficiently reliable as AUC(0-12) was > 80% AUC(0-∞) in all cases, except for one in a

Chapter 3 | Results
58
test situation with 400mg chitosan HCl where AUC(0-12) was 67% of AUC(0-∞). All data were used in
the analysis.
Figure 3.4.2 Individual data for AUC(0-12) per subject.

Chapter 3 | Results
59
Figure 3.4.3 Individual data for Cmax per subject.
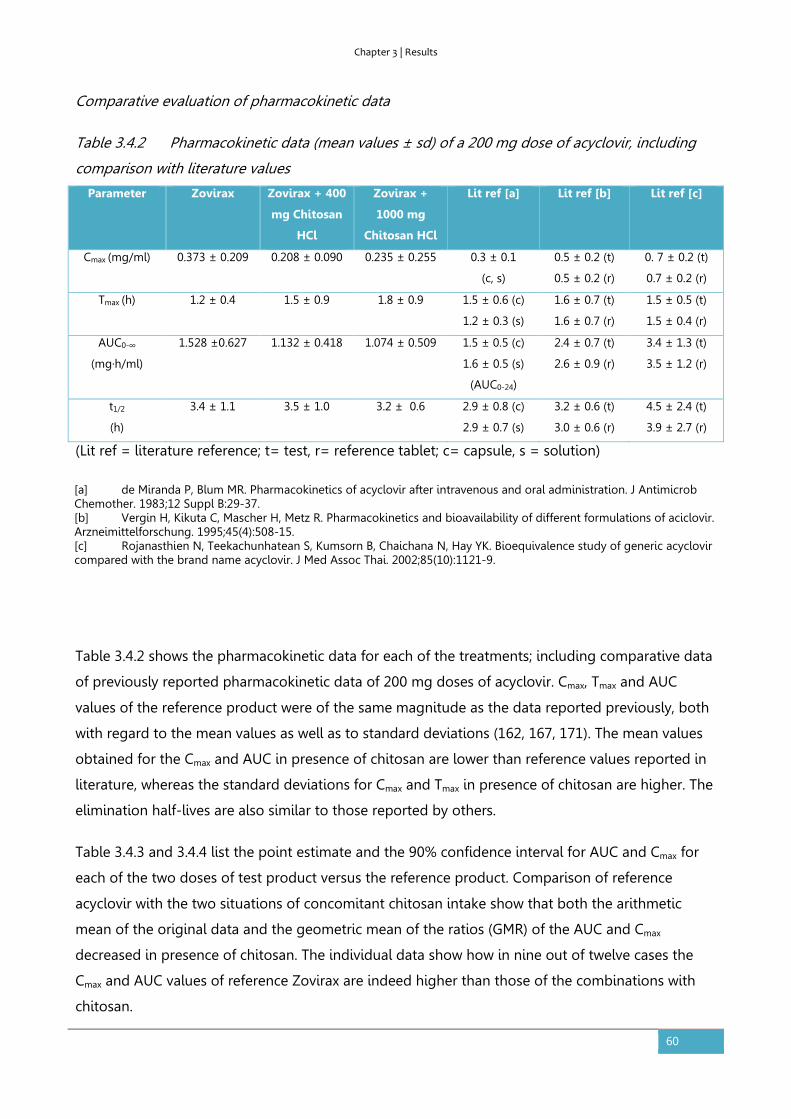
Chapter 3 | Results
60
Comparative evaluation of pharmacokinetic data
Table 3.4.2 Pharmacokinetic data (mean values ± sd) of a 200 mg dose of acyclovir, including
comparison with literature values
Parameter Zovirax Zovirax + 400
mg Chitosan
HCl
Zovirax +
1000 mg
Chitosan HCl
Lit ref [a]
Lit ref [b]
Lit ref [c]
Cmax (mg/ml) 0.373 ± 0.209 0.208 ± 0.090 0.235 ± 0.255 0.3 ± 0.1
(c, s)
0.5 ± 0.2 (t)
0.5 ± 0.2 (r)
0. 7 ± 0.2 (t)
0.7 ± 0.2 (r)
Tmax (h) 1.2 ± 0.4 1.5 ± 0.9 1.8 ± 0.9 1.5 ± 0.6 (c)
1.2 ± 0.3 (s)
1.6 ± 0.7 (t)
1.6 ± 0.7 (r)
1.5 ± 0.5 (t)
1.5 ± 0.4 (r)
AUC0-∞
(mg·h/ml)
1.528 ±0.627 1.132 ± 0.418 1.074 ± 0.509 1.5 ± 0.5 (c)
1.6 ± 0.5 (s)
(AUC0-24)
2.4 ± 0.7 (t)
2.6 ± 0.9 (r)
3.4 ± 1.3 (t)
3.5 ± 1.2 (r)
t1/2
(h)
3.4 ± 1.1 3.5 ± 1.0 3.2 ± 0.6 2.9 ± 0.8 (c)
2.9 ± 0.7 (s)
3.2 ± 0.6 (t)
3.0 ± 0.6 (r)
4.5 ± 2.4 (t)
3.9 ± 2.7 (r)
(Lit ref = literature reference; t= test, r= reference tablet; c= capsule, s = solution)
Table 3.4.2 shows the pharmacokinetic data for each of the treatments; including comparative data
of previously reported pharmacokinetic data of 200 mg doses of acyclovir. Cmax, Tmax and AUC
values of the reference product were of the same magnitude as the data reported previously, both
with regard to the mean values as well as to standard deviations (162, 167, 171). The mean values
obtained for the Cmax and AUC in presence of chitosan are lower than reference values reported in
literature, whereas the standard deviations for Cmax and Tmax in presence of chitosan are higher. The
elimination half-lives are also similar to those reported by others.
Table 3.4.3 and 3.4.4 list the point estimate and the 90% confidence interval for AUC and Cmax for
each of the two doses of test product versus the reference product. Comparison of reference
acyclovir with the two situations of concomitant chitosan intake show that both the arithmetic
mean of the original data and the geometric mean of the ratios (GMR) of the AUC and Cmax
decreased in presence of chitosan. The individual data show how in nine out of twelve cases the
Cmax and AUC values of reference Zovirax are indeed higher than those of the combinations with
chitosan.
[a] de Miranda P, Blum MR. Pharmacokinetics of acyclovir after intravenous and oral administration. J Antimicrob Chemother. 1983;12 Suppl B:29-37. [b] Vergin H, Kikuta C, Mascher H, Metz R. Pharmacokinetics and bioavailability of different formulations of aciclovir. Arzneimittelforschung. 1995;45(4):508-15. [c] Rojanasthien N, Teekachunhatean S, Kumsorn B, Chaichana N, Hay YK. Bioequivalence study of generic acyclovir compared with the brand name acyclovir. J Med Assoc Thai. 2002;85(10):1121-9.
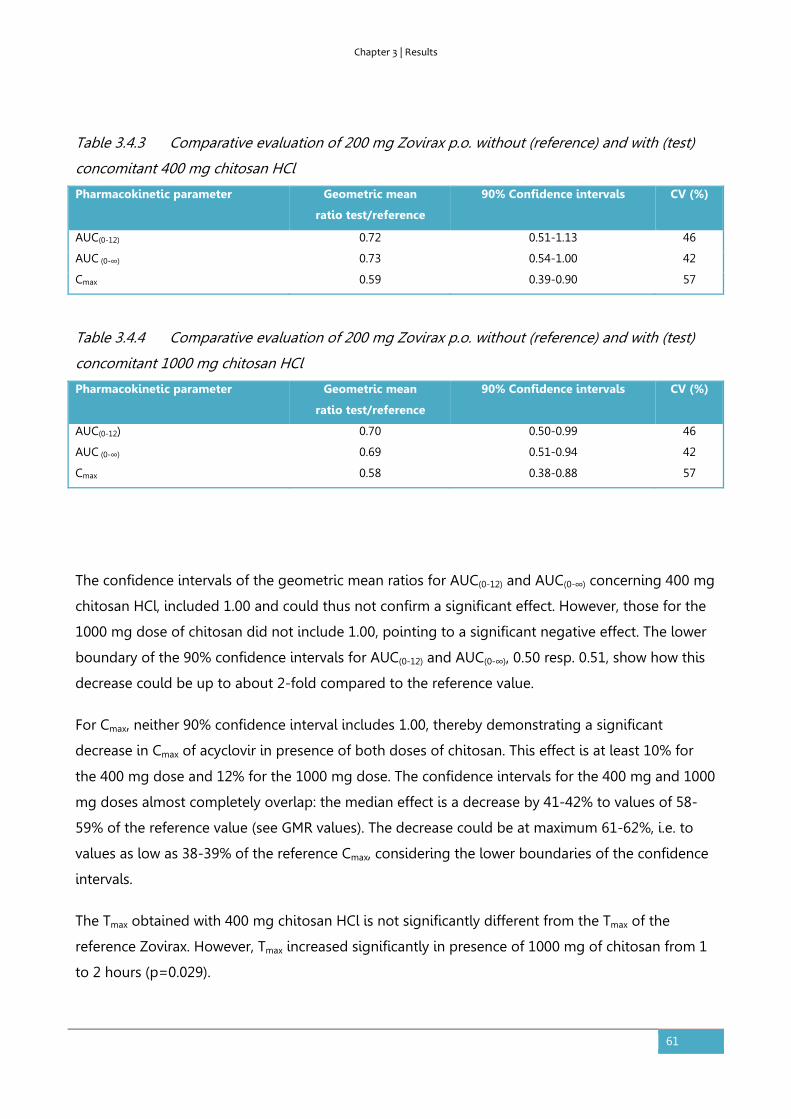
Chapter 3 | Results
61
Table 3.4.3 Comparative evaluation of 200 mg Zovirax p.o. without (reference) and with (test)
concomitant 400 mg chitosan HCl
Pharmacokinetic parameter Geometric mean
ratio test/reference
90% Confidence intervals CV (%)
AUC(0-12) 0.72 0.51-1.13 46
AUC (0-∞) 0.73 0.54-1.00 42
Cmax 0.59 0.39-0.90 57
Table 3.4.4 Comparative evaluation of 200 mg Zovirax p.o. without (reference) and with (test)
concomitant 1000 mg chitosan HCl
Pharmacokinetic parameter Geometric mean
ratio test/reference
90% Confidence intervals CV (%)
AUC(0-12) 0.70 0.50-0.99 46
AUC (0-∞) 0.69 0.51-0.94 42
Cmax 0.58 0.38-0.88 57
The confidence intervals of the geometric mean ratios for AUC(0-12) and AUC(0-∞) concerning 400 mg
chitosan HCl, included 1.00 and could thus not confirm a significant effect. However, those for the
1000 mg dose of chitosan did not include 1.00, pointing to a significant negative effect. The lower
boundary of the 90% confidence intervals for AUC(0-12) and AUC(0-∞), 0.50 resp. 0.51, show how this
decrease could be up to about 2-fold compared to the reference value.
For Cmax, neither 90% confidence interval includes 1.00, thereby demonstrating a significant
decrease in Cmax of acyclovir in presence of both doses of chitosan. This effect is at least 10% for
the 400 mg dose and 12% for the 1000 mg dose. The confidence intervals for the 400 mg and 1000
mg doses almost completely overlap: the median effect is a decrease by 41-42% to values of 58-
59% of the reference value (see GMR values). The decrease could be at maximum 61-62%, i.e. to
values as low as 38-39% of the reference Cmax, considering the lower boundaries of the confidence
intervals.
The Tmax obtained with 400 mg chitosan HCl is not significantly different from the Tmax of the
reference Zovirax. However, Tmax increased significantly in presence of 1000 mg of chitosan from 1
to 2 hours (p=0.029).

Chapter 3 | Results
62
Discussion
The results obtained with the acyclovir reference product were in line with those published by
others, both regarding the magnitude of the mean values as well as the standard deviations (see
Table 3.4.2).
The effects of chitosan on the bioavailability of acyclovir from Zovirax were evaluated in the
context of a pretreatment with Zovirax, as administered to all volunteers on the first trial day. In
view of the half-life of acyclovir of about 3 hours, a carry-over effect of pretreatment with Zovirax is
not expected to play a role and the order of administration of the test and reference products is
not expected to affect the results (172).
Locally administered chitosan increased acyclovir’s permeability across Caco-2 membranes and
facilitated the absorption of acyclovir in rats (164-166). The clinical trial protocol was based on an
expected increase of Cmax and AUC and defined that an increase by 30% would be considered as
relevant. However, chitosan HCl did not act as absorption enhancer of acyclovir in the human study
presented here. None of the confidence intervals includes a value of 1.3 or more, so an increase by
30% is highly unlikely.
Masuda et al. postulated a cut-off value of 10 kDa as minimal chain length of the chitosan
polysaccharide to facilitate acyclovir’s absorption. Opanasopit et al. showed an increasing negative
effect on the transepithelial electric resistance of Caco-2 monolayers with increasing molecular
weight in the range of 20-460 kDa (173). The applied chitosan had a molecular weight of 30-400
kDa which is well within these ranges. Masuda et al. also found a dose dependent effect and the
authors explained its transience by dilution of the concentration at the site of action and by
neutralization of the acidified perfusate by the intestinal fluids. An enhancing effect due to changes
in viscosity or cationic charges only was not found likely. Here, chitosan HCl and acyclovir were
administered orally and their concentrations were diluted by the luminal fluids while progressing
through the gastrointestinal tract, probably resulting in insufficiently high concentrations at
acyclovir’s absorption site. Moreover, the actually dissolved and protonated fraction of chitosan
may have been too low at gastrointestinal pH, thereby limiting a charge-based interaction with the
epithelial membrane (174).
Chitosan is metabolized in the colon, a property that has been used to produce colon targeted
formulations (175). Although evidence suggests that chitosan metabolism is likely to mainly take
place in the colon, the concentration at acyclovir’s absorption site may also have been decreased
by enzymatic degradation in stomach (pepsin) and/or duodenum/ileum (pancreatic enzymes) (176-
181). In addition, the presence of mucus may represent an unfavorable microenvironment and have
Chapter 3 | Results
63
hampered the access of chitosan to the mucosa to exert its permeability enhancing effect (182,
183).
If the data were to be evaluated as a bioequivalence study, a confidence interval contained within
0.8 to 1.25 would be considered as bioequivalent and confirm absence of clinically relevant
difference. Considering the lower values of each of the 90% confidence intervals, which are all well
below 0.8, the data do not confirm bioequivalence of the combination of Zovirax with chitosan to
Zovirax only. In fact, the data unexpectedly show a reduced bioavailability of acyclovir in presence
of chitosan HCl. Cmax was significantly reduced by both chitosan doses, and AUC and Tmax only by
the 1000 mg chitosan dose. Dose dependency could not be demonstrated as point estimates for
AUC and Cmax were close and the confidence intervals for both doses of chitosan almost
completely overlap. Confirmatory studies may clarify the actual significance and magnitude of the
observed negative effects on the means.
Acyclovir is known for its variable absorption. De Miranda and Blum described how a 200 mg
acyclovir outperformed a 200 mg acyclovir solution in as many subjects as vice versa thereby
demonstrating how the variability in absorption is a substance related characteristic and not
product related (23). Figure 3.4.2 and 3.4.3 also show variable individual effects in absence and
presence of chitosan: contrary to the results of the means, three volunteers actually showed an
increase of the bioavailability for one of the chitosan doses. The standard deviations calculated for
AUC and Cmax remain comparable to literature data in presence of chitosan (see Table 3.4.2).
However, the standard deviation for Tmax is higher than literature values for the reference product.
Several mechanisms may have influenced the bioavailability of acyclovir. Considering the effects on
the variability of Tmax, the significant effects on Cmax and AUC, and other hand, the similarity of the
terminal half-lives with reference values, chitosan’s effect seems to mainly take place in the
absorption phase.
Literature evidence does not point to interaction between chitosan HCl and acyclovir leading to
degradation of acyclovir, either in a formulation or in the gut lumen. An effect of chitosan HCl on
the dissolution (rate) of acyclovir at the time of administration is conceivable. The tablets were
dispersed in 100 mL water or 100 mL chitosan solution and the glass was rinsed with another 150
mL of water. In view of acyclovir’s solubility of ≥ 2.3 mg/mL in pH range 1.2–7.4 at 37°C and the
expected final concentration 2 mg/mL in the first 100 mL water at room temperature, not all
acyclovir may have been dissolved (105, 184). However, after addition of 150 ml water and
assuming the presence of additional volume of aqueous fluids and a temperature of 37°C in the
stomach, acyclovir was expected to dissolve sufficiently well. Experiments [data not shown] indeed
confirmed the visual compatibility of 1g chitosan HCl with 200 mg pure acyclovir after 1 minute of

Chapter 3 | Results
64
stirring in 250 mL water at room temperature, resulting in a clear solution. In addition, any residues
of undissolved acyclovir were expected to be similar for reference and test situations.
Acyclovir’s solubility is at the borderline of BCS class III and IV. Increasing its solubility in the lumen
may improve its bioavailability, as demonstrated by the effects of a self-microemulsifying drug
delivery system (185). Vice versa, its solubility may become limiting if it is chemically or
physiologically reduced. Allam et al. showed how chitosan-acyclovir co-crystals prolonged the
release of acyclovir, however, crystal formation was not observed when acyclovir and chitosan were
dissolved in 250 mL water [data not shown] (186). Nadai et al. showed how chitosan (25 mg/kg)
prolonged Tmax of orally administered suspensions of indomethacin and griseofulvin in rats, and
reduced Cmax and AUC. Association of the anionic indomethacin to the tertiary amino groups of
chitosan did not play a role according to those authors (187). The molecular structures of chitosan
(pKa ~6-6.5) and acyclovir (pKa's 2.3 and 9.3) do not seem to favor charge based complex
formation or adsorption either (188).
Effects on Tmax and Cmax may be related to the gastric emptying time; whereas an effect on
intestinal transit time may be relevant for the absorption of the BCS class III compound acyclovir. It
was previously found unlikely that chitosan caused alterations in the gastric emptying rate, as the
delayed Tmax was not observed for other compounds (187). However, in the current case, the
difference in stomach content after ingestion of the chitosan dispersion (increased osmotic value,
lower pH, perceived nutrient density) compared the reference dispersion may have influenced the
gastric emptying rate in this study which may explain the variable effect on Cmax and Tmax.
Nadai et al. postulated an indirect effect as a cause for the prolonged Tmax: binding of bile acids to
chitosan resulting in inhibition of the solubilisation of the drug substances (187). Heinen et al.
indeed described how presence and reduction of bile salts affected the absorption of BCS class III
drug trospium chloride (138). In fact, the absorption of acyclovir increased in presence of
conjugated trihydroxy bile salts and bile salt-acylcarnitine mixed micelles (189, 190). The 1000 mg
chitosan HCl used in the clinical study presented here corresponds to about 14 mg/kg for a
human being of 70 kg and is thus of the same order of magnitude as the dose used by Nadai et al.
Although amphoteric acyclovir is in neutral state at physiological pH and is not known for having a
significant food effect, chitosan may have interacted with luminal bile components indirectly
resulting in a reduced bioavailability of acyclovir (163, 184).
Finally, chitosan may act at the site of absorption. Chitosan’s mucoadhesive properties have been
studied in potentially absorption enhancing formulations of acyclovir (191-193). Although no
literature evidence is known to the authors, theoretically, chitosan may have physically or
biochemically delayed or prevented access of acyclovir to its paracellular permeation route by
Chapter 3 | Results
65
binding to mucus at the absorption site and/or changing the microclimate e.g. by formation of a
protective viscous layer. Derivatives of chitosan, quercetin and DM72 have been shown to inhibit
the efflux of acyclovir via P-gp, with the aim of improving its bioavailability (194-196). An opposite
effect, i.e. induction of (expression of) P-gp by chitosan has not been described and seems an
unlikely effect of a single dose of chitosan.
An effect of chitosan on the metabolism of drugs has not been described. As acyclovir is
eliminated mainly in unchanged form, such interaction is not considered likely either (163).
As chitosan is currently not in use as an excipient in approved drug products, the clinical impact of
the results seems limited. However, the observed variability and complex potential interactions
may complicate the use of chitosan HCl in oral pharmaceutical formulations. In addition, chitosan
is advertised as food supplement in high doses, up to 6 grams a day; interactions with concomitant
pharmacotherapy seem possible (197).
Conclusion
The results of this study in human volunteers did not confirm the data obtained in in vitro
experiments and in rat studies that suggested that chitosan would improve the bioavailability of
acyclovir. Chitosan increased the variability of the absorption of acyclovir and significantly reduced
its absorption. Mechanistic studies are needed to investigate the cause for the discrepancy in these
results. A luminal interaction of chitosan with acyclovir, bile salts or the epithelial membrane may
be responsible for the negative effects on acyclovir’s absorption.

Chapter 3 | Results
66
3.5. The effect of chitosan on the bioaccessibility and intestinal permeability of
acyclovir – in vitro studies
Based on:
Kubbinga M, Augustijns P, Heinen C, Wortelboer HM, Verwei M, Langguth P. The effect of chitosan on the
bioaccessibility and intestinal permeability of acyclovir, <publication in progress>
Abstract
Chitosan is object of pharmaceutical research as a candidate permeability enhancer. However,
chitosan was recently shown to reduce the oral bioavailability of acyclovir in humans. The effect of
chitosan on two processes determining the oral bioavailability of acyclovir, bioaccessibility and
intestinal absorption, was now investigated. Acyclovir’s bioaccessibility was studied using the
dynamic TNO gastro-Intestinal Model (TIM-1). Several epithelial models were used for permeability
experiments: a Caco-2 cell model in absence and presence of mucus and both rat and porcine
excised intestinal segments. Study concentrations of acyclovir (0.8 g/L) and chitosan (1.6 g/L and 4
g/L) were in line with those used in the aforementioned human study. No effect of chitosan was
measured on the bioaccessibility of acyclovir in the TIM-1 system, which confirmed absence
relevant of intraluminal interactions. The Caco-2 model was not biopredictive, neither in absence
nor in presence of a mucus layer. The rat and porcine intestinal tissue models showed a negative
trend of acyclovir’s permeation in presence of chitosan, including a statistically significant effect for
the rat tissue at 1.6 g/L chitosan. These tissue segment models thus suggested being the most
biopredictive, although – in absence of an established correlation - in vivo pharmacokinetic studies
remain necessary to determine the actual clinical effect of chitosan on the absorption of acyclovir.
Introduction
Chitosan is an unbranched binary heteropolysaccharide consisting of the two units N-acetyl-d-
glucosamine and d-glucosamine, obtained by partial deacetylation of the natural product chitin
(198-202). The absorption of a variety of pharmaceutical substances has been studied in
combination with chitosan. Besides its employment as a conventional excipient (e.g. filler,
disintegrant, release modifier), chitosan has been tested as a candidate drug bioavailability
modulator. Various modulating effects of chitosan were shown in preclinical research including
improved dissolution of poorly water-soluble drug ECU-01 and naproxen (203, 204), reduced
Chapter 3 | Results
67
intraluminal degradation or metabolism of calcitonin and mesalazine (205-207), increased gastric
residence time of melatonin and acyclovir due to mucoadhesion and floating of the formulation
(191, 192, 208, 209) or enhanced permeability of acyclovir, cyclosporine-A and hydrophilic marker
molecules like mannitol (157, 166, 191, 210). However, the data of these in vitro and animal
experiments were not confirmed by human data tested at identical dose levels and have not yet
resulted in a marketed pharmaceutical product.
The in vivo relevance of chitosan’s effects is still subject to further research (211-213). Chitosan
salts have been shown to increase the in vitro permeability of acyclovir across Caco-2 monolayers
and the oral absorption of acyclovir in the rat at concentrations varying from 0.1% to 3% (164, 165).
The mechanism for permeation enhancement is postulated to occur through an interaction of the
positively charged chitosan molecules and negative charges in the cavity of the epithelial tight
junctions resulting in opening of these tight junctions (16, 30-33). However, a recent study in
healthy human volunteers performed by the authors showed how chitosan hydrochloride actually
reduced the bioavailability of 200 mg acyclovir when orally administered at a concentration of
0.16% or 0.4% (1.6 g/L or 4 g/L; given as 400 mg and 1000 mg chitosan hydrochloride respectively
in 250 mL water) (214). The data obtained from other available studies are often difficult to
compare as the characteristics of the applied chitosan (molecular weight, degree of deacetylation
(DD), salt form) as well as the test compounds and dose levels differ between the studies. The
current paper describes the effect of chitosan on acyclovir absorption using different studies all
performed with chitosan of the same or very similar quality at identical dose levels as applied in
the human study. The studies improve the understanding of chitosan’s effects on two kinetic
processes underlying the oral bioavailability of the high solubility and low permeability model drug
acyclovir (BSCIII). In addition, this research allows evaluation of the different intestinal permeability
models for pharmaceutical development or biowaiver purposes.
Materials and methods
Materials
Chitosan hydrochloride (degree of deacetylation (DD) 92.7%; viscosity 1% in water at 20°C 4-5
mPas for TIM-1 studies and Ussing type rat model and DD 93.05%, viscosity 1% in water at 20°C
5.9 mPas for Caco-2 and the inTESTine study) was obtained from Heppe Medical GmbH, Halle,
Germany. Zovirax 200 mg dispersible tablets (GlaxoSmithKline) were purchased in the Netherlands.
Acyclovir was obtained from Fagron (The Netherlands). For the Caco-2 studies, Hanks’ balanced
salt solution (HBSS), Dulbecco’s modified Eagle’s medium (DMEM), 10,000 IU/mL penicillin and
Chapter 3 | Results
68
10,000 μg/mL streptomycin, nonessential amino acid medium (100 x) and 4-(2-hydroxyethyl)-1-
piperazineethanesulfonic acid (HEPES) were obtained from Lonza (Verviers, Belgium). Fetal bovine
serum (FBS) was purchased from Biological Industries (Beit Haemek, Israel). 2-(N-
morpholino)ethanesulfonic acid (MES) was obtained from Sigma–Aldrich (St. Louis, MO, United
States). For rat ligated loop studies, ketamin (Ketavet, Pfizer, Germany), and xylazin (Rompun,
Bayer, Germany) were obtained via the Pharmacy of the Medical Center of the Johannes Gutenberg
University, Mainz, Germany. For the InTESTine study, 14C-Antipyrine (55 mCi/mmol) was purchased
from American Radiolabeled Chemicals Inc. (St. Louis, Missouri, United States). 3H-Atenolol (1.79
Ci/mmol), and 14C-acyclovir (440 mCi/mmol) were purchased from Moravek biochemicals Inc.
(Brea, California, United States). All other chemicals were purchased at Sigma-Aldrich, Schnelldorf,
Germany.
TIM-1 model
The in vitro dynamic TIM-1 system consists of one gastric compartment and three intestinal
compartments (duodenum, jejunum and ileum) connected with valves simulating the gastric and
small intestinal passage of food and pharmaceutical products. The TIM-1 systems (215-217) have a
simulated pyloric sphincter for controlled gastric emptying of liquids and solids (particles less than
3-5 mm) with specific settings for fasted and fed conditions. The conditions in the compartments
are computer-controlled via pH electrodes, temperature and pressure sensors. The secretions into
the gastric compartment consist of artificial saliva with electrolytes and α-amylase and gastric juice
with hydrochloric acid, pepsin and lipase. In the small-intestinal compartments, the secretion fluids
consist of bicarbonate, electrolytes, pancreatic juice with digestive enzymes, and bile.
The TIM-1 studies were performed with acyclovir (0.8 g/L) in absence or presence of chitosan (1.6
and 4.0 g/L) to provide information on the effect of chitosan on the bioaccessibility (i.e. availability
for absorption) of acyclovir during gastrointestinal passage. Preparation of the dispersions
containing Zovirax tablets in presence and absence of the two levels of chitosan took place in line
with the instructions applied during the human study (214): a total volume of 250 mL water was
introduced in the gastric compartment. The model conditions simulated the fasted state including
gastric pH profile, enzyme levels, gastric emptying etc. A gastric emptying half-time of 20 minutes
(default fasted state) was used for the three conditions (acyclovir in absence of chitosan, in
presence of 1.6 g/L or in presence of 4.0 g/L chitosan). The jejunum and ileum compartments were
connected with dialysis membranes (cut-off 5kDa) to remove the released and water-dissolved
compounds. Jejunum and ileum dialysate samples were collected every 30 minutes during the first
three hours and every 60 minutes during the next 2 hours till a total of five hours. The amount of

Chapter 3 | Results
69
acyclovir in these dialysate samples was considered as the fraction available for absorption from
the upper gastrointestinal tract, i.e. the bioaccessible amount, within a given time period. In
addition, ileum effluent was sampled every hour. These ileum effluent samples provide information
on the non-bioaccessible fraction during transit through the upper GI tract, and which will enter
the colon. After five hours, the experiments were ended and the residues were collected to be able
to calculate the mass balance of acyclovir in each individual TIM-1 experiment. All samples were
stored at or below -18°C until analysis.
Caco-2 cell permeation studies (n=3 wells)
Caco-2 cells were obtained from American Type Culture Collection (Manassas, VA) and were grown
in DMEM+ at 37 °C in an atmosphere of 5% CO2 and 90% relative humidity. Cells were passaged
every 3–4 days (at 80–90% confluence) at a split ratio of 1:6. For transport experiments, cells were
seeded at a density of 90,000 cells/cm² on Costar Transwell membrane inserts (3 μm pore
diameter, 12 mm diameter; Corning Inc., Corning, NY, United States) and were used for
experiments 17–18 days after seeding. Only monolayers with transepithelial electrical resistance
(TEER) values higher than 400Ω * cm² were used for transport studies.
Caco-2 cell culture medium consisted of DMEM supplemented with 10% FBS, 1% nonessential
amino acids, 100 IU/mL penicillin and 100 μg/mL streptomycin (DMEM+).
Transport medium consisted of HBSS containing 25 mM glucose and was buffered with 10 mM
HEPES to pH 7.4 or with 10 mM MES to pH 6.0 (HBSS+ pH 7.4 or pH 6.0).
Three conditions were tested in absence or presence of mucus: 0.8 g/L acyclovir, 0.8 g/L acyclovir +
1.6g/L chitosan and 0.8 g/L acyclovir + 4 g/L chitosan based on the concentrations for chitosan
which effects have been described previously (164, 165). The mucus used as a protective barrier in
the Caco-2 assay consisted of type III mucin derived from porcine stomach dissolved in HBSS+ pH
6.0. Mucus was used in a concentration of 50 mg/mL (218).
Prior to the transport study, Caco-2 cells were washed twice with pre-warmed HBSS+ pH 7.4 and
placed in a shake incubator (Thermostar, BMG Labtech, Offenburg, Germany) at 37 °C and 300
rotations per minute (rpm) for 30 min. After the pre-incubation, 100 µL of mucus was applied to
the apical compartment of the transwell plates for the corresponding conditions; in the basolateral
compartment fresh HBSS+ pH 7.4 was added. The transport experiment was initiated by adding the
corresponding incubation medium (0.5 mL) to the donor compartment. Plates were incubated in
the shake incubator at 300 rpm for 2 h at 37 °C. 200µL samples were taken from the basolateral

Chapter 3 | Results
70
compartment at t =15, 30, 45, 60, 90 and 120 min and were replaced by fresh buffer. 10 µL apical
samples were taken at t = 0 and 120 min and diluted 100x in HBSS+ pH 7.4. Samples were analysed
immediately. Monolayer integrity after the transport experiment was confirmed by comparing the
measured TEER at t = 0 min with the TEER at t = 120 min.
Ussing-type chamber permeation studies using rat jejunal segments (5-6 rats)
Rats were purchased from Charles River (Sulzfeld, Germany). Rat excised jejunal segments were
obtained and permeation studies in an Ussing-type chamber were performed as described by
Heinen et al. 2013 (137). On the apical side, a 5 mL Krebs-Ringer-Bicarbonate-Buffer (KRB)
containing 4-morpholine ethane sulfonic acid (MES) was used. The reference solution was 200mg
acyclovir dissolved in 250mL buffer. For the respective other solutions, increasing quantities of
chitosan hydrochloride were added, corresponding to 1.6 g/L, 4 g/L, 10 g/L, 30 g/L and 50 g/L,
respectively, to test whether a dose related effect would be observed. Samples of 600 µL were
taken at 30, 60, 90 and 120 min from the acceptor chamber, each replaced with fresh KRB buffer
and at 0 and 120 min from the donor chamber.
Porcine excised segment InTESTine permeation studies (2 individual studies each with 4 replicates)
Porcine excised jejunal segments were obtained from healthy pigs, mounted in a newly developed
InTESTine™ system, and permeability studies were performed as described by Westerhout et al.
(219). On the apical side, a 1 mL pre-warmed (37°C) Krebs-Ringer Bicarbonate buffer (containing 10
mM glucose, 25 mM HEPES, 15 mM sodium bicarbonate, 2.5 mM calcium chloride, pH 7.4, and
saturated with oxygen using a 95%/5% O2/CO2 mixture by gassing for 120 minutes, further
indicated as KRB-HEPES) dose solutions containing 10 µM acyclovir (containing [14C]-acyclovir, 2
kBq/mL) in the absence and presence of chitosan (0, 1.6, 4, 10, 30, and 50 g/L) and 50 µM
fluorescein isothiocyanate-dextran (FD4) as a membrane integrity marker was used. The basolateral
compartment contained 7.5 mL pre-warmed KRB buffer (37°C). In parallel, the permeability of 3H-
atenolol and 14C-antipyrine (both 10 µM) was determined in the absence and presence of chitosan
as a control for the permeability of a low and high permeability marker, respectively. The InTESTine
samples were taken from both the apical and basolateral compartment after a pre-incubation time
of 45 minutes in order to measure the linear phase of the transport over 60 min incubation.
Recovery of active substance compared to added quantity at the beginning of the study was
determined at the end of the studies by determination of the mass balance. It was previously
Chapter 3 | Results
71
shown that intestinal permeability of a wide range of compounds is comparable between (adult)
human and porcine intestinal tissue (219).
Analytical methods
Liquid chromatography
• Acyclovir by HPLC-FID (TIM-1)
Acyclovir in ileum and jejunum dialysate, ileum effluent and residue samples from the TIM-1
experiment was analysed by HPLC with fluorescence detection (excitation wavelength 260 nm,
emission wavelength 375 nm). A Waters Sunfire 150 x 3,0 mm 3,5 μm column was used at ambient
conditions, with an injection volume of 10 μl. A gradient elution method was applied involving
solvent A (0.1% formic acid in acetonitrile) and solvent B (0.1% formic acid in purified water) at a
flow rate of 0.6 mL/min. Solvent A and B were used in a ratio of 99:1 during the first 5 min,
followed by 2 min of 100% solvent B. The run time of 14 min was completed using the 99:1 ratio
again. Low, middle and high QC samples in two TIM matrices were analyzed in duplo in parallel
with the samples. Linearity was demonstrated in a range of 25 mg/mL to 250 mg/mL (R2 ≥ 0.998).
Regarding precision, intraday variation coefficients per concentration level varied from 0.03 to
5.1%, which is acceptable considering the complex matrix. The results for accuracy showed for QC
low (25 μg/mL) an average deviation of +15% in both matrices. Considering that the deviation
varied from +5% to +23% and that the results for overall recovery are limited to 110%, a correction
factor was not applied. The mean QC middle (100 μg/mL) and high (250 μg/mL) showed an
average deviation of the nominal values of -1% and 4%, respectively.
• Acyclovir by HPLC-UV (Caco-2)
Acyclovir concentration in media samples from the Caco-2 cell experiments were analysed by HPLC
consisting of a Waters 600 pump and a Waters 717 auto injector (Waters, Milford, MA). For
chromatographic separation, a Waters Novapak C18 column under radial compression was used.
UV absorbance was monitored using a Waters 2487 detector at 254 nm. The observed peaks were
integrated using Empower Pro (Empower 2) software. The mobile phase consisted of a 25 mM
acetate buffer (pH 3.5) (95%) / methanol (5%) and a flow rate of 1 mL/min was applied. Retention
time of acyclovir was 6.0 min. The calibration curve of acyclovir was linear over the concentration
range of 0.12 – 1000µM. The assessment of repeatability at concentrations of 250, 25, 2.5 and 0.25
µM resulted all in RSD’s below 2.5%. Samples from the acceptor compartment were not diluted; the
Chapter 3 | Results
72
10 µL samples from the apical department were diluted with 990 μL HBSS+ pH 7.4. The injection
volume amounted to 50 μL.
• Acyclovir by HPLC-UV (Ussing-type chamber)
Acyclovir concentration in media samples from Ussing-type chamber experiments were
determined using isocratic HPLC with UV detection at 254 nm. A Lichrospher 10 RP 18 (5 μm), 250-
4 column was used for chromatographic separation, at 40°C and ~133 bar. The mobile phase
consisted of 10 mM acetic acid and acetonitrile (95:5; V/V) and a flow rate of 1 mL/min was applied
(retention time acyclovir ~ 4.6 min). Linearity was demonstrated in a range of 0.050 µg/mL to 50.0
µg/mL acyclovir. Intraday precision resulted in RSD values <5.5% for concentrations ≥ 0.50 µg/mL
and <11% for the lower concentrations. Interday precision resulted in RSD values <5.5% for
concentrations ≥ 0.10 µg/mL and 13% for the lowest concentration of 0.050 µg/mL. Samples from
the acceptor compartment were not diluted; 10 µL of the samples from the apical department were
diluted with 390 µl buffer. Injection volumes were 50 µL.
Liquid scintillation counting (InTESTine)
Concentrations of radioactive labeled compounds in The InTESTine samples were measured on a
Tri-Carb 3100TR Liquid Scintillation counter (LSC, Perkin Elmer, Boston, Massachusetts, United
States) after adding scintillation liquid (Ultima Gold, Perkin Elmer Inc., Boston, Massachusetts,
United States) to samples of the InTESTine experiments.
Fluorescence spectrophotometry (InTESTine)
FD4 levels in media samples from both the apical and basolateral compartments of the InTESTine
system were determined using a FLUOstar OPTIMA fluorescence spectrometer (BMG Labtech,
Ortenberg, Germany) at excitation wavelength 490 nm and emission wavelength 520 nm.
Data analysis
Bioaccessibility
The amount of acyclovir in each sample collected during the TIM-1 experiment was calculated by
multiplying the measured concentration by the total volume of the individual samples collected in
the time periods. The bioaccessibility of acyclovir is given as percentage of the intake dose of
Chapter 3 | Results
73
acyclovir and expressed as the mean and range of duplicate TIM-1 experiments. The mass balance
(recovery) was calculated as the sum of the bioaccessible fraction (ileum and jejunum), the ileum
effluent and the residues in the system after ending the experiments.
Apparent permeability
The apparent permeability coefficient (Papp) was calculated based on the linear part of the curves
according to the following equation:
Papp = dQ/dt * 1/A * C0
where Q is the amount of drug appearing in the acceptor compartment as a function of time (t), A
is the surface area of the Transwell membrane (1.13 cm2) or the exposed surface of the intestinal
segment in the Ussing-type chamber (0.67 cm2) , or InTESTine system (0.79 cm2), and C0 is the
initial drug concentration in the donor (apical) compartment.
Statistical analysis
The TIM-1-results for cumulative bioaccessibility were compared using unpaired t-tests at each
time point. Differences were considered statistically significant when p < 0.05.
Statistical analysis of the permeation studies was performed using GraphPad Prism 6.03. The mean
Papp values obtained from the Caco-2 study, Ussing-type chamber, InTESTine experiments as well as
the AUCs of the ligated loop experiments were compared with the references using one-way
ANOVA and Dunnett’s multiple comparison test. P-values below 0.05 were considered significant
at a confidence level of 95%.
Results
Bioaccessibility in TIM-1
Figure 1 shows the jejunal, ileal and total bioaccessible fractions of acyclovir tested in absence
(reference) and presence of chitosan (1.6 g/L and 4.0 g/L). The total bioaccessibility of the high
solubility compound acyclovir tested under fasted state conditions in TIM-1 was found to be high,
as values above 90% were measured. No effect of chitosan on the bioaccessibility of acyclovir was
observed. Equal bioaccessible fractions were measured in the TIM-1 runs in absence of chitosan
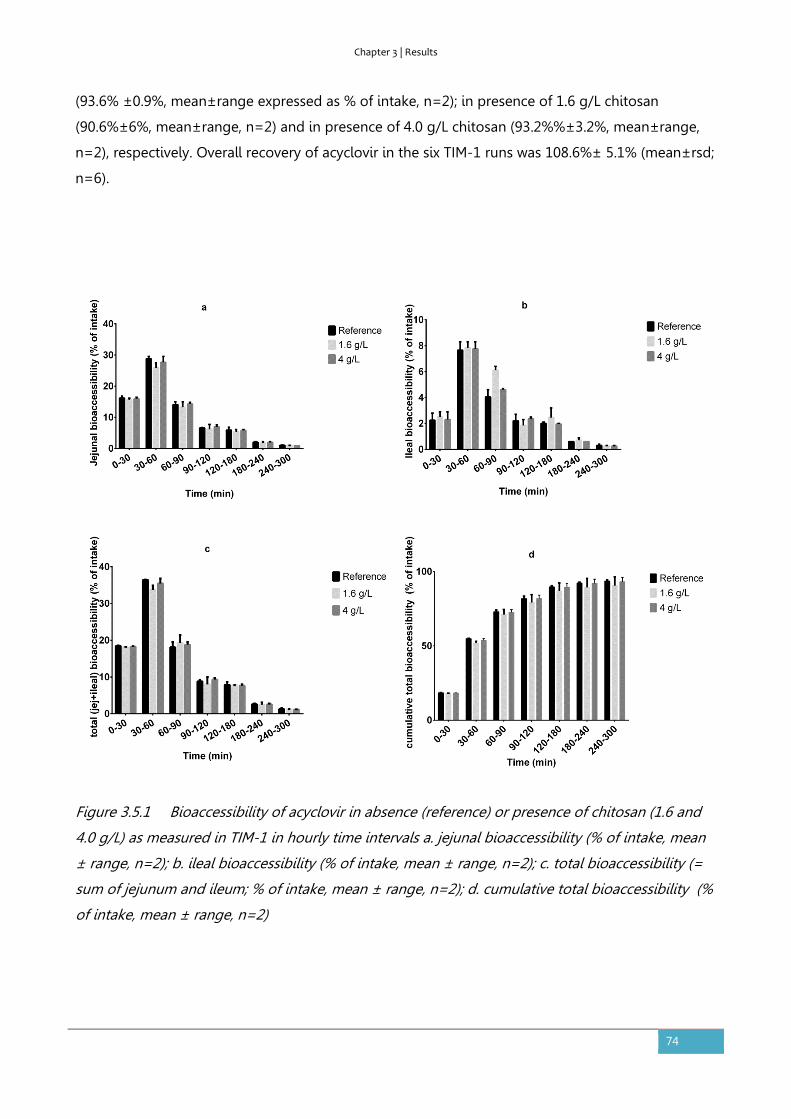
Chapter 3 | Results
74
(93.6% ±0.9%, mean±range expressed as % of intake, n=2); in presence of 1.6 g/L chitosan
(90.6%±6%, mean±range, n=2) and in presence of 4.0 g/L chitosan (93.2%%±3.2%, mean±range,
n=2), respectively. Overall recovery of acyclovir in the six TIM-1 runs was 108.6%± 5.1% (mean±rsd;
n=6).
Figure 3.5.1 Bioaccessibility of acyclovir in absence (reference) or presence of chitosan (1.6 and
4.0 g/L) as measured in TIM-1 in hourly time intervals a. jejunal bioaccessibility (% of intake, mean
± range, n=2); b. ileal bioaccessibility (% of intake, mean ± range, n=2); c. total bioaccessibility (=
sum of jejunum and ileum; % of intake, mean ± range, n=2); d. cumulative total bioaccessibility (%
of intake, mean ± range, n=2)
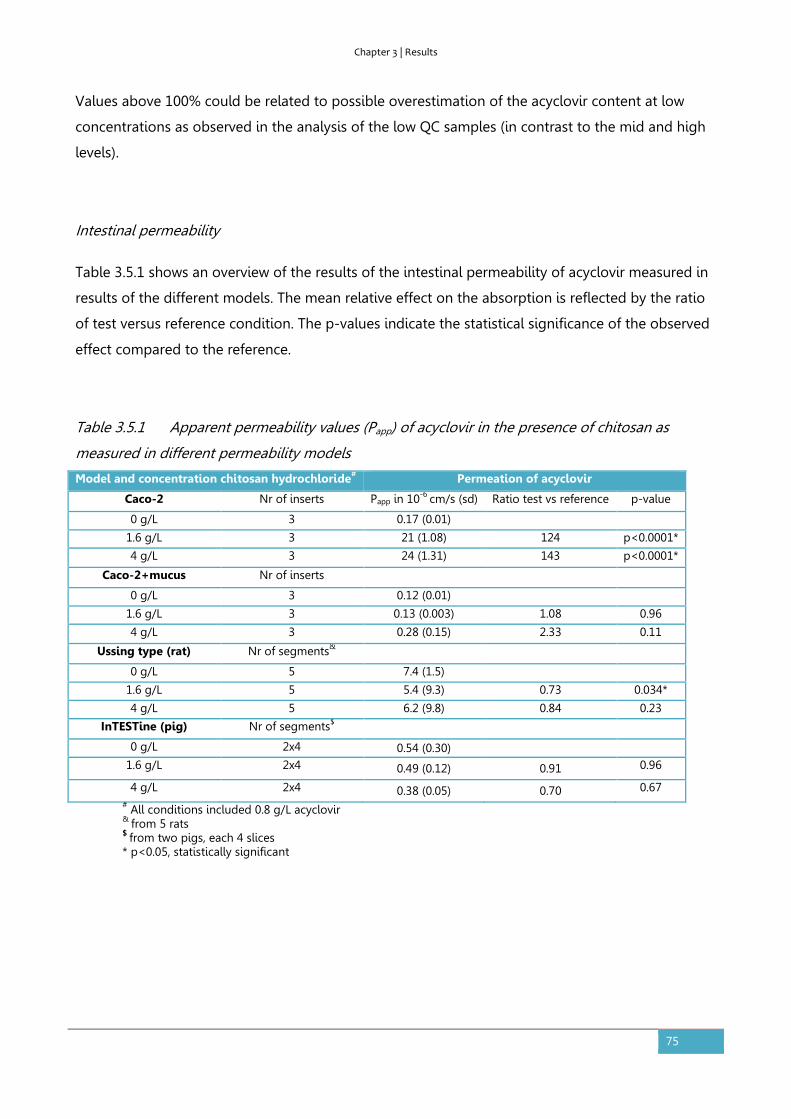
Chapter 3 | Results
75
Values above 100% could be related to possible overestimation of the acyclovir content at low
concentrations as observed in the analysis of the low QC samples (in contrast to the mid and high
levels).
Intestinal permeability
Table 3.5.1 shows an overview of the results of the intestinal permeability of acyclovir measured in
results of the different models. The mean relative effect on the absorption is reflected by the ratio
of test versus reference condition. The p-values indicate the statistical significance of the observed
effect compared to the reference.
Table 3.5.1 Apparent permeability values (Papp) of acyclovir in the presence of chitosan as
measured in different permeability models
Model and concentration chitosan hydrochloride# Permeation of acyclovir
Caco-2 Nr of inserts Papp in 10-6 cm/s (sd) Ratio test vs reference p-value
0 g/L 3 0.17 (0.01)
1.6 g/L 3 21 (1.08) 124 p<0.0001*
4 g/L 3 24 (1.31) 143 p<0.0001*
Caco-2+mucus Nr of inserts
0 g/L 3 0.12 (0.01)
1.6 g/L 3 0.13 (0.003) 1.08 0.96
4 g/L 3 0.28 (0.15) 2.33 0.11
Ussing type (rat) Nr of segments&
0 g/L 5 7.4 (1.5)
1.6 g/L 5 5.4 (9.3) 0.73 0.034*
4 g/L 5 6.2 (9.8) 0.84 0.23
InTESTine (pig) Nr of segments$
0 g/L 2x4 0.54 (0.30)
1.6 g/L 2x4 0.49 (0.12) 0.91 0.96
4 g/L 2x4 0.38 (0.05) 0.70 0.67 # All conditions included 0.8 g/L acyclovir & from 5 rats $ from two pigs, each 4 slices * p<0.05, statistically significant
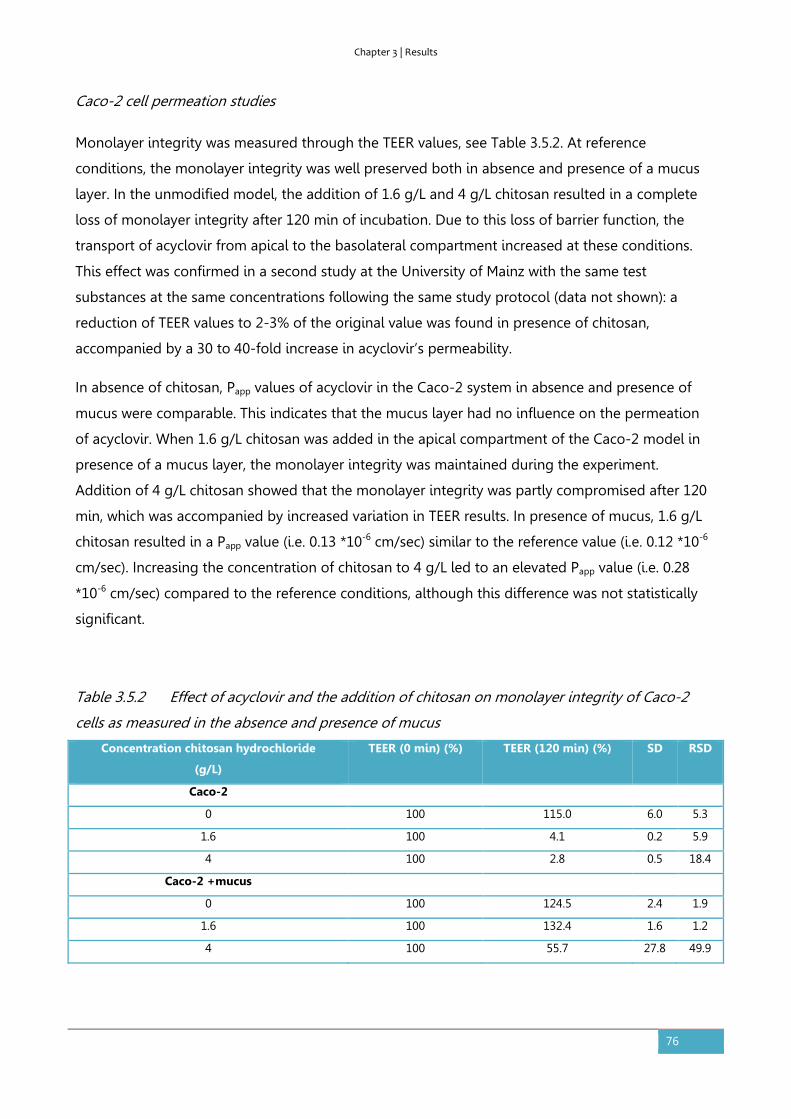
Chapter 3 | Results
76
Caco-2 cell permeation studies
Monolayer integrity was measured through the TEER values, see Table 3.5.2. At reference
conditions, the monolayer integrity was well preserved both in absence and presence of a mucus
layer. In the unmodified model, the addition of 1.6 g/L and 4 g/L chitosan resulted in a complete
loss of monolayer integrity after 120 min of incubation. Due to this loss of barrier function, the
transport of acyclovir from apical to the basolateral compartment increased at these conditions.
This effect was confirmed in a second study at the University of Mainz with the same test
substances at the same concentrations following the same study protocol (data not shown): a
reduction of TEER values to 2-3% of the original value was found in presence of chitosan,
accompanied by a 30 to 40-fold increase in acyclovir’s permeability.
In absence of chitosan, Papp values of acyclovir in the Caco-2 system in absence and presence of
mucus were comparable. This indicates that the mucus layer had no influence on the permeation
of acyclovir. When 1.6 g/L chitosan was added in the apical compartment of the Caco-2 model in
presence of a mucus layer, the monolayer integrity was maintained during the experiment.
Addition of 4 g/L chitosan showed that the monolayer integrity was partly compromised after 120
min, which was accompanied by increased variation in TEER results. In presence of mucus, 1.6 g/L
chitosan resulted in a Papp value (i.e. 0.13 *10-6 cm/sec) similar to the reference value (i.e. 0.12 *10-6
cm/sec). Increasing the concentration of chitosan to 4 g/L led to an elevated Papp value (i.e. 0.28
*10-6 cm/sec) compared to the reference conditions, although this difference was not statistically
significant.
Table 3.5.2 Effect of acyclovir and the addition of chitosan on monolayer integrity of Caco-2
cells as measured in the absence and presence of mucus
Concentration chitosan hydrochloride
(g/L)
TEER (0 min) (%) TEER (120 min) (%) SD RSD
Caco-2
0 100 115.0 6.0 5.3
1.6 100 4.1 0.2 5.9
4 100 2.8 0.5 18.4
Caco-2 +mucus
0 100 124.5 2.4 1.9
1.6 100 132.4 1.6 1.2
4 100 55.7 27.8 49.9

Chapter 3 | Results
77
Rat jejunal tissue mounted in the Ussing-type chamber
Two concentrations of chitosan hydrochloride (1.6 g/L, 4 g/L) were applied in the Ussing type
chamber with rat intestinal segments to test their effect on the permeability of acyclovir (0.8 g/L).
The results were compared with acyclovir alone (reference). In all incubations, the transsegmental
electrical resistance (Rf) values decreased during the experiment as presented in Table 3.5.3. At
reference conditions, the Rf decreased by 20%; in presence of chitosan, the membrane integrity
diminished less than the reference. A relatively high Papp value for the permeability of acyclovir in
absence of chitosan was found (i.e. 7.4 *10-6 cm/sec) in the Ussing type chamber with rat intestinal
segments. This mean Papp was reduced by both concentrations of chitosan, which was statistically
significant only for 1.6 g/L chitosan in the donor solution.
Table 3.5.3 Effect of acyclovir and the addition of chitosan on monolayer integrity of rat
intestinal tissue as mounted in Ussing-type chamber
Concentration chitosan hydrochloride (g/L)
Rf (0 min) (%) Rf (120 min) (%) SD RSD
0 100 79.7 6.6 8.3
1.6 100 97.3 5.6 5.8
4 100 88.2 6.6 7.5
Porcine intestinal tissue
The permeability of acyclovir, atenolol and antipyrine was measured across jejunal porcine tissue
mounted in the InTESTine system. The tissue of two rats (each 4 slices) was subjected to the same
test concentrations with respect to chitosan as used in the rat tissue Ussing-type chamber
experiments. Recovery of all compounds based upon media alone were > 95%. FD4 leakage
remained below 1% indicating no effect of the test solutions on intestinal integrity. The Papp values
of acyclovir, atenolol, and antipyrine in the absence of chitosan were 0.54*10-6 cm/sec, 0.46*10-6
cm/sec and 6.58*10-6 cm/sec, respectively. The addition of concentrations of 1.6 and 4 g/L chitosan
resulted in a negative trend on the permeation of acyclovir, but the overall effect of both
concentrations was not statistically significant. The permeability of the paracellular transport
marker atenolol enhanced with higher concentrations of chitosan from ~0.5 * 10-6 cm/s up to ~ 1 *
10-6 cm/s at 4.0 g/L (data not shown). No effect of chitosan was observed on the permeability of
the transcellular transport marker antipyrine, which varied in the range of 6 to 9 * 10-6 cm/s (data
not shown).
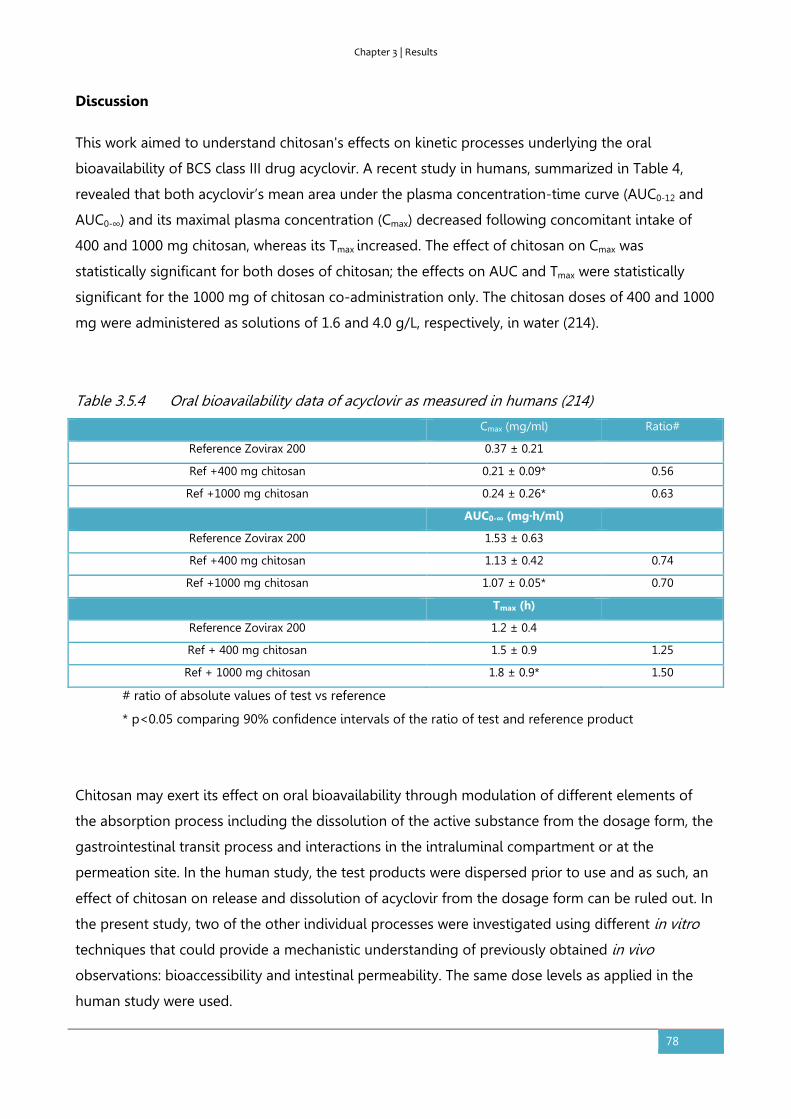
Chapter 3 | Results
78
Discussion
This work aimed to understand chitosan's effects on kinetic processes underlying the oral
bioavailability of BCS class III drug acyclovir. A recent study in humans, summarized in Table 4,
revealed that both acyclovir’s mean area under the plasma concentration-time curve (AUC0-12 and
AUC0-∞) and its maximal plasma concentration (Cmax) decreased following concomitant intake of
400 and 1000 mg chitosan, whereas its Tmax increased. The effect of chitosan on Cmax was
statistically significant for both doses of chitosan; the effects on AUC and Tmax were statistically
significant for the 1000 mg of chitosan co-administration only. The chitosan doses of 400 and 1000
mg were administered as solutions of 1.6 and 4.0 g/L, respectively, in water (214).
Table 3.5.4 Oral bioavailability data of acyclovir as measured in humans (214)
Cmax (mg/ml) Ratio#
Reference Zovirax 200 0.37 ± 0.21
Ref +400 mg chitosan 0.21 ± 0.09* 0.56
Ref +1000 mg chitosan 0.24 ± 0.26* 0.63
AUC0-∞ (mg·h/ml)
Reference Zovirax 200 1.53 ± 0.63
Ref +400 mg chitosan 1.13 ± 0.42 0.74
Ref +1000 mg chitosan 1.07 ± 0.05* 0.70
Tmax (h)
Reference Zovirax 200 1.2 ± 0.4
Ref + 400 mg chitosan 1.5 ± 0.9 1.25
Ref + 1000 mg chitosan 1.8 ± 0.9* 1.50
# ratio of absolute values of test vs reference
* p<0.05 comparing 90% confidence intervals of the ratio of test and reference product
Chitosan may exert its effect on oral bioavailability through modulation of different elements of
the absorption process including the dissolution of the active substance from the dosage form, the
gastrointestinal transit process and interactions in the intraluminal compartment or at the
permeation site. In the human study, the test products were dispersed prior to use and as such, an
effect of chitosan on release and dissolution of acyclovir from the dosage form can be ruled out. In
the present study, two of the other individual processes were investigated using different in vitro
techniques that could provide a mechanistic understanding of previously obtained in vivo
observations: bioaccessibility and intestinal permeability. The same dose levels as applied in the
human study were used.

Chapter 3 | Results
79
The selected in vitro intestinal models have previously been described as tools to study the
individual processes underlying oral bioavailability and identify the critical process(es) hampering
the oral bioavailability of a specific compound. Based on the physico-chemical properties of
acyclovir and available data, acyclovir was previously classified as a BCS III compound indicating
that intestinal permeability, not solubility, is the rate limiting process in oral bioavailability.
The TIM-1 system simulating the human physiological conditions in the stomach and the three
parts of the small intestine was applied to investigate the effect of chitosan on the bioaccessibility
of acyclovir. A high bioaccessibility of acyclovir was measured (>90%) in absence and presence of
chitosan which indicates a large fraction of the acyclovir dose added to the gastric compartment
appears to be available for absorption irrespective of the presence of chitosan. These observations
are in line with the high solubility characteristics of acyclovir. Luminal interactions affecting both
acyclovir and chitosan might possibly explain the in vivo results. For example, an interaction of
chitosan with bile acids in the gut lumen, reducing the solubility of acyclovir was hypothesized
(187, 214). In the study presented here, no effect of chitosan on the bioaccessibility of acyclovir was
observed, indicating that the possible luminal interactions did not affect the bioaccessibility of
acyclovir.
The current set-up of the TIM-1 experiments simulated the average human adult fasted state
conditions concerning enzyme levels, pH values, transit times, etc. Gastric emptying time was fixed
and identical in the TIM-1 runs testing the three applied experimental conditions. An effect of
chitosan on the gastric emptying time was thus not tested in current study. As the TIM-1 system is
a computer-controlled in vitro system, individual parameters as gastric emptying rate could be
changed to investigate the effect of this specific parameter. Including known variation in the
human population concerning specific simulated parameters in TIM-1 is also possible and could be
relevant in explaining in vivo results related to processes in the human GI tract. However, a
physiological basis to assume that the gastric emptying rate would change in the presence of
chitosan has not been confirmed so far. Rat experiments using similar doses of chitosan (5 mg/kg
and 25 mg/kg) in combination with several drugs with different absorption characteristics showed
that delayed gastric emptying is an unlikely effect of chitosan (38). However, the recently
performed human study showed an increased Tmax value at 4g/L chitosan which could be related to
delayed gastric emptying of acyclovir.
Mucosal interactions of chitosan causing a change in permeation of acyclovir were tested in four
different permeability models. Chitosan is thought to act as a potential permeability modulator
through interaction with the tight junctions between the epithelial cells, resulting in redistribution
of cytoskeletal F-actin and translocation of tight junction proteins ZO-1 and occludin from the
membrane to the cytoskeleton (157, 220, 221). Smith et al. showed activation of PKC-dependent
Chapter 3 | Results
80
signal transduction pathways using a Caco-2 model (222). The mucus layer was also reported to
play a role in the access of chitosan to the epithelial membrane and the subsequent effect on the
paracellular permeation route (183).
In the unmodified human intestinal Caco-2 cell model, chitosan enhanced the permeability of
acyclovir to a statistically significant extent. This was caused by the disruption of the monolayer
integrity as shown by the reduction of the TEER values. This loss of intestinal integrity due to
exposure to chitosan is in line with literature data (164, 165, 173, 223). The almost complete
reduction of the TEER values suggested a cytotoxic effect. The consequential relatively large
increase in Papp-values (124 and 143-fold respectively) compared to literature may partly be due to
the low reference value of Papp, as compared to other studies (84, 164, 165). The low pH of the
current study, applied to overcome precipitation of chitosan, and the general interlaboratory
variability of the Caco-2 system (224, 225) may explain absolute differences compared to literature
values.
The modified Caco-2 model with mucus demonstrated that the disruptive effect of chitosan on the
integrity of the epithelial cells is much lower in presence of mucus (183, 226). Both TEER values and
acyclovir’s permeation were less affected than in the unmodified model when 1.6 g/L chitosan was
added, suggesting that the mucus layer prevented damage to cell monolayer integrity and
consequential increased permeation of acyclovir. The higher concentration of chitosan (4 g/L)
caused reduced monolayer integrity accompanied by an elevated permeation of acyclovir,
although this was not statistically significant. The observed results thus suggest a protective effect
of the mucus layer, that should be taken into account as relevant characteristic of the intestinal wall
when using biorelevant permeation models. In addition, the observed precipitate suggests a direct
interaction of chitosan with the mucus reducing the available concentration of the modulator in
solution. Therefore, in the presence of mucus, no effect of chitosan (1.6 and 4.0 g/L) on the
absorption of acyclovir was detected in this modified Caco-2 cell model.
In the rat jejunal segments mounted in the Ussing-type chamber, the permeability of acyclovir was
statistically significantly reduced in presence of a concentration of 1.6 g/L chitosan, while the
reduction remained a non-significant trend at 4.0 g/L. The Rf values decreased during the
experiment and the limited reduction in presence of chitosan suggested a stabilizing effect of
mucus on the epithelial integrity. Interactions of chitosan with mucus may again explain these
observations. The mucus production of intestinal tissue segments in the Ussing-type chamber is
enhanced by the experimental conditions (183, 227), as was also observed in the present study.
Charge interactions of chitosan in the mucus-producing model may neutralize the reactivity of
chitosan and prevent an absorption enhancing effect. In addition, the positive charges of chitosan
Chapter 3 | Results
81
may have undergone an interaction with the negative glycoproteins in the mucus layer, thereby
increasing the rigidity of the protective layer and enhancing its protective effect (183).
Both concentrations of chitosan (1.6 and 4 g/L) suggested a negative effect on the absorption of
acyclovir across porcine jejunal segments of both pigs mounted in the InTESTine system. The effect
was quite pronounced in one of the two pigs (ratio test versus reference of 0.44), however, the
overall effect was not statistically significantly different from the reference. The effect of chitosan
on paracellular transport marker compound atenolol was in line with that for acyclovir, which
confirmed an effect of chitosan on the paracellular absorption route. The absence of an effect of
chitosan on transport of antipyrine confirmed the absence of an effect on the transcellular route
and of a non-specific effect on the mucus barrier.
The reference Papp values of the Caco-2 experiments and porcine intestinal segments were
comparably low and in line with earlier observations that permeability is the limiting process in the
oral bioavailability of the BCS class 3 compound acyclovir (37, 46). The reference values for the two
Caco-2 models were similar. The absolute Papp values of acyclovir measured with the rat intestinal
segments were higher than those obtained with the Caco-2 and porcine models. Both interspecies
differences between the characteristics of the human Caco-2 model and the two animal tissue
models, as well as differences resulting from the applied test conditions may play a role.
The unmodified Caco-2 model does not resemble the true human anatomic intestinal lining due to
the lack of a mucus layer. The results obtained with the other permeation models employed indeed
suggest that the presence of mucus in the in vivo GI tract prevented chitosan to exert an overall
enhancing effect on the bioavailability of acyclovir, as discussed above. The application of the
Caco-2 model as biorelevant tool to predict in vivo permeation is further limited by differences in
expression of tight junctions and transporters as compared to healthy human colon (67, 225).
Especially the differences in protective mucus layer and tight junctions are of relevance, as the
modulation of membrane transport by cationic chitosan is postulated to occur through an
interaction with negative charges in the cavity of the tight junctions.
Porcine intestinal segments have proven to be physiologically similar to human intestinal segments
with mucus production, high CYP3A metabolic activity, and active transporter processes. Detailed
research on metabolic differences and expression of transporters compared to humans is ongoing
(26, 219). Rat intestine mounted in an Ussing chamber has shown to be a useful model in
predicting human intestinal absorption too, although differences in transporter expression and
metabolic characteristics apply as well (26, 228, 229). For the current test substance acyclovir, a
difference in transporter expression or metabolism between the cell-based Caco-2 models and the
rat and porcine tissue models was not expected to play a major role as acyclovir is mainly passively
Chapter 3 | Results
82
absorbed and intestinal metabolism has not been reported. The higher reference Papp values
measured in the studies with rat segments as compared to the porcine intestinal segments and the
Caco-2 model were thus most likely due to differences in passive absorption.
The absorption of acyclovir in rats was shown to decrease along the GI tract from stomach to colon
(230). Consequently, the human colon-based Caco-2 model would be expected to show a relatively
low permeation compared to the two small intestinal tissue models, which was indeed observed in
the current study. Both animal tissue models made use of jejunal segments. The rat model
contained proximal jejunal tissue , whereas the porcine model used four mid jejunal segments per
rat. The use of more distal tissue segments for the inTESTine model, compared to the proximal rat
tissue segments mounted in the Ussing type chamber, may partly explain the higher reference Papp
values in the rat tissue model.
However, differences in the (preparation of) the intestinal tissue as mounted in the experimental
setting of the two models constitute the most prominent cause of the relatively low basal Papp of
the porcine intestinal segments compared to that observed for the rat tissue. The relatively long
villi and thicker tissue, compared to that of the stretched rat tissue, presented a larger permeation
barrier. In addition, the relatively thick mucus layer located between the villi limited the ease of
access of the model substances to the basolateral cell layer of the porcine tissue.
Our human study showed a relatively high intra-individual and interindividual variability of the
absorption of acyclovir itself, which augmented in presence of chitosan (214). Both increased and
decreased AUC and Cmax values were observed when acyclovir was co-administered with chitosan.
The animal tissue models also showed interindividual differences. Further evaluation of potential
intra- and interindividual differences in physiological processes in the absorption of acyclovir and
the potential effect of chitosan on these processes, may thus be relevant. Integration of different in
vitro datasets in a PBPK model can also be helpful in this perspective.
An evaluation of the biorelevance of the applied models is also of relevance in the context of
biowaiving. Based on human studies with acyclovir and cimetidine, Vaithianathan et al. recently
proposed widened biowaiver possibilities for changes in the content of 12 common excipients
combined with BCS class III substances (231). In the current case of potential excipient chitosan, the
contrary can be concluded. The unmodified Caco-2 cell model showed a loss of membrane
integrity, which has no correlation to the in vivo human situation. The mucus-containing Caco-2
model showed a non-significant positive trend, which is not line with the in vivo data. These
models thus seem unsuitable to replace in vivo testing. The overall trends observed for the tissue
segment models (rat and porcine intestine) were negative and correctly predicted a statistically
significantly reduced absorption of acyclovir at two conditions. These models thus seems most
Chapter 3 | Results
83
promising for further development as a tool for biowaiver purposes. However, none of the models
has so far been sufficiently validated as suitable to fully exempt from in vivo testing. An in vivo
pharmacokinetic study remains necessary to determine the magnitude of chitosan’s clinical effect
on Cmax, AUC and Tmax and its consequential relevance for drug absorption.
Conclusion
This study presents for the first time a comparison of various preclinical models run under
comparative conditions with the aim of testing the predictive power of each model. The overall in
vivo effects of chitosan pointed to a reduced rate and extent of the absorption of acyclovir.
Acyclovir’s bioaccessibility in TIM-1 was not affected by chitosan; this model thus confirmed
absence of intraluminal interactions hampering the solubility and availability for absorption of
acyclovir. Chitosan’s influence on intestinal permeability of acyclovir differed per model. The Caco-
2 model was not biopredictive, neither in absence nor in presence of a mucus layer. The rat and
porcine intestinal segments showed an overall negative trend of acyclovir’s permeation in presence
of chitosan, including statistically significant results for the rat. These tissue segment models thus
showed to be the most biopredictive models and can be considered as the most promising
candidates for further development as biowaiver tool. As a follow-up, PBPK modelling may be
applied to more specifically correlate the outcome of the models to the in vivo data. In absence of
an established correlation, in vivo pharmacokinetic studies remain necessary to determine the
actual clinical effect of chitosan on the absorption of acyclovir.

Chapter 4 | General discussion
84
4. GENERAL DISCUSSION
4.1. Biowaiver extensions from a risk-based perspective.
Regulatory authorities in EU and US as well as the WHO offer the alternative option for biowaiving
based on the Biopharmaceutic Classification System. The overall aim of biowaiver guidance is to
reduce the need for human studies while keeping the risk of bioinequivalence at an acceptable
level, as described in Chapter 1 of this thesis. The common principle lies in the use of a
comparative in vitro dissolution test as a surrogate for the in vivo bioequivalence test that would
otherwise be required.
Section 3.1 introduced the following risk calculation:
risk = probability of incidence x probability of detection x severity.
The incidence describes the probability of producing a product that really is bioinequivalent to the
comparator. The probability of detection is a measure for the ability to detect (and reject) the
bioinequivalent products prior to marketing. Severity refers to the potential impact of exposure of
a patient to a bioinequivalent product, or the risk to public health. The relevance of the different
factors in this equation in improving the accessibility of the biowaiver route is illustrated by
examples in the Chapter 3, sections 3.2 to 3.5
Incidence
The incidence or occurrence of bioinequivalence i.e. the probability that a bioinequivalent product
is manufactured depends on the prior knowledge and understanding of the manufacturer. Public
databases of scientific experience may facilitate sharing and availability of information to improve
this understanding. Such databases may be set-up for BCS classification of APIs, outcomes of
bioequivalence trials and classification of excipient effects.
From a regulatory perspective, the probability of incidence of a bioinequivalent formulation is
limited by the access criteria based on the BCS. As Section 3.2 of this thesis shows, the regional
differences in biowaiver guidance can be of pivotal importance for the regulatory hurdles to take in
Chapter 4 | General discussion
85
the approval of a generic medicinal product via this route. The assignment of the BCS class has
recently been changed by the EMA by a change in definition of the Dose based on which Solubility
is determined. The subsequent eligibility for a biowaiver, depending on the BCS class, also differs
per guidance. Such regional differences are likely to hinder application of the biowaiver concept by
globally operating pharmaceutical industries. Harmonization seems preferable.
The application of the risk analysis to biowaiver guidance as described in Section 3.1 shows an
obvious gap in applied understanding of excipient effects on bioavailability of the API. This may be
due to the absence of knowledge on these effects, but also to the lack of initiatives to make the
available experience accessible for evaluation. In the (pre)formulation stage, the focus seems to be
on the API. After approval, the quantitative composition of individual products remains mostly
confidential. A systematic approach to characterize and analyze excipient effects seems not to be
available at either stage.
The top-down database research described in Section 3.3 exemplifies how much information (‘big
data’) is hidden in the databases of regulatory agencies. Data mining may disclose many
interesting formulation development decisions. The case study with lactose showed how its
quantity is varied to specified extents without affecting the bioequivalence of the generic product.
This database research, perhaps supplemented by comparison of pharmacokinetic data, may be
helpful in increasing overall knowledge of excipient effects and be used to estimate safety levels
excipients. A limitation of this one-dimensional approach is the implicit assumption that the
excipients itself do not interact and that manufacturing steps have limited influence. Furthermore,
the database at regulatory agencies offers a view on approved, bioequivalent products. It would be
helpful if these data could be complemented by results on bioinequivalent products as available at
research centers.
Chitosan’s discovery has been attributed to Rouget in 1859 (177). A search in Pubmed including
‘chitosan’ as key word retrieves more than 14 000 publications. Still the results presented in
Sections 3.4 and 3.5 demonstrate how little we actually know about its effects after oral intake in
general and more specifically about its potential modulation of the bioavailability of acyclovir. The
outcome of the comparative bioavailability trial in Section 3.4 was not as foreseen, even though
the conditions were based on publications on chitosan’s in vitro effects on permeation of acyclovir
in a Caco-2 model. Publication of these studies might help reduce trial and error approaches with
the combination of acyclovir and chitosan by other researchers.
The results thus underline the continued relevance of the classical bottom-up approach while
developing a new formulation and estimating excipient effects. Application of biorelevant models
facilitates optimal substance and product understanding and consequential decision making.

Chapter 4 | General discussion
86
However, the application of models at the stage of drug discovery and development should not be
confused with the use of models for biowaiver purposes or for QC testing. Drug development aims
at promoting promising drug candidates or formulations to the next level of development and at
excluding only truly bad candidates. False negative outcomes are not favourable in this case as this
would exclude the wrong candidates, while a certain probability of false positives may be
acceptable if these can be identified at the next development stage. For biowaiver purposes or for
QC testing, however, it is critical that bioinequivalent formulations will not pass the test.
Discriminatory capacity is, thereby, more important than biopredictability.
Current regulatory guidance offers very limited possibilities to exempt from in vivo studies
(biowaiver) for BCS class 3 compounds like acyclovir in case of changes in excipient content.
Identification of a biorelevant model might offer new biowaiver options, as discussed below.
So far, a public, systematic approach to classify excipient effects and model outcomes is lacking.
Such an excipient-centered approach could include an evaluation of the characteristics of the
excipient, its effects on the physiological system of the GI tract and the relevance of this effect in
combination with specific APIs. Ideally, such a system would include standardized biorelevant test
models and criteria for evaluation of the obtained results covering all or most relevant mechanisms
by which an excipient could influence the bioavailability of an API. As Kostewicz et al. note it may
be valuable to invest in complex models at the beginning of drug development and apply more
simple modes for later stages (70).
Table 4.1 provides a simplified outline of such a toolbox. A systematic approach highlighting the
strengths and limitations of a justified set of models is recommended. The approach of a decision
tree in combination with a toolbox, resulting in a case by case selection of the most appropriate
test method, as suggested by Kostewicz et al for product development in general could be applied
in this context too.
Further evaluation and validation of the models in Section 3.5 is needed to determine their value
in drug development. The biorelevance of the models depends on the model characteristics and
on the applied conditions. The search for biorelevant media, for example, is ongoing. Guidance on
relevant dilution factors is also lacking. Concentration profiling to determine biorelevant luminal
concentrations is an interesting topic for further research in that context (232). Work on shearing
forces has further be reported as interesting topic for further research (70).
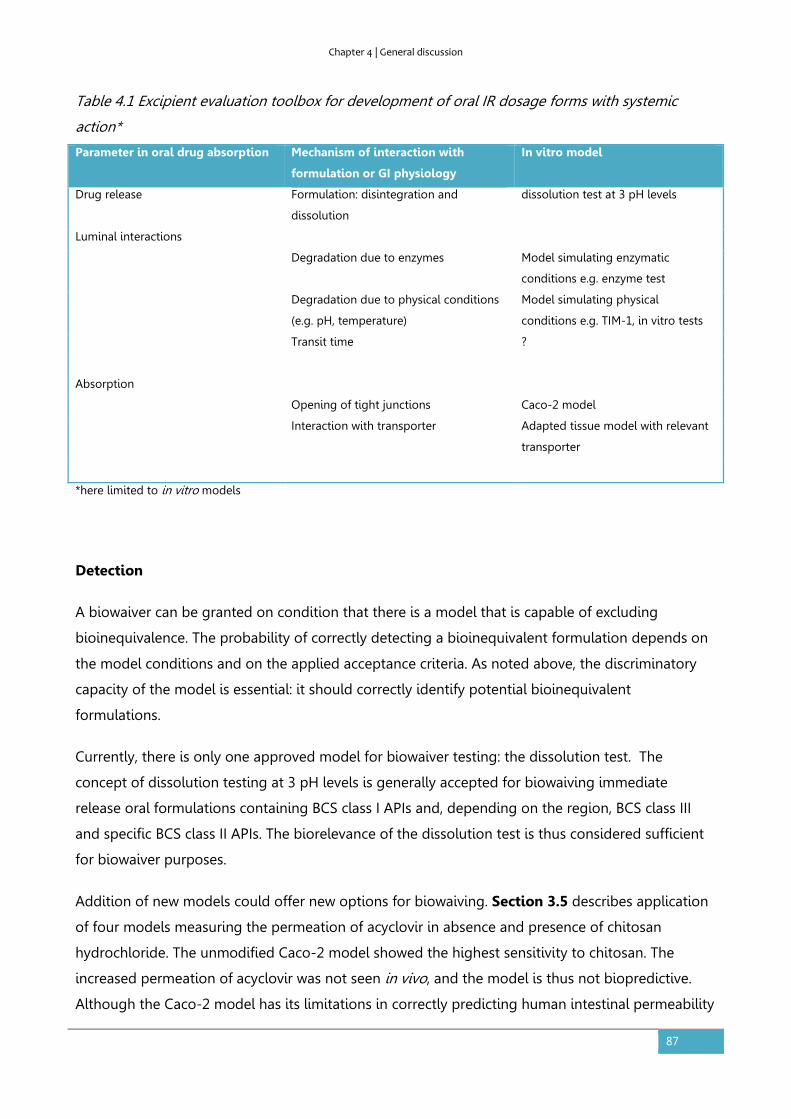
Chapter 4 | General discussion
87
Table 4.1 Excipient evaluation toolbox for development of oral IR dosage forms with systemic
action*
Parameter in oral drug absorption Mechanism of interaction with
formulation or GI physiology
In vitro model
Drug release Formulation: disintegration and
dissolution
dissolution test at 3 pH levels
Luminal interactions
Degradation due to enzymes Model simulating enzymatic
conditions e.g. enzyme test
Degradation due to physical conditions
(e.g. pH, temperature)
Model simulating physical
conditions e.g. TIM-1, in vitro tests
Transit time ?
Absorption
Opening of tight junctions Caco-2 model
Interaction with transporter Adapted tissue model with relevant
transporter
*here limited to in vitro models
Detection
A biowaiver can be granted on condition that there is a model that is capable of excluding
bioinequivalence. The probability of correctly detecting a bioinequivalent formulation depends on
the model conditions and on the applied acceptance criteria. As noted above, the discriminatory
capacity of the model is essential: it should correctly identify potential bioinequivalent
formulations.
Currently, there is only one approved model for biowaiver testing: the dissolution test. The
concept of dissolution testing at 3 pH levels is generally accepted for biowaiving immediate
release oral formulations containing BCS class I APIs and, depending on the region, BCS class III
and specific BCS class II APIs. The biorelevance of the dissolution test is thus considered sufficient
for biowaiver purposes.
Addition of new models could offer new options for biowaiving. Section 3.5 describes application
of four models measuring the permeation of acyclovir in absence and presence of chitosan
hydrochloride. The unmodified Caco-2 model showed the highest sensitivity to chitosan. The
increased permeation of acyclovir was not seen in vivo, and the model is thus not biopredictive.
Although the Caco-2 model has its limitations in correctly predicting human intestinal permeability
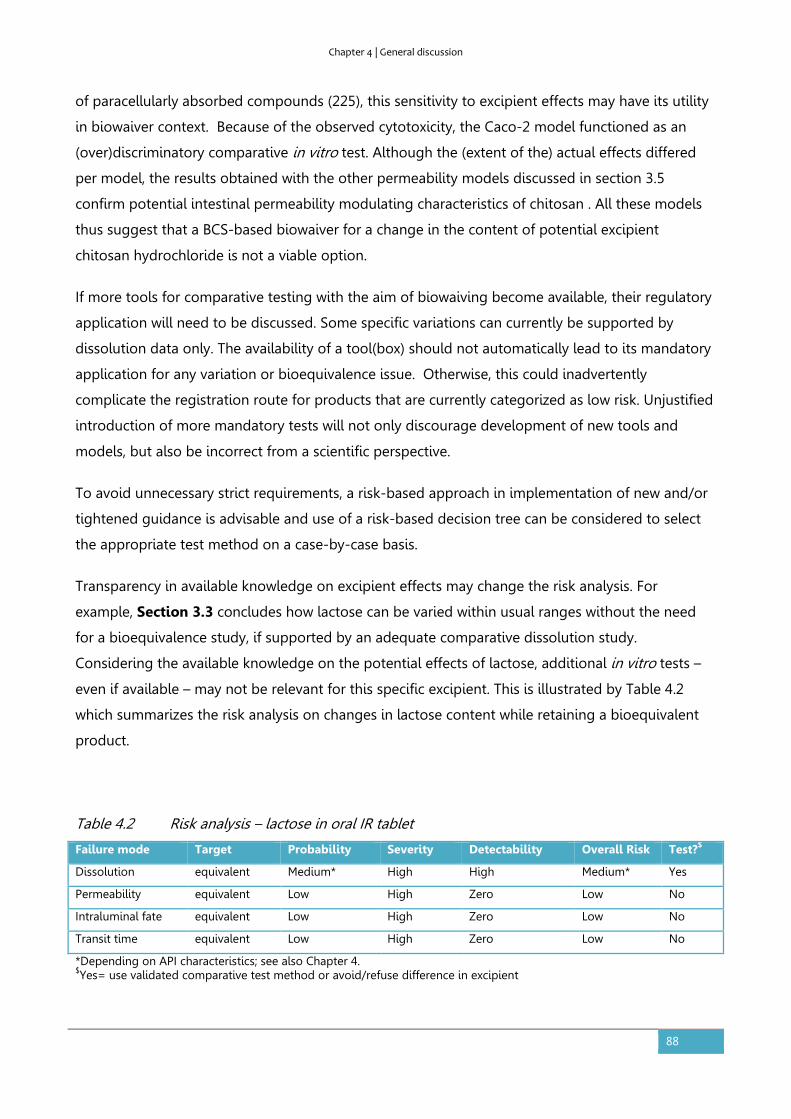
Chapter 4 | General discussion
88
of paracellularly absorbed compounds (225), this sensitivity to excipient effects may have its utility
in biowaiver context. Because of the observed cytotoxicity, the Caco-2 model functioned as an
(over)discriminatory comparative in vitro test. Although the (extent of the) actual effects differed
per model, the results obtained with the other permeability models discussed in section 3.5
confirm potential intestinal permeability modulating characteristics of chitosan . All these models
thus suggest that a BCS-based biowaiver for a change in the content of potential excipient
chitosan hydrochloride is not a viable option.
If more tools for comparative testing with the aim of biowaiving become available, their regulatory
application will need to be discussed. Some specific variations can currently be supported by
dissolution data only. The availability of a tool(box) should not automatically lead to its mandatory
application for any variation or bioequivalence issue. Otherwise, this could inadvertently
complicate the registration route for products that are currently categorized as low risk. Unjustified
introduction of more mandatory tests will not only discourage development of new tools and
models, but also be incorrect from a scientific perspective.
To avoid unnecessary strict requirements, a risk-based approach in implementation of new and/or
tightened guidance is advisable and use of a risk-based decision tree can be considered to select
the appropriate test method on a case-by-case basis.
Transparency in available knowledge on excipient effects may change the risk analysis. For
example, Section 3.3 concludes how lactose can be varied within usual ranges without the need
for a bioequivalence study, if supported by an adequate comparative dissolution study.
Considering the available knowledge on the potential effects of lactose, additional in vitro tests –
even if available – may not be relevant for this specific excipient. This is illustrated by Table 4.2
which summarizes the risk analysis on changes in lactose content while retaining a bioequivalent
product.
Table 4.2 Risk analysis – lactose in oral IR tablet
Failure mode Target Probability Severity Detectability Overall Risk Test?$
Dissolution equivalent Medium* High High Medium* Yes
Permeability equivalent Low High Zero Low No
Intraluminal fate equivalent Low High Zero Low No
Transit time equivalent Low High Zero Low No
*Depending on API characteristics; see also Chapter 4. $Yes= use validated comparative test method or avoid/refuse difference in excipient

Chapter 4 | General discussion
89
The chitosan case could have started by an initial risk evaluation as summarized in Table 4.3.a. With
the knowledge as obtained from the in vivo study and the results from the models, this risk
analysis can change to Table 4.3b.
Table 4.3a. Initial risk analysis – chitosan
Failure mode Target Probability Severity Detectability Overall
Risk
Test? $
Dissolution equivalent Zero# High N/A N/A No
Permeability equivalent High High Medium High Yes
Intraluminal fate equivalent Medium High Medium High Yes
Transit time equivalent Medium High Low High Yes $Yes= use validated comparative test method or avoid/refuse difference in excipient
Table 4.3b. Final risk analysis – chitosan
Failure mode Target Probability Severity Detectability Overall
Risk
Test? $
Dissolution equivalent Zero# High N/A N/A No
Permeability equivalent Medium High Medium Medium Yes
Intraluminal fate equivalent Low High Medium Medium Yes
Transit time equivalent Medium High Low High Yes # API was in solution $Yes= use validated comparative test method or avoid/refuse difference in excipient
Severity
In the above examples in Table 4.2 and 4.3.a/b, the severity has been ranked as high, independent
of the API. However, regulatory requirements not only need to consider reducing the probability of
incidence or non-detection as much as possible but also take account of the severity of the
potential bioinequivalence.
The severity of the possible bioinequivalence depends on the API. Improved access to safety
evaluations and therapeutic windows of APIs may help definition of specific acceptance criteria.
Section 3.2 provides an example of an API for which, depending on the criteria, a biowaiver may

Chapter 4 | General discussion
90
or may not be applied. Prednisolone’s usual doses would classify it as a BCS class I drug, while
strict adherence to the maximum administered dose – which is usually not intended for chronic use
- would rule out this option.
4.2. Regulatory perspective
The available guidance on biowaivers shows that EU and US regulators are in principle open to
submissions including adequate justification of full BCS based biowaivers or waivers in the context
of a change in composition of the product. For BCS class I biowaivers 'qualitative differences' are
acceptable, if appropriately justified and provided that those excipients that might affect the
bioavailability are qualitatively and quantitatively the same. In case of a change in composition,
'minor changes' in excipient content may be accepted based on dissolution data only i.e. without
addressing other steps in the absorption process. In such a case, the classification of the change as
'minor' is to be assessed on a case-by-case basis. To avoid the need for comparative testing of
each difference in composition and clarify the classification of changes as 'minor' or 'major’,
publication of information of the effects of specific excipients in combination with specific APIs
seems useful.
In Quality by design terminology, the quality target product profile includes ‘pharmacokinetics’ as
quality attribute with target ‘bioequivalent’ (i.e. .compliant with bioequivalence criteria’).
Dissolution may be identified as a critical quality attribute that determines the bioequivalence.
Factors like ‘permeability’, ‘intraluminal fate’ or ‘transit time’ are normally not mentioned as
(critical) quality attributes and no specific tests are included in the control strategy. Still, besides
the dissolution test, many other models and many relevant experience with excipient effects must
exist. Little of this knowledge obtained in drug development studies is currently translated into
regulatory guidance on excipients. Authorities may, therefore, seem unnecessary restrictive in the
acceptance of differences in excipients. However, it should also be noted that authorities do not
dispose of these, mostly confidential, company data and development of regulatory acceptable
models depends on the availability of public data and shared knowledge.
Regulatory agencies do have an archive of application files. However, just as pharmaceutical
industry focuses on bringing a product to the market, regulatory agencies are generally organized
and financed in a way to process individual application procedures. Although regulatory agencies
acknowledge the relevance of scientific research as illustrated by the implementation of the quality
by design concept and references such as the MEB’s website www.regulatoryscience.nl or the EMA’s
Chapter 4 | General discussion
91
logo (“science, medicine, health”), financial and organizational restrictions may not easily allow
time-consuming product-independent evaluation.
4.3. Overall evaluation and future perspectives
This thesis combines scientific evidence with regulatory reality on a topic that is part of public
discussion: generics. The idea was to support public health by reducing the regulatory burden of
new generic applications by identifying new biowaiver options. Application of the biowaiver
concept requires definitions and evaluation of acceptance criteria for the risk of bioinequivalence.
The perception of the risk associated with a biowaiver depends on the expertise and experiences of
the risk evaluator, e.g. as a scientist, regulator or patient. Considering the subjectivity of risk
assessments, a generally acceptable balance between increased uncertainty of bioequivalence and
the risk mitigation measures applied, can be difficult to define. However, all these potential
evaluators would benefit from increased understanding of excipient effects to improve or confirm
their assessment.
In general, increased transparency of available scientific data as well as regulatory decision-making
is encouraged. In addition, harmonization of evaluation criteria of BCS classification, biowaiver
access criteria, biowaiver test conditions and acceptance criteria as well as clarification of the
definition of narrow therapeutic index drugs would enhance insight in the regulatory possibilities.
This thesis also showed how the top-down and bottom-up approach may be of complementary
value in helping improve excipient understanding. New options for surrogate in vitro testing are
open for further research, while data mining may disclose available knowledge. Future research
may be used to consciously apply these approaches for individual excipients in relation to
biowaiver discussions.
Current international efforts joining industry and regulatory forces and aiming at improving the
understanding of oral drug absorption, development of biorelevant tools and optimization of the
use of the biopharmaceutic classification system (e.g. regulatory harmonization, consideration of
subclasses) may all contribute to optimization of the biowaiver concept. Although scientific
evidence is not always sufficient to establish or change regulatory guidance, this thesis provides
concepts that can help systematic extension of our knowledge and facilitate translation of this
evidence to regulatory science.

Chapter 5 | Summary
92
5. SUMMARY
5.1. Summary
For orally administered products with systemic action, the plasma profile of the active pharmaceutical
ingredient is generally considered as a measure of both efficacy and safety of the medicinal product. In
case of changes to an existing product or development of a generic version, confirmation of
equivalent plasma profiles is sought through a so-called bioequivalence study. Such an in vivo
bioequivalence study in human volunteers may be waived if there is sufficient in vitro evidence of the
equivalence of the test and reference products at issue. Biowaiver options depend on the characteristics
of the API and the formulation.
This thesis evaluates international (US, EU and WHO) regulatory conditions for biowaiving from a risk-
based perspective with the aim to identify new biowaiver options. Regional differences in biowaiver
conditions are obvious. Deviating definitions of the substance characteristic ‘solubility’ may have
important consequences for the required evidence to show bioequivalence of a generic product.
Harmonisation of the criteria as a common effort of authorities, academia and industry may facilitate
application of the biowaiver approach and thus reduce the number of human studies.
Understanding of the biopharmaceutic effects of excipients may extend biowaiver options. Lactose, for
example, is used in highly variable quantities in similar tablets and capsules in combination with APIs
from different BCS classes. In addition, an effect of lactose on other parameters than dissolution is not
known from literature. Therefore, a comparative in vitro dissolution study is considered sufficient to
support a change in lactose content if varied within the approved range.
The biopharmaceutic effects of potential excipient chitosan on the absorption of acyclovir were
explored both in humans and in several models. In a human study, chitosan showed a significant
negative effect on Cmax, Tmax and AUC of acyclovir. The effect of the same chitosan on acyclovir was then
tested in a bioaccessibility model as well as in four permeation models. The results showed potential
intestinal permeability modulating characteristics of chitosan. A BCS-based biowaiver for a change in
this potential excipient does thus not seem a viable option. Further studies are necessary to determine
the suitability of the models for application as a tool for biowaiver purposes.

Chapter 5 | Summary
93
5.2. Zusammenfassung
Bei peroral eingenommenen Arzneimitteln wird das Plasmakonzentrations-Zeit-Profil des aktiven
Stoffes im Allgemeinen als Maß für die Wirksamkeit und Sicherheit des Arzneimittels angesehen. Bei
Veränderungen an bestehenden Arzneimitteln oder der Entwicklung eines Generikums kann durch
Bioäquivalenzstudien an gesunden Probanden untersucht werden, ob das Plasmakonzentrations-Zeit-
Profil gleich bleibt. Auf eine solche Studie kann verzichtet werden (sog. Biowaiver), wenn ausreichend
bewiesen ist, dass das Test- und das Referenzprodukt in vitro äquivalent sind. Die Möglichkeit für einen
Biowaiver hängt von den Eigenschaften des aktives Stoffes und der Formulierung ab.
Die vorliegende Doktorarbeit untersucht die internationalen (US, EU und WHO) regulatorischen
Bedingungen für einen Biowaiver aus einer risikoorientierten Perspektive mit dem Ziel, neue
Möglichkeiten für einen Biowaiver zu identifizieren. Offensichtlich sind die Bedingungen für einen
Biowaiver weltweit verschieden. Unterschiedliche Definitionen der Löslichkeit eines Arzneistoffes
können entscheidende Konsequenzen haben für die Daten die für den Nachweis der Bioäquivalenz
nötig sind. Eine Harmonisierung der Kriterien durch die Zulassungsbehörden, akademische Welt und
Industrie könnte die Anwendung des Biowaiveransatzes vereinfachen und die Zahl der klinischen
Studien verringern.
Das Verständnis der biopharmazeutischen Effekten von Hilfsstoffen könnte die Möglichkeiten für einen
Biowaiver erweitern. Laktose wird zum Beispiel in sehr unterschiedlichen Mengen in vergleichbaren
Tabletten und Kapseln mit Arzneistoffen aus unterschiedlichen Klassen des Biopharmaceutics
Classification Systems (BCS) kombiniert. Daneben ist aus der Literatur bekannt, dass Laktose höchstens
einen Effekt auf die Freisetzung des aktiven Stoffes hat und nicht auf andere Parameter. Daher könnte
eine vergleichende In-vitro-Wirkstoff-Freisetzungsstudie ausreichend sein um eine Veränderung des
Laktosegehaltes im zugelassenen Bereich zu unterstützen.
Die Möglichkeiten der Anwendung von neuen Modellen für Biowaiver wurden anhand von Chitosan
untersucht. Chitosan ist bekannt als ein potentieller Modulator der intestinalen Absorption. In einer
klinischen Studie hatte Chitosan einen signifikant negativen Effekt auf auf die Maximalkonzentration
(Cmax), den Zeitpunkt ihres Auftretens (tmax) und die Fläche unter der Kurve (AUC) von Acyclovir. Der
Effekt der gleichen Chitosankonzentration wurde danach in einem Biozugänglichkeitmodell und in vier
Permeationsmodellen untersucht. Auch wenn die Ergebnisse variabel waren, wurde in allen
Permeationsmodellen bestätigt, dass Chitosan potentiell die intestinale Permeabilität beeinflussen
kann. Ein Biowaiver auf der Basis des biopharmazeutischen Klassifikationssystems ist daher nicht
gerechtfertigt bei einer Veränderung dieses Hilfsstoffes.

Chapter 5 | Summary
94
5.3. Samenvatting
Voor het op de markt brengen van een nieuw geneesmiddel moet de farmaceutische industrie
onderzoek doen naar werkzaamheid en veiligheid van het product. Dit onderzoek gebeurt eerst in
laboratoria en in dierproeven en daarna in mensen (klinische studies). Voor generieke (merkloze)
geneesmiddelen is het niet nodig dat alle klinische studies herhaald worden. En ook bij aanpassingen
van een bestaand geneesmiddel, bijvoorbeeld het wijzigen van een hulpstof, zijn niet volledig nieuwe
studies nodig. Voor geneesmiddelen die via de mond worden ingenomen en hun werking uitoefenen
via de bloedbaan, volstaat in zulke gevallen een onderzoek waarbij aangetoond wordt dat de
bloedspiegels gelijkwaardig zijn. Dit wordt een bioequivalentiestudie genoemd. Dergelijk onderzoek
wordt uitgevoerd in gezonde vrijwilligers die zowel het nieuwe product innemen als het bestaande
product.
In sommige gevallen is een bioequivalentiestudie niet nodig (biowaiver), maar volstaat een
vergelijkende laboratoriumtest. Dit proefschrift gaat over regelgeving rond biowaivers. Deze
regelgeving houdt het risico dat producten onterecht slagen voor de laboratoriumtest zo klein mogelijk
door strenge beperking van de mogelijke verschillen. De eisen die aan een biowaiver gesteld worden,
wijkenechter in Europa en de Verenigde Staten op een aantal punten van elkaar af. Om het nodeloos
uitvoeren van studies in mensen te verminderen, is het gewenst dat overheid en industrie hun krachten
bundelen om eenduidige, geharmoniseerde afspraken te maken.
De regelgeving biedt ruimte om nieuwe criteria en testmodellen te ontwikkelen die studies in mensen
kunnen vervangen, bijvoorbeeld als de producten verschillen in hulpstoffen. De criteria voor hulpstof
lactose zouden op grond van dit proefschrift verruimd kunnen worden. Uit de database van in
Nederland geregistreerde geneesmiddelen blijkt namelijk dat lactose in zeer diverse hoeveelheden
voorkomt in vergelijkbare tabletten en capsules. Als de toegepaste hoeveelheid binnen gebruikelijke
marges blijft, lijkt het daarom niet nodig een bioequivalentiestudie uit te voeren bij een verandering in
hoeveelheid lactose, maar kan worden volstaan met vergelijkende oplosbaarheidsstudies.
We hebben daarnaast de toepasbaarheid van een vijftal nieuwe modellen onderzocht aan de hand van
modelstof chitosan. Chitosan is een stof van natuurlijk oorsprong die de opname van geneesmiddelen
zou kunnen bevorderen. Uit onze studies in mensen blijkt dat de stof chitosan de bloedspiegels van
geneesmiddel acyclovir juist kan verlagen. Geen van de geteste modellen voorspelde de uitkomst van
de humane studie precies. Als er sprake is van een verschil in chitosan, is het daarom niet mogelijk om
de toegepaste laboratoriummodellen in te zetten ter vervanging van de studie in mensen. De resultaten
wijzen er juist op dat in dit geval een studie in mensen aan te bevelen is om het daadwerkelijke effect te
achterhalen.
Chapter 6 | References
95
6. REFERENCES
1. Code of Federal Regulations Title 21 §320.1. 2012, Available at: http://www.gpo.gov/fdsys/granule/CFR-2012-title21-vol5/CFR-2012-title21-vol5-part320. 2. Directive 2001/83/EC, as amended. Available at: http://ec.europa.eu/health/files/eudralex/vol-1/dir_2001_83_cons/dir2001_83_cons_20081230_en.pdf . 3. Chow S-C, Liu J-P. History of bioequivalence studies. In: Design and Analysis of Bioavailability and Bioequivalence Studies. Chapman and Hall/CRC Biostatistics Series, 2009; p. 3–8] 4. FDA. Abbreviated New Drug Application (ANDA): Generics. Available at: http://www.fda.gov/Drugs/DevelopmentApprovalProcess/HowDrugsareDevelopedandApproved/ApprovalApplications/AbbreviatedNewDrugApplicationANDAGenerics/default.htm . 5. FDA Questions and Answers on Generic Drugs. Available at: http://www.fda.gov/Drugs/ResourcesForYou/Consumers/QuestionsAnswers/ucm100100.htm 6. FDA. Orange Book: Approved Drug Products with Therapeutic Equivalence Evaluations. Available at: http://www.accessdata.fda.gov/scripts/cder/ob/default.cfm 7. European Medicines Agency. Guideline on the investigation of bioequivalence; CPMP/EWP/QWP/1401/98 Rev. 1/ Corr ** 2010. Available at: http://www.ema.europa.eu/docs/en_GB/document_library/Scientific_guideline/2010/01/WC500070039.pdf 8. FDA. Guidance for Industry. Waiver of In vivo Bioavailability and Bioequivalence Studies for Immediate-Release Solid Oral Dosage Forms Based on a Biopharmaceutics Classification System Available at: http://www.fda.gov/cder/guidance/index.htm. 9. Tannergren C, Borde A, Borestrom C, Abrahamsson B, Lindahl A. Evaluation of an in vitro faecal degradation method for early assessment of the impact of colonic degradation on colonic absorption in humans. Eur J Pharm Sci. 2014;57:200-6. 10. Leo A, Hansch C, Elkins D. Partition coefficients and their uses. Chemical Reviews. 1971;71(6):525-616. 11. Lipinski CA, Lombardo F, Dominy BW, Feeney PJ. Experimental and computational approaches to estimate solubility and permeability in drug discovery and development settings. Advanced Drug Delivery Reviews. 1997;23(1–3):3-25. 12. Bergström CAS, Holm R, Jørgensen SA, Andersson SBE, Artursson P, Beato S, et al. Early pharmaceutical profiling to predict oral drug absorption: Current status and unmet needs. European Journal of Pharmaceutical Sciences. 2014;57(0):173-99. 13. Amidon GL, Lennernas H, Shah VP, Crison JR. A theoretical basis for a biopharmaceutic drug classification: the correlation of in vitro drug product dissolution and in vivo bioavailability. Pharm Res. 1995;12(3):413-20. 14. Wu CY, Benet LZ. Predicting drug disposition via application of BCS: transport/absorption/ elimination interplay and development of a biopharmaceutics drug disposition classification system. Pharm Res. 2005;22(1):11-23. 15. Benet LZ, Amidon GL, Barends DM, Lennernas H, Polli JE, Shah VP, et al. The use of BDDCS in classifying the permeability of marketed drugs. Pharm Res. 2008;25(3):483-8. 16. Benet LZ. The role of BCS (biopharmaceutics classification system) and BDDCS (biopharmaceutics drug disposition classification system) in drug development. J Pharm Sci. 2013;102(1):34-42. 17. Zhao C, Jain A, Hailemariam L, Suresh P, Akkisetty P, Joglekar G, et al. Toward intelligent decision support for pharmaceutical product development. J Pharm Innov. 2006;1(1):23-35. 18. Ku MS. Use of the Biopharmaceutical Classification System in early drug development. Aaps j. 2008;10(1):208-12. 19. Byrn S, Pfeiffer R, Ganey M, Hoiberg C, Poochikian G. Pharmaceutical solids: a strategic approach to regulatory considerations. Pharm Res. 1995;12(7):945-54. 20. Huang L-F, Tong W-Q. Impact of solid state properties on developability assessment of drug candidates. Advanced Drug Delivery Reviews. 2004;56(3):321-34.

Chapter 6 | References
96
21. Wilson AG, Nouraldeen A, Gopinathan S. A new paradigm for improving oral absorption of drugs in discovery: role of physicochemical properties, different excipients and the pharmaceutical scientist. Future medicinal chemistry. 2010;2(1):1-5. 22. Butler JM, Dressman JB. The developability classification system: Application of biopharmaceutics concepts to formulation development. Journal of Pharmaceutical Sciences. 2010;99(12):4940-54. 23. Announcement of various conferences on Manufacturing Classification System at http://www.apsgb.co.uk Last accessed on 21 November 2014 24. Bharate SS, Bharate SB, Bajaj AN. Interactions and incompatibilities of pharmaceutical excipients with active pharmaceutical ingredients: A comprehensive review. Journal of Excipients and Food Chemicals. 2010;1(3):3-26. 25. Panakanti R, Narang AS. Impact of excipient interactions on drug bioavailability from solid dosage forms. Pharmaceutical research. 2012;29(10):2639-59. 26. Sjogren E, Abrahamsson B, Augustijns P, Becker D, Bolger MB, Brewster M, et al. In vivo methods for drug absorption - comparative physiologies, model selection, correlations with in vitro methods (IVIVC), and applications for formulation/API/excipient characterization including food effects. Eur J Pharm Sci. 2014;57:99-151. 27. Singhal D, Curatolo W. Drug polymorphism and dosage form design: a practical perspective. Advanced drug delivery reviews. 2004;56(3):335-47. 28. Telang C, Mujumdar S, Mathew M. Improved physical stability of amorphous state through acid base interactions. Journal of pharmaceutical sciences. 2009;98(6):2149-59. 29. Vialpando M, Aerts A, Persoons J, Martens J, Van Den Mooter G. Evaluation of ordered mesoporous silica as a carrier for poorly soluble drugs: influence of pressure on the structure and drug release. Journal of pharmaceutical sciences. 2011;100(8):3411-20. 30. Hannula AM, Marvola M, Rajamaeki M, Ojantakanen S. Effects of pH regulators used as additives on the bioavailability of ibuprofen from hard gelatin capsules. European journal of drug metabolism and pharmacokinetics. 1991;Spec No 3:221-7. 31. Davis SS. Formulation strategies for absorption windows. Drug Discov Today. 2005;10(4):249-57. 32. Prajapati VD, Jani GK, Khutliwala TA, Zala BS. Raft forming system-An upcoming approach of gastroretentive drug delivery system. Journal of controlled release : official journal of the Controlled Release Society. 2013. 33. Davidovich-Pinhas M, Bianco-Peled H. Mucoadhesion: A review of characterization techniques. Expert Opinion on Drug Delivery. 2010;7(2):259-71. 34. Ahmed IS, Ayres JW. Bioavailability of riboflavin from a gastric retention formulation. International journal of pharmaceutics. 2007;330(1-2):146-54. 35. Marvola M, Nykanen S, Nokelainen M. Bioavailability of erythromycin acistrate from hard gelatin capsules containing sodium bicarbonate. Pharm Res. 1991;8(8):1056-8. 36. Christiansen A, Backensfeld T, Denner K, Weitschies W. Effects of non-ionic surfactants on cytochrome P450-mediated metabolism in vitro. Eur J Pharm Biopharm. 2011;78(1):166-72. 37. Rao Z, Si L, Guan Y, Pan H, Qiu J, Li G. Inhibitive effect of cremophor RH40 or tween 80-based self-microemulsiflying drug delivery system on cytochrome P450 3A enzymes in murine hepatocytes. Journal of Huazhong University of Science and Technology Medical sciences. 2010;30(5):562-8. 38. Ren X, Mao X, Cao L, Xue K, Si L, Qiu J, et al. Nonionic surfactants are strong inhibitors of cytochrome P450 3A biotransformation activity in vitro and in vivo. Eur J Pharm Sci. 2009;36(4-5):401-11. 39. Tompkins L, Lynch C, Haidar S, Polli J, Wang H. Effects of commonly used excipients on the expression of CYP3A4 in colon and liver cells. Pharm Res. 2010;27(8):1703-12. 40. Ren X, Mao X, Si L, Cao L, Xiong H, Qiu J, et al. Pharmaceutical excipients inhibit cytochrome P450 activity in cell free systems and after systemic administration. Eur J Pharm Biopharm. 2008;70(1):279-88. 41. Wandel C, Kim RB, Stein CM. "Inactive" excipients such as Cremophor can affect in vivo drug disposition. Clin Pharmacol Ther. 2003;73(5):394-6. 42. Bravo Gonzalez RC, Huwyler J, Walter I, Mountfield R, Bittner B. Improved oral bioavailability of cyclosporin A in male Wistar rats. Comparison of a Solutol HS 15 containing self-dispersing formulation and a microsuspension. Int J Pharm. 2002;245(1-2):143-51.

Chapter 6 | References
97
43. Bittner B, Guenzi A, Fullhardt P, Zuercher G, Gonzalez RC, Mountfield RJ. Improvement of the bioavailability of colchicine in rats by co-administration of D-alpha-tocopherol polyethylene glycol 1000 succinate and a polyethoxylated derivative of 12-hydroxy-stearic acid. Arzneimittel-Forschung. 2002;52(9):684-8. 44. Nassar T, Rom A, Nyska A, Benita S. A novel nanocapsule delivery system to overcome intestinal degradation and drug transport limited absorption of P-glycoprotein substrate drugs. Pharm Res. 2008;25(9):2019-29. 45. De Koninck P, Archambault D, Hamel F, Sarhan F, Mateescu MA. Carboxymethyl-starch excipients for gastrointestinal stable oral protein formulations containing protease inhibitors. J Pharm Pharm Sci. 2010;13(1):78-92. 46. Challa R, Ahuja A, Ali J, Khar RK. Cyclodextrins in drug delivery: an updated review. AAPS PharmSciTech. 2005;6(2):E329-57. 47. Adkin DA, Davis SS, Sparrow RA, Huckle PD, Phillips AJ, Wilding IR. The effects of pharmaceutical excipients on small intestinal transit. Br J Clin Pharmacol. 1995;39(4):381-7. 48. Adkin DA, Davis SS, Sparrow RA, Huckle PD, Wilding IR. The effect of mannitol on the oral bioavailability of cimetidine. J Pharm Sci. 1995;84(12):1405-9. 49. Salminen EK, Salminen SJ, Porkka L, Kwasowski P, Marks V, Koivistoinen PE. Xylitol vs glucose: effect on the rate of gastric emptying and motilin, insulin, and gastric inhibitory polypeptide release. The American journal of clinical nutrition. 1989;49(6):1228-32. 50. Staniforth DH. Comparison of orocaecal transit times assessed by the lactulose/breath hydrogen and the sulphasalazine/sulphapyridine methods. Gut. 1989;30(7):978-82. 51. Read NW, Cammack J, Edwards C, Holgate AM, Cann PA, Brown C. Is the transit time of a meal through the small intestine related to the rate at which it leaves the stomach? Gut. 1982;23(10):824-8. 52. Pilichiewicz AN, Little TJ, Brennan IM, Meyer JH, Wishart JM, Otto B, et al. Effects of load, and duration, of duodenal lipid on antropyloroduodenal motility, plasma CCK and PYY, and energy intake in healthy men. American journal of physiology Regulatory, integrative and comparative physiology. 2006;290(3):R668-77. 53. Martinez V, Jimenez M, Gonalons E, Vergara P. Intraluminal lipids modulate avian gastrointestinal motility. The American journal of physiology. 1995;269(2 Pt 2):R445-52. 54. Dobson CL, Davis SS, Chauhan S, Sparrow RA, Wilding IR. The effect of oleic acid on the human ileal brake and its implications for small intestinal transit of tablet formulations. Pharm Res. 1999;16(1):92-6. 55. Swenson ES, Milisen WB, Curatolo W. Intestinal permeability enhancement: efficacy, acute local toxicity, and reversibility. Pharm Res. 1994;11(8):1132-42. 56. Takatsuka S, Morita T, Horikiri Y, Yamahara H, Saji H. Influence of various combinations of mucolytic agent and non-ionic surfactant on intestinal absorption of poorly absorbed hydrophilic compounds. Int J Pharm. 2008;349(1-2):94-100. 57. Takatsuka S, Morita T, Koguchi A, Horikiri Y, Yamahara H, Yoshino H. Synergistic absorption enhancement of salmon calcitonin and reversible mucosal injury by applying a mucolytic agent and a non-ionic surfactant. Int J Pharm. 2006;316(1-2):124-30. 58. Ross BP, Toth I. Gastrointestinal absorption of heparin by lipidization or coadministration with penetration enhancers. Curr Drug Deliv. 2005;2(3):277-87. 59. Cano-Cebrian MJ, Zornoza T, Granero L, Polache A. Intestinal absorption enhancement via the paracellular route by fatty acids, chitosans and others: a target for drug delivery. Curr Drug Deliv. 2005;2(1):9-22. 60. Salama NN, Eddington ND, Fasano A. Tight junction modulation and its relationship to drug delivery. Advanced drug delivery reviews. 2006;58(1):15-28. 61. Goole J, Lindley DJ, Roth W, Carl SM, Amighi K, Kauffmann JM, et al. The effects of excipients on transporter mediated absorption. Int J Pharm. 2010;393(1-2):17-31. 62. Grube S, Langguth P. Excipients as modulators of drug-carrier mediated absorption in the intestine, in: Mashkevich, B.O. (Ed.), Drug Delivery Research Advances. Nova Science Publishers, New York; 2007.

Chapter 6 | References
98
63. Guan S, Qin X, Zhou Z, Zhang Q, Huang Y. Investigation of the mechanisms of improved oral bioavailability of bergenin using bergenin-phospholipid complex. Drug development and industrial pharmacy. 2013. 64. Butler J, Augustijns P. WP2 In vitro tools: understanding the formulation - Overview Presentation at Stevenage May 2014 Available at: http://www.orbitoproject.eu/ Last accessed on 21 November 2014. 65. Announcement of: In vivo Predictive Dissolution Conference. August 2014; University of Michigan, Available at: https://pharmacy.umich.edu/invivodissolution Last accessed on 21 November 2014. 66. Amidon GL. The New Science of (Oral) Bioequivalence: In Vivo Predictive Dissolution (IPD) May 2014 Available at:: http://www.fda.gov/downloads/ForIndustry/UserFees/GenericDrugUserFees/UCM398883.pdf Last accessed on 4 December 2015. 67. Reppas C, Friedel HD, Barker AR, Buhse LF, Cecil TL, Keitel S, et al. Biorelevant in vitro performance testing of orally administered dosage forms - Workshop report. Pharm Res. 2014;31(7):1867-76. 68. Tsume Y, Mudie DM, Langguth P, Amidon GE, Amidon GL. The Biopharmaceutics Classification System: subclasses for in vivo predictive dissolution (IPD) methodology and IVIVC. Eur J Pharm Sci. 2014;57:152-63. 69. Lennernäs H, Aarons L, Augustijns P, Beato S, Bolger M, Box K, et al. Oral biopharmaceutics tools – Time for a new initiative – An introduction to the IMI project OrBiTo. European Journal of Pharmaceutical Sciences. 2014;57(0):292-9. 70. Kostewicz ES, Abrahamsson B, Brewster M, Brouwers J, Butler J, Carlert S, et al. In vitro models for the prediction of in vivo performance of oral dosage forms. Eur J Pharm Sci. 2014;57:342-66. 71. van der Meersch A, Dechartres A, Ravaud P. Quality of reporting of bioequivalence trials comparing generic to brand name drugs: a methodological systematic review. PloS one. 2011;6(8):e23611. 72. Ramirez E, Laosa O, Guerra P, Duque B, Mosquera B, Borobia AM, et al. Acceptability and characteristics of 124 human bioequivalence studies with active substances classified according to the Biopharmaceutic Classification System. Br J Clin Pharmacol. 2010;70(5):694-702. 73. Lamouche S, Leonard H, Shink É, Tanguay M. The Biopharmaceutical Classification System: Can it Help Predict Bioequivalence Outcome? A CRO Retrospective Analysis. AAPS Journal. 2008;10(S2). 74. Cristofoletti R, Chiann C, Dressman JB, Storpirtis S. A comparative analysis of biopharmaceutics classification system and biopharmaceutics drug disposition classification system: A cross-sectional survey with 500 bioequivalence studies. J Pharm Sci. 2013;102(9):3136-44. 75. Tsume Y, Langguth P, Garcia-Arieta A, Amidon GL. In silico prediction of drug dissolution and absorption with variation in intestinal pH for BCS class II weak acid drugs: ibuprofen and ketoprofen. Biopharm Drug Dispos. 2012;33(7):366-77. 76. Alvarez C, Nunez I, Torrado JJ, Gordon J, Potthast H, Garcia-Arieta A. Investigation on the possibility of biowaivers for ibuprofen. J Pharm Sci. 2011;100(6):2343-9. 77. Nair AK, Anand O, Chun N, Conner DP, Mehta MU, Nhu DT, et al. Statistics on BCS classification of generic drug products approved between 2000 and 2011 in the USA. AAPS Journal. 2012;14(4):664-6. 78. European Medecines Agency. Concept paper on BCS based biowaiver. EMEA/CHMP/EWP/213035/2007 2007. Available at: http://www.ema.europa.eu/docs/en_GB/document_library/Scientific_guideline/2009/09/WC500003010.pdf 79. Dressman JB, Amidon GL, Reppas C, Shah VP. Dissolution testing as a prognostic tool for oral drug absorption: immediate release dosage forms. Pharm Res. 1998;15(1):11-22. 80. FIP biowaiver monographs. Accessible through: http://www.fip.org/bcs_monographs/ 81. Goyanes A, Souto C, Martinez-Pacheco R. A comparison of chitosan-silica and sodium starch glycolate as disintegrants for spheronized extruded microcrystalline cellulose pellets. Drug Dev Ind Pharm. 2011;37(7):825-31. 82. Brewster ME, Loftsson T. Cyclodextrins as pharmaceutical solubilizers. Adv Drug Deliv Rev. 2007;59(7):645-66. 83. Mura P, Zerrouk N, Mennini N, Maestrelli F, Chemtob C. Development and characterization of naproxen-chitosan solid systems with improved drug dissolution properties. Eur J Pharm Sci. 2003;19(1):67-75.

Chapter 6 | References
99
84. Rege BD, Yu LX, Hussain AS, Polli JE. Effect of common excipients on Caco-2 transport of low-permeability drugs. J Pharm Sci. 2001;90(11):1776-86. 85. Chen ML, Straughn AB, Sadrieh N, Meyer M, Faustino PJ, Ciavarella AB, et al. A modern view of excipient effects on bioequivalence: case study of sorbitol. Pharm Res. 2007;24(1):73-80. 86. Ashiru DA, Patel R, Basit AW. Polyethylene glycol 400 enhances the bioavailability of a BCS class III drug (ranitidine) in male subjects but not females. Pharm Res. 2008;25(10):2327-33. 87. International Conference on Harmonisation. Quality Risk Management Q9; 2005. Available at: www.ich.org. 88. Sidor L, Lewus P. Using risk analysis in process validation. BioPharm International. 2007;20(2):50-7. 89. Gupta E, Barends DM, Yamashita E, Lentz KA, Harmsze AM, Shah VP, et al. Review of global regulations concerning biowaivers for immediate release solid oral dosage forms. Eur J Pharm Sci. 2006;29(3-4):315-24. 90. Food and Drug Administration. Guidance for Industry: Waiver of In Vivo Bioavailability and Bioequivalence Studies for Immediate-Release Solid Oral Dosage Forms Based on a Biopharmaceutics Classification System. 2000. Available at: http://www.fda.gov . 91. World Health Organisation. Multisource (generic) pharmaceutical products: guidelines on registration requirements to establish interchangeability. 2006. Available at: http://whqlibdoc.who.int/trs/WHO_TRS_937_eng.pdf/ 92. International Pharmaceutical Federation. Biowaiver monographs 2004-2012, 2012. Available at: http://www.fip.org /. 93. Potthast H, Dressman JB, Junginger HE, Midha KK, Oeser H, Shah VP, et al. Biowaiver monographs for immediate release solid oral dosage forms: ibuprofen. J Pharm Sci. 2005;94(10):2121-31. 94. Shohin IE, Kulinich JI, Vasilenko GF, Ramenskaya GV. Interchangeability evaluation of multisource Ibuprofen drug products using biowaiver procedure. Indian J Pharm Sci. 2011;73(4):443-6. 95. Amidon KS, Langguth P, Lennernas H, Yu L, Amidon GL. Bioequivalence of oral products and the biopharmaceutics classification system: science, regulation, and public policy. Clin Pharmacol Ther. 2011;90(3):467-70. 96. FDA, Inactive Ingredient Search for Approved Drug Products. Available at: http://www.accessdata.fda.gov/scripts/cder/iig/index.cfm/ Last accessed on 9 November 2012. 97. Japan, Ministry of Health Labour and Welfare. Guideline for Bioequivalence Studies of Generic Products. 2006. Available at: http://www.nihs.go.jp/drug/be-guide(e)/be2006e.pdf Last accessed on 9 November 2012. 98. Benet LZ, Larregieu CA. The FDA should eliminate the ambiguities in the current BCS biowaiver guidance and make public the drugs for which BCS biowaivers have been granted. Clin Pharmacol Ther. 2010;88(3):405-7. 99. Barthe L, Woodley J, Houin G. Gastrointestinal absorption of drugs: methods and studies. Fundamental & Clinical Pharmacology. 1999;13(2):154-68. 100. Blanquet S, Zeijdner E, Beyssac E, Meunier JP, Denis S, Havenaar R, et al. A dynamic artificial gastrointestinal system for studying the behavior of orally administered drug dosage forms under various physiological conditions. Pharm Res. 2004;21(4):585-91. 101. Versantvoort CHM, Rompelberg CJM, Sips AJAM. Methodologies to study human intestinal absorption. A review. RIVM rapport. Bilthoven: Rijksinstituut voor Volksgezondheid en Milieu, 2000 630030001. 102. Polli JE, Cook JA, Davit BM, Dickinson PA, Argenti D, Barbour N, et al. Summary workshop report: facilitating oral product development and reducing regulatory burden through novel approaches to assess bioavailability/bioequivalence. Aaps J. 2012;14(3):627-38. 103. European Medicines Agency, Committee for Medicinal Products for Human Use. 2001. Note for guidance on the investigation of bioavailability and bioequivalence. Available at: http://www.ema.europa.eu/docs/en_GB/document_library/Scientific_guideline/2009/09/WC500003519.pdf . 104. WHO. Proposal to waive in vivo bioequivalence requirements for WHO Model List of Essential Medicines immediate-release, solid oral dosage forms. Annex 8 of WHO Expert Committee on specifications

Chapter 6 | References
100
for pharmaceutical preparations. 2006: Available at: http://apps.who.int/prequal/info_general/documents/TRS937/WHO_TRS_937__annex8_eng.pdf . 105. Arnal J, Gonzalez-Alvarez I, Bermejo M, Amidon GL, Junginger HE, Kopp S, et al. Biowaiver monographs for immediate release solid oral dosage forms: aciclovir. Journal of Pharmaceutical Sciences. 2008;97(12):5061-73. 106. Vogelpoel H, Welink J, Amidon GL, Junginger HE, Midha KK, Moller H, et al. Biowaiver monographs for immediate release solid oral dosage forms based on biopharmaceutics classification system (BCS) literature data: Verapamil hydrochloride, propranolol hydrochloride, and atenolol. J Pharm Sci. 2004;93(8):1945-56. 107. Granero GE, Longhi MR, Mora MJ, Junginger HE, Midha KK, Shah VP, et al. Biowaiver monographs for immediate release solid oral dosage forms: furosemide. J Pharm Sci. 2010;99(6):2544-56. 108. Jantratid E, Prakongpan S, Dressman JB, Amidon GL, Junginger HE, Midha KK, et al. Biowaiver monographs for immediate release solid oral dosage forms: cimetidine. J Pharm Sci. 2006;95(5):974-84. 109. Kortejarvi H, Yliperttula M, Dressman JB, Junginger HE, Midha KK, Shah VP, et al. Biowaiver monographs for immediate release solid oral dosage forms: ranitidine hydrochloride. J Pharm Sci. 2005;94(8):1617-25. 110. Olivera ME, Manzo RH, Junginger HE, Midha KK, Shah VP, Stavchansky S, et al. Biowaiver monographs for immediate release solid oral dosage forms: ciprofloxacin hydrochloride. J Pharm Sci. 2011;100(1):22-33. 111. Strauch S, Jantratid E, Dressman JB, Junginger HE, Kopp S, Midha KK, et al. Biowaiver monographs for immediate release solid oral dosage forms: lamivudine. J Pharm Sci. 2011;100(6):2054-63. 112. Koeppe MO, Cristofoletti R, Fernandes EF, Storpirtis S, Junginger HE, Kopp S, et al. Biowaiver monographs for immediate release solid oral dosage forms: levofloxacin. J Pharm Sci. 2011;100(5):1628-36. 113. Kalantzi L, Reppas C, Dressman JB, Amidon GL, Junginger HE, Midha KK, et al. Biowaiver monographs for immediate release solid oral dosage forms: Acetaminophen (paracetamol). J Pharm Sci. 2006;95(1):4-14. 114. Verbeeck RK, Junginger HE, Midha KK, Shah VP, Barends DM. Biowaiver monographs for immediate release solid oral dosage forms based on biopharmaceutics classification system (BCS) literature data: chloroquine phosphate, chloroquine sulfate, and chloroquine hydrochloride. J Pharm Sci. 2005;94(7):1389-95. 115. Jantratid E, Strauch S, Becker C, Dressman JB, Amidon GL, Junginger HE, et al. Biowaiver monographs for immediate release solid oral dosage forms: Doxycycline hyclate. J Pharm Sci. 2010;99(4):1639-53. 116. Becker C, Dressman JB, Amidon GL, Junginger HE, Kopp S, Midha KK, et al. Biowaiver monographs for immediate release solid oral dosage forms: ethambutol dihydrochloride. J Pharm Sci. 2008;97(4):1350-60. 117. Becker C, Dressman JB, Amidon GL, Junginger HE, Kopp S, Midha KK, et al. Biowaiver monographs for immediate release solid oral dosage forms: Isoniazid. J Pharm Sci. 2007;96(3):522-31. 118. Rediguieri CF, Porta V, DS GN, Nunes TM, Junginger HE, Kopp S, et al. Biowaiver monographs for immediate release solid oral dosage forms: metronidazole. J Pharm Sci. 2011;100(5):1618-27. 119. Becker C, Dressman JB, Amidon GL, Junginger HE, Kopp S, Midha KK, et al. Biowaiver monographs for immediate release solid oral dosage forms: Pyrazinamide. J Pharm Sci. 2008. 120. Grube S, Langguth P, Junginger HE, Kopp S, Midha KK, Shah VP, et al. Biowaiver monographs for immediate release solid oral dosage forms: quinidine sulfate. J Pharm Sci. 2009;98(7):2238-51. 121. Chuasuwan B, Binjesoh V, Polli JE, Zhang H, Amidon GL, Junginger HE, et al. Biowaiver monographs for immediate release solid oral dosage forms: Diclofenac sodium and diclofenac potassium. J Pharm Sci. 2008. 122. Strauch S, Jantratid E, Dressman JB, Junginger HE, Kopp S, Midha KK, et al. Biowaiver monographs for immediate release solid oral dosage forms: mefloquine hydrochloride. J Pharm Sci. 2011;100(1):11-21. 123. Vogt M, Derendorf H, Kramer J, Junginger HE, Midha KK, Shah VP, et al. Biowaiver monographs for immediate release solid oral dosage forms: Prednisone. J Pharm Sci. 2007;96(6):1480-9. 124. Becker C, Dressman JB, Junginger HE, Kopp S, Midha KK, Shah VP, et al. Biowaiver monographs for immediate release solid oral dosage forms: rifampicin. J Pharm Sci. 2009;98(7):2252-67. 125. Manzo RH, Olivera ME, Amidon GL, Shah VP, Dressman JB, Barends DM. Biowaiver monographs for immediate release solid oral dosage forms: amitriptyline hydrochloride. J Pharm Sci. 2006;95(5):966-73. 126. Granero GE, Longhi MR, Becker C, Junginger HE, Kopp S, Midha KK, et al. Biowaiver monographs for immediate release solid oral dosage forms: Acetazolamide. J Pharm Sci. 2008.

Chapter 6 | References
101
127. Stosik AG, Junginger HE, Kopp S, Midha KK, Shah VP, Stavchansky S, et al. Biowaiver monographs for immediate release solid oral dosage forms: Metoclopramide hydrochloride. J Pharm Sci. 2008:97(9):3700-8. 128. Vogt M, Derendorf H, Kramer J, Junginger HE, Midha KK, Shah VP, et al. Biowaiver monographs for immediate release solid oral dosage forms: prednisolone. J Pharm Sci. 2007;96(1):27-37. 129. Strauch S, Dressman JB, Shah VP, Kopp S, Polli JE, Barends DM. Biowaiver monographs for immediate-release solid oral dosage forms: quinine sulfate. J Pharm Sci. 2012;101(2):499-508. 130. European Medicines Agency, Committee for Medicinal Products for Human Use. Overview of comments received on the draft guideline on the investigation of bioequivalence. 2010. CPMP/EWP/QWP/1401/98 rev. 1, Available at: www.ema.europa.eu , Last accessed on: May 31, 2013.. 131. Adkin DA, Davis SS, Sparrow RA, Huckle PD, Phillips AJ, Wilding IR. The effect of different concentrations of mannitol in solution on small intestinal transit: implications for drug absorption. Pharm Res. 1995;12(3):393-6. 132. Könnecke T, Moddelmog G, Langguth P. Influence of different directly compressible mannnitol grades on dissolution of low soluble fenofibrate. AAPS Annual Meeting, San Diego, CA, 11.-15. November2007. 133. Grube S, Wolfrum U, Langguth P. Characterization of the epithelial permeation enhancing effect of basic butylated methacrylate copolymer--in vitro studies. Biomacromolecules. 2008;9(5):1398-405. 134. Buch P, Holm P, Thomassen JQ, Scherer D, Branscheid R, Kolb U, et al. IVIVC for fenofibrate immediate release tablets using solubility and permeability as in vitro predictors for pharmacokinetics. Journal of pharmaceutical sciences. 2010;99(10):4427-36. 135. Buch P, Holm P, Thomassen JQ, Scherer D, Kataoka M, Yamashita S, et al. IVIVR in oral absorption for fenofibrate immediate release tablets using dissolution and dissolution permeation methods. Pharmazie. 2011;66(1):11-6. 136. Chen ML, Sadrieh N, Yu L. Impact of osmotically active excipients on bioavailability and bioequivalence of BCS class III drugs. Aaps j. 2013;15(4):1043-50. 137. Heinen C, Reuss S, Saaler-Reinhardt S, Langguth P. Mechanistic basis for unexpected bioavailability enhancement of polyelectrolyte complexes incorporating BCS class III drugs and carrageenans. Eur J Pharm Biopharm. 2013;85(1):26-33. 138. Heinen CA, Reuss S, Amidon GL, Langguth P. Ion Pairing with Bile Salts Modulates Intestinal Permeability and Contributes to Food-Drug Interaction of BCS Class III Compound Trospium Chloride. Mol Pharm. 2013;10(11):3989-96. 139. Gamble JF, Chiu WS, Gray V, Toale H, Tobyn M, Wu Y. Investigation into the degree of variability in the solid-state properties of common pharmaceutical excipients-anhydrous lactose. AAPS PharmSciTech. 2010;11(4):1552-7. 140. Vromans H, Bolhuis GK, Lerk CF, van de Biggelaar H, Bosch H. Studies on tableting properties of lactose. VII. The effect of variations in primary particle size and percentage of amorphous lactose in spray dried lactose products. International Journal of Pharmaceutics. 1987;35(1-2):29-37. 141. Wang T, Alston KM, Wassgren CR, Mockus L, Catlin AC, Fernando SR, et al. The creation of an excipient properties database to support quality by design (QbD) formulation development. American Pharmaceutical Review. 2013;16(4). 142. Rowe RC, Sheskey PJ, Owen SC. Handbook of Pharmaceutical Excipients. 5th ed: Pharmaceutical Press; 2006. 143. Allahham A, Stewart PJ. Enhancement of the dissolution of indomethacin in interactive mixtures using added fine lactose. European Journal of Pharmaceutics and Biopharmaceutics. 2007;67(3):732-42. 144. Mauludin R, Pamudji JS, Ruyanti D. Dissolution improvement of ketoprofen tablets by solid dispersion method. Asian Journal of Pharmaceutical and Clinical Research. 2011;4(4):119-24. 145. Saffoon N, Jhanker YM, Huda NH. Dissolution profile of ibuprofen solid dispersion prepared with cellulosic polymers and sugar by fusion method. Stamford Journal of Pharmaceutical Sciences. 2011;4(1):31-7. 146. Vogt M, Kunath K, Dressman JB. Dissolution improvement of four poorly water soluble drugs by cogrinding with commonly used excipients. European Journal of Pharmaceutics and Biopharmaceutics. 2008;68(2):330-7.
Chapter 6 | References
102
147. Sanganwar GP, Sathigari S, Babu RJ, Gupta RB. Simultaneous production and co-mixing of microparticles of nevirapine with excipients by supercritical antisolvent method for dissolution enhancement. European Journal of Pharmaceutical Sciences. 2010;39(1-3):164-74. 148. Brown W, McGinn M, Polli JE, Parr A, Yu L. Biowaiversfor BCS Class III Drugs http://www.pqri.org/workshops/Conf0912/imagespdfs/Posters/BCS_poster_PQR_conf.pdf: PQRI; 2012. 149. Ursino MG, Poluzzi E, Caramella C, De Ponti F. Excipients in medicinal products used in gastroenterology as a possible cause of side effects. Regulatory toxicology and pharmacology : RTP. 2011;60(1):93-105. 150. Eadala P, Waud JP, Matthews SB, Green JT, Campbell AK. Quantifying the 'hidden' lactose in drugs used for the treatment of gastrointestinal conditions. Alimentary pharmacology & therapeutics. 2009;29(6):677-87. 151. Kubbinga M, Langguth P, Barends D. Risk analysis in bioequivalence and biowaiver decisions. Biopharm Drug Dispos. 2013;34(5):254-61. 152. FDA. Guidance for Industry; Immediate Release Solid Oral Dosage Forms; Scale-Up and Postapproval Changes: Chemistry, Manufacturing, and Controls, In Vitro Dissolution Testing, and In Vivo Bioequivalence Documentation, 1995. Available at: http://www.fda.gov/downloads/Drugs/Guidances/UCM070636.pdf . 153. Aungst BJ. Absorption enhancers: applications and advances. Aaps J. 2012;14(1):10-8. 154. Artursson P, Lindmark T, Davis SS, Illum L. Effect of chitosan on the permeability of monolayers of intestinal epithelial cells (Caco-2). Pharm Res. 1994;11(9):1358-61. 155. Schipper NG, Varum KM, Artursson P. Chitosans as absorption enhancers for poorly absorbable drugs. 1: Influence of molecular weight and degree of acetylation on drug transport across human intestinal epithelial (Caco-2) cells. Pharm Res. 1996;13(11):1686-92. 156. Deli MA. Potential use of tight junction modulators to reversibly open membranous barriers and improve drug delivery. Biochim Biophys Acta. 2009;1788(4):892-910. 157. Schipper NG, Olsson S, Hoogstraate JA, deBoer AG, Varum KM, Artursson P. Chitosans as absorption enhancers for poorly absorbable drugs 2: mechanism of absorption enhancement. Pharm Res. 1997;14(7):923-9. 158. Gonzalez-Mariscal L, Nava P, Hernandez S. Critical role of tight junctions in drug delivery across epithelial and endothelial cell layers. J Membr Biol. 2005;207(2):55-68. 159. Illum L. Chitosan and its use as a pharmaceutical excipient. Pharm Res. 1998;15(9):1326-31. 160. Meadows KC, Dressman JB. Mechanism of acyclovir uptake in rat jejunum. Pharm Res. 1990;7(3):299-303. 161. Tanna S, Wood C, Lawrence MJ. Competition studies to elucidate the mechanisms of acyclovir uptake in the small intestine. J Pharm Pharmacol. 1992;44(Suppl.1):1047. 162. de Miranda P, Blum MR. Pharmacokinetics of acyclovir after intravenous and oral administration. J Antimicrob Chemother. 1983;12 Suppl B:29-37. 163. The electronic Medicines Compendium (eMC) [Internet]. Datapharm communications limited. 2010. Available at: http://www.medicines.org.uk/emc/ m e d i c i n e / 9 2 7 3 / S P C / Z o v i r a x % 2 0 2 0 0 m g % 20Tablets#tableOfContents. Last accessed on 16 September 2010. 164. Shah P, Jogani V, Mishra P, Mishra AK, Bagchi T, Misra A. In vitro assessment of acyclovir permeation across cell monolayers in the presence of absorption enhancers. Drug Dev Ind Pharm. 2008;34(3):279-88. 165. Merzlikine A, Rotter C, Rago B, Poe J, Christoffersen C, Thomas VH, et al. Effect of chitosan glutamate, carbomer 974P, and EDTA on the in vitro Caco-2 permeability and oral pharmacokinetic profile of acyclovir in rats. Drug Dev Ind Pharm. 2009;35(9):1082-91. 166. Masuda A, Goto Y, Kurosaki Y, Aiba T. In vivo application of chitosan to facilitate intestinal acyclovir absorption in rats. J Pharm Sci. 2012;101(7):2449-56. 167. Vergin H, Kikuta C, Mascher H, Metz R. Pharmacokinetics and bioavailability of different formulations of aciclovir. Arzneimittelforschung. 1995;45(4):508-15. 168. Tian Y, Lin H, Zhang XY, Zhang ZJ, Mao GG. Rapid quantification of the metabolite of valacyclovir hydrochloride in human plasma by liquid chromatography-tandem mass spectrometry. Academic Journal of Xi'an Jiaotong University. 2010;22(2):83-90.

Chapter 6 | References
103
169. Kanneti R, Rajesh R, Aravinda Raj JR, Bhatt PA. An LC-MS-MS method for the simultaneous quantitation of acyclovir and valacyclovir in human plasma. Chromatographia. 2009;70(3-4):407-14. 170. Zhang Y, Huo M, Zhou J, Xie S. PKSolver: An add-in program for pharmacokinetic and pharmacodynamic data analysis in Microsoft Excel. Comput Methods Programs Biomed. 2010;99(3):306-14. 171. Rojanasthien N, Teekachunhatean S, Kumsorn B, Chaichana N, Hay YK. Bioequivalence study of generic acyclovir compared with the brand name acyclovir. J Med Assoc Thai. 2002;85(10):1121-9. 172. Martindale: the complete drug reference [online]. London: The Pharmaceutical Press; 2010. Available at: http://www.medicinescomplete.com/. Last accessed: 6 June 2014. 173. Opanasopit P, Aumklad P, Kowapradit J, Ngawhiranpat T, Apirakaramwong A, Rojanarata T, et al. Effect of salt forms and molecular weight of chitosans on in vitro permeability enhancement in intestinal epithelial cells (Caco-2). Pharm Dev Technol. 2007;12(5):447-55. 174. Kotze AF, Thanou MM, Luebetaen HL, de Boer AG, Verhoef JC, Junginger HE. Enhancement of paracellular drug transport with highly quaternized N-trimethyl chitosan chloride in neutral environments: in vitro evaluation in intestinal epithelial cells (Caco-2). J Pharm Sci. 1999;88(2):253-7. 175. Bernkop-Schnürch A, Dünnhaupt S. Chitosan-based drug delivery systems. European Journal of Pharmaceutics and Biopharmaceutics. 2012;81(3):463-9. 176. Kean T, Thanou M. Biodegradation, biodistribution and toxicity of chitosan. Adv Drug Deliv Rev. 2010;62(1):3-11. 177. Baldrick P. The safety of chitosan as a pharmaceutical excipient. Regul Toxicol Pharmacol. 2009. 178. Nishimura Y, Kim HS, Ikota N, Arima H, Bom HS, Kim YH, et al. Radioprotective effect of chitosan in sub-lethally X-ray irradiated mice. Journal of radiation research. 2003;44(1):53-8. 179. Hirano S, Itakura C, Seino H, Akiyama Y, Nonaka I, Kanbara N, et al. Chitosan as an ingredient for domestic animal feeds. Journal of Agricultural and Food Chemistry. 1990;38(5):1214-7. 180. Okamoto Y, Nose M, Miyatake K, Sekine J, Oura R, Shigemasa Y, et al. Physical changes of chitin and chitosan in canine gastrointestinal tract. Carbohydrate Polymers. 2001;44(3):211-5. 181. McConnell EL, Murdan S, Basit AW. An investigation into the digestion of chitosan (noncrosslinked and crosslinked) by human colonic bacteria. J Pharm Sci. 2008;97(9):3820-9. 182. Hagesaether E. Permeation modulating properties of natural polymers - Effect of molecular weight and mucus. International Journal of Pharmaceutics. 2011;409(1-2):150-5. 183. Schipper NG, Varum KM, Stenberg P, Ocklind G, Lennernas H, Artursson P. Chitosans as absorption enhancers of poorly absorbable drugs. 3: Influence of mucus on absorption enhancement. Eur J Pharm Sci. 1999;8(4):335-43. 184. The Merck Index Copyright © 2006, 2012 Merck Sharp & Dohme Corp, a subsidiary of Merck & Co, Inc, Whitehouse Station, NJ, USA All rights reserved MedicinesComplete © The Pharmaceutical Press 2014 [Internet]. Last accessed on: 14 February 2014. 185. Patel D, Sawant KK. Oral bioavailability enhancement of acyclovir by self-microemulsifying drug delivery systems (SMEDDS). Drug Dev Ind Pharm. 2007;33(12):1318-26. 186. Allam AN, Naggar VF, El Gamal SS. Formulation and physicochemical characterization of chitosan/acyclovir co-crystals. Pharmaceutical development and technology. 2013;18(4):856-65. 187. Nadai M, Tajiri C, Yoshizumi H, Suzuki Y, Zhao YL, Kimura M, et al. Effect of chitosan on gastrointestinal absorption of water-insoluble drugs following oral administration in rats. Biol Pharm Bull. 2006;29(9):1941-6. 188. Wang QZ, Chen XG, Liu N, Wang SX, Liu CS, Meng XH, et al. Protonation constants of chitosan with different molecular weight and degree of deacetylation. Carbohydrate Polymers. 2006;65(2):194-201. 189. Park GB, Shao Z, Mitra AK. Acyclovir permeation enhancement across intestinal and nasal mucosae by bile salt-acylcarnitine mixed micelles. Pharm Res. 1992;9(10):1262-7. 190. Shao Z, Mitra AK. Nasal membrane and intracellular protein and enzyme release by bile salts and bile salt-fatty acid mixed micelles: correlation with facilitated drug transport. Pharm Res. 1992;9(9):1184-9. 191. Dhaliwal S, Jain S, Singh HP, Tiwary AK. Mucoadhesive microspheres for gastroretentive delivery of acyclovir: in vitro and in vivo evaluation. Aaps J. 2008;10(2):322-30. 192. Ruiz-Caro R, Gago-Guillan M, Otero-Espinar FJ, Veiga MD. Mucoadhesive tablets for controlled release of acyclovir. Chemical & pharmaceutical bulletin. 2012;60(10):1249-57.

Chapter 6 | References
104
193. Naderkhani E, Erber A, Skalko-Basnet N, Flaten GE. Improved permeability of acyclovir: optimization of mucoadhesive liposomes using the phospholipid vesicle-based permeation assay. J Pharm Sci. 2014;103(2):661-8. 194. Yang ZG, Meng H, Zhang X, Li XD, Lv WL, Zhang Q. [Effect of quercetin on the acyclovir intestinal absorption]. Beijing Da Xue Xue Bao. 2004;36(3):309-12. 195. Salama NN, Scott KR, Eddington ND. DM27, an enaminone, modifies the in vitro transport of antiviral therapeutic agents. Biopharm Drug Dispos. 2004;25(5):227-36. 196. Palmberger TF, Hombach J, Bernkop-Schnurch A. Thiolated chitosan: development and in vitro evaluation of an oral delivery system for acyclovir. Int J Pharm. 2008;348(1-2):54-60. 197. Jull AB, Ni Mhurchu C, Bennett DA, Dunshea-Mooij CA, Rodgers A. Chitosan for overweight or obesity. Cochrane Database Syst Rev. 2008(3):CD003892. 198. European Pharmacopoeia, available at www.edqm.eu . 199. Wu T, Zivanovic S, Draughon FA, Conway WS, Sams CE. Physicochemical properties and bioactivity of fungal chitin and chitosan. J Agric Food Chem. 2005;53(10):3888-94. 200. Tajdini F, Amini MA, Nafissi-Varcheh N, Faramarzi MA. Production, physiochemical and antimicrobial properties of fungal chitosan from Rhizomucor miehei and Mucor racemosus. Int J Biol Macromol. 2010;47(2):180-3. 201. Synowiecki J, Al-Khateeb NA. Production, properties, and some new applications of chitin and its derivatives. Crit Rev Food Sci Nutr. 2003;43(2):145-71. 202. Harish Prashanth KV, Tharanathan RN. Chitin/chitosan: modifications and their unlimited application potential. Trends in Food Science & Technology. 2007;18:117-31. 203. Rasenack N, Hartenhauer H, Muller BW. Microcrystals for dissolution rate enhancement of poorly water-soluble drugs. Int J Pharm. 2003;254(2):137-45. 204. Maestrelli F, Zerrouk N, Chemtob C, Mura P. Influence of chitosan and its glutamate and hydrochloride salts on naproxen dissolution rate and permeation across Caco-2 cells. Int J Pharm. 2004;271(1-2):257-67. 205. Guggi D, Bernkop-Schnurch A. In vitro evaluation of polymeric excipients protecting calcitonin against degradation by intestinal serine proteases. Int J Pharm. 2003;252(1-2):187-96. 206. Thongborisute J, Tsuruta A, Kawabata Y, Takeuchi H. The effect of particle structure of chitosan-coated liposomes and type of chitosan on oral delivery of calcitonin. J Drug Target. 2006;14(3):147-54. 207. Raghavan CV, Muthulingam C, Jenita JA, Ravi TK. An in vitro and in vivo investigation into the suitability of bacterially triggered delivery system for colon targeting. Chem Pharm Bull (Tokyo). 2002;50(7):892-5. 208. El-Gibaly I. Development and in vitro evaluation of novel floating chitosan microcapsules for oral use: comparison with non-floating chitosan microspheres. Int J Pharm. 2002;249(1-2):7-21. 209. Svirskis D, Seyfoddin A, Chalabi S, In Kim JH, Langford C, Painter S, et al. Development of mucoadhesive floating hollow beads of acyclovir with gastroretentive properties. Pharm Dev Technol. 2014;19(5):571-6. 210. El-Shabouri MH. Positively charged nanoparticles for improving the oral bioavailability of cyclosporin-A. Int J Pharm. 2002;249(1-2):101-8. 211. Sakkinen M, Linna A, Ojala S, Jurjenson H, Veski P, Marvola M. In vivo evaluation of matrix granules containing microcrystalline chitosan as a gel-forming excipient. Int J Pharm. 2003;250(1):227-37. 212. Sakkinen M, Marvola J, Kanerva H, Lindevall K, Ahonen A, Marvola M. Scintigraphic verification of adherence of a chitosan formulation to the human oesophagus. Eur J Pharm Biopharm. 2004;57(1):145-7. 213. Sakkinen M, Marvola J, Kanerva H, Lindevall K, Ahonen A, Marvola M. Are chitosan formulations mucoadhesive in the human small intestine? An evaluation based on gamma scintigraphy. Int J Pharm. 2006;307(2):285-91. 214. Kubbinga M, Nguyen MA, Staubach P, Teerenstra S, Langguth P. The Influence of Chitosan on the Oral Bioavailability of Acyclovir-a Comparative Bioavailability Study in Humans. Pharm Res. 2015;32(7):2241-9.

Chapter 6 | References
105
215. Dickinson PA, Abu Rmaileh R, Ashworth L, Barker RA, Burke WM, Patterson CM, et al. An investigation into the utility of a multi-compartmental, dynamic, system of the upper gastrointestinal tract to support formulation development and establish bioequivalence of poorly soluble drugs. AAPS J. 2012;14(2):196-205. 216. Brouwers J, Anneveld B, Goudappel GJ, Duchateau G, Annaert P, Augustijns P, et al. Food-dependent disintegration of immediate release fosamprenavir tablets: in vitro evaluation using magnetic resonance imaging and a dynamic gastrointestinal system. Eur J Pharm Biopharm. 2011;77(2):313-9. 217. Minekus M, Marteau P, Havenaar R, Huis in 't Veld JHJ. A multi compartmental dynamic computer-controlled model simulating the stomach and small intestine. Alternatives to Laboratory Animals. 1995;23:197-209. 218. Wuyts B, Riethorst D, Brouwers J, Tack J, Annaert P, Augustijns P. Evaluation of fasted state human intestinal fluid as apical solvent system in the Caco-2 absorption model and comparison with FaSSIF. Eur J Pharm Sci. 2015;67:126-35. 219. Westerhout J, van de Steeg E, Grossouw D, Zeijdner EE, Krul CA, Verwei M, et al. A new approach to predict human intestinal absorption using porcine intestinal tissue and biorelevant matrices. Eur J Pharm Sci. 2014;63:167-77. 220. Dodane V, Amin Khan M, Merwin JR. Effect of chitosan on epithelial permeability and structure. Int J Pharm. 1999;182(1):21-32. 221. Smith J, Wood E, Dornish M. Effect of chitosan on epithelial cell tight junctions. Pharm Res. 2004;21(1):43-9. 222. Smith JM, Dornish M, Wood EJ. Involvement of protein kinase C in chitosan glutamate-mediated tight junction disruption. Biomaterials. 2005;26(16):3269-76. 223. Shah P, Jogani V, Mishra P, Mishra AK, Bagchi T, Misra A. Modulation of ganciclovir intestinal absorption in presence of absorption enhancers. J Pharm Sci. 2007;96(10):2710-22. 224. Volpe DA. Variability in Caco-2 and MDCK cell-based intestinal permeability assays. J Pharm Sci. 2008;97(2):712-25. 225. Larregieu CA, Benet LZ. Drug discovery and regulatory considerations for improving in silico and in vitro predictions that use Caco-2 as a surrogate for human intestinal permeability measurements. AAPS J. 2013;15(2):483-97. 226. He P, Davis SS, Illum L. In vitro evaluation of the mucoadhesive properties of chitosan microspheres. Int J Pharm. 1998;166(1):75-88. 227. Ungell AL. Transport studies using intestinal tissue ex vivo. In: Lehr C-M, editor. Cell Culture Models of Biological Barriers: CRC Press; 2002. p. 164-88. 228. Lennernas H. Human jejunal effective permeability and its correlation with preclinical drug absorption models. J Pharm Pharmacol. 1997;49(7):627-38. 229. Ungell AL, Nylander S, Bergstrand S, Sjoberg A, Lennernas H. Membrane transport of drugs in different regions of the intestinal tract of the rat. J Pharm Sci. 1998;87(3):360-6. 230. Liu H, Pan W, Ke P, Dong Y, Ji L. Preparation and evaluation of a novel gastric mucoadhesive sustained-release acyclovir microsphere. Drug Dev Ind Pharm. 2010;36(9):1098-105. 231. Vaithianathan S, Haidar SH, Zhang X, Jiang W, Avon C, Dowling TC, et al. Effect of Common Excipients on the Oral Drug Absorption of Biopharmaceutics Classification System Class 3 Drugs Cimetidine and Acyclovir. J Pharm Sci. 2015. 232. Brouwers J, Augustijns P. Resolving intraluminal drug and formulation behavior: Gastrointestinal concentration profiling in humans. European Journal of Pharmaceutical Sciences. 2014;61(1):2-10.

Chapter 7 |Appendices
106
7. APPENDICES
7.1. Supplementary information to section 3.4: Bioanalytical method validation
Description
The bioanalytical method was modified from previously reported methods. Plasma samples of
500µl were prepared for analysis by solid phase extraction, using Oasis HLB 1cc cartridges (30mg)
supplied by Waters. The column was washed with 500ml water and then eluted with 500µl
acetonitrile. The extract was centrifuged at 14000 rpm for 10 minutes at -5°C and the concentration
of acyclovir was determined by LC-MS/MS using a sample injection volume of 10 µl. The HPLC
consisted of a Prontosil C18; 100*2,00mm; 5µm column, using an Agilent 1100 LC binary pump. A
gradient elution was used with mobile phase A and B where A consisted of 15mM ammonium
acetate + 0.1375% formic acid at pH 3.5 and B was acetonitrile + 0.1375% formic acid. Details of
the gradient:
Step Total Time(min) Flow Rate(µl/min) A (%) B (%) 0 0.00 300 97.0 3.0 1 0.50 300 97.0 3.0 2 0.60 300 5.0 95.0 3 1.20 300 5.0 95.0 4 2.00 300 97.0 3.0 5 5.50 300 97.0 3.0
Detection took place by a triple quadrupole LC-MS/MS mass spectrometer, API 3000 manufactured
by AB Sciex Instruments, using multiple reactions monitoring with transitions Q1/Q3: 255,992→
151,873. Source temperature was 500°C, overall run time was 5.5 minutes. The method was linear
in a range of 10 to 800 ng/ml, with a detection limit of 1 ng/ml. QC samples were analyzed with
the plasma samples to monitor method accuracy and precision.
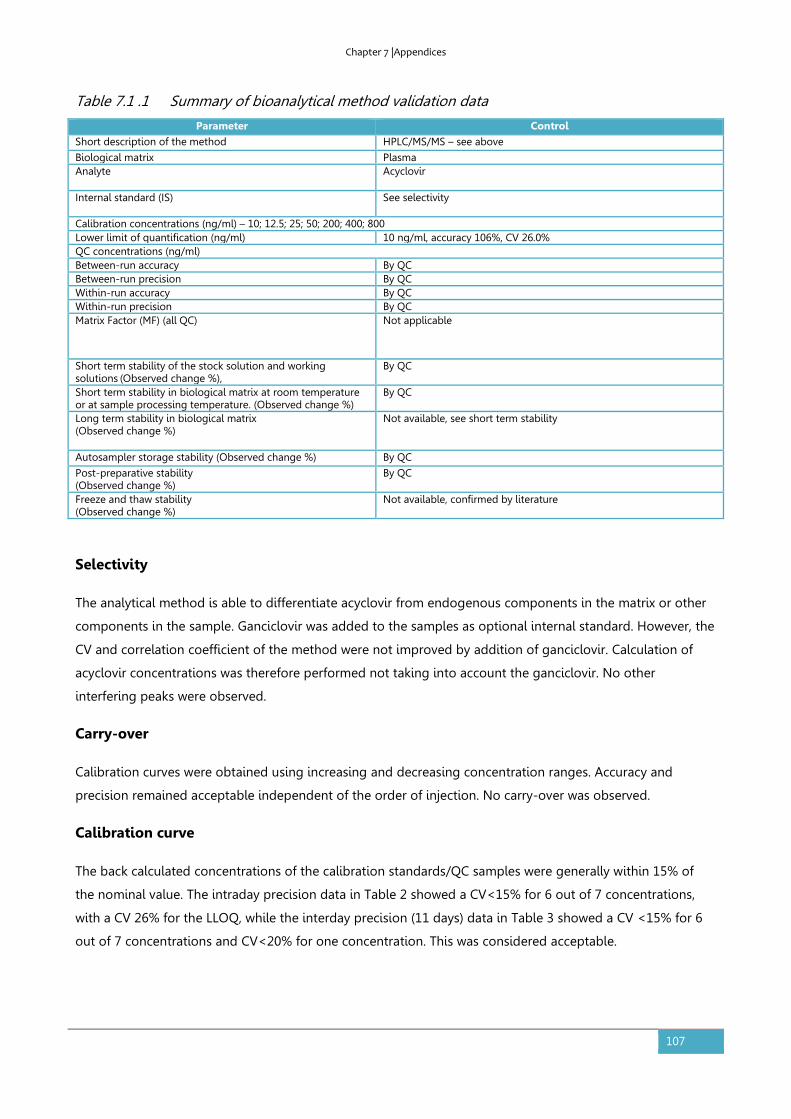
Chapter 7 |Appendices
107
Table 7.1 .1 Summary of bioanalytical method validation data
Parameter Control
Short description of the method HPLC/MS/MS – see above
Biological matrix Plasma Analyte
Acyclovir
Internal standard (IS)
See selectivity
Calibration concentrations (ng/ml) – 10; 12.5; 25; 50; 200; 400; 800 Lower limit of quantification (ng/ml) 10 ng/ml, accuracy 106%, CV 26.0% QC concentrations (ng/ml) Between-run accuracy By QC Between-run precision By QC Within-run accuracy By QC Within-run precision By QC Matrix Factor (MF) (all QC)
Not applicable
Short term stability of the stock solution and working solutions
(Observed change %),
By QC
Short term stability in biological matrix at room temperature or at sample processing temperature. (Observed change %)
By QC
Long term stability in biological matrix (Observed change %)
Not available, see short term stability
Autosampler storage stability (Observed change %) By QC
Post-preparative stability (Observed change %)
By QC
Freeze and thaw stability (Observed change %)
Not available, confirmed by literature
Selectivity
The analytical method is able to differentiate acyclovir from endogenous components in the matrix or other
components in the sample. Ganciclovir was added to the samples as optional internal standard. However, the
CV and correlation coefficient of the method were not improved by addition of ganciclovir. Calculation of
acyclovir concentrations was therefore performed not taking into account the ganciclovir. No other
interfering peaks were observed.
Carry-over
Calibration curves were obtained using increasing and decreasing concentration ranges. Accuracy and
precision remained acceptable independent of the order of injection. No carry-over was observed.
Calibration curve
The back calculated concentrations of the calibration standards/QC samples were generally within 15% of
the nominal value. The intraday precision data in Table 2 showed a CV<15% for 6 out of 7 concentrations,
with a CV 26% for the LLOQ, while the interday precision (11 days) data in Table 3 showed a CV <15% for 6
out of 7 concentrations and CV<20% for one concentration. This was considered acceptable.
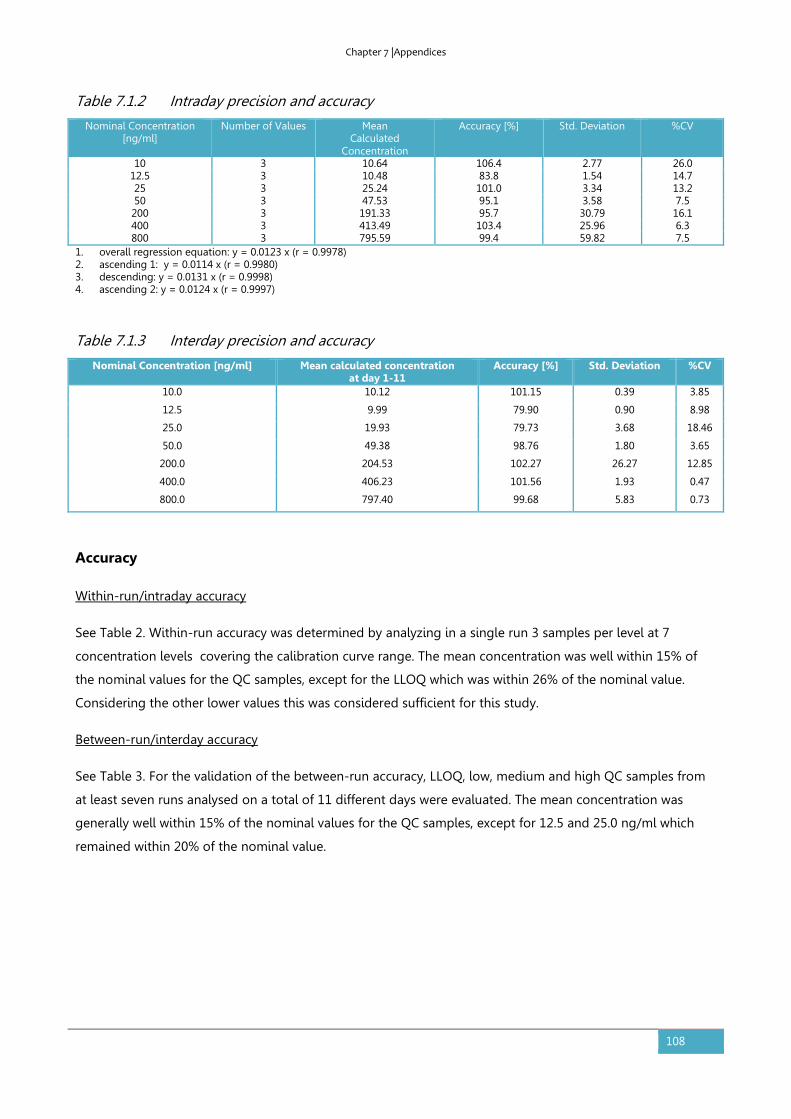
Chapter 7 |Appendices
108
Table 7.1.2 Intraday precision and accuracy
Nominal Concentration [ng/ml]
Number of Values Mean Calculated
Concentration
Accuracy [%] Std. Deviation %CV
10 3 10.64 106.4 2.77 26.0 12.5 3 10.48 83.8 1.54 14.7 25 3 25.24 101.0 3.34 13.2 50 3 47.53 95.1 3.58 7.5 200 3 191.33 95.7 30.79 16.1 400 3 413.49 103.4 25.96 6.3 800 3 795.59 99.4 59.82 7.5
1. overall regression equation: y = 0.0123 x (r = 0.9978) 2. ascending 1: y = 0.0114 x (r = 0.9980) 3. descending: y = 0.0131 x (r = 0.9998) 4. ascending 2: y = 0.0124 x (r = 0.9997)
Table 7.1.3 Interday precision and accuracy
Nominal Concentration [ng/ml] Mean calculated concentration at day 1-11
Accuracy [%] Std. Deviation %CV
10.0 10.12 101.15 0.39 3.85
12.5 9.99 79.90 0.90 8.98
25.0 19.93 79.73 3.68 18.46
50.0 49.38 98.76 1.80 3.65
200.0 204.53 102.27 26.27 12.85
400.0 406.23 101.56 1.93 0.47
800.0 797.40 99.68 5.83 0.73
Accuracy
Within-run/intraday accuracy
See Table 2. Within-run accuracy was determined by analyzing in a single run 3 samples per level at 7
concentration levels covering the calibration curve range. The mean concentration was well within 15% of
the nominal values for the QC samples, except for the LLOQ which was within 26% of the nominal value.
Considering the other lower values this was considered sufficient for this study.
Between-run/interday accuracy
See Table 3. For the validation of the between-run accuracy, LLOQ, low, medium and high QC samples from
at least seven runs analysed on a total of 11 different days were evaluated. The mean concentration was
generally well within 15% of the nominal values for the QC samples, except for 12.5 and 25.0 ng/ml which
remained within 20% of the nominal value.
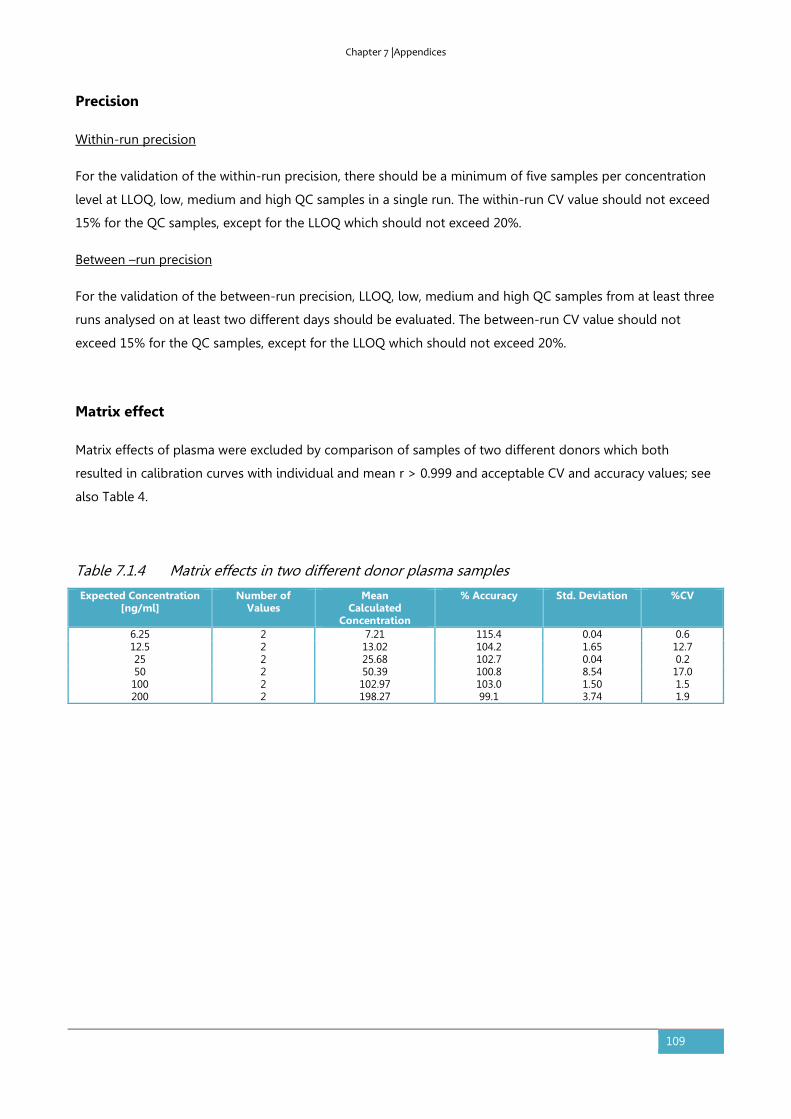
Chapter 7 |Appendices
109
Precision
Within-run precision
For the validation of the within-run precision, there should be a minimum of five samples per concentration
level at LLOQ, low, medium and high QC samples in a single run. The within-run CV value should not exceed
15% for the QC samples, except for the LLOQ which should not exceed 20%.
Between –run precision
For the validation of the between-run precision, LLOQ, low, medium and high QC samples from at least three
runs analysed on at least two different days should be evaluated. The between-run CV value should not
exceed 15% for the QC samples, except for the LLOQ which should not exceed 20%.
Matrix effect
Matrix effects of plasma were excluded by comparison of samples of two different donors which both
resulted in calibration curves with individual and mean r > 0.999 and acceptable CV and accuracy values; see
also Table 4.
Table 7.1.4 Matrix effects in two different donor plasma samples
Expected Concentration [ng/ml]
Number of Values
Mean Calculated
Concentration
% Accuracy Std. Deviation %CV
6.25 2 7.21 115.4 0.04 0.6 12.5 2 13.02 104.2 1.65 12.7 25 2 25.68 102.7 0.04 0.2 50 2 50.39 100.8 8.54 17.0 100 2 102.97 103.0 1.50 1.5 200 2 198.27 99.1 3.74 1.9
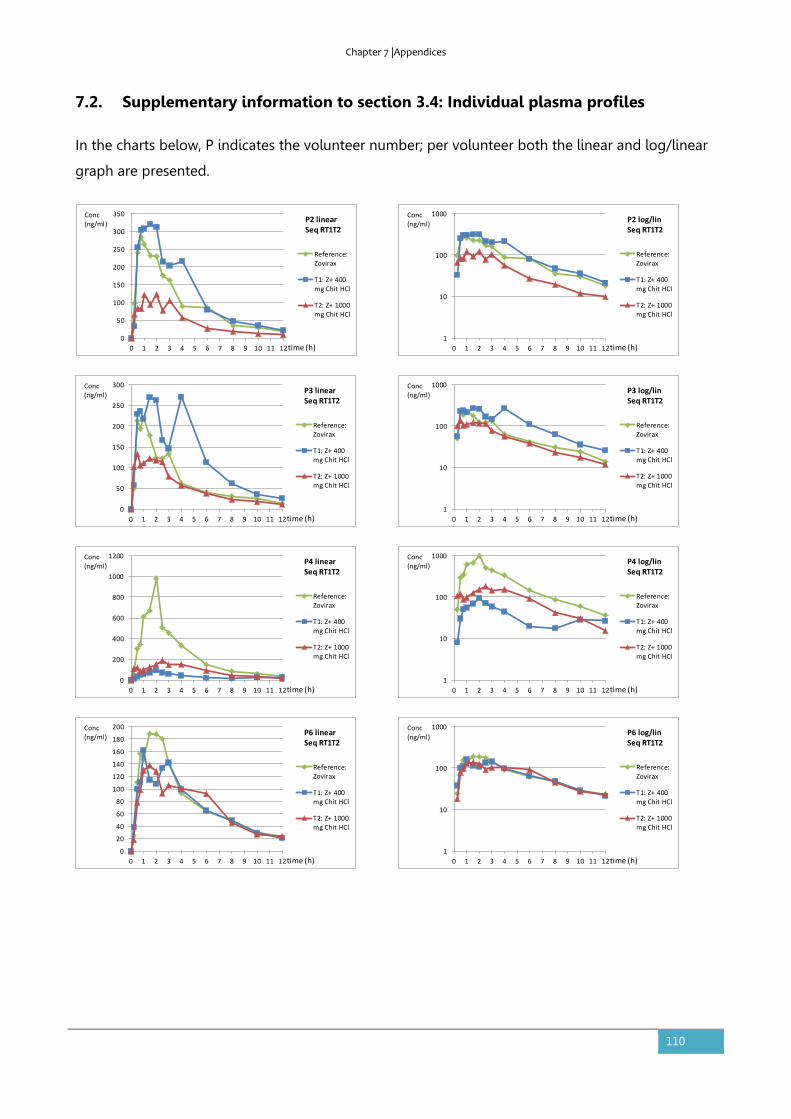
Chapter 7 |Appendices
110
7.2. Supplementary information to section 3.4: Individual plasma profiles
In the charts below, P indicates the volunteer number; per volunteer both the linear and log/linear
graph are presented.
0
50
100
150
200
250
300
350
0 1 2 3 4 5 6 7 8 9 10 11 12
Reference:Zovirax
T1: Z+ 400mg Chit HCl
T2: Z+ 1000mg Chit HCl
P2 linearSeq RT1T2
time (h)
Conc(ng/ml)
1
10
100
1000
0 1 2 3 4 5 6 7 8 9 10 11 12
Reference:Zovirax
T1: Z+ 400mg Chit HCl
T2: Z+ 1000mg Chit HCl
P2 log/linSeq RT1T2
time (h)
Conc(ng/ml)
0
50
100
150
200
250
300
0 1 2 3 4 5 6 7 8 9 10 11 12
Reference:Zovirax
T1: Z+ 400mg Chit HCl
T2: Z+ 1000mg Chit HCl
P3 linearSeq RT1T2
time (h)
Conc(ng/ml)
0
200
400
600
800
1000
1200
0 1 2 3 4 5 6 7 8 9 10 11 12
Reference:Zovirax
T1: Z+ 400mg Chit HCl
T2: Z+ 1000mg Chit HCl
P4 linearSeq RT1T2
time (h)
Conc(ng/ml)
0
20
40
60
80
100
120
140
160
180
200
0 1 2 3 4 5 6 7 8 9 10 11 12
Reference:Zovirax
T1: Z+ 400mg Chit HCl
T2: Z+ 1000mg Chit HCl
P6 linearSeq RT1T2
time (h)
Conc(ng/ml)
1
10
100
1000
0 1 2 3 4 5 6 7 8 9 10 11 12
Reference:Zovirax
T1: Z+ 400mg Chit HCl
T2: Z+ 1000mg Chit HCl
P3 log/linSeq RT1T2
time (h)
Conc(ng/ml)
1
10
100
1000
0 1 2 3 4 5 6 7 8 9 10 11 12
Reference:Zovirax
T1: Z+ 400mg Chit HCl
T2: Z+ 1000mg Chit HCl
P4 log/linSeq RT1T2
time (h)
Conc(ng/ml)
1
10
100
1000
0 1 2 3 4 5 6 7 8 9 10 11 12
Reference:Zovirax
T1: Z+ 400mg Chit HCl
T2: Z+ 1000mg Chit HCl
P6 log/linSeq RT1T2
time (h)
Conc(ng/ml)

Chapter 7 |Appendices
111
0
200
400
600
800
1000
1200
0 1 2 3 4 5 6 7 8 9 10 11 12
Reference:Zovirax
T1: Z+ 400mg Chit HCl
T2: Z+ 1000mg Chit HCl
P10 linearSeq RT1T2
time (h)
Conc(ng/ml)
0
100
200
300
400
500
600
0 1 2 3 4 5 6 7 8 9 10 11 12
Reference:Zovirax
T1: Z+ 400mg Chit HCl
T2: Z+ 1000mg Chit HCl
P14 linearSeq RT1T2
time (h)
Conc(ng/ml)
0
50
100
150
200
250
300
350
400
0 1 2 3 4 5 6 7 8 9 10 11 12
Reference:Zovirax
T1: Z+ 400mg Chit HCl
T2: Z+ 1000mg Chit HCl
P5 linearSeq R21T1
time (h)
Conc(ng/ml)
0
50
100
150
200
250
300
0 1 2 3 4 5 6 7 8 9 10 11 12
c[ng/ml]
c[ng/ml]
P7 linearSeq R21T1
time (h)
Conc(ng/ml)
1
10
100
1000
10000
0 1 2 3 4 5 6 7 8 9 10 11 12
Reference:Zovirax
T1: Z+ 400mg Chit HCl
T2: Z+ 1000mg Chit HCl
P10 log/linSeq RT1T2
time (h)
Conc(ng/ml)
1
10
100
1000
0 1 2 3 4 5 6 7 8 9 10 11 12
Reference:Zovirax
T1: Z+ 400mg Chit HCl
T2: Z+ 1000mg Chit HCl
P14 log/linSeq RT1T2
time (h)
Conc(ng/ml)
1
10
100
1000
0 1 2 3 4 5 6 7 8 9 10 11 12
Reference:Zovirax
T1: Z+ 400mg Chit HCl
T2: Z+ 1000mg Chit HCl
P5 log/linSeq R21T1
time (h)
Conc(ng/ml)
1
10
100
1000
0 1 2 3 4 5 6 7 8 9 10 11 12
c[ng/ml]
c[ng/ml]
P7 log/linSeq R21T1
time (h)
Conc(ng/ml)

Chapter 7 |Appendices
112
0
50
100
150
200
250
300
350
400
450
0 1 2 3 4 5 6 7 8 9 10 11 12
Reference:Zovirax
T1: Z+ 400mg Chit HCl
T2: Z+ 1000mg Chit HCl
P8 linearSeq R21T1
time (h)
Conc(ng/ml)
0
50
100
150
200
250
300
350
400
0 1 2 3 4 5 6 7 8 9 10 11 12
Reference:Zovirax
T1: Z+ 400mg Chit HCl
T2: Z+ 1000mg Chit HCl
P11 linearSeq R21T1
time (h)
Conc(ng/ml)
0
50
100
150
200
250
300
0 1 2 3 4 5 6 7 8 9 10 11 12
Reference:Zovirax
T1: Z+ 400mg Chit HCl
T2: Z+ 1000mg Chit HCl
P12 linearSeq R21T1
time (h)
Conc(ng/ml)
0
50
100
150
200
250
300
0 1 2 3 4 5 6 7 8 9 10 11 12
Reference:Zovirax
T1: Z+ 400mg Chit HCl
T2: Z+ 1000mg Chit HCl
P13 linearSeq R21T1
time (h)
Conc(ng/ml)
1
10
100
1000
0 1 2 3 4 5 6 7 8 9 10 11 12
Reference:Zovirax
T1: Z+ 400mg Chit HCl
T2: Z+ 1000mg Chit HCl
P8 log/linSeq R21T1
time (h)
Conc(ng/ml)
1
10
100
1000
0 1 2 3 4 5 6 7 8 9 10 11 12
Reference:Zovirax
T1: Z+ 400mg Chit HCl
T2: Z+ 1000mg Chit HCl
P11 log/linSeq R21T1
time (h)
Conc(ng/ml)
1
10
100
1000
0 1 2 3 4 5 6 7 8 9 10 11 12
Reference:Zovirax
T1: Z+ 400mg Chit HCl
T2: Z+ 1000mg Chit HCl
P12 log/linSeq R21T1
time (h)
Conc(ng/ml)
1
10
100
1000
0 1 2 3 4 5 6 7 8 9 10 11 12
Reference:Zovirax
T1: Z+ 400mg Chit HCl
T2: Z+ 1000mg Chit HCl
P13 log/linSeq R21T1
time (h)
Conc(ng/ml)

Chapter 8 |List of publications
113
8. LIST OF PUBLICATIONS
Publications in relation to this thesis:
• Kubbinga M, Nguyen MA, Staubach P, Teerenstra S, Langguth P. The influence of chitosan on
the oral bioavailability of acyclovir-a comparative bioavailability study in humans. Pharm Res.
2015; 32: 2241-2249.
• Kubbinga M, Moghani L, Langguth P. Novel insights into excipient effects on the
biopharmaceutics of APIs from different BCS classes: Lactose in solid oral dosage forms. Eur J
Pharm Sci. 2014;61:27-31.
• Sjogren, E., Abrahamsson, B., Augustijns, P., Becker, D., Bolger, M.B., Brewster, M., Brouwers, J.,
Flanagan, T., Harwood, M., Heinen, C., Holm, R., Juretschke, H.P., Kubbinga, M., Lindahl, A.,
Lukacova, V., Munster, U., Neuhoff, S., Nguyen, M.A., Peer, A.V., Reppas, C., Hodjegan, A.R.,
Tannergren, C., Weitschies, W., Wilson, C., Zane, P., Lennernas, H., Langguth, P., In vivo methods
for drug absorption - comparative physiologies, model selection, correlations with in vitro
methods (IVIVC), and applications for formulation/API/excipient characterization including food
effects. Eur J Pharm Sci. 2014;57:99-151
• Sediq A, Kubbinga M, Langguth P, Dressman J. The impact of the EMA change in definition of
"dose" on the BCS dose-solubility ratio: a review of the biowaiver monographs. J Pharm Sci.
2014;103(1):65-70.
• Kubbinga M, Langguth P, Barends D. Risk analysis in bioequivalence and biowaiver decisions.
Biopharm Drug Dispos. 2013;34(5):254-61.

Chapter 9 | Conflicts of interest and financial disclosures
114
9. CONFLICTS OF INTEREST AND FINANCIAL DISCLOSURES
The research described in this thesis was initiated by RIVM in the framework of RIVM Strategic
Research Programme (SOR, currently SPR), in which expertise and innovative projects prepare RIVM
to respond to future issues in health and sustainability. The project received financial support from
the Fédération Internationale Pharmaceutique (FIP). The work on excipients described in Chapter 3
received support from and contributes to the Innovative Medicines Initiative Joint Undertaking
(http://www.imi.europa.eu) under grant agreement no. 115369. The clinical study as described in
Chapter 3 was sponsored by the Product Quality Research Institute (PQRI).
Marlies Kubbinga is employed as a quality assessor at the Medicines Evaluation Board of the
Netherlands, but the views presented in this thesis do not necessarily reflect the opinion of the
Board.

Chapter 10 | Acknowledgements
115
10. ACKNOWLEDGEMENTS/DANKWOORD/DANKSAGUNG
This thesis is the result of efforts and patience from many sides. I hereby wish to thank everyone
who allowed the project and me to move forward. I am grateful for each of your supporting words
or actions. Some personal words:

Chapter 10 | Acknowledgements
116

Chapter 10 | Acknowledgements
117

Chapter 10 | Acknowledgements
118
Chapter 11 | Curriculum vitae
119
11. CURRICULUM VITAE