bcoewhitepaper smart transportation systems smart transportation systems ... and the inability to...
TRANSCRIPT

BCoE whItEPAPER
SmartTransportationSystemsIntroduction
The following report was produced based on a grant from the Universityof New Hampshire’s Broadband Center of Excellence (BCoE) to the UNHcommunity seeking ideas on the use of smart sensors to benefit rural ordisadvantaged communities. BCoE provides unbiased information anddemonstrations of broadband for the development of innovative networkapplication experiments in the education, health, public safety and economicdevelopment sectors to improve citizens’ quality of life. BCoE seeks to attainaffordable broadband available to all people around the world.
UNH BroadBaNd CeNter of exCelleNCeSMART TRANSPORTATION SYSTEMS 2017
PI:
Nicholas Kirsch, Electrical and Computer Engineering
Co-PIs:
Andrew Kun, Electrical and Computer Engineering
Robert McGrath, Health Management and Policy
Prashant Mittal, Health Management and Policy
Staff:
Christina Dube, Connectivity Research Center
Students:
Cameron Devine, Connectivity Research Center
Maxwell McNally, Connectivity Research Center
Participants

� UNh BRoADBAND CENtER of ExCEllENCE Smart Transportation Systems 2017
Executive SummaryVehicular traffic of all kinds is vital in semi-ruralcommunities such as Durham, NH. While ourcommunity does not have the traffic congestionof larger cities, our vibrant pedestriancontingent, cars, buses, and maintenancevehicles are sometimes at odds. The challengesrange from pedestrians in un-signaledcrosswalks between classes to the lack ofparking spaces during maximum demandi. Theseproblems are universal throughout the countryand scale to much larger cities.
Smart cities are communities that utilizeinformation from sensors and sensing systems tomake services more efficient or improvesustainability. These systems are essentially acyber-physical system that acts upon gatheredinformation that is transmitted through a wiredor wireless networkii. In this context, we areinterested in deploying a network of sensorsystems throughout UNH and Durham toimprove transportation in our community.
The goal of this project is to have a positiveimpact on the community by improvingawareness of parking, decreasing trafficcongestion caused by pedestrians andresearching novel methods to encourage the use of alternative forms oftransportation. The innovation of this project is the synthesis of data analytics fromnetworked sensors and new forms of displaying information to community members.
There were several outcomes of this project and we achieved many of our goals:
Developed and deployed two sensor platforms (parking and pedestrian); theseplatforms included sensor architecture and devices, connectivity to thebackend, and necessary servers.
Performed a range of analyses on the collected data that demonstrates theefficacy of making these measurements. Certain limitations of the sensors didnot enable us to collect sufficient data to build a complete UNH transportationmodel.
Created a platform for displaying transportation information to a motoristthrough augmented reality and to understand the impact of using these toolswhile driving.
Brought a multi-disciplinary group of UNH faculty together to work on a SmartCities project that lead to the submission of a federally funded researchproposal and connections to local transportation companies and DOTs.
TOWN
SENSORS
NETWORKING
APPLICATIONS
DATA ANALYSIS
figure 1: Smart Cities tiers

� UNh BRoADBAND CENtER of ExCEllENCE Smart Transportation Systems 2017
Sensor PlatformsThe first objective of our project was to develop two sensing platforms for measuringparking availability in one of the University lots and pedestrian traffic in key crosswalks. Theproposed parking system has a set of solar powered wireless sensors to count the numberof spaces available in a lot and to communicate with a server. The pedestrian sensormonitors mobile phone emissions as pedestrians walk by the sensors and will similarly storethe data.
Parking Sensor
An ideal solution would require little to nomaintenance for the life of the project andwould be able to be deployed remotely, withthe data accessible in real time, e.g. buryingsensors under every parking space. However,this effort was outside of the scope of theproject. Instead, we developed a temporarysensor platform. When considering theamount and frequency of the data, LoRawireless technology was the best fit since itprovides a low power solution that could beaccessed at a long range. The decision to useLoRa, then drove the processor selection,which was MultiTech’s mdotiii processor.
The main requirement for the sensor platformwas the ability to detect a vehicle passingthrough the entrance of the parking lot.There were a variety of sensors that met thisrequirement. Magnetic, infrared, LIDAR andultrasonic sensors were explored, andultrasonic sensors were deployed.
Initially magnetic sensors seemed to be thelogical choice, however, to detect a vehicle,the magnetic signature (waveform) had to beanalyzed and compared to a “known” vehiclemagnetic signature.
Without a user actively reading the data, thisanalysis required a DSP filter. The DSP filterwould have required more power forprocessing than could be afforded on theproject.
Infrared tests showed promise when detecting objects in the lab, however infrared was notchosen because the sun’s infrared spectrum emission confused the sensor because it is inthe same wavelength as the sensor. LIDAR is more expensive than our solution warranted.
Ultrasonic sensors could accurately detect vehicles up to 10 feet from the sensor platform.Given that the entrances to the parking lots are large areas of space with cars turning fromvarious directions, this was the most ideal sensor for the project.
figure 2: original parking sensor form factor asdeployed in Parking lot B

� UNh BRoADBAND CENtER of ExCEllENCE Smart Transportation Systems 2017
Block Diagram
Each sensor module contains asingle mDot as the processorhandling sensor input andnetwork connectivity. TwoUltrasonic range sensors areconnected to the mDot, onemonitoring the inner-side of theparking lot entrance and anothermonitoring the external side.These transmit ultrasonic pulsesand then receive the pulse back.Upon reception, they monitor thetime of flight of the waveform.Knowing the speed of sound, thedistance from the sensor to thecar can be measured. If thedistance measured is within a certain threshold then that sensor has detected a car. If theother sensor senses a car in the same cycle, the direction of the car can be determined.
The sensors used were HC-SR04 Ultrasonicsensors. They have four pins, a power and groundfor powering the device, and a trigger and echopins. When the trigger pin is sent high the sensorsends out an ultrasonic pulse that is then receivedby the sensor. The echo pin returns a high pulsethat corresponds to an object being in the field ofview of the sensor. The time of flight (differencebetween send and receive) of the ultrasonic pulseis then used to calculate distance. The modulecounts vehicles passing by in 15-minute intervals.People and other passing objects are purposely ignored by distance thresholds and timeconstraints on the sensed object, but this is not perfect. When 15 minutes passes the deviceuplinks to the LoRa network and transmits a frame with data indicating “Cars In” and “CarsOut”. The data is then pushed from the Senet network to a server on the UNH campus forfurther analysis.
In addition to sending data up to the network, a downlink can be sent to the device throughthe network immediately after an uplink to either reset the device or to have it sleep. Thedevices were often told to sleep overnight to save additional power.
These sensors were deployed at the entrances to the A-Lot and B-Lot parking lots on theUNH campus. For one entrance of B-Lot, due to the large width of the entrance, two sensorsystems were deployed, one on each side of the entrance. Another similarly sized entranceon the same side of B-Lot could not be instrumented on both sides due to the proximity ofa fire hydrant, and the inability to secure the device in place.
SOLARPANEL
POWERSYSTEMPROCESSOR
NETWORK
SENSORS
figure 3: Block diagram of Parking Sensor
figure 4: Processor module wired to sensors
figure 5: New form factor of the parkingsensor as deployed in Parking lot a

� UNh BRoADBAND CENtER of ExCEllENCE Smart Transportation Systems 2017
figure 6: three sensors deployedin Parking lot a at the entrances
figure 7: four sensors deployedin Parking lot B at the entrances
location of Parking lot sensors (in yellow)
Pedestrian Sensor
Detecting people was a challenging, yet vital, goal in order to make transportation moreefficient and safe. The ability to do this would allow better traffic management and allowcommuters to better plan their drive around densely packed areas. Current solutions forthis problem are expensive, complex and use a lot of power.
The current solutions include computer vision, analyzing WiFi traffic or analyzing cell phonesignals. These can be extremely complex and for this project, consume too much power.Many highway departments now use Bluetooth signals to analyze car travel times onroadways. Instead of travel times, counting the amount of Bluetooth devices can be relatedto the amount of people in the area. Bluetooth has a small range of around 10 meters so thecount would be relative to that small area.

� UNh BRoADBAND CENtER of ExCEllENCE Smart Transportation Systems 2017
One problem with Bluetooth is that not all people carry a Bluetooth device and even whenthey do it is not always activated and detectable. Because of this, an experiment had to beconducted to create a probability model of how many Bluetooth devices there are perperson. These experiments allowed us to correlate the number of devices and thepopulation in a small area and then accurately predict the population using the data wepreviously recorded.
A Raspberry Pi 3 was used as the processor module. The Raspberry Pi has a Bluetoothmodule on it with the BlueZ Bluetooth stack that allows the user to control the module. Apython script was written to scan and record the MAC addresses it could detect and get acount of Bluetooth devices by counting the number of unique addresses. Each MACaddress is guaranteed to be linked to one Bluetooth device.
Block Diagram
The experiments were conducted in Durham in front of Thompson Hall at the intersection ofGarrison Ave. and Main St. Every sample taken would count Bluetooth devices in the areafor 30 seconds. During those 30 seconds, the amount of people walking through the areawere being counted. At the end of the experiment, the number of devices was compared tothe actual amount of people so in the future, the prediction of the amount of people in anarea compared to the number of devices can be made with high confidence.
In the future, these devices can be upgraded to move away from an entire Raspberry Piusing a lower power Bluetooth module instead ,with LoRaWAN to provide access to acentral server at low power and cost. This data can be used to give real time predictions ofpopulation to users in Durham.
BLUETOOTH
PEDESTRIANDATA
SENSORS
MACADDRESSES
PYTHONSCRIPT
BLUEZBT
RASPBERRYPI
figure 8: Block diagram of Parking Sensor

� UNh BRoADBAND CENtER of ExCEllENCE Smart Transportation Systems 2017
Data AnalysisThe purpose of the data analysis is to analyze the base-line and sensor data from the firstobjective to reduce the stress level for drivers and pedestrians, but also to help direct thetraffic around the campus in a safer and more efficient way. In the future, the broadcast ofsuch information through an app or signage requires complete understanding of the currenttraffic situation, number of parking spots available all over the campus and highly accuratepredictive models that constantly modify their predictions of availability of spots.
Parking Sensors
The csv file containing time series data points for all days between the third week ofJanuary through the second week of March were loaded into memory in a manner thatallows for detailed analysis for B lot. Measurements were also made for A lot. This processsimply renames columns with intuitive names, creates a date formatted column, numericalweekday column (i.e. Monday 0, …, Sunday = 6), and parsed time stamps into hourlycolumns. The data were 15 minute counts of cars entering in and exiting the lot. Sensors hada systematic tendency of overestimating cars exiting the lot and underestimating thosecoming in the lot. We calibrated sensors for various measurement errors several times, andthere still existed estimation anomalies.
Our sensor platform was not completely stable and led to anomalies that made it difficult tocreate a complete transportation model based on the time when each lot was at capacity.Several methods of detecting anomalies were employed. The first method tried was animplementation of an Isolation Forestiv algorithm. The details of this algorithm are notdiscussed as it is beyond the scope of this report. The second method implemented was arule based anomaly identifier. The rules rely on grouped averages and standard deviationsto flag a record as anomalous or not. The function is built to flag records as anomalous withrespect to either cars in or cars out. A record is flagged as anomalous if its number of carsin or out is greater than n standard deviations above the mean of cars in or out grouped byhour and quarter of the hour.
The third method of anomaly detection was an “out of the ballpark” range of number ofcars in and out. For instance, there were cases where number of cars exiting in an hourexceeded nine hundred, which is physically impossible and indicates anomalies in sensordetection of vehicles. However, we present a data set to demonstrate the efficacy of oursensor platform by analyzing the data from the sensors. The following graphs depict thenumber of cars entering and exiting each lot on campus.

� UNh BRoADBAND CENtER of ExCEllENCE Smart Transportation Systems 2017
figure 9: 24-hour view of cars entering and exiting Parking lot a. each color represents a day duringthe week of april 24 — april 28
figure 10: 24-hour view of cars entering and exiting Parking lot B. each color represents a day duringthe week of april 24 — april 28

� UNh BRoADBAND CENtER of ExCEllENCE Smart Transportation Systems 2017
One interpretation of the data is that A lot rarely reaches capacity and cars arrive in themorning and leave in the evening. However, in B lot cars arrive throughout the day andleave as early as 9AM. This leads us to believe that the lot is full when a car enters, looks fora parking place, is not successful, and then leaves.
Pedestrian Data
The experiments were conducted in Durham in front of Thompson Hall at the intersection ofGarrison Ave. and Main St. Every sample taken would count devices in the area for 30seconds. During those 30 seconds, the amount of people walking through the area wasbeing counted. At the end of the experiment, the number of devices scanned wascompared to the actual amount of people so that in the future, the prediction of theamount of people in an area compared to the amount of devices can be made with highconfidence.
The raw data over two experiments shows the correlation between the number of devicesdetected and the number of people counted.
DEvICES PER PERSoN
ExPERIMENt 1 ExPERIMENt �
Mean 1.86 0.74
Median 1.22 0.66
Standard Deviation 1.61 0.41
Correlation Coefficient 0.49 0.48
table 1: Statistical analysis of devices per Person for each Bluetooth experiment
The data demonstrate a positive correlation of about 1.5 devices per person. We alsoanalyzed the density of devices per person and found that the distribution is likelyLaplacian distributed. However, a larger study is required to create a better model.
figure 11: actual Population vs devices detected for each Bluetooth experiment

1� UNh BRoADBAND CENtER of ExCEllENCE Smart Transportation Systems 2017
These experiments proved that Bluetooth can be used to predict the amount of people inan outdoor area while keeping cost and power required low. Creating a strong probabilitymodel can make these predictions more accurate. These experiments showed that 1.5devices can be equal to 1 person or 15 devices will be seen for every 10 people. This is thecase 80 percent of the time with a confidence level of 90 percent. More experimentationcan be done to get a higher percentage with a greater confidence bound.
transportation Augmented Reality
Augmented reality holds the promise of providing relevant information to road users in amanner that will allow the road users to remain connected to their surroundings. Thisconnection to their surroundings has multiple benefits. First, for drivers, this approachshould allow them to consume information, such as navigation instructions, while theyretain sufficient attention on the outside world to safely perform the primary task in thevehicle, which is driving. Second, for passengers (and we will all be passengers inautomated vehicles), the connection to their surroundings means that information can bedisplayed in a context-sensitive manner. Context sensitivity in this case means thatinformation is presented such that it is visible under different road and environmentalconditions, and that the information is closely tied to the physical world that it relates to.
To make augmented reality work in a smart transportation system will require significantbroadband capabilities. Drivers and passengers alike will want to see rapidly changingvisual information that is tied to their physical context. Examples include visualaugmentations of the physical environment for gaming purposes, as well as navigationinstructions that augment physical landmarks with virtual landmarks. Thus, we expect thataugmented reality applications will constitute a significant portion of broadband dataconsumption in smart transportation systems.
figure 12: density of Bluetooth devices per person for each experiment
11 UNh BRoADBAND CENtER of ExCEllENCE Smart Transportation Systems 2017
To make augmented reality work, we need to answer questions related to in-vehicle human-computer interaction. What information do drivers and passengers want to consume invehicles? How should the information be presented? For example, which virtual objects canbe used as virtual landmarks for navigation applications? And to answer these questions weneed some tools. We feel that one critical tool is to be able to provide accurate data aboutwhere users are looking at any given time as they are using augmented reality.
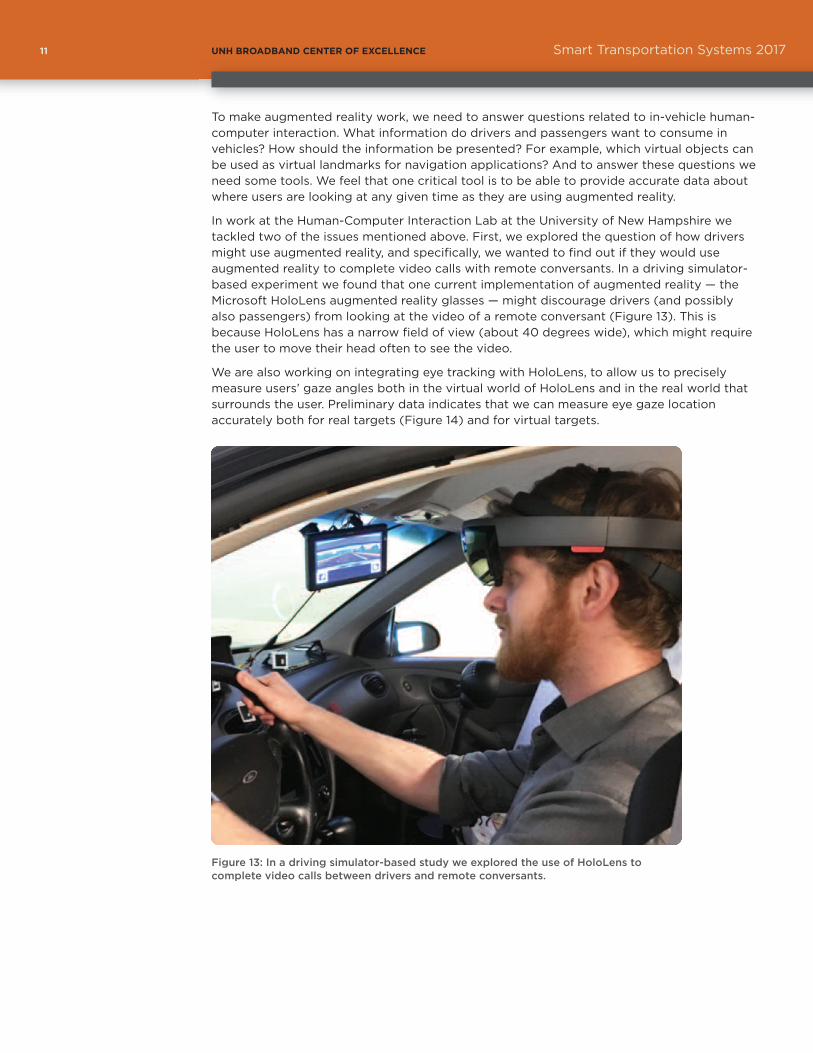
In work at the Human-Computer Interaction Lab at the University of New Hampshire wetackled two of the issues mentioned above. First, we explored the question of how driversmight use augmented reality, and specifically, we wanted to find out if they would useaugmented reality to complete video calls with remote conversants. In a driving simulator-based experiment we found that one current implementation of augmented reality — theMicrosoft HoloLens augmented reality glasses — might discourage drivers (and possiblyalso passengers) from looking at the video of a remote conversant (Figure 13). This isbecause HoloLens has a narrow field of view (about 40 degrees wide), which might requirethe user to move their head often to see the video.
We are also working on integrating eye tracking with HoloLens, to allow us to preciselymeasure users’ gaze angles both in the virtual world of HoloLens and in the real world thatsurrounds the user. Preliminary data indicates that we can measure eye gaze locationaccurately both for real targets (Figure 14) and for virtual targets.
figure 13: In a driving simulator-based study we explored the use of Hololens tocomplete video calls between drivers and remote conversants.

1� UNh BRoADBAND CENtER of ExCEllENCE Smart Transportation Systems 2017
ConclusionsIn this smart transportation project, we developed and deployed two complete wirelesssensor networks, measured and analyzed two sets of transportation datanand created anovel augmented reality platform to display information to motorist. Each of these tasksbrought the research group closer together and created a vital data set to apply for futureSmart City research projects.
In addition to the team working together as researchers, other valuable connections andrelationships were developed that will enable future Smart City work on the UNH campus.These relationships include working with the UNH Transportation and Parking departments,the UNH-Police department and the Town of Durham Police Department.
Many other tangential items were learned and established that could also enable futureSmart City work. In the research phase of the sensor development, many processorplatforms, sensor types and wireless technologies were explored which will benefit otherprojects. A LoRa network has been deployed on campus, which includes a server for thesensor data. This network can be utilized for future projects. Most importantly, many lessonswere learned regarding the actual deployment, monitoring and maintenance of a remotesensor network in the New Hampshire climate. This knowledge will be critical to futureSmart City projects at the University of New Hampshire.
i Nagatani, takashi. "the physics of traffic jams." reports on progress in physics 65.9 (2002): 1331.
ii Jin, Jiong, et al. "an information framework for creating a smart city through internet of things."Internet of things Journal, Ieee 1.2 (2014): 112-121.
iii http://multitech.com
iv liu, fei tony, Kai Ming ting, and Zhi-Hua Zhou. "Isolation forest." 2008 eighth Ieee InternationalConference on data Mining (2008)
figure 14: Head-tracking data from Hololens was integrated with gaze direction datafrom a wearable eye tracker. this figure demonstrates that this data can be used toaccurately measure gaze location in the real world for users wearing Hololens.
© 2017 University of New HampshireBroadband Center of Excellence
For more information, visit
www.unhbcoe.org