bbn ang 141 foundations of phonology phonetics …seas3.elte.hu/foundations/030-h.pdfbbn–ang–141...
TRANSCRIPT

BBN–ANG–141 Foundations of phonology
Phonetics 3: Acoustic phonetics 1
Zoltán Kiss
Dept. of English Linguistics, ELTE
z. kiss (elte/delg) intro phono 3/acoustics 1 / 49

Introduction
z. kiss (elte/delg) intro phono 3/acoustics 2 / 49

Introduction
z. kiss (elte/delg) intro phono 3/acoustics 3 / 49

Introduction
z. kiss (elte/delg) intro phono 3/acoustics 4 / 49

Introduction
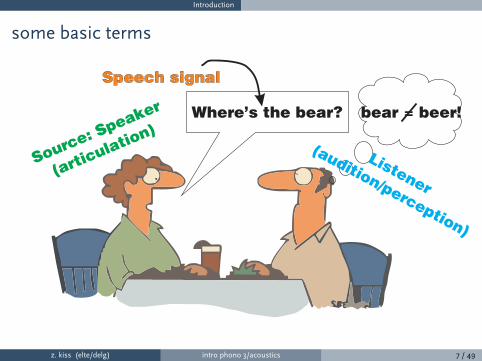
contrast
beer ←→ bear
z. kiss (elte/delg) intro phono 3/acoustics 5 / 49

Introduction
contrast: how?
?what makes the contrast possible?
z. kiss (elte/delg) intro phono 3/acoustics 6 / 49
Introduction
some basic terms
z. kiss (elte/delg) intro phono 3/acoustics 7 / 49

Introduction
acoustic cues
z. kiss (elte/delg) intro phono 3/acoustics 8 / 49

sound waves
acoustics
definition and etymology
◮ acoustics is a branch of physics and is the study of sound (which ischaracterized as mechanical waves in gases, liquids, and solids)
◮ acoustic is derived from the Greek word Ćkoustoc ‘able to be heard’
◮ it is concerned with the production, control, transmission, reception,and e=ects of sound
◮ it aims at describing and quantifying the properties of sounds with thehelp of various wave-related models
acoustic phonetics
deals with the acoustic properties and quantification of speech sounds
z. kiss (elte/delg) intro phono 3/acoustics 9 / 49
sound waves
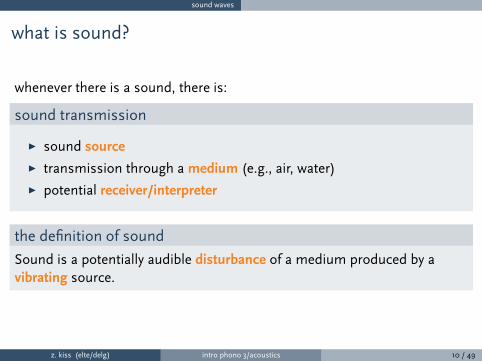
what is sound?
whenever there is a sound, there is:
sound transmission
◮ sound source
◮ transmission through a medium (e.g., air, water)
◮ potential receiver/interpreter
the definition of sound
Sound is a potentially audible disturbance of a medium produced by avibrating source.
z. kiss (elte/delg) intro phono 3/acoustics 10 / 49

sound waves
how to measure sounds?
two problems:
◮ sound is invisible
◮ most sounds are fairly complex
the task:
◮ make sound visible for analysis
◮ deal with the simplest sounds first
z. kiss (elte/delg) intro phono 3/acoustics 11 / 49
sound waves
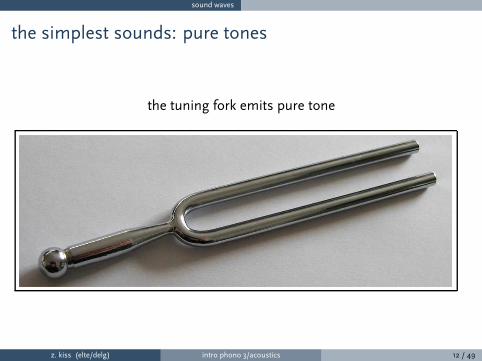
the simplest sounds: pure tones
the tuning fork emits pure tone
z. kiss (elte/delg) intro phono 3/acoustics 12 / 49

sound waves
the sound of the tuning fork
z. kiss (elte/delg) intro phono 3/acoustics 13 / 49

sound waves
simple periodic motion (SPM)
the SPM of the tuning fork
◮ the tines of the tuning fork vibrate in simple
periodic motion
◮ the tines move back and forth one fixed
number of times per second
(no matter how hard the fork is struck)
◮ periodic motion: the pattern repeats itselfuntil it damps out
z. kiss (elte/delg) intro phono 3/acoustics 14 / 49

sound waves
simple periodic motion (SPM)
the SPM of the tuning fork
◮ a complete movement:starting/rest position >maximum displacement >back over starting position >maximum displacement >back to starting position= a cycle (c)
◮ frequency (F): the number of completedcycles per second (s) (Hertz (Hz) or cps)
◮ the tines complete 440 cycles per second,frequency of the tuning fork = 440 Hz
z. kiss (elte/delg) intro phono 3/acoustics 15 / 49

sound waves
more simple periodic motion (SPM):
the swing & the pendulum of the grandfather clock
z. kiss (elte/delg) intro phono 3/acoustics 16 / 49

sound waves
graphing SPM
Let’s try to record SPMin a graph!
(demo)
z. kiss (elte/delg) intro phono 3/acoustics 17 / 49

sound waves
graphing SPM: sound wave/waveform
z. kiss (elte/delg) intro phono 3/acoustics 18 / 49

sound waves
graphing SPM: sinus waveform
z. kiss (elte/delg) intro phono 3/acoustics 19 / 49

sound waves
graphing SPM: sinus waveform
z. kiss (elte/delg) intro phono 3/acoustics 20 / 49

sound waves
2 definitions
waveform
A graphical display of how amplitude varies over time.
simple harmonic motion (SHM)
A motion whose waveform is a sinus wave.
−→ the SPM of the tuning fork is a simple harmonic motion
z. kiss (elte/delg) intro phono 3/acoustics 21 / 49

sound waves
waveform properties
2 independent properties:
1. TIME, expressed as period (T) = time for a cycle to complete(expressed in seconds)◮ in the graph T = 0.01 sORfrequency (Hz) = number of cycles in a second◮ in the graph frequency = ??? Hz
2. (PEAK) AMPLITUDE: the distance from the zero crossing
z. kiss (elte/delg) intro phono 3/acoustics 22 / 49

sound waves
the sound of the tuning fork
z. kiss (elte/delg) intro phono 3/acoustics 23 / 49

sound waves
the propagation of sound: pressure wave movement
z. kiss (elte/delg) intro phono 3/acoustics 24 / 49

sound waves
sound propagation (of the pure tone): summary
◮ SHM of sound source
◮ SHM of air particle set in motion by source
◮ air particle moves in sympathy with the SHM of source
◮ individual particle has limited motion
◮ areas of air compression and rarefaction /�re@rI"fækSn/ are created
◮ compression and rarefaction areas move in time away from source,transmitting the SHM of source (pressure wave movement)
◮ listener senses same SHM as that of the source: sound has beenpropagated
z. kiss (elte/delg) intro phono 3/acoustics 25 / 49

sound waves
representations of sound propagation: waveform
z. kiss (elte/delg) intro phono 3/acoustics 26 / 49

sound waves
graphing SHM of air particles: waveform
z. kiss (elte/delg) intro phono 3/acoustics 27 / 49
sound waves
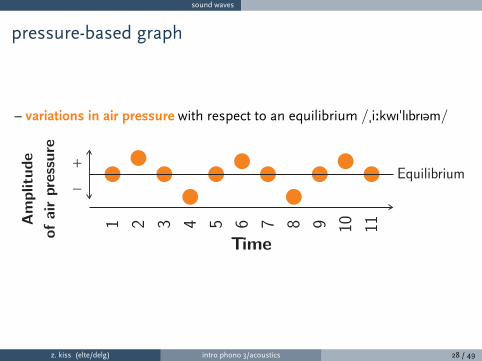
pressure-based graph
– variations in air pressure with respect to an equilibrium /�i:kwI"lIbrI@m/
z. kiss (elte/delg) intro phono 3/acoustics 28 / 49
sound waves
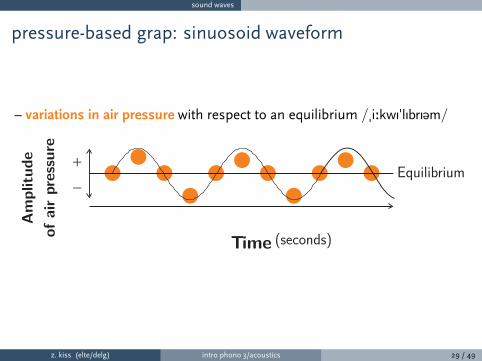
pressure-based grap: sinuosoid waveform
– variations in air pressure with respect to an equilibrium /�i:kwI"lIbrI@m/
z. kiss (elte/delg) intro phono 3/acoustics 29 / 49

sound waves
the sound of the tuning fork
z. kiss (elte/delg) intro phono 3/acoustics 30 / 49

frequency
change in frequency⇒ subjective sensation of pitch
z. kiss (elte/delg) intro phono 3/acoustics 31 / 49

frequency
some important facts about frequency
◮ when a sound is twice the frequency of another sound, it is an octave
higher
◮ frequency range of human hearing: 20 Hz–20,000 Hz
◮ speech sound analysis usually involves the range between100 Hz–10,000 Hz
z. kiss (elte/delg) intro phono 3/acoustics 32 / 49
frequency
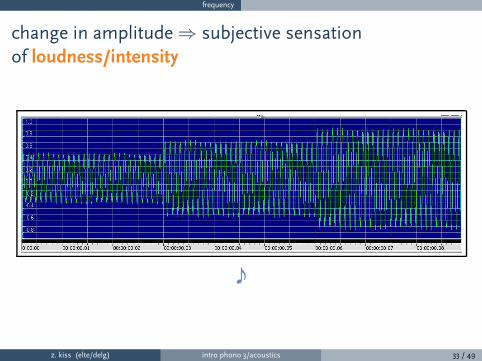
change in amplitude⇒ subjective sensation
of loudness/intensity
z. kiss (elte/delg) intro phono 3/acoustics 33 / 49

amplitude
the decibel: a measure of relative intensity
why the decibel scale?
◮ air pressure amplitude is measured in pascals (Pa)
◮ the pascal scale is a linear scale: each increment is equal to the next
◮ the sensation of sound loudness/intensity is related to amplitude;however,
◮ it is not linear but logarithmic, that is,
◮ it is constructed with increments with increasingly larger numericaldi=erences
◮ the decibel (dB) scale (or “sound pressure level (SPL) scale”) is alogarithmic scale of the amplitude of air pressure variations
◮ the dB scale has intervals that are roughly equal to perceived loudness
z. kiss (elte/delg) intro phono 3/acoustics 34 / 49

amplitude
0 dB = 20 µPa(the threshold of hearing; the buzz of a mosquito around 3 meters away)
z. kiss (elte/delg) intro phono 3/acoustics 35 / 49

amplitude
80 dB (≈ 100000 µPa)(average street tra;c)
z. kiss (elte/delg) intro phono 3/acoustics 36 / 49

amplitude
140 dB (= 100,000,000 µPa)(threshold of pain; jet engine at 25m distance)
z. kiss (elte/delg) intro phono 3/acoustics 37 / 49

synthesis
?what about complex sounds?!
(speech sounds are nothing like pure tones!)
z. kiss (elte/delg) intro phono 3/acoustics 38 / 49

synthesis
how can we characterize complex waves?
Jean Baptiste Joseph Fourier(1768–1830)
◮ key idea: if we can reduce a complex periodic waveform into acombination of sine waves
◮ then we can describe it using information about the frequency andamplitude of each component sine wave
z. kiss (elte/delg) intro phono 3/acoustics 39 / 49

synthesis
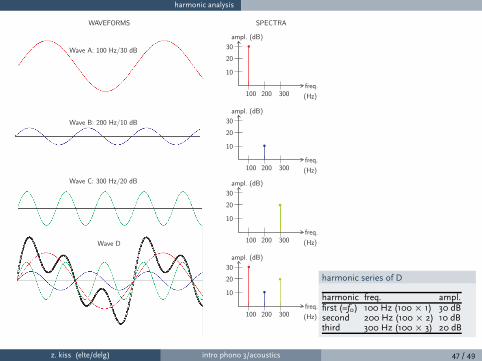
to build a complex wave is like a recipe, e.g., take
◮ 1 100 Hz/30 dB sinus wave, then add
◮ 1 200 Hz/10 dB sinus wave, and also add
◮ 1 300 Hz/20 dB sinus wave
This addition of two or more di=erent sine waves to create a complexperiodic wave is called synthesis.
z. kiss (elte/delg) intro phono 3/acoustics 40 / 49

synthesis
waveform of a complex tone derives from 2 or more pure
tones of di=erent frequency and/or amplitude
z. kiss (elte/delg) intro phono 3/acoustics 41 / 49

synthesis
three important consequences of synthesis
◮ the amplitudes of the complex wave depends on the addition of theamplitudes of the component waves
◮ the sine wave with the smallest frequency will define the main/basicrepetition frequency of the complex wave: fundamental frequency f0
◮ the other sine wave frequencies present in the complex wave are calledharmonics (H) (or: overtones);
harmonics and f0
harmonics are integer (whole number) multiples of the f0(this is because each sine wave component must complete a whole number of cycles within
one period of the complex)
z. kiss (elte/delg) intro phono 3/acoustics 42 / 49

harmonic analysis
Our example complex wave has this harmonic series
(also called Fourier series):
Harmonic Frequency Amplitude
H1 (= f0) 100 (100× 1) Hz 30 dBH2 200 (100× 2) Hz 10 dBH3 300 (100× 3) Hz 20 dB
harmonic analysis
the reverse of synthesis, finding (characterizing) the component sine waveharmonics of the complex wave
z. kiss (elte/delg) intro phono 3/acoustics 43 / 49

harmonic analysis
Fourier’s theorem (1822)
◮ All complex periodic waveforms can be analysed into a sum ofsinusoidal component waveforms (harmonics).
◮ The mathematical algorithm of this process of harmonic analysis iscalled Fourier analysis or Fourier transformation.
z. kiss (elte/delg) intro phono 3/acoustics 44 / 49

harmonic analysis
?how can we graphically represent harmonic analysis?
z. kiss (elte/delg) intro phono 3/acoustics 45 / 49

harmonic analysis
spectrum graphs
◮ the (power/amplitude/line/sound) spectrum (plural: spectra): is a plotof the results of harmonic analysis
◮ frequency of harmonic: horizontal axis
◮ amplitude of harmonic: vertical axis
◮ time and phase: not shown (Fourier analysis is taken at a particularinstant of time)
z. kiss (elte/delg) intro phono 3/acoustics 46 / 49
harmonic analysis
harmonic series of D
harmonic freq. ampl.first (=f0) 100 Hz (100 × 1) 30 dBsecond 200 Hz (100 × 2) 10 dBthird 300 Hz (100 × 3) 20 dB
z. kiss (elte/delg) intro phono 3/acoustics 47 / 49

harmonic analysis
loudness, pitch, quality: a summary
◮ all these components are independent of each other:
◮ sound loudness depends on amplitude
◮ sound pitch depends on f0◮ sound quality/timbre depends on the spectrum (harmonic series)
z. kiss (elte/delg) intro phono 3/acoustics 48 / 49
harmonic analysis
contrast: depends on the spectrum
beer ←→ bear
z. kiss (elte/delg) intro phono 3/acoustics 49 / 49