bay area emission reduction strategies june 4, 2008 jean roggenkamp deputy air pollution control...
TRANSCRIPT
Bay Area Emission
Reduction StrategiesJune 4, 2008
Jean RoggenkampDeputy Air Pollution Control Officer
Bay Area Air Quality Management District
Bay Area Air Quality Management District
2
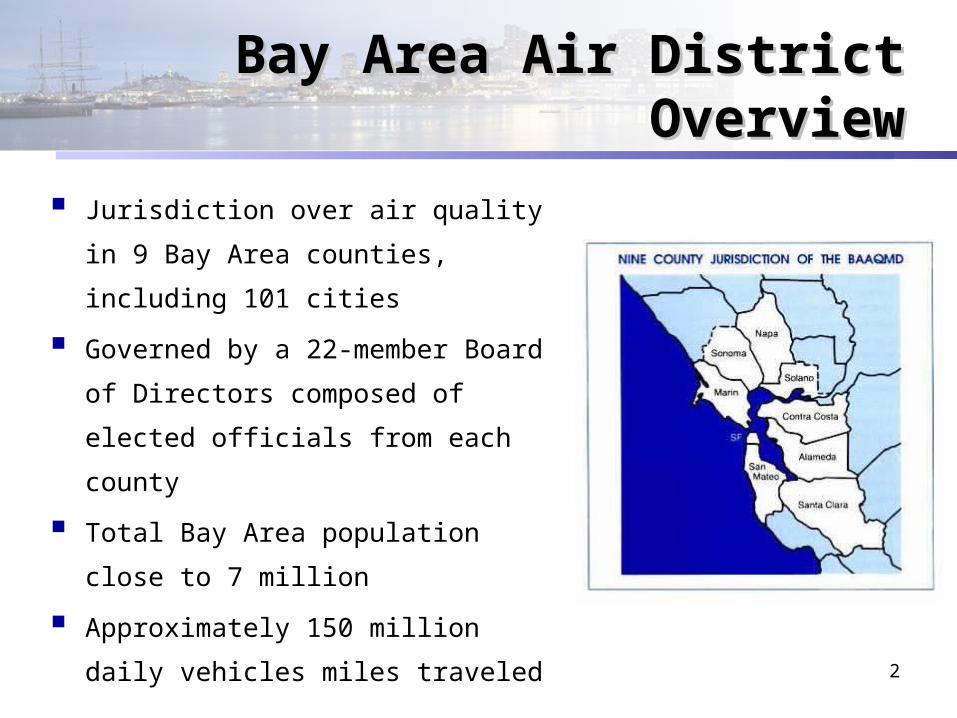
Bay Area Air District Bay Area Air District OverviewOverview
Jurisdiction over air quality in 9 Bay
Area counties, including 101 cities
Governed by a 22-member Board of
Directors composed of elected officials
from each county
Total Bay Area population close to 7
million
Approximately 150 million daily vehicles
miles traveled
3
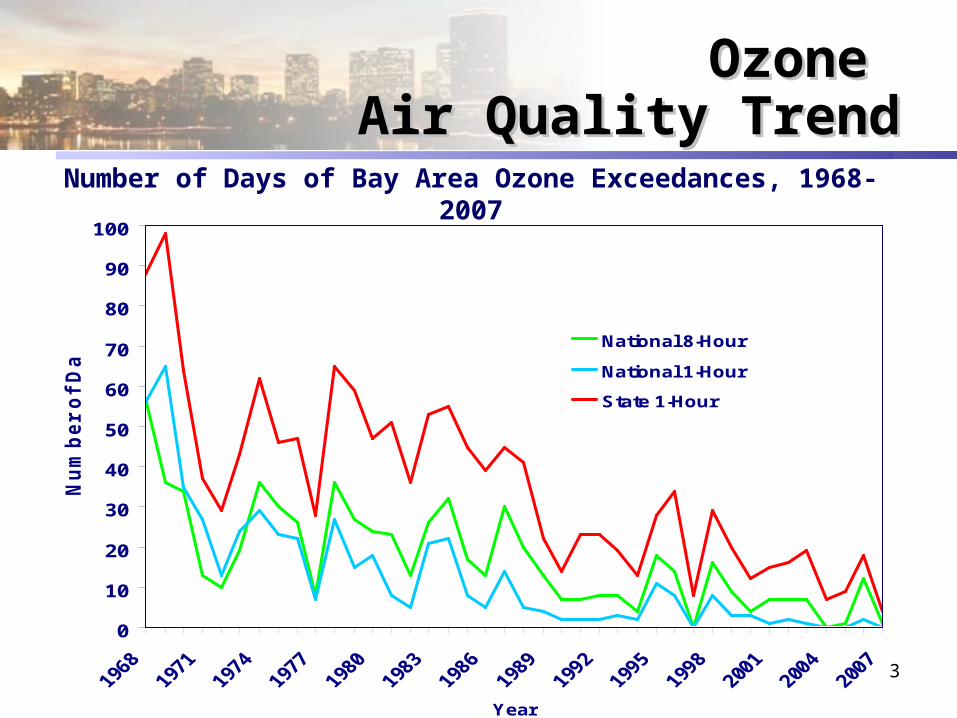
Ozone Ozone Air Quality TrendAir Quality Trend
Number of Days of Bay Area Ozone Exceedances, 1968- 2007
0
10
20
30
40
50
60
70
80
90
100
Year
Nu
mb
er
of
Da
ys National 8-Hour
National 1-Hour
State 1-Hour
4
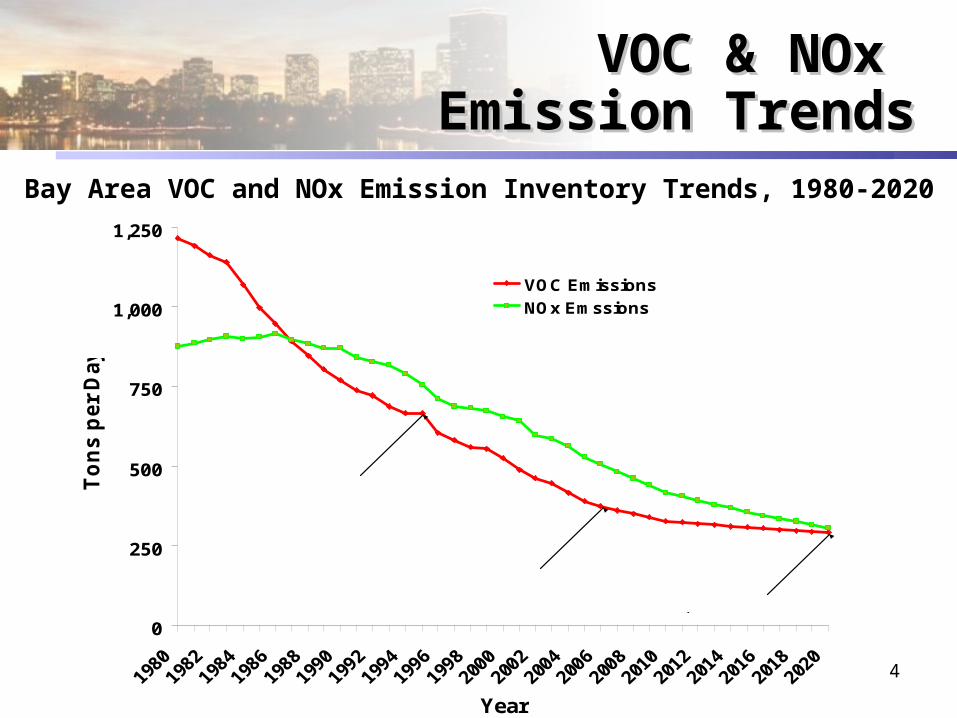
VOC & NOx VOC & NOx Emission TrendsEmission Trends
Bay Area VOC and NOx Emission Inventory Trends, 1980-2020
0
250
500
750
1,000
1,250
Year
To
ns p
er
Day
VOC Emissions
NOx Emssions
665 tpd 1995
374 tpd 2006291 tpd 2020

5
Recent Rules Recent Rules to Reduce Ozone Levelsto Reduce Ozone Levels
Wastewater Systems Rule, control on organic emissions from refinery wastewater collection systems (2004)
Flare Control Rule, enhance flare emissions control from refineries (2005, 2006)
Marine Loading Operations Rule, add cargos to existing control requirements (2005)
Episodic emissions from pressure relief devices at refineries (2005)
Organic Liquid Storage Rule, enhance equipment standards (2006)
Stationary Gas Turbines, control on NOx emissions from turbines (2006)
Stationary Internal Combustion Engines, reduce NOx limits (2007)
Water Heaters, reduce NOx limits (2007)

6
Upcoming Rules Upcoming Rules to Reduce Ozone Levelsto Reduce Ozone Levels
Boilers, Steam Generators and Process Heaters, reduce
NOx emissions
Auto Refinishing Rule, reduce VOC emissions
Gasoline Bulk Plants, Terminals and Delivery Vehicles,
reduce VOC emissions
Graphic Arts Operations, reduce VOC emissions
Wood Products Coatings, reduce VOC emissions
Architectural Coatings, reduce VOC emissions
7
Non-Regulatory Non-Regulatory Ozone Reduction Activities Ozone Reduction Activities
Spare the Air
Grants and Incentives
Vehicle Buy Back
Demonstration Projects
Transportation Control Measures

8
Recent ActionsRecent Actionsto Reduce Particulate Matter to Reduce Particulate Matter
Comprehensive Wood Smoke Rule
- Phase in mandatory wood burning curtailment on Spare the Air nights
- Require cleaner burning technology in new construction
- Visible emissions limitations
- Rule to Board on July 9, 2008
Charbroiler Rule
- Requires energy efficient control devices and sets VOC and PM emission standards for chain-
driven and underfired charbroilers
- Rule adopted in December 2007
Stationary Internal Combustion Engine Rule
- Lower emission limits and expand applicability to more engines
- Rule adopted July 2007

9
Bay AreaBay AreaExtreme Heat Days Extreme Heat Days
Nu
mb
er o
f E
xtre
me
Hea
t d
ays
per
Yea
r
0
20
40
60
80
100
120
140
Currently Higher Warming Scenario
Mid Warming Scenario
Low Warming Scenario
Source: CEC 2006 Report “Our Changing Climate”
10
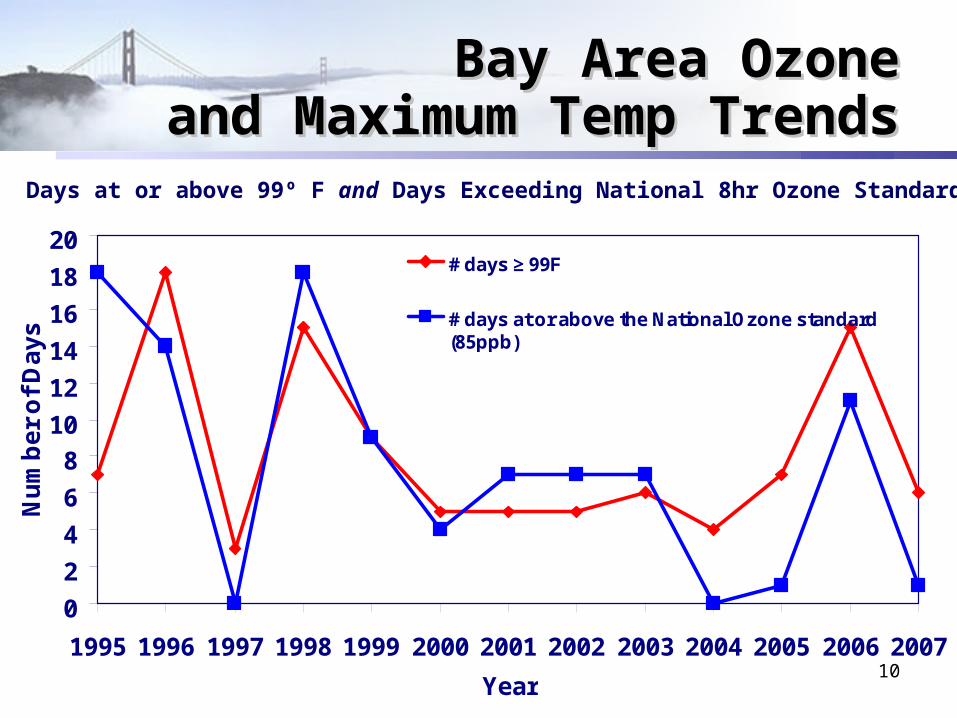
Bay Area OzoneBay Area Ozoneand Maximum Temp Trendsand Maximum Temp Trends
Days at or above 99º F and Days Exceeding National 8hr Ozone Standard
0
2
4
6
8
10
12
14
16
18
20
1995 1996 1997 1998 1999 2000 2001 2002 2003 2004 2005 2006 2007
Year
Nu
mb
er
of
Da
ys
# days ≥ 99F
# days at or above the National Ozone standard(85ppb)
11
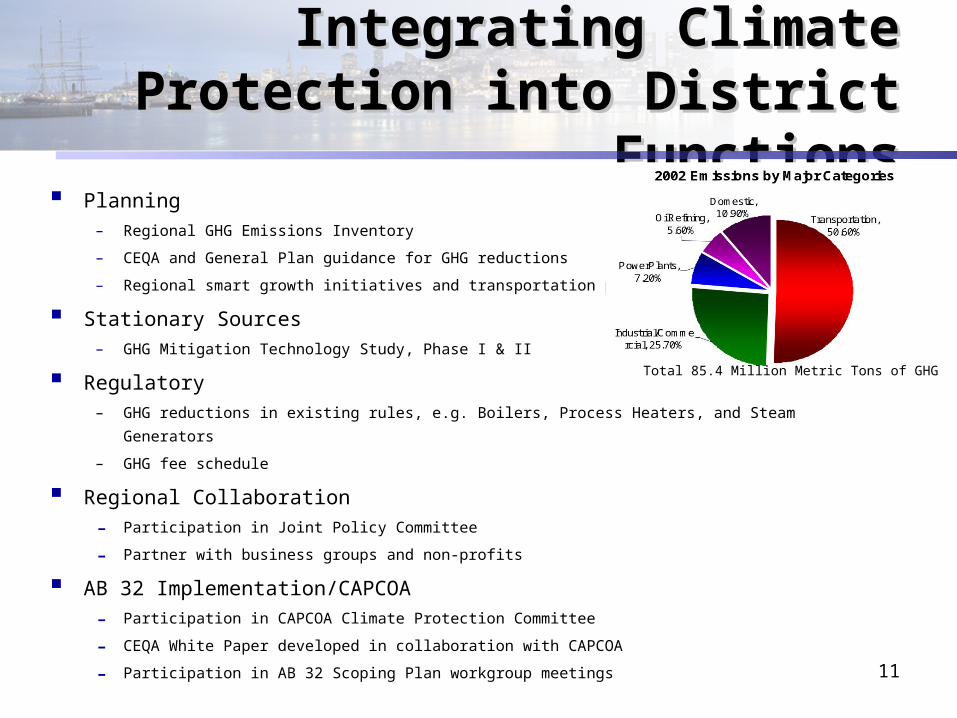
Integrating Climate Protection Integrating Climate Protection into District Functionsinto District Functions
Planning– Regional GHG Emissions Inventory
– CEQA and General Plan guidance for GHG reductions
– Regional smart growth initiatives and transportation plans
Stationary Sources– GHG Mitigation Technology Study, Phase I & II
Regulatory– GHG reductions in existing rules, e.g. Boilers, Process Heaters, and Steam Generators
– GHG fee schedule
Regional Collaboration
- Participation in Joint Policy Committee
- Partner with business groups and non-profits
AB 32 Implementation/CAPCOA
- Participation in CAPCOA Climate Protection Committee
- CEQA White Paper developed in collaboration with CAPCOA
- Participation in AB 32 Scoping Plan workgroup meetings
Total 85.4 Million Metric Tons of GHG
12
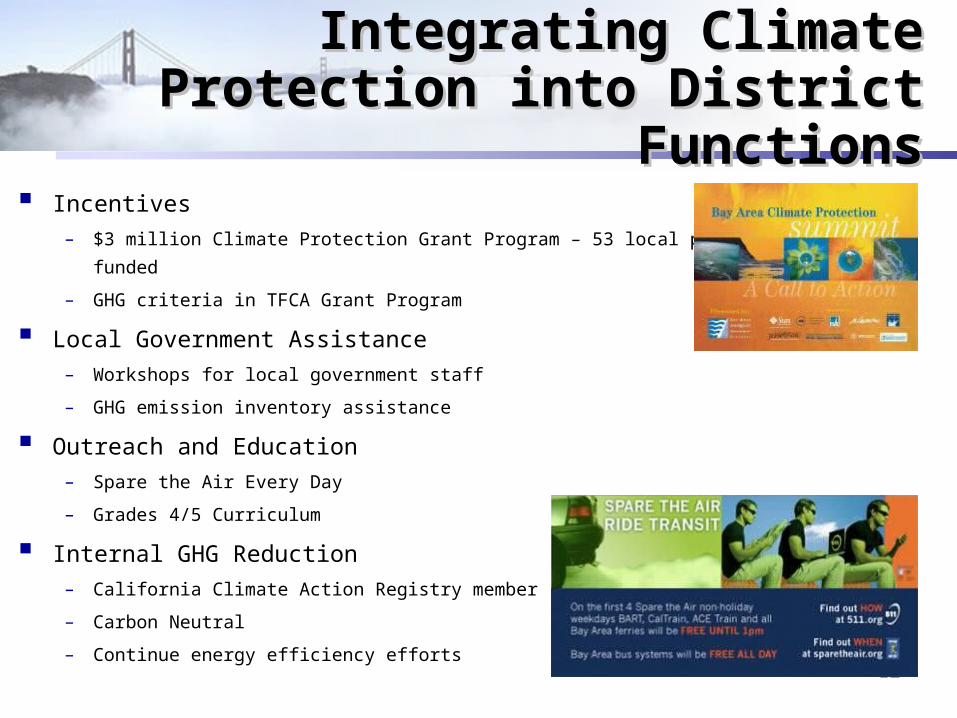
Integrating Climate Protection Integrating Climate Protection into District Functionsinto District Functions
Incentives
– $3 million Climate Protection Grant Program – 53 local projects funded
– GHG criteria in TFCA Grant Program
Local Government Assistance
– Workshops for local government staff
– GHG emission inventory assistance
Outreach and Education
– Spare the Air Every Day
– Grades 4/5 Curriculum
Internal GHG Reduction
– California Climate Action Registry member
– Carbon Neutral
– Continue energy efficiency efforts

13
ChallengesChallenges
• More stringent ozone standards
• More stringent PM standards
• Emission reductions needed from all sources, no low hanging fruit left
• Goods movement emission reductions (federal sources)
• Climate change impacts on air quality, including an increase in ambient
temperatures and ozone formation conditions
• Implementation of the Global Warming Solutions Act (AB32)