bay area air quality management district's comment letter
TRANSCRIPT
DOCKETED Docket Number: 20-SPPE-02
Project Title: Lafayette Backup Generating Facility
TN #: 239573
Document Title: Bay Area Air Quality Management District's Comment Letter for
Lafayette Data Center NOP
Description: N/A
Filer: System
Organization: Bay Area Air Quality Management District
Submitter Role: Public Agency
Submission Date: 9/1/2021 4:27:40 PM
Docketed Date: 9/1/2021

Comment Received From: Bay Area Air Quality Management District Submitted On: 9/1/2021
Docket Number: 20-SPPE-02
Comment Letter for Lafayette Data Center NOP
Additional submitted attachment is included below.
375 BEALE STREET, SUITE 600 • SAN FRANCISCO CA • 94105 • 415.771.6000 • www.baaqmd.gov
September 1, 2021 Leonidas Payne Siting, Transmission and Environmental Protection Division California Energy Commission 1516 Ninth Street Sacramento, CA 95814 RE: Lafayette Data Center – Notice of Preparation Dear Mr. Payne, Bay Area Air Quality Management District (Air District) staff has reviewed the Notice of Preparation (NOP) of an Environmental Impact Report (EIR) for the Lafayette Data Center (Project). The Project applicant proposes to demolish two existing on-site office buildings and construct a three-story 576,120 square foot data center building, generator equipment yard, surface parking, and landscaping on a 15.45-acre site in the City of Santa Clara. Silicon Valley Power (SVP) would supply electricity to the Project through a new distribution substation that would be constructed as part of the Project. The backup generating facility would include 44 3-MW Tier 4 diesel-fired backup generators and a 0.8-MW emergency generator for the administrative/office areas of the Project. As the lead agency, the California Energy Commission (CEC) can grant the project applicant a Small Power Plant Exemption if it finds that the proposed project would not create a substantial adverse impact on the environment or energy resources. The Project will require Air District approval of an Authority to Construct and Permit to Operate the backup diesel generators, and as such, the Project will be required to comply with all applicable Air District regulations. The Air District has worked for many years to improve air quality and health in the San Francisco Bay Area, including Santa Clara County, and continues to do so today. Since the Project is in an area that has long been disproportionately impacted by air pollution and is identified as a priority community through our Community Air Risk Evaluation (CARE) program and by the State of California as a Senate Bill 535 disadvantaged community, the Air District is concerned about the potential for any increase in emissions that could result from the Project. Because diesel combustion produces fine particulate matter (PM), toxic air contaminants, and greenhouse gases (GHGs), the Air District encourages the CEC to go beyond current regulatory requirements and require the project applicant to adopt the use of cleaner, non-diesel technologies.
ALAMEDA COUNTY John J. Bauters
(Secretary) Pauline Russo Cutter
David Haubert Nate Miley
CONTRA COSTA COUNTY
John Gioia David Hudson Karen Mitchoff
(Vice Chair) Mark Ross
MARIN COUNTY
Katie Rice
NAPA COUNTY Brad Wagenknecht
SAN FRANCISCO COUNTY
Tyrone Jue (SF Mayor’s Appointee)
Myrna Melgar Shamann Walton
SAN MATEO COUNTY
David J. Canepa Carole Groom Davina Hurt
SANTA CLARA COUNTY
Margaret Abe-Koga Cindy Chavez
(Chair) Rich Constantine
Rob Rennie
SOLANO COUNTY Erin Hannigan
Lori Wilson
SONOMA COUNTY Teresa Barrett Lynda Hopkins
Jack P. Broadbent EXECUTIVE OFFICER/APCO

Leonidas Payne September 1, 2021 Page 2
Air District staff further recommends the EIR include the following information and analysis:
• The GHG impact analysis should include an evaluation of the Project’s consistency with the most recent draft of the AB 32 Scoping Plan by the California Air Resources Board and with the State's 2030, 2045, and 2050 climate goals. The current recommended GHG thresholds in the Air District’s 2017 CEQA Guidelines are based on the State’s 2020 GHG targets which are now superseded by the 2030 GHG targets established in SB 32. The EIR should demonstrate how the Project will be consistent with the Scoping Plan as well as the State’s long-term climate goals. This includes an evaluation and discussion of how the GHG emissions associated with the electricity used by the data center and diesel fuel combusted by the backup power generators (including non-testing/non-maintenance operations) are consistent with the State’s goal of carbon neutrality as soon as possible and no later than 2045.
• The EIR should estimate and evaluate the potential health risk to existing and future
sensitive populations within and near the Project area from toxic air contaminants (TAC) and fine particulate matter (PM2.5) as a result of the Project’s construction and operation. Air District staff recommends the EIR evaluate potential cumulative health risk impacts of TAC and PM2.5 emissions on sensitive receptors within and near the Project area.
• The EIR should include various scenarios of backup power generation operations
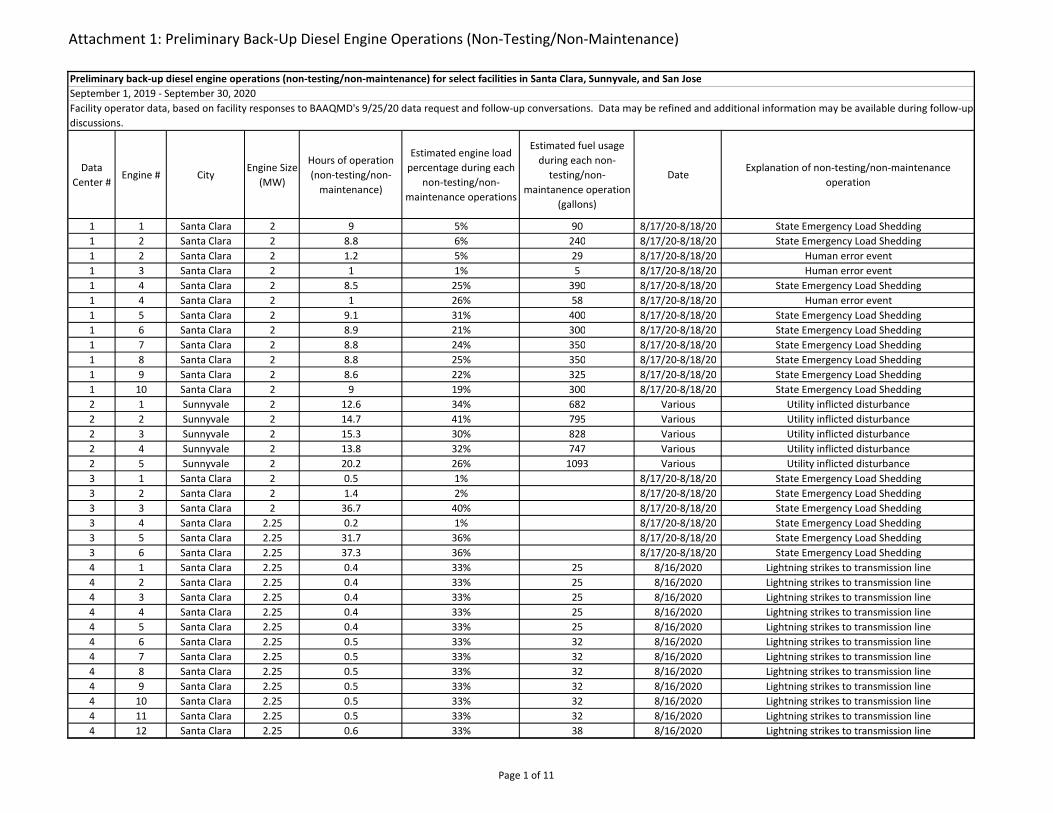
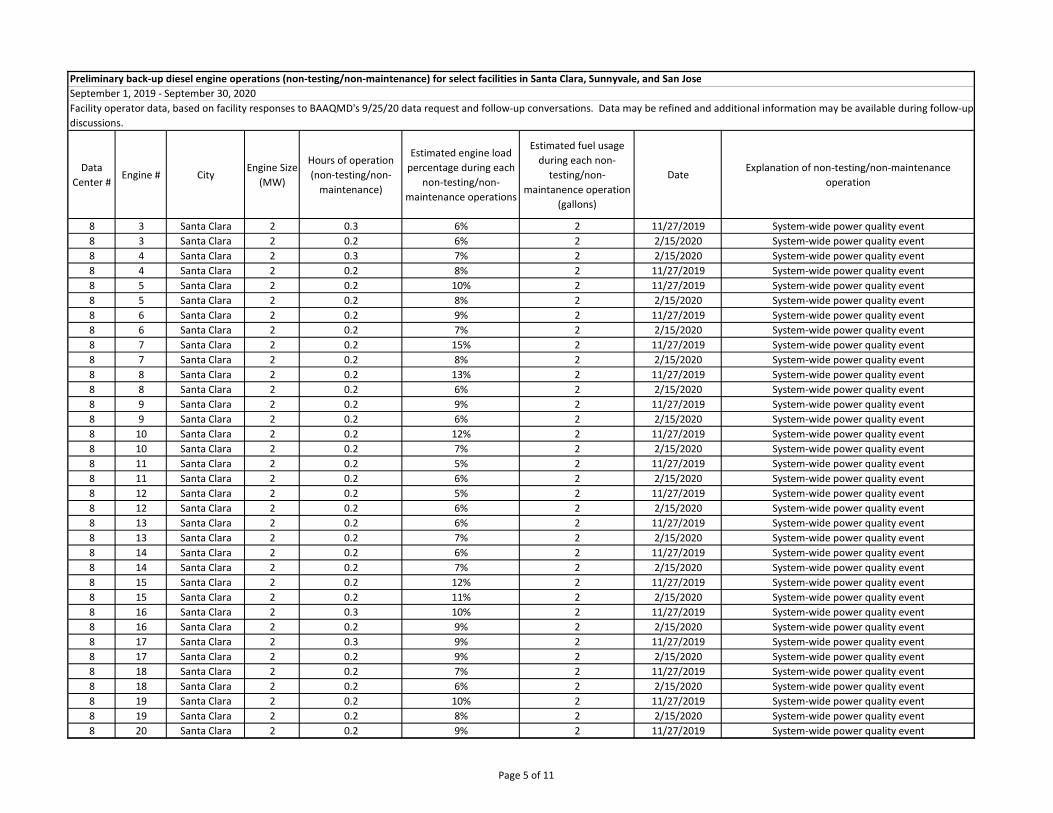
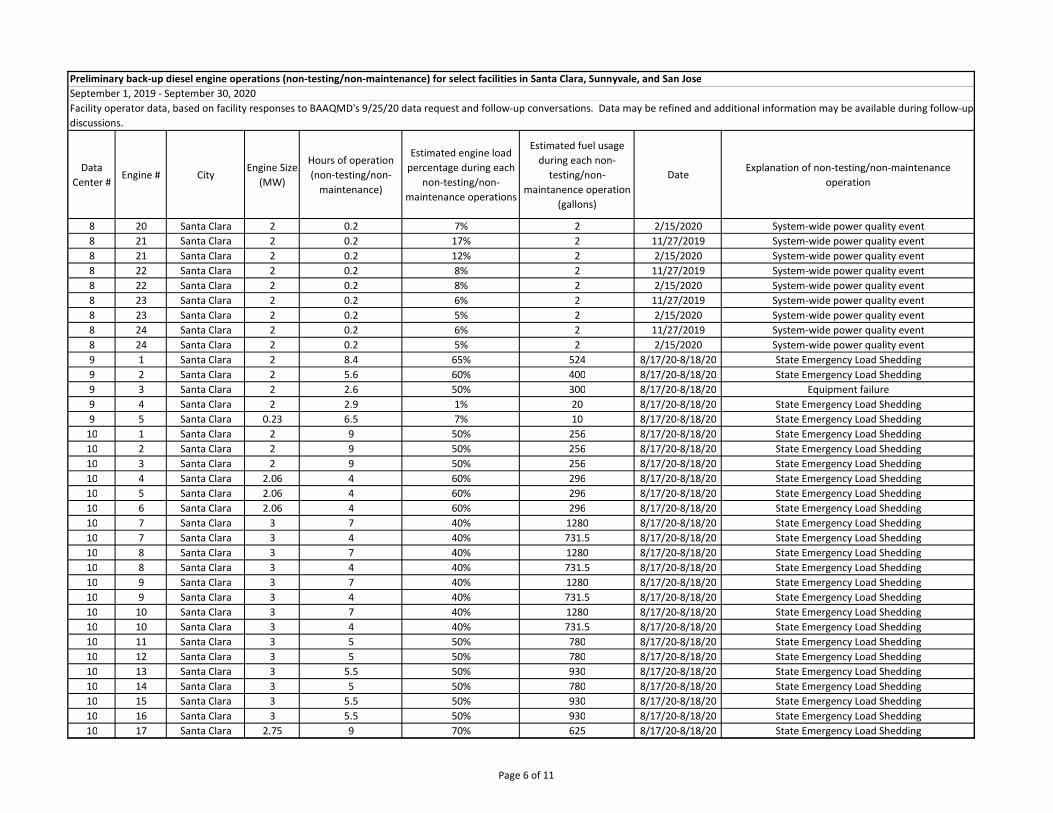
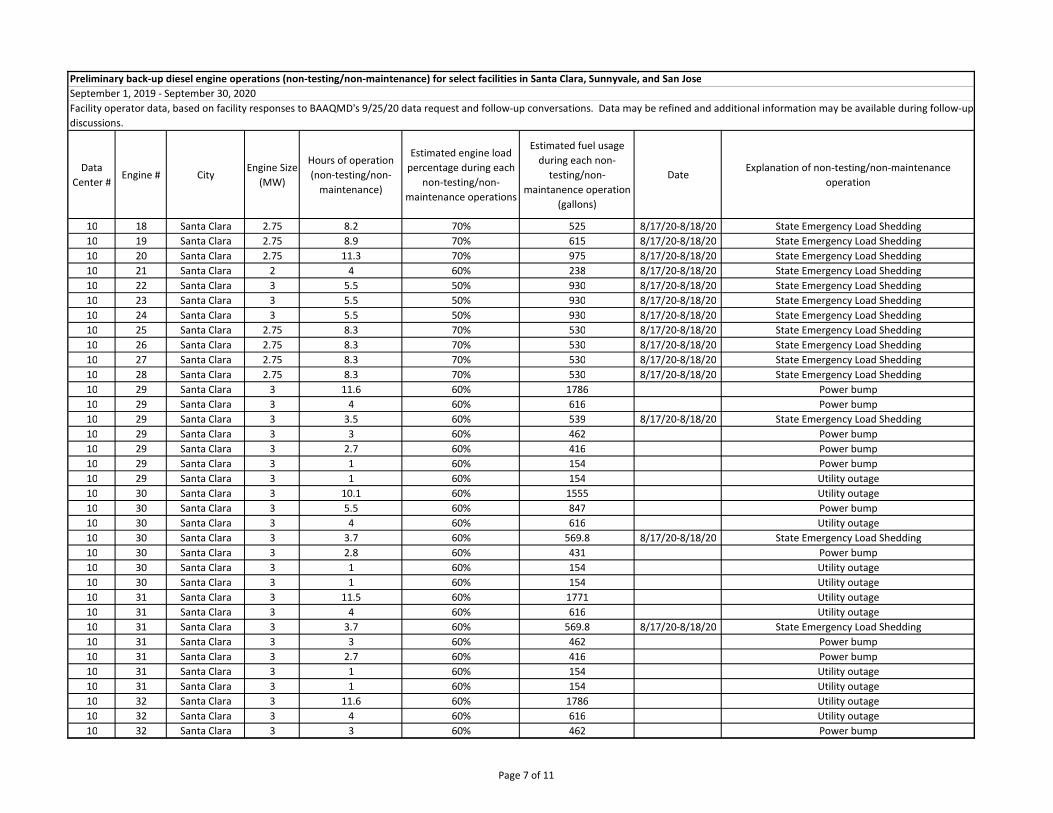
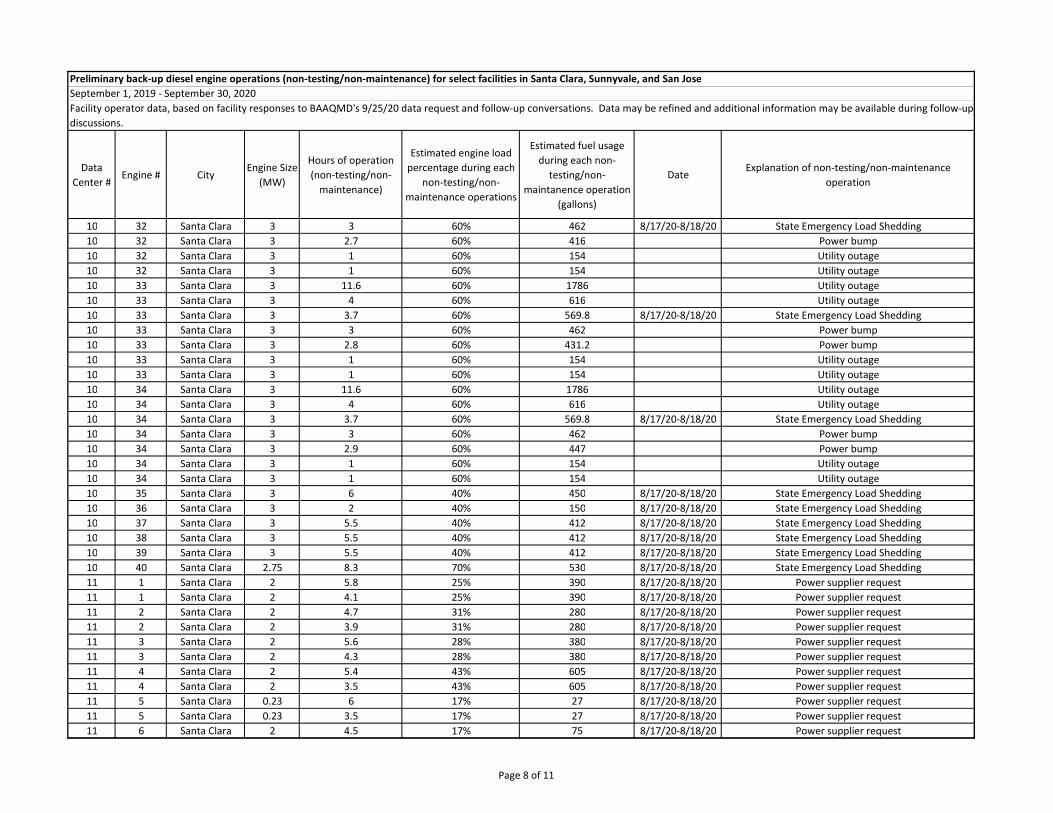
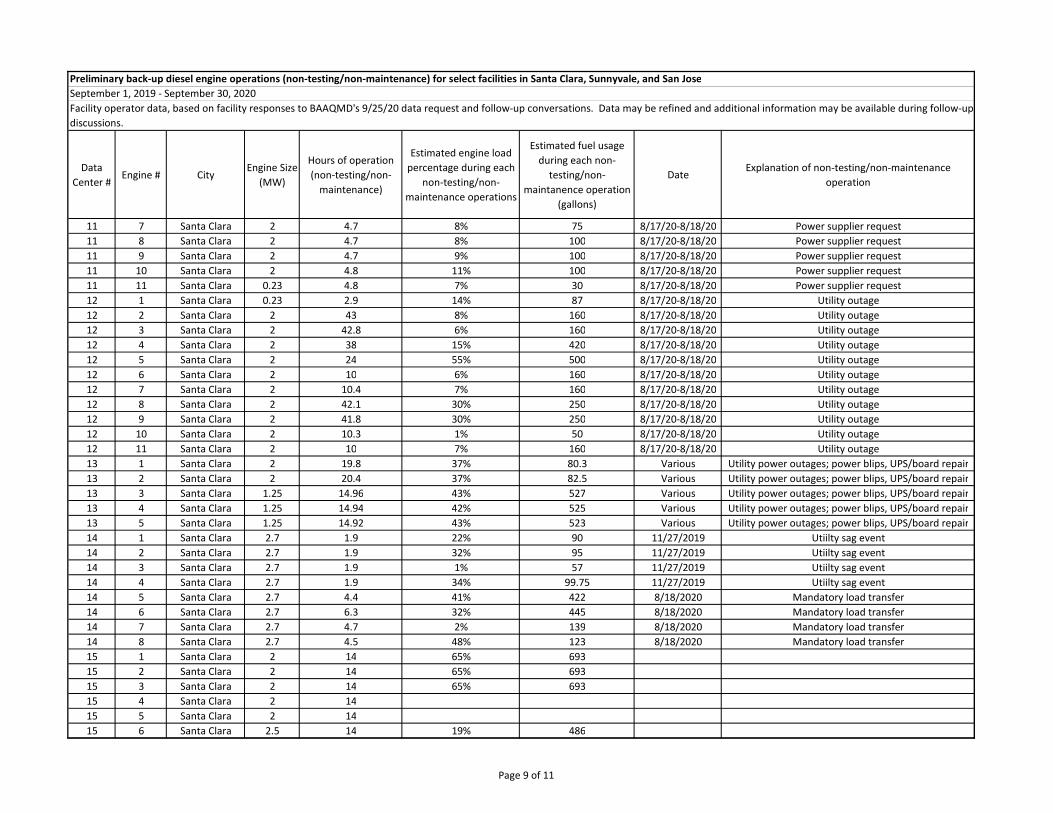
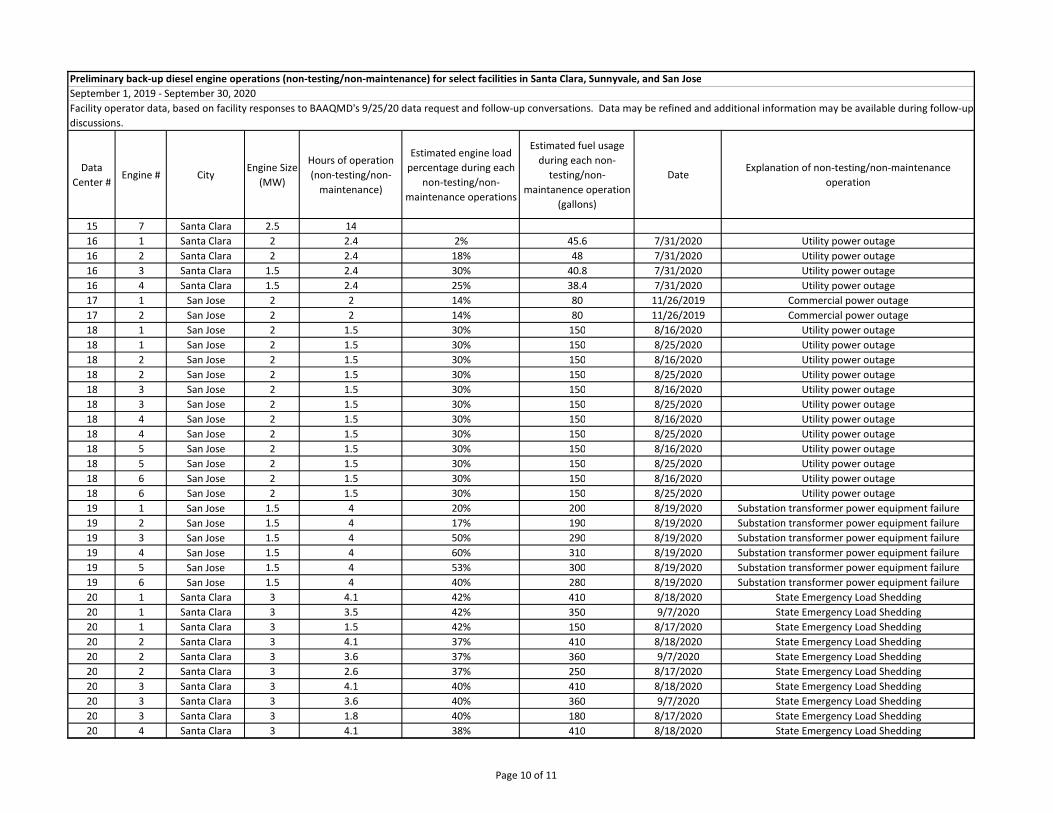
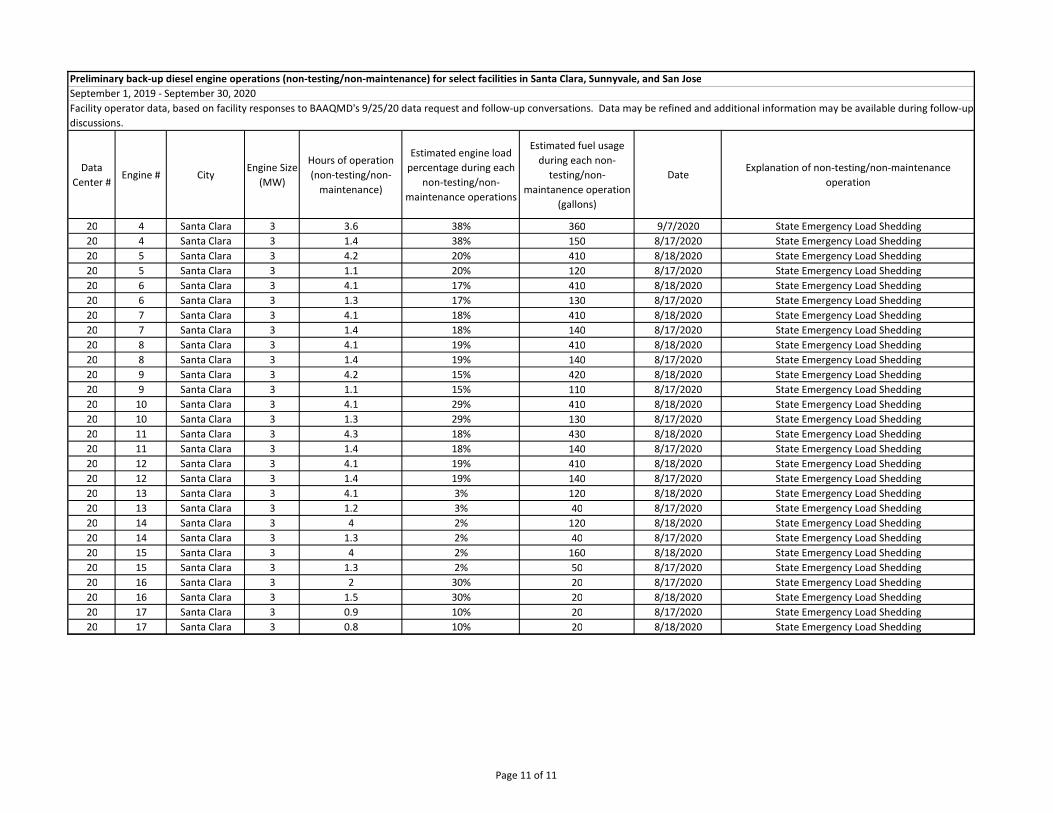
beyond routine testing and maintenance. Air District staff has reviewed recent data regarding backup generator usage during non-testing/non-maintenance operations at several Bay Area data centers. Between September 1, 2019, and September 30, 2020, nearly half of the identified data centers in Santa Clara, San Jose, and Sunnyvale operated backup diesel generators for reasons other than routine testing and maintenance. Many of the data centers operated diesel generators during multiple non-testing/non-maintenance events over the course of this period, with operations approaching 50 hours for one generator for one event; with 40 or more generators operating concurrently at two facilities; and with one facility running diesel generators for approximately 400 hours. Please see Attachment 1 for preliminary information on non-testing/non-maintenance operations that the Air District has received from data centers. These data demonstrate the need to evaluate non-testing/non-maintenance operations. Air District staff recommends that the DEIR include GHG, criteria pollutant, and TAC impacts due to the non-testing/non-maintenance operations of backup power generators. Various scenarios should be considered for non-testing/non-maintenance operations, including non-zero hours of operation and concurrent generator operations.
Leonidas Payne September 1, 2021 Page 3
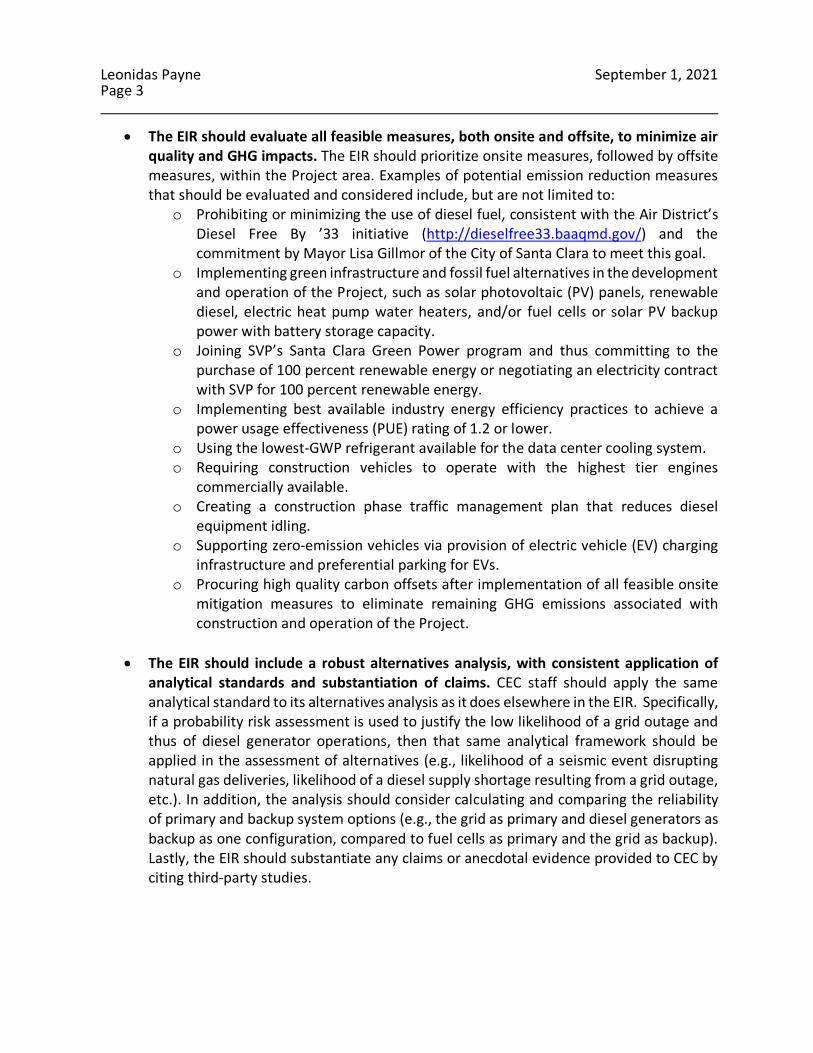
• The EIR should evaluate all feasible measures, both onsite and offsite, to minimize air quality and GHG impacts. The EIR should prioritize onsite measures, followed by offsite measures, within the Project area. Examples of potential emission reduction measures that should be evaluated and considered include, but are not limited to:
o Prohibiting or minimizing the use of diesel fuel, consistent with the Air District’s Diesel Free By ’33 initiative (http://dieselfree33.baaqmd.gov/) and the commitment by Mayor Lisa Gillmor of the City of Santa Clara to meet this goal.
o Implementing green infrastructure and fossil fuel alternatives in the development and operation of the Project, such as solar photovoltaic (PV) panels, renewable diesel, electric heat pump water heaters, and/or fuel cells or solar PV backup power with battery storage capacity.
o Joining SVP’s Santa Clara Green Power program and thus committing to the purchase of 100 percent renewable energy or negotiating an electricity contract with SVP for 100 percent renewable energy.
o Implementing best available industry energy efficiency practices to achieve a power usage effectiveness (PUE) rating of 1.2 or lower.
o Using the lowest-GWP refrigerant available for the data center cooling system. o Requiring construction vehicles to operate with the highest tier engines
commercially available. o Creating a construction phase traffic management plan that reduces diesel
equipment idling. o Supporting zero-emission vehicles via provision of electric vehicle (EV) charging
infrastructure and preferential parking for EVs. o Procuring high quality carbon offsets after implementation of all feasible onsite
mitigation measures to eliminate remaining GHG emissions associated with construction and operation of the Project.
• The EIR should include a robust alternatives analysis, with consistent application of analytical standards and substantiation of claims. CEC staff should apply the same analytical standard to its alternatives analysis as it does elsewhere in the EIR. Specifically, if a probability risk assessment is used to justify the low likelihood of a grid outage and thus of diesel generator operations, then that same analytical framework should be applied in the assessment of alternatives (e.g., likelihood of a seismic event disrupting natural gas deliveries, likelihood of a diesel supply shortage resulting from a grid outage, etc.). In addition, the analysis should consider calculating and comparing the reliability of primary and backup system options (e.g., the grid as primary and diesel generators as backup as one configuration, compared to fuel cells as primary and the grid as backup). Lastly, the EIR should substantiate any claims or anecdotal evidence provided to CEC by citing third-party studies.
Leonidas Payne September 1, 2021 Page 4
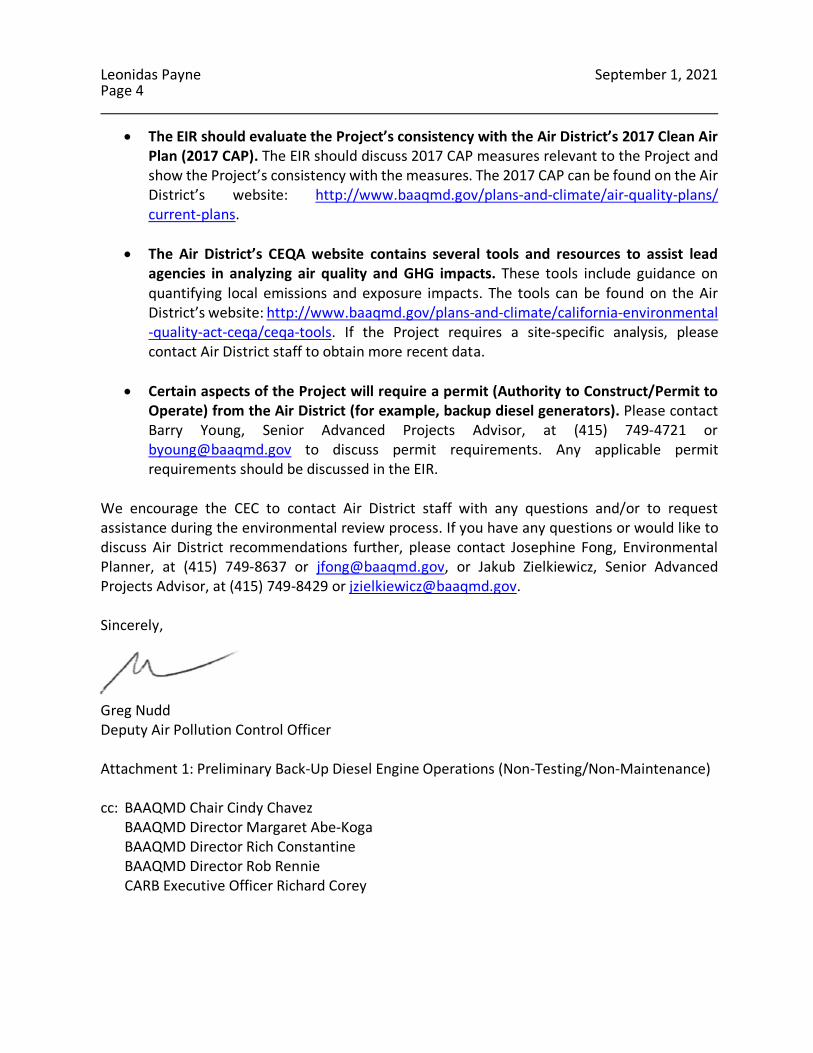
• The EIR should evaluate the Project’s consistency with the Air District’s 2017 Clean Air Plan (2017 CAP). The EIR should discuss 2017 CAP measures relevant to the Project and show the Project’s consistency with the measures. The 2017 CAP can be found on the Air District’s website: http://www.baaqmd.gov/plans-and-climate/air-quality-plans/ current-plans.
• The Air District’s CEQA website contains several tools and resources to assist lead agencies in analyzing air quality and GHG impacts. These tools include guidance on quantifying local emissions and exposure impacts. The tools can be found on the Air District’s website: http://www.baaqmd.gov/plans-and-climate/california-environmental -quality-act-ceqa/ceqa-tools. If the Project requires a site-specific analysis, please contact Air District staff to obtain more recent data.
• Certain aspects of the Project will require a permit (Authority to Construct/Permit to Operate) from the Air District (for example, backup diesel generators). Please contact Barry Young, Senior Advanced Projects Advisor, at (415) 749-4721 or [email protected] to discuss permit requirements. Any applicable permit requirements should be discussed in the EIR.
We encourage the CEC to contact Air District staff with any questions and/or to request assistance during the environmental review process. If you have any questions or would like to discuss Air District recommendations further, please contact Josephine Fong, Environmental Planner, at (415) 749-8637 or [email protected], or Jakub Zielkiewicz, Senior Advanced Projects Advisor, at (415) 749-8429 or [email protected]. Sincerely,
Greg Nudd Deputy Air Pollution Control Officer Attachment 1: Preliminary Back-Up Diesel Engine Operations (Non-Testing/Non-Maintenance) cc: BAAQMD Chair Cindy Chavez BAAQMD Director Margaret Abe-Koga BAAQMD Director Rich Constantine BAAQMD Director Rob Rennie CARB Executive Officer Richard Corey
Data Center #
Engine # CityEngine Size
(MW)
Hours of operation (non-testing/non-
maintenance)
Estimated engine load percentage during each
non-testing/non-maintenance operations
Estimated fuel usage during each non-
testing/non-maintanence operation
(gallons)
DateExplanation of non-testing/non-maintenance
operation
1 1 Santa Clara 2 9 5% 90 8/17/20-8/18/20 State Emergency Load Shedding1 2 Santa Clara 2 8.8 6% 240 8/17/20-8/18/20 State Emergency Load Shedding1 2 Santa Clara 2 1.2 5% 29 8/17/20-8/18/20 Human error event1 3 Santa Clara 2 1 1% 5 8/17/20-8/18/20 Human error event1 4 Santa Clara 2 8.5 25% 390 8/17/20-8/18/20 State Emergency Load Shedding1 4 Santa Clara 2 1 26% 58 8/17/20-8/18/20 Human error event1 5 Santa Clara 2 9.1 31% 400 8/17/20-8/18/20 State Emergency Load Shedding1 6 Santa Clara 2 8.9 21% 300 8/17/20-8/18/20 State Emergency Load Shedding1 7 Santa Clara 2 8.8 24% 350 8/17/20-8/18/20 State Emergency Load Shedding1 8 Santa Clara 2 8.8 25% 350 8/17/20-8/18/20 State Emergency Load Shedding1 9 Santa Clara 2 8.6 22% 325 8/17/20-8/18/20 State Emergency Load Shedding1 10 Santa Clara 2 9 19% 300 8/17/20-8/18/20 State Emergency Load Shedding2 1 Sunnyvale 2 12.6 34% 682 Various Utility inflicted disturbance2 2 Sunnyvale 2 14.7 41% 795 Various Utility inflicted disturbance2 3 Sunnyvale 2 15.3 30% 828 Various Utility inflicted disturbance2 4 Sunnyvale 2 13.8 32% 747 Various Utility inflicted disturbance2 5 Sunnyvale 2 20.2 26% 1093 Various Utility inflicted disturbance3 1 Santa Clara 2 0.5 1% 8/17/20-8/18/20 State Emergency Load Shedding3 2 Santa Clara 2 1.4 2% 8/17/20-8/18/20 State Emergency Load Shedding3 3 Santa Clara 2 36.7 40% 8/17/20-8/18/20 State Emergency Load Shedding3 4 Santa Clara 2.25 0.2 1% 8/17/20-8/18/20 State Emergency Load Shedding3 5 Santa Clara 2.25 31.7 36% 8/17/20-8/18/20 State Emergency Load Shedding3 6 Santa Clara 2.25 37.3 36% 8/17/20-8/18/20 State Emergency Load Shedding4 1 Santa Clara 2.25 0.4 33% 25 8/16/2020 Lightning strikes to transmission line4 2 Santa Clara 2.25 0.4 33% 25 8/16/2020 Lightning strikes to transmission line4 3 Santa Clara 2.25 0.4 33% 25 8/16/2020 Lightning strikes to transmission line4 4 Santa Clara 2.25 0.4 33% 25 8/16/2020 Lightning strikes to transmission line4 5 Santa Clara 2.25 0.4 33% 25 8/16/2020 Lightning strikes to transmission line4 6 Santa Clara 2.25 0.5 33% 32 8/16/2020 Lightning strikes to transmission line4 7 Santa Clara 2.25 0.5 33% 32 8/16/2020 Lightning strikes to transmission line4 8 Santa Clara 2.25 0.5 33% 32 8/16/2020 Lightning strikes to transmission line4 9 Santa Clara 2.25 0.5 33% 32 8/16/2020 Lightning strikes to transmission line4 10 Santa Clara 2.25 0.5 33% 32 8/16/2020 Lightning strikes to transmission line4 11 Santa Clara 2.25 0.5 33% 32 8/16/2020 Lightning strikes to transmission line4 12 Santa Clara 2.25 0.6 33% 38 8/16/2020 Lightning strikes to transmission line
Preliminary back-up diesel engine operations (non-testing/non-maintenance) for select facilities in Santa Clara, Sunnyvale, and San JoseSeptember 1, 2019 - September 30, 2020Facility operator data, based on facility responses to BAAQMD's 9/25/20 data request and follow-up conversations. Data may be refined and additional information may be available during follow-up discussions.
Page 1 of 11
Attachment 1: Preliminary Back-Up Diesel Engine Operations (Non-Testing/Non-Maintenance)
Data Center #
Engine # CityEngine Size
(MW)
Hours of operation (non-testing/non-
maintenance)
Estimated engine load percentage during each
non-testing/non-maintenance operations
Estimated fuel usage during each non-
testing/non-maintanence operation
(gallons)
DateExplanation of non-testing/non-maintenance
operation
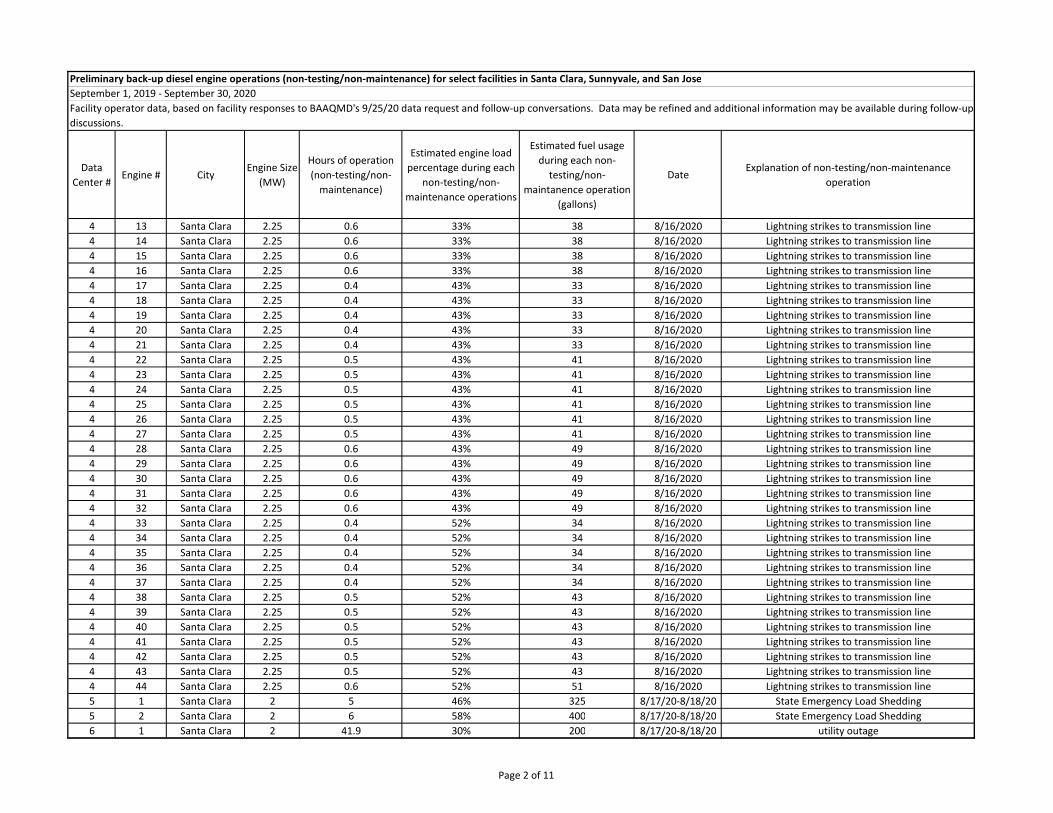
Preliminary back-up diesel engine operations (non-testing/non-maintenance) for select facilities in Santa Clara, Sunnyvale, and San JoseSeptember 1, 2019 - September 30, 2020Facility operator data, based on facility responses to BAAQMD's 9/25/20 data request and follow-up conversations. Data may be refined and additional information may be available during follow-up discussions.
4 13 Santa Clara 2.25 0.6 33% 38 8/16/2020 Lightning strikes to transmission line4 14 Santa Clara 2.25 0.6 33% 38 8/16/2020 Lightning strikes to transmission line4 15 Santa Clara 2.25 0.6 33% 38 8/16/2020 Lightning strikes to transmission line4 16 Santa Clara 2.25 0.6 33% 38 8/16/2020 Lightning strikes to transmission line4 17 Santa Clara 2.25 0.4 43% 33 8/16/2020 Lightning strikes to transmission line4 18 Santa Clara 2.25 0.4 43% 33 8/16/2020 Lightning strikes to transmission line4 19 Santa Clara 2.25 0.4 43% 33 8/16/2020 Lightning strikes to transmission line4 20 Santa Clara 2.25 0.4 43% 33 8/16/2020 Lightning strikes to transmission line4 21 Santa Clara 2.25 0.4 43% 33 8/16/2020 Lightning strikes to transmission line4 22 Santa Clara 2.25 0.5 43% 41 8/16/2020 Lightning strikes to transmission line4 23 Santa Clara 2.25 0.5 43% 41 8/16/2020 Lightning strikes to transmission line4 24 Santa Clara 2.25 0.5 43% 41 8/16/2020 Lightning strikes to transmission line4 25 Santa Clara 2.25 0.5 43% 41 8/16/2020 Lightning strikes to transmission line4 26 Santa Clara 2.25 0.5 43% 41 8/16/2020 Lightning strikes to transmission line4 27 Santa Clara 2.25 0.5 43% 41 8/16/2020 Lightning strikes to transmission line4 28 Santa Clara 2.25 0.6 43% 49 8/16/2020 Lightning strikes to transmission line4 29 Santa Clara 2.25 0.6 43% 49 8/16/2020 Lightning strikes to transmission line4 30 Santa Clara 2.25 0.6 43% 49 8/16/2020 Lightning strikes to transmission line4 31 Santa Clara 2.25 0.6 43% 49 8/16/2020 Lightning strikes to transmission line4 32 Santa Clara 2.25 0.6 43% 49 8/16/2020 Lightning strikes to transmission line4 33 Santa Clara 2.25 0.4 52% 34 8/16/2020 Lightning strikes to transmission line4 34 Santa Clara 2.25 0.4 52% 34 8/16/2020 Lightning strikes to transmission line4 35 Santa Clara 2.25 0.4 52% 34 8/16/2020 Lightning strikes to transmission line4 36 Santa Clara 2.25 0.4 52% 34 8/16/2020 Lightning strikes to transmission line4 37 Santa Clara 2.25 0.4 52% 34 8/16/2020 Lightning strikes to transmission line4 38 Santa Clara 2.25 0.5 52% 43 8/16/2020 Lightning strikes to transmission line4 39 Santa Clara 2.25 0.5 52% 43 8/16/2020 Lightning strikes to transmission line4 40 Santa Clara 2.25 0.5 52% 43 8/16/2020 Lightning strikes to transmission line4 41 Santa Clara 2.25 0.5 52% 43 8/16/2020 Lightning strikes to transmission line4 42 Santa Clara 2.25 0.5 52% 43 8/16/2020 Lightning strikes to transmission line4 43 Santa Clara 2.25 0.5 52% 43 8/16/2020 Lightning strikes to transmission line4 44 Santa Clara 2.25 0.6 52% 51 8/16/2020 Lightning strikes to transmission line5 1 Santa Clara 2 5 46% 325 8/17/20-8/18/20 State Emergency Load Shedding5 2 Santa Clara 2 6 58% 400 8/17/20-8/18/20 State Emergency Load Shedding6 1 Santa Clara 2 41.9 30% 200 8/17/20-8/18/20 utility outage
Page 2 of 11
Data Center #
Engine # CityEngine Size
(MW)
Hours of operation (non-testing/non-
maintenance)
Estimated engine load percentage during each
non-testing/non-maintenance operations
Estimated fuel usage during each non-
testing/non-maintanence operation
(gallons)
DateExplanation of non-testing/non-maintenance
operation
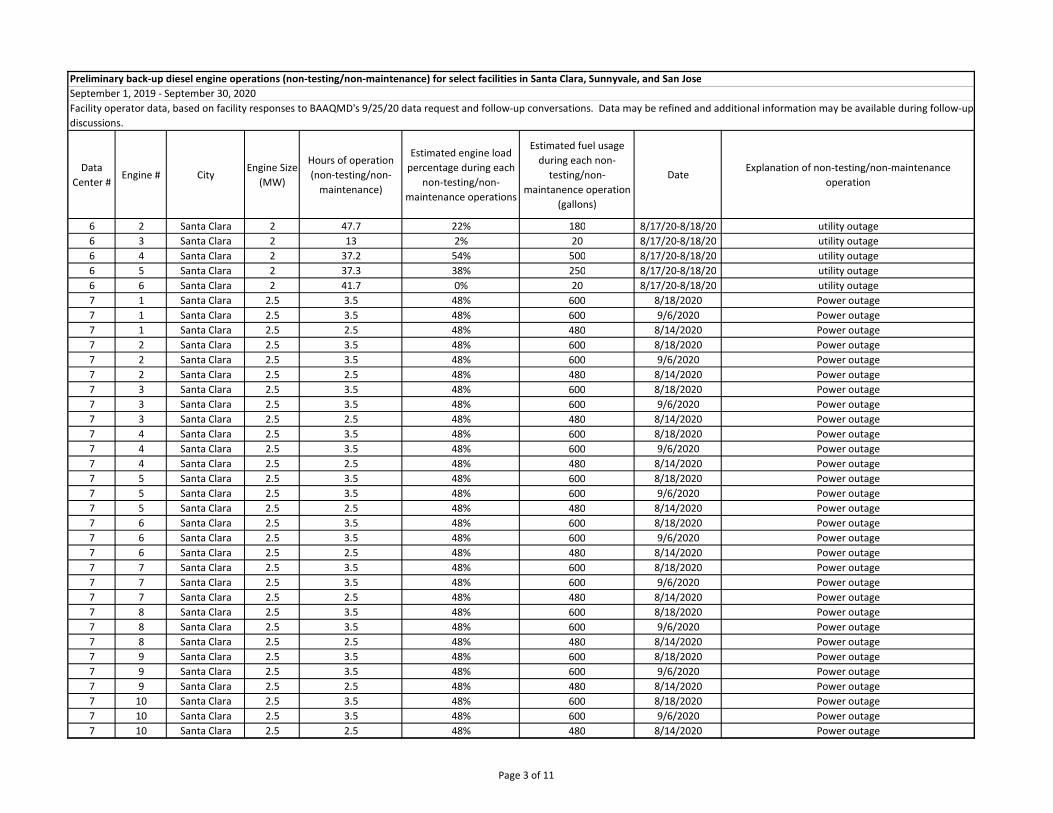
Preliminary back-up diesel engine operations (non-testing/non-maintenance) for select facilities in Santa Clara, Sunnyvale, and San JoseSeptember 1, 2019 - September 30, 2020Facility operator data, based on facility responses to BAAQMD's 9/25/20 data request and follow-up conversations. Data may be refined and additional information may be available during follow-up discussions.
6 2 Santa Clara 2 47.7 22% 180 8/17/20-8/18/20 utility outage6 3 Santa Clara 2 13 2% 20 8/17/20-8/18/20 utility outage6 4 Santa Clara 2 37.2 54% 500 8/17/20-8/18/20 utility outage6 5 Santa Clara 2 37.3 38% 250 8/17/20-8/18/20 utility outage6 6 Santa Clara 2 41.7 0% 20 8/17/20-8/18/20 utility outage7 1 Santa Clara 2.5 3.5 48% 600 8/18/2020 Power outage7 1 Santa Clara 2.5 3.5 48% 600 9/6/2020 Power outage7 1 Santa Clara 2.5 2.5 48% 480 8/14/2020 Power outage7 2 Santa Clara 2.5 3.5 48% 600 8/18/2020 Power outage7 2 Santa Clara 2.5 3.5 48% 600 9/6/2020 Power outage7 2 Santa Clara 2.5 2.5 48% 480 8/14/2020 Power outage7 3 Santa Clara 2.5 3.5 48% 600 8/18/2020 Power outage7 3 Santa Clara 2.5 3.5 48% 600 9/6/2020 Power outage7 3 Santa Clara 2.5 2.5 48% 480 8/14/2020 Power outage7 4 Santa Clara 2.5 3.5 48% 600 8/18/2020 Power outage7 4 Santa Clara 2.5 3.5 48% 600 9/6/2020 Power outage7 4 Santa Clara 2.5 2.5 48% 480 8/14/2020 Power outage7 5 Santa Clara 2.5 3.5 48% 600 8/18/2020 Power outage7 5 Santa Clara 2.5 3.5 48% 600 9/6/2020 Power outage7 5 Santa Clara 2.5 2.5 48% 480 8/14/2020 Power outage7 6 Santa Clara 2.5 3.5 48% 600 8/18/2020 Power outage7 6 Santa Clara 2.5 3.5 48% 600 9/6/2020 Power outage7 6 Santa Clara 2.5 2.5 48% 480 8/14/2020 Power outage7 7 Santa Clara 2.5 3.5 48% 600 8/18/2020 Power outage7 7 Santa Clara 2.5 3.5 48% 600 9/6/2020 Power outage7 7 Santa Clara 2.5 2.5 48% 480 8/14/2020 Power outage7 8 Santa Clara 2.5 3.5 48% 600 8/18/2020 Power outage7 8 Santa Clara 2.5 3.5 48% 600 9/6/2020 Power outage7 8 Santa Clara 2.5 2.5 48% 480 8/14/2020 Power outage7 9 Santa Clara 2.5 3.5 48% 600 8/18/2020 Power outage7 9 Santa Clara 2.5 3.5 48% 600 9/6/2020 Power outage7 9 Santa Clara 2.5 2.5 48% 480 8/14/2020 Power outage7 10 Santa Clara 2.5 3.5 48% 600 8/18/2020 Power outage7 10 Santa Clara 2.5 3.5 48% 600 9/6/2020 Power outage7 10 Santa Clara 2.5 2.5 48% 480 8/14/2020 Power outage
Page 3 of 11
Data Center #
Engine # CityEngine Size
(MW)
Hours of operation (non-testing/non-
maintenance)
Estimated engine load percentage during each
non-testing/non-maintenance operations
Estimated fuel usage during each non-
testing/non-maintanence operation
(gallons)
DateExplanation of non-testing/non-maintenance
operation
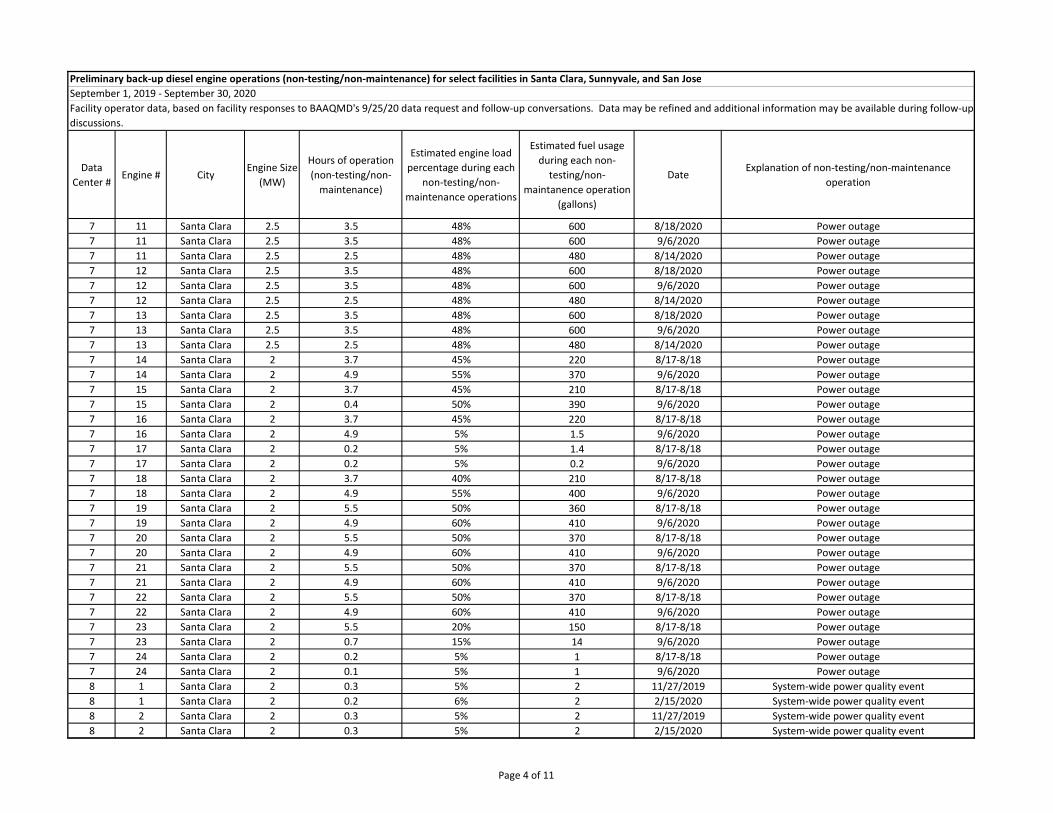
Preliminary back-up diesel engine operations (non-testing/non-maintenance) for select facilities in Santa Clara, Sunnyvale, and San JoseSeptember 1, 2019 - September 30, 2020Facility operator data, based on facility responses to BAAQMD's 9/25/20 data request and follow-up conversations. Data may be refined and additional information may be available during follow-up discussions.
7 11 Santa Clara 2.5 3.5 48% 600 8/18/2020 Power outage7 11 Santa Clara 2.5 3.5 48% 600 9/6/2020 Power outage7 11 Santa Clara 2.5 2.5 48% 480 8/14/2020 Power outage7 12 Santa Clara 2.5 3.5 48% 600 8/18/2020 Power outage7 12 Santa Clara 2.5 3.5 48% 600 9/6/2020 Power outage7 12 Santa Clara 2.5 2.5 48% 480 8/14/2020 Power outage7 13 Santa Clara 2.5 3.5 48% 600 8/18/2020 Power outage7 13 Santa Clara 2.5 3.5 48% 600 9/6/2020 Power outage7 13 Santa Clara 2.5 2.5 48% 480 8/14/2020 Power outage7 14 Santa Clara 2 3.7 45% 220 8/17-8/18 Power outage7 14 Santa Clara 2 4.9 55% 370 9/6/2020 Power outage7 15 Santa Clara 2 3.7 45% 210 8/17-8/18 Power outage7 15 Santa Clara 2 0.4 50% 390 9/6/2020 Power outage7 16 Santa Clara 2 3.7 45% 220 8/17-8/18 Power outage7 16 Santa Clara 2 4.9 5% 1.5 9/6/2020 Power outage7 17 Santa Clara 2 0.2 5% 1.4 8/17-8/18 Power outage7 17 Santa Clara 2 0.2 5% 0.2 9/6/2020 Power outage7 18 Santa Clara 2 3.7 40% 210 8/17-8/18 Power outage7 18 Santa Clara 2 4.9 55% 400 9/6/2020 Power outage7 19 Santa Clara 2 5.5 50% 360 8/17-8/18 Power outage7 19 Santa Clara 2 4.9 60% 410 9/6/2020 Power outage7 20 Santa Clara 2 5.5 50% 370 8/17-8/18 Power outage7 20 Santa Clara 2 4.9 60% 410 9/6/2020 Power outage7 21 Santa Clara 2 5.5 50% 370 8/17-8/18 Power outage7 21 Santa Clara 2 4.9 60% 410 9/6/2020 Power outage7 22 Santa Clara 2 5.5 50% 370 8/17-8/18 Power outage7 22 Santa Clara 2 4.9 60% 410 9/6/2020 Power outage7 23 Santa Clara 2 5.5 20% 150 8/17-8/18 Power outage7 23 Santa Clara 2 0.7 15% 14 9/6/2020 Power outage7 24 Santa Clara 2 0.2 5% 1 8/17-8/18 Power outage7 24 Santa Clara 2 0.1 5% 1 9/6/2020 Power outage8 1 Santa Clara 2 0.3 5% 2 11/27/2019 System-wide power quality event8 1 Santa Clara 2 0.2 6% 2 2/15/2020 System-wide power quality event8 2 Santa Clara 2 0.3 5% 2 11/27/2019 System-wide power quality event8 2 Santa Clara 2 0.3 5% 2 2/15/2020 System-wide power quality event
Page 4 of 11
Data Center #
Engine # CityEngine Size
(MW)
Hours of operation (non-testing/non-
maintenance)
Estimated engine load percentage during each
non-testing/non-maintenance operations
Estimated fuel usage during each non-
testing/non-maintanence operation
(gallons)
DateExplanation of non-testing/non-maintenance
operation
Preliminary back-up diesel engine operations (non-testing/non-maintenance) for select facilities in Santa Clara, Sunnyvale, and San JoseSeptember 1, 2019 - September 30, 2020Facility operator data, based on facility responses to BAAQMD's 9/25/20 data request and follow-up conversations. Data may be refined and additional information may be available during follow-up discussions.
8 3 Santa Clara 2 0.3 6% 2 11/27/2019 System-wide power quality event8 3 Santa Clara 2 0.2 6% 2 2/15/2020 System-wide power quality event8 4 Santa Clara 2 0.3 7% 2 2/15/2020 System-wide power quality event8 4 Santa Clara 2 0.2 8% 2 11/27/2019 System-wide power quality event8 5 Santa Clara 2 0.2 10% 2 11/27/2019 System-wide power quality event8 5 Santa Clara 2 0.2 8% 2 2/15/2020 System-wide power quality event8 6 Santa Clara 2 0.2 9% 2 11/27/2019 System-wide power quality event8 6 Santa Clara 2 0.2 7% 2 2/15/2020 System-wide power quality event8 7 Santa Clara 2 0.2 15% 2 11/27/2019 System-wide power quality event8 7 Santa Clara 2 0.2 8% 2 2/15/2020 System-wide power quality event8 8 Santa Clara 2 0.2 13% 2 11/27/2019 System-wide power quality event8 8 Santa Clara 2 0.2 6% 2 2/15/2020 System-wide power quality event8 9 Santa Clara 2 0.2 9% 2 11/27/2019 System-wide power quality event8 9 Santa Clara 2 0.2 6% 2 2/15/2020 System-wide power quality event8 10 Santa Clara 2 0.2 12% 2 11/27/2019 System-wide power quality event8 10 Santa Clara 2 0.2 7% 2 2/15/2020 System-wide power quality event8 11 Santa Clara 2 0.2 5% 2 11/27/2019 System-wide power quality event8 11 Santa Clara 2 0.2 6% 2 2/15/2020 System-wide power quality event8 12 Santa Clara 2 0.2 5% 2 11/27/2019 System-wide power quality event8 12 Santa Clara 2 0.2 6% 2 2/15/2020 System-wide power quality event8 13 Santa Clara 2 0.2 6% 2 11/27/2019 System-wide power quality event8 13 Santa Clara 2 0.2 7% 2 2/15/2020 System-wide power quality event8 14 Santa Clara 2 0.2 6% 2 11/27/2019 System-wide power quality event8 14 Santa Clara 2 0.2 7% 2 2/15/2020 System-wide power quality event8 15 Santa Clara 2 0.2 12% 2 11/27/2019 System-wide power quality event8 15 Santa Clara 2 0.2 11% 2 2/15/2020 System-wide power quality event8 16 Santa Clara 2 0.3 10% 2 11/27/2019 System-wide power quality event8 16 Santa Clara 2 0.2 9% 2 2/15/2020 System-wide power quality event8 17 Santa Clara 2 0.3 9% 2 11/27/2019 System-wide power quality event8 17 Santa Clara 2 0.2 9% 2 2/15/2020 System-wide power quality event8 18 Santa Clara 2 0.2 7% 2 11/27/2019 System-wide power quality event8 18 Santa Clara 2 0.2 6% 2 2/15/2020 System-wide power quality event8 19 Santa Clara 2 0.2 10% 2 11/27/2019 System-wide power quality event8 19 Santa Clara 2 0.2 8% 2 2/15/2020 System-wide power quality event8 20 Santa Clara 2 0.2 9% 2 11/27/2019 System-wide power quality event
Page 5 of 11
Data Center #
Engine # CityEngine Size
(MW)
Hours of operation (non-testing/non-
maintenance)
Estimated engine load percentage during each
non-testing/non-maintenance operations
Estimated fuel usage during each non-
testing/non-maintanence operation
(gallons)
DateExplanation of non-testing/non-maintenance
operation
Preliminary back-up diesel engine operations (non-testing/non-maintenance) for select facilities in Santa Clara, Sunnyvale, and San JoseSeptember 1, 2019 - September 30, 2020Facility operator data, based on facility responses to BAAQMD's 9/25/20 data request and follow-up conversations. Data may be refined and additional information may be available during follow-up discussions.
8 20 Santa Clara 2 0.2 7% 2 2/15/2020 System-wide power quality event8 21 Santa Clara 2 0.2 17% 2 11/27/2019 System-wide power quality event8 21 Santa Clara 2 0.2 12% 2 2/15/2020 System-wide power quality event8 22 Santa Clara 2 0.2 8% 2 11/27/2019 System-wide power quality event8 22 Santa Clara 2 0.2 8% 2 2/15/2020 System-wide power quality event8 23 Santa Clara 2 0.2 6% 2 11/27/2019 System-wide power quality event8 23 Santa Clara 2 0.2 5% 2 2/15/2020 System-wide power quality event8 24 Santa Clara 2 0.2 6% 2 11/27/2019 System-wide power quality event8 24 Santa Clara 2 0.2 5% 2 2/15/2020 System-wide power quality event9 1 Santa Clara 2 8.4 65% 524 8/17/20-8/18/20 State Emergency Load Shedding9 2 Santa Clara 2 5.6 60% 400 8/17/20-8/18/20 State Emergency Load Shedding9 3 Santa Clara 2 2.6 50% 300 8/17/20-8/18/20 Equipment failure9 4 Santa Clara 2 2.9 1% 20 8/17/20-8/18/20 State Emergency Load Shedding9 5 Santa Clara 0.23 6.5 7% 10 8/17/20-8/18/20 State Emergency Load Shedding
10 1 Santa Clara 2 9 50% 256 8/17/20-8/18/20 State Emergency Load Shedding10 2 Santa Clara 2 9 50% 256 8/17/20-8/18/20 State Emergency Load Shedding10 3 Santa Clara 2 9 50% 256 8/17/20-8/18/20 State Emergency Load Shedding10 4 Santa Clara 2.06 4 60% 296 8/17/20-8/18/20 State Emergency Load Shedding10 5 Santa Clara 2.06 4 60% 296 8/17/20-8/18/20 State Emergency Load Shedding10 6 Santa Clara 2.06 4 60% 296 8/17/20-8/18/20 State Emergency Load Shedding10 7 Santa Clara 3 7 40% 1280 8/17/20-8/18/20 State Emergency Load Shedding10 7 Santa Clara 3 4 40% 731.5 8/17/20-8/18/20 State Emergency Load Shedding10 8 Santa Clara 3 7 40% 1280 8/17/20-8/18/20 State Emergency Load Shedding10 8 Santa Clara 3 4 40% 731.5 8/17/20-8/18/20 State Emergency Load Shedding10 9 Santa Clara 3 7 40% 1280 8/17/20-8/18/20 State Emergency Load Shedding10 9 Santa Clara 3 4 40% 731.5 8/17/20-8/18/20 State Emergency Load Shedding10 10 Santa Clara 3 7 40% 1280 8/17/20-8/18/20 State Emergency Load Shedding10 10 Santa Clara 3 4 40% 731.5 8/17/20-8/18/20 State Emergency Load Shedding10 11 Santa Clara 3 5 50% 780 8/17/20-8/18/20 State Emergency Load Shedding10 12 Santa Clara 3 5 50% 780 8/17/20-8/18/20 State Emergency Load Shedding10 13 Santa Clara 3 5.5 50% 930 8/17/20-8/18/20 State Emergency Load Shedding10 14 Santa Clara 3 5 50% 780 8/17/20-8/18/20 State Emergency Load Shedding10 15 Santa Clara 3 5.5 50% 930 8/17/20-8/18/20 State Emergency Load Shedding10 16 Santa Clara 3 5.5 50% 930 8/17/20-8/18/20 State Emergency Load Shedding10 17 Santa Clara 2.75 9 70% 625 8/17/20-8/18/20 State Emergency Load Shedding
Page 6 of 11
Data Center #
Engine # CityEngine Size
(MW)
Hours of operation (non-testing/non-
maintenance)
Estimated engine load percentage during each
non-testing/non-maintenance operations
Estimated fuel usage during each non-
testing/non-maintanence operation
(gallons)
DateExplanation of non-testing/non-maintenance
operation
Preliminary back-up diesel engine operations (non-testing/non-maintenance) for select facilities in Santa Clara, Sunnyvale, and San JoseSeptember 1, 2019 - September 30, 2020Facility operator data, based on facility responses to BAAQMD's 9/25/20 data request and follow-up conversations. Data may be refined and additional information may be available during follow-up discussions.
10 18 Santa Clara 2.75 8.2 70% 525 8/17/20-8/18/20 State Emergency Load Shedding10 19 Santa Clara 2.75 8.9 70% 615 8/17/20-8/18/20 State Emergency Load Shedding10 20 Santa Clara 2.75 11.3 70% 975 8/17/20-8/18/20 State Emergency Load Shedding10 21 Santa Clara 2 4 60% 238 8/17/20-8/18/20 State Emergency Load Shedding10 22 Santa Clara 3 5.5 50% 930 8/17/20-8/18/20 State Emergency Load Shedding10 23 Santa Clara 3 5.5 50% 930 8/17/20-8/18/20 State Emergency Load Shedding10 24 Santa Clara 3 5.5 50% 930 8/17/20-8/18/20 State Emergency Load Shedding10 25 Santa Clara 2.75 8.3 70% 530 8/17/20-8/18/20 State Emergency Load Shedding10 26 Santa Clara 2.75 8.3 70% 530 8/17/20-8/18/20 State Emergency Load Shedding10 27 Santa Clara 2.75 8.3 70% 530 8/17/20-8/18/20 State Emergency Load Shedding10 28 Santa Clara 2.75 8.3 70% 530 8/17/20-8/18/20 State Emergency Load Shedding10 29 Santa Clara 3 11.6 60% 1786 Power bump10 29 Santa Clara 3 4 60% 616 Power bump10 29 Santa Clara 3 3.5 60% 539 8/17/20-8/18/20 State Emergency Load Shedding10 29 Santa Clara 3 3 60% 462 Power bump10 29 Santa Clara 3 2.7 60% 416 Power bump10 29 Santa Clara 3 1 60% 154 Power bump10 29 Santa Clara 3 1 60% 154 Utility outage10 30 Santa Clara 3 10.1 60% 1555 Utility outage10 30 Santa Clara 3 5.5 60% 847 Power bump10 30 Santa Clara 3 4 60% 616 Utility outage10 30 Santa Clara 3 3.7 60% 569.8 8/17/20-8/18/20 State Emergency Load Shedding10 30 Santa Clara 3 2.8 60% 431 Power bump10 30 Santa Clara 3 1 60% 154 Utility outage10 30 Santa Clara 3 1 60% 154 Utility outage10 31 Santa Clara 3 11.5 60% 1771 Utility outage10 31 Santa Clara 3 4 60% 616 Utility outage10 31 Santa Clara 3 3.7 60% 569.8 8/17/20-8/18/20 State Emergency Load Shedding10 31 Santa Clara 3 3 60% 462 Power bump10 31 Santa Clara 3 2.7 60% 416 Power bump10 31 Santa Clara 3 1 60% 154 Utility outage10 31 Santa Clara 3 1 60% 154 Utility outage10 32 Santa Clara 3 11.6 60% 1786 Utility outage10 32 Santa Clara 3 4 60% 616 Utility outage10 32 Santa Clara 3 3 60% 462 Power bump
Page 7 of 11
Data Center #
Engine # CityEngine Size
(MW)
Hours of operation (non-testing/non-
maintenance)
Estimated engine load percentage during each
non-testing/non-maintenance operations
Estimated fuel usage during each non-
testing/non-maintanence operation
(gallons)
DateExplanation of non-testing/non-maintenance
operation
Preliminary back-up diesel engine operations (non-testing/non-maintenance) for select facilities in Santa Clara, Sunnyvale, and San JoseSeptember 1, 2019 - September 30, 2020Facility operator data, based on facility responses to BAAQMD's 9/25/20 data request and follow-up conversations. Data may be refined and additional information may be available during follow-up discussions.
10 32 Santa Clara 3 3 60% 462 8/17/20-8/18/20 State Emergency Load Shedding10 32 Santa Clara 3 2.7 60% 416 Power bump10 32 Santa Clara 3 1 60% 154 Utility outage10 32 Santa Clara 3 1 60% 154 Utility outage10 33 Santa Clara 3 11.6 60% 1786 Utility outage10 33 Santa Clara 3 4 60% 616 Utility outage10 33 Santa Clara 3 3.7 60% 569.8 8/17/20-8/18/20 State Emergency Load Shedding10 33 Santa Clara 3 3 60% 462 Power bump10 33 Santa Clara 3 2.8 60% 431.2 Power bump10 33 Santa Clara 3 1 60% 154 Utility outage10 33 Santa Clara 3 1 60% 154 Utility outage10 34 Santa Clara 3 11.6 60% 1786 Utility outage10 34 Santa Clara 3 4 60% 616 Utility outage10 34 Santa Clara 3 3.7 60% 569.8 8/17/20-8/18/20 State Emergency Load Shedding10 34 Santa Clara 3 3 60% 462 Power bump10 34 Santa Clara 3 2.9 60% 447 Power bump10 34 Santa Clara 3 1 60% 154 Utility outage10 34 Santa Clara 3 1 60% 154 Utility outage10 35 Santa Clara 3 6 40% 450 8/17/20-8/18/20 State Emergency Load Shedding10 36 Santa Clara 3 2 40% 150 8/17/20-8/18/20 State Emergency Load Shedding10 37 Santa Clara 3 5.5 40% 412 8/17/20-8/18/20 State Emergency Load Shedding10 38 Santa Clara 3 5.5 40% 412 8/17/20-8/18/20 State Emergency Load Shedding10 39 Santa Clara 3 5.5 40% 412 8/17/20-8/18/20 State Emergency Load Shedding10 40 Santa Clara 2.75 8.3 70% 530 8/17/20-8/18/20 State Emergency Load Shedding11 1 Santa Clara 2 5.8 25% 390 8/17/20-8/18/20 Power supplier request11 1 Santa Clara 2 4.1 25% 390 8/17/20-8/18/20 Power supplier request11 2 Santa Clara 2 4.7 31% 280 8/17/20-8/18/20 Power supplier request11 2 Santa Clara 2 3.9 31% 280 8/17/20-8/18/20 Power supplier request11 3 Santa Clara 2 5.6 28% 380 8/17/20-8/18/20 Power supplier request11 3 Santa Clara 2 4.3 28% 380 8/17/20-8/18/20 Power supplier request11 4 Santa Clara 2 5.4 43% 605 8/17/20-8/18/20 Power supplier request11 4 Santa Clara 2 3.5 43% 605 8/17/20-8/18/20 Power supplier request11 5 Santa Clara 0.23 6 17% 27 8/17/20-8/18/20 Power supplier request11 5 Santa Clara 0.23 3.5 17% 27 8/17/20-8/18/20 Power supplier request11 6 Santa Clara 2 4.5 17% 75 8/17/20-8/18/20 Power supplier request
Page 8 of 11
Data Center #
Engine # CityEngine Size
(MW)
Hours of operation (non-testing/non-
maintenance)
Estimated engine load percentage during each
non-testing/non-maintenance operations
Estimated fuel usage during each non-
testing/non-maintanence operation
(gallons)
DateExplanation of non-testing/non-maintenance
operation
Preliminary back-up diesel engine operations (non-testing/non-maintenance) for select facilities in Santa Clara, Sunnyvale, and San JoseSeptember 1, 2019 - September 30, 2020Facility operator data, based on facility responses to BAAQMD's 9/25/20 data request and follow-up conversations. Data may be refined and additional information may be available during follow-up discussions.
11 7 Santa Clara 2 4.7 8% 75 8/17/20-8/18/20 Power supplier request11 8 Santa Clara 2 4.7 8% 100 8/17/20-8/18/20 Power supplier request11 9 Santa Clara 2 4.7 9% 100 8/17/20-8/18/20 Power supplier request11 10 Santa Clara 2 4.8 11% 100 8/17/20-8/18/20 Power supplier request11 11 Santa Clara 0.23 4.8 7% 30 8/17/20-8/18/20 Power supplier request12 1 Santa Clara 0.23 2.9 14% 87 8/17/20-8/18/20 Utility outage12 2 Santa Clara 2 43 8% 160 8/17/20-8/18/20 Utility outage12 3 Santa Clara 2 42.8 6% 160 8/17/20-8/18/20 Utility outage12 4 Santa Clara 2 38 15% 420 8/17/20-8/18/20 Utility outage12 5 Santa Clara 2 24 55% 500 8/17/20-8/18/20 Utility outage12 6 Santa Clara 2 10 6% 160 8/17/20-8/18/20 Utility outage12 7 Santa Clara 2 10.4 7% 160 8/17/20-8/18/20 Utility outage12 8 Santa Clara 2 42.1 30% 250 8/17/20-8/18/20 Utility outage12 9 Santa Clara 2 41.8 30% 250 8/17/20-8/18/20 Utility outage12 10 Santa Clara 2 10.3 1% 50 8/17/20-8/18/20 Utility outage12 11 Santa Clara 2 10 7% 160 8/17/20-8/18/20 Utility outage13 1 Santa Clara 2 19.8 37% 80.3 Various Utility power outages; power blips, UPS/board repair13 2 Santa Clara 2 20.4 37% 82.5 Various Utility power outages; power blips, UPS/board repair13 3 Santa Clara 1.25 14.96 43% 527 Various Utility power outages; power blips, UPS/board repair13 4 Santa Clara 1.25 14.94 42% 525 Various Utility power outages; power blips, UPS/board repair13 5 Santa Clara 1.25 14.92 43% 523 Various Utility power outages; power blips, UPS/board repair14 1 Santa Clara 2.7 1.9 22% 90 11/27/2019 Utiilty sag event14 2 Santa Clara 2.7 1.9 32% 95 11/27/2019 Utiilty sag event14 3 Santa Clara 2.7 1.9 1% 57 11/27/2019 Utiilty sag event14 4 Santa Clara 2.7 1.9 34% 99.75 11/27/2019 Utiilty sag event14 5 Santa Clara 2.7 4.4 41% 422 8/18/2020 Mandatory load transfer14 6 Santa Clara 2.7 6.3 32% 445 8/18/2020 Mandatory load transfer14 7 Santa Clara 2.7 4.7 2% 139 8/18/2020 Mandatory load transfer14 8 Santa Clara 2.7 4.5 48% 123 8/18/2020 Mandatory load transfer15 1 Santa Clara 2 14 65% 69315 2 Santa Clara 2 14 65% 69315 3 Santa Clara 2 14 65% 69315 4 Santa Clara 2 1415 5 Santa Clara 2 1415 6 Santa Clara 2.5 14 19% 486
Page 9 of 11
Data Center #
Engine # CityEngine Size
(MW)
Hours of operation (non-testing/non-
maintenance)
Estimated engine load percentage during each
non-testing/non-maintenance operations
Estimated fuel usage during each non-
testing/non-maintanence operation
(gallons)
DateExplanation of non-testing/non-maintenance
operation
Preliminary back-up diesel engine operations (non-testing/non-maintenance) for select facilities in Santa Clara, Sunnyvale, and San JoseSeptember 1, 2019 - September 30, 2020Facility operator data, based on facility responses to BAAQMD's 9/25/20 data request and follow-up conversations. Data may be refined and additional information may be available during follow-up discussions.
15 7 Santa Clara 2.5 1416 1 Santa Clara 2 2.4 2% 45.6 7/31/2020 Utility power outage16 2 Santa Clara 2 2.4 18% 48 7/31/2020 Utility power outage16 3 Santa Clara 1.5 2.4 30% 40.8 7/31/2020 Utility power outage16 4 Santa Clara 1.5 2.4 25% 38.4 7/31/2020 Utility power outage17 1 San Jose 2 2 14% 80 11/26/2019 Commercial power outage17 2 San Jose 2 2 14% 80 11/26/2019 Commercial power outage18 1 San Jose 2 1.5 30% 150 8/16/2020 Utility power outage18 1 San Jose 2 1.5 30% 150 8/25/2020 Utility power outage18 2 San Jose 2 1.5 30% 150 8/16/2020 Utility power outage18 2 San Jose 2 1.5 30% 150 8/25/2020 Utility power outage18 3 San Jose 2 1.5 30% 150 8/16/2020 Utility power outage18 3 San Jose 2 1.5 30% 150 8/25/2020 Utility power outage18 4 San Jose 2 1.5 30% 150 8/16/2020 Utility power outage18 4 San Jose 2 1.5 30% 150 8/25/2020 Utility power outage18 5 San Jose 2 1.5 30% 150 8/16/2020 Utility power outage18 5 San Jose 2 1.5 30% 150 8/25/2020 Utility power outage18 6 San Jose 2 1.5 30% 150 8/16/2020 Utility power outage18 6 San Jose 2 1.5 30% 150 8/25/2020 Utility power outage19 1 San Jose 1.5 4 20% 200 8/19/2020 Substation transformer power equipment failure19 2 San Jose 1.5 4 17% 190 8/19/2020 Substation transformer power equipment failure19 3 San Jose 1.5 4 50% 290 8/19/2020 Substation transformer power equipment failure19 4 San Jose 1.5 4 60% 310 8/19/2020 Substation transformer power equipment failure19 5 San Jose 1.5 4 53% 300 8/19/2020 Substation transformer power equipment failure19 6 San Jose 1.5 4 40% 280 8/19/2020 Substation transformer power equipment failure20 1 Santa Clara 3 4.1 42% 410 8/18/2020 State Emergency Load Shedding20 1 Santa Clara 3 3.5 42% 350 9/7/2020 State Emergency Load Shedding20 1 Santa Clara 3 1.5 42% 150 8/17/2020 State Emergency Load Shedding20 2 Santa Clara 3 4.1 37% 410 8/18/2020 State Emergency Load Shedding20 2 Santa Clara 3 3.6 37% 360 9/7/2020 State Emergency Load Shedding20 2 Santa Clara 3 2.6 37% 250 8/17/2020 State Emergency Load Shedding20 3 Santa Clara 3 4.1 40% 410 8/18/2020 State Emergency Load Shedding20 3 Santa Clara 3 3.6 40% 360 9/7/2020 State Emergency Load Shedding20 3 Santa Clara 3 1.8 40% 180 8/17/2020 State Emergency Load Shedding20 4 Santa Clara 3 4.1 38% 410 8/18/2020 State Emergency Load Shedding
Page 10 of 11
Data Center #
Engine # CityEngine Size
(MW)
Hours of operation (non-testing/non-
maintenance)
Estimated engine load percentage during each
non-testing/non-maintenance operations
Estimated fuel usage during each non-
testing/non-maintanence operation
(gallons)
DateExplanation of non-testing/non-maintenance
operation
Preliminary back-up diesel engine operations (non-testing/non-maintenance) for select facilities in Santa Clara, Sunnyvale, and San JoseSeptember 1, 2019 - September 30, 2020Facility operator data, based on facility responses to BAAQMD's 9/25/20 data request and follow-up conversations. Data may be refined and additional information may be available during follow-up discussions.
20 4 Santa Clara 3 3.6 38% 360 9/7/2020 State Emergency Load Shedding20 4 Santa Clara 3 1.4 38% 150 8/17/2020 State Emergency Load Shedding20 5 Santa Clara 3 4.2 20% 410 8/18/2020 State Emergency Load Shedding20 5 Santa Clara 3 1.1 20% 120 8/17/2020 State Emergency Load Shedding20 6 Santa Clara 3 4.1 17% 410 8/18/2020 State Emergency Load Shedding20 6 Santa Clara 3 1.3 17% 130 8/17/2020 State Emergency Load Shedding20 7 Santa Clara 3 4.1 18% 410 8/18/2020 State Emergency Load Shedding20 7 Santa Clara 3 1.4 18% 140 8/17/2020 State Emergency Load Shedding20 8 Santa Clara 3 4.1 19% 410 8/18/2020 State Emergency Load Shedding20 8 Santa Clara 3 1.4 19% 140 8/17/2020 State Emergency Load Shedding20 9 Santa Clara 3 4.2 15% 420 8/18/2020 State Emergency Load Shedding20 9 Santa Clara 3 1.1 15% 110 8/17/2020 State Emergency Load Shedding20 10 Santa Clara 3 4.1 29% 410 8/18/2020 State Emergency Load Shedding20 10 Santa Clara 3 1.3 29% 130 8/17/2020 State Emergency Load Shedding20 11 Santa Clara 3 4.3 18% 430 8/18/2020 State Emergency Load Shedding20 11 Santa Clara 3 1.4 18% 140 8/17/2020 State Emergency Load Shedding20 12 Santa Clara 3 4.1 19% 410 8/18/2020 State Emergency Load Shedding20 12 Santa Clara 3 1.4 19% 140 8/17/2020 State Emergency Load Shedding20 13 Santa Clara 3 4.1 3% 120 8/18/2020 State Emergency Load Shedding20 13 Santa Clara 3 1.2 3% 40 8/17/2020 State Emergency Load Shedding20 14 Santa Clara 3 4 2% 120 8/18/2020 State Emergency Load Shedding20 14 Santa Clara 3 1.3 2% 40 8/17/2020 State Emergency Load Shedding20 15 Santa Clara 3 4 2% 160 8/18/2020 State Emergency Load Shedding20 15 Santa Clara 3 1.3 2% 50 8/17/2020 State Emergency Load Shedding20 16 Santa Clara 3 2 30% 20 8/17/2020 State Emergency Load Shedding20 16 Santa Clara 3 1.5 30% 20 8/18/2020 State Emergency Load Shedding20 17 Santa Clara 3 0.9 10% 20 8/17/2020 State Emergency Load Shedding20 17 Santa Clara 3 0.8 10% 20 8/18/2020 State Emergency Load Shedding
Page 11 of 11