bay area 2009 clean air plan - home | heatisland
TRANSCRIPT

1
David Burch, Principal Planner,Bay Area Air Quality Management District
Urban Heat Island ConferenceSeptember 21, 2009

22
Presentation OverviewPresentation Overview
• Profile of Bay Area AQMD• Multi-pollutant planning• Control Strategy for Bay Area
2009 Clean Air Plan (CAP)• Role of UHI Mitigation in CAP• UHI data to help frame policy

3
Bay Area AQMD Profile
• Regional agency responsible for AQ in BayArea(we’re not the California Air Resources Board)
• Governing board made up of elected officialsfrom all 9 counties
• 100+ cities with > 7 million population• Regulate emissions from stationary sources• Develop air quality plans to attain state &
federal standards

4
BAAQMD MissionTwo fundamental goals:• Protect Air Quality• Protect ClimateThese goals are closely relatedHigher temperatures will exacerbate AQ
problems:- more potent ozone formation- higher evaporative emissions of VOCs- increased emissions from power plants

5
BAAQMD Climate ProtectionProgram
• Board adopted climate policy in 2005• Incorporated climate protection into
BAAQMD mission statement• First air district to compile regional GHG
emissions inventory• Adopted GHG fee on stationary sources• Climate grant program to support local
efforts• Complement ARB’s climate scoping plan

6
Benefits of Clean Air
Good air quality provides a range ofbenefits:
• Ecosystem protection• Agricultural production• Economic benefits: tourism, property
values• Quality of life• Protect public health

7
Air Quality → Health
4 key steps1)ΔEmissions of each pollutant
2)ΔAmbientConcentrations
3)ΔPopulationExposure
4)ΔHealth Effects

8
Traditional AQ Planning
• Develop AQ plan to address a singlepollutant
• Focus on reducing emissions & ambientconcentrations (Steps 1 & 2 previousslide)
• AQ stds expressed as ambientconcentrations - easy to measure
• But traditional AQ planning does notconsider :- pop. exposure & health effects: Steps 3& 4- co-benefits or trade-offs for otherpollutants

9
Innovative Aspects of 2009CAP
Develop integrated multi-pollutant plan toreduce:- ozone precursors (ROG & NOx)- direct particulate matter (PM) & PMprecursors- key air toxics- key greenhouse gases (“Kyoto 6”)
• Protect public health, both at regional scale& in communities most heavily impacted bypollution
• Protect our climate & ecosystems

10
Multi-Pollutant Planning
• More holistic approach to AQ planning• Conceptual groundwork:
National Research Council (2004) & USEPA
• EPA pilot efforts under way in 4 states /areas
• Voluntary effort on the part of BAAQMD• No guidelines available as yet:
- we’re on the cutting edge

11
Multi-Pollutant Planning
MP planning makes sense, but more complex• Policy challenges:
- - Where to draw the line?• Technical challenges:
- Need inventory data & emission factors- AQ modeling for ozone, PM & air toxics- How to compare the various pollutants ?

12
Multi-Pollutant EvaluationMethod (MPEM)
Used our technical data & tools to developMPEM to help analyze control measures:
• MPEM based on the 4 steps outlinedabove
• Evaluate control measures in order to:- Optimize co-benefits across pollutants- Minimize trade-offs
• Identify control measures that providegreatest overall health & climate protectionbenefit

13
Overview of CAP ControlStrategy
57 control measures:• Stationary sources measures (19)• Mobile sources measures (10)• Transportation control measures (18)• Land use & local impacts measures (6)• Energy & climate measures (4)

14
Energy & ClimateMeasures
• ECM 1: Energy Efficiency- promote green building codes &practices
• ECM 2: Renewable Energy- promote solar power& other renewables
• ECM 3: Urban heat islands- cool roofing & cool paving
• ECM 4: Tree-Planting- promote planting of low VOC emittingtrees

15
Heat Island ControlMeasure
• Promote cool roofing and paving throughmodel ordinances that cities can adopt
• Provide training for local agencies re: coolroofing and paving technologies &benefits
• Use policy levers to encourage coolstrategies as GHG offsets in newdevelopment projects

16
UHI Policy Needs
UHI makes sense conceptually, but need toquantify GHG reductions & other benefits
Data gaps:• electricity saving per square meter of cool
roofs & cool paving installed• evaporative emission reductions from cool
paving• square meters of rooftops & parking lots in
the Bay Area
17
Closing Thoughts
• We need fresh thinking & new strategies toaddress today’s AQ & climate challenges
• MPEM integrates our 3 key objectives:- addressing multiple air pollutants- protecting public health- reducing GHGs & protecting climate
Broad support for the MP planningconcept
Bay Area 2009 CAP will break newground

18
Bay Area 2009 Clean Air Plan website:http://www.baaqmd.gov/Divisions/Planni
ng-and-Research/Plans/Clean-Air-Plans.aspx
David Burch:[email protected]

19
Stages of MPEM Analysis
Ozone, PM, Toxics
1)ΔEmissions
2)ΔConcentrations
3)ΔExposure
4)ΔHealth Effects
5)Δ$HealthBenefits
GHGs(Kyoto 6 – CO2-e)
1) ΔEmissions
5) Δ$SocialBenefits

20
EffectAmbient Pollutant
PM2.5 Range of health effects
Ozone Range of health effects
Toxics: DPM, benzene, 1,3-butadiene, acetaldehyde,
formaldehydeCancer
Greenhouse gases (GHGs) Health, Environment &Economic Effects
Pollutants & Effects considered
21
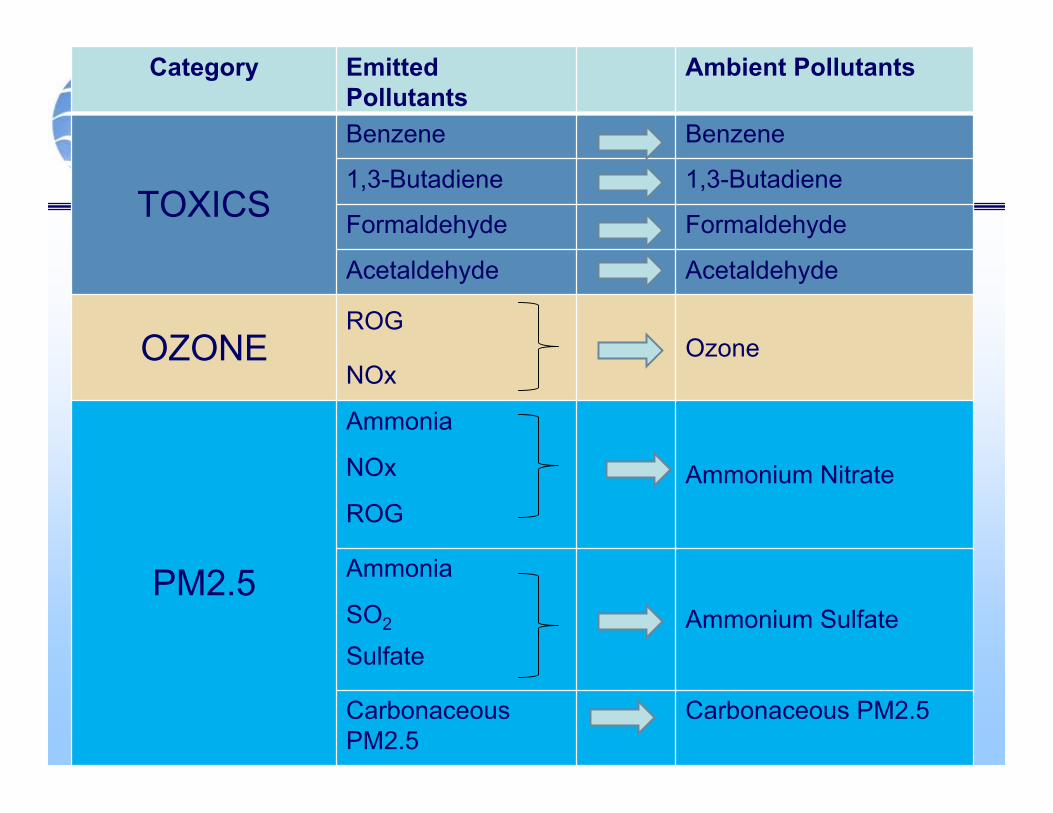
Category EmittedPollutants
Ambient Pollutants
TOXICS
Benzene Benzene
1,3-Butadiene 1,3-Butadiene
Formaldehyde Formaldehyde
Acetaldehyde Acetaldehyde
OZONEROG
NOxOzone
PM2.5
Ammonia
NOx
ROGAmmonium Nitrate
Ammonia
SO2
SulfateAmmonium Sulfate
CarbonaceousPM2.5
Carbonaceous PM2.5

22
Economic Valuation:GHGs
• Value of reductions = a dollar value per ton of CO2equivalent reduced
• We’re concerned about social cost, not market price• GHG valuation is complicated:
- Global in scale- Wide range of effects & costs (not just health)- Effects of today’s emissions will be felt far into thefuture. How to value future benefits in current $$?
• We’ve chosen a value of $28 per ton of CO2-e basedon meta-study by Richard Tol (2005/2008)

23
MPEM caveats /limitations
• Does not include all pollutants: only a subset ofcriteria pollutants, toxics & GHGs
Does not fully capture all health effects:- only health effects that are well-documented- no synergistic interactions among pollutants- does not consider downwind benefits (beyond BayArea)
• Consider other non-air quality benefits• MPEM is Bay Area-specific• Need to strengthen MPEM technical
foundation