battlement mesa natural gas development plan meeting #7 ... · pdf file•...
TRANSCRIPT

Battlement Mesa Natural Gas Development PlanMeeting #7
Environmental Program – Air Quality and Water Resource Protection and Noise, Dust, Weed, Light, and Visual Mitigation
October 7, 2009

• July 1st – Introductory Meeting (define future mtgs and public involvement process)• July 29th - Pad Locations, Facilities, and Setbacks• August 5th - Surface Use Agreement• August 19th - Drilling Schedule and Pace• September 2nd - Traffic Plan• September 16th – Drilling, Completion, and Water Management Plan• October 7th – Environmental Program• October 21st – Emergency Response Plan and Pad Security Plan• November 4th – Post Drilling and Completion Operations and Interim Reclamation
(All meetings are open to the public and times are posted in Grand Valley Echo and on battlementmesacolorado.com website)
Slide 2
BMOGC Meeting Series – Brief Overview

• Review Major Aspects of Environmental Program– Air Quality and Odor Mitigation– Surface Water Resource Protection
• Spill Prevention• Stormwater/Erosion Control
– Mitigation Strategies• Noise• Dust• Light• Weeds• Visual/Aesthetics
• Question and Answer SessionSlide 3
Today’s Meeting Purpose

• What are the major potential emission sources involved in natural gas development?Temporary– Truck Traffic and Construction of Pads and Pipelines – fugitive dust
• Controls = reduce traffic (water pipeline), gravelling pads and dust suppression via water/soiltac
– Drilling Rig Generators – diesel fumes and exhaust emissions• Controls = electric grid power-substitute for diesel generators, low NOX engines where grid unavailable
– Drilling Reserve Pits• Controls = pitless drilling
– Fraccing Operations – diesel fumes and exhaust emissions, flowback tanks• Controls = Green completion skids and covered flowback tanks
Long Term– Production Tanks – VOC emissions from condensate flashing (> 90% of potential)
• Controls = Combustor flare controls and automatic igniters
– Separators and Wellheads – fugitive VOC emissions from valves and flanges • Controls = Low bleed valves and routine maintenance of connection integrity
– Water Handling Facility – VOC and bacterial odors• Controls = Eliminate through use of covered pit design and vapor collection/combustion
Slide 4
Air Quality Modeling Study – Brief Overview
Slide 5
Air Quality Modeling Study – Brief Overview
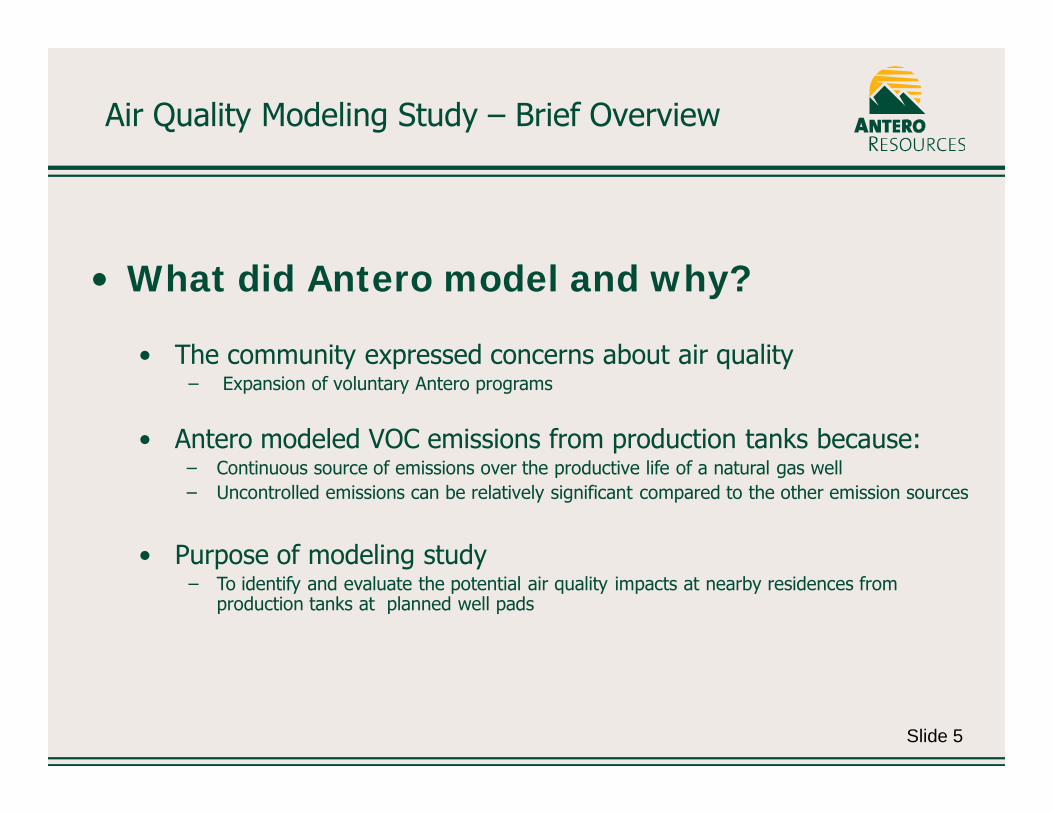
• What did Antero model and why?
• The community expressed concerns about air quality− Expansion of voluntary Antero programs
• Antero modeled VOC emissions from production tanks because:– Continuous source of emissions over the productive life of a natural gas well– Uncontrolled emissions can be relatively significant compared to the other emission sources
• Purpose of modeling study− To identify and evaluate the potential air quality impacts at nearby residences from
production tanks at planned well pads

• Potential Air Quality Impacts – EPA approved air model (AERMOD) used to estimate air quality impacts– Air Quality Impacts = Predicted benzene concentrations around well pads– EPA model used Rifle Airport meteorological data and worst case production tank
emission rates
• Modeled Benzene Concentrations– Compared to EPA Health Based Standards and– Colorado Air Monitoring Data
• Conclusion – Modeled Worst Case Benzene Concentrations at Nearby Residences Are Significantly Below EPA Health Based Standard
Slide 6
Air Quality Modeling Study – Brief Overview

• Assumptions– No tank emission controls
– Up to 20 wells on a completed pad (2x Antero actual dev. plans)
– 11 proposed pads
– 1.78 bbls condensate per MMscf (Grand Valley and Parachute Field)
– Each well makes 2 MMscf/day
– Each pad was modeled assuming 75 bbls/day condensate
• Antero Tank Emission Factor– EPA Approved Model (E&P Tanks 2.0) - Used to determine
condensate tank VOC/benzene emission rates
– Uncontrolled Benzene emissions ~ 0.36 tpy from each well pad
– Uncontrolled Emission Factor = 0.026 lbs benzene/bbl condensate
Slide 7
Modeling Inputs – Worst Case Emissions Scenario

Modeling Inputs – Worst Case Emissions Scenario (cont.)
• Why Model Worst Case Uncontrolled Emission Scenario?– Actual production tank well pad emissions controlled by flare
with potential to be fitted with auto igniter
– Actual modeled emissions (controlled) will be significantly less than worst case modeled emissions (uncontrolled)
– If worst case modeled benzene concentrations are below EPA health based standards then actual benzene impacts will be significantly less

Modeling Inputs – Meteorology
• Used a Rifle Airport 5-yr meteorological dataset• Rifle Airport dataset provided by Colorado Department of Public Health &
Environment (CDPHE)• Rifle Airport - Wind direction/speed data
– Most representative of Battlement Mesa meteorological conditions– Prevailing wind direction are from west and south (see Rifle Airport Wind Rose
Slide)• Rifle Airport - Terrain influences
– Similar to Battlement Mesa – Both locations immediately south of river and I-70– Rifle Airport at 5,500 ft, Battlement Mesa at 5,100 to 5,500 ft
----------------------------------------------------------
• Closet meteorological dataset is Williams’ Parachute Creek Gas Plant (PCGP), however it was not used because:– Located in Grand Valley oriented NW to SE– PCGP Wind Rose shows prevailing winds parallel to Grand Valley– Dataset limited to 1-yr
Slide 9

Modeling Inputs – Rifle Airport Wind Rose
Dominate Wind Directions
West
Sout
h

Air Quality Modeling – Predicting Impacts from Well Pad Production Tanks
• Modeled potential offsite impacts at “Receptors” out to 1,500 feet in all directions from each well pad location
• Receptor = residence, golf course clubhouse, schools, etc.
• Impacts = Modeled 24-hr Benzene Concentrations
• Identified location of Potential Maximum 24-hr impacts relative to each pad location
• Modeled Results – See Area Specific Well Pad Impact Maps– Area specific maps include setback distances
• 350 ft - COGCC Setback in high density areas• 500ft - Antero Internal Setback• 1,000 ft
Slide 11

Benzene Air Quality Data - Monitored
• Compared modeled worst case uncontrolled 24-hr benzene concentrations to monitoring data in Denver, Grand Junction and Piceance Basin.
• Average monitored 24-hr benzene concentrations– Denver = 2.5 to 3.2 µg/m3 (data collection follows EPA monitoring protocols) – Grand Junction = 1.6 µg/m3 (data collection follows EPA monitoring protocols) – Parachute = 3 µg/m3 (likely less than 3 µg/m3 because benzene “non-detects” not
counted – Garfield County monitoring data)
• Benzene monitoring data for Colorado are presented in following table

Monitoring Data – Benzene Background
Benzene Monitoring Results in Colorado - 24-hr Measured Concentrations
Location Average Maximum1Denver - Urban Site 1 3.2 7.41Denver - Urban Site 2 2.5 7.21Denver - Urban Site 3 2.8 7.02Grand Junction (Powell) 1.6 4.2Glenwood - Courthouse 1.2 3.5New Castle - Library 2.0 15.0Rifle - Henry Bldg 2.9 6.9Parachute 3.0 5.1Silt - Cox 1.0 1.9Silt - Bell 2.0 7.4Butterfly 2.0 7.7Isley 1.2 3.0West Landfill 4.4 7.5Sebold 1.1 2.7Haire 1.0 2.3
1 Denver data from 2003 monitoring project2 Grand Junction 2006-2007 data (Powell site)* Garfield County date from 2005-2007 study
24-hr Conc. (ug/m3)

Benzene Air Quality Data - Modeled
– Worst case modeled benzene concentrations were compared to:• EPA acceptable 24-hr exposure of 30 µg/m3 = benzene health
based standard (U.S. EPA. Integrated Risk Information System (IRIS) on Benzene. National Center for Environmental Assessment, Office of Research and Development, Washington, DC. 2002)
– Residential (receptor) locations are all below the EPA standard of 30 µg/m3
– 9.2 µg/m3 was the highest modeled 24-hr concentration (house north of N Pad). (maximum out of 365 X 5 yrs = 1825 days)
– Background benzene 24-hr concentration of 3 µg/m3 in Parachute was added to modeled results for comparison to the health based 24-hr standard.
– Maximum Modeled benzene 24-hr concentrations for each well pad are presented in the next slide.
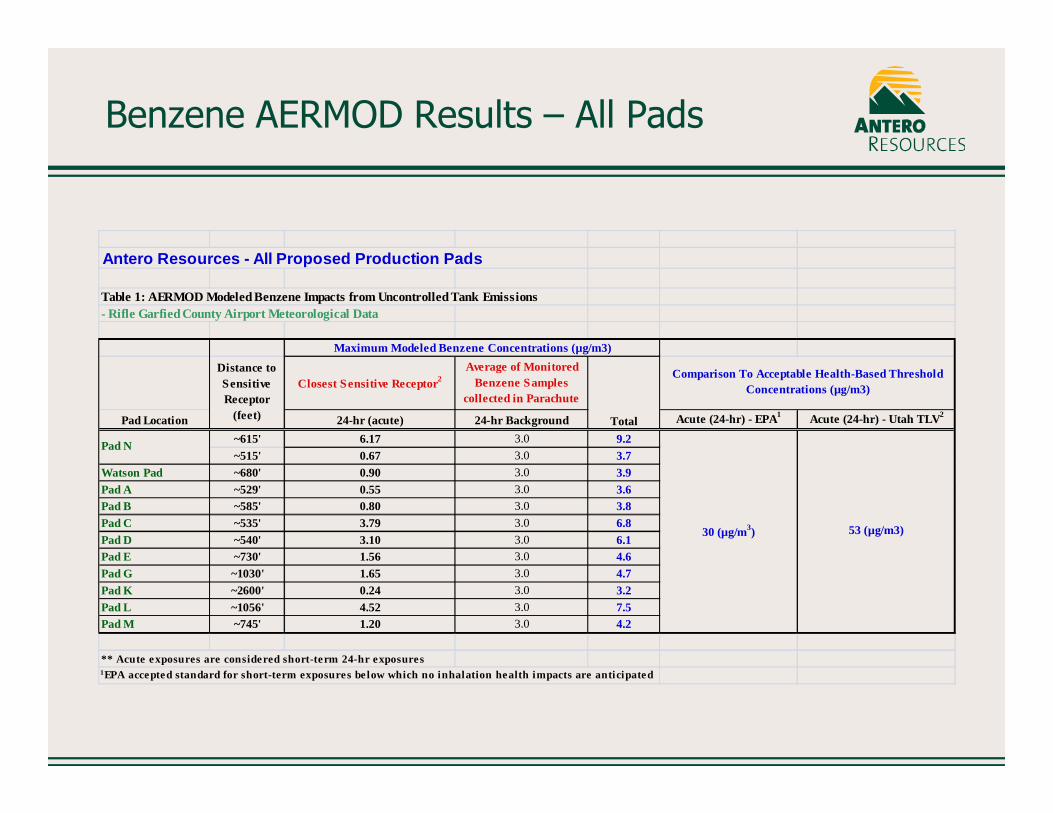
Benzene AERMOD Results – All Pads
Antero Resources - All Proposed Production Pads
Table 1: AERMOD Modeled Benzene Impacts from Uncontrolled Tank Emissions- Rifle Garfied County Airport Meteorological Data
Closest Sensitive Receptor2Average of Monitored
Benzene Samples collected in Parachute
Pad Location 24-hr (acute) 24-hr Background Acute (24-hr) - EPA1 Acute (24-hr) - Utah TLV2
~615' 6.17 3.0 9.2~515' 0.67 3.0 3.7
Watson Pad ~680' 0.90 3.0 3.9Pad A ~529' 0.55 3.0 3.6Pad B ~585' 0.80 3.0 3.8Pad C ~535' 3.79 3.0 6.8Pad D ~540' 3.10 3.0 6.1Pad E ~730' 1.56 3.0 4.6Pad G ~1030' 1.65 3.0 4.7Pad K ~2600' 0.24 3.0 3.2Pad L ~1056' 4.52 3.0 7.5Pad M ~745' 1.20 3.0 4.2
** Acute exposures are considered short-term 24-hr exposures1EPA accepted standard for short-term exposures be low which no inhalation health impacts are anticipated
Maximum Modeled Benzene Concentrations (µg/m3)
Distance to Sensitive Receptor
(feet) Total
Pad N
53 (µg/m3)
Comparison To Acceptable Health-Based Threshold Concentrations (µg/m3)
30 (µg/m3)

Air Quality – Base Map
Slide 16
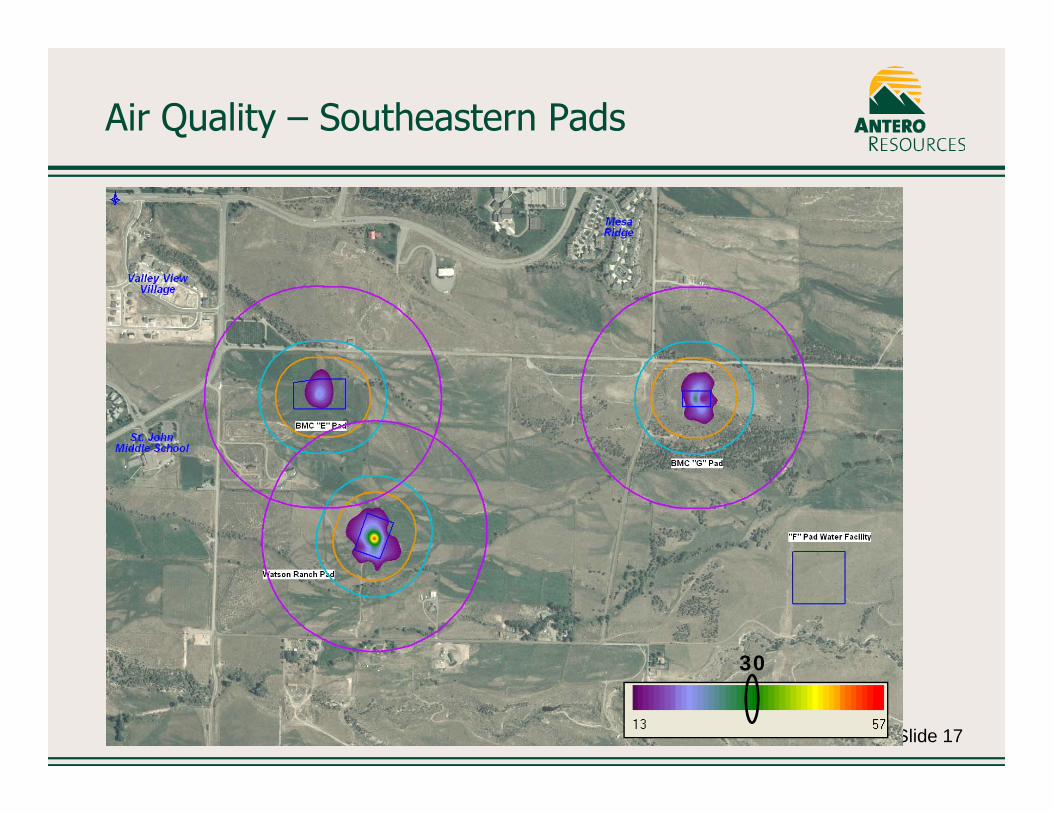
Air Quality – Southeastern Pads
Slide 17
30
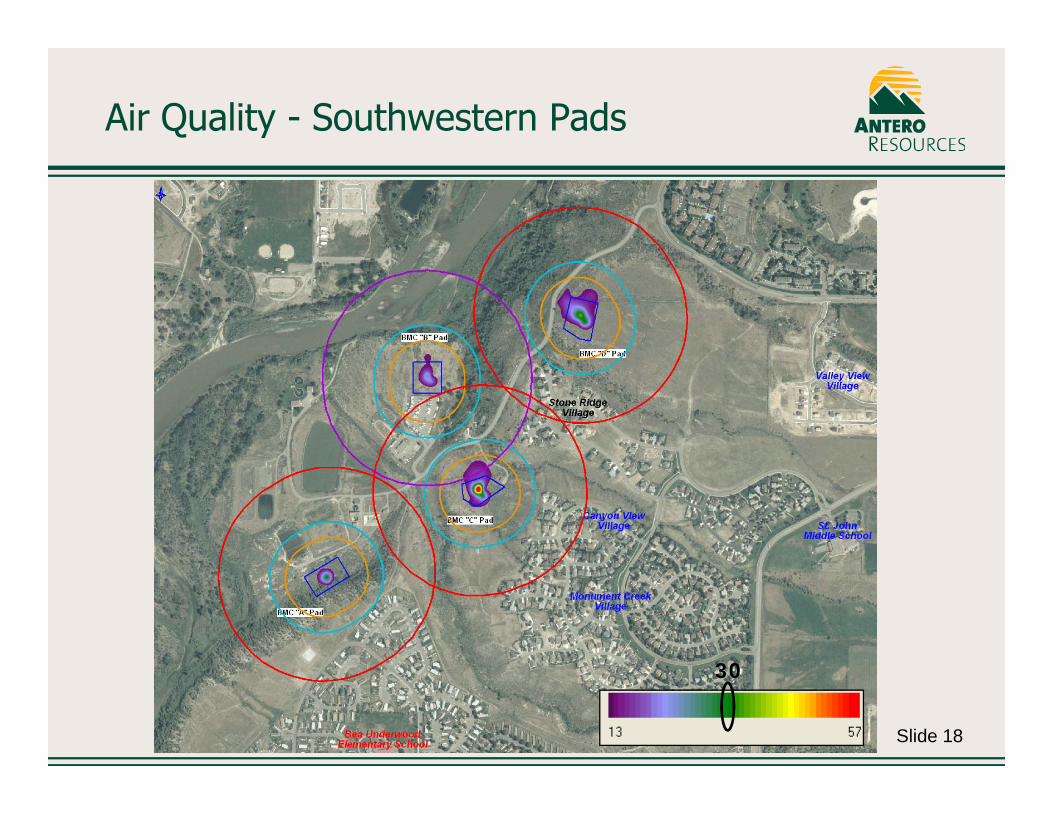
Air Quality - Southwestern Pads
Slide 18
30

Air Quality – Northern Pads
Slide 19
30

Air Modeling Study - Conclusions
• The modeled benzene concentrations at or above the EPA health based standard of 30 µg/m3 do not extend beyond pad boundaries
• The modeled benzene concentrations at ALL residential receptors are between 3.2 and 9.2 ug/m3 - well below the 24-hr EPA acceptable exposure threshold of 30 ug/m3 (includes background)
• Antero installed control measures will reduce incremental benzene emissions by approximately 95%
• The highest modeled benzene concentration (worst case scenario) at nearest residence is about 30% of the acceptable EPA health based standard, average is about 19% of the acceptable EPA health based standard

Slide 21
Production tanks
VOC combustor
Air Quality – Odor Mitigation
• All tank venting emissions are routed to a VOC combustor• VOC combustor will operate with igniter
Air Quality – Odor Mitigation
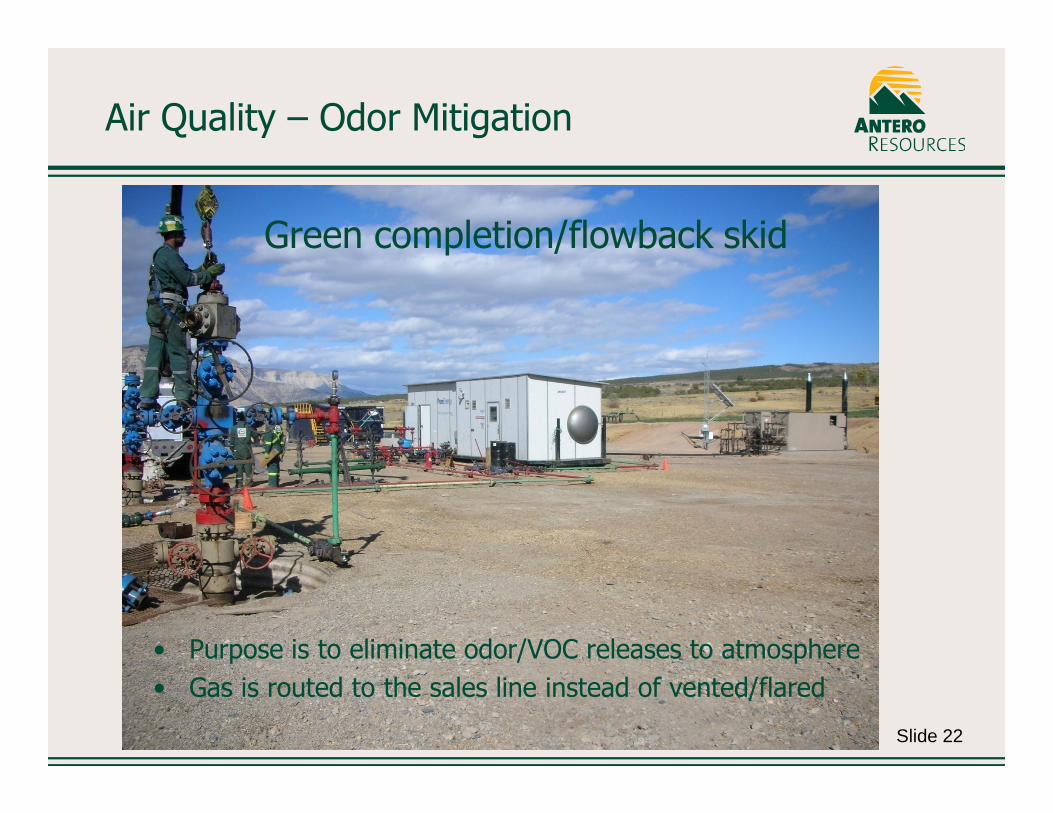
Slide 22
• Purpose is to eliminate odor/VOC releases to atmosphere• Gas is routed to the sales line instead of vented/flared
Green completion/flowback skid

Air Quality – Odor Mitigation
Slide 23
Storage tanks enclosed for odor control

Air Quality – Odor Mitigation
Slide 24
Water Storage and Treatment Facility (Pad F)
Example of Cover Technology for Water Handling Facilities
Empty
Full

Slide 25
Air Quality – Summary
• Well Pads – potential air emissions reduced and/or eliminated with controls or design (e.g. electric power from grid)
• Production Tank Air Quality Modeling Study− Dr. Walker of Mesa State said during his August 2, 2009 GVCA annual
meeting that “air quality modeling is a useful predictive tool for estimating exposures to VOC emissions from oil and gas.”
− The modeled benzene concentrations at ALL residential receptors are well below the 24-hr EPA acceptable exposure threshold of 30 ug/m3