battery management systems for electric and plug-in hybrid .... mi.pdf · super conducting magnetic...
TRANSCRIPT
1
Chris Mi, Ph.D, Fellow IEEE
Professor, Department of Electrical and Computer Engineering
Director, DOE GATE Center for Electric Drive Transportation
San Diego State University
5500 Campanile Drive, San Diego, CA 92182 USA,
Tel: (619)594-3741; email: [email protected]
Battery Management Systems for
Electric and Plug-in Hybrid Electric
Vehicles
First Prepared on Jan 2009. Last Revised on October 20, 2015
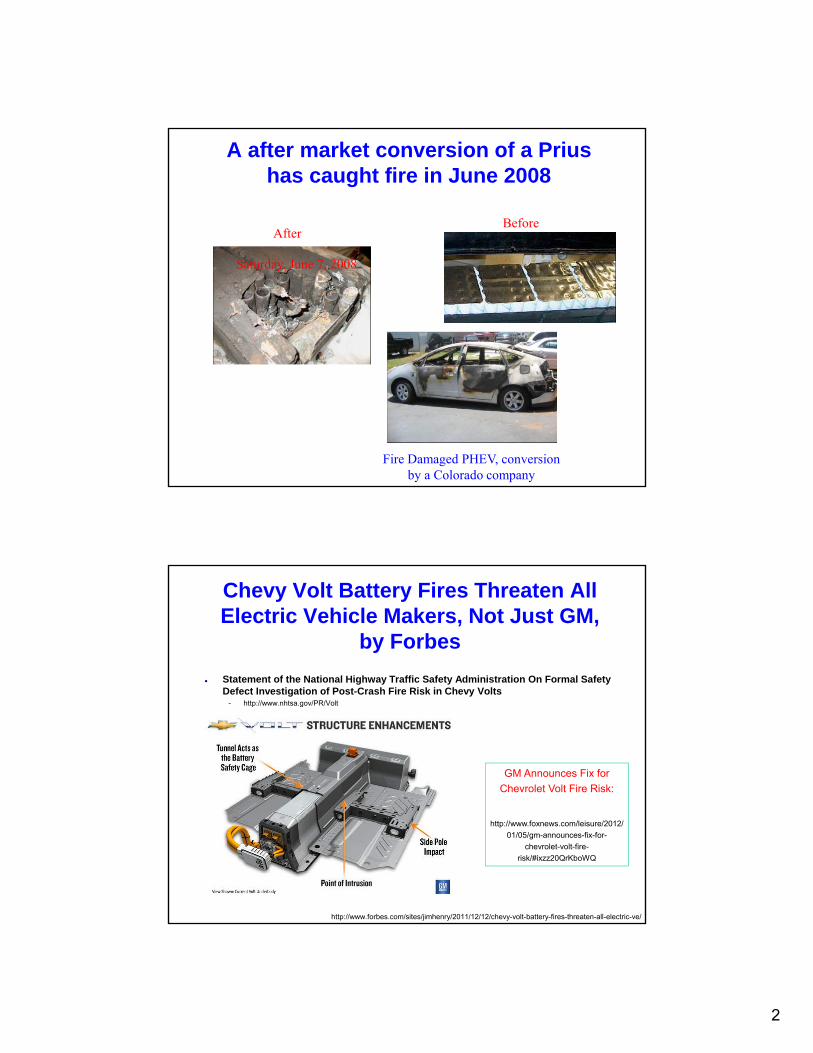
OEM and Suppliers are committed to the electrification of the Automobile
Range, cost, charging time is of major concerns, and……………….…..
EVs provide opportunity for fuel savings and GHG emissions.
2
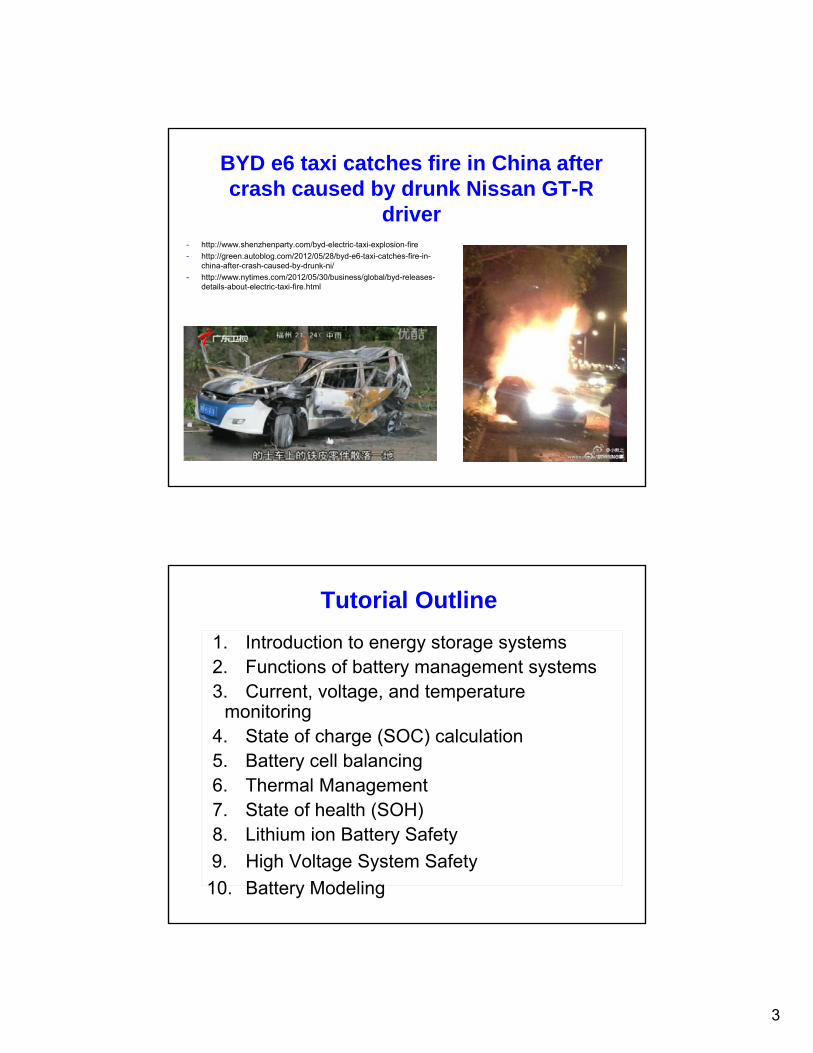
A after market conversion of a Prius has caught fire in June 2008
Fire Damaged PHEV, conversion by a Colorado company
Saturday, June 7, 2008
Before After
Chevy Volt Battery Fires Threaten All Electric Vehicle Makers, Not Just GM,
by Forbes
Statement of the National Highway Traffic Safety Administration On Formal Safety Defect Investigation of Post-Crash Fire Risk in Chevy Volts
- http://www.nhtsa.gov/PR/Volt
GM Announces Fix for
Chevrolet Volt Fire Risk:
http://www.foxnews.com/leisure/2012/
01/05/gm-announces-fix-for-
chevrolet-volt-fire-
risk/#ixzz20QrKboWQ
http://www.forbes.com/sites/jimhenry/2011/12/12/chevy-volt-battery-fires-threaten-all-electric-ve/
3
BYD e6 taxi catches fire in China after crash caused by drunk Nissan GT-R
driver- http://www.shenzhenparty.com/byd-electric-taxi-explosion-fire
- http://green.autoblog.com/2012/05/28/byd-e6-taxi-catches-fire-in-china-after-crash-caused-by-drunk-ni/
- http://www.nytimes.com/2012/05/30/business/global/byd-releases-details-about-electric-taxi-fire.html
Tutorial Outline
1. Introduction to energy storage systems2. Functions of battery management systems3. Current, voltage, and temperature
monitoring 4. State of charge (SOC) calculation5. Battery cell balancing 6. Thermal Management7. State of health (SOH) 8. Lithium ion Battery Safety
9. High Voltage System Safety
10. Battery Modeling
4
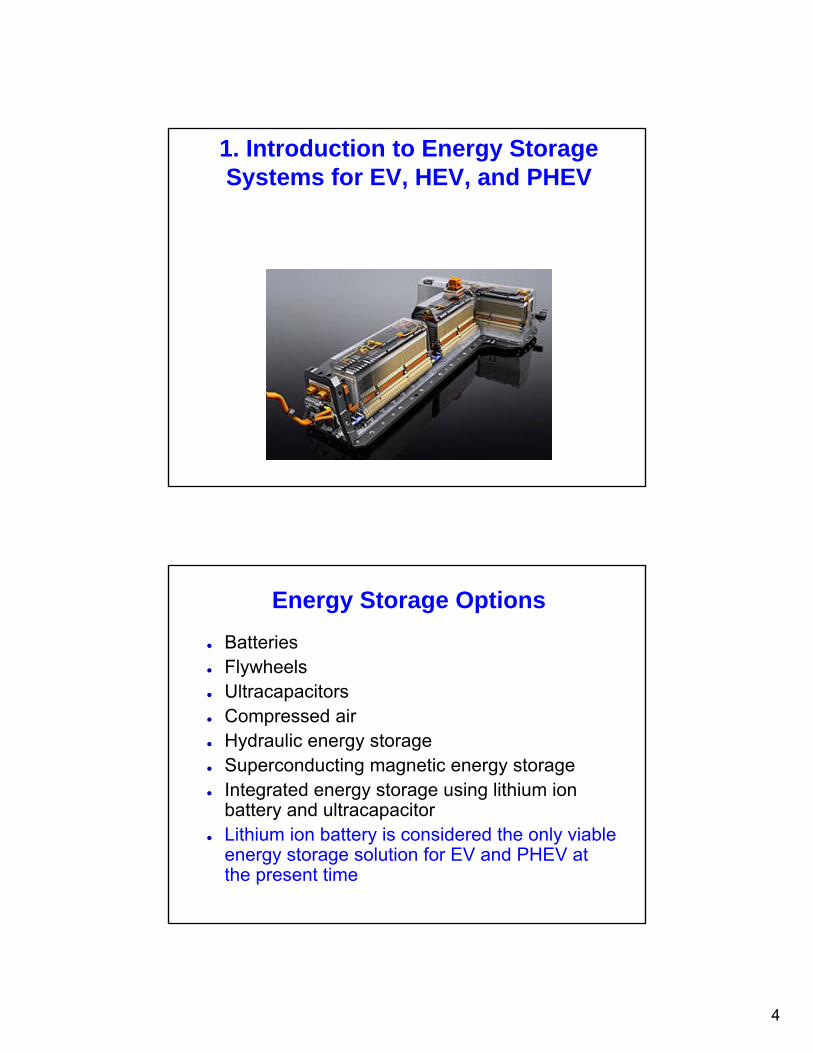
1. Introduction to Energy Storage Systems for EV, HEV, and PHEV
Energy Storage Options
Batteries Flywheels Ultracapacitors Compressed air Hydraulic energy storage Superconducting magnetic energy storage Integrated energy storage using lithium ion
battery and ultracapacitor Lithium ion battery is considered the only viable
energy storage solution for EV and PHEV at the present time
5
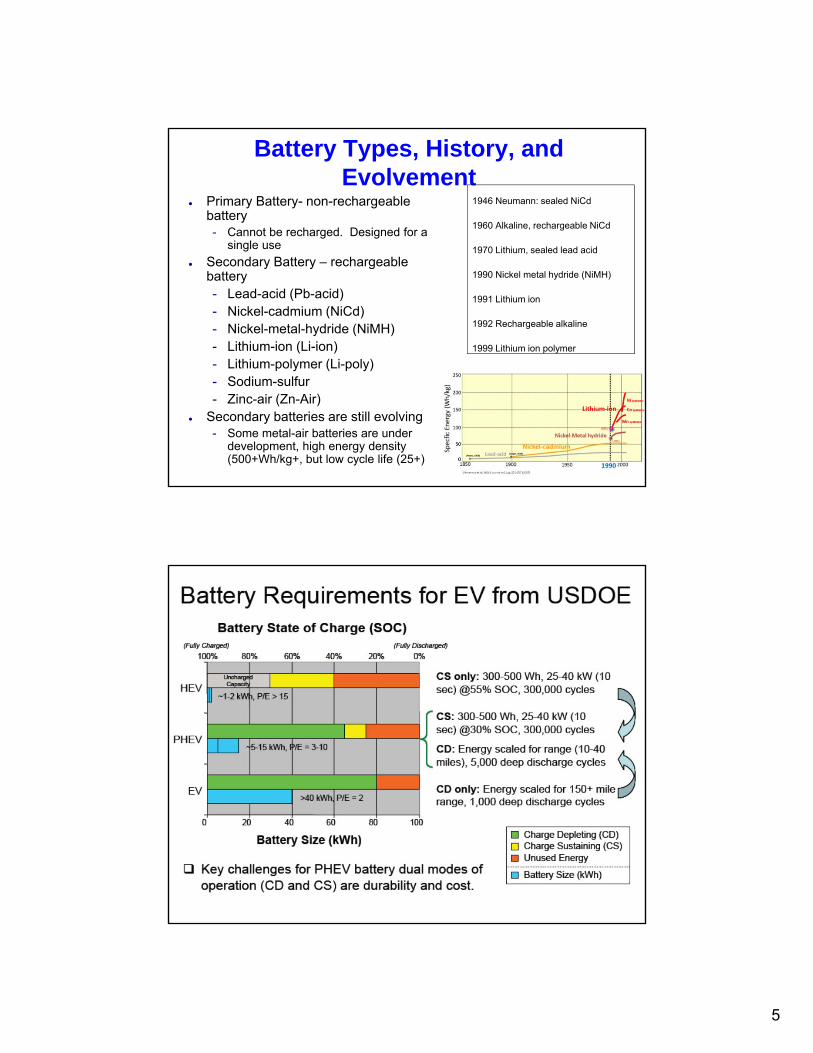
Battery Types, History, and Evolvement
Primary Battery- non-rechargeable battery- Cannot be recharged. Designed for a
single use
Secondary Battery – rechargeable battery- Lead-acid (Pb-acid)- Nickel-cadmium (NiCd)- Nickel-metal-hydride (NiMH)- Lithium-ion (Li-ion)- Lithium-polymer (Li-poly)- Sodium-sulfur- Zinc-air (Zn-Air)
Secondary batteries are still evolving- Some metal-air batteries are under
development, high energy density (500+Wh/kg+, but low cycle life (25+)
1946 Neumann: sealed NiCd
1960 Alkaline, rechargeable NiCd
1970 Lithium, sealed lead acid
1990 Nickel metal hydride (NiMH)
1991 Lithium ion
1992 Rechargeable alkaline
1999 Lithium ion polymer

6
Battery Power and Energy
BM
PSP
Specific Energy
Specific Power
Discharge Energy
Total Battery Mass B
ESE
M
(units: Wh/kg)
(units: W/kg)
Energy Density
Power Density
Discharge EnergyTotal Battery Volume
EPower Density
V
PPower Density
V
(units: W/m3)
(units: Wh/m3)
Lithium Battery Schematics

7
Advantages of Li-Ion Batteries
Lithium battery are considered the only viable solution for PHEV
Li ion batteries offer high energy density: - 1.5 times NiMH; 3 times lead acid
High power density
Long life cycles - 1000 vs. 300 lead acid;
Low memory effect; deep discharge cycles
High cell voltage (3.2V vs. 1.2V)
Low self discharge, long shelf life – only 5% discharge loss per month; 10% for NiMH, 20% for NiCd
model 18650, energy 3.2V*1.5Ah=4.8Wh;
Lithium:
228Wh/L;
120-200Wh/kg
Lead Acid:
85Wh/L; 39Wh/kg
Disadvantages of Li-Ion
Expensive -- 40% more than NiCd.
Delicate -- battery temp must be monitored from within (which raises the price), and sealed particularly well.
Regulations -- when shipping Li-Ion batteries in bulk (which also raises the price).
Class 9 miscellaneous hazardous material

8
Major Lithium Ion Battery PlayersCompany Cathode Anode Electrolyte Packaging Structure Shape
Toyota NCA Graphite Liquid Metal Spiral Elliptic
Panasonic NMC Blend Liquid Metal Spiral Elliptic
JCS NCA Graphite Liquid Metal Spiral Cylindrical
Hitachi LMO/NMC Hard Carbon Liquid Metal Spiral Cylindrical/Elliptic
AESC LMO/NMC Hard Carbon Liquid Pouch Stacked Prismatic
Sanyo LMO//NMC Blend Liquid Metal Spiral Cylindrical
GS Yuasa LMO/NMC Hard Carbon Liquid Metal Spiral Elliptic
A123 LFP Graphite Liquid Metal Spiral Cylindrical/Elliptic
LG Chem LMO Brend Carbob Gel Pouch Stacked Prismatic
Samsung LMO/NMC Graphite Liquid Metal Spiral Cylindrical
SK LMO Graphite Liquid Pouch Spiral Prismatic
Toshba LMO LTO Liquid Pouch/metal Spiral Prismatic
AltairNano LMO LTO Liquid Pouch Stacked Prismatic
BYD LFP NA Liquid Metal Spiral Cylindrical/Elliptic
Electrovaya LMP NA NA NA NA NA
Valence LFP NA Polymer pouch Stacked Prismatic
Major CollaborationsFord Toyota Honda GM Mercede
sNissa
nVW Mitsubis
hiHyunda
iBosc
hContinenta
l
Sanyo X X X X Develop
Panasonic
JV
NEC JV
JC-Saft X
Bak-A123 X
A123-Cobsys
X
MRI X
LG X X
GYS JV JV
Samsung JV
Enax JV
9
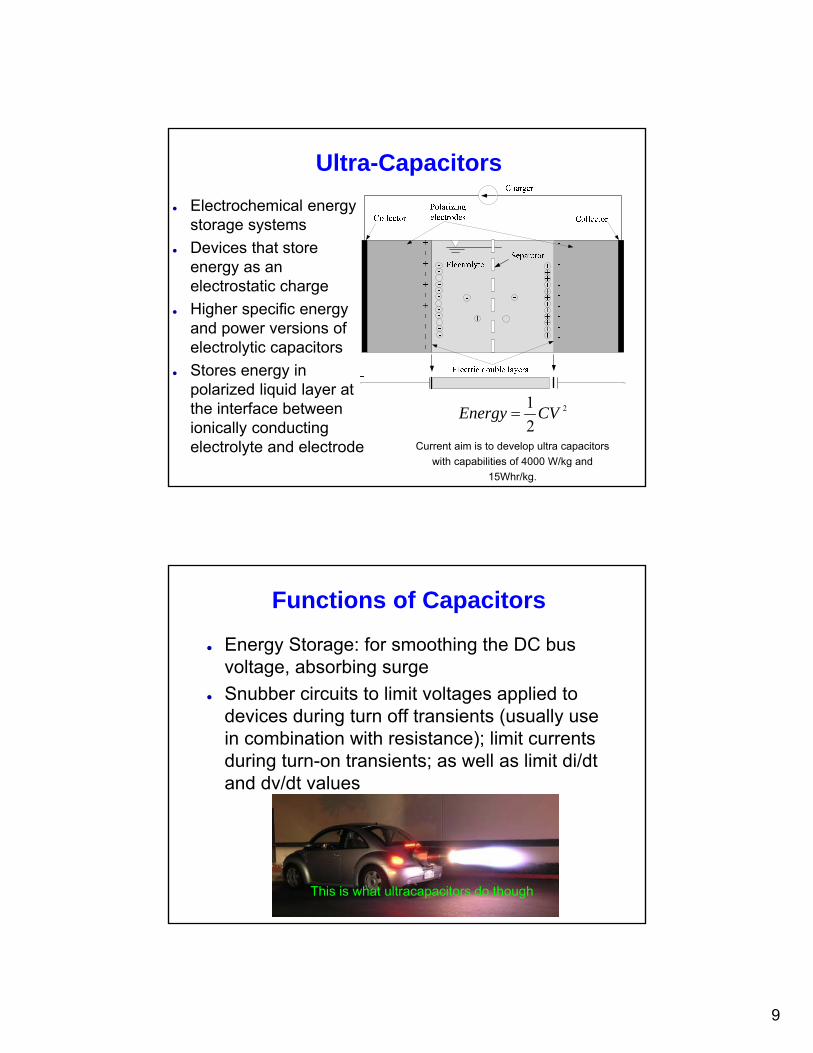
Ultra-Capacitors
Electrochemical energy storage systems
Devices that store energy as an electrostatic charge
Higher specific energy and power versions of electrolytic capacitors
Stores energy in polarized liquid layer at the interface between ionically conducting electrolyte and electrode
2
2
1CVEnergy
Current aim is to develop ultra capacitors
with capabilities of 4000 W/kg and
15Whr/kg.
Functions of Capacitors
Energy Storage: for smoothing the DC bus voltage, absorbing surge
Snubber circuits to limit voltages applied to devices during turn off transients (usually use in combination with resistance); limit currents during turn-on transients; as well as limit di/dt and dv/dt values
This is what ultracapacitors do though
10
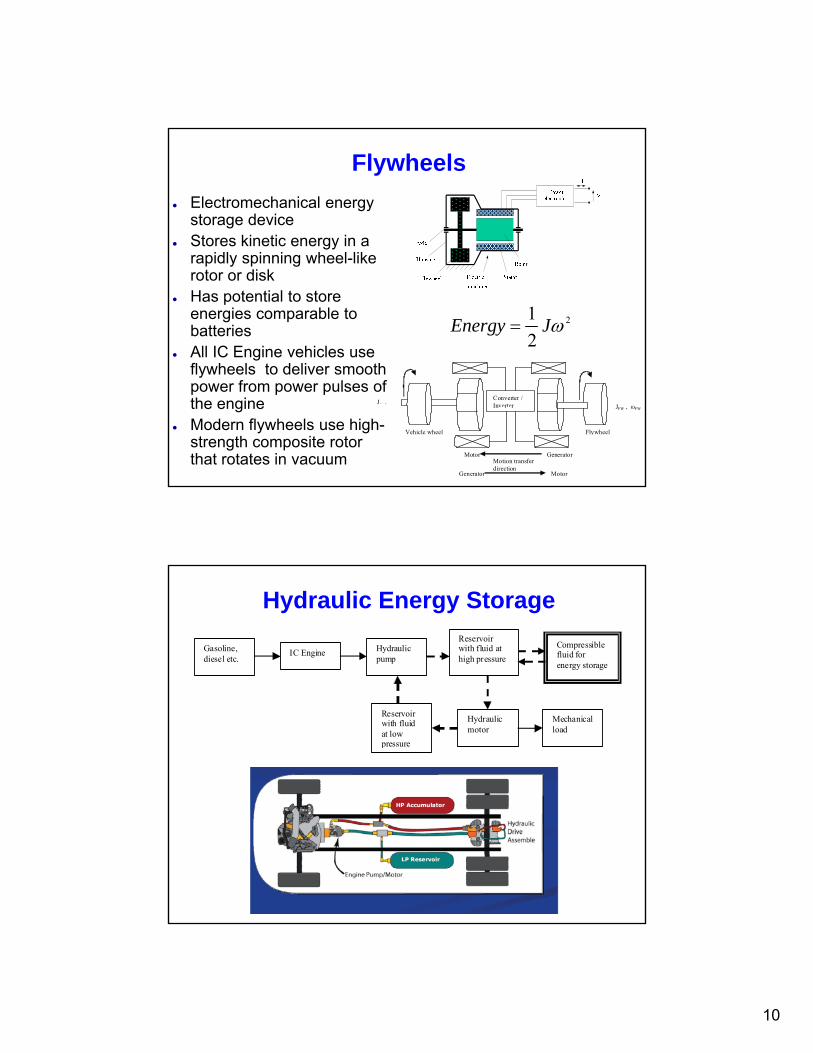
Flywheels
Electromechanical energy storage device
Stores kinetic energy in a rapidly spinning wheel-like rotor or disk
Has potential to store energies comparable to batteries
All IC Engine vehicles use flywheels to deliver smooth power from power pulses of the engine
Modern flywheels use high-strength composite rotor that rotates in vacuum
2
2
1 JEnergy
Flywheel Vehicle wheel
Jv ,
Generator Motor
JFW , ωFW
Converter / Inverter
Generator Motor
Motion transfer direction
Hydraulic Energy Storage
Gasoline, diesel etc.
IC Engine Hydraulic pump
Reservoir with fluid at high pressure
Reservoir with fluid at low pressure
Hydraulic motor
Mechanical load
Compressible fluid for energy storage
11
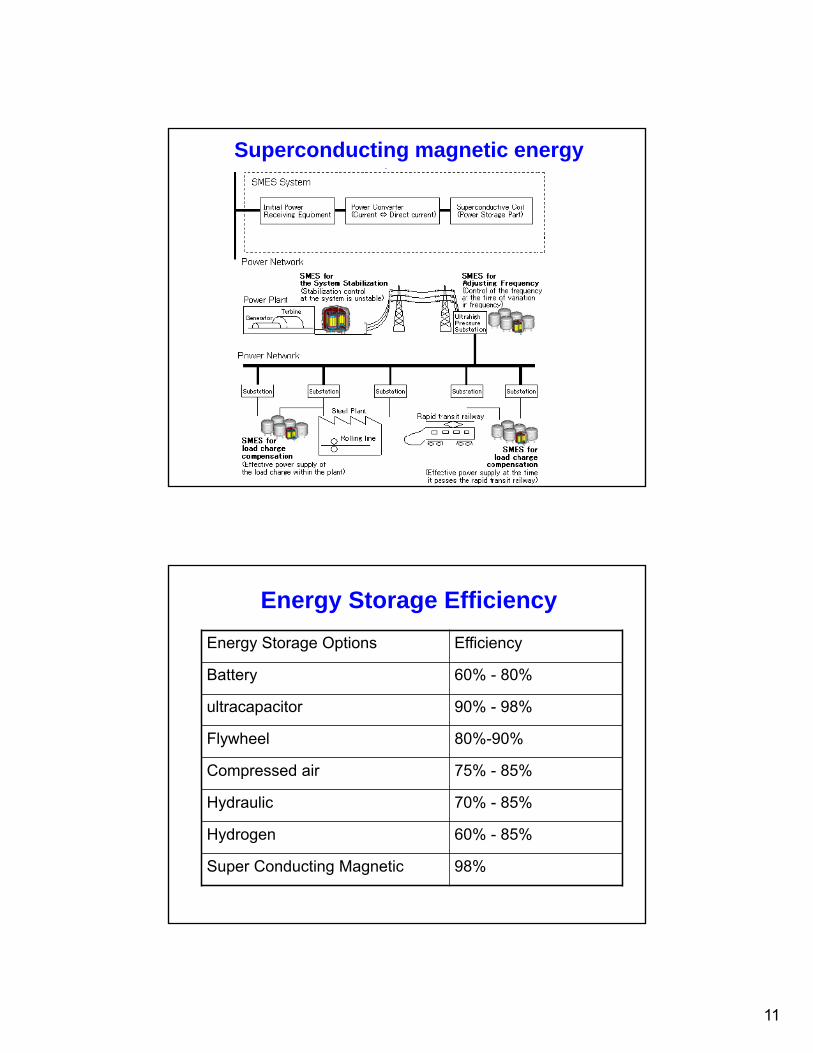
Superconducting magnetic energy storage
Energy Storage Efficiency
Energy Storage Options Efficiency
Battery 60% - 80%
ultracapacitor 90% - 98%
Flywheel 80%-90%
Compressed air 75% - 85%
Hydraulic 70% - 85%
Hydrogen 60% - 85%
Super Conducting Magnetic 98%

12
Hybridization of Energy Storage
High specific
energy storage
High specificpower storage
Powerconverter
Load
Low power demand
High specific
Energy storage
High specificpower storage
Powerconverter
Load
Negative power
Primary power flow
Secondary power flow
High specificEnergy storage
High specificpower storage
Powerconverter
Load
High power demand
(a)
(b)
(c)
Fig. 10.18
Use multiple sources of storage
Tackle high demand and rapid charging capability
One typical example is to combine battery and ultracap in parallel
Topologies of Hybridization
. . .
. . .
Bat
teri
es
+
-
Ultr
acap
acit
or
Direct parallel connection - passive Or through two quadrant chopper for better
power management – semi-active or active
PEMFC
Battery
Buck or Boost DC-DC
Converter
Buck –BoostBidirectional
DC-DC Converter
Ultracapacitor
DCLink Load
• Longer service life due to peaks are only from ultracap
• Smaller size, volume, and weight possible
• More fuel savings due to increased regen capture
• Better performance due to power capabilities
13
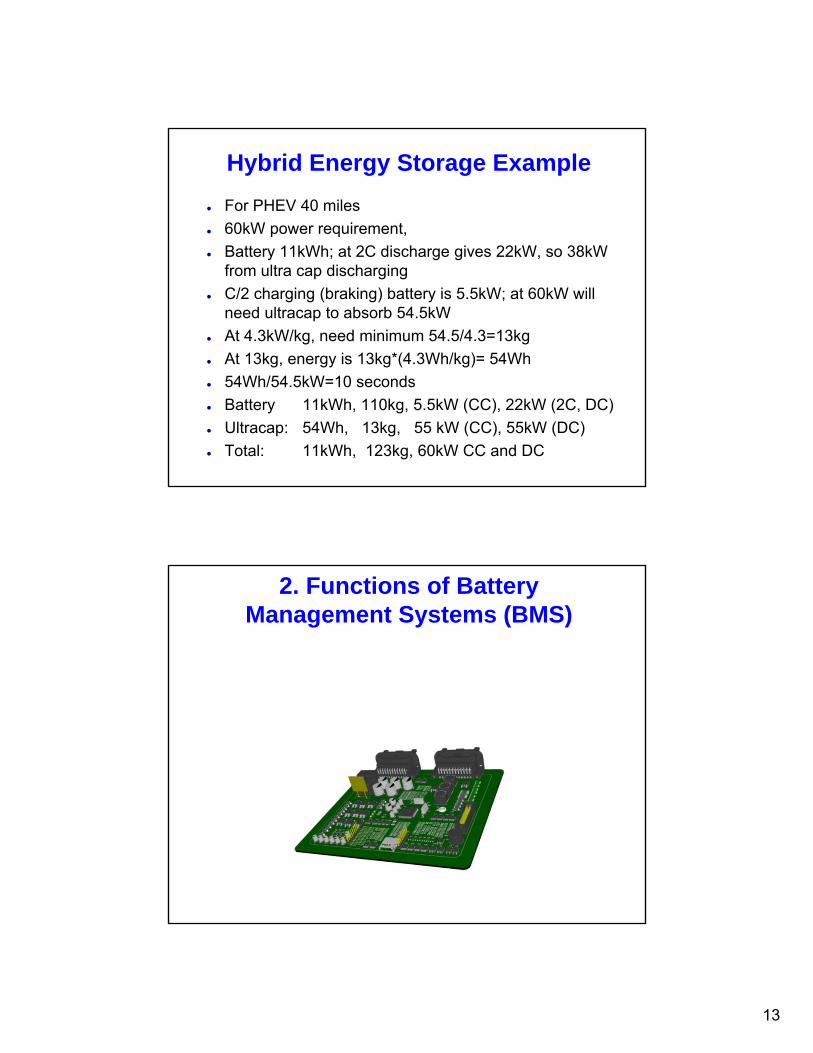
Hybrid Energy Storage Example
For PHEV 40 miles
60kW power requirement,
Battery 11kWh; at 2C discharge gives 22kW, so 38kW from ultra cap discharging
C/2 charging (braking) battery is 5.5kW; at 60kW will need ultracap to absorb 54.5kW
At 4.3kW/kg, need minimum 54.5/4.3=13kg
At 13kg, energy is 13kg*(4.3Wh/kg)= 54Wh
54Wh/54.5kW=10 seconds
Battery 11kWh, 110kg, 5.5kW (CC), 22kW (2C, DC)
Ultracap: 54Wh, 13kg, 55 kW (CC), 55kW (DC)
Total: 11kWh, 123kg, 60kW CC and DC
2. Functions of Battery Management Systems (BMS)

14
Functions of BMS
Cell monitoring- Voltage, current, temperature, state of charge (SOC), SOH
Cell protection and safety- Avoid over charge or over discharge and over temperature
Cell balancing- Dynamic balancing
- Charge balancing
Thermal management
Charge control
Safety, life and capacity of lithium batteries can be effectively addressed by a battery management system - Protect the cells from damage, and prolong the life
3. Current, Voltage, and Temperature Monitoring
15
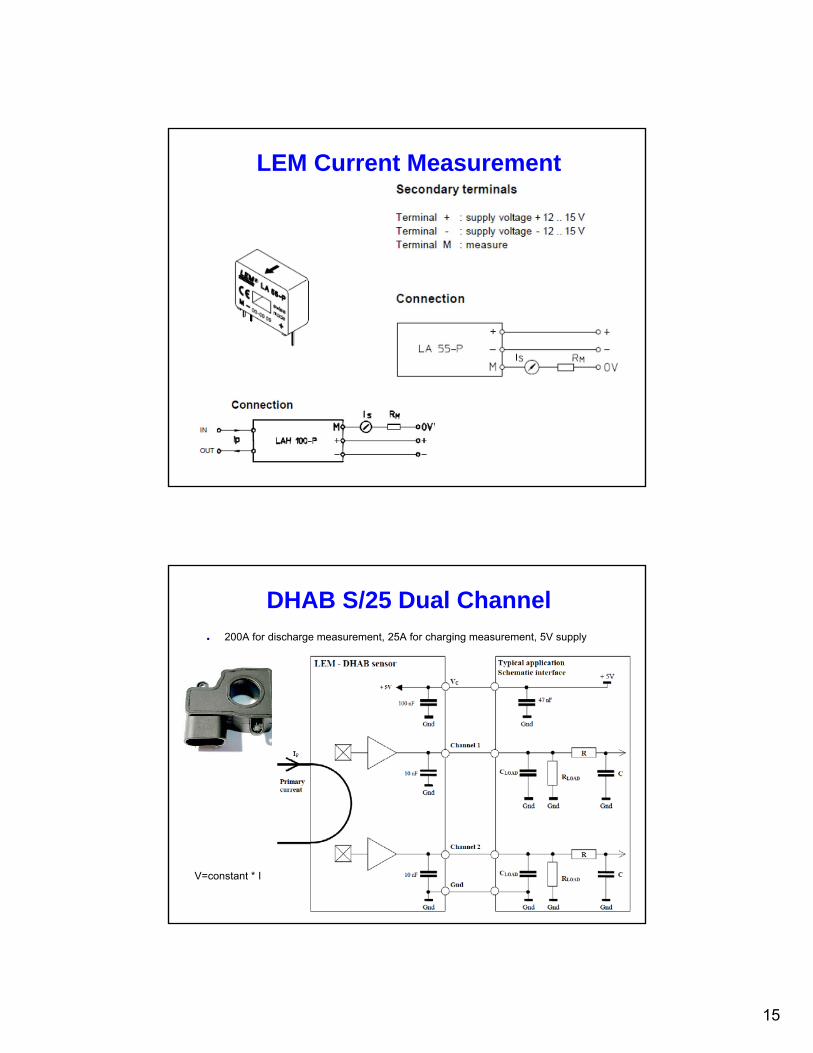
LEM Current Measurement
DHAB S/25 Dual Channel 200A for discharge measurement, 25A for charging measurement, 5V supply
V=constant * I
16
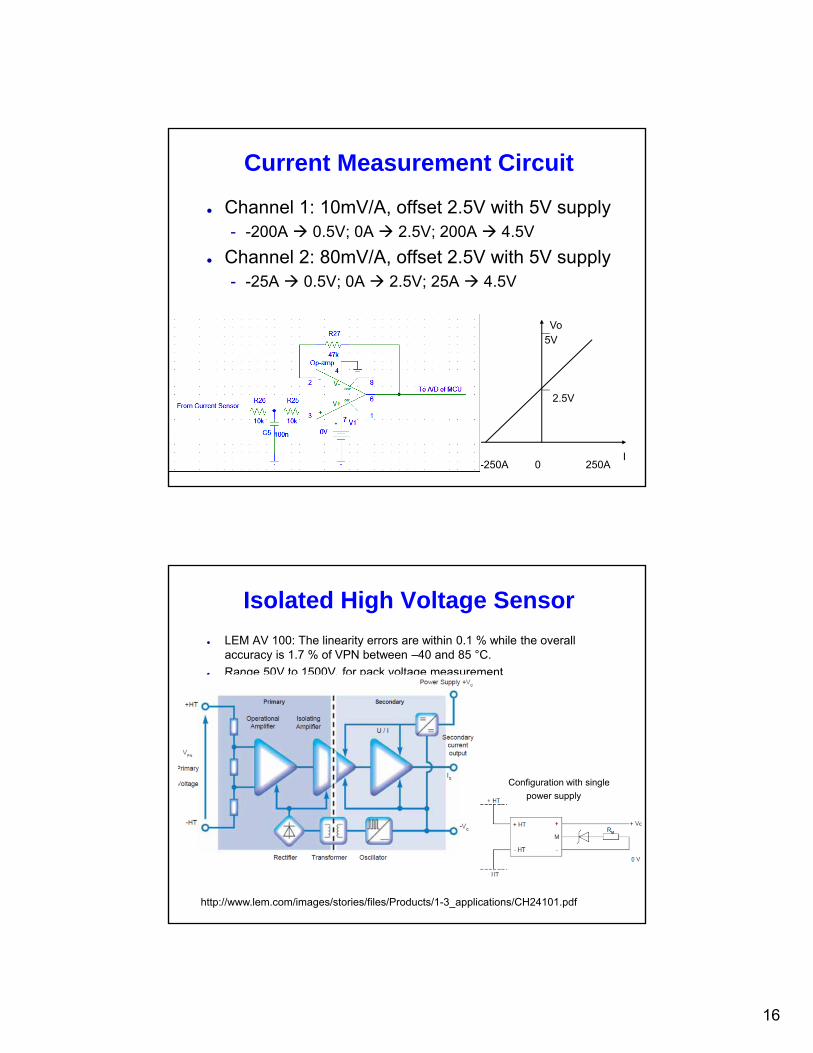
Current Measurement Circuit
Channel 1: 10mV/A, offset 2.5V with 5V supply- -200A 0.5V; 0A 2.5V; 200A 4.5V
Channel 2: 80mV/A, offset 2.5V with 5V supply- -25A 0.5V; 0A 2.5V; 25A 4.5V
-250A 0 250A
2.5V
Vo
I
5V
Isolated High Voltage Sensor
LEM AV 100: The linearity errors are within 0.1 % while the overall accuracy is 1.7 % of VPN between –40 and 85 °C.
Range 50V to 1500V, for pack voltage measurement
Configuration with single
power supply
http://www.lem.com/images/stories/files/Products/1-3_applications/CH24101.pdf
17
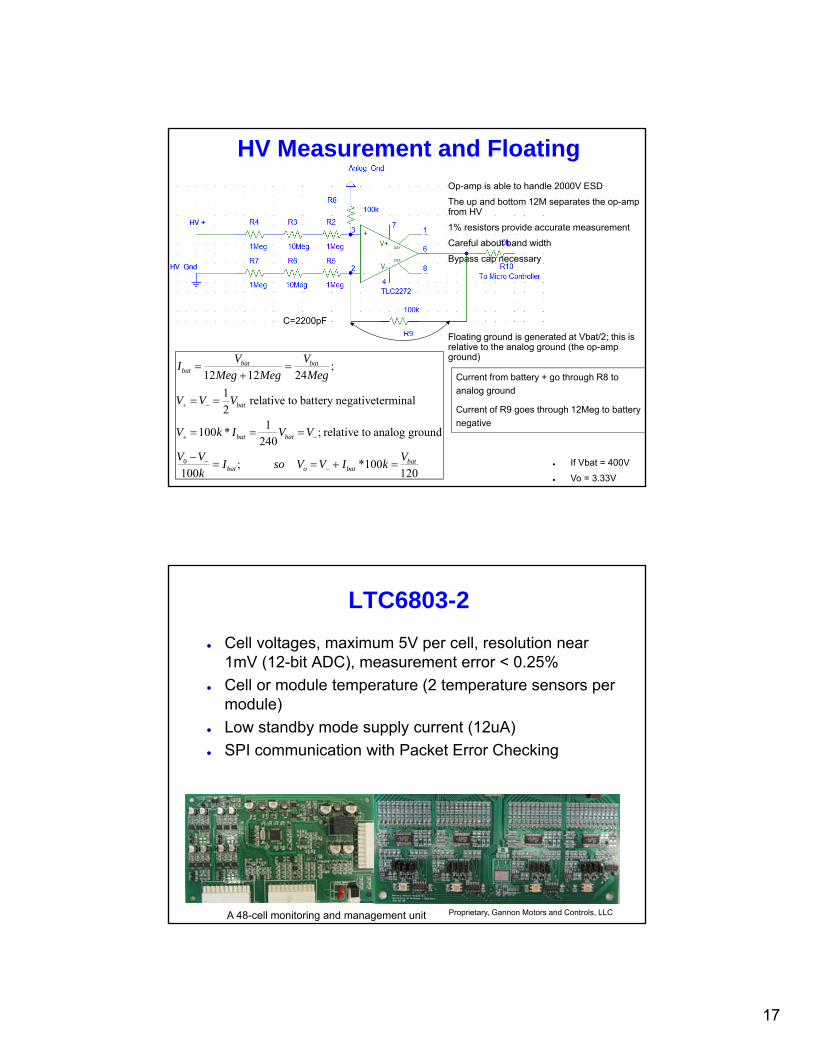
HV Measurement and Floating Ground
0
;12 12 24
1relative to battery negativeterminal
21
100 * ; relative to analog ground240
; *100100 120
bat batbat
bat
bat bat
batbat o bat
V VI
Meg Meg Meg
V V V
V k I V V
V V VI so V V I k
k
If Vbat = 400V
Vo = 3.33V
Op-amp is able to handle 2000V ESD
The up and bottom 12M separates the op-amp from HV
1% resistors provide accurate measurement
Careful about band width
Bypass cap necessary
Floating ground is generated at Vbat/2; this is relative to the analog ground (the op-amp ground)
C=2200pF
Current from battery + go through R8 to
analog ground
Current of R9 goes through 12Meg to battery
negative
LTC6803-2
Cell voltages, maximum 5V per cell, resolution near 1mV (12-bit ADC), measurement error < 0.25%
Cell or module temperature (2 temperature sensors per module)
Low standby mode supply current (12uA)
SPI communication with Packet Error Checking
A 48-cell monitoring and management unit Proprietary, Gannon Motors and Controls, LLC
18
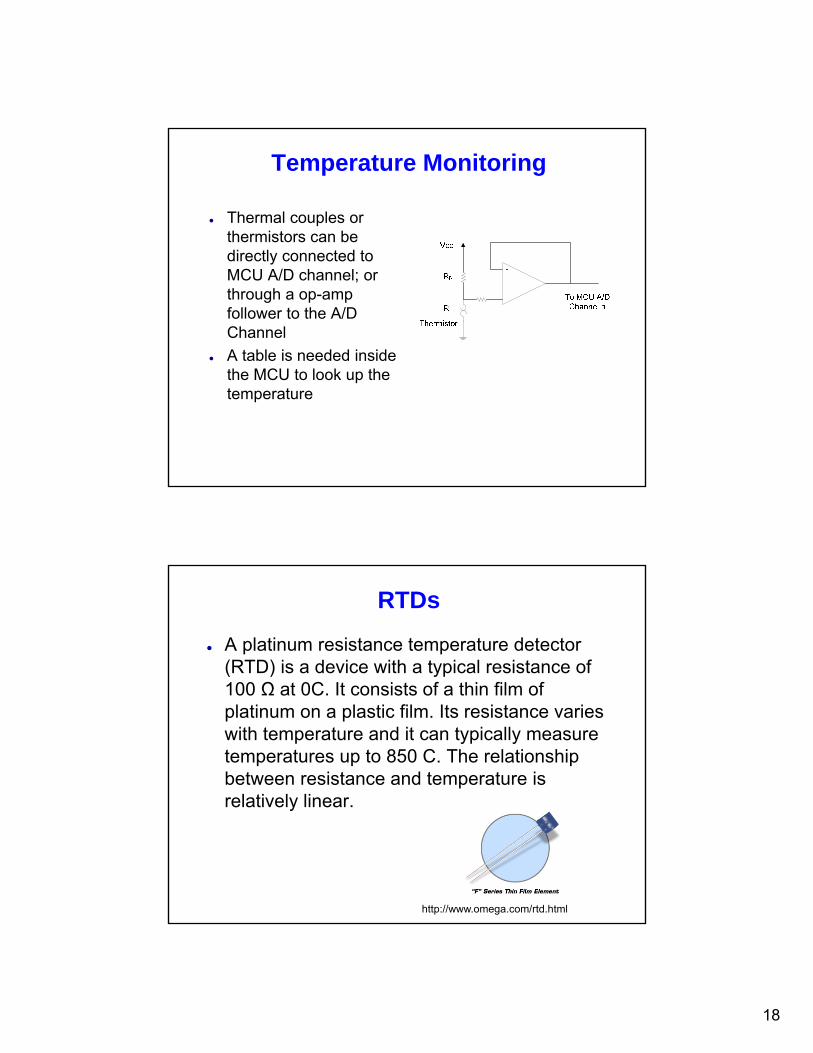
Temperature Monitoring
Thermal couples or thermistors can be directly connected to MCU A/D channel; or through a op-amp follower to the A/D Channel
A table is needed inside the MCU to look up the temperature
RTDs
A platinum resistance temperature detector (RTD) is a device with a typical resistance of 100 Ω at 0C. It consists of a thin film of platinum on a plastic film. Its resistance varies with temperature and it can typically measure temperatures up to 850 C. The relationship between resistance and temperature is relatively linear.
http://www.omega.com/rtd.html
19
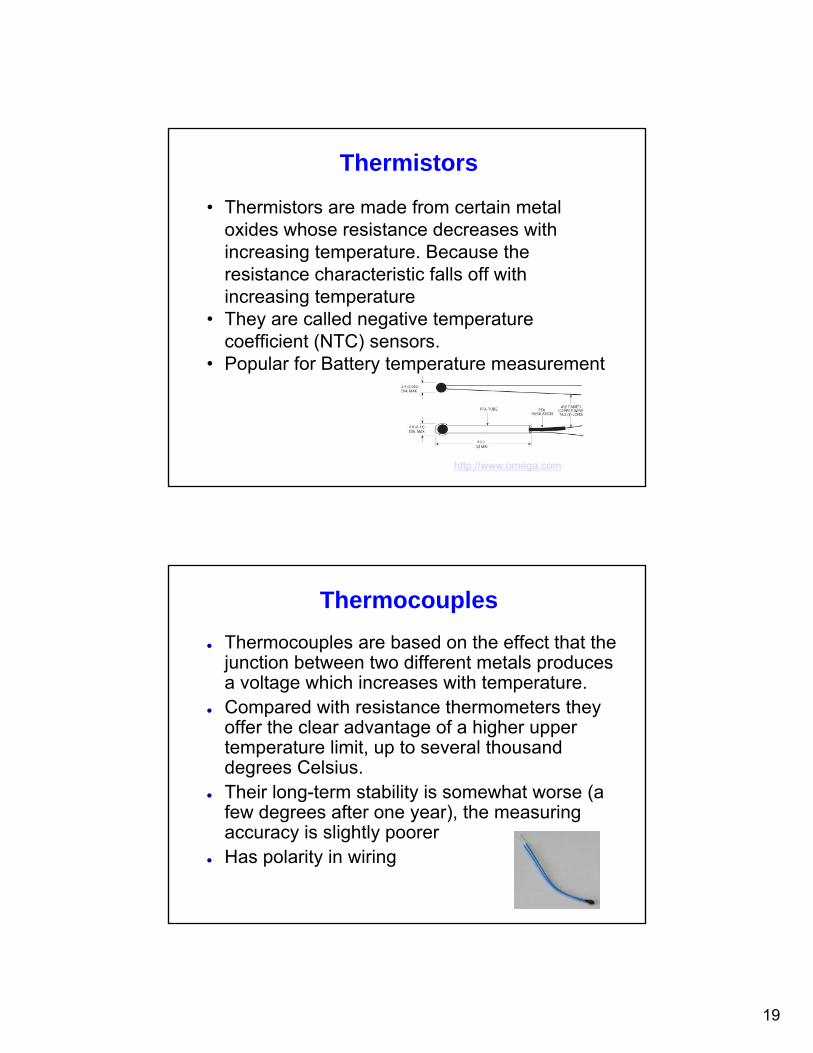
Thermistors
• Thermistors are made from certain metal oxides whose resistance decreases with increasing temperature. Because the resistance characteristic falls off with increasing temperature
• They are called negative temperature coefficient (NTC) sensors.
• Popular for Battery temperature measurement
http://www.omega.com
Thermocouples
Thermocouples are based on the effect that the junction between two different metals produces a voltage which increases with temperature.
Compared with resistance thermometers they offer the clear advantage of a higher upper temperature limit, up to several thousand degrees Celsius.
Their long-term stability is somewhat worse (a few degrees after one year), the measuring accuracy is slightly poorer
Has polarity in wiring
20
4. Calculation of State of Charge
If the battery original SOC is given, then the new SOC is
SOC is in percentage
Ts is the sampling time
Therefore, initial SOC or (Ah) of the battery needs to be known
Sampling frequency needs to be accurate
Integration of Current
*( ) ( )
( )s
total
I TSoC new SoC old
Ah
21
Self Discharge
Self discharge inside the battery can not be counted for by the BMS for SOC calculations
Small current draw from the HV when vehicle is at rest (BMS sleeping mode) can also be monitored by the BMS
Therefore, initial calibration is also important during vehicle start up
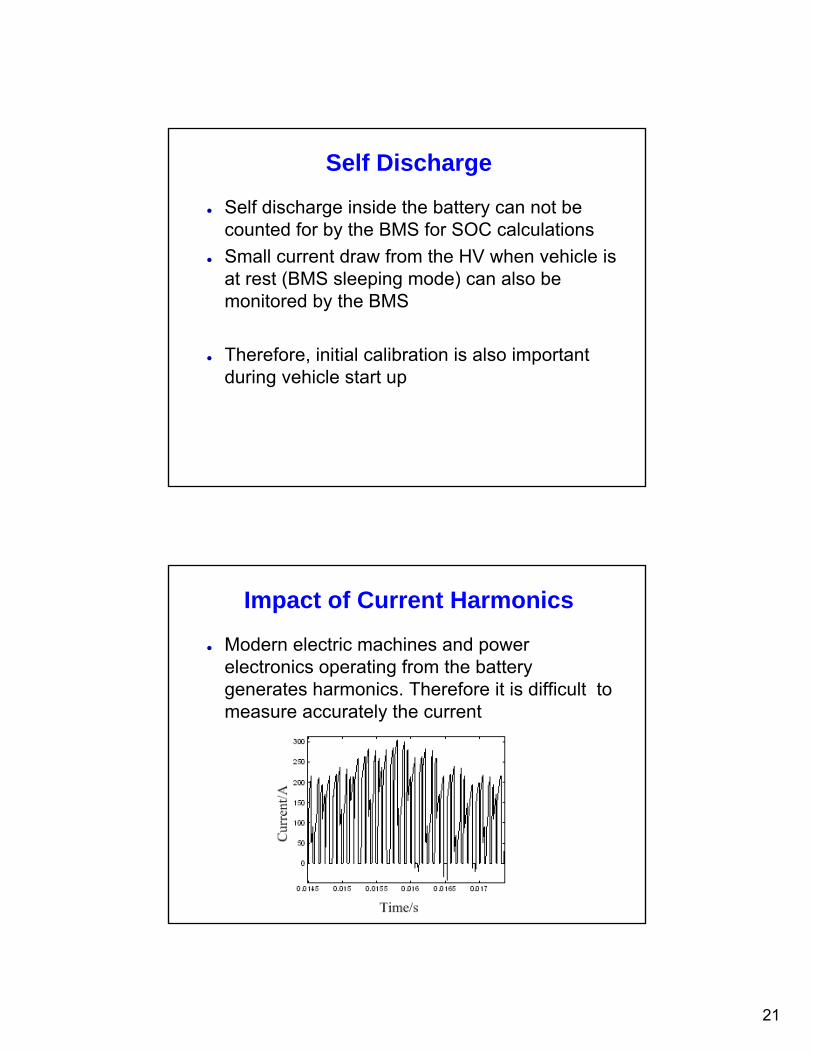
Impact of Current Harmonics
Modern electric machines and power electronics operating from the battery generates harmonics. Therefore it is difficult to measure accurately the current
22
Measurement Error and Process Noise
Current sensor has certain error (resolution, accuracy, etc.)
Timing may cause error too
Noise in the measurement loop and in the amplification circuits
Capacity fade over time
Internal loss due to internal impedance - Different at different discharge rate
Aging of Battery etc.
Aging of battery will alter the base of nominal capacity hence cause error in the calculated percentage SOC
In consistency (could be small) but can cause error over time in the accumulated SOC calculations
Furthermore, initial SOC may not be known or may not be accurate
Temperature can cause nominal capacity to change
23
5. Cell Balancing
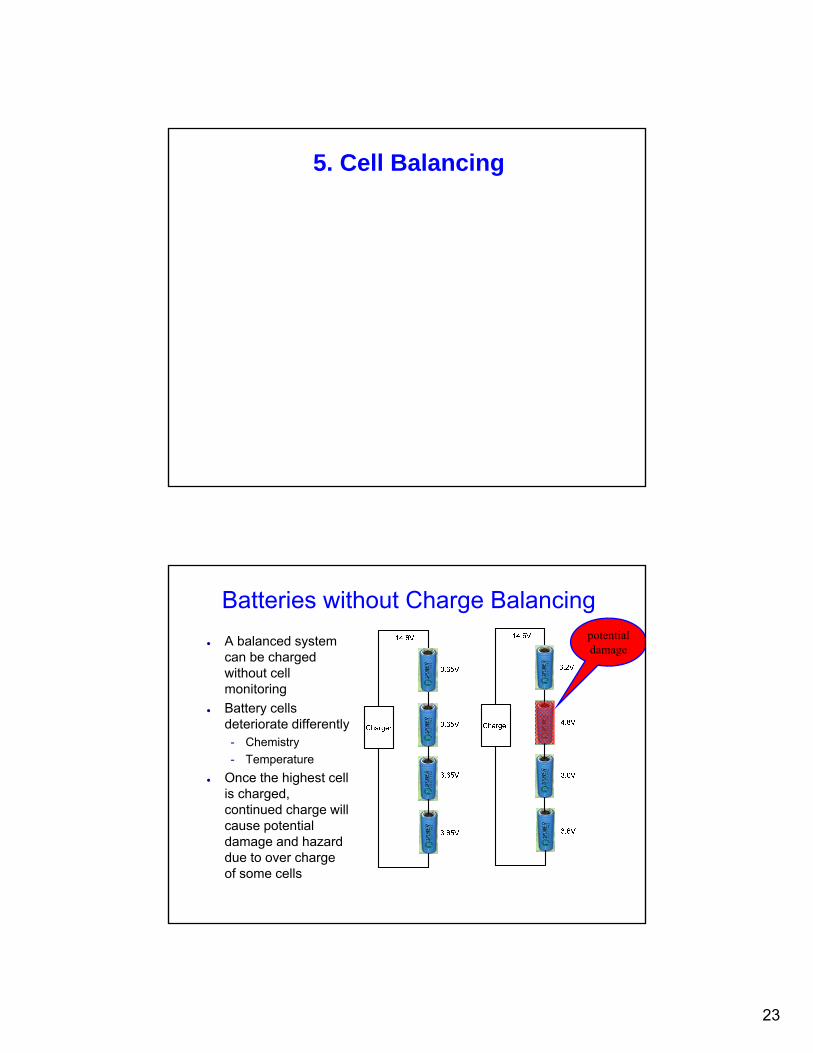
Batteries without Charge Balancing
A balanced system can be charged without cell monitoring
Battery cells deteriorate differently- Chemistry
- Temperature
Once the highest cell is charged, continued charge will cause potential damage and hazard due to over charge of some cells
potential damage
24
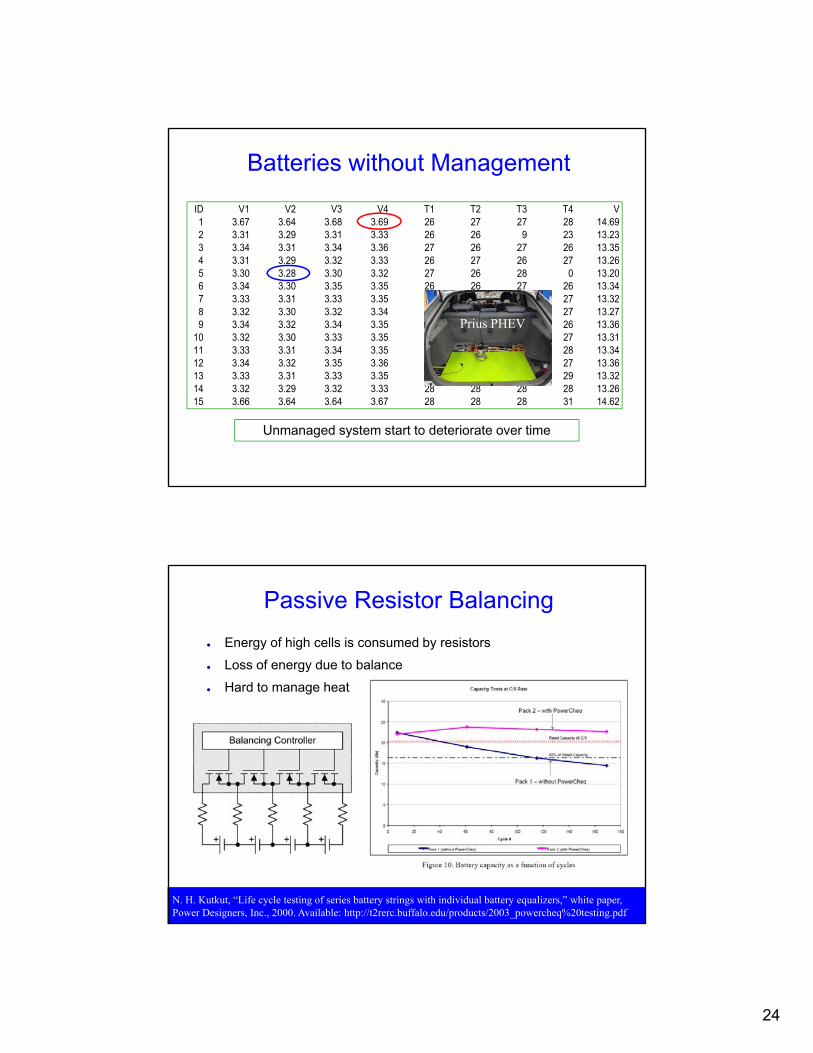
Batteries without Management
Unmanaged system start to deteriorate over time
ID V1 V2 V3 V4 T1 T2 T3 T4 V1 3.67 3.64 3.68 3.69 26 27 27 28 14.692 3.31 3.29 3.31 3.33 26 26 9 23 13.233 3.34 3.31 3.34 3.36 27 26 27 26 13.354 3.31 3.29 3.32 3.33 26 27 26 27 13.265 3.30 3.28 3.30 3.32 27 26 28 0 13.206 3.34 3.30 3.35 3.35 26 26 27 26 13.347 3.33 3.31 3.33 3.35 27 27 27 27 13.328 3.32 3.30 3.32 3.34 25 26 23 27 13.279 3.34 3.32 3.34 3.35 28 27 27 26 13.36
10 3.32 3.30 3.33 3.35 27 28 27 27 13.3111 3.33 3.31 3.34 3.35 28 28 28 28 13.3412 3.34 3.32 3.35 3.36 27 27 28 27 13.3613 3.33 3.31 3.33 3.35 27 28 27 29 13.3214 3.32 3.29 3.32 3.33 28 28 28 28 13.2615 3.66 3.64 3.64 3.67 28 28 28 31 14.62
Prius PHEV
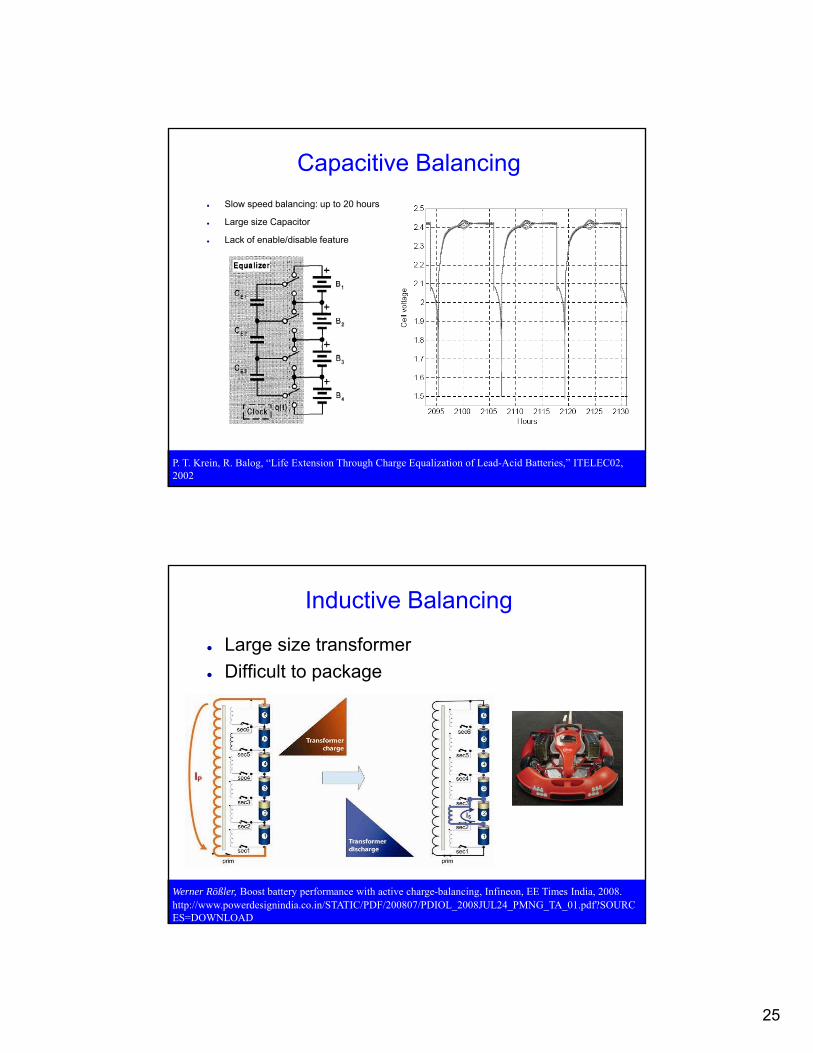
Passive Resistor Balancing
Energy of high cells is consumed by resistors
Loss of energy due to balance
Hard to manage heat
N. H. Kutkut, “Life cycle testing of series battery strings with individual battery equalizers,” white paper, Power Designers, Inc., 2000. Available: http://t2rerc.buffalo.edu/products/2003_powercheq%20testing.pdf
25
Capacitive Balancing
Slow speed balancing: up to 20 hours
Large size Capacitor
Lack of enable/disable feature
P. T. Krein, R. Balog, “Life Extension Through Charge Equalization of Lead-Acid Batteries,” ITELEC02, 2002
Inductive Balancing
Large size transformer
Difficult to package
Werner Rößler, Boost battery performance with active charge-balancing, Infineon, EE Times India, 2008. http://www.powerdesignindia.co.in/STATIC/PDF/200807/PDIOL_2008JUL24_PMNG_TA_01.pdf?SOURCES=DOWNLOAD
26
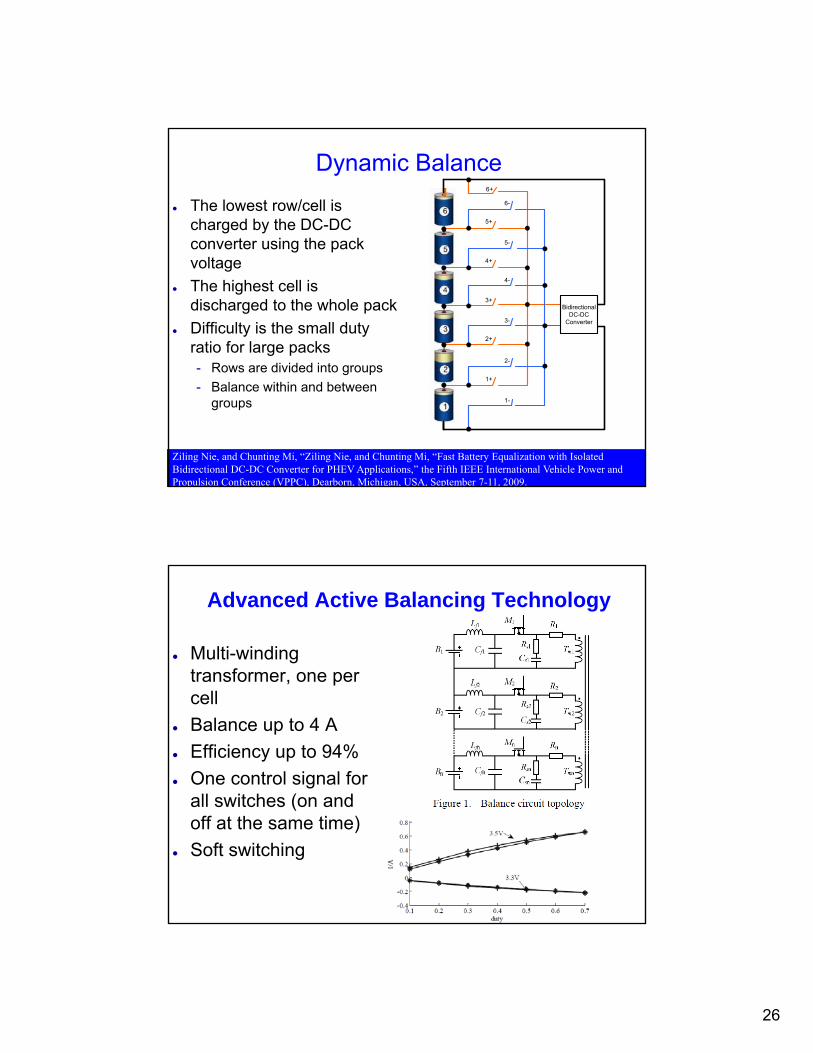
Dynamic Balance
BidirectionalDC-DC
Converter
6+
6-
5+
5-
4+
4-
3+
3-
2+
2-
1+
1-
The lowest row/cell is charged by the DC-DC converter using the pack voltage
The highest cell is discharged to the whole pack
Difficulty is the small duty ratio for large packs- Rows are divided into groups
- Balance within and between groups
Ziling Nie, and Chunting Mi, “Ziling Nie, and Chunting Mi, “Fast Battery Equalization with Isolated Bidirectional DC-DC Converter for PHEV Applications,” the Fifth IEEE International Vehicle Power and Propulsion Conference (VPPC), Dearborn, Michigan, USA, September 7-11, 2009.
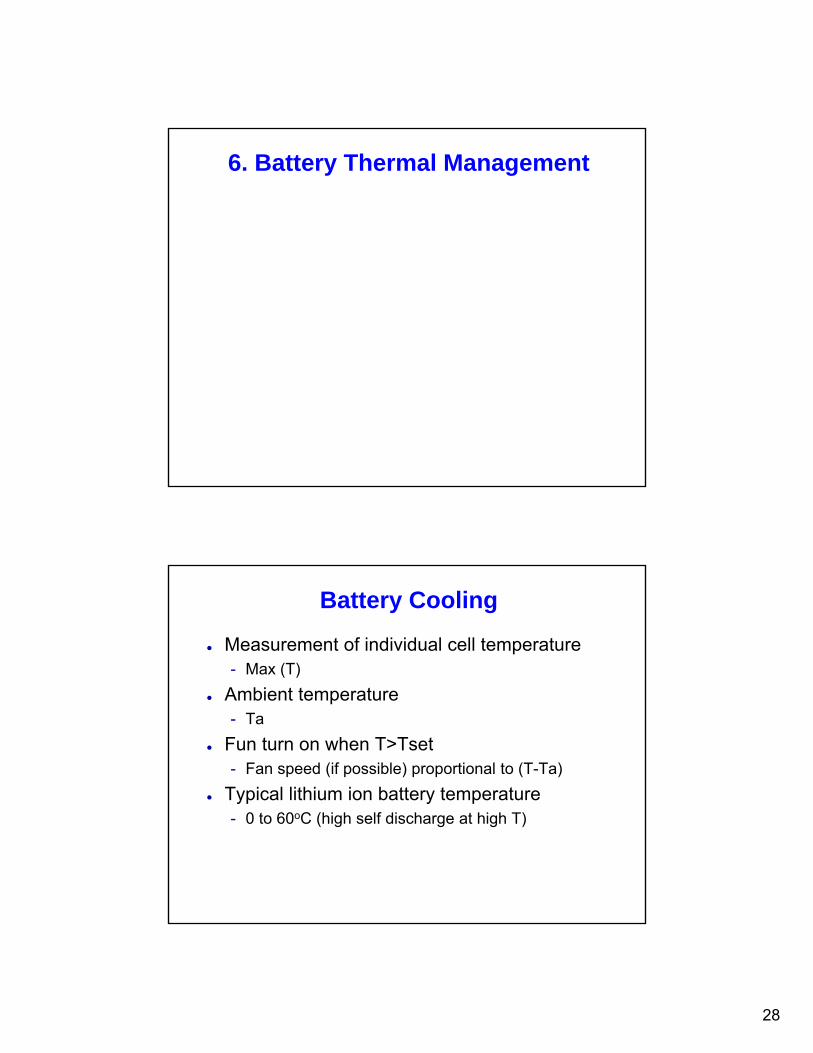
Advanced Active Balancing Technology
Multi-winding transformer, one per cell
Balance up to 4 A
Efficiency up to 94%
One control signal for all switches (on and off at the same time)
Soft switching

27
Balancing Example
Chevy Volt Battery Pack- Resistive passive balancing; at very low current
- Accumulated balancing duration over 10 month
- On average, the balancing resistors are switched on in only 0.55% of time
http://files.evbatteryforum.com/battery2/2_12Adam%20Opel_Horst%20Mettlach_Cell%20Balanci
ng%20Techniques%20Using%20The%20Example%20Of%20The%20Li-
ion%20Battery%20System%20For%20The%20Opel%20Ampera.pdf
Balancing Algorithms
Based on when to balance- Balance during charging
- Balance during discharging
- Balance during idle
Based on balance current- Fast balancing (> 4A)
- Slow balancing (< 1A)
Based on balance activation- Voltage based – most popular
- SOC based – very difficult due to the need of SOC of individual cells
28
6. Battery Thermal Management
Battery Cooling
Measurement of individual cell temperature- Max (T)
Ambient temperature- Ta
Fun turn on when T>Tset- Fan speed (if possible) proportional to (T-Ta)
Typical lithium ion battery temperature- 0 to 60oC (high self discharge at high T)
29
Battery Heating
Battery does not perform very well below 0oC
A heater may be added and controlled by BMS
Thermally insulated pack may help the battery to stay warm
Cycling the battery at very low charge/discharge rate may also help to keep the battery warm
Heating the battery while also heat up the catalyst; start engine after the catalyst is hot can help reduce cold emissions.
7. Battery State of Health (SOH)
30
What Parameters in SOH
Internal impedance- Increase over time and aging of battery
Individual cell voltage- Become too high too quickly during charge
- Become too low too quickly during discharge
Individual cell temperature - Hotter that other cells during charge/discharge
Cell capacity - Needed to be balanced first during charge or
discharge (repeatedly)
Cell Impedance Measurement
Cell impedance can be measured by impose a AC excitation and measure the response.
Measure DC voltage and current during charge or discharge to estimate the DC resistance of the battery
R=(Vo-VB)/IB, where Vo is open circuit voltage, and VB is the battery voltage during discharge at rate IB
31
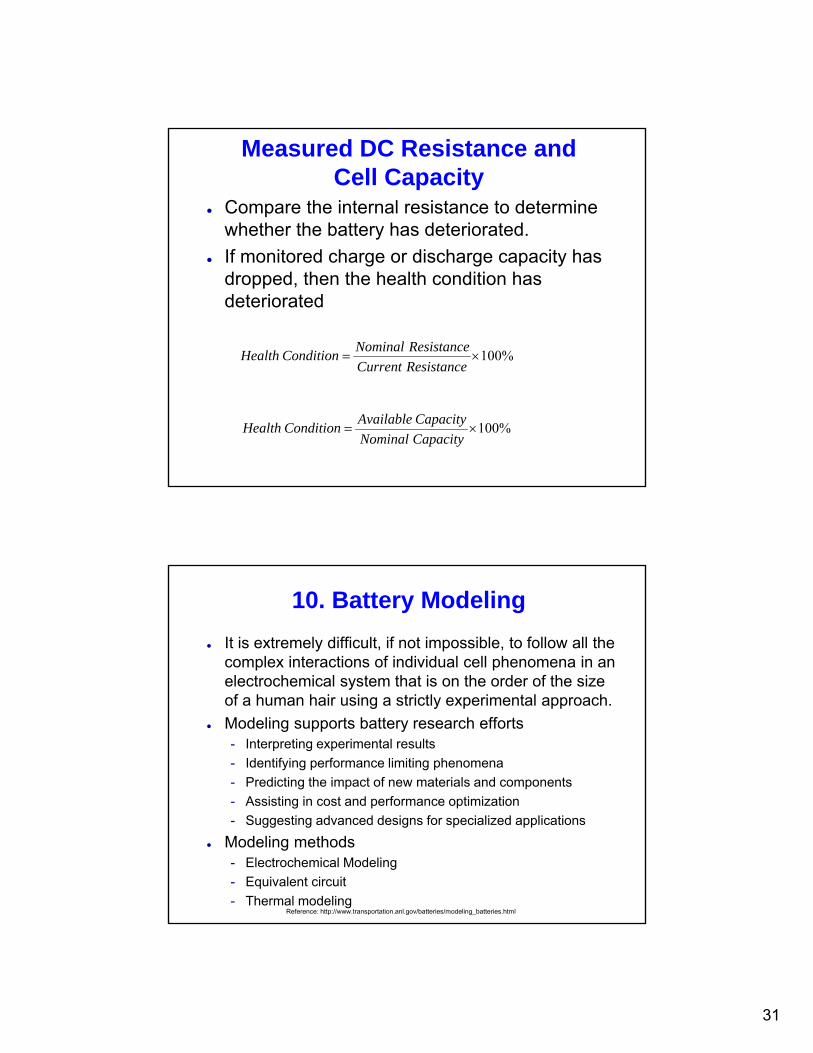
Measured DC Resistance and Cell Capacity
Compare the internal resistance to determine whether the battery has deteriorated.
If monitored charge or discharge capacity has dropped, then the health condition has deteriorated
%100ResistanceurrentC
ResistanceNominalConditionHealth
%100CapacityNominal
CapacityAvailableConditionHealth
10. Battery Modeling
It is extremely difficult, if not impossible, to follow all the complex interactions of individual cell phenomena in an electrochemical system that is on the order of the size of a human hair using a strictly experimental approach.
Modeling supports battery research efforts - Interpreting experimental results
- Identifying performance limiting phenomena
- Predicting the impact of new materials and components
- Assisting in cost and performance optimization
- Suggesting advanced designs for specialized applications
Modeling methods- Electrochemical Modeling
- Equivalent circuit
- Thermal modelingReference: http://www.transportation.anl.gov/batteries/modeling_batteries.html

32
Electrochemical Modeling
Utilizes a set of coupled non-linear differential equations to describe the pertinent transport, thermodynamic, and kinetic phenomena occurring in the cell
Reference: http://www.transportation.anl.gov/batteries/modeling_batteries.html
Equivalent Circuit
Use an equivalent circuit to represent the characteristics of the battery
One example is shown below
+_
+_
1 2o o ov E v v IR
1 1 2 21 2
1 2
v dv v dvi C C
R dt R dt
0 0.2 0.4 0.6 0.8 13.4
3.6
3.8
4
4.2
Battery SOC
Vo
ltag
e(V
)
OCV at charge processAverage valueOCV at discharge process
33
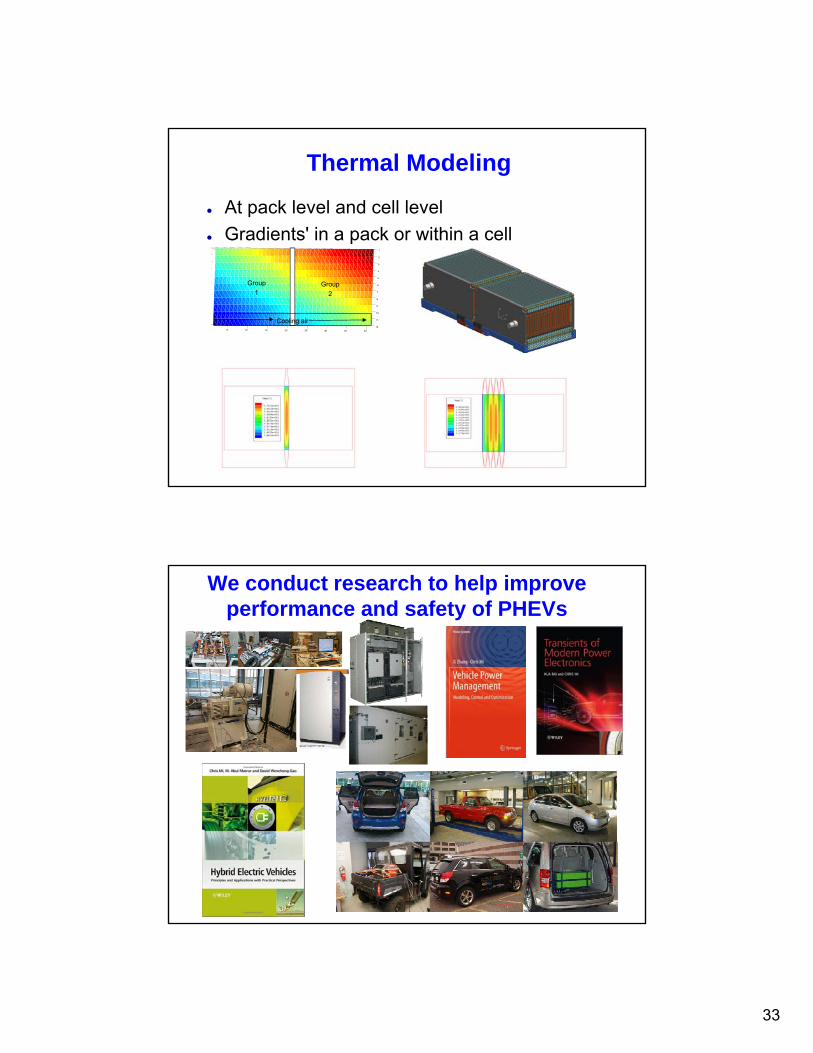
Thermal Modeling
At pack level and cell level
Gradients' in a pack or within a cell
5 10 15 20 25 30 35 40
1
2
3
4
5
6
7
8
9
10
11
12
Group
1Group
2
Cooling air
We conduct research to help improve performance and safety of PHEVs

34
Advanced Battery Management System Incorporating Real-Time Diagnosis and Data-Driven Prognostic Health Management with Joint SOC, SOH and Parameter
EstimationContributors: Yuhong Fu, Le Yi Wang, Chris Mi, Zhimin Xi et al
Funding Agency/Collaborations: DOE, Chrysler, Ford, ARPA-e
• Real-time battery diagnosis with joint SOC and parameter
estimation and large deviation principles
• Prognostic health management of battery systems through
data-driven algorithms
Technology Summary
Technology Impact
• Increase effectiveness of fault diagnostics
• Increase accuracy of residual life predictions
• Reduce sensor count by incorporating advanced algorithms
• Preventing catastrophic failures through fast, real time, and
accurate battery cell parameter estimations
Metric State of the Art Proposed
Diag response time Seconds Milliseconds
Prog response time minutes 3 seconds
Accuracy 90% 99%
Real time No Yes
Need of sensor Large number Reduced count
Proposed Targets
Gannon
BMS
Joint
parameter
estimation
with error less
than 1%
Life
prediction
with high
accuracy
Patent pending
Integrated Battery Management System Incorporating Modular, Reconfigurable Charger, Active Balancer, PFC and Sensorless Voltage Monitoring
Contributor: Siqi Li, Chris Mi, et al
Funding Agency/Collaborations: DOE, GATE, ARPA-e, Chrysler
• Modular,, high efficiency, and low cost charger with
integrated active balance and power factor correction (PFC)
• High efficiency, low cost active cell balancing
• Sensorless cell parameter monitoring
Technology Summary
Technology Impact
• Modular design reduce BMS/Charger/Balancer cost by 80%
• Increase charge efficiency by 3~5%
• Increase balance efficiency by 5~10%
Patent Pending
Metric State of the Art Proposed
6kW PHEV Charger
<90%; cost>$1000 >96%; cost<$200
Active cell balancer
<70%;cost>$10/cell max 2A/cell
>93%;cost<$0.15/cell; max 8A/cell
Sensorless monitoring
$1/cell No additional cost
PFC Separate circuitPart of charger/balancer
Proposed Targets
BCU:
Sensorless voltage monitoring, SOC,
SOH, and im
pedance estimate Module #1
Module #n
Novel Packaging Concepts
Module #2
Charger Balancer Monitoring
Gannon
BMS
Modular
concept to
reduce cost
and
increase
efficiency
Individual
cell based
charger/bala
ncer/PFC
35
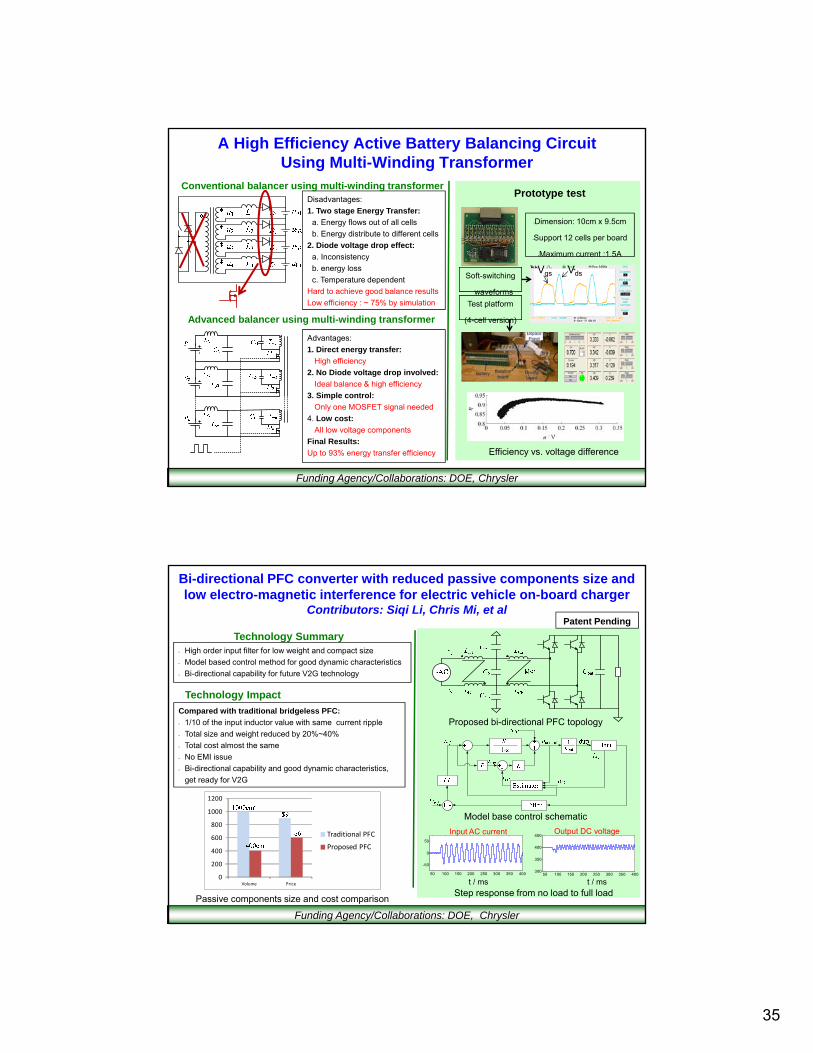
A High Efficiency Active Battery Balancing Circuit Using Multi-Winding Transformer
Funding Agency/Collaborations: DOE, Chrysler
Disadvantages:
1. Two stage Energy Transfer:
a. Energy flows out of all cells
b. Energy distribute to different cells
2. Diode voltage drop effect:
a. Inconsistency
b. energy loss
c. Temperature dependent
Hard to achieve good balance results
Low efficiency : ~ 75% by simulation
Conventional balancer using multi-winding transformer
Advanced balancer using multi-winding transformer
Advantages:
1. Direct energy transfer:
High efficiency
2. No Diode voltage drop involved:
Ideal balance & high efficiency
3. Simple control:
Only one MOSFET signal needed
4. Low cost:
All low voltage components
Final Results:
Up to 93% energy transfer efficiency
Prototype test
•Dimension: 10cm x 9.5cm
•Support 12 cells per board
•Maximum current :1.5A
•Simple control interfaceSoft-switching
waveforms
Vgs Vds
Test platform
(4-cell version)
Efficiency vs. voltage difference
Bi-directional PFC converter with reduced passive components size and low electro-magnetic interference for electric vehicle on-board charger
Contributors: Siqi Li, Chris Mi, et al
Funding Agency/Collaborations: DOE, Chrysler
• High order input filter for low weight and compact size
• Model based control method for good dynamic characteristics
• Bi-directional capability for future V2G technology
Technology Summary
Technology Impact
Compared with traditional bridgeless PFC:
• 1/10 of the input inductor value with same current ripple
• Total size and weight reduced by 20%~40%
• Total cost almost the same
• No EMI issue
• Bi-directional capability and good dynamic characteristics,
get ready for V2G
Patent Pending
Proposed bi-directional PFC topology
0
200
400
600
800
1000
1200
Volume Price
Traditional PFC
Proposed PFC
Passive components size and cost comparison
Model base control schematic
50 100 150 200 250 300 350 400
-50
0
50
50 100 150 200 250 300 350 400300
350
400
450
t / ms t / ms
Step response from no load to full load
Output DC voltageInput AC current

36
Wireless Charging of EV Wireless changing is different from inductive
charging, and information transmission, such as radio signal
Wireless means transferring power and energy in a great distance.
It is typically done through electromagnetic resonance
MIT, KIAST, and University of Tokyo, some of the leaders in this area.
MIT Lab
University of TokyoUS DOE
Funding Agency/Collaborations: Chrysler, DENSO, Oakridge National Laboratory
High Efficiency Lithium-Ion Battery Charger for Plug-in Hybrid Electric VehicleContributors: Sideng Hu, Junjun Deng, Chris Mi, et al
• Bridgeless PFC boost converter performs the front end AC-
DC conversion with high efficiency by eliminating the input
rectifier diodes
• Full bridge multi-resonant LLC converter offers very high
efficiency and low EMI at high power by providing ZVS of
MOSFETs and ZCS of output diodes
Technology Summary
Technology Impact
• Increase power rating for different P-HEV application
• Increase efficiency by soft-switching technology
• Increase power factor by advanced algorithms
Metric State of the Art Proposed
Power rating 3.3kW 6kW
EMI/noise fair good
Power factor medium high
Efficiency fair good
Cost medium low
Proposed Targets
Fig.1 System Diagram Overview
Funding Agency/Collaborations: Chrysler, DOE