battelle team dose reconstruction project for niosh · for documents marked as a total rewrite,...
TRANSCRIPT

Battelle Team Dose Reconstruction Project for NIOSH
Document Title:
Site Profiles for Atomic Weapons Employers that Worked Uranium and Thorium Metals
Document Number: Battelle-TBD-6000
PNWD-3738 Rev 0
Revision: F0
Effective Date: 12/13/2006
Type of Document: TBD
Supersedes: None
Subject Experts: R.I. Scherpelz
Document Owner Approval: Signature on File Approval Date: 12/11/2006
Robert I. Scherpelz, Staff Scientist
Approval: Signature on File Approval Date: 12/11/2006 Jay A. MacLellan, Battelle PNWD Task Manager
Concurrence: Signature on File Concurrence Date: 12/11/2006 Richard J. Traub, Staff Scientist
Approval: Signature on File Approval Date: 12/13/2006 James W. Neton, Associate Director of Science
New Total Rewrite Revision Page Change
FOR DOCUMENTS MARKED AS A TOTAL REWRITE, REVISION, OR PAGE CHANGE, REPLACE THE PRIOR REVISION AND DISCARD / DESTROY ALL COPIES OF THE PRIOR REVISION.

Document No. Battelle-TBD-6000; PNWD-3738 R0
Revision No. F0 Effective Date: 12/13/2006 Page ii
Publication Record EFFECTIVE DATE
REVISION NUMBER DESCRIPTION
April 28, 2006 P1 First draft, sections 1-6: no appendices yet July 26, 2006 P2 Updated Sections 5-6 to be compatible with Refining July 31, 2006 P3 Responding to internal comments August 14, 2006 P4 Updated some unfinished tables in P3 September 12, 2006 P5 Updates in response to NIOSH review of P3 September 15, 2006 P6 Minor changes from internal reviewer November 10, 2006 P7 Responding to October comments from NIOSH reviewers November 14, 2006 P8 Updated conversion factors for contaminated ground, air
submersion

Document No. Battelle-TBD-6000; PNWD-3738 R0
Revision No. F0 Effective Date: 12/13/2006 Page iii
Contents
Publication Record ........................................................................................................................................ ii Acronyms and Abbreviations ...................................................................................................................... vi 1.0 Purpose and Scope.............................................................................................................................. 9
2.0 Site Description ................................................................................................................................ 11
2.1 PROCESS DESCRIPTIONS .................................................................................................. 11
2.1.1 Extrusion .................................................................................................................... 11
2.1.2 Rolling........................................................................................................................ 11
2.1.3 Forging ....................................................................................................................... 12
2.1.4 Uranium Metal Machining ......................................................................................... 12
2.1.5 Uranium Slug Production and Canning...................................................................... 13
2.1.6 Uranium Scrap Recovery and Casting ....................................................................... 13
2.2 SITE ACTIVITIES.................................................................................................................. 14
2.3 SOURCE TERMS ................................................................................................................... 14
2.4 SAFETY.................................................................................................................................. 15
2.4.1 Available Mitigation Measures during Extrusion ...................................................... 15
2.4.2 Available Mitigation Measures during Uranium Rolling........................................... 15
2.4.3 Available Mitigation Measures during Uranium Forging .......................................... 16
2.4.4 Available Mitigation Measures during Uranium Metal Machining ........................... 16
2.4.5 Available Mitigation Measures during Uranium Slug Production and Canning........ 16
2.4.6 Available Mitigation Measures during Uranium Scrap Recovery and Casting ......... 17
3.0 Uranium Dosimetry .......................................................................................................................... 18
3.1 Characteristics of Uranium...................................................................................................... 18
3.2 Radiation Emissions ................................................................................................................ 19
3.3 External Dosimetry.................................................................................................................. 20
3.3.1 Electron Dosimetry .................................................................................................... 20
3.3.2 Other Non-Penetrating Radiation ............................................................................... 21
3.3.3 Photon Dosimetry....................................................................................................... 21
3.3.4 Neutron Radiation ...................................................................................................... 21
3.4 Dose Conversion Factors for External Doses.......................................................................... 23
3.4.1 Submersion in Contaminated Air and Exposure to Contaminated Surfaces .............. 24
3.4.2 Exposures from Contaminated Surfaces .................................................................... 24
3.4.3 Exposures from Contaminated Soil............................................................................ 25
3.5 Internal Dosimetry................................................................................................................... 25
3.5.1 Inhalation.................................................................................................................... 26

Document No. Battelle-TBD-6000; PNWD-3738 R0
Revision No. F0 Effective Date: 12/13/2006 Page iv
3.5.2 Ingestion ..................................................................................................................... 26
4.0 Occupational Medical Dose.............................................................................................................. 28
4.1 Chest X-Rays........................................................................................................................... 28
4.2 Pelvic X-Rays .......................................................................................................................... 28
5.0 Occupational Environmental Dose ................................................................................................... 29
5.1 Environmental External Irradiation ......................................................................................... 29
5.1.1 Environmental Doses During Operations................................................................... 29
5.1.2 After Operations and Initial Decontamination and Before FUSRAP Remediation ... 30
5.1.3 After FUSRAP Remediation ...................................................................................... 30
5.2 Environmental Internal Dose Due to Inhalation of Radioactive Material ............................... 30
5.2.1 During Operations ...................................................................................................... 30
5.2.2 After Operations and Initial Decontamination and Before FUSRAP Remediation ... 31
5.2.3 After FUSRAP Remediation ...................................................................................... 31
5.3 Summary of Occupational Environmental Doses ................................................................... 31
6.0 Occupational External Dose ............................................................................................................. 33
6.1 Submersion in Contaminated Air and Exposure to Contaminated Surfaces ........................... 33
6.1.1 Exposures from Submersion in a Dust Cloud ............................................................ 34
6.1.2 Exposures from a Contaminated Surface ................................................................... 34
6.2 Whole Body Radiation Emitted from Metal Surfaces ............................................................. 35
6.3 Nonpenetrating Radiation Emitted from Uranium Metal Surfaces ......................................... 36
6.4 Summary of External Radiation Doses During Operation ...................................................... 37
7.0 Occupational Internal Dose .............................................................................................................. 42
7.1 Uranium................................................................................................................................... 43
7.1.1 Uranium Bioassay ...................................................................................................... 43
7.1.2 Uranium Air Sampling ............................................................................................... 43
7.1.3 Additional Assumptions for Assessing Internal Dose from Inhalation ...................... 47
7.1.4 Uranium Intakes by Inhalation ................................................................................... 48
7.1.5 Resuspension During Periods with no Uranium Operations ...................................... 49
7.1.6 Ingestion ..................................................................................................................... 50
7.2 Thorium................................................................................................................................... 52
8.0 References ........................................................................................................................................ 53
9.0 Glossary............................................................................................................................................ 56

Document No. Battelle-TBD-6000; PNWD-3738 R0
Revision No. F0 Effective Date: 12/13/2006 Page v
Tables Table 3.1. Isotopic composition of uranium at different enrichments 18 Table 3.2. Assumed activity fraction (Bq contaminant/Bq uranium) of contaminants in recycled uranium
19 Table 3.3. Principal radiation emissions from natural uranium and its short-lived decay products that are of concern for external irradiation (not including bremsstrahlung) 20 Table 3.4 Beta Surface Exposure Rates from Equilibrium Thickness of Uranium Metal and Compounds (DOE-STD-1136) 21 Table 3.5. Neutron yields from spontaneous fission and (α,n) reactions for oxides and fluorides 22 Table 3.6. Neutron yields for trace impurities in uranium 22 Table 3.7. Neutron dose rates from (α,n) sources in uranium oxides 23 Table 3.8. Measured beta/gamma dose rates from containers of pitchblende ore 23 Table 3.9. Dose conversion factors and daily doses for external dose due to submersion in uranium-contaminated air 24 Table 3.10 Daily dose rates from natural uranium surface contamination over 1 m2 24 Table 3.11. Dose rates from uranium activity in the soil. 25 Table 3.12. Some internal dosimetry related characteristics of uranium 25 Table 4.1. Organ analogues for diagnostic chest X-ray 28 Table 5.1. Environmental external daily doses (effective dose equivalent) to workers in non-operational areas of a facility. 30 Table 5.2. Environmental internal daily intakes to workers in non-operational areas of a facility. 31 Table 5.3. Daily doses and intakes for occupational exposure to environmental levels of radiation 32 Table 6.1. Dose rates from standard shapes of uranium metal 35 Table 6.3. Daily doses from non-penetrating radiation to a worker’s skin near bare uranium metal 36 Table 6.4. Estimated daily doses, external exposure pathways, for metal-working processes. Values represent the geometric mean of a lognormal distribution with geometric standard deviation equal to 5.0.
38 Table 7.1. Some Internal Dosimetry Related Characteristics of Uranium Oxides 42 Table 7.2 Air sampling data for facilities extruding uranium rods 44 Table 7.3 Air sampling data for facilities rolling uranium rods 45 Table 7.4 Air sampling data for facilities forging uranium 45 Table 7.5 Air sampling data for facilities machining uranium 46 Table 7.6 Air sampling data for uranium slug production and canning 46 Table 7.7 Air sampling data for uranium scrap recovery 47 Table 7.9. Daily uranium intakes from uranium inhalation by process and job category 48 Table 7.10. Daily uranium intakes from uranium ingestion by process and job category 50

Document No. Battelle-TBD-6000; PNWD-3738 R0
Revision No. F0 Effective Date: 12/13/2006 Page vi
Acronyms and Abbreviations
α alpha β beta γ gamma µR microroentgen (0.000 001 roentgen) µg microgram (0.000 001 gram) (α,n) alpha-neutron (alpha particle absorbed, neutron emitted) ABRWH Advisory Board on Radiation and Worker Health ADU ammonium diuranate AMAD activity median aerodynamic diameter AP anterior-posterior AWE Atomic Weapons Employer BZ breathing zone CATI Computer-Assisted Telephone Interview Ci curie CV coefficient of variation d/m/m3 disintegrations per minute per cubic meter DCF dose conversion factor DOL Department of Labor dpm disintegrations per minute d day DR dose reconstruction Dx diagnosis DWA daily weighted average E, E+, E− ×10 raised to the power, e.g., 2.37E4 = 2.37 × 10⁴; 2.73E−06 = 2.73 × 10⁻⁶
EEOICPA Energy Employees Occupational Illness Compensation Program Act ESE entrance skin exposure f1 fraction of radionuclide activity taken up into systemic circulation from the
gastrointestinal (GI) tract F ICRP Respiratory Tract Transportability Type Fast FGR-12 Federal Guidance Report 12 FUSRAP Formerly Utilized Sites Remedial Action Program g gram GA general area GSD geometric standard deviation h hour HASL [AEC] Health and Safety Laboratory HLW high-level [radioactive] waste HP health physicist HRTM Human Respiratory Tract Model ICD-9 International Classification of Diseases Revision 9 ICRP International Commission on Radiological Protection IH industrial hygienist

Document No. Battelle-TBD-6000; PNWD-3738 R0
Revision No. F0 Effective Date: 12/13/2006 Page vii
IMBA Integrated Modules for Bioassay Analysis IREP Interactive Radioepidemiological Program ISO isotropic keV kiloelectronvolt LAT lateral LLW low-level [radioactive] waste LOD limit of detection LOGNORM4 computer program m, m2, m3 meter, square meter, cubic meter mg milligram (0.001 gram) mR milliroentgen (0.001 roentgen) mrem millirem (0.001 rem) mrep millirep (0.001 rep) M ICRP Respiratory Tract Transportability Type Moderate MAC maximum allowable concentration Max maximum MCNP Monte Carlo N-Particle [computer code] MED Manhattan Engineer District MeV megaelectronvolt Min minimum MMAD mass median aerodynamic diameter N/A not applicable NIOSH National Institute for Occupational Safety and Health NOCTS NIOSH Occupational Claims Tracking System NORMSDIST() standard Normal distribution function in Microsoft Excel NORMSINV() inverse standard Normal distribution function in Microsoft Excel OCAS Office of Compensation Analysis and Support PA posterior-anterior pCi picocurie (0.000 000 000 001 Ci or 10−12 Ci) POC probability of causation Q quality factor R roentgen ROT rotational s second S ICRP Respiratory Tract Transportability Type S SD standard deviation (arithmetic) SEC Special Exposure Cohort SQRI Site Query Research Interface TBD Technical Basis Document TIB Technical Information Bulletin TLD thermoluminescent dosimeter TLV® Threshold Limit Value (® American Conference of Governmental Industrial
Hygienists) Tn thoron (220Rn)

Document No. Battelle-TBD-6000; PNWD-3738 R0
Revision No. F0 Effective Date: 12/13/2006 Page viii
TRU transuranic (i.e., elements with Z > 92, Np, Pu, Am, …) TWA time-weighted average UMTRCA Uranium Mill Tailings Radiation Control Act WL working level (a unit of potential alpha energy concentration) WLM working level month (a unit of potential alpha energy exposure) wR ICRP radiation weighting factor

Document No. Battelle-TBD-6000; PNWD-3738 R0
Revision No. F0 Effective Date: 12/13/2006 Page 9
1.0 Purpose and Scope
Technical Basis Documents and Site Profile Documents are not official determinations made by the National Institute for Occupational Safety and Health (NIOSH) but are rather general working documents that provide historic background information and guidance to assist in the preparation of dose reconstructions at particular sites or categories of sites. They will be revised in the event additional relevant information is obtained about the affected site(s). These documents may be used to assist the NIOSH staff in the completion of the individual work required for each dose reconstruction.
In this document, the word “facility” is used as a general term for an area, building, or group of buildings that served a specific purpose at a site. It does not necessarily connote an “atomic weapons employer (AWE) facility” or a “Department of Energy facility” as defined in the Energy Employees Occupational Illness Compensation Program Act (EEOICPA) of 2000 [42 U.S.C. Sections 7384l(5) and (12)].
EEOICPA, as amended, provides for employees who worked at an AWE facility during the contract period and/or during the residual contamination period.
Employment at an AWE facility is categorized as either (1) during the contract period (i.e., when the AWE was processing or producing material that emitted radiation and was used in the production of an atomic weapon), or (2) during the residual contamination period (i.e., periods that NIOSH has determined there is the potential for significant residual contamination outside of the period in which weapons-related production occurred). For contract period employment, all occupationally-derived radiation exposures at the facility must be included in dose reconstructions. NIOSH does not consider the following exposures to be occupationally-derived:
• radiation from naturally occurring radon present in conventional structures; and
• radiation from diagnostic X-rays received in the treatment of work-related injuries.
For residual contamination period employment, only the radiation exposures defined in 42 U.S.C. § 7384n(c)(4) (i.e., radiation doses received from DOE/AEC-related work) must be included in dose reconstructions. Radiation dose received from DOE/AEC-related work includes: (1) radiation from radon consistent with NIOSH’s policies for including such radiation in the contract period; and, (2) medical screening X-rays, but not diagnostic X-rays for the treatment of work-related injuries. It should be noted that: (1) under subparagraph A of § 7384n(c)(4), radiation associated with the Naval Propulsion Program is specifically excluded from the employee’s radiation dose; and, (2) under subparagraph B of this section, radiation from a source not covered by subparagraph A that cannot be reliably distinguished from radiation that is covered by subparagraph A is considered part of the employee’s radiation dose. This site profile covers only exposures resulting from nuclear weapons-related work. Exposures resulting from non-weapons related work, if applicable, will be covered elsewhere.
The two principal purposes of this technical basis document are (1) to provide information sufficient to enable dose reconstructors to estimate doses for these workers on an individual basis under the provisions of EEOICPA and (2) to allow claimants, federal assessors, and others to understand the information sources and assumptions on which the dose estimations are based.
This document provides an exposure matrix for workers at AWE facilities that performed metal-working operations with uranium metal. Over 110 facilities performed these operations, and this document intends to provide guidance for dose reconstruction at any of these facilities. The main body of this document, in

Document No. Battelle-TBD-6000; PNWD-3738 R0
Revision No. F0 Effective Date: 12/13/2006 Page 10
Sections 2-6, includes general discussions of operations and exposure conditions at these facilities. Following the main body of this document is a collection of appendices, with one appendix for each AWE site that performed metal-working operations. Each appendix contains site-specific information that can be used for dose reconstruction. For those sites where this information is insufficient or totally lacking, the dose reconstructor must use information in the main body of the TBD.

Document No. Battelle-TBD-6000; PNWD-3738 R0
Revision No. F0 Effective Date: 12/13/2006 Page 11
2.0 Site Description
2.1 PROCESS DESCRIPTIONS
The processes covered in this TBD all involve working with uranium metal. For all work performed at AWE sites, as described here, the uranium had a natural isotopic composition, neither depleted in 235U nor enriched. Some sites also worked with thorium metal.
2.1.1 Extrusion
Extrusion was a common method to change the dimensions of a large-diameter ingot of uranium metal into a long small-diameter rod. The original billets and the resulted rods had diameters that varied depending on the process and the desired product. In one case, a 1¼-in. diameter billet was extruded into a 3/8-in diameter rod. In another case the billet was 4¼-in. and 10-to-12 in. long. A variety of extrusion techniques were tested: extrusions were tested in the high-temperature range of the alpha phase of uranium and at temperatures throughout the gamma phase.
Harris and Kingsley (1959) describe the following steps for a typical commercial uranium metal extrusion in the alpha phase:
• The ingot is heated in a salt bath furnace to a temperature of 1170°F. • The ingot is conveyed to a press, and extruded through a die block into a long, thin rod. About 12
extrusions per hour can usually be performed. • The extruded rod is passed through a quenching jacket onto a run-out trough. • The butt-end of the extruded piece is cut off and thrown into a drum. • The cut-end of the rod is reamed with an abrasive material mounted on a portable drill. • The extruded rod is dragged using a grappling wire onto a run-out table, where it is stamped for
identification and accountability. • The die-block is deburred using abrasive material on the end of a portable drill. • The rods are cut to a desired length. • The rods are weighed, packed in shipping containers, and moved to the shipping area.
Several steps in this operation have the potential to release uranium oxide into the air, particularly after the actual extrusion. Section 2.4.1 describes measures that are used to reduce worker exposure in an extrusion plant.
2.1.2 Rolling
Rolling was another common method in the metal-working industry to change the dimensions of a large-diameter billet of uranium metal into a long small-diameter rod. AWE sites tested a variety of rolling methods, including cold rolling and hot rolling in both the alpha and beta phases.
Harris and Kingsley (1959) describe the following steps for uranium metal rolling in the alpha range, a common commercial practice:
• A uranium billet or slab is heated in a furnace to a temperature of about 1170°F. The furnace may be a gas-fired, induction furnace, or a salt-bath or lead-bath. The salt- and lead-bath furnaces significantly reduced oxidation at the metal surface, reducing workplace air concentrations.

Document No. Battelle-TBD-6000; PNWD-3738 R0
Revision No. F0 Effective Date: 12/13/2006 Page 12
• The heated billet is removed from the furnace and conveyed to a roughing mill (also called a blooming mill) for lengthening into shapes (rods or slabs) of rough dimensions. Several passes in the roughing mill may be utilized.
• After roughing, the rod or slab is sent to one or more finishing mills, for reducing to the final dimension.
• The finished item is conveyed to shears for cutting to the desired length. • The item is then conveyed to an area where it is quenched or air cooled and stamped. • After stamping, the items may be descaled, and straightened, bundled, weighed, recorded,
packed, stored and shipped.
All of these operations may have been performed manually, or many may have been automated.
Most of these operations were capable of releasing large quantities of uranium dust to the atmosphere. Uranium readily oxidizes when exposed to air at temperatures above 600° F. The oxide scale formed on the surface spontaneously flakes off at elevated temperatures and is easily disturbed upon handling. The oxide formation and flaking produces high air concentrations and dust collection on the workplace floor and other surfaces. Any worker movement on a dusty floor will resuspend dust into the air, so that elevated air concentrations can be produced after the rolling has stopped. Safety measures to mitigate the air concentrations are discussed in Section 2.4.2.
2.1.3 Forging
Forging was another method for re-shaping uranium metal ingots. Two types were employed at AWE facilities, hot press forging and hammer forging.
In hot press forging, the ingot was heated in a salt bath to a working temperature of about 1170°F. It was then conveyed on a monorail or conveyor to the flat die forge press. There were three pressings, with the pressed uranium returned to the salt bath after each of the pressings. After pressing, the lengthened uranium slab was quenched in a water tank, packaged and stored for shipment. Hot press forging produced low air concentrations of uranium because the metal was covered with a protective layer from the salt bath for most of the operations.
In hammer forging, the ingot was heated to the working temperature in an oil-fired air furnace, then moved to the forging die, where it was hammered to the desired dimensions. Upon completion of forging, the hammered metal was marked for identity, then moved to an area where it cooled in air. It was subsequently conveyed to a rolling mill for further working. The average cycle time for forging one ingot was about 10 minutes, with about 200 hammer blows administered to the ingot.
Hammer forging produced much higher air concentrations than hot press forging. The metal oxidized in the furnace, and the oxide fell off the metal as it was moved from the furnace to the die. Then each hammer blow knocked much of the scale from the metal surface, exposing more hot metal to air where it quickly oxidized to provide more scale for the next hammer blow.
2.1.4 Uranium Metal Machining
After uranium metal rods were rolled or extruded, and before they were encased in cans as reactor fuel slugs, many machining steps were typically performed. In many ways these operations were similar to standard machine shop operations, but they needed to take into account the unique metallurgical properties of uranium. They also required more care to minimize the generation of oxide scale, which was an inhalation hazard to workers in the shop, and they needed to account for the pyrophoric nature of uranium metal.

Document No. Battelle-TBD-6000; PNWD-3738 R0
Revision No. F0 Effective Date: 12/13/2006 Page 13
Machining processes commonly employed at AWE facilities include lathe operations, centerless grinder, abrasive cut-off wheel, sawing, milling, shaping, surface grinding, belt sanding, planing, and drilling.
2.1.5 Uranium Slug Production and Canning
Uranium slugs are segments of uranium metal rods used as basic elements of fuel rods in the production reactors. They are canned in a protective cladding. The earliest slugs were solid, but some later designs had a hole drilled through the cylindrical axis.
Typically, a rod 5 or 6 feet long, 1.425 to 1.475-in diameter, was used after it had been straightened, outgassed and finished to remove surface imperfections. A machinist began by finishing one end of the long rod, which was then put on a lathe to reduce the diameter to 1.36-in, and an 8-in length was cut off (for some reactor applications the lengths were 8.5-in). Both the length and diameter required tight tolerances. The cut end of the slug was then finished and all corners were rounded.
Another option for producing a slug is powder metallurgy, where powdered uranium metal is produced, and hot-pressed in a die to form a uranium slug. This process was less common than cutting sections from rolled or extruded rods.
Early attempts to encase the slugs in a protective can placed the slugs in aluminum cans without bonding the uranium to the can. This method was sufficient for early test reactors like the X-10 at Oak Ridge but was found to be unsuitable for the Hanford production reactors because of poor heat transfer. A “triple-dip” slug coating process was developed at Hanford in 1944. Later Hanford developed a coextrusion process that installed a protective jacket as part of the extrusion process.
2.1.6 Uranium Scrap Recovery and Casting
Uranium is a sufficiently valuable material that scrap recovery is a cost-effective process. A plant that practices metal-working operations will collect all the chips, shavings and turnings, along with butt-ends from extrusions and similar cast-off pieces for melting and subsequent re-use. Most plants will compress the small pieces into a “briquette,” which can be stored and later melted and cast into ingots.
The uranium metal scraps were collected at the machining sites in 30- or 55-gallon drums, usually with the pieces kept under water or oil to avoid oxidation. The drums were brought to the collection site for cleaning, sorting, and pressing into a briquette. The pieces that are pressed into a briquette must be pure uranium metal, with minimal inclusion of uranium oxides or other material such as dust or steel. The metal in the briquette should be free of grease and cutting fluid. During the Manhattan Project, preparation of the material was done by hand sorting and cleaning, using hand tools such as small rakes. In later years the preparation was automated. Pieces were dumped into a crusher, washed, degreased and finely divided before loading into the pressing machine.
During pressing of the briquette, heat was generated inside the pressing machine, and the edges of the briquette could be ignited by this heat. When the briquette was unloaded, uranium oxide fumes could be released to the air.
For uranium oxide scrap, the scrap is collected and sent back to a refining plant to be converted to UF4 and then reduced and cast.
Uranium metal scrap, either in the form of a briquette or larger chunks such as billet butt-ends or rejected slugs, are placed in a graphite crucible and reheated to melt the metal. At the proper temperature for

Document No. Battelle-TBD-6000; PNWD-3738 R0
Revision No. F0 Effective Date: 12/13/2006 Page 14
pouring, a plug is removed from the crucible and the liquid metal drains into a form for new ingots or billets.
2.2 SITE ACTIVITIES
Uranium metal working was almost non-existent before 1942. In 1942-43, the first major studies of metallurgical properties were performed at the University of Chicago’s Metallurgical Laboratory and in several other universities and industrial research centers. These early research sites are AWE facilities.
The first large-scale requirements for uranium metallic products was fuel for Oak Ridge’s X-10 research reactor and the Hanford plutonium production reactors in 1943. In this year more than a dozen industrial facilities were contracted to roll and extrude uranium rods, and then produce fuel slugs. These and many other industrial AWE sites continued to develop metal-working techniques and produced production quantities of uranium metal products over the next two decades.
Hanford also developed uranium metal-working capabilities and operated fabrication facilities that provided much of the fuel needed for the Hanford production reactors from 1944 through 1971.
The Feed Materials Production Center was opened near the village of Fernald, Ohio in 1951, and by 1954 it was fully operational. This facility had extensive capabilities in all areas of uranium metalworking and was a major producer for the AEC in the mid- and late-1950s and the 1960s. The Weldon Spring Plant in Missouri was a backup to the Fernald facility, operating from 1957 – 1967.
While Hanford, Fernald and Weldon Spring supplied a large volume of uranium metal products for the weapons complex, many AWE sites contributed to this effort in the decades following 1943. The AWE sites developed and tested new metal-working techniques, such as doing an experimental rolling of billets into rods. During some years, AWE sites were major providers of uranium metal to AEC facilities; during other years they did small production runs to supplement the work performed at Hanford, Fernald, or Weldon Spring. They also performed specialty functions not handled by the big AEC facilities.
The appendices to this TBD give detailed descriptions of the activities performed at each AWE facility that performed uranium metal-work.
2.3 SOURCE TERMS
Fuel for the production reactors during the Manhattan Project used uranium with no enrichment (“natural uranium”). Natural uranium continued to be used exclusively until the early 1950s, when some low-enriched uranium was used in reactor fuel. Most metal work at AWE sites used natural uranium. When enriched uranium was required, the metal working was usually performed at Hanford, Fernald or Weldon Springs, although some of these operations were developed at AWE sites, so some enriched uranium work occurred at these sites. Also several specialty applications with enriched uranium were performed at AWE sites. Recycled uranium may have appeared at some AWE sites after 1952, but before 1952 there was no recycled uranium.
Most uranium at these sites was in the metallic form, but oxidation occurred readily during many operations. Thus oxides of uranium were present, and most of the internal exposure to uranium, by inhalation or ingestion, involved uranium oxides.
A small number of sites processed thorium, so Th metal was a source term in some facilities.

Document No. Battelle-TBD-6000; PNWD-3738 R0
Revision No. F0 Effective Date: 12/13/2006 Page 15
2.4 SAFETY
Since uranium metal oxidizes readily, particularly at elevated temperatures, airborne uranium dust concentrations far exceeded accepted limits and guidance levels if no mitigation measures were employed. At AWE metalworking sites, a variety of safety measures were employed. Dust mitigation technologies continually improved from the mid-1940’s onward, so the earliest metal-working plants typically had primitive safety measures, or none at all, while sites operating in later years had more effective technologies. Even with the more effective technologies, however, hazardous dust levels could be observed in AWE facilities. A number of AWE facilities also were involved in only limited-duration operations and did not employ all available safety technologies for these operations.
This section presents a summary of the types of mitigation measures that were available and sometimes employed. The description is based on (Harris and Kingsley 1959) so it is most closely representative of late-1950s technology. Some of the mitigation measures described here were not employed in the 1940s or early 1950s. As an example, salt baths are described for extrusion and rolling but they were not commonly employed for either process before 1951.
2.4.1 Available Mitigation Measures during Extrusion
If the ingot was heated in a salt bath, the resulting coating prevented uranium oxidation up to the point where it passed through the die block (the actual extrusion). However, the extrusion removed the protective coating and oxidation then became a problem. The major sources of contamination were (Harris and Kingsley, 1959):
• Fumes released when cutting off the butt end, tossing the end into a drum, and deburring the die block.
• Suspension of surface oxides at the run-off table and weigh area. Handling of the rods at these locations released the oxides into the air.
• Release of oxides at the discharge of the extrusion press, during extrusion and cut-off. • Poor housekeeping, particularly from dust accumulations at the conveyors and run-out table
during material and personnel movement.
The following mitigation measures have been employed in plants performing uranium metal extrusions: • Quenching: various rates of quenching were tested and it was found that the largest quench rate,
immediately after extrusion, was most effective in minimizing oxide production. • Ventilation at the extrusion press discharge: a hood that was carefully designed would limit dust
generation after extrusion, and during cropping of the rod and during deburring of the die block. • A hood surrounding the drum that holds the cropped butt-ends would limit dust. • Dust catch pans positioned under roller conveyors would contain dust dropped from the
conveyor. • Steel grating on the floor would prevent workers from resuspending dust from the floor. Frequent
vacuuming of the dust from the spaces in the grating was required to maintain effectiveness.
2.4.2 Available Mitigation Measures during Uranium Rolling
Harris and Kingsley (1959) describes the following recommended measures for controlling airborne dust in a uranium metal-rolling plant:
Oxidation of uranium metal occurred in the furnace when bringing the metal up to a temperature suitable for rolling. Two methods were developed for controlling this oxidation: a lead bath and a salt bath. Both of these methods excluded oxygen from contacting the metal surface during heating, and left a protective

Document No. Battelle-TBD-6000; PNWD-3738 R0
Revision No. F0 Effective Date: 12/13/2006 Page 16
coating on the heated metal that would reduce oxidation during rolling operations. The salt bath, utilizing a mixture of lithium and potassium salts, was more effective than the lead bath.
Ventilation was another measure employed to reduce dust loadings in the air at rolling sites. Ventilation over the roughing rolls was effective, particularly when a canopy hood with side shields was in place. Similar ventilation and hoods over other rolls was also effective. Man-cooling fans were sometimes positioned to blow the dust clouds away from the rolls, but while this method reduced the exposure of the roll operators, it increased the exposure of other workers and spread contamination around the plant. Ventilation utilizing hoods was also effective at other operations in the rolling plant, such as shearing, quenching, stamping, descaling and straightening.
Aggressive housekeeping practices, including the use of floor grates and vacuuming, also was helpful in controlling airborne dust. Workers walking on grating resuspended much less dust than walking on a smooth dust-laden floor. Frequent vacuuming of the dust from the openings in the grating was required to maintain effectiveness. Maintenance of the grating was also required to correct the flattening when heavy equipment drove over it. Frequent cleaning of the furnace to remove the scale that collects on the furnace floor is another measure that was necessary to keep dust loading low.
Experience showed that deliberately dripping water onto the rolls when they were hot increased air concentrations. Steam clouds formed from this operation, carrying fine particles of uranium oxide into the air. Air concentrations increased by a factor of 30 when water was dripped onto metal on the roughing rolls.
2.4.3 Available Mitigation Measures during Uranium Forging
The salt bath used in hot press forging was an effective method of uranium dust control. Well-designed ventilation control in hammer forging would be an effective method to control dust production. The housekeeping-related methods of dust control, such as using grating on the floor and frequent vacuuming, would also be effective mitigation methods.
2.4.4 Available Mitigation Measures during Uranium Metal Machining
Surface oxides are not formed or loosened during machining to the extent that they are during rolling and extrusion, because the metal is typically near room temperature for machining. The biggest generator of uranium dust is probably the ignition of small chips and turnings that are generated during machine operations. Mitigation measures typically focused on the control of these small metal pieces.
The most common mitigation measure was to flood the operation with coolant, which entrained the metal chips and prevented them from igniting. Machining technique was also critical – typically a low machine speed with a deep cut was best for reducing the generation of chips. The blade should also be kept sharp. For basic cutting operations, local ventilation was not necessary when sufficient coolant was supplied to the operation and optimal machining technique was followed. Major dust-generating operations such as grinding and sanding would require local ventilation, including enclosures around the machine, to minimize dust generation. In actual practice, application of ventilation was not always applied to the machining operations which needed it.
2.4.5 Available Mitigation Measures during Uranium Slug Production and Canning
Safety measures employed during uranium slug production were very similar to measures employed during machining. A heavy coolant flow was directed over the metal as it was worked in the lathe to prevent oxidation, and to entrain the metal chips, preventing them from igniting.

Document No. Battelle-TBD-6000; PNWD-3738 R0
Revision No. F0 Effective Date: 12/13/2006 Page 17
2.4.6 Available Mitigation Measures during Uranium Scrap Recovery and Casting
The biggest opportunity for exposing a worker to uranium dust during scrap recovery was during the pressing of uranium scraps into a briquette, especially when opening the press. Heat generated inside the press often ignited the edges of the briquette, emitting fumes.
Local ventilation is usually the most effective means of limiting uranium dust concentrations in the air. Good ventilation has been shown to reduce air concentrations in the vicinity of briquetting by a factor of 4.

Document No. Battelle-TBD-6000; PNWD-3738 R0
Revision No. F0 Effective Date: 12/13/2006 Page 18
3.0 Uranium Dosimetry
This TBD discusses the radiation doses that could result from work at AWE metal-working sites. Most of this work was associated with uranium metal but there was work with thorium metal at some AWE sites. This section describes the dosimetry of uranium. Thorium will be addressed, where appropriate, in TBD appendices.
3.1 Characteristics of Uranium
Uranium is a heavy metal. There are several isotopes of uranium and, depending on the process in question, uranium may have been enriched in some of the isotopes. Most AWE uranium metal-working sites were concerned with natural uranium.
All isotopes of uranium are radioactive and the decay progeny of uranium are also radioactive, forming a long decay chain. For the most part, the radioactive progeny of uranium were separated from uranium during refining. After those processes were completed, only the uranium isotopes were present. But some ingrowth of uranium progeny does occur even after a short time (~100 days) with a dose rate that exceeds the dose rate from pure uranium.
Uranium consists of four isotopes, 234U, 235U, 236U, and 238U. The term enrichment refers to the extent to which the amount of 235U has been increased relative to naturally occurring uranium. The relative amounts of each isotope for different enrichments were obtained from IMBA Expert – OCAS Edition and are listed in Table 3.1.
Table 3.1. Isotopic composition of uranium at different enrichments
Enrichment Isotope Weight
Fraction Specific Activity
Bq/mg pCi/mg dpm/mg Depleted 234U 0.000010 2.31×1000 6.24×10+01 1.39×10+02
235U 0.001991 1.59×10-01 4.30×10+00 9.55×10+00
236U 0.000003 7.44×10-03 2.01×10-01 4.46×10-01
238U 0.997996 1.24×10+01 3.35×10+02 7.45×10+02
Total 1.49×10+01 4.02×10+02 8.93×10+02
Natural 234U 0.000054 1.24×10+01 3.35×10+02 7.44×10+02
235U 0.007204 5.76×10-01 1.56×10+01 3.46×10+01
236U 0.000000 0.00×10+00 0.00×10+00 0.00×10+00
238U 0.992742 1.23×10+01 3.33×10+02 7.41×10+02
Total 2.53×10+01 6.84×10+02 1.52×10+03
Low Enrichment
234U 0.000290 6.70×10+01 1.81×10+03 4.02×10+03
235U 0.034989 2.80×10+00 7.56×10+01 1.68×10+02
236U 0.000000 0.00×10+00 0.00×10+00 0.00×10+00
238U 0.964722 1.20×10+01 3.24×10+02 7.20×10+02
Total 8.18×10+01 2.21×10+03 4.91×10+03
High Enrichment
234U 0.010606 2.45×10+03 6.62×10+04 1.47×10+05
235U 0.934636 7.47×10+01 2.02×10+03 4.48×10+03
236U 0.002075 4.97×10+00 1.34×10+02 2.98×10+02
238U 0.052683 6.55×10-01 1.77×10+01 3.93×10+01

Document No. Battelle-TBD-6000; PNWD-3738 R0
Revision No. F0 Effective Date: 12/13/2006 Page 19
Enrichment Isotope Weight
Fraction Specific Activity
Bq/mg pCi/mg dpm/mg Total 2.53×10+03 6.84×10+04 1.52×10+05
Recycled
234U 0.000082 1.90×10+01 5.13×10+02 1.14×10+03
235U 0.009700 7.76×10-01 2.10×10+01 4.65×10+01
236U 0.000680 1.63×10+00 4.40×10+01 9.77×10+01
238U 0.989500 1.23×10+01 3.33×10+02 7.38×10+02
Total 3.37×10+01 9.10×10+02 5.03×10+03
Table 3.1 includes a reference to recycled uranium. Recycled uranium is uranium that has been irradiated in a reactor and from which the plutonium has been extracted. Recycled uranium will contain 236U, sparingly found in naturally occurring uranium, due to the processes in a reactor. Note that high enrichment uranium contains appreciable amounts of 236U while low enriched uranium contains virtually no 236U. The reason for this apparent discrepancy is that high enriched uranium is generally derived from recycled uranium and is commonly associated with weapons development whereas low enriched uranium is generally associated with the commercial fuel cycle where the feed material for enrichment is natural uranium.
For the time period from 1944 until 1952, all uranium used by the DOE (and predecessor agencies) was derived from natural sources because processes that recover uranium from spent fuel were not available (DOE/SO-0003, p 14). There is the possibility that uranium processed in refineries after 1953 was recycled uranium or contained recycled uranium, so for these time periods, in the absence of definitive information about the origin of the processed uranium, it should be assumed that the uranium contains the contaminants listed in Table 3.2 (ORAUT 2005c). The appendices for each site should contain information concerning whether recycled uranium was present at the site.
Table 3.2. Assumed activity fraction (Bq contaminant/Bq uranium) of contaminants in recycled uranium
Recycled Uranium Contaminant 239Pu 237Np 99Tc 232Th 228Th Activity fraction of contaminant in uranium 0.00246 0.00182 0.379 2.73E-06 2.73E-06 Contaminant in ppb of uranium 10 1,040 9,000 10,888 * * assumes same activity as Th-232
3.2 Radiation Emissions
Natural uranium emits both beta particles (electrons) and photons (x ray and gamma photons), as shown in Table 3.3, derived from Kocher (1981). The two primordial components of natural uranium are 238U and 235U, but some of their decay products grow into equilibrium quickly enough to be hazardous in processing metal.
Uranium-238 transitions by alpha decay to 234Th, emitting traces of weakly penetrating ~ 13 keV L x rays. However, 234Th transitions primarily to 1.17-minute 234mPa, the metastable state of protactinium-234, which in turn transitions to 234U with the emission of a 2.28-MeV beta particle in 98.6% of transitions (Kocher 1981). This relatively high-energy beta particle accounts for significant external dose rates to skin, lens of the eye, and to a certain extent to shallow portions of tissues such as thyroid, female breast and bone marrow. It also produces significant bremsstrahlung X-rays, primarily in the 30-250 keV energy range. Dose rates from uranium metals are presented in Sections 6.2 and 6.3.
Uranium-235 emits alpha particles and gamma photons in about 70% of its transitions, but occurs as 0.7200 atom % in natural uranium.

Document No. Battelle-TBD-6000; PNWD-3738 R0
Revision No. F0 Effective Date: 12/13/2006 Page 20
Like 238U, 234U emits alpha particles and traces of weakly penetrating L x rays.
Table 3.3. Principal radiation emissions from natural uranium and its short-lived decay products that are of concern for external irradiation (not including bremsstrahlung)
Photon (x or γ) Energy Radionuclide
238U Half-life
4.468E+9 years Beta Energy (MeV Max)
None (MeV)
x: 0.013 (8.8%) 234Th 24.1 days 0.096 (25%) x: 0.013 (9.6%)
0.189 (73%) γ: 0.063 (3.8%)
234mPa 1.17 minutes 2.28 (98.6%) γ: 0.093 (5.4%) γ: 0.765 (0.2%)
235U 7.038E+8 years ~1.4 (1.4%)
None γ: 1.001 (0.6%) x: 0.013 (31%)
x: 0.090-0.105 (9.3%) γ: 0.144 (10.5%) γ: 0.163 (4.7%) γ: 0.186 (54%)
231Th 25.5 hours 0.206 (15%) γ: 0.205 (4.7%) x: 0.013 (71%)
0.288 (49%) γ: 0.026 (14.7%)
234U 244,500 years 0.305 (35%)
None γ: 0.084 (6.4%)
x: 0.013 (10.5%) γ: 0.053 (0.2%)
3.3 External Dosimetry
External dosimetry refers to the radiation dose received from radioactive material that is outside the body. External doses can be associated with immersion in airborne radioactive material, accumulations of radioactive material associated with a particular process and radioactive material that contaminates the floor or other surfaces.
For consistent presentation, exposure or dose is reported as: • penetrating, assumed to be associated with photons of energies 30 keV or greater, and • nonpenetrating, assumed to be associated with photons of energies less than 30 keV or with
electrons. Nonpenetrating dose from natural uranium consists primarily of electrons with energies >15 keV.
3.3.1 Electron Dosimetry
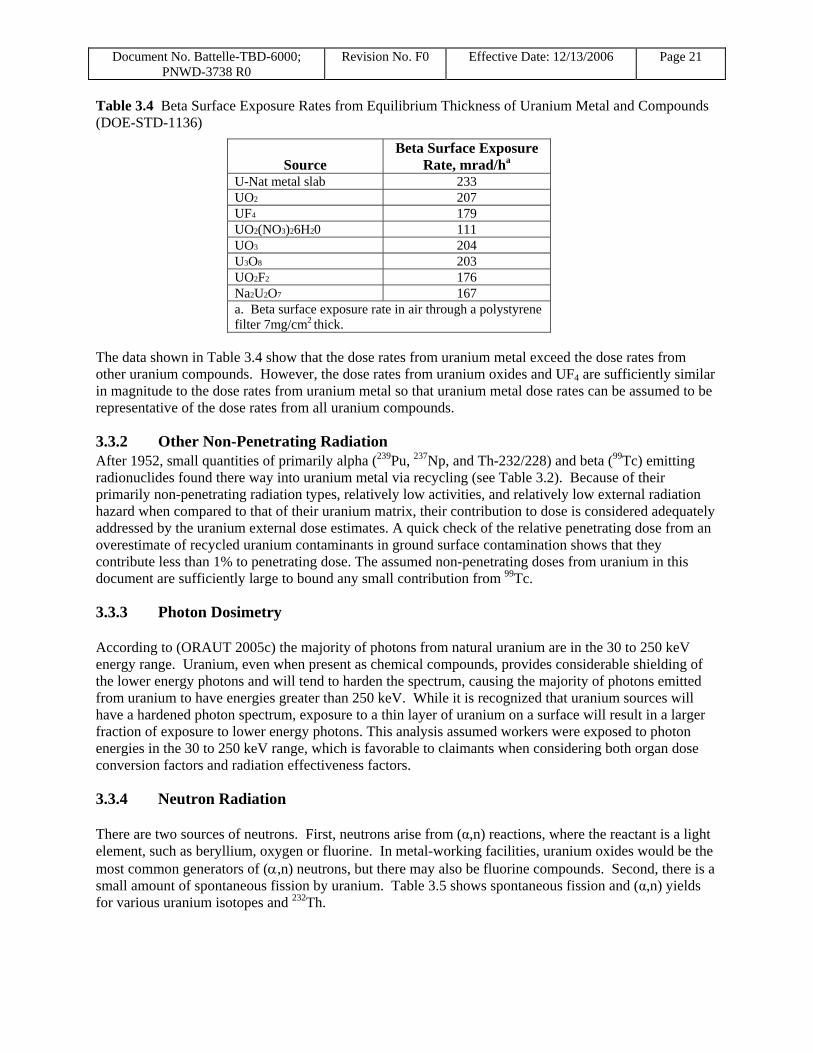
Uranium metal and compounds emit beta and electron radiation that can irradiate the skin, and to a more limited extent, the shallow organs of the body. Table 3.4, taken from DOE-STD-1136 (DOE 2004) shows the measured beta surface dose rates from uranium metal and selected uranium compounds.
Document No. Battelle-TBD-6000; PNWD-3738 R0
Revision No. F0 Effective Date: 12/13/2006 Page 21
Table 3.4 Beta Surface Exposure Rates from Equilibrium Thickness of Uranium Metal and Compounds (DOE-STD-1136)
Source Beta Surface Exposure
Rate, mrad/ha
U-Nat metal slab 233 UO2 207 UF4 179 UO2(NO3)26H20 111 UO3 204 U3O8 203 UO2F2 176 Na2U2O7 167 a. Beta surface exposure rate in air through a polystyrene filter 7mg/cm2 thick.
The data shown in Table 3.4 show that the dose rates from uranium metal exceed the dose rates from other uranium compounds. However, the dose rates from uranium oxides and UF4 are sufficiently similar in magnitude to the dose rates from uranium metal so that uranium metal dose rates can be assumed to be representative of the dose rates from all uranium compounds.
3.3.2 Other Non-Penetrating Radiation After 1952, small quantities of primarily alpha (239Pu, 237Np, and Th-232/228) and beta (99Tc) emitting radionuclides found there way into uranium metal via recycling (see Table 3.2). Because of their primarily non-penetrating radiation types, relatively low activities, and relatively low external radiation hazard when compared to that of their uranium matrix, their contribution to dose is considered adequately addressed by the uranium external dose estimates. A quick check of the relative penetrating dose from an overestimate of recycled uranium contaminants in ground surface contamination shows that they contribute less than 1% to penetrating dose. The assumed non-penetrating doses from uranium in this document are sufficiently large to bound any small contribution from 99Tc.
3.3.3 Photon Dosimetry
According to (ORAUT 2005c) the majority of photons from natural uranium are in the 30 to 250 keV energy range. Uranium, even when present as chemical compounds, provides considerable shielding of the lower energy photons and will tend to harden the spectrum, causing the majority of photons emitted from uranium to have energies greater than 250 keV. While it is recognized that uranium sources will have a hardened photon spectrum, exposure to a thin layer of uranium on a surface will result in a larger fraction of exposure to lower energy photons. This analysis assumed workers were exposed to photon energies in the 30 to 250 keV range, which is favorable to claimants when considering both organ dose conversion factors and radiation effectiveness factors.
3.3.4 Neutron Radiation
There are two sources of neutrons. First, neutrons arise from (α,n) reactions, where the reactant is a light element, such as beryllium, oxygen or fluorine. In metal-working facilities, uranium oxides would be the most common generators of (α,n) neutrons, but there may also be fluorine compounds. Second, there is a small amount of spontaneous fission by uranium. Table 3.5 shows spontaneous fission and (α,n) yields for various uranium isotopes and 232Th.

Document No. Battelle-TBD-6000; PNWD-3738 R0
Revision No. F0 Effective Date: 12/13/2006 Page 22
Table 3.5. Neutron yields from spontaneous fission and (α,n) reactions for oxides and fluorides
Isotope
Spontaneous Fission Yield,
n/s-gram
(α,n) Yield in Oxides,
n/s-g
(α,n) Yield in Fluorides,
n/s-g232Th 2.2E-5 232U 1.3 1.49E4 2.6E+6 233U 8.6E-4 4.8 7.0E+2 234U 5.02E-3 3 5.8E+2 235U 2.99E-4 7.1E-4 0.08 236U 5.49E-3 2.4E-2 2.9 238U 1.36E-2 8.3E-5 0.028 (DOE-STD-1136)
The production of neutrons by (α,n) interactions in uranium compounds will vary according to the light element involved in the interaction. Table 3.6, obtained from DOE-STD-1136-2000, shows the neutron yields for various light elements. The data in this table show that the greatest yield is from fluorine and the yield from oxygen compounds, which are more likely to be found in metal-working facilities, is two orders of magnitude less.
Table 3.6. Neutron yields for trace impurities in uranium
Neutron Yield
Element per 106 Alphas
at 4.7 MeV (234U) Li 0.16 ± 0.04 Be 44. ± 4 B 12.4 ± 0.6 C 0.051 ± 0.002 O 0.040 ± 0.001 F 3.1 ± 0.3
Na 0.5 ± 0.5 Mg 0.42 ± 0.03 Al 0.13 ± 0.01 Si 0.028 ± 0.002 Cl 0.01 ± 0.01
(DOE, 2004)
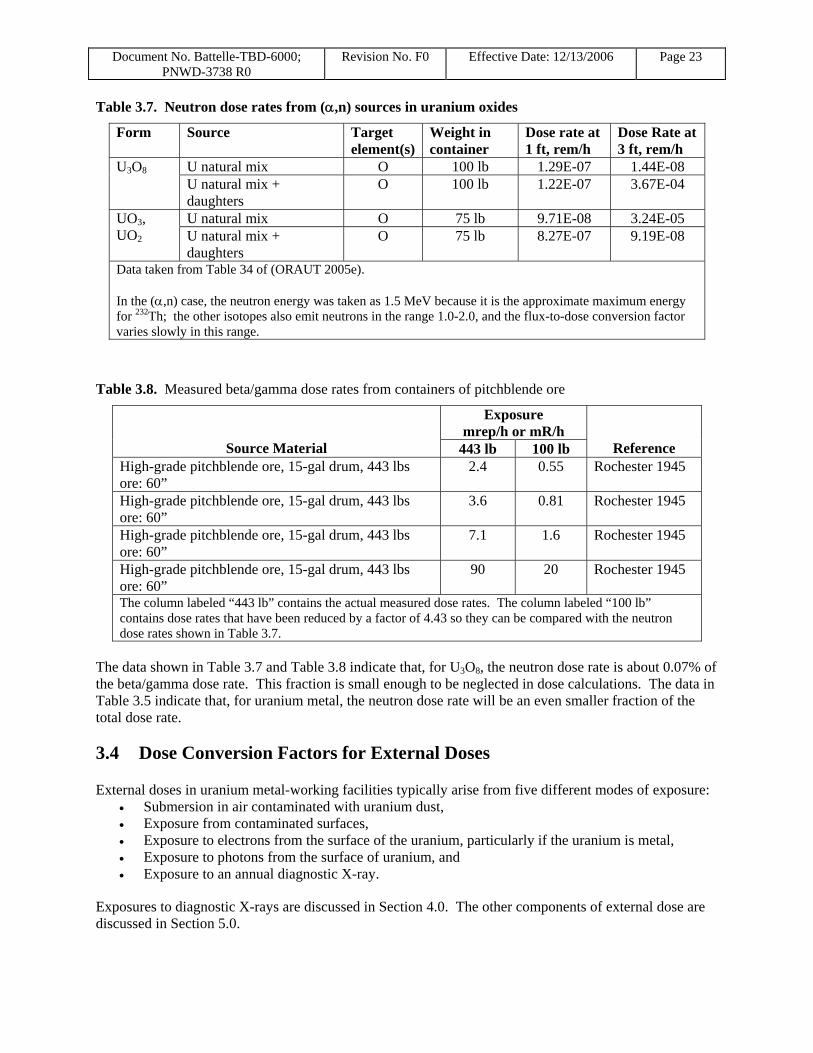
An analysis of neutron dose rates from uranium and thorium oxides and fluorides was performed for the Mallinckrodt site (ORAUT 2005e). The calculated neutron dose rates are shown in Table 3.7. The calculated neutron dose rates can then be compared to the measured dose rates from pitchblende ore, shown in Table 3.8. Pitchblende ore contains a very high concentration of U3O8. The measured dose rates from pitchblende ore were divided by 4.43 so that the measured and calculated dose rates would represent the dose rate from the same amount of U3O8. Comparison of the measured beta/photon dose rates and the calculated neutron dose rates show that the neutron dose rate is about 0.07% of the beta/photon dose rate and need not be included in dose rate calculations. For uranium metal, the neutron dose rate is even less important. The data in Table 3.5 show that the neutron emission rate due to spontaneous fission is much less than the neutron emission rate due to (α, n) reactions.
Document No. Battelle-TBD-6000; PNWD-3738 R0
Revision No. F0 Effective Date: 12/13/2006 Page 23
Table 3.7. Neutron dose rates from (α,n) sources in uranium oxides
Form Source Target element(s)
Weight in container
Dose rate at 1 ft, rem/h
Dose Rate at 3 ft, rem/h
U3O8 U natural mix O 100 lb 1.29E-07 1.44E-08 U natural mix + daughters
O 100 lb 1.22E-07 3.67E-04
UO3, UO2
U natural mix O 75 lb 9.71E-08 3.24E-05 U natural mix + daughters
O 75 lb 8.27E-07 9.19E-08
Data taken from Table 34 of (ORAUT 2005e).
In the (α,n) case, the neutron energy was taken as 1.5 MeV because it is the approximate maximum energy for 232Th; the other isotopes also emit neutrons in the range 1.0-2.0, and the flux-to-dose conversion factor varies slowly in this range.
Table 3.8. Measured beta/gamma dose rates from containers of pitchblende ore
Source Material
Exposure mrep/h or mR/h
Reference 443 lb 100 lb High-grade pitchblende ore, 15-gal drum, 443 lbs ore: 60”
2.4 0.55 Rochester 1945
High-grade pitchblende ore, 15-gal drum, 443 lbs ore: 60”
3.6 0.81 Rochester 1945
High-grade pitchblende ore, 15-gal drum, 443 lbs ore: 60”
7.1 1.6 Rochester 1945
High-grade pitchblende ore, 15-gal drum, 443 lbs ore: 60”
90 20 Rochester 1945
The column labeled “443 lb” contains the actual measured dose rates. The column labeled “100 lb” contains dose rates that have been reduced by a factor of 4.43 so they can be compared with the neutron dose rates shown in Table 3.7.
The data shown in Table 3.7 and Table 3.8 indicate that, for U3O8, the neutron dose rate is about 0.07% of the beta/gamma dose rate. This fraction is small enough to be neglected in dose calculations. The data in Table 3.5 indicate that, for uranium metal, the neutron dose rate will be an even smaller fraction of the total dose rate.
3.4 Dose Conversion Factors for External Doses
External doses in uranium metal-working facilities typically arise from five different modes of exposure: • Submersion in air contaminated with uranium dust, • Exposure from contaminated surfaces, • Exposure to electrons from the surface of the uranium, particularly if the uranium is metal, • Exposure to photons from the surface of uranium, and • Exposure to an annual diagnostic X-ray.
Exposures to diagnostic X-rays are discussed in Section 4.0. The other components of external dose are discussed in Section 5.0.

Document No. Battelle-TBD-6000; PNWD-3738 R0
Revision No. F0 Effective Date: 12/13/2006 Page 24
3.4.1 Submersion in Contaminated Air and Exposure to Contaminated Surfaces
When workers are enveloped in a cloud of radioactive dust, they will receive a small amount of external dose. External exposure rates from uranium and its radioactive progeny are shown in Table 3.9. The doses were calculated using the computer code MiroShield version 6.02 (Grove Engineering 2003). The calculated dose rates are for natural uranium and include the dose contribution from the radioactive progeny of 238U, 235U, and 234U. In accordance with (ORAUT 2005c) 100 days of radioactive progeny ingrowth was assumed for these calculations.
Table 3.9. Dose conversion factors and daily doses for external dose due to submersion in uranium-contaminated air
External Dose Conversion factor Time since separation (mR/h per dpm(α)/m3) (mR/d per dpm(α)/m3)
100 d 2.46E-09 1.97E-08
Notice that the dose quantity calculated for this conversion factor is exposure, in units of milliRoentgen. For this particular conversion factor, 50.5% of the exposure is associated with photons with energies below 30 keV; 28.5% is from photons with energies between 30 keV and 250 keV, and the remaining 21.0% is for photons with energies greater than 250 keV.
The dose reconstructor should refer to Appendix A of OCAS-IG-001 (NIOSH 2002) to determine which of the tabulated organ dose rates should be used for any particular ICD code.
3.4.2 Exposures from Contaminated Surfaces
When workers are working on a contaminated surface, they will receive a small amount of external dose. External dose rates from uranium and its radioactive progeny are shown in Table 3.10. The doses were calculated using the computer code MiroShield (Grove Engineering 2003). The calculated dose rates are for natural uranium and include the dose contribution from the radioactive progeny of 238U, 235U, and 234U. In accordance with (ORAUT 2005c) 100 days of radioactive progeny ingrowth was assumed for these calculations.
Table 3.10 Daily dose rates from natural uranium surface contamination over 1 m2
Surface contamination dose conversion factors Time since separation (mR/h per dpm(α)/m2) (mR/d per dpm(α)/m2)
100 d 5.61E-10 4.49E-09
Notice that the dose quantity calculated for this conversion factor is exposure, in units of milliRoentgen. For this particular conversion factor, 76.7% of the exposure is associated with photons with energies below 30 keV; 10.0% is from photons with energies between 30 keV and 250 keV, and the remaining 13.3% is for photons with energies greater than 250 keV.
The dose reconstructor should refer to Appendix A of OCAS-IG-001 (NIOSH 2002) to determine which of the tabulated organ dose rates should be used for any particular ICD code.
The quantity of uranium on the floor surface can be obtained from floor survey (wipe) sample measurements. Most survey samples were based on a 100 cm2 sample rather than a 1 meter squared sample. When measured floor contamination rates are not available the contamination on the floor may be estimated from measured air concentrations. The floor activity may be computed from the air
Document No. Battelle-TBD-6000; PNWD-3738 R0
Revision No. F0 Effective Date: 12/13/2006 Page 25
concentrations following the method of (ORAUT 2005c) pp 14-15. The level of surface contamination was determined by first calculating a terminal settling velocity for 5-µm activity mean aerodynamic diameter (AMAD) particles. The calculated terminal settling velocity was 0.00075 meters per second. It was assumed that the surface contamination level was due to 365 days of constant deposition from the constant air concentration to give a deposition factor of 2.37E4 meters. The floor contamination level is then estimated as Floor Concentration (dpm/m2) = Air Concentration (dpm/m3) × 2.37E4 meters. This method calculates the surface contamination over 1 m2 .
3.4.3 Exposures from Contaminated Soil
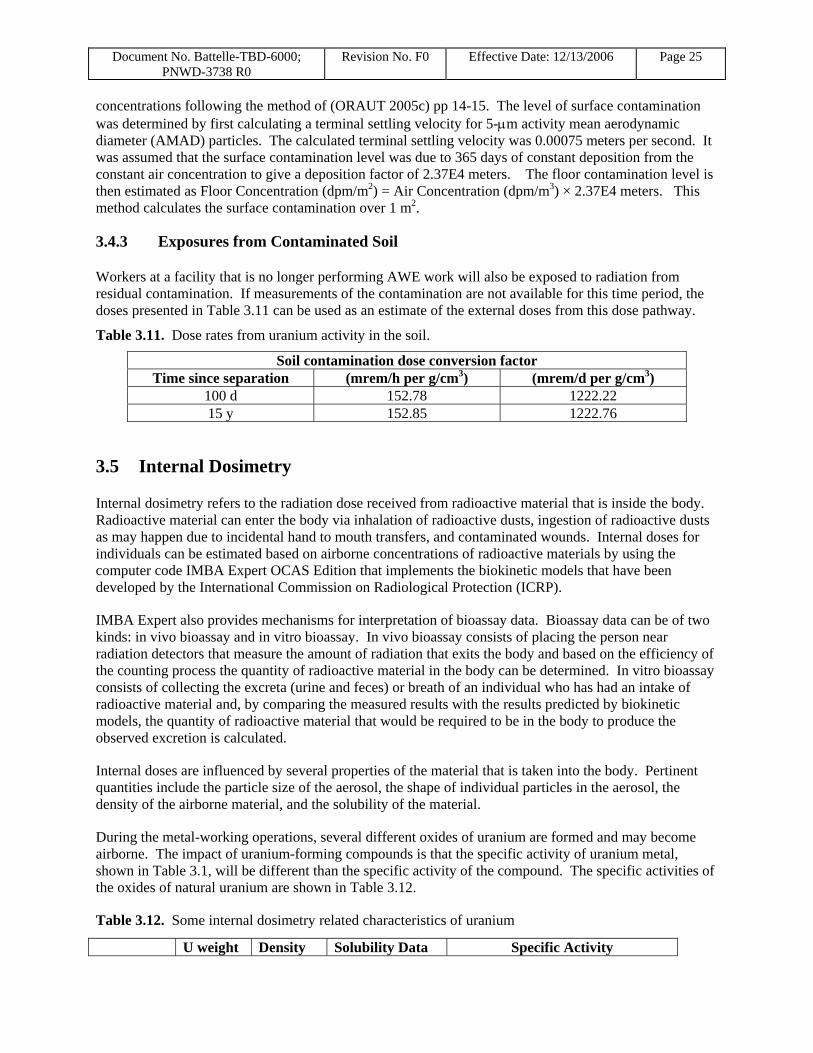
Workers at a facility that is no longer performing AWE work will also be exposed to radiation from residual contamination. If measurements of the contamination are not available for this time period, the doses presented in Table 3.11 can be used as an estimate of the external doses from this dose pathway.
Table 3.11. Dose rates from uranium activity in the soil.
Soil contamination dose conversion factor Time since separation (mrem/h per g/cm3) (mrem/d per g/cm3)
100 d 152.78 1222.22 15 y 152.85 1222.76
3.5 Internal Dosimetry
Internal dosimetry refers to the radiation dose received from radioactive material that is inside the body. Radioactive material can enter the body via inhalation of radioactive dusts, ingestion of radioactive dusts as may happen due to incidental hand to mouth transfers, and contaminated wounds. Internal doses for individuals can be estimated based on airborne concentrations of radioactive materials by using the computer code IMBA Expert OCAS Edition that implements the biokinetic models that have been developed by the International Commission on Radiological Protection (ICRP).
IMBA Expert also provides mechanisms for interpretation of bioassay data. Bioassay data can be of two kinds: in vivo bioassay and in vitro bioassay. In vivo bioassay consists of placing the person near radiation detectors that measure the amount of radiation that exits the body and based on the efficiency of the counting process the quantity of radioactive material in the body can be determined. In vitro bioassay consists of collecting the excreta (urine and feces) or breath of an individual who has had an intake of radioactive material and, by comparing the measured results with the results predicted by biokinetic models, the quantity of radioactive material that would be required to be in the body to produce the observed excretion is calculated.
Internal doses are influenced by several properties of the material that is taken into the body. Pertinent quantities include the particle size of the aerosol, the shape of individual particles in the aerosol, the density of the airborne material, and the solubility of the material.
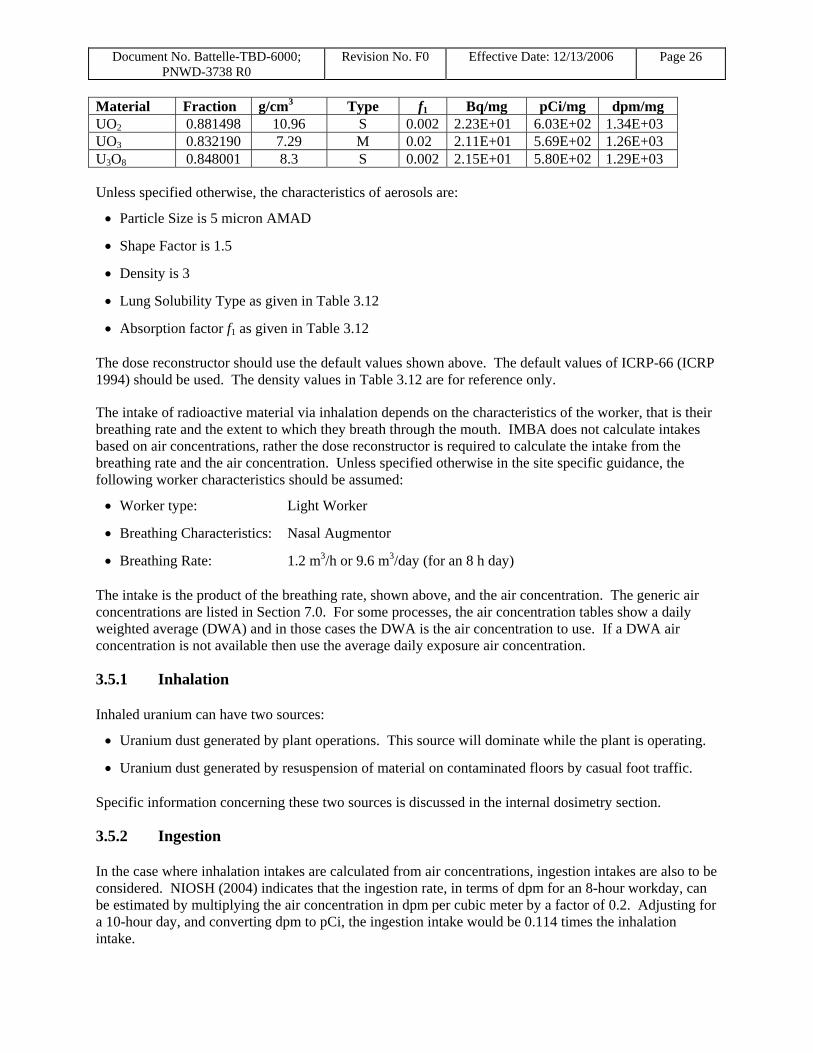
During the metal-working operations, several different oxides of uranium are formed and may become airborne. The impact of uranium-forming compounds is that the specific activity of uranium metal, shown in Table 3.1, will be different than the specific activity of the compound. The specific activities of the oxides of natural uranium are shown in Table 3.12.
Table 3.12. Some internal dosimetry related characteristics of uranium
U weight Density Solubility Data Specific Activity
Document No. Battelle-TBD-6000; PNWD-3738 R0
Revision No. F0 Effective Date: 12/13/2006 Page 26
Material Fraction g/cm3 Type f1 Bq/mg pCi/mg dpm/mg UO2 0.881498 10.96 S 0.002 2.23E+01 6.03E+02 1.34E+03 UO3 0.832190 7.29 M 0.02 2.11E+01 5.69E+02 1.26E+03 U3O8 0.848001 8.3 S 0.002 2.15E+01 5.80E+02 1.29E+03
Unless specified otherwise, the characteristics of aerosols are:
• Particle Size is 5 micron AMAD
• Shape Factor is 1.5
• Density is 3
• Lung Solubility Type as given in Table 3.12
• Absorption factor f1 as given in Table 3.12
The dose reconstructor should use the default values shown above. The default values of ICRP-66 (ICRP 1994) should be used. The density values in Table 3.12 are for reference only.
The intake of radioactive material via inhalation depends on the characteristics of the worker, that is their breathing rate and the extent to which they breath through the mouth. IMBA does not calculate intakes based on air concentrations, rather the dose reconstructor is required to calculate the intake from the breathing rate and the air concentration. Unless specified otherwise in the site specific guidance, the following worker characteristics should be assumed:
• Worker type: Light Worker
• Breathing Characteristics: Nasal Augmentor
• Breathing Rate: 1.2 m3/h or 9.6 m3/day (for an 8 h day)
The intake is the product of the breathing rate, shown above, and the air concentration. The generic air concentrations are listed in Section 7.0. For some processes, the air concentration tables show a daily weighted average (DWA) and in those cases the DWA is the air concentration to use. If a DWA air concentration is not available then use the average daily exposure air concentration.
3.5.1 Inhalation
Inhaled uranium can have two sources:
• Uranium dust generated by plant operations. This source will dominate while the plant is operating.
• Uranium dust generated by resuspension of material on contaminated floors by casual foot traffic.
Specific information concerning these two sources is discussed in the internal dosimetry section.
3.5.2 Ingestion
In the case where inhalation intakes are calculated from air concentrations, ingestion intakes are also to be considered. NIOSH (2004) indicates that the ingestion rate, in terms of dpm for an 8-hour workday, can be estimated by multiplying the air concentration in dpm per cubic meter by a factor of 0.2. Adjusting for a 10-hour day, and converting dpm to pCi, the ingestion intake would be 0.114 times the inhalation intake.

Document No. Battelle-TBD-6000; PNWD-3738 R0
Revision No. F0 Effective Date: 12/13/2006 Page 27

Document No. Battelle-TBD-6000; PNWD-3738 R0
Revision No. F0 Effective Date: 12/13/2006 Page 28
4.0 Occupational Medical Dose
In most AWE facilities, workers received a pre-employment X-ray examination, and in many of these facilities, the X-ray was also administered annually to employees who worked with uranium metal. The “pre-employment” X-ray was often administered at the start of AEC operations. In the absence of site-specific information about medical X-rays required for employment, the assumption should be made that it was administered at the beginning of AEC operations (or at the beginning of a worker’s employment) and annually during uranium metal-working operations. This follows the practice at Simonds Saw & Steel (Simonds, 1948). The exposure geometry was assumed to be posterior-anterior (PA) (NIOSH, 2002).
4.1 Chest X-Rays
Information to be used in dose reconstruction for the early years for which no specific information is available is provided in ORAUT-OTIB-0006, the dose reconstruction project technical information bulletin covering diagnostic X-ray procedures (ORAUT 2003d). ORAUT (2003d) should be referred to regarding the underlying bases, interpretation details, and a sample of a summary data table where actual beam data are known.
Doses for organs not listed in ICRP Publication 34 (ICRP 1982) but specified in the IREP code should be determined by analogy with anatomical location as indicated below. Analogues for IREP organs not included in ICRP 34 are given in Table 4.1.
Table 4.1. Organ analogues for diagnostic chest X-ray
Anatomical location ICRP 34 reference organ IREP organ analogues
Thorax Lung Thymus Esophagus Stomach Bone surface Liver/gall bladder/spleen Remainder organs
Abdomen Ovaries Urinary/bladder Colon/rectum Uterus
Head and neck Thyroid Eye/Brain
As ORAUT (2003d) notes, for any individual entrance skin exposure (ESE) or derived organ dose, an uncertainty of ± 30% at the one sigma confidence level may be assumed; for further conservatism it may be appropriate to assume that errors are all positive and thus only the + 30% should be used.
4.2 Pelvic X-Rays
Pelvic X-rays were administered to workers who handled fluoride compounds, so they may not have been administered to workers at uranium metal-working facilities. If workers at any of these facilities received pelvic X-rays as conditions of employment, the dose can be estimated using the guidance provided in Appendix A of ORAU-OTIB-0006 (ORAUT 2005d).
Document No. Battelle-TBD-6000; PNWD-3738 R0
Revision No. F0 Effective Date: 12/13/2006 Page 29
5.0 Occupational Environmental Dose
In the context of reconstructing doses for Atomic Weapons employees, the occupational environmental dose includes doses due to
• direct, external irradiation from material in process, in storage, in transit, and from radioactive contamination on surfaces, in soil and water, and in plumes of radioactive material
• internal irradiation due to intakes of residual radioactive material through inhalation, ingestion, dermal contact with radioactive material, and through wounds. Generally, dermal contact and wound entry are assumed to be negligible in the absence of information to the contrary.
5.1 Environmental External Irradiation
Typically, atomic weapons employees who were not categorized as radiation workers were not monitored using personal dosimeters. However, the work environment for these employees was sometimes routinely monitored using area dosimeters or periodically monitored using survey instrumentation to measure the “background” environmental radiation levels. At many of these facilities, routine monitoring stations have recorded the average photon dose in a general area or at the plant boundaries. At several DOE facilities, radioactive emissions from plant stacks have been known to significantly increase the “background” radiation levels on the plant site. In general the dose from increased background is rather low.
5.1.1 Environmental Doses During Operations
Direct, external irradiation of people on site can occur from material in process, in storage, in transit, and from radioactive contamination on surfaces, in soil and water, and in plumes of radioactive material. Uranium metal emits beta particles (electrons) and to a lesser extent, photon radiation primarily in the form of bremsstrahlung X-rays but with some gamma emissions (e.g., the 186 keV photon from 235U). Neutron radiation (from spontaneous fission) is negligible, even for massive quantities of uranium (based on neutron production calculated by SOURCES-4 (Wilson et al. 1999)).
During operations, environmental doses were much smaller than those occurring in the metal-working portions of the facility, so these doses would be significant only for workers who spent little time in the high-dose portions of the facility. For these workers, the exposure scenario is spending eight hours per working day in an area with a low level of airborne contamination and a low level of contamination deposited on the floor. To estimate external doses resulting from these two pathways, dose factors are provided in 3.4.
The environmental external dose received by a worker exposed to contaminated air and walking on contaminated ground can be found by multiplying the dose factors by the contamination levels, assuming a number of hours of exposure per workday. This analysis assumes that during plant operation, the worker away from the main operation area is exposed to a uranium concentration in air of 7 dpm/m3 . This level corresponds to 0.1 MAC, and is consistent with general area air sampling results for positions on the factory floor away from operations. Air sampling results for three plants, American Machine and Foundry, Medart, and Allegheny Ludlum were examined, comparing air samples at the highest concentration areas to air samples at the lowest concentration areas during the same operation. For 11 different cases, the ratio of the low to high concentration ranged from 0.002 to 0.029, with all but two of those ratios below 0.01. Thus it would be reasonable to use a ratio of 0.01 for areas that are further away

Document No. Battelle-TBD-6000; PNWD-3738 R0
Revision No. F0 Effective Date: 12/13/2006 Page 30
from the heavy operations, which non-operational areas of the facility would be. We can assume that a heavy operation would produce a daily-weighted air concentration of 10 MAC at the operator’s position, so ratioing this by 0.01 gives a value of 0.1 MAC or 7 dpm/m3 in the non-operational areas of the plant.
For the surface contamination, it is assumed that the uranium deposited on the floor with a deposition velocity of 0.00075 m/s for a period of one year without cleanup, then remained at that level of contamination for the duration of operations. This would be a contamination level of 1.65×10⁵ dpm/m2 . The worker exposure is estimated as daily doses for 40-, 44-, and 48-hour workweeks. Using these assumptions, the daily doses1 can be calculated, and they are presented in Table 5.1. These external doses are from penetrating photons with energies between 30 and 250 keV.
Table 5.1. Environmental external daily exposure to workers in non-operational areas of a facility.
Hours worked per week
Submersion Exposure
(mR/d)
Contaminated Surface Exposure
(mR/d) Total Exposure
(mR/d) 40 9.44E-08 5.08E-04 5.08E-04 44 1.04E-07 5.58E-04 5.58E-04 48 1.13E-07 6.09E-04 6.09E-04
Since the total exposure is dominated by the surface contamination pathway, 76.7% of the exposure is associated with photons with energies below 30 keV; 10.0% is from photons with energies between 30 keV and 250 keV, and the remaining 13.3% is for photons with energies greater than 250 keV.
5.1.2 After Operations and Initial Decontamination and Before FUSRAP Remediation
Workers at a facility that is no longer performing AWE work will also be exposed to radiation from residual contamination. If measurements of the contamination are not available for this time period, the doses presented in Table 5.1 can be used as an estimate of the external doses from this dose pathway.
5.1.3 After FUSRAP Remediation
At the conclusion of remediation, exit surveys should be available to base dose calculations on. If no exit surveys are available, external doses can be estimated using the doses presented in Table 5.1.
5.2 Environmental Internal Dose Due to Inhalation of Radioactive Material
At several DOE facilities, radioactive emissions from plant stacks have been known to significantly increase the “background” radiation levels on the plant site. In general the dose from increased background is rather low.
5.2.1 During Operations
Radioactive material aerosolized by various industrial processes in uranium metalworking can be released deliberately or inadvertently to the environment, producing uranium aerosols in the environs of the site. An estimate of the intake from the inhalation pathway can be estimated assuming an airborne
1 In this document, a “daily dose” assumes 365 days of exposure for year. This is found by estimating the annual dose based on number of hours worked per week and 50 weeks per year, then dividing the annual dose by 365. This format is used by the IMBA code for internal doses and the convention will be used for both internal and external exposures.

Document No. Battelle-TBD-6000; PNWD-3738 R0
Revision No. F0 Effective Date: 12/13/2006 Page 31
contamination level, a breathing rate, and daily exposure period. The estimate of 7 dpm/m3 used in Section 5.1.1 can be assumed for the contamination level. A breathing rate of 1.2 m3/h can be used, and the conversion factor of 2.22 dpm/pCi must also be employed, to give intakes in units of pCi/d of uranium. Ingestion intakes were found using the equation I IMBA = 3.062 ×10⁻⁵ Ah as discussed in Section 7.1.6. Table 5.2 gives the intakes, both from inhalation and ingestion, for these conditions. The intake values are assumed to be the geometric means of lognormal distributions with GSD=5.
Table 5.2. Environmental internal daily intakes to workers in non-operational areas of a facility.
Hours worked per week
Daily Intake from Inhalation
(pCi/d)
Daily Intake from Ingestion (pCi/d)
40 20.7 0.429 44 22.8 0.472 48 24.9 0.514
To account for the uncertainty in the estimation of doses, it is recognized that any estimate of an intake is actually a best estimate chosen from the range of all possible values. The distribution of possible values is assumed to follow a lognormal distribution, as discussed in (Battelle Team 2006). The best estimate chosen from this distribution is the geometric mean of the lognormal. The lognormal distribution is further described by its geometric standard deviation (GSD). In some cases the GSD can be determined from a set of data associated with the site. In many cases, however, the GSD cannot be derived, and in these cases a GSD of 5 will be assigned, as discussed in (Battelle Team 2006).
5.2.2 After Operations and Initial Decontamination and Before FUSRAP Remediation
Workers at a facility that is no longer performing AWE work may also be inhaling uranium from residual contamination. If measurements of the contamination are not available for this time period, the intake presented in the previous section can be used as an estimate of the internal doses from this dose pathway.
5.2.3 After FUSRAP Remediation
At the conclusion of remediation, exit surveys should be available to base intakes on. If no exit surveys are available, intakes can be estimated as identical to that given in Section 5.2.1.
5.3 Summary of Occupational Environmental Doses
The external doses and internal intakes of uranium at environmental levels are summarized in Table 5.3.

Document No. Battelle-TBD-6000; PNWD-3738 R0
Revision No. F0 Effective Date: 12/13/2006 Page 32
Table 5.3. Daily doses and intakes for occupational exposure to environmental levels of radiation
Dose Pathway Workweek, hours
During Operations
After Operations and Initial Decontamination and Before FUSRAP Remediation
After FUSRAP Remediation
External 40 3.15E-4 mrem/d 3.15E-4 mrem/d 3.15E-4 mrem/d irradiation
44 3.47E-4 mrem/d N/A N/A 76.7%: < 30 keV;
10.0%: 30 < E < 250 keV;
13.3%: > 250 keV
48
3.78E-4 mrem/d N/A N/A
40 20.7 pCi/d 20.7 pCi/d 20.7 pCi/d Inhalation intake of 234U, type M or 44 22.8 pCi/d N/A N/A S
48 24.9 pCi/d N/A N/A
40 0.429 pCi/d 0.429 pCi/d 0.429 pCi/d
Ingestion intake of 234U, type M or S 44 0.472 pCi/d N/A N/A
48 0.514 pCi/d N/A N/A

Document No. Battelle-TBD-6000; PNWD-3738 R0
Revision No. F0 Effective Date: 12/13/2006 Page 33
6.0 Occupational External Dose
Film badge usage at AWE sites varied from plant to plant and over time. When film badge data for workers are available, these readings are the preferred indicator of the worker’s whole body dose. In some cases there may be coworker dosimetry results available that can be used to estimate an unbadged worker’s dose. When film badges were not issued, the worker’s dose must be determined from plant conditions. The estimation of doses in this section will assume that no dosimetry results were available, and will assume typical conditions for the type of workplace addressed in this document, but will use worst case exposure conditions as assumptions favorable to a claimant. The appendices to this document will present site-specific information to provide more appropriate estimates where available. If site information is insufficient to estimate a dose to a worker, the information in this section can be used.
The majority of photons from natural uranium metals are in the 30 to 250 keV energy range. Solid uranium objects provide considerable shielding of the lower energy photons and harden the spectrum, causing the majority of photons emitted from a solid uranium object, such as a billet or a rod, to have energies greater than 250 keV. While it is recognized that solid uranium sources will have a hardened photon spectrum, exposure to a thin layer of uranium on a surface will result in a larger fraction of exposure to lower energy photons. This analysis assumed workers were exposed to photon energies in the 30 to 250 keV range, which is favorable to claimants. Nonpenetrating dose from natural uranium consists primarily of electrons with energies above 15 keV. For consistent presentation, exposure or dose is reported as:
• penetrating, assumed to be associated with photons of energies 30 keV or greater, and • nonpenetrating, assumed to be associated with photons of energies less than 30 keV or with
electrons.
External doses in uranium metal-handling facilities typically arise from five different modes of exposure: • Submersion in air contaminated with uranium dust (whole body exposure from penetrating
radiation), • Exposure from contaminated surfaces (whole body exposure), • Exposure to photons from the surface of uranium metal (whole body exposure), • Exposure to non-penetrating radiation from the surface of the uranium metal (skin of hands and
forearms) • Exposure to non-penetrating radiation from the surface of the uranium metal (skin other than
hands and forearms).
6.1 Submersion in Contaminated Air and Exposure to Contaminated Surfaces
Clouds of radioactive dust were frequently present in uranium metal-working facilities. The dust material consisted of uranium oxide, usually originating in the oxidation of uranium that occurred on hot metal surfaces as the uranium metal was processed. This dust cloud produced two types of external exposure: exposure to radiation emitted by the dust cloud, and exposure emitted by uranium oxide that settled on horizontal surfaces in the shop.

Document No. Battelle-TBD-6000; PNWD-3738 R0
Revision No. F0 Effective Date: 12/13/2006 Page 34
6.1.1 Exposures from Submersion in a Dust Cloud
When workers are enveloped in a cloud of radioactive dust, they will receive a small amount of external dose. External dose rates from uranium and its radioactive progeny are calculated using the dose factor in Section 5.1.1.
A worker’s external dose due to submersion in a dust cloud can be found by taking the air concentration appropriate for the job title and multiplying it by the dose factor. If the air concentration is the daily weighted average, this calculation would give a dose rate in mrem/h, so multiplying that value by the number of hours worked per day will give the dose per workday. Air concentrations appropriate for job categories for the metal-working processes are given in Section 7.1 and they are converted to daily doses in Section 6.4.
6.1.2 Exposures from a Contaminated Surface
When workers are working on a contaminated surface, they will receive a small amount of external dose. External dose rates from uranium and its radioactive progeny are calculated using the dose factor in Section 4.1.2. These dose rates assume that a worker is standing on a contaminated floor, with the contamination level uniform to infinity in all directions.
Surface contamination levels can be found in one of two ways: measurement of surface contamination or calculation of surface contamination based on air concentrations. If surface measurements are used, the dose reconstructor should be sure that the measurement units are converted to alpha dpm per m2 (notice that most measurements are based on a probe area of 100 cm2, so conversion is required) when using values in this table.
When measured floor contamination rates are not available the contamination on the floor may be estimated from measured air concentrations. The floor activity may be computed from the air concentrations following the method used for the Rocky Flats plant (ORAUT 2004). The level of surface contamination was determined by first calculating a terminal settling velocity for 5-mm activity mean aerodynamic diameter (AMAD) particles. The calculated terminal settling velocity was 0.00075 meters per second. The surface contamination can be found by multiplying the air concentration by the deposition velocity and then by the assumed time that the deposition occurs. Choosing this time is difficult, since it depends on the housekeeping practices of the facility. For metal sites, an assumption can be made that surface contamination can be characterized by a seven-day deposition time. In other words, the contamination level is the result of deposition occurring for one week, and then additional deposition and cleanup balancing each other so that this level is constant for the remainder of the operating period. With this assumption the deposition factor would be 453.6 (= 0.00075 m/s × 604800 s) to convert the air concentration, in units of dpm/m3 to surface concentration in units of dpm/m2 .
A worker’s external dose due to exposure from a contaminated surface can be found by taking the air concentration appropriate for the job title, converting that to a corresponding surface concentration, and multiplying it by the dose factor. This calculation will give a dose rate in mrem/h, so multiplying that value by the number of hours worked per day will give the dose per workday. Air concentrations appropriate for job categories for the metal-working processes are given in Section 7.1 and they are converted to daily doses in Section 6.4.

Document No. Battelle-TBD-6000; PNWD-3738 R0
Revision No. F0 Effective Date: 12/13/2006 Page 35
6.2 Whole Body Radiation Emitted from Metal Surfaces
For estimating external dose rates due to penetrating radiation emitted from the surface of uranium metal, MCNP calculations were performed for a number of basic shapes representative of those that are used in AWE metal-working facilities (Anderson and Hertel 2005). Table 6.1 shows these calculated dose rates for distances of 1 cm, 30.48 cm (equal to 1 foot) and 1 meter from the surface. The 1-cm dose position can be considered to give the “surface” dose rate.
Table 6.1. Dose rates from standard shapes of uranium metal
Shape Surface dose rate
(mrem/h) 30.48-cm dose rate
(mrem/h) 1-m dose rate
(mrem/h) Long Rod 5.09 0.285 0.0883 Slug 7.63 0.0524 0.00519 Long Billet 7.74 0.703 0.108 Short Billet 7.36 0.469 0.0585 Cylindrical Ingot 8.44 1.15 0.185 Rectangular Ingot 8.26 2.08 0.373 Flat Plate 6.27 0.231 0.0278
The dose rates were calculated using ANSI/ANS 6.1.1-1977 (ANSI 1977) dose-equivalent conversion coefficients. These were calculated as the maximum dose deposited in a slab phantom, including a quality factor, so it is a measure of a whole-body dose equivalent.
These dose rates can be used to estimate the component of whole body dose that a worker would receive while handling or near uranium metal. For an individual site, there may be information on which shape applied to a site’s operations, what a representative distance from the source would be, and how many hours of exposure at that distance there would be per year. However, for the generic case, a worst-case assumption should be made, which is that all work was done with a uranium metal slab, and the following assumptions are made about a worker’s exposure conditions:
• Operator: 50% of the workday was spent at 1 foot from the surface of the metal
• General Laborer: 50% of the workday was spent at 1 meter from the metal surface
• Supervisor: exposure was equal to 50% of a general laborer’s exposure
• Clerical: exposure was equal to 10% of a supervisor’s exposure.
With these assumptions, Table 6.2 lists the daily doses to four job categories in a metal plant. Exposures are whole body, assuming that the incident radiation is photons with energies between 30 and 250 keV.
Table 6.2. Daily doses from penetrating photon radiation to a worker near bare uranium metal
Job Title
Daily dose for a 48-hr workweek (mrem/d)
Daily dose for a 44-hr workweek (mrem/d)
Daily dose for a 40-hr workweek (mrem/d)
Operator 6.84 6.27 5.70 General Laborer 1.23 1.12 1.02 Supervisor 0.613 0.562 0.511

Document No. Battelle-TBD-6000; PNWD-3738 R0
Revision No. F0 Effective Date: 12/13/2006 Page 36
Clerical 0.061 0.056 0.051
6.3 Nonpenetrating Radiation Emitted from Uranium Metal Surfaces
Skin doses (7 mg/cm2) are estimated for two worker cases: the hands and forearms of a worker who handles uranium metal, and the other skin surfaces of a worker who handles the metal.
The 7 mg/cm2 dose from non-penetrating radiation when the skin is in contact with an unshielded slab of uranium metal is 230 mrem/hour (Coleman, Hudson, and Plato, 1983; U.S. Army, 1989). Exposure assumptions for hands-on contact with uranium metal for the four job categories assumes:
• Operator: 50% of the workday was spent with hands in contact with the surface of the metal
• General Laborer: exposure would be 50% of the exposure of the operator
• Supervisor: exposure would be 10% of the exposure of the general laborer (assuming the supervisor seldom has a reason to touch metal)
• Clerical: 0 (assuming the clerical worker has no reason to touch metal)
These assumptions can be used with the contact dose rate of 230 mrem/h to estimate the dose of the skin of the hands and forearm. This dose estimate assumes that no gloves or protective clothing shielded the worker’s hands and forearms, which may have been true for some of the earliest years of uranium metalworking, and is an assumption favorable to the claimant for other workers.
For dose to other skin on the worker’s body that is not in direct contact with uranium metal, but is nearby (for example, a worker’s neck and face when the hands are in contact with metal), a dose relation can be used that estimates this dose to be 10 times the photon dose rate at 1-foot. This relation, based on a review of film badge data, is documented in (ORAUT, 2005). In Table 6.1, the photon dose rate at 1 foot from a slab of uranium is 2.08 mrem/h, which would give a non-penetrating dose rate of 20.8 mrem/h using this relation. Using this relation with the four assumptions given for time spent with hands in contact with metal gives the daily doses for the four job categories for skin other than the hands and forearms.
The daily doses for non-penetrating radiation to skin of a worker in a metal-working facility is given in Table 6.3.
Table 6.3. Daily doses from non-penetrating radiation to a worker’s skin near bare uranium metal
Job Title
Daily dose for a 48-hr workweek, mrem/d
Daily dose for a 44-hr workweek, mrem/d
Daily dose for a 40-hr workweek, mrem/d
Hands & Forearm
Other Skin
Hands & Forearm
Other Skin
Hands & Forearm
Other Skin
Operator 756 68 693 63 630 57 General Laborer 378 34 347 31 315 28 Supervisor 38 3 35 3 32 3 Clerical 0 0 0 0 0 0

Document No. Battelle-TBD-6000; PNWD-3738 R0
Revision No. F0 Effective Date: 12/13/2006 Page 37
6.4 Summary of External Radiation Doses During Operation
The daily doses received by workers at a plant that handled uranium, according to the five pathways described in this section, are given in Table 6.4.
For the air submersion and contaminated floor dose pathways, the dose quantity is exposure, and doses should be evaluated using the dose evaluation should use the fractional distributions in energy ranges that were given in Sections 3.4.1 and 3.4.2.
For the metal whole body dose, the dose quantity is dose equivalent, and the exposure geometry is an AP beam. For this geometry it is conservative to assume that all photons have energies in the range of 30-250 keV.
The “hands and forearms” and “other skin” pathways are doses at a skin depth of 7 mg/cm2, caused by electrons with energies above 15 keV.
Each daily dose value is assumed to be the geometric mean of a lognormal distribution with a GSD of 5.
Data in Table 6.4 can be used for a metal-working site that performed one of the six processes discussed in this section. If a site has more specific data describing exposures to workers, the exposure data will be listed in its appendix to this document. However, if exposure data were unavailable for a site, data from this table can be used for calculating worker doses. Data in this table are chosen for worst-case exposures, so they would be favorable to the claimant. Data presented here assumes that the facility operates full-time over the course of a year, while many metal-working sites worked with uranium for only small portions of a year. If it is known that the site operated with uranium for only a small fraction of a year but the exposure conditions were unknown, the data in this table could be scaled for the fraction of the year actually worked and used for worker exposure assessment.

Document No. Battelle-TBD-6000; PNWD-3738 R0 Revision No. F0 Effective Date: 12/13/2006 Page 38
Table 6.4. Estimated daily doses, external exposure pathways, for metal-working processes. Values represent the geometric mean of a lognormal distribution with geometric standard deviation equal to 5.0.
Process Job Title Years
Air Submersion Exposure
(mR)
Contaminated Floor Exposure
(mR)
Metal Whole-Body Dose
(mrem)
Hands & Forearms Non-
Penetrating dose (mrem)
Other Skin Non-
Penetrating dose (mrem)
Extrusion
Operator
up to 12/31/1950 1.606E-05 1.661E-03 6.84 756 68
1951 – 55 1.472E-05 1.523E-03 6.27 693 63 1956 on 1.338E-05 1.384E-03 5.70 630 57
General Laborer
up to 12/31/1950 2.379E-06 2.462E-04 1.23 378 34
1951 – 55 2.181E-06 2.256E-04 1.12 347 31 1956 on 1.983E-06 2.051E-04 1.02 315 28
Supervisor
up to 12/31/1950 1.182E-06 1.222E-04 0.613 38 3
1951 – 55 1.083E-06 1.121E-04 0.562 35 3 1956 on 9.847E-07 1.019E-04 0.511 32 3
Clerical
up to 12/31/1950 1.133E-07 1.172E-05 0.061 0 0
1951 – 55 1.039E-07 1.075E-05 0.056 0 0 1956 on 9.442E-08 9.768E-06 0.051 0 0
Rolling Operator
up to 12/31/1950 5.719E-05 5.916E-03 6.84 756 68
1951 – 55 5.242E-05 5.423E-03 6.27 693 63 1956 on 4.766E-05 4.930E-03 5.70 630 57
General Labor
up to 12/31/1950 1.054E-05 1.090E-03 1.23 378 34
1951 – 55 9.659E-06 9.993E-04 1.12 347 31 1956 on 8.781E-06 9.085E-04 1.02 315 28
Supervisor
up to 12/31/1950 5.277E-06 5.459E-04 0.613 38 3
1951 – 55 4.837E-06 5.004E-04 0.562 35 3 1956 on 4.397E-06 4.549E-04 0.511 32 3

Document No. Battelle-TBD-6000; PNWD-3738 R0 Revision No. F0 Effective Date: 12/13/2006 Page 39
Process Job Title Years
Air Submersion Exposure
(mR)
Contaminated Floor Exposure
(mR)
Metal Whole-Body Dose
(mrem)
Hands & Forearms Non-
Penetrating dose (mrem)
Other Skin Non-
Penetrating dose (mrem)
Clerical
up to 12/31/1950
5.342E-07 5.526E-05 0.061 0 0
1951 – 55 4.896E-07 5.066E-05 0.056 0 0 1956 on 4.451E-07 4.605E-05 0.051 0 0
Forging
Operator
up to 12/31/1950 1.894E-05 1.959E-03 6.84 756 68
1951 – 55 1.736E-05 1.796E-03 6.27 693 63 1956 on 1.578E-05 1.633E-03 5.70 630 57
General Labor
up to 12/31/1950 5.860E-06 6.062E-04 1.23 378 34
1951 – 55 5.371E-06 5.557E-04 1.12 347 31 1956 on 4.883E-06 5.052E-04 1.02 315 28
Supervisor up to
12/31/1950 2.930E-06 3.031E-04 0.613 38 3
1951 – 55 2.686E-06 2.778E-04 0.562 35 3 1956 on 2.441E-06 2.526E-04 0.511 32 3
Clerical
up to 12/31/1950 2.914E-07 3.014E-05 0.061 0 0
1951 – 55 2.671E-07 2.763E-05 0.056 0 0 1956 on 2.428E-07 2.512E-05 0.051 0 0
Machining Operator
up to 12/31/1950 8.870E-05 9.177E-03 6.84 756 68
1951 – 55 8.131E-05 8.412E-03 6.27 693 63 1956 on 7.392E-05 7.647E-03 5.70 630 57
General Labor
up to 12/31/1950 4.435E-05 4.588E-03 1.23 378 34
1951 – 55 4.066E-05 4.206E-03 1.12 347 31 1956 on 3.696E-05 3.824E-03 1.02 315 28
Supervisor Operator
up to 12/31/1950 2.218E-05 2.294E-03 0.613 38 3
1951 – 55 2.033E-05 2.103E-03 0.562 35 3

Document No. Battelle-TBD-6000; PNWD-3738 R0 Revision No. F0 Effective Date: 12/13/2006 Page 40
Process Job Title Years
Air Submersion Exposure
(mR)
Contaminated Floor Exposure
(mR)
Metal Whole-Body Dose
(mrem)
Hands & Forearms Non-
Penetrating dose (mrem)
Other Skin Non-
Penetrating dose (mrem)
1956 on 1.848E-05 1.912E-03 0.511 32 3
Clerical
up to 12/31/1950
2.218E-06 2.294E-04 0.061 0 0
up to 12/31/1950 2.033E-06 2.103E-04 0.056 0 0
1951 – 55 1.848E-06 1.912E-04 0.051 0 0
Slug Production
Operator
up to 12/31/1950 3.205E-06 3.316E-04 6.84 756 68
1951 – 55 2.938E-06 3.039E-04 6.27 693 63 1956 on 2.671E-06 2.763E-04 5.70 630 57
General Labor
up to 12/31/1950 1.602E-06 1.658E-04 1.23 378 34
1951 – 55 1.469E-06 1.520E-04 1.12 347 31 1956 on 1.335E-06 1.382E-04 1.02 315 28
Supervisor
up to 12/31/1950 8.093E-07 8.373E-05 0.613 38 3
1951 – 55 7.419E-07 7.675E-05 0.562 35 3 1956 on 6.744E-07 6.977E-05 0.511 32 3
Clerical
up to 12/31/1950 8.093E-08 8.373E-06 0.061 0 0
1951 – 55 7.419E-08 7.675E-06 0.056 0 0 1956 on 6.744E-08 6.977E-06 0.051 0 0
Scrap Recovery Operator
up to 12/31/1950 2.736E-05 2.830E-03 6.84 756 68
1951 – 55 2.508E-05 2.594E-03 6.27 693 63 1956 on 2.280E-05 2.358E-03 5.70 630 57
General Labor
up to 12/31/1950 1.368E-05 1.415E-03 1.23 378 34
1951 – 55 1.254E-05 1.297E-03 1.12 347 31 1956 on 1.140E-05 1.179E-03 1.02 315 28
Supervisor up to 12/31/1950 6.847E-06 7.083E-04 0.613 38 3

Document No. Battelle-TBD-6000; PNWD-3738 R0 Revision No. F0 Effective Date: 12/13/2006 Page 41
Process Job Title Years
Air Submersion Exposure
(mR)
Contaminated Floor Exposure
(mR)
Metal Whole-Body Dose
(mrem)
Hands & Forearms Non-
Penetrating dose (mrem)
Other Skin Non-
Penetrating dose (mrem)
1951 – 55 6.276E-06 6.493E-04 0.562 35 3 1956 on 5.706E-06 5.903E-04 0.511 32 3
Clerical
up to 12/31/1950 6.798E-07 7.033E-05 0.061 0 0
1951 – 55 6.232E-07 6.447E-05 0.056 0 0 1956 on 5.665E-07 5.861E-05 0.051 0 0

Document No. Battelle-TBD-6000; PNWD-3738 R0
Revision No. F0 Effective Date: 12/13/2006 Page 42
7.0 Occupational Internal Dose
The primary sources of internal radiation exposure at the AWE metal-working sites were uranium and thorium dust produced during the manipulation of metal objects. At some sites, bioassays were performed on workers, and urinalysis was the most effective method of determining an individual worker’s intake. When bioassay data are available for individual workers, this should be the primary source of dose reconstruction for internal exposure. When no bioassay data are available, intakes can be derived from air sampling data. The appendices to this document present air sampling data, where available, for individual sites, and these data can be used for site-specific dose reconstruction where available. In the absence of site-specific air sampling data, the air sampling data presented in this section can be used for dose reconstruction.
In this section the internal dosimetry parameters are recommended for use in dose reconstruction. Subsequent subsections present tables of default dust air concentrations that can be used to estimate intakes when site specific information is lacking.
Internal doses are influenced by several properties of the material that is taken into the body. Pertinent quantities include the particle size of the aerosol, the shape of individual particles in the aerosol, the density of the airborne material, and the solubility of the material.
In metal-working facilities, airborne uranium exists as an oxide compound of uranium. The specific activities of various oxides of natural uranium are shown in Table 7.1.
In the text of this TBD the chemical compound associated with each process will be identified.
Table 7.1. Some Internal Dosimetry Related Characteristics of Uranium Oxides
Density Solubility Data Specific Activity
Material U weight Fraction g/cm3 Type f1 Bq/mg pCi/mg dpm/mg
UO2 0.881498 10.96 S 0.002 2.23E+01 6.03E+02 1.34E+03 UO3 0.832190 7.29 M 0.02 2.11E+01 5.69E+02 1.26E+03 U3O8 0.848001 8.3 S 0.002 2.15E+01 5.80E+02 1.29E+03
Unless specified otherwise, the characteristics of aerosols are:
• Particle Size is 5 micron AMAD
• Shape Factor is 1.5
• Density as given in Table 7.1
• Lung Solubility Type as given in Table 7.1
• Absorption factor f1 as given in Table 7.1
When calculating intakes of uranium, the dose reconstructor should use the default values shown in Table 7.1 unless site research indicates that these assumptions are not warranted. For all times, the materials should be assumed to have a particle size distribution of 5 micron AMAD with a shape factor of 1.5.

Document No. Battelle-TBD-6000; PNWD-3738 R0
Revision No. F0 Effective Date: 12/13/2006 Page 43
Uranium oxides are formed in a variety of ways in metal-working plants, including scale formation on hot surfaces, oxidation enhanced by the presence of water, and fires involving chips and turnings. Thus all three of the compounds listed in Table 7.1 can be found in these facilities. The compounds are typically insoluble, primarily class S, but some class M material may be observed. The solubility rate and f1 should be chosen based on the organ of interest to be favorable to claimants.
The intake of radioactive material via inhalation depends on the characteristics of the worker, that is their breathing rate and the extent to which they breath through the mouth. IMBA does not calculate based on air concentrations, rather the dose reconstructor is required to calculate the intake from the breathing rate and the air concentration. Unless specified otherwise in the site specific guidance, the following worker characteristics should be assumed:
• Worker type: Light Worker
• Breathing Characteristics: Nasal Augmenter
• Breathing Rate: 1.2 m3/h or 9.6 m3/day
The intake is the product of the breathing rate, shown above, and the air concentration. Air concentrations are presented in the following sections.
7.1 Uranium
7.1.1 Uranium Bioassay
Bioassays were performed on workers at many sites, and urinalysis was the most effective method of determining an individual worker’s uranium intake. When bioassay data are available for individual workers, this should be the primary source of dose reconstruction for internal exposure.
7.1.2 Uranium Air Sampling
Air sampling was performed by the AEC at many of the AWE metal-working sites, and many of these results are presented in this document’s appendices. Harris and Kingsley (1959) summarized representative measurements for most of the processes performed by AWE metal-working facilities. These results are presented in this section and are available for use in dose reconstruction in situations where no site-specific information is available. These results are typical of the state of technology in the late 1950s, as surveyed by Harris and Kingsley. Results presented in this section always assumed the minimal use of mitigation technologies as published in Harris and Kingsley, so that for instance if results were presented for ventilated situations and non-ventilated, the non-ventilated are always presented here. In many cases the air concentrations are well above the MAC.
Some sites did not implement all the mitigation technologies represented in the survey and may have had higher air concentrations than those listed. If a site is found to have higher measured air concentrations, it would be appropriate to use the higher values for dose reconstruction.
For the air sampling data presented in this section, data are presented for individual worker positions, as listed in the Harris and Kingsley (1959) tables. When a claimant’s job category is known, the air

Document No. Battelle-TBD-6000; PNWD-3738 R0
Revision No. F0 Effective Date: 12/13/2006 Page 44
sampling data for the corresponding job category can be used for the dose reconstruction. Where the claimant’s job category is unknown or does not correspond to a listed category, the maximum air sampling data should be used.
For some of the measurements, the authors were not specific about the nature of the air concentrations, whether they were for a short time duration or a longer time-weighted average. It is assumed that they represent peak values that occurred during an operation. Thus they would need to be adjusted by the worker’s actual hours and proximity during a workday to estimate the actual time-weighted average exposure. Some values were daily-weighted averages, however, and could be used as DWA values for the worker exposure.
Air sampling data are presented as lognormal distributions. In the Harris and Kingsley (1959) tables, air concentrations were presented as either a single value or as a two-value range. If the air concentration was presented as a single value, this value was assumed to be the arithmetic mean, with an assumed geometric standard deviation (GSD) of 5 (Battelle Team 2006). The geometric mean can be calculated from the arithmetic mean and standard deviation. If the value was presented as a two-value range, the two values were assumed to be set about the geometric mean such that the geometric mean is equal to the square root of the product of the two values; this lognormal distribution is also assumed to have a GSD=5.
Table 7.2 shows air sampling data for workers who were involved in extrusion processes at AWE facilities. The air concentrations in this table assume that there was no ventilation and minimal use of dust mitigation procedures, so the air concentrations are expected to be among the highest experienced in extrusion facilities. The data presented by Harris and Kingsley were daily weighted averages.
Table 7.2 Air sampling data for facilities extruding uranium rods
Job Category
Measured air concentrations
(dpm/m3)
Geometric Mean
(dpm/m3) Salt-Bath Operator, DWA 11-90 31.5 Extrusion Press Operator, DWA
29-180 72.2
Die-head operator, DWA 410-2400 992 Weigh man, DWA 58-370 147 Operator DWA --- 992 General Laborer DWA --- 147 Supervisor DWA --- 73 Clerical DWA --- 7
For extrusion, the air concentration for the operator was taken as the die-head operator, since this position had the highest tabulated exposure.. The assumption for the general laborer is exposure to the “Weigh Man” concentration. For the supervisor, the DWA was assumed to be 50% of the general laborer, and the clerical worker 10% of the supervisor.
Air concentrations for rolling operations are presented in Table 7.3. These concentrations are instantaneous measured concentrations. The daily weighted average for the operator’s is assumed to be the measured air concentration for the roughing roll operator, with a 75% weighting factor assuming that 25% of the operator’s time was spent away from the high concentration. The general laborer’s DWA was derived from the stamper, applying a 75% time factor. The supervisor was assumed to be 50% of the general laborer, and the clerical worker 10% of the supervisor.

Document No. Battelle-TBD-6000; PNWD-3738 R0
Revision No. F0 Effective Date: 12/13/2006 Page 45
Table 7.3 Air sampling data for facilities rolling uranium rods
Job Category
Measured air concentrations
(dpm/m3)
Geometric Mean
(dpm/m3) Furnace Operator 180 80.5 Roughing Roll Operator 1620-13700 4710 Finishing Roll Operator 800-8400 2590 Cooling 1470 657 Stamper 1940 868 Drag Down Operator 730 327 Shear Man 1500 671 Operator DWA --- 3533 General Laborer DWA --- 651 Supervisor DWA --- 326 Clerical DWA --- 33
Table 7.4 shows air sampling data for facilities where forging of uranium was practiced. For the press forging operations, the measurements were short-duration samples. However, for the hammer forging air samples, the measured air concentrations were already identified by Harris and Kingsley as daily weighted averages. So the operator DWA was identified as the backside operator of hammer forging and the general laborer was identified as the “furnace operator and helper,” while the supervisor DWA was taken to be 50% of the general laborer’s DWA, and the clerical 10% of the supervisor.
Table 7.4 Air sampling data for facilities forging uranium
Job Category
Measured air concentrations
(dpm/m3)
Geometric Mean
(dpm/m3) Press Forging – Salt bath 1.7 0.8 Press forging – Press 16 7.2 Press forging – Quench tank 6.2 2.8 Hammer Forging – Front hammer operator, DWA
2480 1110
Hammer Forging – Backside hammer operator, DWA
2610 1170
Hammer Forging – Furnace operator and helper, DWA
810 362
Operator DWA --- 1170 General Laborer DWA --- 362 Supervisor DWA --- 181 Clerical DWA --- 18
Table 7.5 shows air sampling data for facilities where machining of uranium was practiced. For these air concentrations, it was assumed that there was no ventilation or other dust mitigation practices. Operations with ventilation would have produced much lower air concentrations. Air concentrations listed for machining operations were daily weighted averages. The operator DWA was assumed to equal the Centerless Grinder air concentration; with the general laborer having half of the operator’s DWA, the supervisor having half of the general laborer’s DWA, and the clerical worker 10% of the supervisor’s.

Document No. Battelle-TBD-6000; PNWD-3738 R0
Revision No. F0 Effective Date: 12/13/2006 Page 46
Table 7.5 Air sampling data for facilities machining uranium
Job Category
Measured air concentrations
(dpm/m3)
Geometric Mean
(dpm/m3) Automatic lathe, DWA 200-300 245 Turret lathe, DWA 150 67 Facing, DWA 100 45 Cutoff, DWA 100 45 Milling, DWA 100 45 Slotting, DWA 100 45 Drill, DWA 20 9 Radius Cutting, DWA 100-300 173 Milling, DWA 40 18 Shaping, DWA <10 4 Planing, DWA <10 4 Surface Grinder, DWA 2000-5000 3160 Portable Grinder, DWA 400 179 Belt Sander, DWA 3000 134 Centerless Grinder, DWA 5000-6000 5480 Straightening, DWA 1500-1900 1690 Operator DWA --- 5480 General Laborer DWA --- 2740 Supervisor DWA --- 1370 Clerical DWA --- 137
For job categories where the air concentration was listed as “<10” or “nil,” this analysis assumed that the average air concentration was 10 dpm/m3, which would give a geometric mean value of 4 and 95th
percentile of 63.
Table 7.6 shows air sampling data for facilities where uranium slugs were produced and canned. For these air concentrations, it was assumed that there was no ventilation or other dust mitigation practices. Operations with ventilation would have produced much lower air concentrations. The concentrations were short-duration measurements, so the operator’s concentration was assumed to correspond to the stamping slug category, with a 75% exposure time, and the general laborer, supervisor, and clerical DWA’s found from the operator’s value with the same ratios applied previously.
Table 7.6 Air sampling data for uranium slug production and canning
Job Category
Measured air concentrations
(dpm/m3)
Geometric Mean
(dpm/m3) Stamping slug 590 264 Filing slug 440 197 Wire-brush cleaning die section 260
116
Cleaning end slugs 220 98 Cleaning die liners 220 98 Operator DWA --- 198 General Laborer DWA --- 99

Document No. Battelle-TBD-6000; PNWD-3738 R0
Revision No. F0 Effective Date: 12/13/2006 Page 47
Measured air Geometric concentrations Mean
Job Category (dpm/m3) (dpm/m3) Supervisor DWA --- 50 Clerical DWA --- 5
Table 7.7 shows air sampling data for facilities where uranium scrap recovery operations were practiced. For these air concentrations, it was assumed that there was no ventilation or other dust mitigation practices. Operations with ventilation would have produced much lower air concentrations. The concentrations listed here were daily weighted averages, so the operator’s air concentration was taken as the value for straightening, and the other three job categories ratioed as before.
Table 7.7 Air sampling data for uranium scrap recovery
Job Category
Measured air concentrations
(dpm/m3)
Geometric Mean
(dpm/m3) Straightening, DWA 1500-1900 1690 Drawing, DWA nil 4 Swaging, DWA <10 4 Degreasing, DWA 260 116 Briquetting, DWA 250 112 Briquette discharge, DWA 600 268 Operator DWA --- 1690 General Laborer DWA --- 845 Supervisor DWA --- 423 Clerical DWA --- 42
7.1.3 Additional Assumptions for Assessing Internal Dose from Inhalation
In addition to the assumptions specified in the previous section, the following assumptions may be used by dose reconstructors when assessing internal dose from the inhalation of air containing uranium dust:
• Radionuclide Constituents: Most uranium handled in AWE metal-working sites was natural uranium. There may have been some operations where the uranium was either depleted or low-enriched, but in any case any air measurements were reported in units of dpm/m3 , so the measurements were based on activity, not mass. So it is valid to assume that for all intakes, the uranium consists solely of 234U.
• Recycled Uranium: There is the possibility that uranium processed after 1953 was recycled uranium, so for these time periods, in the absence of definitive information about the origin of the processed uranium, it should be assumed that the uranium contains the contaminants listed in Table 3.2.
• Operational Period, Workdays, Work hours: In most metal-working plants, AEC work with uranium was interspersed with similar work done with steel or other non-radioactive material, and in most plants only a small fraction of a year was devoted to AEC work. Each site should use its AWE operational history to estimate the number of hours worked each year on AWE-related work. However, a default assumption of 2000 hours per year, or 10 hours per day, could be made
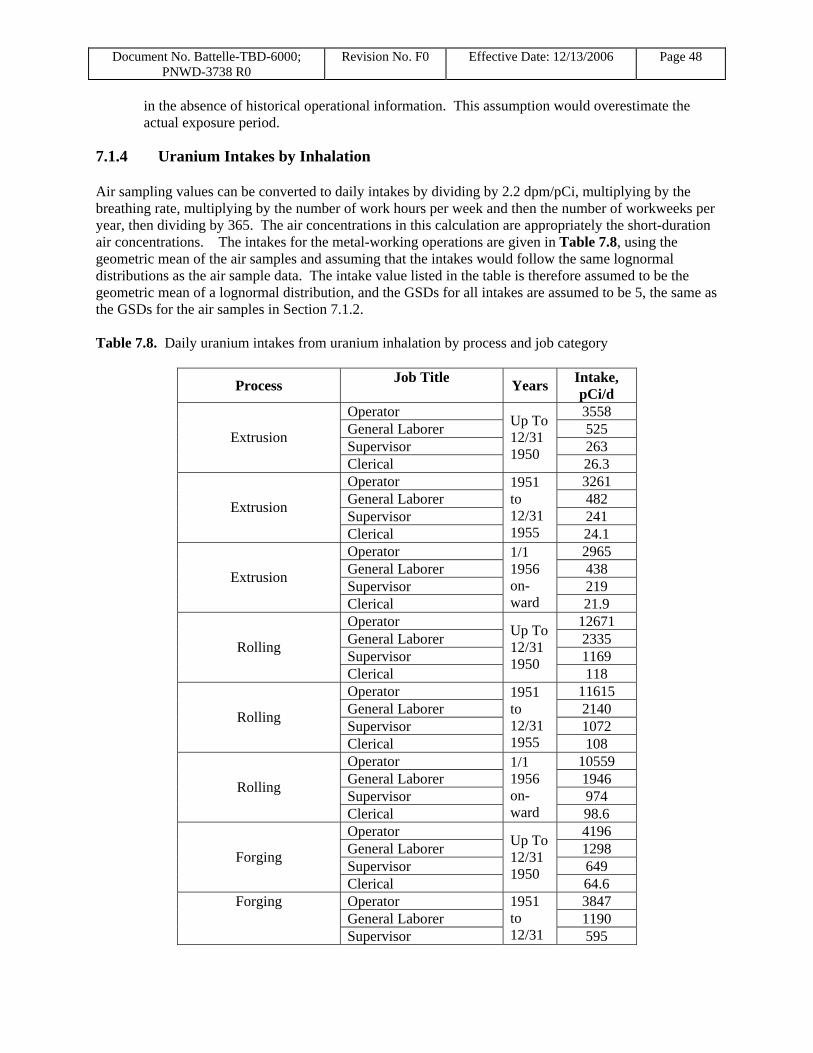
Document No. Battelle-TBD-6000; PNWD-3738 R0
Revision No. F0 Effective Date: 12/13/2006 Page 48
in the absence of historical operational information. This assumption would overestimate the actual exposure period.
7.1.4 Uranium Intakes by Inhalation
Air sampling values can be converted to daily intakes by dividing by 2.2 dpm/pCi, multiplying by the breathing rate, multiplying by the number of work hours per week and then the number of workweeks per year, then dividing by 365. The air concentrations in this calculation are appropriately the short-duration air concentrations. The intakes for the metal-working operations are given in Table 7.8, using the geometric mean of the air samples and assuming that the intakes would follow the same lognormal distributions as the air sample data. The intake value listed in the table is therefore assumed to be the geometric mean of a lognormal distribution, and the GSDs for all intakes are assumed to be 5, the same as the GSDs for the air samples in Section 7.1.2.
Table 7.8. Daily uranium intakes from uranium inhalation by process and job category
Process Job Title Years Intake, pCi/d
Extrusion
Operator Up To 12/31 1950
3558 General Laborer 525 Supervisor 263 Clerical 26.3
Extrusion
Operator 1951 to 12/31 1955
3261 General Laborer 482 Supervisor 241 Clerical 24.1
Extrusion
Operator 1/1 1956 onward
2965 General Laborer 438 Supervisor 219 Clerical 21.9
Rolling
Operator Up To 12/31 1950
12671 General Laborer 2335 Supervisor 1169 Clerical 118
Rolling
Operator 1951 to 12/31 1955
11615 General Laborer 2140 Supervisor 1072 Clerical 108
Rolling
Operator 1/1 1956 onward
10559 General Laborer 1946 Supervisor 974 Clerical 98.6
Forging
Operator Up To 12/31 1950
4196 General Laborer 1298 Supervisor 649 Clerical 64.6
Forging Operator 1951 to 12/31
3847 General Laborer 1190 Supervisor 595

Document No. Battelle-TBD-6000; PNWD-3738 R0
Revision No. F0 Effective Date: 12/13/2006 Page 49
Process Job Title Years Intake, pCi/d
Clerical 1955 59.2
Forging
Operator 1/1 1956 onward
3497 General Laborer 1082 Supervisor 541 Clerical 53.8
Machining
Operator Up To 12/31 1950
19654 General Laborer 9827 Supervisor 4914 Clerical 491
Machining
Operator 1951 to 12/31 1955
18016 General Laborer 9008 Supervisor 4504 Clerical 450
Machining
Operator 1/1 1956 onward
16379 General Laborer 8189 Supervisor 4095 Clerical 409
Slug Production
Operator Up To 12/31 1950
710 General Laborer 355 Supervisor 179 Clerical 17.9
Slug Production
Operator 1951 to 12/31 1955
651 General Laborer 325 Supervisor 164 Clerical 16.4
Slug Production
Operator 1/1 1956 onward
592 General Laborer 296 Supervisor 149 Clerical 14.9
Scrap Recovery
Operator Up To 12/31 1950
6061 General Laborer 3031 Supervisor 1515 Clerical 152
Scrap Recovery
Operator 1951 to 12/31 1955
5556 General Laborer 2778 Supervisor 1389 Clerical 139
Scrap Recovery
Operator 1/1 1956 onward
5051 General Laborer 2526 Supervisor 1263 Clerical 126.3
7.1.5 Resuspension During Periods with no Uranium Operations
There was a potential for internal exposure to resuspended material from the AEC work during non-AEC operations following soon after the actual operations. To estimate exposure from resuspended materials,

Document No. Battelle-TBD-6000; PNWD-3738 R0
Revision No. F0 Effective Date: 12/13/2006 Page 50
this analysis assumed that surfaces in the building became contaminated by deposition of uranium dust during metal-working operations. (ORAUT 2005c) estimates that for uranium metal-working operations, a reasonable maximum time-weighted average air concentration would be 7000 dpm/m3 (equal to 100 MAC) during AEC operations.
The level of contamination was determined by multiplying the air concentration of 7000 dpm/m3 by the indoor deposition velocity and the assumed deposition time, which for uranium was 20 hr per operating day. The indoor deposition velocity is dependent on the physical properties of the room (air viscosity and density, turbulence, thermal gradients, surface geometry, etc.). It is also dependent on the physical properties of the aerosol particles (such as diameter, shape, and density). These characteristics are not known, so the terminal settling velocity was calculated for an aerosol with the default particle size distribution of 5-µm activity median aerodynamic diameter. The calculated terminal settling velocity was 7.5 × 10⁻⁴ m/s, which is within the range of deposition velocities (2.7 × 10⁻⁶ to 2.7 × 10⁻³ m/s) measured in various studies (NRC 2002a).
The calculated surface contamination level created from airborne dusts during a 1-year period of uranium metal-working operations would be 3.44×10⁷ pCi/m2 . This level of surface contamination assumes that all uranium deposited on the floor was present for the entire period of AEC operations. Therefore, using a resuspension factor of 1×10⁻⁶/m (NRC 2002b), the air concentration due to resuspension would be 34.4 pCi/m3 .
The annual inhalation intake received from resuspension of deposited material, assuming 10-hour workdays and the worst-case air concentrations for a one-year metal-working operation, would be 413 pCi/day.
7.1.6 Ingestion
In the case where inhalation intakes are calculated from air concentrations, ingestion intakes are also to be considered. Neton (NIOSH 2004) indicates that the ingestion rate, in terms of pCi for an 8-hour workday, can be estimated by multiplying the air concentration by a factor of 0.0985.
The ingestion rate must be adjusted for the fact that IMBA assumes chronic intakes, even during weekends, and that the number of hours worked in a year changed over time (Strom 2006). These adjustments result in an IMBA chronic intake rate I IMBA = 3.373×10⁻⁵ Ah , where IIMBA is the daily intake (pCi/d), A is the median air concentration (pCi/m3), and h is the number of hours in a working year.
Making similar adjustments to Neton’s (NIOSH 2004) equations for incidental hand-to-mouth ingestion the chronic IMBA daily intake rate is I IMBA = 3.425×10⁻⁵ Ah , where IIMBA is the daily chronic intake rate (pCi/d), h is the number of hours in a work year, and A is the median dust concentration (pCi/m3).
The total ingestion rate is the sum of the food contamination and incidental hand-to-mouth ingestion rates. Incorporating a conversion factor of (1 pCi per 2.22 dpm) gives a I IMBA = 3.062 ×10⁻⁵ Ah where the air concentration is given in units of dpm/m3 and the daily intake is in units of pCi/d. Intakes for the metal processes are given in Table 7.9. Intake values are assumed to be the geometric mean of a lognormal distribution with a GSD of 5.
Table 7.9. Daily uranium intakes from uranium ingestion by process and job category

Document No. Battelle-TBD-6000; PNWD-3738 R0
Revision No. F0 Effective Date: 12/13/2006 Page 51
Process Job Title Years
Ingestion Intake, pCi/d
Extrusion
Operator Up To 12/31 1950
73 General Laborer 10.8 Supervisor 5.4 Clerical 0.5
Extrusion
Operator 1951 to 12/31 1955
67 General Laborer 9.9 Supervisor 4.9 Clerical 0.5
Extrusion
Operator 1/1 1956 onward
61 General Laborer 9.0 Supervisor 4.5 Clerical 0.4
Rolling
Operator Up To 12/31 1950
260 General Laborer 48 Supervisor 24 Clerical 2.4
Rolling
Operator 1951 to 12/31 1955
238 General Laborer 44 Supervisor 22 Clerical 2.2
Rolling
Operator 1/1 1956 onward
216 General Laborer 40 Supervisor 20 Clerical 2.0
Forging
Operator Up To 12/31 1950
86 General Laborer 27 Supervisor 13 Clerical 1.3
Forging
Operator 1951 to 12/31 1955
86 General Laborer 27 Supervisor 13 Clerical 1.3
Forging
Operator 1/1 1956 onward
79 General Laborer 24 Supervisor 12 Clerical 1.2
Machining
Operator Up To 12/31 1950
403 General Laborer 201 Supervisor 101 Clerical 10.1
Machining
Operator 1951 to 12/31 1955
369 General Laborer 185 Supervisor 92 Clerical 9.2
Machining Operator 1/1 1956
336 General Laborer 168

Document No. Battelle-TBD-6000; PNWD-3738 R0
Revision No. F0 Effective Date: 12/13/2006 Page 52
Process Job Title Years
Ingestion Intake, pCi/d
Supervisor onward
84 Clerical 8.4
Slug Production
Operator Up To 12/31 1950
15 General Laborer 7.3 Supervisor 3.7 Clerical 0.4
Slug Production
Operator 1951 to 12/31 1955
13 General Laborer 6.7 Supervisor 3.4 Clerical 0.3
Slug Production
Operator 1/1 1956 onward
12 General Laborer 6.1 Supervisor 3.1 Clerical 0.3
Scrap Recovery
Operator Up To 12/31 1950
124 General Laborer 62 Supervisor 31 Clerical 3.1
Scrap Recovery
Operator 1951 to 12/31 1955
114 General Laborer 57 Supervisor 28 Clerical 2.8
Scrap Recovery
Operator 1/1 1956 onward
103 General Laborer 52 Supervisor 26 Clerical 2.6
7.2 Thorium
[Reserved]

Document No. Battelle-TBD-6000; PNWD-3738 R0
Revision No. F0 Effective Date: 12/13/2006 Page 53
8.0 References
AEC (U.S. Atomic Energy Commission). 1949. Simonds Saw & Steel Co. Summary Report of Three Surveys (Oct. 27, 1948 – Feb. 15, 1949), 1949. [pp. 249–254 of Simonds Saw and Steel Company.pdf; Reference ID #11996]
American Nuclear Society Standards Committee Working Group ANS-6.1.1. 1977. American National Standard for Neutron and Gamma-Ray Fluence-to-Dose Factors. ANSI/ANS 6.1.1-N666 (LaGrange Park, IL: American Nuclear Society).
Archives of Environmental Health, Vol 1, November, 1960. pp 74-96.
Anderson, JL and Hertel, NE. 2005. “Bremsstrahlung doses from natural uranium ingots”. Radiation Protection Dosimetry. Vol. 115, No. 1-4:298-301.
Battelle Team. 2006. Default Assumptions and Methods for AWE Dose Reconstructions, Technical Information Bulletin, Battelle-TIB-5000, Revision A.12, September 2006.
Christofano, E and WB Harris. 1960. “The Industrial Hygiene of Uranium Refining.”
Coleman, R. L., Hudson, C. G., and Plato, P. A., 1983, “Depth-dose curves for 90Sr and natural and depleted uranium in mylar,” Health Physics, 44(4): 395-402.
DOE (U.S. Department of Energy). 2004. Guide of Good Practices for Occupational Radiological Protection in Uranium Facilities. DOE-STD-1136-2004, December.
Eidson, A. F., 1994, “The effect of solubility on inhaled uranium compound clearance: A review,” Health Physics, volume 67, number 1, pp. 1–14.
EPA (U.S. Environmental Protection Agency). 1993. External Exposure to Radionuclides in Air, Water, and Soil. Federal Guidance Report-12, Washington DC, September 1993.
EPA (Environmental Protection Agency). 2002. Federal Guidance Report 13. Cancer Risk Coefficients for Environmental Exposure to Radionuclides: CD Supplement, EPA-402-C-99-001, Rev. 1. U.S. Environmental Protection Agency, Washington, DC.
Grove Engineering. 2003. MicroShield Software Program, Version 6.02. Copyright 1992-2003.
Harris, WB and I Kingsley. 1959. “The Industrial Hygiene of Uranium Fabrication.” A.M.A. Archives of Industrial Health, Vol 19, May 1959. pp 76-101.
Heffernan, T. E., J. C. Lodwick, H. Spitz, J. Neton, and M. Soldano, 2001, “Solubility of airborne uranium compounds at the Fernald Environmental Management Project,” Health Physics, volume 80, number 3, pp. 255–262.
ICRP (International Commission on Radiological Protection), 1994, Human Respiratory Tract Model for Radiological Protection, Publication 66, Pergamon Press, Oxford, England.

Document No. Battelle-TBD-6000; PNWD-3738 R0
Revision No. F0 Effective Date: 12/13/2006 Page 54
ICRP (International Commission on Radiological Protection), 1995, Age-Dependent Doses to Members of the Public from Intake of Radionuclides: Part 4 Inhalation Dose Coefficients, Publication 71, Pergamon Press, Oxford, England.
Kathren, R. L., V. E. Shockley, E. M. Thomas, and T. D. Taulbee. 2003. Technical Information Bulletin: Dose Reconstruction from Occupationally Related Diagnostic X-ray Procedures, ORAUT-OTIB-0006, Rev. 2, NIOSH Dose Reconstruction Project, Cincinnati, Ohio.
Kocher DC. 1981. Radioactive Decay Data Tables. DOE/TIC-11026, National Technical Information Service, Springfield, Virginia.
Neton JW. 2004. Estimation of Ingestion Intakes. OCAS-TIB-009, NIOSH Office of Compensation Analysis and Support, Cincinnati, Ohio.
NIOSH (National Institute for Occupational Safety and Health). 2002. External Dose Reconstruction Implementation Guideline, OCAS-IG-001, Rev. 1 Office of Compensation Analysis and Support, Cincinnati, Ohio.
NIOSH (National Institute for Occupational Safety and Health), 2004. Estimation of Ingestion Intakes, Technical Information Bulletin, OCAS-TIB-009, Revision 0, Office of Compensation Analysis and Support, Cincinnati, Ohio, April 13.
NRC (U.S. Nuclear Regulatory Commission), 2002a. Technical Basis for Calculating Radiation Doses for the Building Occupancy Scenario Using the Probabilistic RESRAD-BUILD 3.0 Code, NUREG/CR6755, Washington, D.C.
NRC (U.S. Nuclear Regulatory Commission). 2002b. Re-Evaluation of the Indoor Resuspension Factor for the Screening Analysis of the Building Occupancy Scenario for NRC’s License Termination Rule, NUREG-1720; Draft Report for Comment, Washington, D.C.
ORAUT (Oak Ridge Associated Universities Team). 2004. Technical Basis Document: Basis for Development of an Exposure Matrix for Bethlehem Steel Corporation, Lackawanna, New York: Period of Operation: 1949-1952. ORAUT-TKBS-0001, Revision 01, Cincinnati, Ohio.
ORAUT (Oak Ridge Associated Universities Team). 2005a. Site Profile for Simonds Saw and Steel. ORAUT-TKBS-0032, July 2005.
ORAUT (Oak Ridge Associated Universities Team). 2005b. An Exposure Matrix for Superior Steel, Carnegie, Pennsylvania. ORAUT-TKBS-0034, August 2005.
ORAUT (Oak Ridge Associated Universities Team). 2005c. Estimating the Maximum Plausible Dose to Workers at Atomic Weapons Employer Facilities. ORAUT-OTIB-0004, November 2005.
ORAUT (Oak Ridge Associated Universities Team). 2005d. Dose Reconstruction from Occupationally Related Diagnostic X-Ray Procedures. ORAUT-OTIB-0006, December 2005.
ORAUT (Oak Ridge Associated Universities Team). 2005e. Basis for Development of an Exposure Matrix for the Mallinckrodt Chemical Company St. Louis Downtown Site and the St Louis Airport Site, St. Louis, Missouri, Period of Operation: 1942–1958. ORAUT-TKBS-0005, March 2005.

Document No. Battelle-TBD-6000; PNWD-3738 R0
Revision No. F0 Effective Date: 12/13/2006 Page 55
Pelowitz, DB (editor). 2005. MCNPX™ Users Manual, Version 2.5.0. LA-CP-05-0369, Los Alamos National Laboratory, Los Alamos, NM.
Simonds Saw & Steel. 1948. Hazard Identification, Evaluation, and Mitigation, 1948. [pp. 461-464 of Simonds Saw and Steel Company.pdf; Reference ID #11996]
U.S. Army, 1989, Handbook of Safety Procedures for Processing Depleted Uranium, Chapter 3, “Safety Considerations for Processing, Handling, and Testing of DU Components”, AMC HDBK 385-1.1-89, Department of Defense.
Wilson, WB., RT Perry, WS Charlton, TA Parish, GP Estes, TH Brown, ED Arthur, M Bozoian, TR England, DG Madland and JE Stewart. 1999. Sources 4A: A code for Calculating (α-n), Spontaneous Fission, and Delayed Neutron Sources and Spectra. LA-13639-MS, Los Alamos National Laboratory, Los Alamos, NM.

Document No. Battelle-TBD-6000; PNWD-3738 R0
Revision No. F0 Effective Date: 12/13/2006 Page 56
9.0 Glossary

Document No. ORAUT-TKBS-00xx-x Revision No. 00-F Effective Date: 01/25/2006 Page 57