batool a haider, ibironke olofin, molin wang, donna ... · page 1 of 43 anaemia, prenatal iron use,...
TRANSCRIPT

Page 1 of 43
Anaemia, prenatal iron use, and risk of adverse pregnancy outcomes: systematic review and meta-
analysis
Batool A Haider, Ibironke Olofin, Molin Wang, Donna Spiegelman, Majid Ezzati, Wafaie W Fawzi, on behalf
of Nutrition Impact Model Study Group (anaemia)
Supplementary figures 1-41

Page 2 of 43
Contents: Page number 1. Supplementary fig 1. Forest plot of iron use on mean haemoglobin in postpartum period 3
2. Supplementary fig 2. Forest plot of iron use on mean haemoglobin in second trimester 4
3. Supplementary fig 3. Forest plot of iron use on maternal anaemia in third trimester or
at delivery 5
4. Supplementary fig 4. Funnel plot of maternal anaemia in third trimester or at delivery 6
5. Supplementary fig 5. Forest plot of iron use on iron deficiency 7
6. Supplementary fig 6. Forest plot of iron use on iron deficiency anaemia 8
7. Supplementary fig 7. Forest plot of iron use on birth weight 9
8. Supplementary fig 8. Forest plot of iron use on preterm birth 10
9. Supplementary fig 9. Forest plot of iron use on duration of gestation 11
10. Supplementary fig 10. Forest plot of iron use on SGA birth 12
11. Supplementary fig 11. Forest plot of iron use on birth length 13
12. Supplementary fig 12. Exposure-response relationship between iron dose and
maternal anaemia 14
13. Supplementary fig 13. Exposure-response relationship between iron dose up to 66 mg/day
and maternal anaemia 15
14. Supplementary fig 14. Exposure-response relationship between iron dose up to 66 mg/day
and low birth weight risk 16
15. Supplementary fig 15. Exposure-response relationship between iron dose up to 66 mg/day
and birth weight 17
16. Supplementary fig 16. Exposure-response relationship of haemoglobin difference with
birth weight 18
17. Supplementary fig 17. Exposure-response relationship of haemoglobin difference with
low birth weight risk 19
18. Supplementary fig 18. Exposure-response relationship of haemoglobin difference with
preterm birth risk 20
19. Supplementary fig 19. Forest plot of iron only on mean haemoglobin concentration in third
trimester or at delivery 21
20. Supplementary fig 20. Forest plot of iron only on mean haemoglobin concentration in
postpartum period 22
21. Supplementary fig 21. Forest plot of iron only on maternal anaemia 23
22. Supplementary fig 22. Forest plot of iron only on iron deficiency 24
23. Supplementary fig 23. Forest plot of iron only on iron deficiency anaemia 25
24. Supplementary fig 24. Forest plot of iron only on birth weight 26
25. Supplementary fig 25. Forest plot of iron only on low birth weight 27
26. Supplementary fig 26. Forest plot of iron only on duration of gestation 28
27. Supplementary fig 27. Forest plot of iron only on preterm birth 29
28. Supplementary fig 28. Forest plot of iron only on SGA 30
29. Supplementary fig 29. Forest plot of iron only on birth length 31
30. Supplementary fig 30. Forest plot of iron with folic acid on mean haemoglobin concentration
in third trimester or at delivery 32
31. Supplementary fig 31. Forest plot of iron with folic acid on maternal anaemia in third trimester
or at delivery 33
32. Supplementary fig 32. Forest plot of maternal anaemia on low birth weight (crude estimates) 34
33. Supplementary fig 33. Forest plot of maternal anaemia on low birth weight (adjusted estimates) 35
34. Supplementary fig 34. Forest plot of maternal anaemia on preterm birth (crude estimates) 36
35. Supplementary fig 35. Forest plot of maternal anaemia on preterm birth (adjusted estimates) 37
36. Supplementary fig 36. Forest plot of maternal anaemia on stillbirth (crude estimates) 38
37. Supplementary fig 37. Forest plot of maternal anaemia on duration of gestation 39
38. Supplementary fig 38. Forest plot of maternal anaemia on birth weight 40
39. Supplementary fig 39. Forest plot of maternal anaemia on SGA (crude estimates) 41
40. Supplementary fig 40. Forest plot of maternal anaemia on SGA (adjusted estimates) 42
41. Supplementary fig 41. Forest plot of maternal anaemia on perinatal mortality (crude estimates) 43

Page 3 of 43
Supplementary fig 1. Forest plot of iron use on mean haemoglobin in postpartum period
I-V Overall (I-squared = 0.0%, p = 1.000)
Cantlie 1971
Dawson 1989
Tura 1989 a
D+L Overall
Buytaert 1983
studyid
Lee 2005 a
Christian 2003
Butler 1968
Milman 1991
Taylor 1982
Eskeland 1997 b
Wallenburg 1984
Menendez 1994
6.79 (0.22, 13.36)
14.00 (-80.41, 108.41)
3.34 (-23.66, 30.34)
2.00 (-24.45, 28.45)
6.79 (0.22, 13.36)
-3.22 (-82.75, 76.31)
WMD (95% CI)
10.00 (-29.39, 49.39)
10.00 (-0.33, 20.33)
1.49 (-61.04, 64.02)
5.30 (-42.95, 53.55)
3.40 (-66.62, 73.42)
4.00 (-74.36, 82.36)
0.00 (-93.78, 93.78)
5.00 (-5.59, 15.59)
100.00
0.48
Weight
5.92
6.17
0.68
(I-V)
2.78
%
40.47
1.10
1.85
0.88
0.70
0.49
38.45
6.79 (0.22, 13.36)
14.00 (-80.41, 108.41)
3.34 (-23.66, 30.34)
2.00 (-24.45, 28.45)
6.79 (0.22, 13.36)
-3.22 (-82.75, 76.31)
WMD (95% CI)
10.00 (-29.39, 49.39)
10.00 (-0.33, 20.33)
1.49 (-61.04, 64.02)
5.30 (-42.95, 53.55)
3.40 (-66.62, 73.42)
4.00 (-74.36, 82.36)
0.00 (-93.78, 93.78)
5.00 (-5.59, 15.59)
100.00
0.48
Weight
5.92
6.17
0.68
(I-V)
2.78
%
40.47
1.10
1.85
0.88
0.70
0.49
38.45
Intervention decreases Hb level Intervention increases Hb level 0-10 0 10

Page 4 of 43
Supplementary fig 2. Forest plot of iron use on mean haemoglobin in second trimester
I-V Overall (I-squared = 0.0%, p = 0.988)
Simmons 1993
D+L Overall
Harvey 2007
Lee 2005 b
Dawson 1989
Barton 1994
Lee 2005 a
Milman 1991
Ziaei 2008
studyid
-0.23 (-12.18, 11.72)
6.10 (-37.06, 49.26)
-0.23 (-12.18, 11.72)
6.00 (-113.35, 125.35)
-5.00 (-28.43, 18.43)
3.34 (-23.66, 30.34)
10.10 (-25.86, 46.06)
-10.00 (-36.81, 16.81)
2.50 (-36.27, 41.27)
9.80 (-41.82, 61.42)
WMD (95% CI)
100.00
Weight
7.66
1.00
26.00
19.58
11.04
19.86
9.50
5.36
(I-V)
%
-0.23 (-12.18, 11.72)
6.10 (-37.06, 49.26)
-0.23 (-12.18, 11.72)
6.00 (-113.35, 125.35)
-5.00 (-28.43, 18.43)
3.34 (-23.66, 30.34)
10.10 (-25.86, 46.06)
-10.00 (-36.81, 16.81)
2.50 (-36.27, 41.27)
9.80 (-41.82, 61.42)
WMD (95% CI)
100.00
Weight
7.66
1.00
26.00
19.58
11.04
19.86
9.50
5.36
(I-V)
%
Intervention decreases Hb level Intervention increases Hb level
0-10 0 10

Page 5 of 43
Supplementary fig 3. Forest plot of iron use on maternal anaemia in third trimester or at delivery
I-V Overall (I-squared = 82.9%, p = 0.000)
Zeng 2008
Sood 1975 b
Cogswell 2003
Sood 1975 a
D+L Overall
Romslo 1983
Holly 1955
Makrides 2003
Batu 1976
Ndyomugyenyi 2000
studyid
Puolakka 1980
Preziosi 1997
Siega-Riz 2006
Chisholm 1966
Pritchard 1958
De Benaze 1989
Liu 1996
Milman 1991
Charoenlarp 1988
Christian 2003
Eskeland 1997 b
0.67 (0.64, 0.70)
0.74 (0.70, 0.79)
0.72 (0.65, 0.81)
0.75 (0.35, 1.59)
0.66 (0.56, 0.80)
0.50 (0.42, 0.59)
0.15 (0.02, 1.12)
0.03 (0.00, 0.18)
0.45 (0.25, 0.82)
0.50 (0.35, 0.71)
0.65 (0.47, 0.90)
ES (95% CI)
0.07 (0.00, 1.15)
0.59 (0.45, 0.77)
1.11 (0.71, 1.71)
0.16 (0.08, 0.33)
0.17 (0.08, 0.39)
0.21 (0.06, 0.73)
0.36 (0.25, 0.52)
0.09 (0.02, 0.38)
0.46 (0.37, 0.57)
0.46 (0.37, 0.57)
0.06 (0.00, 1.00)
100.00
54.69
18.30
Weight
0.38
%
6.61
0.05
0.05
0.58
1.67
2.03
(I-V)
0.03
2.98
1.10
0.43
0.31
0.14
1.63
0.11
4.31
4.57
0.03
Intervention decreases anaemia risk Intervention increases anaemia risk
1.1 1 5

Page 6 of 43
Supplementary fig 4. Funnel plot of maternal anaemia in third trimester or at delivery
0.5
11.
5
s.e.
of l
ogrr
-4 -2 0 2logrr
Funnel plot with pseudo 95% confidence limits

Page 7 of 43
Supplementary fig 5. Forest plot of iron use on iron deficiency
I-V Overall (I-squared = 79.4%, p = 0.000)
Romslo 1983
studyid
Siega-Riz 2006
Tura 1989 a
Preziosi 1997
Falahi 2011
D+L Overall
Milman 1991
Makrides 2003
Cogswell 2003
0.73 (0.66, 0.82)
0.06 (0.01, 0.38)
ES (95% CI)
0.81 (0.65, 1.02)
0.92 (0.73, 1.17)
0.34 (0.21, 0.54)
0.35 (0.16, 0.78)
0.59 (0.44, 0.79)
0.16 (0.04, 0.71)
0.60 (0.48, 0.76)
0.87 (0.69, 1.08)
100.00
0.33
(I-V)
22.95
22.45
5.42
1.97
Weight
0.57
22.43
23.89
%
0.73 (0.66, 0.82)
0.06 (0.01, 0.38)
ES (95% CI)
0.81 (0.65, 1.02)
0.92 (0.73, 1.17)
0.34 (0.21, 0.54)
0.35 (0.16, 0.78)
0.59 (0.44, 0.79)
0.16 (0.04, 0.71)
0.60 (0.48, 0.76)
0.87 (0.69, 1.08)
100.00
0.33
(I-V)
22.95
22.45
5.42
1.97
Weight
0.57
22.43
23.89
%
Intervention decreases risk Intervention increases risk 1.1 1 5

Page 8 of 43
Supplementary fig 6. Forest plot of iron use on iron deficiency anaemia
I-V Overall (I-squared = 32.5%, p = 0.180)
Meier 2003 b
Siega-Riz 2006
Cogswell 2003
Makrides 2003
Christian 2003
Meier 2003 a
Milman 1991
studyid
D+L Overall
0.40 (0.29, 0.54)
0.47 (0.16, 1.44)
0.69 (0.33, 1.43)
0.61 (0.32, 1.15)
0.28 (0.12, 0.68)
0.28 (0.17, 0.47)
0.17 (0.02, 1.32)
0.06 (0.00, 0.93)
ES (95% CI)
0.40 (0.26, 0.60)
100.00
7.76
18.03
23.44
12.08
35.21
2.28
1.20
(I-V)
Weight
%
0.40 (0.29, 0.54)
0.47 (0.16, 1.44)
0.69 (0.33, 1.43)
0.61 (0.32, 1.15)
0.28 (0.12, 0.68)
0.28 (0.17, 0.47)
0.17 (0.02, 1.32)
0.06 (0.00, 0.93)
ES (95% CI)
0.40 (0.26, 0.60)
100.00
7.76
18.03
23.44
12.08
35.21
2.28
1.20
(I-V)
Weight
%
Intervention decreases risk Intervention increases risk
1.1 1 5

Page 9 of 43
Supplementary fig 7. Forest plot of iron use on birth weight
I-V Overall (I-squared = 98.9%, p = 0.000)
Sood 1975 b
Makrides 2003
Cogswell 2003
Falahi 2011
Menendez 1994
Taylor 1982
Bloxam 1989
Ziaei 2007
Harvey 2007
Puolakka 1980
Ndyomugyenyi 2000
Zeng 2008
Preziosi 1997
Dawson 1989
Siega-Riz 2006
Ouladsahebmadarek 2011
Christian 2003
D+L Overall
Sood 1975 a
Chan 2009
studyid
Eskeland 1997 b
45.95 (41.95, 49.96)
30.08 (3.43, 56.73)
-43.00 (-65.21, -20.79)
205.00 (172.52, 237.48)
40.00 (6.05, 73.95)
87.00 (67.71, 106.29)
-32.00 (-78.91, 14.91)
470.00 (436.07, 503.93)
10.00 (-4.01, 24.01)
-100.00 (-220.26, 20.26)
-300.00 (-373.90, -226.10)
86.00 (66.36, 105.64)
20.20 (12.36, 28.04)
30.00 (2.07, 57.93)
-220.00 (-241.79, -198.21)
108.00 (83.20, 132.80)
43.22 (29.94, 56.50)
65.00 (52.44, 77.56)
41.21 (1.20, 81.23)
71.00 (28.44, 113.56)
95.40 (85.79, 105.01)
WMD (95% CI)
78.90 (24.45, 133.35)
100.00
2.26
3.26
1.52
1.39
%
4.32
0.73
1.40
8.19
0.11
0.29
4.17
26.16
Weight
2.06
3.39
2.61
9.11
10.19
0.89
17.40
(I-V)
0.54
Intervention decreases birth weight Intervention increases birth weight
0-10010
Page 10 of 43
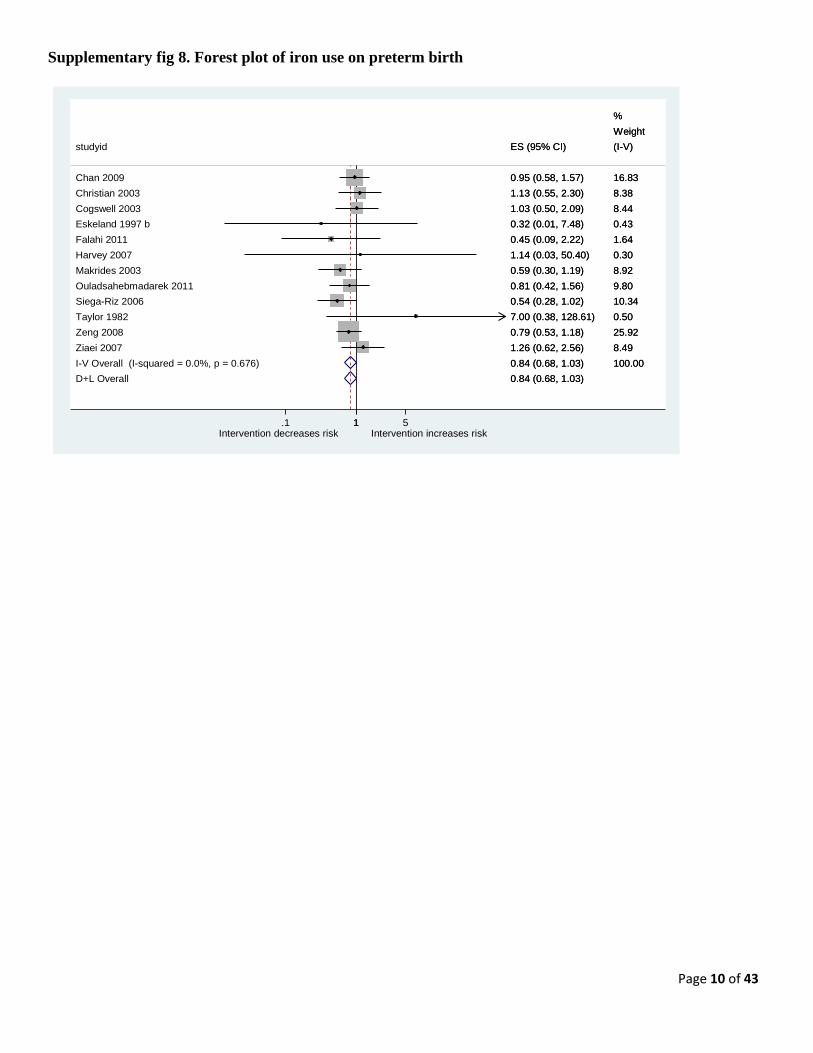
Supplementary fig 8. Forest plot of iron use on preterm birth
I-V Overall (I-squared = 0.0%, p = 0.676)
D+L Overall
Cogswell 2003
Makrides 2003
Taylor 1982
studyid
Siega-Riz 2006
Ouladsahebmadarek 2011
Chan 2009
Harvey 2007
Falahi 2011
Ziaei 2007
Christian 2003
Eskeland 1997 b
Zeng 2008
0.84 (0.68, 1.03)
0.84 (0.68, 1.03)
1.03 (0.50, 2.09)
0.59 (0.30, 1.19)
7.00 (0.38, 128.61)
ES (95% CI)
0.54 (0.28, 1.02)
0.81 (0.42, 1.56)
0.95 (0.58, 1.57)
1.14 (0.03, 50.40)
0.45 (0.09, 2.22)
1.26 (0.62, 2.56)
1.13 (0.55, 2.30)
0.32 (0.01, 7.48)
0.79 (0.53, 1.18)
100.00
%
Weight
8.44
8.92
0.50
(I-V)
10.34
9.80
16.83
0.30
1.64
8.49
8.38
0.43
25.92
0.84 (0.68, 1.03)
0.84 (0.68, 1.03)
1.03 (0.50, 2.09)
0.59 (0.30, 1.19)
7.00 (0.38, 128.61)
ES (95% CI)
0.54 (0.28, 1.02)
0.81 (0.42, 1.56)
0.95 (0.58, 1.57)
1.14 (0.03, 50.40)
0.45 (0.09, 2.22)
1.26 (0.62, 2.56)
1.13 (0.55, 2.30)
0.32 (0.01, 7.48)
0.79 (0.53, 1.18)
100.00
%
Weight
8.44
8.92
0.50
(I-V)
10.34
9.80
16.83
0.30
1.64
8.49
8.38
0.43
25.92
Intervention decreases risk Intervention increases risk 1.1 1 5

Page 11 of 43
Supplementary fig 9. Forest plot of iron use on duration of gestation
I-V Overall (I-squared = 0.0%, p = 1.000)
Meier 2003 a
Siega-Riz 2006
Falahi 2011
Zeng 2008
studyid
Ziaei 2007
Ouladsahebmadarek 2011
Meier 2003 b
Dawson 1989
Makrides 2003
D+L Overall
Chan 2009
Bloxam 1989
0.11 (-0.35, 0.57)
0.10 (-7.43, 7.63)
0.10 (-15.23, 15.43)
0.10 (-13.18, 13.38)
0.21 (-0.95, 1.37)
WMD (95% CI)
0.00 (-6.78, 6.78)
0.04 (-1.52, 1.60)
-0.30 (-6.92, 6.32)
0.00 (-25.37, 25.37)
0.20 (-11.34, 11.74)
0.11 (-0.35, 0.57)
0.10 (-0.43, 0.63)
0.00 (-4.34, 4.34)
100.00
0.37
0.09
0.12
15.41
(I-V)
0.45
8.62
0.48
0.03
0.16
Weight
73.17
%
1.11
0.11 (-0.35, 0.57)
0.10 (-7.43, 7.63)
0.10 (-15.23, 15.43)
0.10 (-13.18, 13.38)
0.21 (-0.95, 1.37)
WMD (95% CI)
0.00 (-6.78, 6.78)
0.04 (-1.52, 1.60)
-0.30 (-6.92, 6.32)
0.00 (-25.37, 25.37)
0.20 (-11.34, 11.74)
0.11 (-0.35, 0.57)
0.10 (-0.43, 0.63)
0.00 (-4.34, 4.34)
100.00
0.37
0.09
0.12
15.41
(I-V)
0.45
8.62
0.48
0.03
0.16
Weight
73.17
%
1.11
Intervention decreases gest age Intervention increases gest age 0-10 -5 0 5 10

Page 12 of 43
Supplementary fig 10. Forest plot of iron use on SGA birth
I-V Overall (I-squared = 59.4%, p = 0.016)
D+L Overall
Zeng 2008
Dawson 1989
Siega-Riz 2006
Christian 2003
Ouladsahebmadarek 2011
Cogswell 2003
Ziaei 2007
Chan 2009
studyid
0.90 (0.83, 0.98)
0.85 (0.67, 1.07)
1.04 (0.66, 1.63)
1.05 (0.02, 50.43)
0.70 (0.39, 1.25)
0.91 (0.83, 1.00)
0.81 (0.58, 1.12)
0.39 (0.17, 0.86)
1.53 (1.03, 2.26)
0.48 (0.26, 0.87)
ES (95% CI)
100.00
3.46
Weight
0.05
2.07
80.23
6.58
1.10
4.55
1.96
(I-V)
%
0.90 (0.83, 0.98)
0.85 (0.67, 1.07)
1.04 (0.66, 1.63)
1.05 (0.02, 50.43)
0.70 (0.39, 1.25)
0.91 (0.83, 1.00)
0.81 (0.58, 1.12)
0.39 (0.17, 0.86)
1.53 (1.03, 2.26)
0.48 (0.26, 0.87)
ES (95% CI)
100.00
3.46
Weight
0.05
2.07
80.23
6.58
1.10
4.55
1.96
(I-V)
%
Intervention decreases risk Intervention increases risk
1.1 1 5

Page 13 of 43
Supplementary fig 11. Forest plot of iron use on birth length
I-V Overall (I-squared = 0.0%, p = 0.763)
Eskeland 1997 b
D+L Overall
Meier 2003 a
studyid
Cogswell 2003
Zeng 2008
Preziosi 1997
Christian 2003
Falahi 2011
Makrides 2003
Meier 2003 b
-1.08 (-4.96, 2.80)
0.00 (-24.10, 24.10)
-1.08 (-4.96, 2.80)
-1.60 (-30.60, 27.40)
WMD (95% CI)
0.35 (-20.76, 21.46)
0.30 (-5.17, 5.77)
0.70 (-16.62, 18.02)
0.20 (-7.61, 8.01)
-0.20 (-27.91, 27.51)
-15.60 (-29.00, -2.20)
0.60 (-28.13, 29.33)
100.00
Weight
2.59
1.79
(I-V)
3.38
50.35
5.02
24.68
1.96
8.39
1.83
%
-1.08 (-4.96, 2.80)
0.00 (-24.10, 24.10)
-1.08 (-4.96, 2.80)
-1.60 (-30.60, 27.40)
WMD (95% CI)
0.35 (-20.76, 21.46)
0.30 (-5.17, 5.77)
0.70 (-16.62, 18.02)
0.20 (-7.61, 8.01)
-0.20 (-27.91, 27.51)
-15.60 (-29.00, -2.20)
0.60 (-28.13, 29.33)
100.00
Weight
2.59
1.79
(I-V)
3.38
50.35
5.02
24.68
1.96
8.39
1.83
%
Intervention decreases birth length Intervention increases birth length
0-10 0 10

Page 14 of 43
Supplementary fig 12. Exposure-response relationship between iron dose and maternal anaemia

Page 15 of 43
Supplementary fig 13. Exposure-response relationship between iron dose up to 66 mg/day and maternal
anaemia
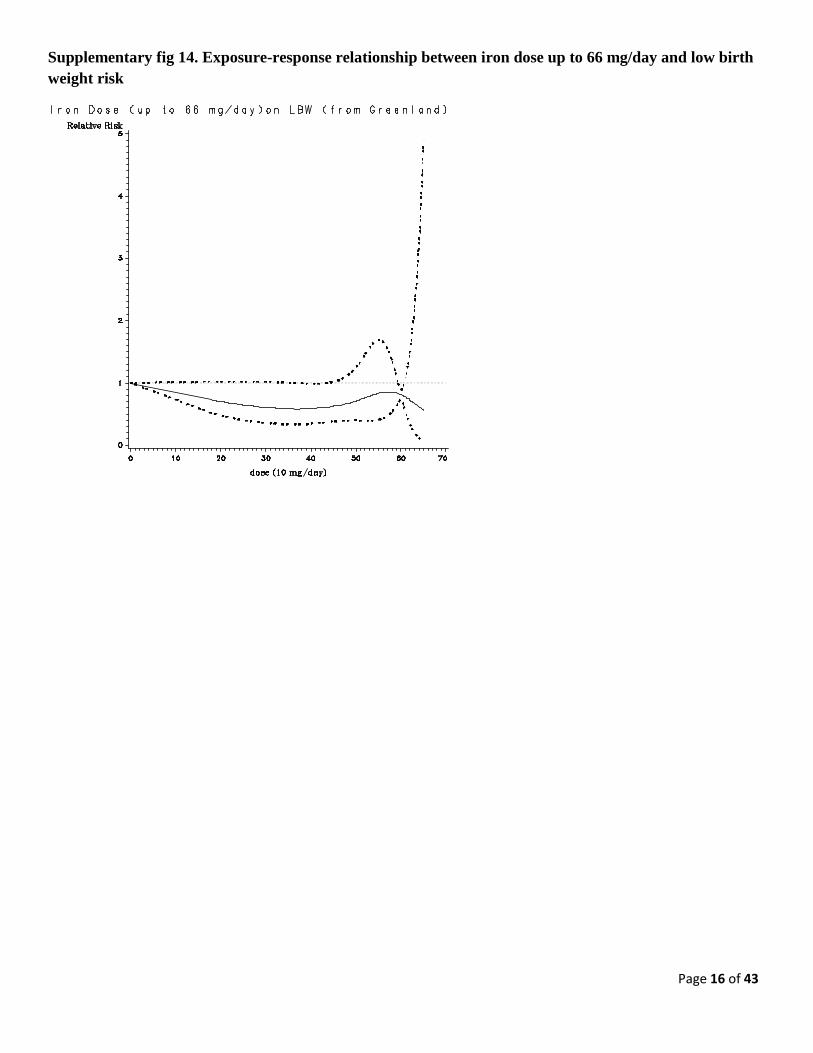
Page 16 of 43
Supplementary fig 14. Exposure-response relationship between iron dose up to 66 mg/day and low birth
weight risk
Page 17 of 43
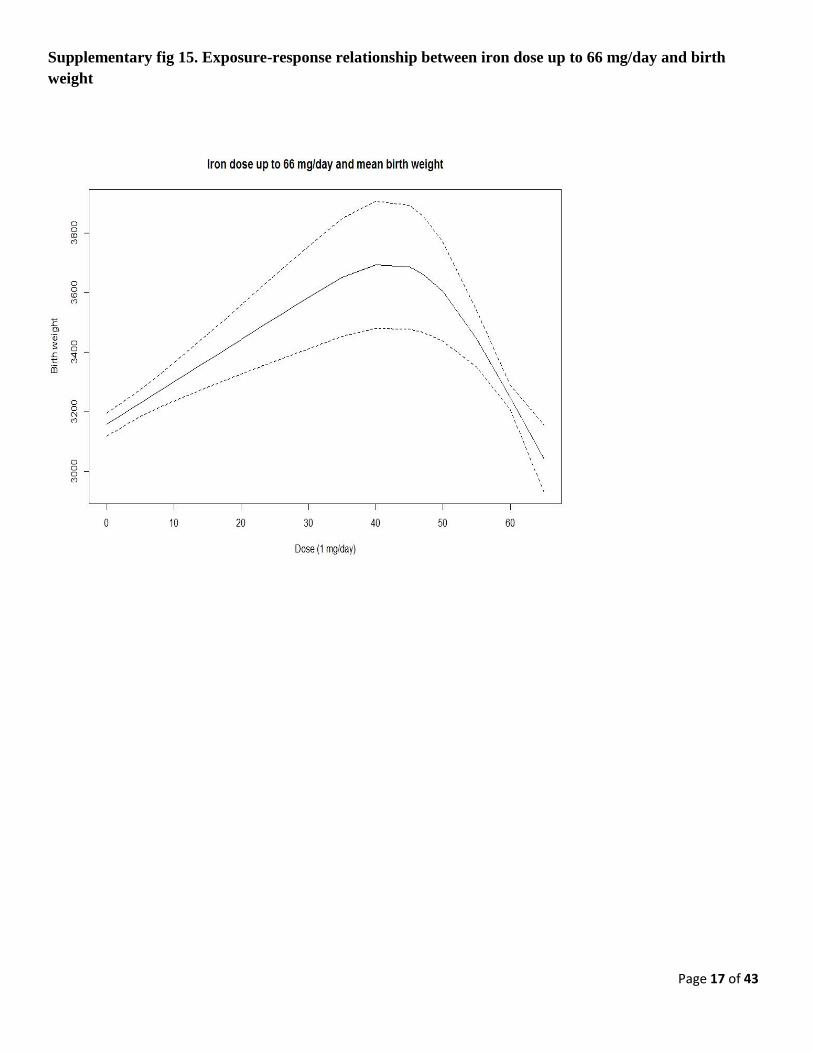
Supplementary fig 15. Exposure-response relationship between iron dose up to 66 mg/day and birth
weight

Page 18 of 43
Supplementary fig 16. Exposure-response relationship of haemoglobin difference with birth weight

Page 19 of 43
Supplementary fig 17. Exposure-response relationship of haemoglobin difference with low birth weight
risk

Page 20 of 43
Supplementary fig 18. Exposure-response relationship of haemoglobin difference with preterm birth
risk

Page 21 of 43
Supplementary fig 19. Forest plot of iron only on mean haemoglobin concentration in third trimester or
at delivery
I-V Overall (I-squared = 0.0%, p = 0.967)
Siega-Riz 2006
Dawson 1989
Buytaert 1983
Svanberg 1975Simmons 1993
Romslo 1983
Milman 1991
Chan 2009
Van Eijk 1978Wallenburg 1984
Tanumihardjo 2002 a
De Benaze 1989
Harvey 2007
studyid
D+L Overall
Falahi 2011
Cogswell 2003
Tura 1989
Zeng 2008
Butler 1968 a
Hoa 2005 a
Freire 1989
Batu 1976 b
Menendez 1994
Eskeland 1997 b
McKenna 2003
Tanumihardjo 2002 b
Batu 1976 a
Ziaei 2008
Charoenlarp 1988 c
Cantlie 1971
Makrides 2003
Ziaei 2007
Ouladsahebmadarek 2011Puolakka 1980
4.50 (3.62, 5.39)
0.00 (-22.34, 22.34)
6.67 (-20.05, 33.39)
3.23 (-12.55, 19.01)
5.00 (-71.51, 81.51)10.40 (3.68, 17.12)
13.00 (-46.48, 72.48)
8.50 (-31.53, 48.53)
4.00 (3.04, 4.96)
19.34 (-7.05, 45.73)3.22 (-88.75, 95.19)
10.00 (-93.41, 113.41)
8.00 (-1.82, 17.82)
9.00 (-128.88, 146.88)
WMD (95% CI)
4.50 (3.62, 5.39)
2.30 (-43.45, 48.05)
-0.30 (-7.09, 6.49)
2.00 (-23.97, 27.97)
4.80 (-3.15, 12.75)
1.00 (-117.50, 119.50)
6.90 (-36.97, 50.77)
7.40 (0.53, 14.27)
19.00 (-3.31, 41.31)
9.00 (-0.88, 18.88)
12.90 (-63.07, 88.87)
2.00 (-53.69, 57.69)
14.00 (-100.46, 128.46)
16.00 (3.68, 28.32)
11.00 (-13.59, 35.59)
12.50 (1.11, 23.89)
14.00 (-51.93, 79.93)
7.00 (0.53, 13.47)
7.20 (2.11, 12.29)
9.80 (-9.73, 29.33)21.00 (-52.27, 94.27)
100.00
0.16
0.11
0.31
0.011.72
0.02
Weight
0.05
84.58
0.110.01
0.01
0.81
0.00
(I-V)
0.04
1.69
0.12
1.23
0.01
0.04
1.65
0.16
0.80
0.01
0.03
0.01
0.51
0.13
0.60
0.02
%
1.86
3.00
0.200.01
4.50 (3.62, 5.39)
0.00 (-22.34, 22.34)
6.67 (-20.05, 33.39)
3.23 (-12.55, 19.01)
5.00 (-71.51, 81.51)10.40 (3.68, 17.12)
13.00 (-46.48, 72.48)
8.50 (-31.53, 48.53)
4.00 (3.04, 4.96)
19.34 (-7.05, 45.73)3.22 (-88.75, 95.19)
10.00 (-93.41, 113.41)
8.00 (-1.82, 17.82)
9.00 (-128.88, 146.88)
WMD (95% CI)
4.50 (3.62, 5.39)
2.30 (-43.45, 48.05)
-0.30 (-7.09, 6.49)
2.00 (-23.97, 27.97)
4.80 (-3.15, 12.75)
1.00 (-117.50, 119.50)
6.90 (-36.97, 50.77)
7.40 (0.53, 14.27)
19.00 (-3.31, 41.31)
9.00 (-0.88, 18.88)
12.90 (-63.07, 88.87)
2.00 (-53.69, 57.69)
14.00 (-100.46, 128.46)
16.00 (3.68, 28.32)
11.00 (-13.59, 35.59)
12.50 (1.11, 23.89)
14.00 (-51.93, 79.93)
7.00 (0.53, 13.47)
7.20 (2.11, 12.29)
9.80 (-9.73, 29.33)21.00 (-52.27, 94.27)
100.00
0.16
0.11
0.31
0.011.72
0.02
Weight
0.05
84.58
0.110.01
0.01
0.81
0.00
(I-V)
0.04
1.69
0.12
1.23
0.01
0.04
1.65
0.16
0.80
0.01
0.03
0.01
0.51
0.13
0.60
0.02
%
1.86
3.00
0.200.01
Intervention decreases Hb Intervention increases Hb
0-10 0 10

Page 22 of 43
Supplementary fig 20. Forest plot of iron only on mean haemoglobin concentration in postpartum
period
I-V Overall (I-squared = 0.0%, p = 0.999)
studyid
D+L Overall
Wallenburg 1984
Cantlie 1971
Eskeland 1997 b
Menendez 1994
Buytaert 1983
Dawson 1989
Butler 1968 a
Christian 2003 b
7.01 (0.36, 13.66)
WMD (95% CI)
7.01 (0.36, 13.66)
0.00 (-96.37, 96.37)
14.00 (-83.01, 111.01)
4.00 (-76.63, 84.63)
5.00 (-5.68, 15.68)
-3.22 (-84.50, 78.06)
3.34 (-23.38, 30.06)
2.00 (-69.21, 73.21)
9.20 (-0.03, 18.43)
100.00
(I-V)
0.48
0.47
0.68
38.72
0.67
%
6.19
Weight
0.87
51.92
7.01 (0.36, 13.66)
WMD (95% CI)
7.01 (0.36, 13.66)
0.00 (-96.37, 96.37)
14.00 (-83.01, 111.01)
4.00 (-76.63, 84.63)
5.00 (-5.68, 15.68)
-3.22 (-84.50, 78.06)
3.34 (-23.38, 30.06)
2.00 (-69.21, 73.21)
9.20 (-0.03, 18.43)
100.00
(I-V)
0.48
0.47
0.68
38.72
0.67
%
6.19
Weight
0.87
51.92
Intervention decreases Hb level Intervention increases Hb level
0-10 0 10

Page 23 of 43
Supplementary fig 21. Forest plot of iron only on maternal anaemia
I-V Overall (I-squared = 75.4%, p = 0.000)
Charoenlarp 1988 cChisholm 1966 a
Batu 1976 b
Sood 1975 a
Romslo 1983
Sood 1975 c
Preziosi 1997
Siega-Riz 2006
Sood 1975 b
Puolakka 1980
Cogswell 2003
Zeng 2008
Christian 2003 b
studyid
Makrides 2003Milman 1991
Pritchard 1958
Sood 1975 e
Holly 1955
Sood 1975 d
D+L Overall
De Benaze 1989
Batu 1976 a
Eskeland 1997 b
0.70 (0.66, 0.73)
0.41 (0.27, 0.62)0.15 (0.05, 0.48)
0.41 (0.22, 0.75)
0.66 (0.56, 0.80)
0.15 (0.02, 1.12)
0.85 (0.69, 1.03)
0.59 (0.45, 0.77)
1.11 (0.71, 1.71)
0.80 (0.65, 0.99)
0.07 (0.00, 1.15)
0.75 (0.35, 1.59)
0.74 (0.70, 0.79)
0.43 (0.32, 0.58)
ES (95% CI)
0.45 (0.25, 0.82)0.09 (0.02, 0.38)
0.17 (0.08, 0.39)
0.64 (0.50, 0.82)
0.03 (0.00, 0.18)
0.65 (0.52, 0.81)
0.56 (0.48, 0.65)
0.21 (0.06, 0.73)
0.57 (0.37, 0.88)
0.06 (0.00, 1.00)
100.00
1.32
%
0.17
0.62
7.32
0.06
5.85
3.30
1.22
5.36
0.03
0.42
60.55
2.67
(I-V)
0.650.12
0.35
3.85
0.06
4.63
0.15
Weight
1.27
0.03
Intervention decreases risk Intervention increases risk 1.1 1 5

Page 24 of 43
Supplementary fig 22. Forest plot of iron only on iron deficiency
I-V Overall (I-squared = 79.4%, p = 0.000)
Cogswell 2003
D+L Overall
Milman 1991
Romslo 1983
Falahi 2011
Makrides 2003
studyid
Siega-Riz 2006
Preziosi 1997
Tura 1989
0.73 (0.66, 0.82)
0.87 (0.69, 1.08)
0.59 (0.44, 0.79)
0.16 (0.04, 0.71)
0.06 (0.01, 0.38)
0.35 (0.16, 0.78)
0.60 (0.48, 0.76)
ES (95% CI)
0.81 (0.65, 1.02)
0.34 (0.21, 0.54)
0.92 (0.73, 1.17)
100.00
Weight
23.89
%
0.57
0.33
1.97
22.43
(I-V)
22.95
5.42
22.45
0.73 (0.66, 0.82)
0.87 (0.69, 1.08)
0.59 (0.44, 0.79)
0.16 (0.04, 0.71)
0.06 (0.01, 0.38)
0.35 (0.16, 0.78)
0.60 (0.48, 0.76)
ES (95% CI)
0.81 (0.65, 1.02)
0.34 (0.21, 0.54)
0.92 (0.73, 1.17)
100.00
Weight
23.89
%
0.57
0.33
1.97
22.43
(I-V)
22.95
5.42
22.45
Intervention decreases anaemia risk Intervention increases anaemia risk 1.1 1 5

Page 25 of 43
Supplementary fig 23. Forest plot of iron only on iron deficiency anaemia
I-V Overall (I-squared = 46.5%, p = 0.082)
Makrides 2003
Siega-Riz 2006
Cogswell 2003
Meier 2003 b
D+L Overall
Meier 2003 a
studyid
Milman 1991
Christian 2003 b
0.37 (0.27, 0.50)
0.28 (0.12, 0.68)
0.69 (0.33, 1.43)
0.61 (0.32, 1.15)
0.47 (0.16, 1.44)
0.37 (0.23, 0.60)
0.17 (0.02, 1.32)
ES (95% CI)
0.06 (0.00, 0.93)
0.24 (0.15, 0.39)
100.00
11.52
Weight
17.20
22.36
7.40
%
2.18
(I-V)
1.14
38.20
0.37 (0.27, 0.50)
0.28 (0.12, 0.68)
0.69 (0.33, 1.43)
0.61 (0.32, 1.15)
0.47 (0.16, 1.44)
0.37 (0.23, 0.60)
0.17 (0.02, 1.32)
ES (95% CI)
0.06 (0.00, 0.93)
0.24 (0.15, 0.39)
100.00
11.52
Weight
17.20
22.36
7.40
%
2.18
(I-V)
1.14
38.20
Intervention decreases anaemia risk Intervention increases anaemia risk
1.1 1 5

Page 26 of 43
Supplementary fig 24. Forest plot of iron only on birth weight
I-V Overall (I-squared = 98.8%, p = 0.000)
Sood 1975 c
Bloxam 1989
Sood 1975 e
Puolakka 1980
Harvey 2007Falahi 2011
D+L Overall
Dawson 1989
Ziaei 2007
Sood 1975 a
Sood 1975 d
Siega-Riz 2006
Makrides 2003
Cogswell 2003
Eskeland 1997 b
Chan 2009
Ouladsahebmadarek 2011
studyid
Sood 1975 b
Menendez 1994
Christian 2003 b
Zeng 2008
Preziosi 1997
45.48 (41.39, 49.58)
-18.40 (-60.66, 23.86)
470.00 (436.41, 503.59)
79.10 (42.14, 116.06)
-300.00 (-375.69, -224.31)
-100.00 (-222.96, 22.96)40.00 (5.26, 74.74)
40.80 (0.97, 80.62)
-220.00 (-241.76, -198.24)
10.00 (-4.30, 24.30)
71.00 (27.54, 114.46)
11.60 (-31.47, 54.67)
108.00 (82.55, 133.45)
-43.00 (-65.88, -20.12)
205.00 (171.59, 238.41)
78.90 (23.09, 134.71)
95.40 (85.65, 105.15)
43.22 (29.58, 56.86)
WMD (95% CI)
44.90 (5.05, 84.75)
87.00 (67.29, 106.71)
65.00 (53.74, 76.26)
20.20 (12.12, 28.28)
30.00 (1.37, 58.63)
100.00
0.94
1.49
1.23
0.29
0.111.39
3.55
8.22
0.89
0.91
2.59
3.21
1.50
0.54
17.68
Weight
9.03
(I-V)
1.06
4.32
13.25
25.75
2.05
%
Intervention decreases birthweight Intervention increases birthweight 0-10010

Page 27 of 43
Supplementary fig 25. Forest plot of iron only on low birth weight
I-V Overall (I-squared = 9.3%, p = 0.356)
Meier 2003 b
Meier 2003 a
Christian 2003 b
D+L Overall
Menendez 1994
Makrides 2003
Siega-Riz 2006
Zeng 2008
Falahi 2011
studyid
Dawson 1989
Cogswell 2003
Ziaei 2007
0.81 (0.71, 0.91)
1.89 (0.18, 20.00)
0.81 (0.02, 38.71)
0.82 (0.71, 0.95)
0.78 (0.64, 0.95)
0.55 (0.22, 1.38)
1.30 (0.56, 3.03)
0.51 (0.22, 1.15)
0.81 (0.50, 1.32)
0.45 (0.09, 2.22)
ES (95% CI)
0.35 (0.02, 8.10)
0.26 (0.10, 0.67)
1.21 (0.57, 2.54)
100.00
0.29
0.11
80.65
1.94
Weight
2.28
2.41
6.87
0.63
(I-V)
0.16
1.73
%
2.92
Intervention decreases LBW risk Intervention increases LBW risk 1.1 1 5

Page 28 of 43
Supplementary fig 26. Forest plot of iron only on duration of gestation
I-V Overall (I-squared = 0.0%, p = 1.000)
Ziaei 2007
Meier 2003 a
Ouladsahebmadarek 2011
Bloxam 1989
Falahi 2011
Siega-Riz 2006
Makrides 2003
Meier 2003 b
Zeng 2008
studyid
D+L Overall
Dawson 1989
Chan 2009
0.11 (-0.35, 0.57)
0.00 (-6.78, 6.78)
0.10 (-7.74, 7.94)
0.04 (-1.52, 1.60)
0.00 (-4.34, 4.34)
0.10 (-13.46, 13.66)
0.10 (-15.57, 15.77)
0.20 (-11.43, 11.83)
-0.30 (-7.14, 6.54)
0.21 (-0.99, 1.41)
WMD (95% CI)
0.11 (-0.35, 0.57)
0.00 (-25.90, 25.90)
0.10 (-0.43, 0.63)
100.00
%
0.46
0.34
8.69
1.12
0.11
0.09
0.16
0.45
14.71
(I-V)
0.03
Weight
73.84
0.11 (-0.35, 0.57)
0.00 (-6.78, 6.78)
0.10 (-7.74, 7.94)
0.04 (-1.52, 1.60)
0.00 (-4.34, 4.34)
0.10 (-13.46, 13.66)
0.10 (-15.57, 15.77)
0.20 (-11.43, 11.83)
-0.30 (-7.14, 6.54)
0.21 (-0.99, 1.41)
WMD (95% CI)
0.11 (-0.35, 0.57)
0.00 (-25.90, 25.90)
0.10 (-0.43, 0.63)
100.00
%
0.46
0.34
8.69
1.12
0.11
0.09
0.16
0.45
14.71
(I-V)
0.03
Weight
73.84
Intervention decreases gest age Intervention increases gest age 0-10 -5 0 5 10

Page 29 of 43
Supplementary fig 27. Forest plot of iron only on preterm birth
I-V Overall (I-squared = 0.0%, p = 0.586)
Makrides 2003
studyid
Chan 2009
Ouladsahebmadarek 2011
Siega-Riz 2006
Falahi 2011
Ziaei 2007
Zeng 2008
Harvey 2007
Eskeland 1997 b
Cogswell 2003
Christian 2003 b
D+L Overall
0.92 (0.80, 1.07)
0.59 (0.30, 1.19)
ES (95% CI)
0.95 (0.58, 1.57)
0.81 (0.42, 1.56)
0.54 (0.28, 1.02)
0.45 (0.09, 2.22)
1.26 (0.62, 2.56)
0.79 (0.53, 1.18)
1.14 (0.03, 50.40)
0.32 (0.01, 7.48)
1.03 (0.50, 2.09)
1.04 (0.85, 1.28)
0.92 (0.80, 1.07)
100.00
4.62
(I-V)
Weight
8.73
5.08
5.36
0.85
%
4.40
13.44
0.15
0.22
4.38
52.76
0.92 (0.80, 1.07)
0.59 (0.30, 1.19)
ES (95% CI)
0.95 (0.58, 1.57)
0.81 (0.42, 1.56)
0.54 (0.28, 1.02)
0.45 (0.09, 2.22)
1.26 (0.62, 2.56)
0.79 (0.53, 1.18)
1.14 (0.03, 50.40)
0.32 (0.01, 7.48)
1.03 (0.50, 2.09)
1.04 (0.85, 1.28)
0.92 (0.80, 1.07)
100.00
4.62
(I-V)
Weight
8.73
5.08
5.36
0.85
%
4.40
13.44
0.15
0.22
4.38
52.76
Intervention decreases risk Intervention increases risk 1.1 1 5

Page 30 of 43
Supplementary fig 28. Forest plot of iron only on SGA
I-V Overall (I-squared = 65.0%, p = 0.009)
Ziaei 2007
Cogswell 2003
studyid
Zeng 2008
Siega-Riz 2006
Ouladsahebmadarek 2011
Christian 2003 b
D+L Overall
Chan 2009
0.89 (0.81, 0.97)
1.53 (1.03, 2.26)
0.39 (0.17, 0.86)
ES (95% CI)
1.04 (0.66, 1.63)
0.70 (0.39, 1.25)
0.81 (0.58, 1.12)
0.89 (0.81, 0.99)
0.84 (0.66, 1.07)
0.48 (0.26, 0.87)
100.00
5.15
1.24
(I-V)
3.92
Weight
2.34
7.46
77.66
2.22
%
0.89 (0.81, 0.97)
1.53 (1.03, 2.26)
0.39 (0.17, 0.86)
ES (95% CI)
1.04 (0.66, 1.63)
0.70 (0.39, 1.25)
0.81 (0.58, 1.12)
0.89 (0.81, 0.99)
0.84 (0.66, 1.07)
0.48 (0.26, 0.87)
100.00
5.15
1.24
(I-V)
3.92
Weight
2.34
7.46
77.66
2.22
%
Intervention decreases risk Intervention increases risk
1.1 1 5

Page 31 of 43
Supplementary fig 29. Forest plot of iron only on birth length
I-V Overall (I-squared = 0.0%, p = 0.768)
Meier 2003 a
D+L Overall
Zeng 2008
Falahi 2011
Eskeland 1997 b
Cogswell 2003
Makrides 2003
Preziosi 1997
Meier 2003 b
studyid
Christian 2003 b
-0.93 (-4.76, 2.89)
-1.60 (-30.60, 27.40)
-0.93 (-4.76, 2.89)
0.30 (-5.25, 5.85)
-0.20 (-28.23, 27.83)
0.00 (-24.56, 24.56)
0.35 (-21.25, 21.95)
-15.60 (-29.17, -2.03)
0.70 (-16.90, 18.30)
0.60 (-28.35, 29.55)
WMD (95% CI)
0.50 (-6.62, 7.62)
100.00
1.74
Weight
47.51
1.86
2.43
3.14
7.95
4.72
1.75
(I-V)
28.90
%
-0.93 (-4.76, 2.89)
-1.60 (-30.60, 27.40)
-0.93 (-4.76, 2.89)
0.30 (-5.25, 5.85)
-0.20 (-28.23, 27.83)
0.00 (-24.56, 24.56)
0.35 (-21.25, 21.95)
-15.60 (-29.17, -2.03)
0.70 (-16.90, 18.30)
0.60 (-28.35, 29.55)
WMD (95% CI)
0.50 (-6.62, 7.62)
100.00
1.74
Weight
47.51
1.86
2.43
3.14
7.95
4.72
1.75
(I-V)
28.90
%
Intervention decreases birth length Intervention increases birth length
0-10 0 10
Page 32 of 43
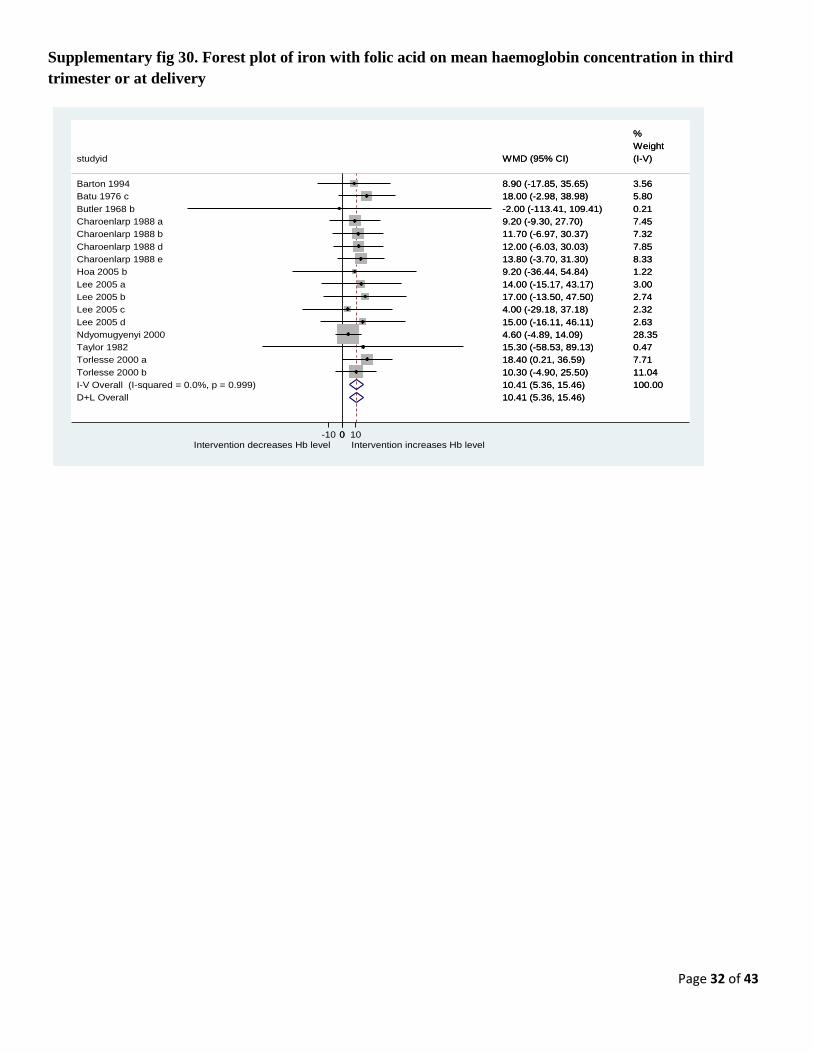
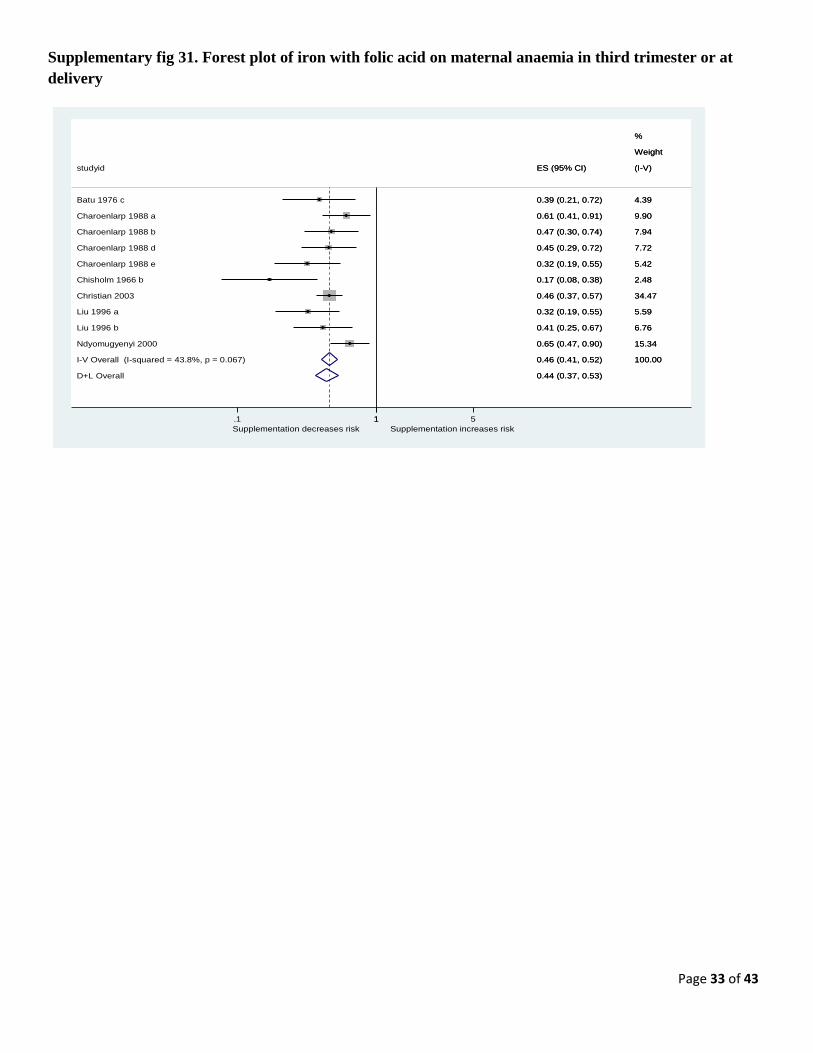
Supplementary fig 30. Forest plot of iron with folic acid on mean haemoglobin concentration in third
trimester or at delivery
I-V Overall (I-squared = 0.0%, p = 0.999)
Ndyomugyenyi 2000
Charoenlarp 1988 a
studyid
Lee 2005 a
Taylor 1982
Charoenlarp 1988 d
Lee 2005 d
Torlesse 2000 a
Batu 1976 c
Hoa 2005 b
D+L Overall
Butler 1968 b
Barton 1994
Torlesse 2000 b
Charoenlarp 1988 b
Charoenlarp 1988 e
Lee 2005 c
Lee 2005 b
10.41 (5.36, 15.46)
4.60 (-4.89, 14.09)
9.20 (-9.30, 27.70)
WMD (95% CI)
14.00 (-15.17, 43.17)
15.30 (-58.53, 89.13)
12.00 (-6.03, 30.03)
15.00 (-16.11, 46.11)
18.40 (0.21, 36.59)
18.00 (-2.98, 38.98)
9.20 (-36.44, 54.84)
10.41 (5.36, 15.46)
-2.00 (-113.41, 109.41)
8.90 (-17.85, 35.65)
10.30 (-4.90, 25.50)
11.70 (-6.97, 30.37)
13.80 (-3.70, 31.30)
4.00 (-29.18, 37.18)
17.00 (-13.50, 47.50)
100.00
%
28.35
Weight
7.45
(I-V)
3.00
0.47
7.85
2.63
7.71
5.80
1.22
0.21
3.56
11.04
7.32
8.33
2.32
2.74
10.41 (5.36, 15.46)
4.60 (-4.89, 14.09)
9.20 (-9.30, 27.70)
WMD (95% CI)
14.00 (-15.17, 43.17)
15.30 (-58.53, 89.13)
12.00 (-6.03, 30.03)
15.00 (-16.11, 46.11)
18.40 (0.21, 36.59)
18.00 (-2.98, 38.98)
9.20 (-36.44, 54.84)
10.41 (5.36, 15.46)
-2.00 (-113.41, 109.41)
8.90 (-17.85, 35.65)
10.30 (-4.90, 25.50)
11.70 (-6.97, 30.37)
13.80 (-3.70, 31.30)
4.00 (-29.18, 37.18)
17.00 (-13.50, 47.50)
100.00
%
28.35
Weight
7.45
(I-V)
3.00
0.47
7.85
2.63
7.71
5.80
1.22
0.21
3.56
11.04
7.32
8.33
2.32
2.74
Intervention decreases Hb level Intervention increases Hb level 0-10 0 10
Page 33 of 43
Supplementary fig 31. Forest plot of iron with folic acid on maternal anaemia in third trimester or at
delivery
I-V Overall (I-squared = 43.8%, p = 0.067)
Charoenlarp 1988 d
Charoenlarp 1988 e
Chisholm 1966 b
Liu 1996 b
Liu 1996 a
Charoenlarp 1988 a
Charoenlarp 1988 b
studyid
Ndyomugyenyi 2000
Christian 2003
Batu 1976 c
D+L Overall
0.46 (0.41, 0.52)
0.45 (0.29, 0.72)
0.32 (0.19, 0.55)
0.17 (0.08, 0.38)
0.41 (0.25, 0.67)
0.32 (0.19, 0.55)
0.61 (0.41, 0.91)
0.47 (0.30, 0.74)
ES (95% CI)
0.65 (0.47, 0.90)
0.46 (0.37, 0.57)
0.39 (0.21, 0.72)
0.44 (0.37, 0.53)
100.00
Weight
7.72
5.42
2.48
6.76
5.59
%
9.90
7.94
(I-V)
15.34
34.47
4.39
Supplementation decreases risk Supplementation increases risk
1.1 1 5

Page 34 of 43
Supplementary fig 32. Forest plot of maternal anaemia on low birth weight (crude estimates)
I-V Overall (I-squared = 90.0%, p = 0.000)
Steer 2005
Kumar 2010
D+L Overall
Lee 2006
Xiong 2003
Bhalerao 2011
Murphy 1986
studyid
Bondevik 2001
Williams 1997
Zhou 1998
Vijayalaxmi 2009
Malhotra 2002
Bodeau-Livinec 2011
Marhatta 2007
Ren 2007
Levy 2005
Mola 1999
Abeysena 2010
Knottnerus 1990
Shobeiri 2006
Lone 2004
Chang 2003El Guindi 2004
Scholl 1992
Banhidy 2010
Hamalainen 2003
1.03 (0.99, 1.06)
0.66 (0.61, 0.71)
1.02 (0.83, 1.25)
1.25 (1.08, 1.45)
4.02 (1.46, 11.05)
0.84 (0.60, 1.17)
1.06 (0.71, 1.57)
1.35 (1.07, 1.69)
ES (95% CI)
1.29 (0.97, 1.72)
2.26 (1.14, 4.45)
2.09 (1.05, 4.15)
1.62 (0.84, 3.13)
1.01 (0.62, 1.62)
0.85 (0.57, 1.26)
1.80 (1.21, 2.69)
1.21 (1.08, 1.36)
1.13 (1.07, 1.20)
1.19 (1.09, 1.30)
0.68 (0.24, 1.94)
0.82 (0.40, 1.68)
15.94 (5.33, 47.68)
2.42 (1.38, 4.27)
0.95 (0.37, 2.46)1.71 (0.83, 3.55)
1.42 (0.92, 2.19)
0.85 (0.75, 0.96)
3.19 (1.38, 7.40)
100.00
18.75
2.930.12
1.09
0.77
2.32
(I-V)
%
1.47
0.26
0.26
0.28
0.53
0.77
0.76
9.62
35.37
14.63
0.11
0.23
0.10
0.38
Weight
0.130.23
0.65
8.08
0.17
Exposure decreases odds Exposure increases odds 1.1 1 5

Page 35 of 43
Supplementary fig 33. Forest plot of maternal anaemia on low birth weight (adjusted estimates)
I-V Overall (I-squared = 86.2%, p = 0.000)
Hamalainen 2003
Knottnerus 1990
Levy 2005
Xiong 2003
Abeysena 2010
Scholl 1992
D+L Overall
Banhidy 2010
von Tempelhoff 2008
Ren 2007
studyid
1.19 (1.14, 1.25)
3.14 (1.35, 7.28)
0.82 (0.38, 1.76)
1.10 (1.01, 1.20)
0.75 (0.53, 1.07)
0.56 (0.07, 4.74)
1.55 (0.96, 2.51)
1.13 (0.94, 1.34)
0.85 (0.73, 0.99)
1.44 (1.33, 1.56)
1.16 (1.04, 1.30)
ES (95% CI)
100.00
0.33
0.40
31.17
1.87
%
0.05
1.02
10.15
36.83
Weight
18.18
(I-V)
1.19 (1.14, 1.25)
3.14 (1.35, 7.28)
0.82 (0.38, 1.76)
1.10 (1.01, 1.20)
0.75 (0.53, 1.07)
0.56 (0.07, 4.74)
1.55 (0.96, 2.51)
1.13 (0.94, 1.34)
0.85 (0.73, 0.99)
1.44 (1.33, 1.56)
1.16 (1.04, 1.30)
ES (95% CI)
100.00
0.33
0.40
31.17
1.87
%
0.05
1.02
10.15
36.83
Weight
18.18
(I-V)
Exposure decreases odds Exposure increases odds 1.1 1 5

Page 36 of 43
Supplementary fig 34. Forest plot of maternal anaemia on preterm birth (crude estimates)
I-V Overall (I-squared = 88.9%, p = 0.000)
Levy 2005
Zhou 1998
studyid
Scholl 1992
Kumar 2010
Marhatta 2007
Vijayalaxmi 2009
Banhidy 2010
Lone 2004
D+L Overall
Mau 1977
Knottnerus 1990
Chang 2003
Gonzales 2009
Lee 2006
Hamalainen 2003
Bhalerao 2011
Arbuckle 1989
Steer 2005
Feresu 2004Fareh 2005
Zhang 2009
Bondevik 2001
Malhotra 2002
Ren 2007
Xiong 2003
Abeysena 2010
Murphy 1986
1.06 (1.03, 1.10)
1.20 (1.13, 1.27)
1.74 (1.00, 3.02)
ES (95% CI)
1.59 (1.10, 2.30)
2.50 (0.86, 7.25)
7.60 (1.67, 34.48)
1.67 (0.86, 3.25)
0.99 (0.90, 1.08)
5.00 (2.97, 8.40)
1.28 (1.12, 1.47)
0.71 (0.48, 1.06)
0.86 (0.38, 1.93)
0.71 (0.26, 1.95)
1.21 (1.08, 1.36)
4.46 (1.55, 12.80)
1.81 (0.73, 4.50)
2.48 (1.65, 3.75)
1.22 (0.99, 1.51)
0.73 (0.68, 0.79)
6.50 (2.17, 19.42)9.37 (0.50, 176.43)
1.05 (0.84, 1.30)
0.92 (0.60, 1.42)
1.24 (0.75, 2.07)
1.13 (1.05, 1.22)
1.08 (0.82, 1.42)
0.70 (0.24, 2.00)
1.16 (0.94, 1.44)
100.00
30.38
0.34
Weight(I-V)
0.75
0.09
0.04
0.23
11.71
0.38
0.67
0.16
0.10
7.52
0.09
0.12
0.61
%
2.26
19.36
0.090.01
2.18
0.54
0.40
18.31
1.35
0.09
2.20
Exposure decreases odds Exposure increases odds 1.1 1 5

Page 37 of 43
Supplementary fig 35. Forest plot of maternal anaemia on preterm birth (adjusted estimates)
I-V Overall (I-squared = 83.3%, p = 0.000)
Hamalainen 2003
Levy 2005
Klebanoff 1989
Xiong 2003
Ren 2007
Hwang 2010
Feresu 2004
Scanlon 2000
Siega-Riz 1998
studyid
Klebanoff 1989 (Black and white separately)
Banhidy 2010
Scholl 1992
D+L Overall
Gonzales 2009
von Tempelhoff 2008
Abeysena 2010
Knottnerus 1990
1.24 (1.19, 1.30)
1.80 (0.72, 4.49)
(Excluded)
1.10 (0.67, 1.80)
1.01 (0.74, 1.37)
1.17 (1.08, 1.27)
1.70 (1.52, 1.90)
4.12 (1.80, 9.43)
1.29 (1.11, 1.50)
1.05 (0.79, 1.40)
ES (95% CI)
1.60 (1.16, 2.20)
0.97 (0.88, 1.07)
1.30 (0.75, 2.24)
1.28 (1.11, 1.48)
1.43 (1.26, 1.62)
(Excluded)
0.64 (0.08, 5.15)
0.86 (0.36, 2.03)
100.00
0.25
0.00
0.85
2.21
30.59
16.63
Weight
0.30
9.04
2.49
(I-V)
2.03
21.37
0.69
13.22
0.00
0.05
0.28
%
Exposure decreases odds Exposure increases odds
1.1 1 5

Page 38 of 43
Supplementary fig 36. Forest plot of maternal anaemia on stillbirth (crude estimates)
NOTE: Weights are from random effects analysis
Overall (I-squared = 23.9%, p = 0.209)
Mola 1999
Steer 2005
Conde-Agudelo 2000
Gonzales 2009
Mamun 2006
Bhalerao 2011
Lone 2004
Hamalainen 2003
Levy 2005
studyid
Zhang 2009
Malhotra 2002
Jehan 2007
1.19 (1.09, 1.28)
1.14 (0.93, 1.38)
1.29 (0.94, 1.77)
1.26 (1.17, 1.36)
1.40 (1.15, 1.70)
0.68 (0.41, 1.14)
1.05 (0.49, 2.27)
2.55 (0.49, 13.24)
3.75 (0.23, 61.56)
1.09 (0.96, 1.23)
ES (95% CI)
1.09 (0.90, 1.31)
1.91 (0.09, 40.17)
1.08 (0.33, 3.55)
100.00
11.96
5.61
31.79
12.28
%
2.29
1.07
0.24
0.08
21.29
Weight
12.87
0.07
0.45
Exposure decreases odds Exposure increases odds 1.1 1 5
Page 39 of 43
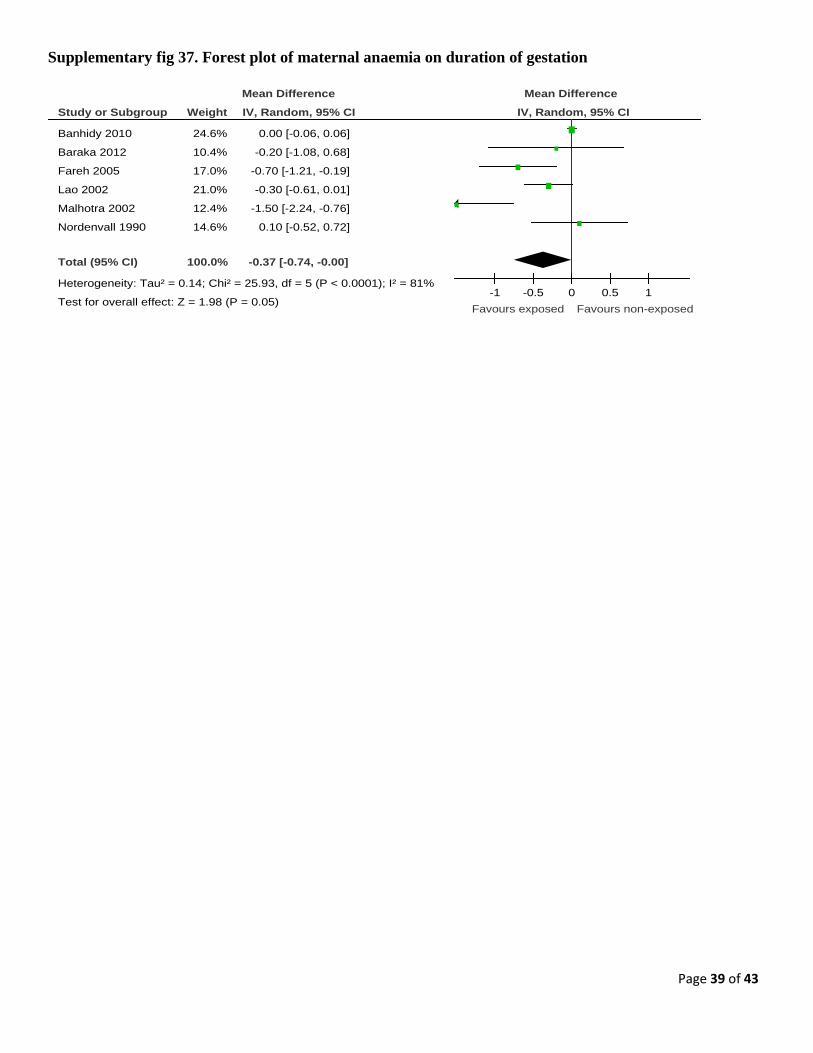
Supplementary fig 37. Forest plot of maternal anaemia on duration of gestation
Study or Subgroup
Banhidy 2010
Baraka 2012
Fareh 2005
Lao 2002
Malhotra 2002
Nordenvall 1990
Total (95% CI)
Heterogeneity: Tau² = 0.14; Chi² = 25.93, df = 5 (P < 0.0001); I² = 81%
Test for overall effect: Z = 1.98 (P = 0.05)
Weight
24.6%
10.4%
17.0%
21.0%
12.4%
14.6%
100.0%
IV, Random, 95% CI
0.00 [-0.06, 0.06]
-0.20 [-1.08, 0.68]
-0.70 [-1.21, -0.19]
-0.30 [-0.61, 0.01]
-1.50 [-2.24, -0.76]
0.10 [-0.52, 0.72]
-0.37 [-0.74, -0.00]
Mean Difference Mean Difference
IV, Random, 95% CI
-1 -0.5 0 0.5 1
Favours exposed Favours non-exposed

Page 40 of 43
Supplementary fig 38. Forest plot of maternal anaemia on birth weight
Study or Subgroup
Baraka 2012
Hamalainen 2003
Fareh 2005
Zhou 1998
Malhotra 2002
Lao 2002
Banhidy 2010
Nordenvall 1990
Williams 1997
Total (95% CI)
Heterogeneity: Tau² = 1878.84; Chi² = 26.76, df = 8 (P = 0.0008); I² = 70%
Test for overall effect: Z = 0.97 (P = 0.33)
Weight
2.5%
7.9%
6.1%
18.0%
10.1%
11.5%
22.5%
2.6%
18.7%
100.0%
IV, Random, 95% CI
-276.00 [-518.04, -33.96]
-88.00 [-205.21, 29.21]
-81.00 [-222.47, 60.47]
-51.11 [-95.71, -6.51]
-49.80 [-146.07, 46.47]
-15.00 [-99.93, 69.93]
3.00 [-10.52, 16.52]
21.00 [-215.10, 257.10]
72.00 [31.27, 112.73]
-20.15 [-60.91, 20.61]
Mean Difference Mean Difference
IV, Random, 95% CI
-100 -50 0 50 100
Favours exposed Favours non-exposed

Page 41 of 43
Supplementary fig 39. Forest plot of maternal anaemia on SGA (crude estimates)
NOTE: Weights are from random effects analysis
Overall (I-squared = 92.1%, p = 0.000)
Fareh 2005
studyid
Zhou 1998
Arbuckle 1989
Scholl 1992
Xiong 2003
Mau 1977
Hamalainen 2003
Gonzales 2009
Malhotra 2002
Bhalerao 2011
Lone 2004
Abeysena 2010
Ren 2007
1.04 (0.80, 1.35)
13.83 (0.77, 248.79)
ES (95% CI)
0.98 (0.64, 1.52)
1.06 (0.84, 1.33)
1.54 (0.91, 2.61)
0.80 (0.64, 1.02)
1.17 (0.84, 1.64)
0.94 (0.40, 2.16)
0.58 (0.53, 0.64)
1.27 (0.34, 4.71)
0.70 (0.49, 1.01)
2.50 (1.40, 4.45)
0.88 (0.36, 2.16)
1.17 (1.09, 1.26)
100.00
0.77
Weight
8.70
10.47
7.80
%
10.41
9.58
5.28
11.17
2.99
9.31
7.34
4.93
11.25
Exposure decreases odds Exposure increases odds 1.1 1 5

Page 42 of 43
Supplementary fig 40. Forest plot of maternal anaemia on SGA (adjusted estimates)
NOTE: Weights are from random effects analysis
Overall (I-squared = 88.4%, p = 0.000)
Hwang 2010
Xiong 2003
Hamalainen 2003
Scanlon 2000
Ren 2007
Scholl 1992
Abeysena 2010
Gonzales 2009
von Tempelhoff 2008
studyid
1.08 (0.90, 1.29)
1.50 (1.32, 1.70)
0.78 (0.60, 1.01)
0.94 (0.41, 2.17)
0.86 (0.74, 1.00)
1.11 (1.03, 1.20)
1.66 (0.91, 3.04)
0.71 (0.06, 7.94)
0.86 (0.77, 0.96)
1.35 (1.16, 1.57)
ES (95% CI)
100.00
15.53
12.45
3.61
%
15.01
16.28
5.77
0.53
15.80
15.01
Weight
1.08 (0.90, 1.29)
1.50 (1.32, 1.70)
0.78 (0.60, 1.01)
0.94 (0.41, 2.17)
0.86 (0.74, 1.00)
1.11 (1.03, 1.20)
1.66 (0.91, 3.04)
0.71 (0.06, 7.94)
0.86 (0.77, 0.96)
1.35 (1.16, 1.57)
ES (95% CI)
100.00
15.53
12.45
3.61
%
15.01
16.28
5.77
0.53
15.80
15.01
Weight
Exposure decreases odds Exposure increases odds 1.1 1 5

Page 43 of 43
Supplementary fig 41. Forest plot of maternal anaemia on perinatal mortality (crude estimates)
NOTE: Weights are from random effects analysis
Overall (I-squared = 67.3%, p = 0.003)
studyid
Xiong 2003
Mamun 2006
Lone 2004
Murphy 1986
Bhalerao 2011
Steer 2005
Levy 2005
Agarwal1998
1.03 (0.77, 1.37)
ES (95% CI)
1.58 (0.99, 2.52)
0.59 (0.38, 0.92)
3.07 (0.61, 15.32)
1.53 (1.06, 2.20)
1.69 (0.62, 4.66)
0.79 (0.39, 1.61)
0.87 (0.75, 1.02)
0.73 (0.46, 1.15)
100.00
Weight
14.26
14.69
2.85
16.71
6.04
9.67
21.24
14.55
%
1.03 (0.77, 1.37)
ES (95% CI)
1.58 (0.99, 2.52)
0.59 (0.38, 0.92)
3.07 (0.61, 15.32)
1.53 (1.06, 2.20)
1.69 (0.62, 4.66)
0.79 (0.39, 1.61)
0.87 (0.75, 1.02)
0.73 (0.46, 1.15)
100.00
Weight
14.26
14.69
2.85
16.71
6.04
9.67
21.24
14.55
%
Exposure decreases odds Exposure increases odds 1.1 1 5