batch adsorption from solution - nist page · journal of research of the national bureau of...
TRANSCRIPT
JOURNAL OF RESEARCH of the National Bureau of Standards—A. Physics and ChemistryVol. 66A, No. 6, November-December 1962
Batch Adsorption From SolutionWilliam V. Loebenstein
(August 7, 1962)
A batch adsorption equation was derived by integrating an irreversible rate equationobtained by neglecting the desorption term of the Langmuir adsorption-rate equation. Theintegrated equation was in reasonably good agreement with experiment and provided ameans for determining from the data the parameters gQ and ku These constants, namely, theadsorptive capacity and the adsorption rate constant, completely characterized the adsorp-tion system at that temperature. Agreement was found between these batch adsorptionparameters and their counterparts previously derived from column adsorption experimentswhen both types of adsorption were performed simultaneously.
1. IntroductionThe study of adsorption from solution of one or
more solutes by solid adsorbents has lagged in com-parison with the advances made in gas adsorption.The problem is more complicated for a number ofreasons: (1) The systems of interest are invariablymulti-component and, hence, the possibility of com-petition exists for the available adsorption sites if,indeed, the same sites are involved. (2) Equations ofstate are less well understood for liquid systems thanfor gases. (3) The isotherms applicable to gas ad-sorption have been studied in great detail. Thedifferences between physical and chemical adsorptionare usually well defined and the parameters of theisotherm equation are meaningful. In contrast, theisotherms applicable to adsorption from solution arecomplicated by the fact that no clean-cut distinctioncan generally be made between physical adsorptionand chemisorption. Complete reversibility is seldomif, indeed, ever attained. A Freundlich adsorptionequation which often fits the data well is limited inits usefulness because its parameters lack physicalsignificance. (4) The additional complications re-sulting from the greater viscosity in liquids than ingases as well as the contribution to the overall com-plexity attributable to diffusion can well beappreciated.
Adsorption from solution is customarily conductedeither as a column or as a batch operation In theformer instance the solution is allowed to percolatethrough a column usually held in a vertical positionsuch as is the common practice with ion exchangecolumns. In a batch operation, a quantity of ad-sorbent is mixed all at once with a quantity ofsolution and the system kept in agitation for aconvenient period of time. Separation of the result-ant solution is accomplished by filtering, centrifuging,or decanting.
It should be possible to characterize a solution-adsorbent system by either column or batch tech-nique and arrive at the same result since the physicaland/or chemical forces applicable in each case mustbe identical. Furthermore, the results obtained froma batch experiment should be somewhat more reli-able because of several reasons. Among the most
serious objections to column experiments are: (1)The overall complexity and expense of experimentalequipment; (2) the inherent difficulties associatedwith maintaining a constant flow rate; (3) the diffi-culty of assuring a constant temperature throughoutthe column; (4) the appreciable probability of chan-neling within the packed column; (5) the variabilityin the results associated with classification by particlesize during settling of the column; (6) the errorsinherent in any of the various methods of settling ofthe column; and (7) the relatively large expenditureboth in time and manpower required for a columnexperiment.
Previous attempts to solve the kinetics of batchadsorption from solution have been, for the mostpart, disappointing. A certain measure of successwas reported by Dryden and Kay [1] 1 despite thefact that their equation (based on a solution of thefinite bath theory) assuming a linear adsorptionisotherm was applied to systems which obeyed theFreundlich isotherm. Their use of the "fractionalapproach to equilibrium" was a refinement of thework of Eagle and Scott [2] which, in turn, was anoutgrowth of the earlier application by Geddes [3].
The aforementioned approach while providing ameasure of the adsorption rate constant can give noestimate of the maximum extent of adsorption whichmight conceivably correlate with surface area.Other investigators assuming either a Langmuir rep-resentation [4, 5, 6, 7] or (less frequently) a B.E.T.behavior [8, 9, 10, 11] applied to solutions were ableto estimate adsorptive capacities. However, sincetheir applications were made using the equationsderived for t= °°, no kinetic information can beexpected.
2. Theoretical Development
The present investigation treats the problem ofbatch adsorption in a manner analogous to that re-cently found extremely useful in column adsorption[12]. The kinetic form of an adsorption equationwhich may reasonably be expected to fit the data isintegrated subject to a "conservation" equation, i.e.,
i Figures uVbrackets indicate the literature references at the end of this paper
503

a conservation of mass equation applied to theadsorb able solute.
2.1. Adsorption Rate
The kinetic form of a Langmuir adsorption equa-tion before attainment of equilibrium may be repre-sented as follows:
(1)
where
2=the amount of solute adsorbed per gram ofthe adsorbent at any time, t;
q0—the maximum value q would have if all theadsorption sites were filled;
c=the solute concentration at any time, t; andki, Jc2=the specific adsorption and desorption rate
constants.
While eq (1) can be handled in its complete form 2
as shown, the result is unwieldy and some doubtexists that the additional precision that may resultin some instances can justify the resultant increasein complexity. Furthermore, the presence of the lastterm of eq (1) implies complete reversibility, a condi-tion which is rarely encountered in any practical caseconcerned with adsorption from solution. Accord-ingly, the kinetic equation adopted in this workis, simply:
dt~k (2)
Further justification for this simplification is the factthat in the column work already mentioned [12]quite satisfactory agreement was found in comparingcolumns of different dimensions, although the desorp-tion rate constant Jc2 had been eliminated from theintegrated equation in that case also. Equation (2)simply states that the rate of adsorption is propor-tional at any instant to the concentration of thesolute and to the number of unfilled adsorption sites.
The "conservation equation" for batch adsorptionmay be expressed in the form:
(3)
where c0 is the initial concentration of the solute,V the volume of solution, and W the mass of theadsorbent.
Equation (2) is easily integrated subject to eq (3)and the boundary conditions that q=0 and c=c0when 2=0. This resultant integrated equation maybe expressed as:
(4)\Vc0
2 See eq 19.
Perhaps the best representation of the adsorptionequation is obtained by eliminating c, entirely,between eqs (3) and (4) to obtain:
(5)EVc0
At 2=0, the numerator of the fraction vanishes,so q=0.
When WqQ/Vc0^>l, the exponent of e is negative, sothat the exponential terms are always less than unity.Thus the denominator is always greater than thenumerator and O<2/2o<l. Furthermore, underthese conditions there is not enough adsorbate in thesystem to satisfy the capacity of the adsorbent, so ast—>co the value of q tends toward Vco/W. Con-versely, when Wqo/Vco<^l, the exponent of e ispositive and the exponential terms become greaterthan unity and increase in magnitude with time.Again the quotient is always positive with a valuebetween zero and one. Now, however, as £—>oo thelimiting value of q is q0 as expected.
Also from eq (5) it can be seen that: 3
limw 2o
(6)
The slope of the curve q=f(t) is even more reveal-ing. By differentiating eq (5) with respect to t, oneobtains:
IVc0
\Vco '• (7)
Now if the exponent in eq (7) is greater than zero,then at relatively large values of t
(8)\Vco - 1 Icofcit
which, in turn, goes to zero as t—>oo.If the exponent in eq (7) is less than zero, then as t
grows large
dtVc0
— 1
Vc0
. - G S - O - (9)
which, in the limit as £—><» y again goes to zero.The integrated equation corresponding to eq
(5) which was found to apply to column [12] adsorp-tion is repeated here for convenience:
3 This is essentially the equation derived by Harned [13] in 1920.
504

V
where V is the volume velocity; x is the mass ofadsorbent upstream from the point at which effluentis collected; and y is the throughput or volume ofeffluent which has passed up to that time. Sincethe effluent in column adsorption is usually collectedonly at the end of the column, the value of x isconstant. Thus, eq (10) is readily adapted forevaluating the parameters q0 and k\ from the linear
plot of W— — 1 \ against y. For the present work
where batch adsorption is involved, no simple linearrepresentation of eq (4) or (5) is possible for testinggoodness of fit and for evaluating the parametersgo and k\. Consequently it was necessary to resortto methods of successive approximations. Two suchmethods which were found to be helpful are givenin the appendix.
3, Experimental Techniques
The batch adsorption experiments were conductedin stoppered erlenmeyer flasks agitated mechanicallyby means of a water bath shaking apparatus thermo-stated at 80 °C. The older experiments involvedthe use of a service bone char (Char 32) as theadsorbent in various U.S. sieve fractions bothseparately and in recombined mixtures. The ad-sorbate was the colorant in a Louisiana raw sugarliquor (of̂ 60 Brix sucrose concentration). Theconcentration of the colorant was considered to beproportional to the optical density (or attenuationindex assuming no scattering) as measured by aBeckman DU spectrophotometer at 560 mju wave-length. The resonableness of this assumption wasdiscussed in some detail in the previous work [12].The proportionality constant, k0, is not known, sothat only comparative results are possible from allthe colorant adsorption experiments. The lengthof time of each adsorption measurement was limited,in the earlier work, to 3 hr and the volume of solutionwas fixed as was the initial concentration. Sixdifferent weights of adsorbent were used in eachexperiment. A comparison was also made at thattime with an activated carbon, namely Darco S-51,in an otherwise identical system.
The more recent series of experiments was designedto compare the results of batch adsorption withcolumn adsorption for the same systems. Againa service bone char (Char 117-B) was used in allcomparisons. A particular Hawaiian raw sugarliquor (Sugar 17) was tested both by batch and bycolumn experiments all at 80 °C. Time, as wellas weight of adsorbent, was allowed to vary amongbatches. The adsorption of colorant (optical den-sity at 420 niju wavelength), sulfate ion, and totalcations, were determined independently for the twomethods. The [SOJ* determination was made bya turbidimetric method applied to suspensions ofprecipitated BaSO4 as described by Gee et al. [14].
Total cations were determined by an ion exchangetechnique using Amberlite IR-120 in the hydrogen-form followed by titration with a standard base [15].
4, Comparison of Parameters Derived FromRelated Batch Experiments
4.1. Comparison Among Sieve Sizes of the SameAdsorbent
Table la gives the data obtained from one of thecolorant adsorption batch experiments in the olderseries. The first method described in the appendixfor determining the values of q0 and kx from theexperimental data was applied here. After four orfive trials, the improved choice of go^9.8O k0 resultedin the quantities computed as shown in table lb.In comparison with previous trials the quantitycomputed for Ag0 was sufficiently close to zero,that no further refinement was deemed to bejustified.
The data of table la were used to plot g againstC/CQ as shown by the open circles and curve offigure 1.
The corresponding values of q computed accordingto eq (5) using the two parameters go and ki fromtable lb are shown in crosses. The agreement isseen to be quite good except at the tail end of thecurve where the amount of adsorbent used was small.
Table 2 summarizes the results for the same bonechar but for various sieve sizes (both separately andin combination) tested with the same sugar solutionfor adsorption of colorant. The values listed forgo and ki were derived in each case by a method de-scribed in the appendix.
For the case of sieve fraction (30 on 35), the valueof 8.58 k0 for q0 seems somewhat low in line with theother members of the series. Likewise its kx valueof 0.182 1/JCQ appears to be high. Interestinglyenough, the values derived by application of thetheory to the reconstituted 50 percent mixtures agreerather well with the arithmetic means of the inde-pendently determined separate fractions. It shouldbe noted in the last line of table 2 that the mixtureincluded the (30 on 35) fraction which exhibited theanomalous behavior already mentioned. Its con-tribution in the case of the mixed sample must havebeen consistent with its separate behavior to haveresulted in such close agreement between derivedvalue and averaged value for go-
It is seen that the value of g0 varied about 2%-foldbetween the coarser and finer fractions as shown inFigure 3. If the entire surface within a porousadsorbent particle were accessible to the adsorbate,the particle size should have little (if any) influence onthe capacity for adsorption per unit mass of adsorbentproviding the surface area were large. The sampleof bone char used in this work had a B.E.T. totalarea (determined with N2 gas at 77 °K) of about80 m2-g-1. I t can easily be shown that the externalor boundary area of (48 on 80) mesh char particlesis about 0.01 m^g"1. A 3%-fold increase in particlesize to (20 on 30) mesh would decrease this particle
505

TABLE la. Typical data obtained by varying the amount of adsorbent from batch to batch
Expt. (22-29), char 32 through 20 on 30 with Louisiana raw sugar liquor. co=M—log ^6o)=0.349itomM-ml-1; T/=78 ml;() (W/V)
Batch No.
123456
W
g2.005.00
10.0214.9919.9924.98
c
mM-ml-i0.302 h
. 257 A:o
. 195 ko
. 143 ko
. 105 ko
.O8O2fco
co-c
0.047 ko. 092 ko. 154 ko. 206 ko. 244 ko. 269 ko
W/V
g-ml-i0.026
.064
.128
.192
.256
.320
q
1.808 ko1.438 ko1.203 ko1.073 ko0. 953 ko
. 841 A;o
t
hr3.003.003.003.003.003.00
c/co
0.865.736.559.410.301.230
I n cole
0.145.307.582.892
1.2001.470
BatchNo.
1
2
3
4
5
6
TABLE lb. Improved estimate of parameters (method 1) applied to data of table la for qQ = 9.80 ko mM[.g-i
Order of computations
1
qlqo
0.184
.147
.123
.109
.0972
.0858
2
q/Ql
0.0188
.0150
.0126
.0111
.00992
.00876
3
l-qlqo
0.816
.853
.877
.891
.903
.914
4
-In (l-qlqo)
0.203
.159
.131
.115
.102
.0900
6
bF/dki
- 0 . 2 8 3
.835
2.716
4.598
6.479
8.361
9
F
0.156
.299
.585
.883
1.185
1.487
10
AF
- 0 . 0 1 1
.008
- . 0 0 3
.009
.015
- . 0 1 7
11
(WlV)ht
0.0130
.0321
.0642
.0962
.1283
.1604
12
ff/flj
l-qlqo
0.0230
.0176
.0144
.0125
.0110
.0096
13
-0 .0100
.0145
.0498
.0837
.1173
.1508
5
lnco/c+ln (l-qlqo)
- 0 . 0 5 8
.148
.451
.777
1.098
1.380
7 8
Eq. (7a)
5
S3II
g
L
# ai ao
*
14 15
Eq. (9a)
IX00
iX$
r,
4 aIX
1?
2.0k
FIGURE 1. Batch adsorption curve for colorant (contained ina Louisiana raw sugar liquor) using a (20 on 80) meshservice bone char.
Three hour experimental points are shown by circles, calculated points by crosses.
2.0k
FIGURE 2. Batch adsorption curve for colorant (contained ina Louisiana raw sugar liquor) using a 50 percent mixture of(20 on SO) mesh and (48 on 80) mesh service bone char.Three hour experimental 'points are shown by circles, calculated points by crosses.
506

area to 0.003 m2-g * and result in a decrease inB.E.T. area of less than 0.01 percent. It is interest-ing to speculate whether the observed variation ofcapacity for adsorption with sieve fraction was causedby the possibility that the service char may haverestricted access to its interior brought on by the
TABLE 2. Relative values of adsorptive capacity qo and rateconstant kj for the adsorption of colorant from a Louisianaraw sugar liauor on service bone char 32 of various sievefractions
Sieve sizes (US standardmesh) single closelysieved fractions
(20 on 30)(30 on 35)(35 on 48)(48 on 80)
Fines Csmaller than 80mesh)
50%'mixtures of sievefractions
(20 on 30)1and \
(48 on 80) j(30 on 35)1
and \(48 on 80) j
determined values
9.90 /co8.58 /co
10.25 /co23.00 /co24.79 /co
Qo
Determinedvalues
17.30 h
16.00 /co
Average ofindividual
values
16.5 h
15.8 h
fcidetermined values
ml-mM-i-hr-i0.165 1/fco
.182 1/fco
.144 1/fco
.0895 1/fco
.227 1/fco
ki
Determinedvalues
0.118 1/fco
.105 1/fco
Average ofindividual
values
0.127 1/fco
0.136 1/fcc
24 k0
22
20
18
16
^ l 4
CVl
INfl 3
AI
K l 0
O
cr
8
6
4
2
o
(Fines)
-
-
-
-
-
-
-
-
-
-
• (48 On 80)
-
-
-
-
-
-
• (350H48) # ( 2 0 0 n 3 0 ) -
• (30 0035)
-
-
-
100 200 300 400 500 600 700 800AVERAGE VALUE OF NOMINAL SIEVE OPENINGS, fJL
9 0 0
FIGURE 3. Adsorption capacity of various sieve fractions ofa service bone char for colorant plotted against mean particlediameter within each fraction.
building up of mineral deposits, etc., resulting fromrepeated cycles of raw sugar filtration and high tem-perature kilning.
5. Comparison Between Two Different Ad-sorbents
It is interesting to compare the behavior of a de-colorizing carbon (Darco S-51) with a service bonechar in connection with the same sugar solution andunder identical conditions in all other respects.The observed curve and calculated points for q ofthe decolorizing carbon are shown in figure 4. Themagnitude of q0 and ki are in qualitative agreementwith known behavior when activated carbon iscompared with bone char.
If the relative number of adsorption sites (asestimated by the magnitude of g0) were a constantfraction of the surface area for different carbonadsorbents, one might hope to use this as a tool tocompare surface areas. The ratio of their relativecolorant adsorptive capacities of 53.5 k0 for DarcoS-51 to, say, 10 kQ for (20 on 30) mesh service bonechar would predict a surface area for the activatedcarbon of 80X53.5/10=428 m^g"1. Published val-ues of about 500 rn^g"1 [16] based on B.E.T. nitrogenadsorption isotherms have been given for the surfacearea of Darco S-51. Of course, considerably morework would have to be done in this connection beforesuch an inference could be verified.
40k,
FIGURE 4.—Batch adsorption curve for colorant (contained ina Louisiana raw sugar liquor) using a decolorizing (vegetable)carbon.
Three hour experimental points are shown by circles, calculated points by crosses.
507

6. Batch Versus Column Adsorption—Comparison of q0 and of ki
A Hawaiian raw sugar solution was studied bymeans of a column experiment and a batch experi-ment using a service bone char as the adsorbent ineach case. The adsorption of colorant as well ascertain inorganic components, notably sulfate ionand alkaline-earth cations, were determined at thesame time. The alkaline-earth cations consistedalmost entirely of calcium ions and (to a much lesserextent) magnesium.
6.1. Colorant Adsorption ParametersFor the column experiment a cylindrical column
of 500 ml capacity was used with 562 g of charleaving a total void volume of about 300 ml. Theflow rate of sugar solution was held at 300 ml-hr"1.When plotted according to eq (10), the results areshown in figure 5. The last seven points form areasonably good straight line. From the slope ofthis line and its intercept on the zero-throughputaxis, a value of 4.66 k0 for q0 and 0.0685 l/k0 for kxwere estimated. The first three points correspondingto no more than one column displacement areprobably too high. Kemnants of the settling liquornot completely displaced would make c abnormally
low and, consequently, ( ——1 ) would be too high.
The data of the batch experiment (26-B2) per-formed with aliquots of the same raw sugar solutionand of the same bone char carried out at the sametemperature and on the same day are available forcomparison. It should be noted that in batchexperiments of the recent work, time was not heldconstant in all of the samples, but was deliberatelyvaried from % hr to 4 hr. The data collected areshown to the left of the double rule in table 3.
By applying the methods of successive approxi-mation described in the appendix the values of 8.52k0 and 0.0490 l/k0 were obtained for q0 and k1}respectively. These parameters applied to eq (5)were used to calculate the quantity q for each batch.These calculations and results are shown to the rightof the double rule in table 3. The differencesbetween q(ohH) and #(caic) are given in the last col-umn. The sum of the squares of these differences is1.83 k2
Oy hence the mean square deviation betweencalculated and observed values of q amounts to
200 400 600 800 1000 1200 1400THROUGHPUT,ml
FIGURE 5. Column adsorption of colorant (contained in aHawaiian raw sugar liquor) by a service bone char shown byexperimental points.
Solid line was selected as best fit for these data. (Perfect agreement with batchadsorption would have required the experimental column points to have fallenon broken line.)
0.305 kl. This yields a value of 0.55 kQ as "standarderror of estimate" for the quantity q based on theabove calculations, although it should not be inter-preted as experimental error. Attention should becalled to the apparent anomaly between samples 4and 5. The concentration may have been errone-ously recorded as the same, but it is equally likelythat the experimental error was great enough to havegiven identical readings for the lK-hr and 2-hrsamples. The data were treated as though the latterwas the case. It is significant that even if the1%-hr point had been omitted and the computa-tions had been based on the seven remaining batches,the value thus obtained for q0 would have differedby no more than about 3K percent.
All in all, considering the assumptions inherent inthe derivation of the adsorption rate equation aswell as the experimental errors present in the batchand column adsorption methods, the values of
SampleNo
23457689
W
g50.050.050.050.050.060.040.030.0
TABLE 3.
t
hr0.51.01.52.04.04.04.04.0
c
mM.ml-i3 .68 fco3 .32 fco2 .66 fco2 .66 fco1.99 fco1. 62 fco2. 59 fco2 . 2 1 fco
Batch
w/v
g-ml-i1.0101.0101.0101.0101.0101.2120.8080.606
adsorption of colorant and test of improved ' estimateBatch expt 26 B2; F=49.5 ml; co=5.21 fc0 mM-ml-i.
g (obe)
mM-g-'11. 515 fco1.871 fco2. 525 fco2. 525 fco3.188 fco2.962 fco3. 243 fco4.950 fco
Wgo
1.6521.6521.6521.6521.6521.9821.3210.9910
fWq* \\ ~Tfy ^ )Cofci'-
0.0832.1664.2497.3329.6658
1.00280.3278
- .00919
Exponen-tial termof eq (5)
0.9200.8470.7790.7170.5140.3670.7211.0092
Numer-ator ofeq(5)
0.0798.153.221.283.486.633.279
- . 0092
of parameters
Denomi-nator ofeq(5)
0.732.805.873.935
1.1381.6150.600
- . 0182
g/g0 (cal-culated)
0.109.190.253.303.427.392.465.505
<7(calc)
mM-g~l
0.929 fco1.619 fco2.156 fco2. 582 fco3.638 fco3. 340 fco3.962 fco4 .303 fco
Ag
mM-g-i0.561 fco
. 252 fco
. 369 fco- . 0 5 7 fco- . 450 fco- . 3 7 8 fco- . 719 fco
. 647 fco
508

8.52&o versus 4.66&0 for q0 and 0.0490 l/kQ versus0.0685 l/k0 for kx derived from batch and column,respectively, are rather encouraging. If the columnexperiment had yielded results for q0 and kx inidentical agreement with those obtained from thebatch experiment, the dashed line shown in figure 5would have resulted.
6.2. Sulfate Adsorption Parameters
The results obtained in the adsorption of sulfateion by bone char from raw sugar solution are espe-cially significant. Since the concentration of sulfatecan be measured in absolute units (only relativeunits for colorant concentration), a means was avail-able for the first time for estimating that fraction ofthe surface of the adsorbent on which sulfate-adsorption sites existed.
Data collected from the column experiment aregiven in table 4. A semi-logarithmic plot of the
dimensionless quantity (—— 1 j against throughput
gave a reasonably good straight line (in accordancewith eq (10)) with intercept on the zero-throughputordinate of In 10 (or 2.303) and with a slope of—2.373X10~3 ml"1. From these results the valuesofjft and ki were easily determined:
-1 hr"1.x=0.036
TABLE 4. Column adsorption of sulfate
Weight of adsorbent, 562 g; flow rate 300 ml-hr-i; concentration of [SO4]"" in on-liquor, co=9.88mM-l-i« 19.76yueq-ml-i; temperature=80 °C.
Throughput
ml100200300400500600900
1,2001,5001,8001,900
(H8.695.814.683.222.972.171.660.871.680.607.116
The corresponding batch adsorption experimentfor sulfate ion was performed, the data of which aregiven in table 5 (to the left of the double rule).By use of the methods described in the appendix,the final values obtained were
qo=35.4
&! = 0.0287
With these numerical values for the batch adsorptioncapacity and rate constant, the remainder of table 5(to the right of the double rule) was calculated.A comparison between the calculated values of qand the corresponding observed values disclosesa mean square deviation of 1.75 /xM2-g~2 (with sixdegrees of freedom). Considering the number ofvariables involved and the experimental difficultiesassociated especially with column adsorption, theagreement attained for [SO4]
= between column andbatch adsorption is very good. In kinetic studiesof this type, agreement within the same order ofmagnitude is often acceptable.
6.3. Alkaline Earth Cation Adsorption Parameters
The adsorption of calcium and magnesium ionsshould in all fairness be treated separately, sinceeach ion must follow its own unique adsorptionisotherm. The only justification that could begiven for treating the mixture as a composite wouldbe the assumption that the individual ion adsorptioncharacteristics might not be too different one fromthe other. Furthermore, since the data were al-ready available, they were tested according to thepresent theory. The data for the column experimentwhen plotted according to eq (10) were reasonablywell fitted by a straight line as shown in figure 6.From this it may be estimated:
q0-8.6 /xeq-g *
kx ~0.0059 ml • jueq"1 • hr"1and
for the adsorptive capacity and rate constant, re-pectively.
The corresponding batch experiment was appliedto the adsorption of [calcium plus magnesium] withthe data shown in the left half of table 6 subjected
SampleNo.
234 ___57689
W
*50.050.050.050.050.060.040.030.0
TABLE 5
t
hr0.51.01.52.04.04.04.04.0
c
nM-ml-i5.073.362.882.731.861.353.272.07
. Batch
wiv
g>ml-i1.0101.0101.0101.0101.0101.2120.808.606
adsorption of sulfate and test of improved
Batch experiment 26 B2; F=49.5 ml; co=9.90 juM-ml-
a?(obe)
tiM-g~l
4.786 476.957.107.967.058.21
12.92
WqoVco
1.8091.8091.8091.8091.8092.1711.4471.085
0.229.459.688.918
1.8362.6571.0140.1929
Exponen-tial termof eq (5)
0.796.632.503.400.160.070.363.826
estimate of parameters-1 a, b
Numer-ator ofeq(5)
0.204.368.497.600.840.930.637.174
Denomi-nator ofeq(5)
1.0131.1771.3061.4091.6492.1011.0840.259
qfqo (cal-culated)
0.201.313.381.426.509.442.588.672
a?(calc)
uM-g-i3.565.556.767.559.037.84
10.4311.92
nM-g-i1.220.92
.19- . 4 5
-1.07-0.79-2.22
1.01
* Computations have been carried in units of micromoles, but these dimensions were converted to micro equivalents in reporting go and ku* Slight difference in values of co between column and batch experiments is a result of heated blank sample No. 1 in batch experiment redetermined.
509

I I I I I I I I I I I I
0.011200 1600 2000THROUGHPUT,ml
FIGURE 6. Column adsorption of total cations {principallycalcium and magnesium) from a Hawaiian raw sugar liquorby a service bone char.
to the method of^calculation already described. Theright half of table 6 (to the right of the double rule)was computed corresponding to
andg0-70.3
i~0.0030 m
after several successive approximations. No appre-ciable improvement in the degree of fit was indicatedalthough, in this case, a mean square deviation aslarge as 58.1 /xeq2-g~2 (with six degrees of freedom)was estimated between the observed and calculatedvalues of q.
A comparison of batch with column-derivedparameters in this instance discloses a twofolddiscrepancy in the rate constant, while the ad-sorptive capacities disagreed by almost an order ofmagnitude.
7. Fraction of Surface Area Available forAdsorption
It was stated at the beginning of the section onsulfate adsorption that the capacity for adsorptionin absolute units could be used to estimate thefraction of the surface to which the adsorption ofeach species was confined. In the case of [SO4]
=,for example, it was found that the maximum capacity,q0, amounted to about 35 /xeq • g"1 for a service bonechar (Char 117-B) whose B.E.T. area is about80 nr^g"1 (measured by nitrogen adsorption at77 °K). If the effective area of an adsorption sitefor the nitrogen molecule is taken as 16.2 A2, therewould be required 812 JUM of nitrogen per gram ofchar to cover a monolayer for the particular bonechar used. The sulfate ion is a tetrahedron with asulfur-oxygen interatomic separation of 1.51 A [17]and an oxygen radius of 1.32 A. If the effectivearea of an adsorption site for the sulfate ion isroughly 28 A2, then the fraction of the total surfacethat could accommodate sulfate adsorption at themaximum adsorptive capacity of the char (measuredby <?o) would amount to only about 3% percent.
8. Temperature Dependence
Very little has been said here concerning k\, theadsorptive rate constant. Data at several tempera-tures would certainly be of prime importance inorder to ascertain whether eq (5) might be madeeven more general. It would be anticipated thatk1 might be replaced by an exponential Arrheniustype formulation to describe the temperature de-pendence of adsorption providing temperature hasno more than a trivial effect upon q0) as was foundby Hirst and Lancaster [18].
9. Shapes of Adsorption Curves
The practical (finite time) adsorption curves,some examples of which are given here in figures1, 2, and 4, should not be confused with equilibriumadsorption isotherms. The experimentally observedcurves may have so many different shapes that theyare difficult to catalog. Figure 7, for example, is aplot of the results already given for the batchadsorption of sulfate ion by bone char from a raw
SampleNo.
234 _ _57689
W
^50.050.050.050.050.060.040.030.0
TABLE
t
hr0.51.01.52.04.04.04.04.0
6. [Ca]
c
iieq-ml-i48.945.141.941.739.637.545.041.7
++ plus
w/v
1.0101.0101.0101.0101.0101.2120.808
.606
[Mg]++ composite adsorption and test of improved estimate ofBatch experiment 26 B2; T/=49.5 ml; co=64.5O Meq-ml-i
£(obs)
neq-g-i15.419.222.422.624.722.324.137.6
Wqo
Fco
1.1011.1011.1011.1011.1011.3210.881.6605
0.0099.0198.0297.0396.0792.2517
- . 0933- . 2662
Exponen-tial termof eq (5)
0.9902.9804.9708.9612.9239.778
1. 09771.3000
Numer-ator ofeq(5)
0.00985.0196.0292.0388.0761.222
-.0977-.3000
Denomi-nator ofeq(5)
0.111.121.130.140.177.543
- .217-.6395
parameters
q/qo (cal-culated)
0.0887.162.225.277.430.409.450.469
g(calc)
fieq-g-i6.2
11.415.819.530.228.831.633.0
Aq
neq-g-i9.27.86.63.1
- 5 . 5- 6 . 5- 7 . 5
4.6
510
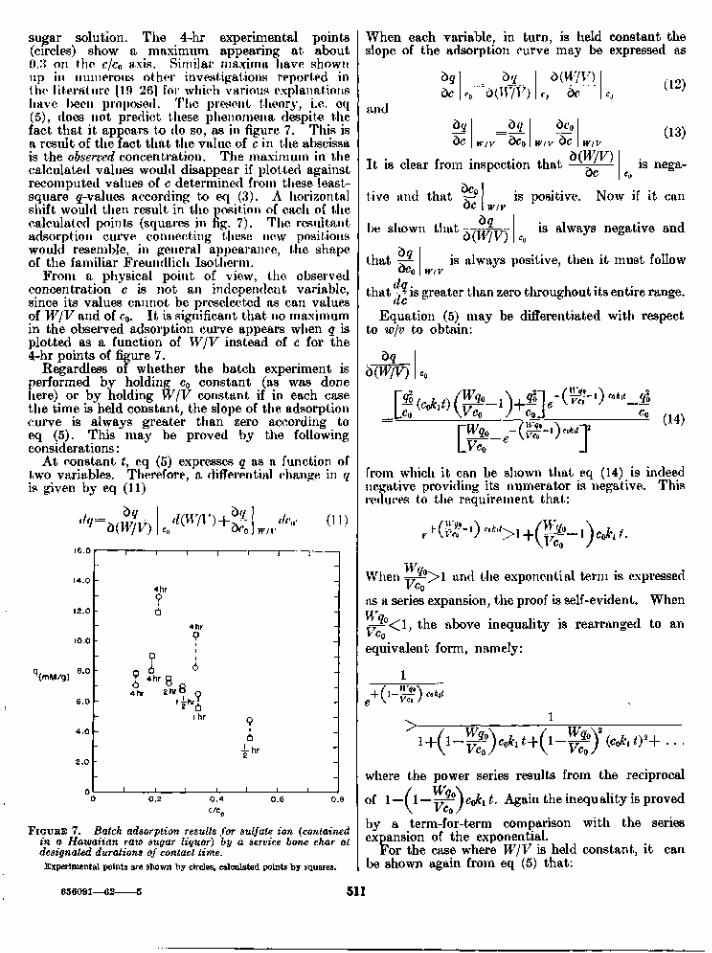
sugar solution. The 4-hr experimental points(circles) show a maximum appearing at about0.3 on the c/c0 axis. Similar maxima have shownup in numerous other investigations reported inthe literature [19-26] for which various explanationshave been proposed. The present theory, i.e. eq(5), does not predict these phenomena despite thefact that it appears to do so, as in figure 7. This isa result of the fact that the value of c in the abscissais the observed concentration. The maximum in thecalculated values would disappear if plotted againstrecomputed values of c determined from these least-square ^-values according to eq (3). A horizontalshift would then result in the position of each of thecalculated points (squares in fig. 7). The resultantadsorption curve connecting these new positionswould resemble, in general appearance, the shapeof the familiar Freundlich Isotherm.
From a physical point of view, the observedconcentration c is not an independent variable,since its values cannot be preselected as can valuesof W/V and of c0. It is significant that no maximumin the observed adsorption curve appears when q isplotted as a function of W/V instead of c for the4-hr points of figure 7.
Regardless of whether the batch experiment isperformed by holding c0 constant (as was donehere) or by holding W/V constant if in each casethe time is held constant, the slope of the adsorptioncurve is always greater than zero according toeq (5). This may be proved by the followingconsiderations:
At constant t, eq (5) expresses g as a function oftwo variables. Therefore, a differential change in qis given by eq (11)
W/V01)
I2.0 -
q(mM/g)
4.0 -
2.0
1
-
-
-
-
g6
4hr
i
—!
4hr9
g64hr g
2hr
i i
4hr9i
i
6
I hr
i I I
-
-
-
_
-
-
9i
i i i
FIGURE 7. Batch adsorption results for sulfate ion (containedin a Hawaiian raw sugar liquor) by a service bone char atdesignated durations of contact time.Experimental points are shown by circles, calculated points by squares.
When each variable, in turn, is held constant theslope of the adsorption curve may be expressed as
(12)
(13)
is nega-
dqdc
anddqdc
It is clear from ]
- &2__d(W/V) cj dc
dqw/v dc0
inspection
dc0
w/v dc
that —
IV)
w/v
(W/V)dc
tive and thatdc
be shown that
dqthat
dc0
dq.W/V
is positive. Now if it can7
STWTTA ^S a l w a y s negative andO \ WI V) c0
is always positive, then it must follow
that -^ is greater than zero throughout its entire range.
Equation (5) may be differentiated with respectto w/v to obtain:
b(W/V)
(14)
— e 1from which it can be shown that eq (14) is indeednegative providing its numerator is negative. Thisreduces to the requirement that:
WhenV CQ
and the exponential term is expressed
as a series expansion, the proof is self-evident. When
^ r ^ < l , the above inequality is rearranged to an
equivalent form, namely:
1/ Wqo\ co ht
ty+...
where the power series results from the reciprocal
of 1 — ( 1 — y^5 ) cQki t. Again the inequ ality is proved
by a term-for-term comparison with the seriesexpansion of the exponential.
For the case where W/V is held constant, it canbe shown again from eq (5) that:
656091—62- 511
£dc0
WcJ UVWw-o-(TFF-i) «>M
wiv(15)
and by the same type of reasoning as in the previous
case, it follows that ^ >0 .^£0 w/v
10. Simplified Method for EvaluatingParameters
Most of the present treatment included in eqs(11) through (15) has been concerned with the spe-cial requirements of eq (5) that q be considered afunction of the ratio W/V or of c0, but that t be heldconstant. The least-squares method (method 2 illus-trated in the appendix) of determining the optimumvalues for qG and ki is exact and applicable in allcases—even when the values of the three independentvariables are simultaneously changed from batch tobatch. At best, however, the method is laborious,since it is based on a process of successive approxima-tions. The experimental arrangement also is some-what inefficient in that it limits each batch to oneexperimental point. The experimental setup wouldbe much simpler if, say, only one flask were used andthe course of adsorption as a function of time weremeasured in situ. This would be equivalent to theconsideration of q as a function only of t. This givesrise to the simplest and quickest determination of q(]and ki from only two measurements by judiciouschoice of the intervals. Let qx correspond to the timetu and q2 to time t2 such that t2=2tx. If eq (5) issolved for its exponential term and the data of thesetwo experimental points are substituted back, thefollowing pair of equations results:
(16)g o " gi
q.o—q.2
They may be solved simultaneously by squaring bothsides of the first equation and eliminating the expo-nent. The equation which remains may be solveddirectly for q0 to yield eq (17).
(17)
Then, by back substitution it can be shown that:
In2o— <
go-gi
catAl-(18)
~VcJ
An excellent opportunity for testing the self-consistency of eqs (17) and (18) is afforded by thepreviously cited reference of Dryden and Kay [1].They used a conductivity cell head attached to theadsorption flask to measure changes in concentrationof aqueous acetic acid as a function of time. Theadsorbent was steam-activated coconut carbon. Thetotal duration of their adsorption experiment was60 min (at 30±0.5 °C) at the end of which time,adsorption was virtually complete. The weight,W, of the carbon was 3.00 g; the volume V of solu-tion was 100 ml; and the initial concentration c0 ofacetic acid was 0.0306 N. After the first 5 min,Dryden and Kay measured the following concentra-tions at the times indicated:
tmin10. 015. 020. 030. 045.060.0
cmeq -ml"1
0. 0200. 0185. 0166.0155.0147. 0140
The 10.0 and 20.0 min data give rise to qx and q2values of 0.3533 and 0.4667 meq-g"1, respectively, byapplication of eq (3). These, in turn, may be sub-stituted in eqs (17) and (18) to yield q0 and kx directly.A second independent determination results from the15.0 and 30.0 min data and a third determinationfrom the 30.0 and 60.0 min data. These determina-tions are, respectively:
go *imeq0.576573565
ml•meq333
~* • mm"1
•94•55.74
In dimensions comparable to the work of the presentpaper this would correspond to about 570 /-teq • g"1
for q0 and about 0.22 ml • t̂eq"1 • hr"1 for ku It isseen, for example, that Dryden and Kay's charcoalexhibited about ten times the capacity for acetic acidadsorption from aqueous solution as did our servicebone char for sulfate from a raw sugar liquor. Also,their rate constant was greater by about the same
512
factor despite their lower temperature, as might havebeen anticipated qualitatively because of the dif-ferences in viscosities.
The methods given in the appendix for determiningthe parameters from batch adsorption were devisedfor desk calculator computation. Where manybatch experiments are to be made on a routine basis,or where it may be preferred to use eq (19) in placeof eq (5) it is more practical to enlist the services ofa digital computer.
11. General Equation When Desorption IsAppreciable
In the event that the desorption rate constant k2is retained in the integration of eq (1), the resultantadsorption equation becomes :
(M-N)-g_M-N 2N ffl (19)
where
and
Equation (19) reduces to eq (5), as expected, whenk2 is set equal to zero. By the same token W/V is elim-inated by means of eq (3), and it is interesting toshow that as time, t, goes to infinity, equation (19)reduces to the familiar Langmuir adsorptionisotherm:
-i+Ke (20)q=
where the equilibrium constant K is defined in theusual way as the ratio of the individual rate con-stants, ki/tc2.
12. Summary
A batch adsorption equation was derived whichexpresses the amount of solute adsorbed per unitweight of adsorbent at constant temperature as afunction of solution volume, concentration, amountof adsorbent, and time of contact. The equation isgiven in terms of only two constants, both of whichhave physical significance and are extremely usefulin adsorption work. One of these parameters, qOj isa measure of the maximum adsorptive capacity ofthe adsorbent for the solute or species adsorbed,while the other parameter, k\, is the specific adsorp-tion rate constant applicable at that temperature.
For known mixtures of different mesh (or grainsize) of the same adsorbent the adsorptive capacityappeared to be an additive property.
The relative abundance of adsorption sites exhib-ited by a family of carbonaceous adsorbents foradsorption of organic colorant molecules was approxi-mately proportional to the known surface areas ofthe adsorbents.
Adsorptive capacities and rate constants obtainedfrom the batch adsorption equation were in sub-stantial agreement with the numerical values for thesame parameters obtained from column adsorptionexperiments performed simultaneously under identi-cal conditions.
13. Appendix. General Methods for Cal-culating qQ and kx
13.1. Method 1
The first method illustrated is applicable to eq (4).Let jP(exp) and i^cai) be defined such that
andFiexp)=\nc0/c
lml)_WjX T7 /tit-
q Vgjgl
anddq0 V 1 —ff/tfo
(la)
(2a)
(3a)
(4a)
(5a)
A value for q() is assumed. Now in the equation:
AF=\\\ C(,/c+ln (1 —<7/#o)—&I—ST^' (6a)
which may be separately determined for each point,numerical values are assignable to all quantitiesexcept ki and AF. A "best" value of kx consistentwith the initial choice of q0 is obtained by least-squaring AF over all points. This results in theequation:
(7a)from which the first kx is evaluated.
If both q0 and kx were now to be "corrected" byadding to each the quantities Aq0 and A&i, respec-tively, according to the first terms of a Taylor's expan-sion in two variables [27], one of the resultant normalequations obtained from all the points would be:
However, in the present application kx is held con-stant temporarily while q0 is allowed to vary, hencethe second term of eq (8a) vanishes and there results:
513
(9a)
from which a Aq0 is computed.The sign of Aq0 indicates the direction of the next
choice for q0 although its magnitude usually willgrossly underestimate the extent of the correction.However, a plot of Aq0 against q0 quickly discloses,after a few trials, the choice of q0 which causes Aq0 tovanish. Concurrently, it can be verified that assuccessive q0 choices are made closing the gapbetween the plus and minus values of Aq0, themagnitude of the corresponding new sums computedfor 2(AF)2 tend toward a minimum.
Method 1 is subject to some bias, partly because itcompares solution concentrations instead of amountsabsorbed per gram and partly because the comparisonis logarithmic. Despite these disadvantages, it re-quires successive choices of q0 only, and it is applicableover wide ranges. An example of the application ofmethod 1 was indicated in table lb.
13.2. Method 2
The second method is applicable to eq (5). It isfree from the serious limitations of method 1 andfollows a more conventional procedure, as given byScarborough [27]. The value of q obtained bysubstituting the experimentally observed value of cinto eq (3) is termed </(Obs). For a given choice of k\and q0, eq (5) may be used to calculate a q for eachcombination of W, V, t, and c0, and this value isdesignated g<caic). Thus, Aq=q(ot,s) — gccaio- By ob-taining partial derivatives of q in eq (5) it can beverified that:
— 1 ) coqote' T T T - 1 J ' o M
(10a)
and
(lla)
For a particular choice of kx and q0, the quantityX(Aq)2 (summed over all n measurements) is ameasure of goodness to fit . . . the smaller thesummation value, the better the choice of kx and q0.The initial choice of these parameters has beensuccessively improved by adding to kx the quantity:
y ,(12a)
and by adding to % the quantity:
S (B(13a)
It should be pointed out that this procedure assignsall of the variability of q first to one parameter andthen to the other. Thus, it tends to over-correct,but by a lesser amount each trial. After a few suchtrials have been made, in a given experiment, if isusually possible to converge more quickly by aweighted averaging of the results so far. Thisseparate adjustment has been found to work con-sistently better than by assigning the variability inq to a simultaneous adjustment in kt and q0.
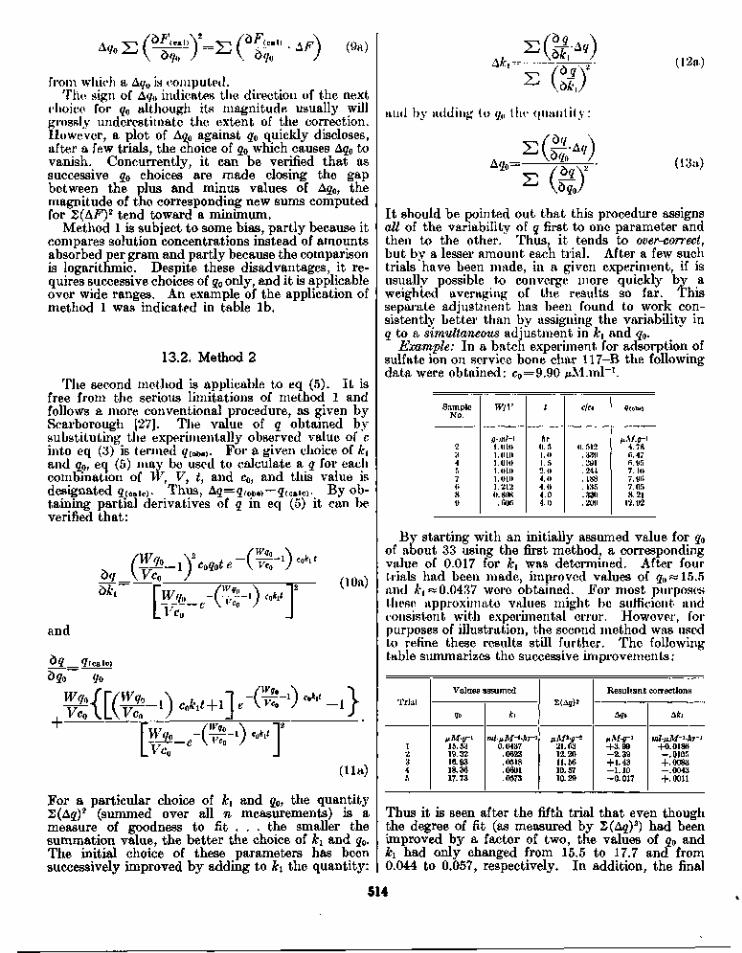
Example: In a batch experiment for adsorption ofsulfate ion on service bone char 117-B the followingdata were obtained: co=9.9O /xM.ml"1.
SampleNo.
2a4r>7fi89
W/V
q-ml~l
1.0101.0101.0101.0101.0101. 2120.808
. 606
t
hr0.51.01.52.04.04.04.04.0
c/co
0. 512. 339.291.244.188. 135.330.209
ffCobs)
4.786. 476.957.107.967. 058.21
12.92
By starting with an initially assumed value for q0of about 33 using the first method, a correspondingvalue of 0.017 for kx was determined. After fourtrials had been made, improved values of qo^15.5and ki —0.0437 were obtained. For most purposesthese approximate values might be sufficient andconsistent with experimental error. However, forpurposes of illustration, the second method was usedto refine these results still further. The followingtable summarizes the successive improvements:
Trial
12345
Values assumed
ffo
15.5319.3216.9318.3617.73
hi
0.0437.0623.0518.0601.0573
2(A</)2
M21.6312.2011.5610.5710.29
Resultant corrections
AQD
+3.99-2.39+1.43—1.10-0.017
M i
+0.0186-.0105+ . 0083-.0043+.0011
Thus it is seen after the fifth trial that even thoughthe degree of fit (as measured by S(Ag)2) had beenimproved by a factor of two, the values of q0 andk\ had only changed from 15.5 to 17.7 and from0.044 to 0.057, respectively. In addition, the final
514

Ago and A&i, quantities amounted to changes ofless than 0.1 and 2 percent, respectively, in g0 andki. Further refinement could not be justified.
The author thanks members of the Bone CharResearch Project for their assistance in carryingout much of the experimental work.
14. References[1] C. E. Dryden and W. B. Kay, Ind. Eng. Chem. 46,
2294 (1954).[2] S. Eagle and J. W. Scott, Ind. Eng. Chem. 42, 1287
(1950).[3] R. L. Geddes, Trans. Am. Inst. Chem. Engrs. 42, 88
(1946).[4] W. D. Harkins and D. M. Gans, J. Am. Chem. Soc.
53, 2804 (1931).[5] H. A. Smith and J. F. Fuzek, J. Am. Chem. Soc. 68,
229 (1946).[6] E. B. Greenhill, Trans. Faraday Soc. 45, 625 (1949).[7] E. R. Linner and A. P. Williams, J. Phys. & Colloid.
Chem. 54, 610 (1950).[8] Y. Fu, R. S. Hansen, and F. E. Bartell, J. Phys. &
Colloid. Chem. 52, 374 (1948).[9] R. S. Hansen, Y. Fu, and F. E. Bartell, J. Phys. &
Colloid. Chem. 53, 769 (1949).[10] F. E. Bartell and D. J. Donahue, J. Phys. Chem. 56
665 (1952).[11] W. W. Ewing and F. W. J. Liu, J. Colloid. Sci. 8, 209
(1953).
[12] W. V. Loebenstein, Proc. of Fifth Tech. Sess. on BoneChar, 253 (1957).
[13] H. S. Harned, J. Am. Chem. Soc. 42, 372 (1920).[14] A. Gee, L. P. Domingues, and V. R. Deitz, Anal. Chem.
26, 1487 (1954).115] L. P. Domingues, Proc. of Fourth Tech. Sess. on Bone
Char, 347 (1955).1.16] V. R. Deitz, Ann. N.Y. Acad. Sci. 49, 315, (1948).[17] Linus Pauling, The Nature of the Chemical Bond,
Cornell Univ. Press (1948) p 240.[18] W. Hirst and J. K. Lancaster, Research (London) 3,
337 (1950).[19] M. L. Corrin, E. L. Lind. A. Roginsky and W. D.
Harkins, J. Colloid. Sci. 4, 485 (1949).[20] F. H. Nestler and H. G. Cassidy, J. Am. Chem. Soc.
72, 680 (1950).[21] R. S. Hansen and W. V. Fackler, Jr., J. Phys. Chem.
57, 634 (1953).[22] R. D. Void and A. K. Phansalkar, Rec. Trav. Chim.
74, 41 (1955).[23] A. Fava and H. Eyring, J. Phys. Chem. 60, 890 (1956).[24] B. Tamamushi and K. Tamaki, Trans. Faraday Soc.
55, 1007 (1959).[25] F. H. Sexsmith and H. J. White, Jr., J. Colloid. Sci.
14, 598 (1959).[26] Y. Gotshal, L. Rebenfeld, and H. J. White, Jr. ibid,
619 (1959).[27] J. B. Scarborough, Numerical Mathematical Analysis
2d Ed., The Johns Hopkins Press, Baltimore (1950)pp 451-469.
(Paper 66A6-186)
515