basin&and&petroleum&system&modeling&for& piceance&basin ... ·...
TRANSCRIPT

Basin and Petroleum System Modeling for Piceance Basin and Uncertainty Quan8fica8on
Basin and Petroleum System Modeling Group 5th Annual Affiliates Mee:ng
November 28, 2012 hCp://bpsm.stanford.edu
Yao Tong1, Tapan Mukerji1, Allegra Hosford Scheirer1, Paul Weimer2, Stephen Cumella3, Kenneth Peters4 1. Stanford University, 2. University of Colorado Boulder,
3. Endeavour Interna8onal Corpora8on, 4. Schlumberger Informa8on Solu8ons
Outline
• Project Overview • Piceance Basin Background and Basin Centered Gas Accumula:on (BCGA)
• Current 1-‐D model study • Progress on 3-‐D modeling • Uncertainty quan:fica:on
Nov-‐28-‐2012 2012 BPSM 2
Project Overview
• Phase 1: Construct 1D and 3D basin models for Piceance Basin to beCer understanding of basin-‐centered gas accumula:ons in Piceance Basin
• Phase 2: Study and test the sensi:vi:es and quan:fy the uncertain:es in basin modeling study
• Explore new modules in PetroMod soXware
Nov-‐28-‐2012 2012 BPSM 3
Piceance Basin Background
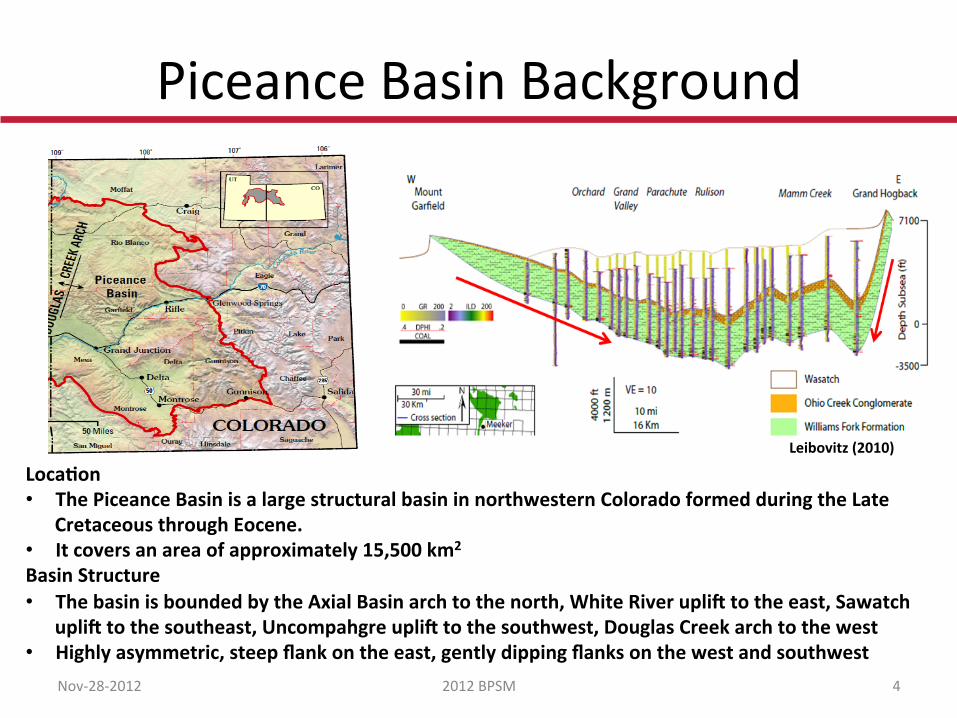
Loca8on • The Piceance Basin is a large structural basin in northwestern Colorado formed during the Late
Cretaceous through Eocene. • It covers an area of approximately 15,500 km2
Basin Structure • The basin is bounded by the Axial Basin arch to the north, White River upliU to the east, Sawatch
upliU to the southeast, Uncompahgre upliU to the southwest, Douglas Creek arch to the west • Highly asymmetric, steep flank on the east, gently dipping flanks on the west and southwest
Nov-‐28-‐2012 2012 BPSM 4
Leibovitz (2010)
Stra:graphy of Piceance Basin
Nov-‐28-‐2012 2012 BPSM 5
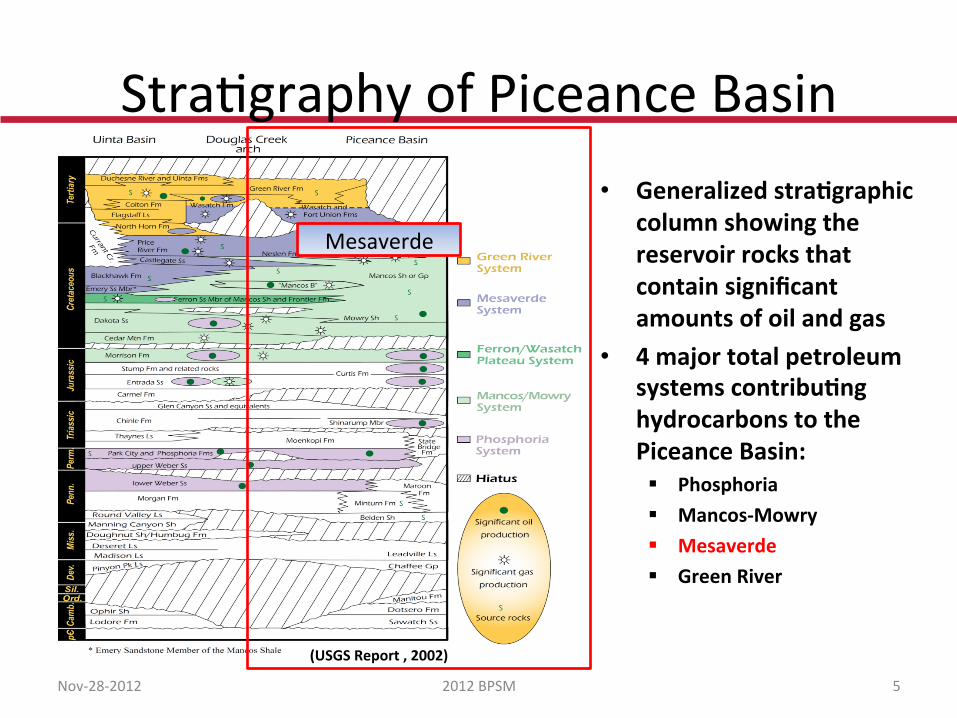
• Generalized stra8graphic column showing the reservoir rocks that contain significant amounts of oil and gas
• 4 major total petroleum systems contribu8ng hydrocarbons to the Piceance Basin: § Phosphoria § Mancos-‐Mowry § Mesaverde § Green River
(USGS Report , 2002)
Mesaverde
Basin Produc:on history and Basin Centered Gas Accumula:on (BCGA)
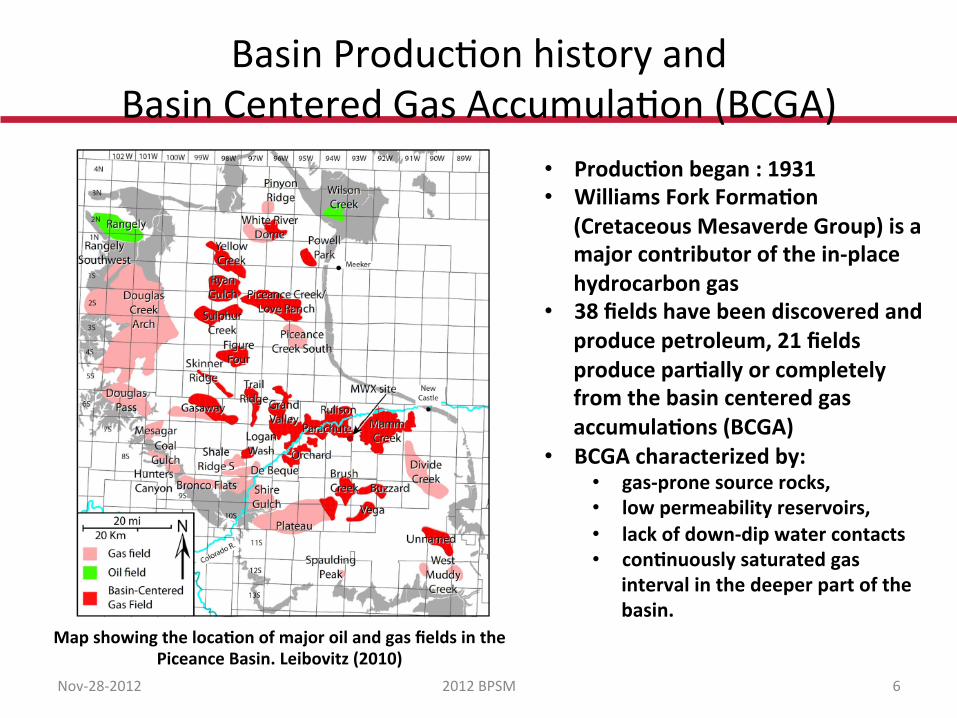
• Produc8on began : 1931 • Williams Fork Forma8on
(Cretaceous Mesaverde Group) is a major contributor of the in-‐place hydrocarbon gas
• 38 fields have been discovered and produce petroleum, 21 fields produce par8ally or completely from the basin centered gas accumula8ons (BCGA)
• BCGA characterized by: • gas-‐prone source rocks, • low permeability reservoirs, • lack of down-‐dip water contacts • con8nuously saturated gas
interval in the deeper part of the basin.
Nov-‐28-‐2012 2012 BPSM 6
Map showing the loca8on of major oil and gas fields in the Piceance Basin. Leibovitz (2010)

Study Objec:ves Ø Phase 1: 1-‐D and 3-‐D basin modeling • Construct 1D model and study the Mesaverde Petroleum System with exis8ng
source rock gas genera8on and calibrate with previous study • Construct 3D model and explored other source rock, inves8gate contribu8ons of
other gas source intervals to the BCGA
Ø Phase 2: Sensi8vity Analysis – What are the impacts of uncertain8es in the input data on the model? – What is the probability of extreme scenarios? – How sensi8ve are the rela8ons between parameter varia8ons and the
resul8ng output varia8on? – What are the impacts of spa8al uncertain8es in lithologies and rock
proper8es on the model?
Nov-‐28-‐2012 2012 BPSM 7
Current 1D Model
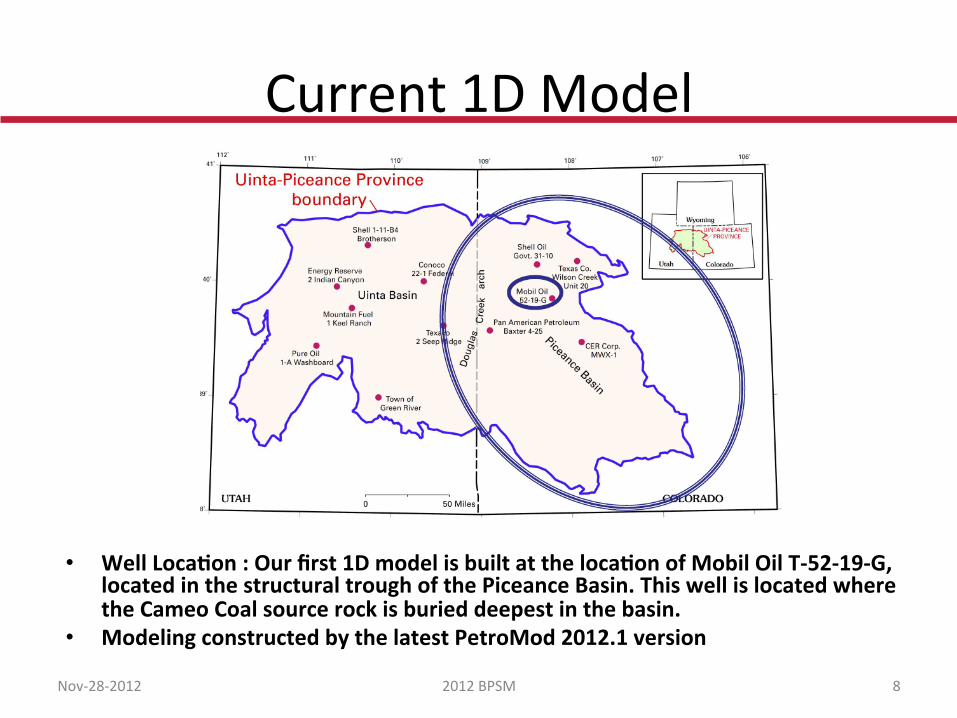
• Well Loca8on : Our first 1D model is built at the loca8on of Mobil Oil T-‐52-‐19-‐G, located in the structural trough of the Piceance Basin. This well is located where the Cameo Coal source rock is buried deepest in the basin.
• Modeling constructed by the latest PetroMod 2012.1 version
Nov-‐28-‐2012 2012 BPSM 8
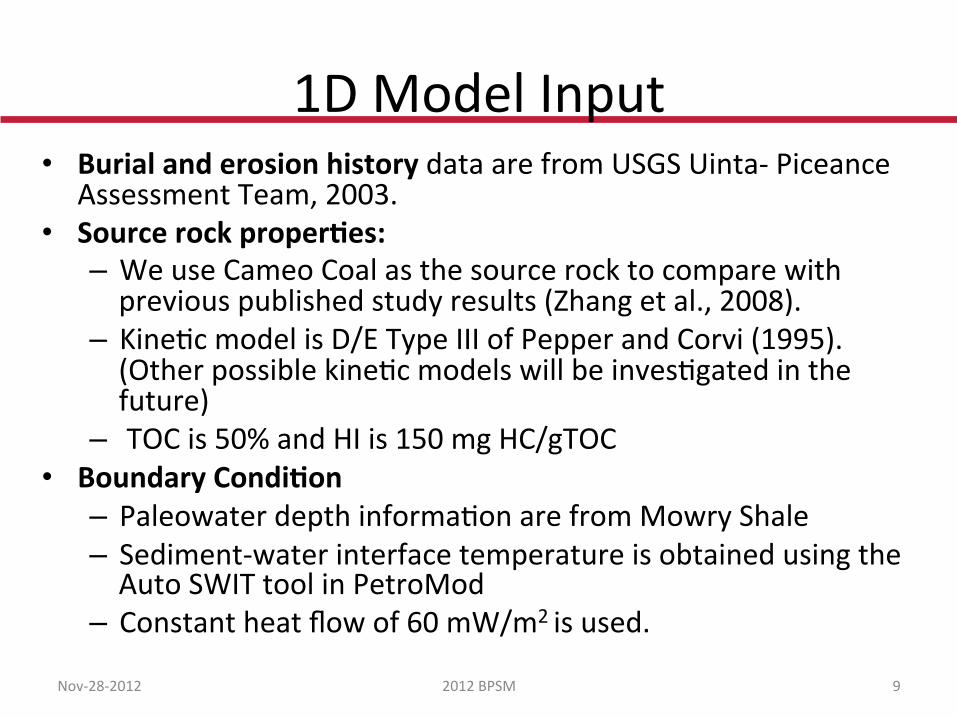
1D Model Input • Burial and erosion history data are from USGS Uinta-‐ Piceance
Assessment Team, 2003. • Source rock proper8es:
– We use Cameo Coal as the source rock to compare with previous published study results (Zhang et al., 2008).
– Kine:c model is D/E Type III of Pepper and Corvi (1995). (Other possible kine:c models will be inves:gated in the future)
– TOC is 50% and HI is 150 mg HC/gTOC • Boundary Condi8on
– Paleowater depth informa:on are from Mowry Shale – Sediment-‐water interface temperature is obtained using the Auto SWIT tool in PetroMod
– Constant heat flow of 60 mW/m2 is used.
Nov-‐28-‐2012 2012 BPSM 9
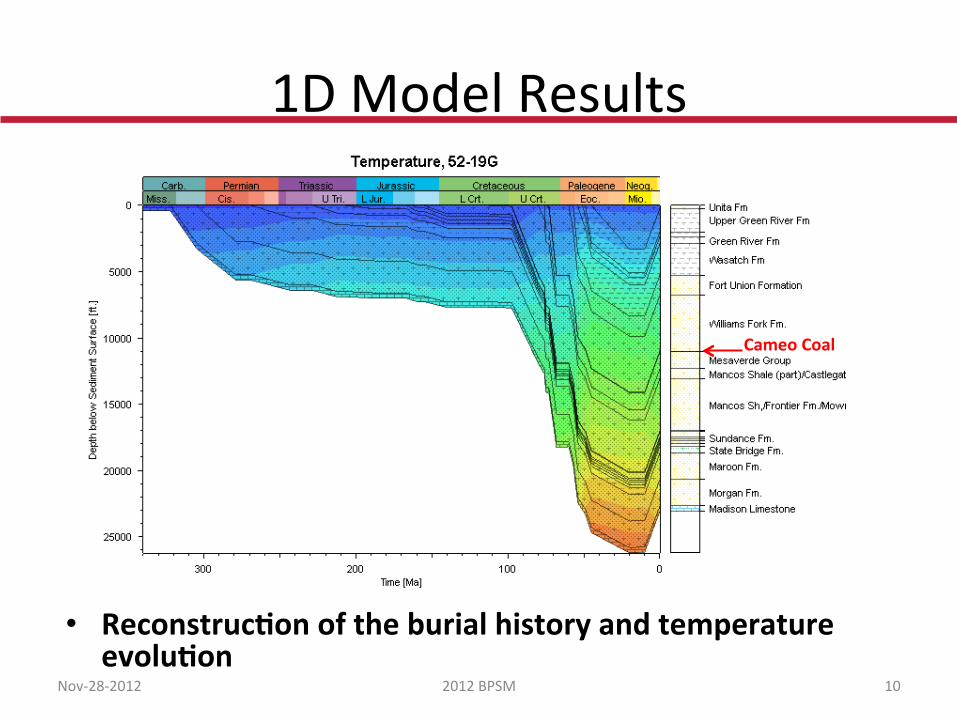
1D Model Results
• Reconstruc8on of the burial history and temperature evolu8on
Nov-‐28-‐2012 2012 BPSM 10
Cameo Coal
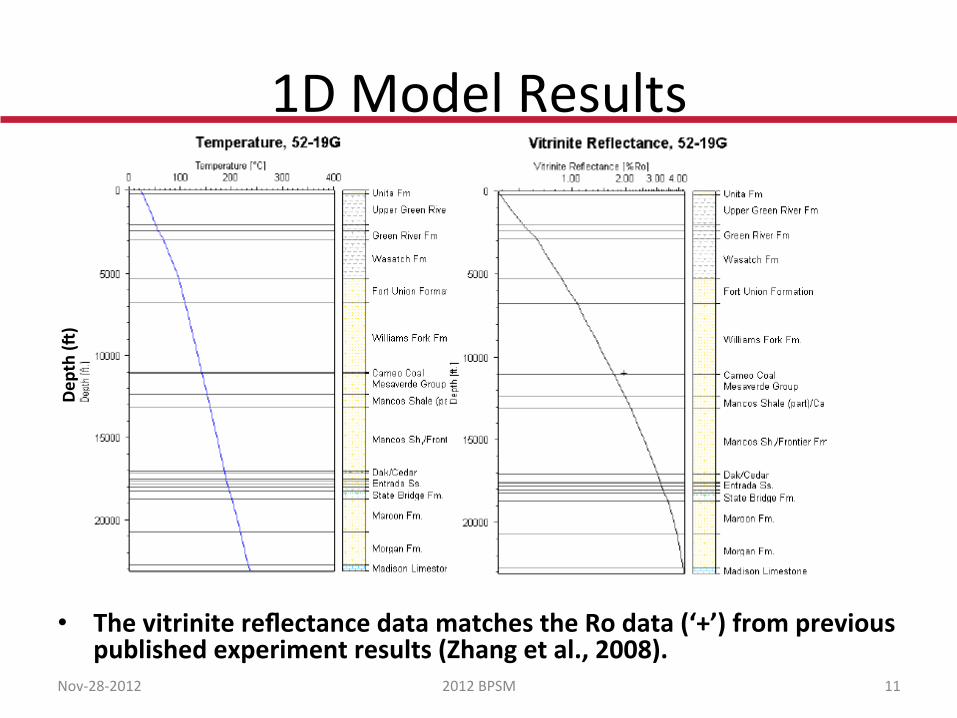
• The vitrinite reflectance data matches the Ro data (‘+’) from previous published experiment results (Zhang et al., 2008).
1D Model Results
Nov-‐28-‐2012 2012 BPSM 11
Depth (U)
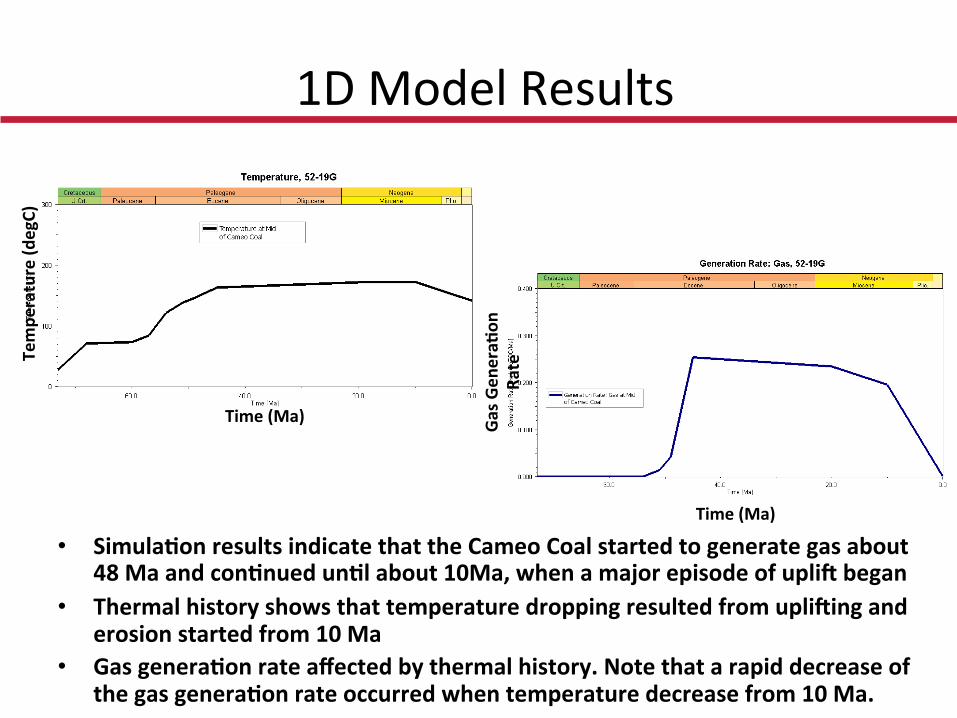
1D Model Results
• Simula8on results indicate that the Cameo Coal started to generate gas about 48 Ma and con8nued un8l about 10Ma, when a major episode of upliU began
• Thermal history shows that temperature dropping resulted from upliUing and erosion started from 10 Ma
• Gas genera8on rate affected by thermal history. Note that a rapid decrease of the gas genera8on rate occurred when temperature decrease from 10 Ma.
Time (Ma)
Tem
perature (d
egC)
Time (Ma) Gas Gen
era8
on
Rate
1D model limita:on
• A 1D model might quan:ta:vely model the hydrocarbon charge at a certain loca:on within basin but it lacks the capability to capture the evolu:on in lateral direc:ons and thus 3D model is required for regional study
Nov-‐28-‐2012 2012 BPSM 13
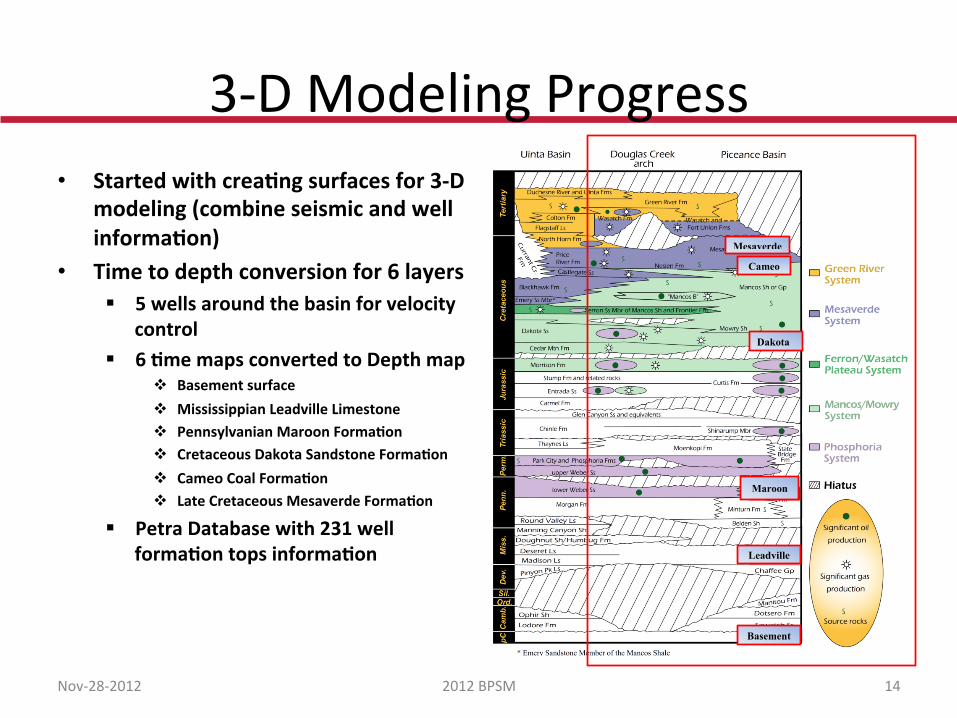
3-‐D Modeling Progress • Started with crea8ng surfaces for 3-‐D
modeling (combine seismic and well informa8on)
• Time to depth conversion for 6 layers § 5 wells around the basin for velocity
control § 6 8me maps converted to Depth map
v Basement surface v Mississippian Leadville Limestone v Pennsylvanian Maroon Forma8on v Cretaceous Dakota Sandstone Forma8on v Cameo Coal Forma8on v Late Cretaceous Mesaverde Forma8on
§ Petra Database with 231 well forma8on tops informa8on
Nov-‐28-‐2012 2012 BPSM 14
Mesaverde
Dakota
Cameo
Maroon
Leadville
Basement
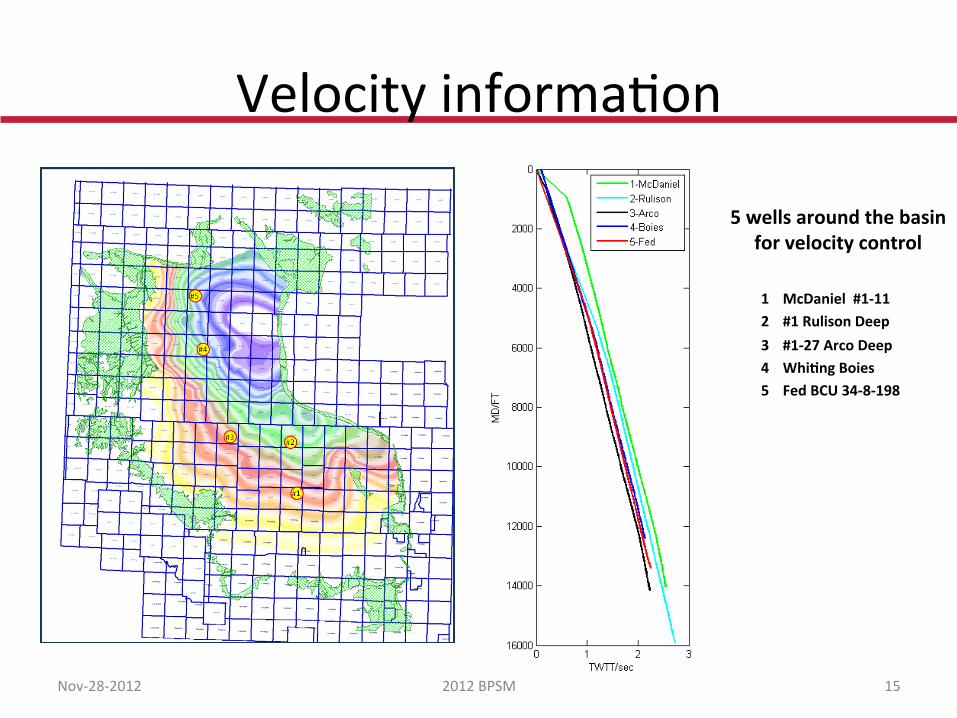
Velocity informa:on
5 wells around the basin for velocity control
1 McDaniel #1-‐11 2 #1 Rulison Deep 3 #1-‐27 Arco Deep 4 Whi8ng Boies 5 Fed BCU 34-‐8-‐198
Nov-‐28-‐2012 2012 BPSM 15
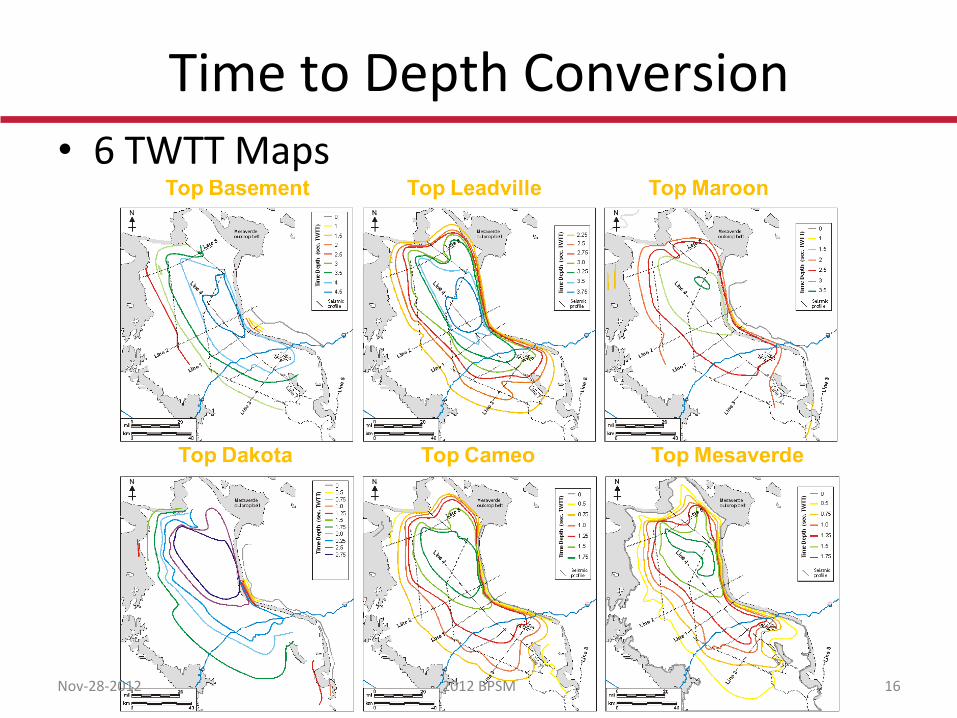
Time to Depth Conversion • 6 TWTT Maps
Nov-‐28-‐2012 2012 BPSM 16
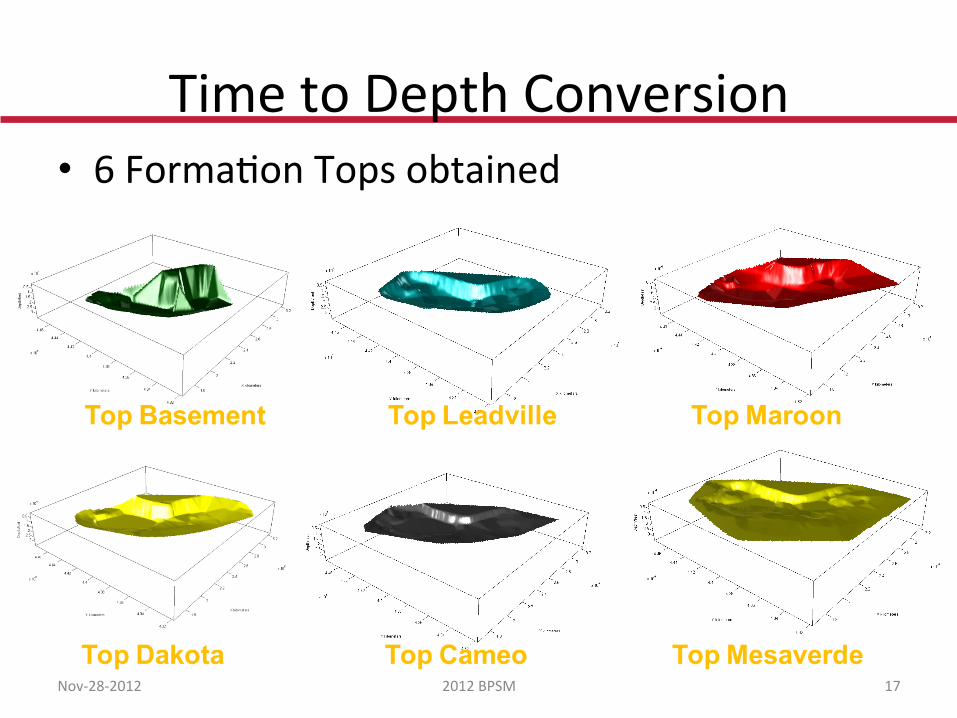
Time to Depth Conversion • 6 Forma:on Tops obtained
Nov-‐28-‐2012 2012 BPSM 17
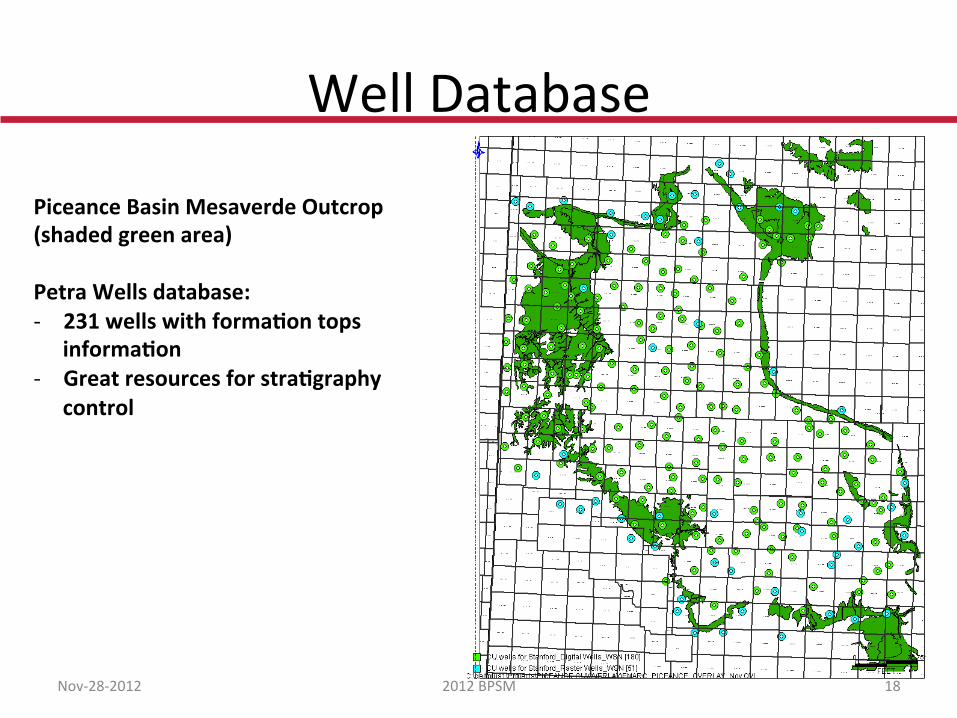
Well Database
Piceance Basin Mesaverde Outcrop (shaded green area) Petra Wells database: -‐ 231 wells with forma8on tops
informa8on -‐ Great resources for stra8graphy
control
Nov-‐28-‐2012 2012 BPSM 18

Uncertainty Quan:fica:on Uncertainty Quan8fica8on: Basin and petroleum system modeling covers large spa8al and temporal intervals. Many of the input parameters are highly uncertain and needed further inves8ga8on • What are the impacts of uncertain:es in the input data on the model? • What is the probability of extreme scenarios? • How sensi:ve are the rela:ons between parameter varia:ons and the resul:ng output
varia:on? • What are the impacts of spa:al uncertain:es in lithologies and rock proper:es on the
model?
Global Sensi8vity Analysis Method recently developed by SCRF(Stanford Center for Reservoir Forecas8ng): • Generate mul:ple models and obtain model response • Cluster models into different classes in MDS space (lower dimension space) • Conduct sensi:vity analysis and iden:fy significant parameters/interac:ons between
parameters which impact the model response most Nov-‐28-‐2012 2012 BPSM 19
Summary and Future Work Ø Phase 1: 1-‐D and 3-‐D basin modeling • Construct 1D model and study the Mesaverde Petroleum System with exis8ng
source rock gas genera8on and calibrate with previous study • (Poster on AAPG Rocky Mountain Sec8on, Sep 9-‐12, 2012) • Construct 3D model and explored other source rock inves8gate contribu8ons of
three gas source intervals to the BCGA: – Cameo coals in the Lower Williams Fork – Niobrara shale – Castlegate condensed sec8on in the Mancos Shale
Ø Phase 2: Global Sensi8vity Analysis apply on Basin Modeling – Iden8fy model response – Study both con8nuous and categorical parameters impact
Nov-‐28-‐2012 2012 BPSM 20
Acknowledgement

Backup
Nov-‐28-‐2012 2012 BPSM 22
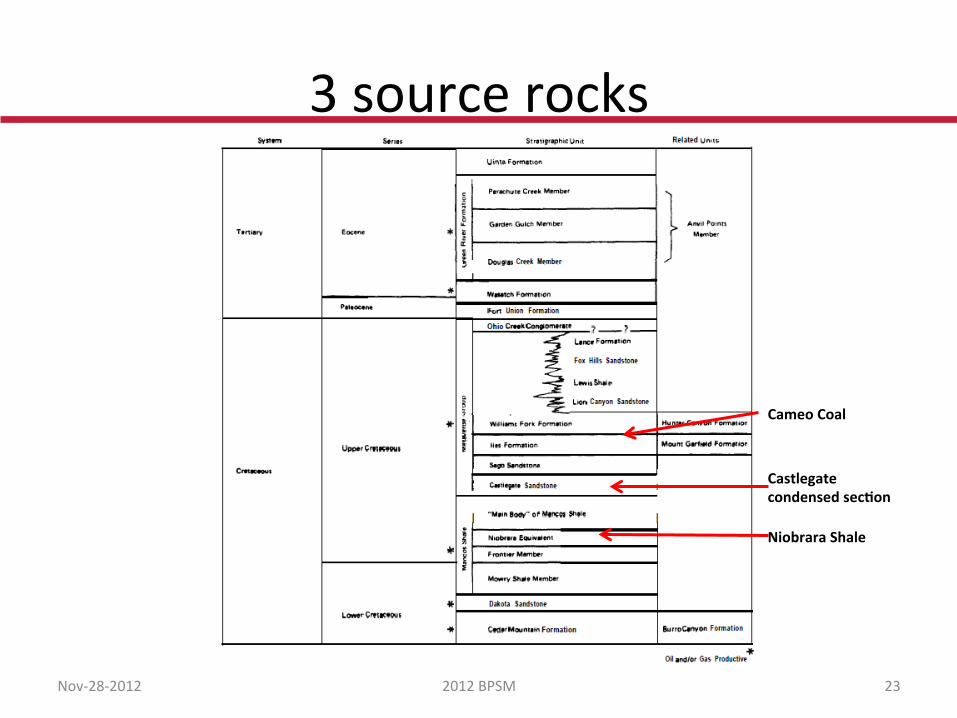
3 source rocks
Nov-‐28-‐2012 2012 BPSM 23
Cameo Coal
Castlegate condensed sec8on
Niobrara Shale
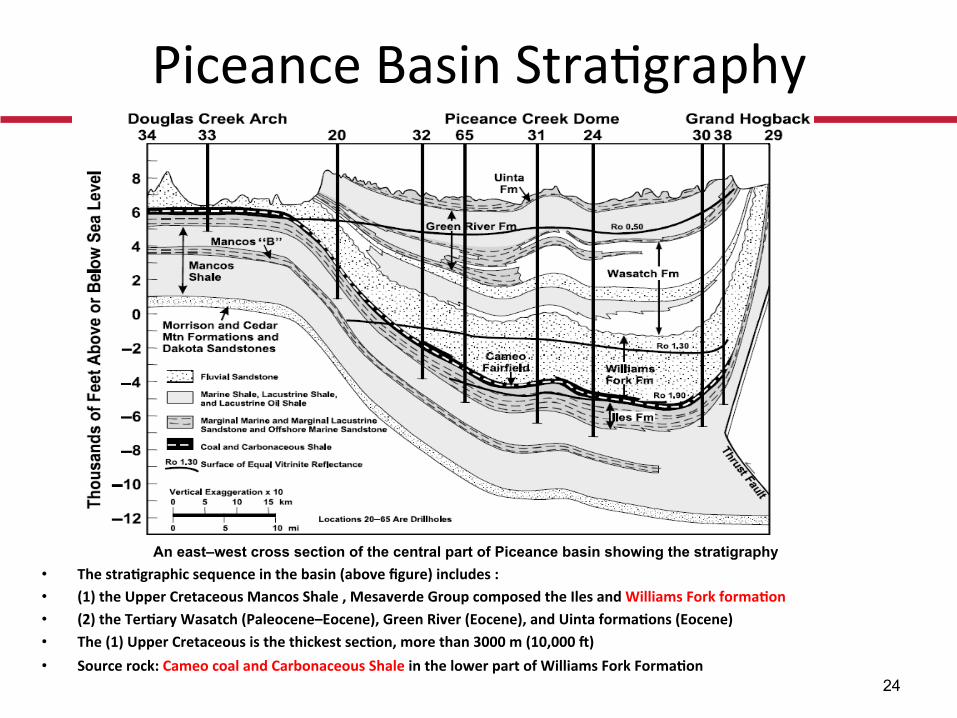
Piceance Basin Stra:graphy
• The stra8graphic sequence in the basin (above figure) includes : • (1) the Upper Cretaceous Mancos Shale , Mesaverde Group composed the Iles and Williams Fork forma8on • (2) the Ter8ary Wasatch (Paleocene–Eocene), Green River (Eocene), and Uinta forma8ons (Eocene) • The (1) Upper Cretaceous is the thickest sec8on, more than 3000 m (10,000 U) • Source rock: Cameo coal and Carbonaceous Shale in the lower part of Williams Fork Forma8on
An east–west cross section of the central part of Piceance basin showing the stratigraphy
24
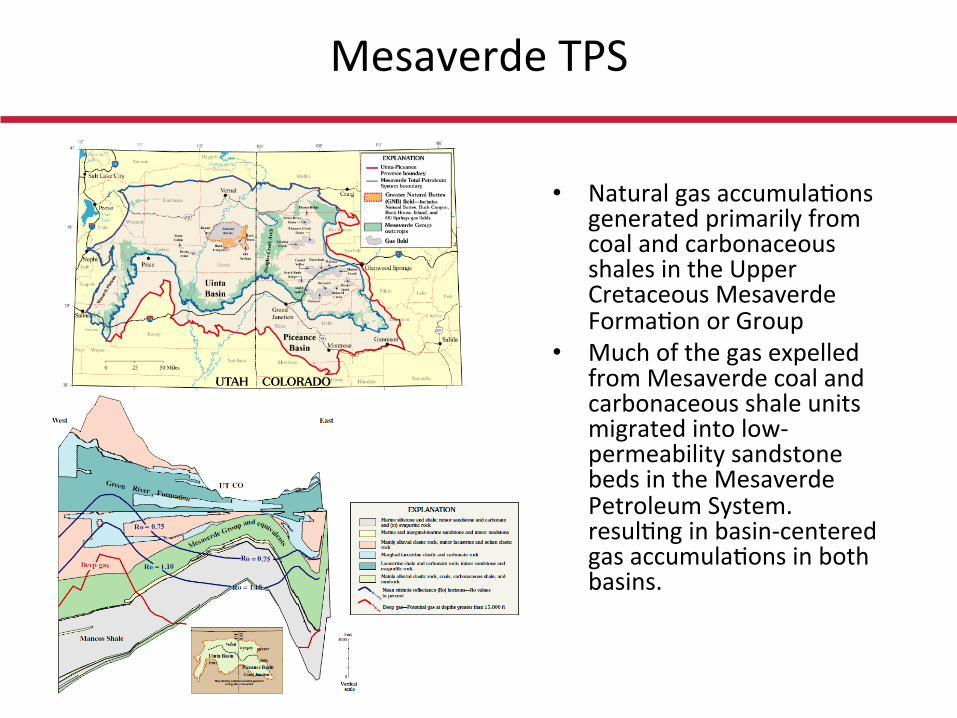
Mesaverde TPS
• Natural gas accumula:ons generated primarily from coal and carbonaceous shales in the Upper Cretaceous Mesaverde Forma:on or Group
• Much of the gas expelled from Mesaverde coal and carbonaceous shale units migrated into low-‐permeability sandstone beds in the Mesaverde Petroleum System. resul:ng in basin-‐centered gas accumula:ons in both basins.
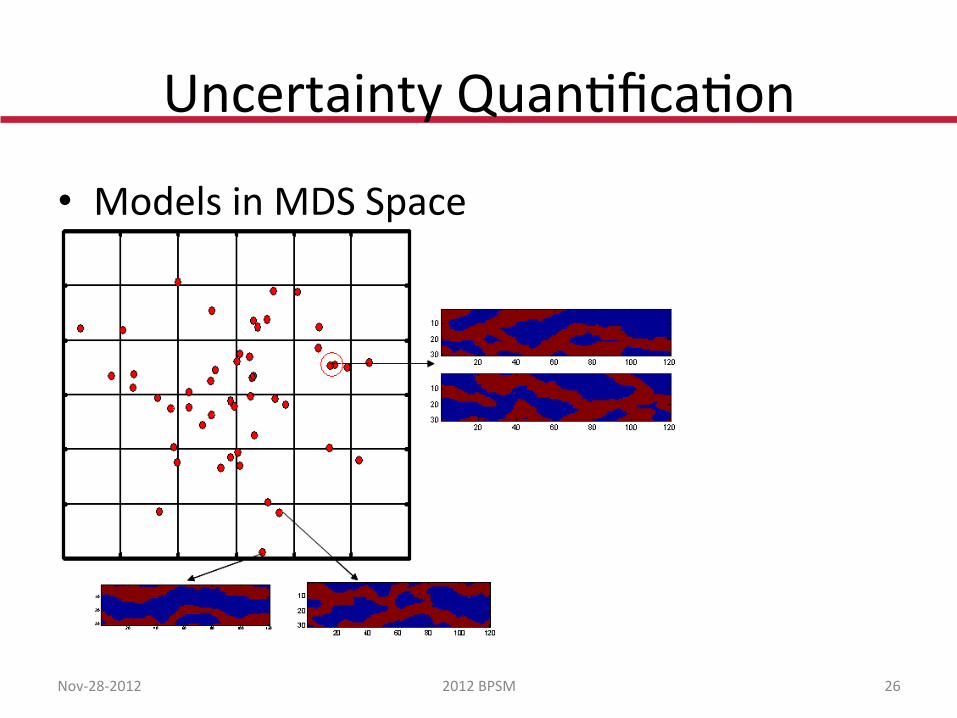
Uncertainty Quan:fica:on
• Models in MDS Space
Nov-‐28-‐2012 2012 BPSM 26