basics of clinical trial design msc in drug development, clinical pharmacology and translational...
TRANSCRIPT
MSc in Drug Development, Clinical Pharmacology and Translational
Medicine
BASICS of CLINICAL TRIAL DESIGN
Janet Peacock Professor of Medical Statistics
Division of Health and Social Care Research

Content
Study question Comparison groups Randomisation Blinding and placebos Primary and secondary outcomes Analysis populations Choosing outcomes
I gratefully acknowledge use of slides from IRM marked with a **
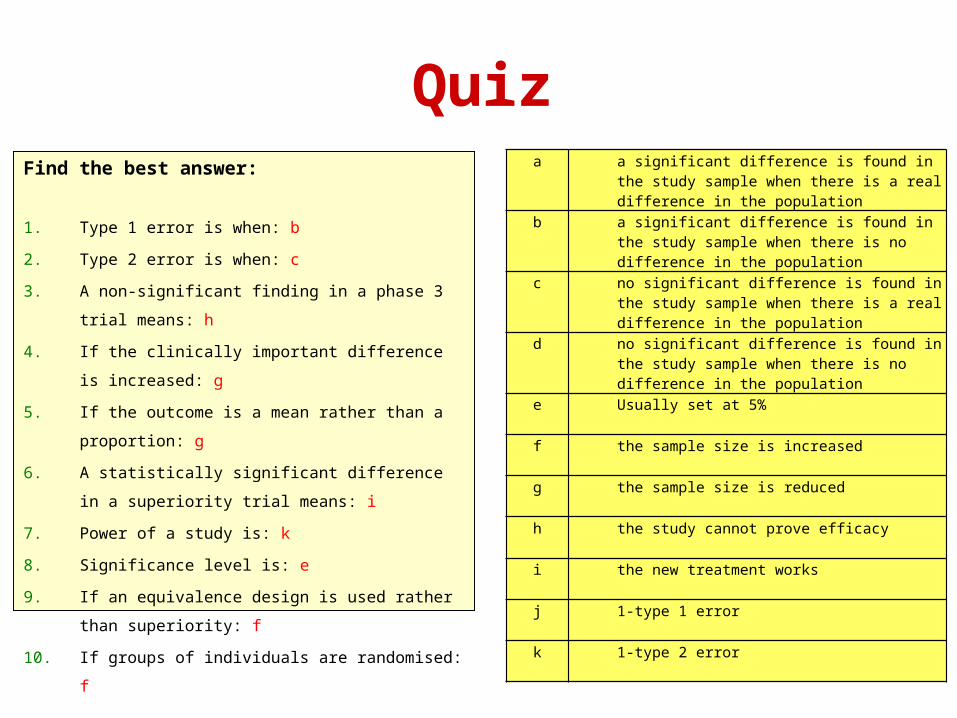
QuizFind the best answer:
1. Type 1 error is when: b
2. Type 2 error is when: c
3. A non-significant finding in a phase 3 trial means: h
4. If the clinically important difference is increased: g
5. If the outcome is a mean rather than a proportion: g
6. A statistically significant difference in a superiority trial
means: i
7. Power of a study is: k
8. Significance level is: e
9. If an equivalence design is used rather than
superiority: f
10. If groups of individuals are randomised: f
a a significant difference is found in the study sample when there is a real difference in the population
b a significant difference is found in the study sample when there is no difference in the population
c no significant difference is found in the study sample when there is a real difference in the population
d no significant difference is found in the study sample when there is no difference in the population
e Usually set at 5%
f the sample size is increased
g the sample size is reduced
h the study cannot prove efficacy
i the new treatment works
j 1-type 1 error
k 1-type 2 error
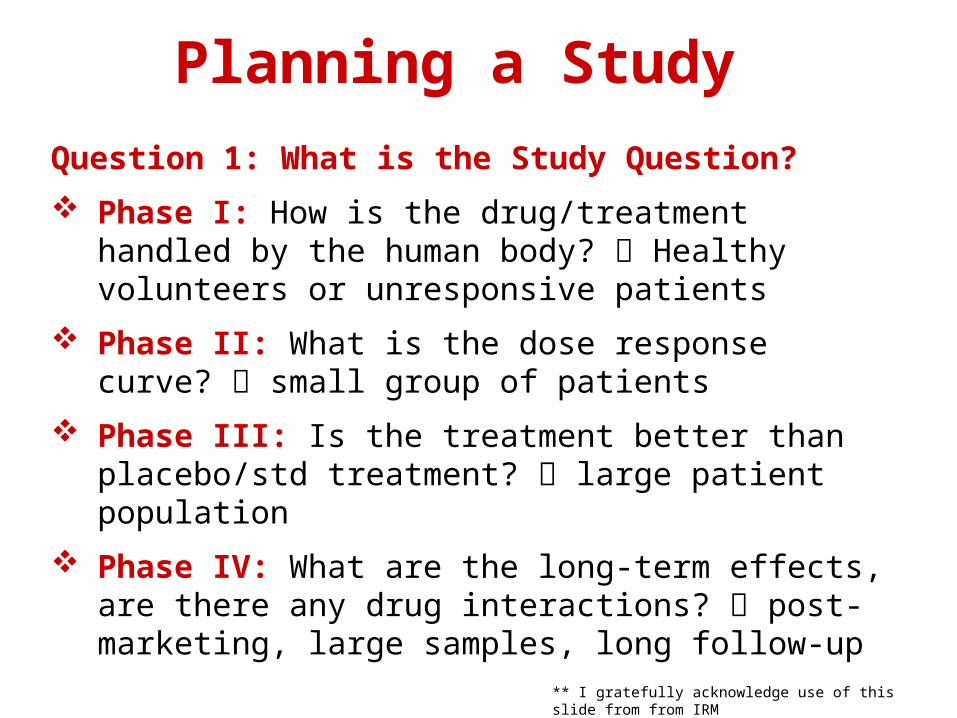
Planning a Study
Question 1: What is the Study Question?
Phase I: How is the drug/treatment handled by the human body? Healthy volunteers or unresponsive patients
Phase II: What is the dose response curve? small group of patients
Phase III: Is the treatment better than placebo/std treatment? large patient population
Phase IV: What are the long-term effects, are there any drug interactions? post-marketing, large samples, long follow-up
** I gratefully acknowledge use of this slide from from IRM
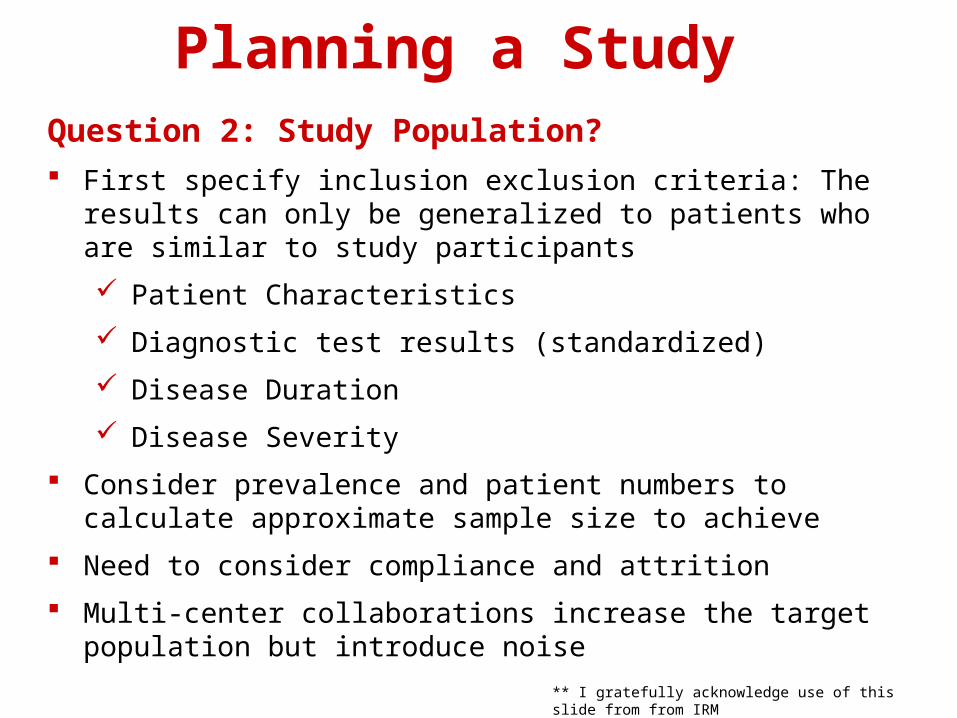
Planning a StudyQuestion 2: Study Population? First specify inclusion exclusion criteria: The results can only be
generalized to patients who are similar to study participants
Patient Characteristics
Diagnostic test results (standardized)
Disease Duration
Disease Severity
Consider prevalence and patient numbers to calculate approximate sample size to achieve
Need to consider compliance and attrition
Multi-center collaborations increase the target population but introduce noise
** I gratefully acknowledge use of this slide from from IRM

Comparison groups
To discuss:
Why do we need a comparison group for a trial of a new treatment?
How could we use a historical control group? Any problems?
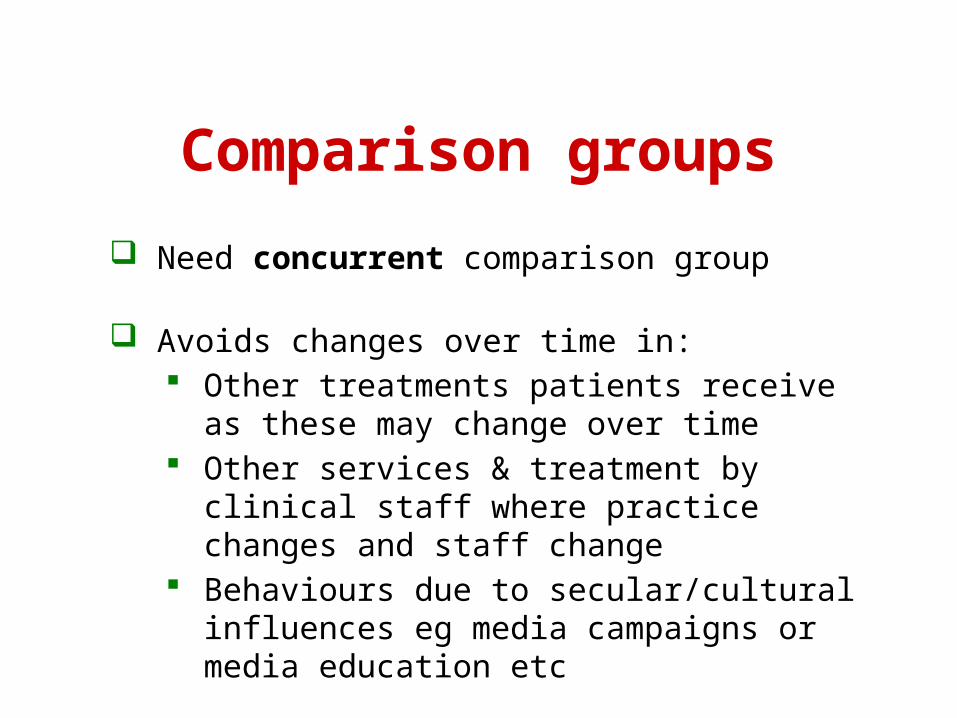
Comparison groups
Need concurrent comparison group
Avoids changes over time in: Other treatments patients receive as these may
change over time Other services & treatment by clinical staff
where practice changes and staff change Behaviours due to secular/cultural influences
eg media campaigns or media education etc
Allocation to treatment groups
To discuss:
Is it okay to let subjects choose between either of 2 new treatments and then compare the groups?
Could this cause any problems?
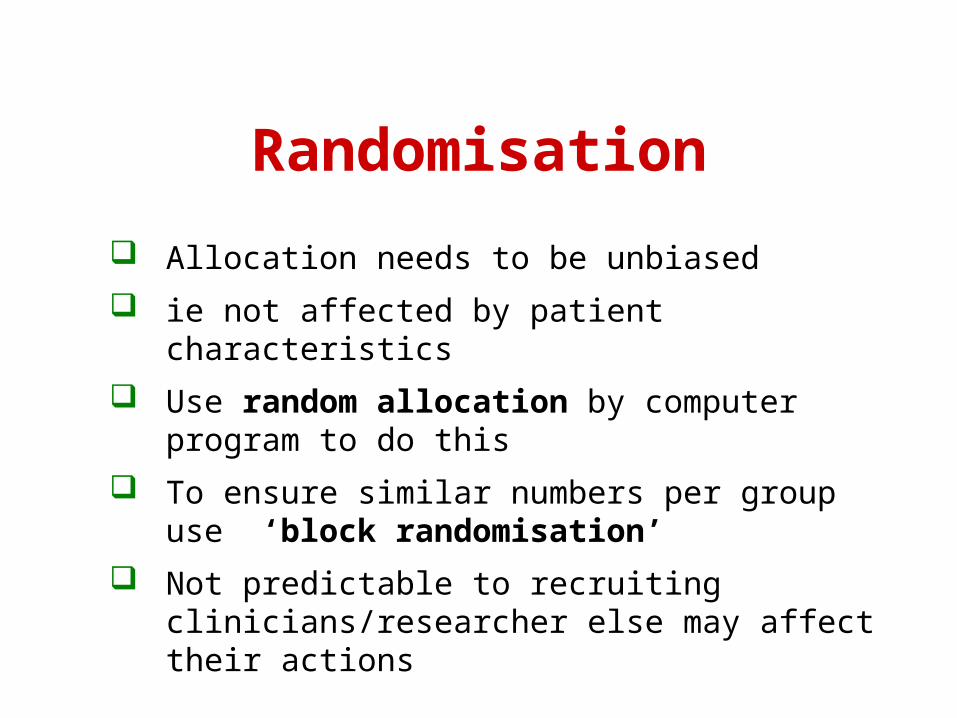
Randomisation
Allocation needs to be unbiased
ie not affected by patient characteristics
Use random allocation by computer program to do this
To ensure similar numbers per group use ‘block randomisation’
Not predictable to recruiting clinicians/researcher else may affect their actions

Block randomisation Used to ensure no. subjects in each group is similar Random allocation determined in discrete blocks so that within
each block there are equal numbers in each group Example using blocks of size 4, and 2 treatments A and B
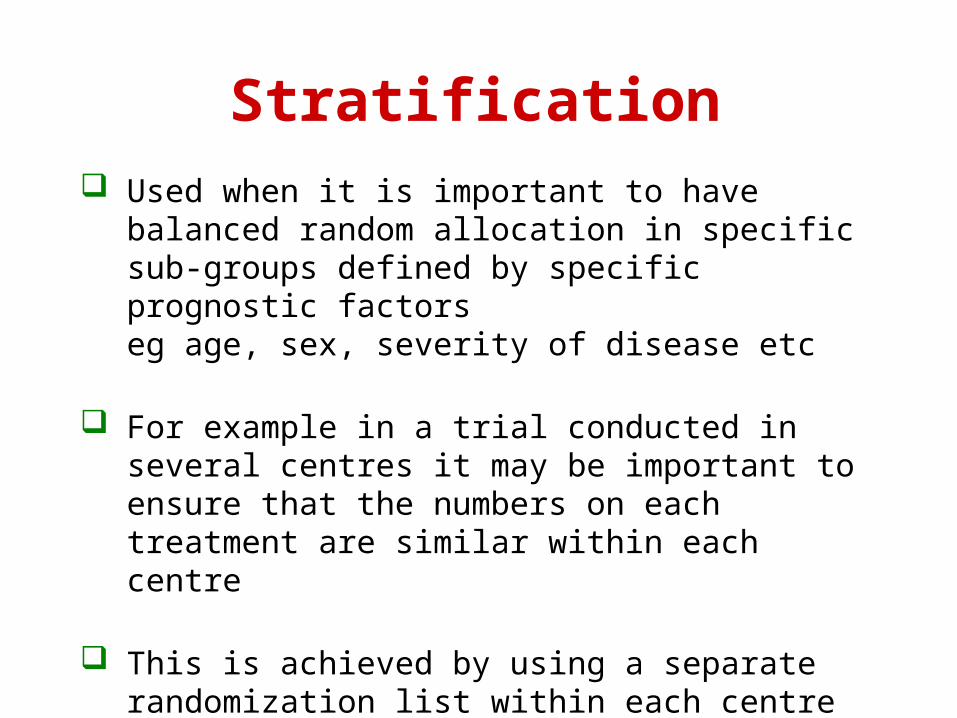
Stratification Used when it is important to have balanced random
allocation in specific sub-groups defined by specific prognostic factors eg age, sex, severity of disease etc
For example in a trial conducted in several centres it may be important to ensure that the numbers on each treatment are similar within each centre
This is achieved by using a separate randomization list within each centre
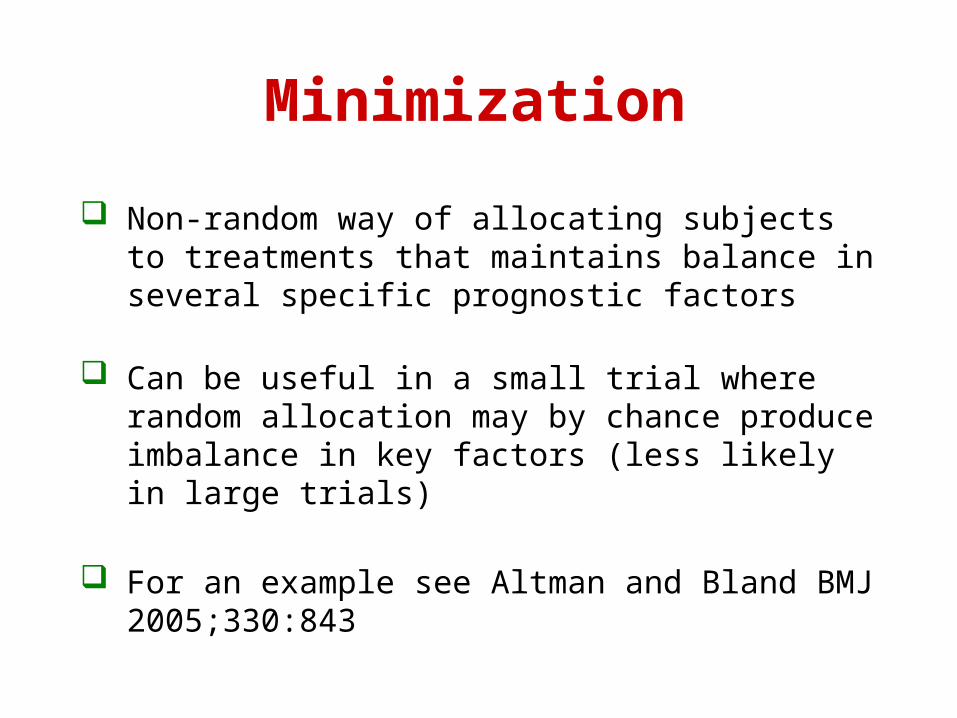
Minimization
Non-random way of allocating subjects to treatments that maintains balance in several specific prognostic factors
Can be useful in a small trial where random allocation may by chance produce imbalance in key factors (less likely in large trials)
For an example see Altman and Bland BMJ 2005;330:843
Blinding & placebos
Discussion:
Does it matter if patients know what treatment there are receiving?
When might it matter most & least?
Should clinicians/researchers be blind to treatment? Why?
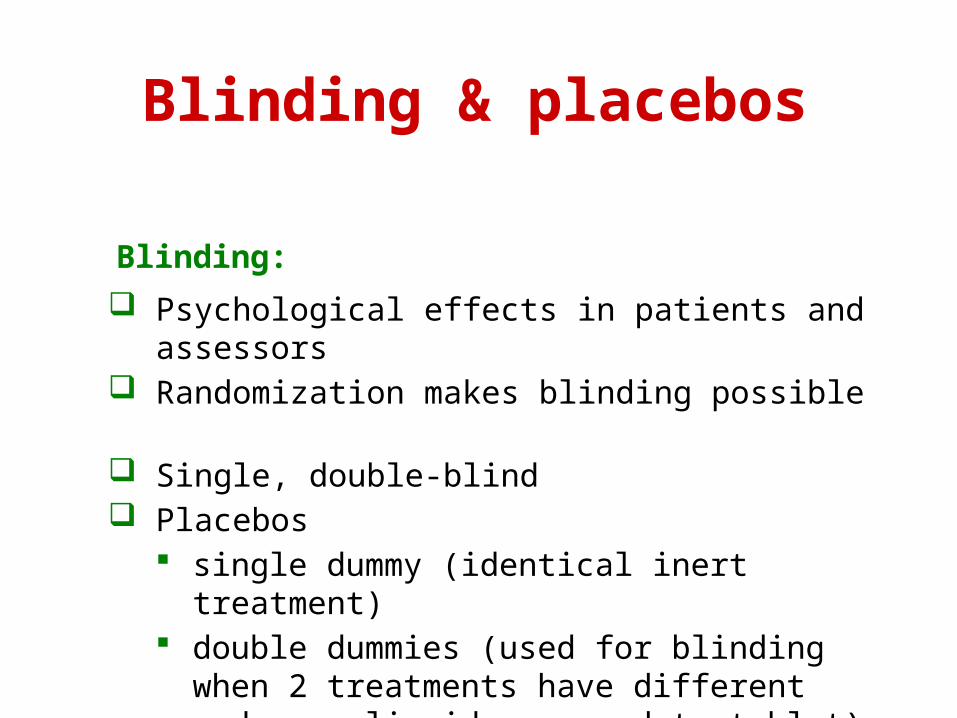
Blinding & placebos
Blinding:
Psychological effects in patients and assessors Randomization makes blinding possible Single, double-blind Placebos
single dummy (identical inert treatment) double dummies (used for blinding when 2
treatments have different modes eg liquid compared to tablet)
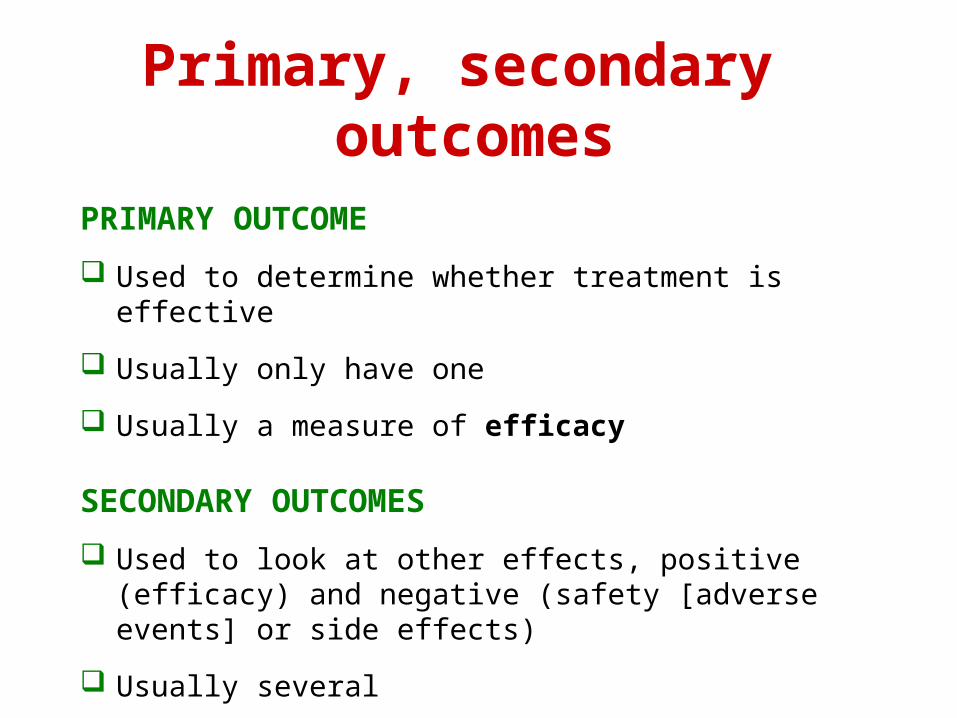
Primary, secondary outcomes
PRIMARY OUTCOME
Used to determine whether treatment is effective
Usually only have one
Usually a measure of efficacy
SECONDARY OUTCOMES
Used to look at other effects, positive (efficacy) and negative (safety [adverse events] or side effects)
Usually several
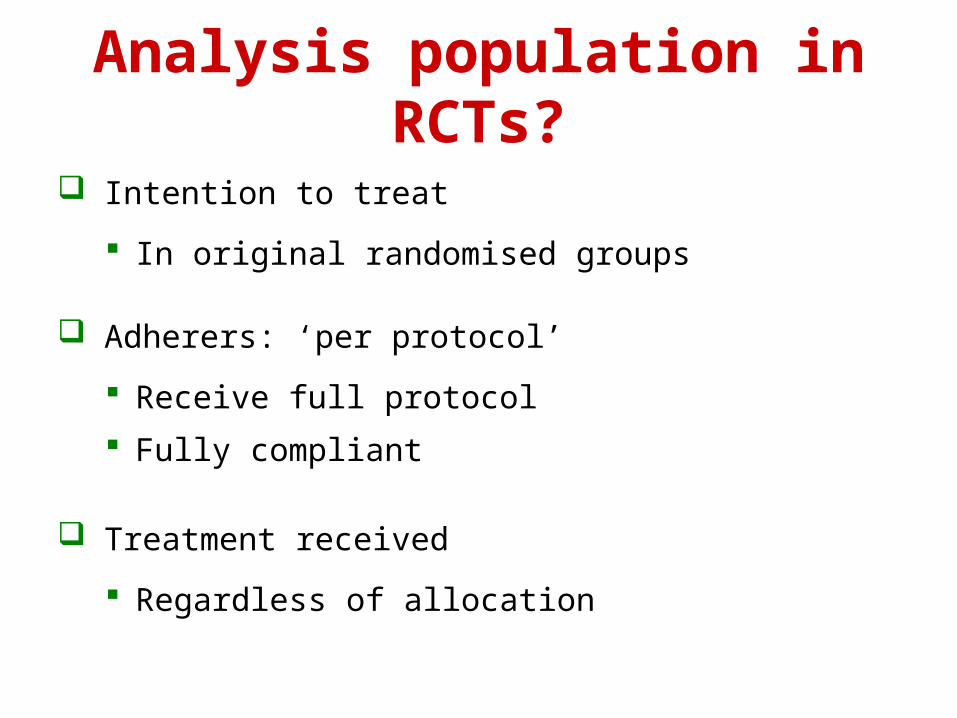
Analysis population in RCTs?
Intention to treat
In original randomised groups
Adherers: ‘per protocol’
Receive full protocol
Fully compliant
Treatment received
Regardless of allocation
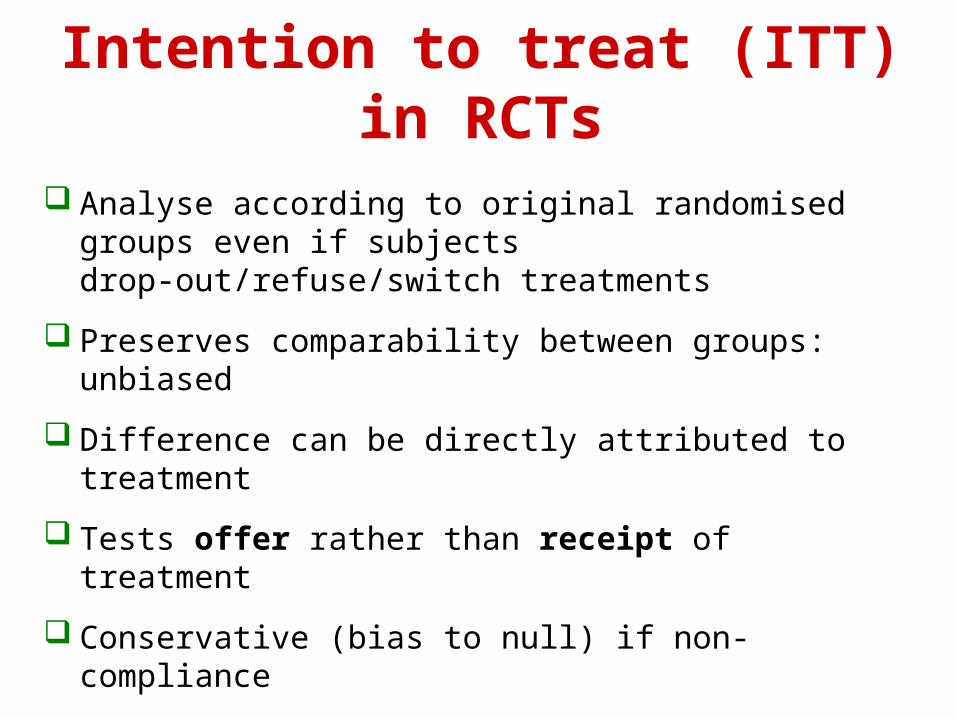
Intention to treat (ITT) in RCTs
Analyse according to original randomised groups even if subjects drop-out/refuse/switch treatments
Preserves comparability between groups: unbiased
Difference can be directly attributed to treatment
Tests offer rather than receipt of treatment
Conservative (bias to null) if non-compliance
Usually the main analysis
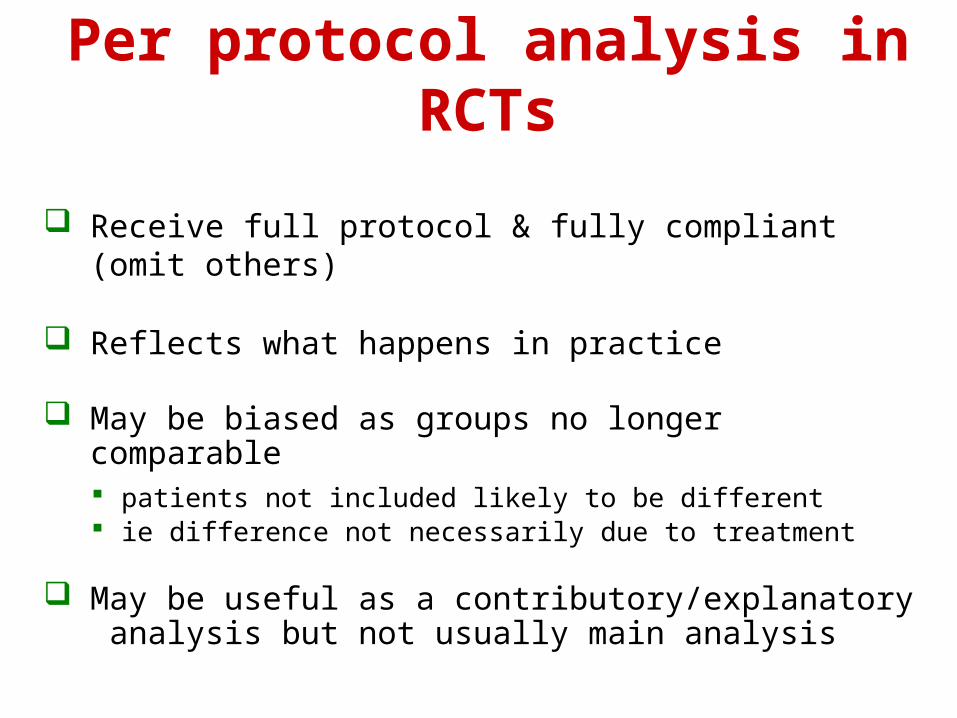
Per protocol analysis in RCTs
Receive full protocol & fully compliant (omit others)
Reflects what happens in practice
May be biased as groups no longer comparable patients not included likely to be different ie difference not necessarily due to treatment
May be useful as a contributory/explanatory analysis but not usually main analysis
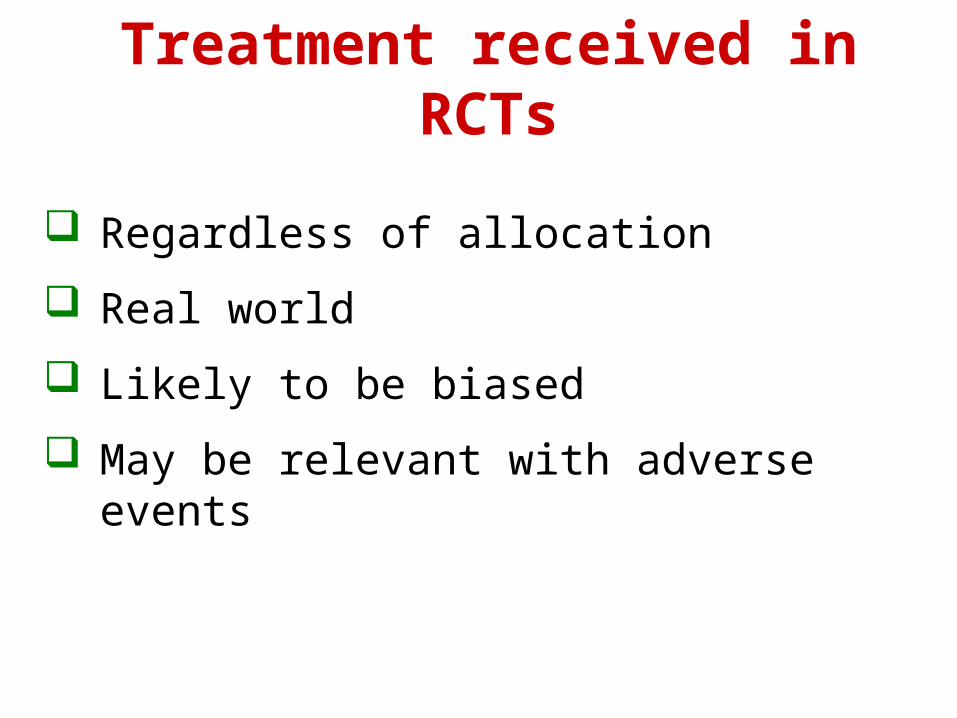
Treatment received in RCTs
Regardless of allocation
Real world
Likely to be biased
May be relevant with adverse events
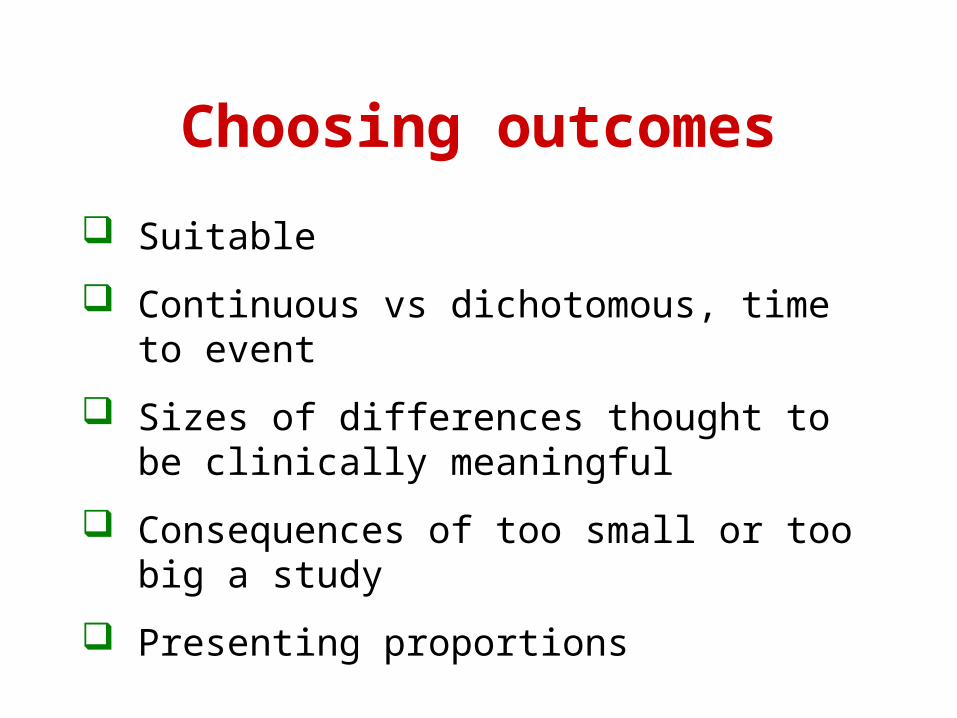
Choosing outcomes
Suitable
Continuous vs dichotomous, time to event
Sizes of differences thought to be clinically meaningful
Consequences of too small or too big a study
Presenting proportions
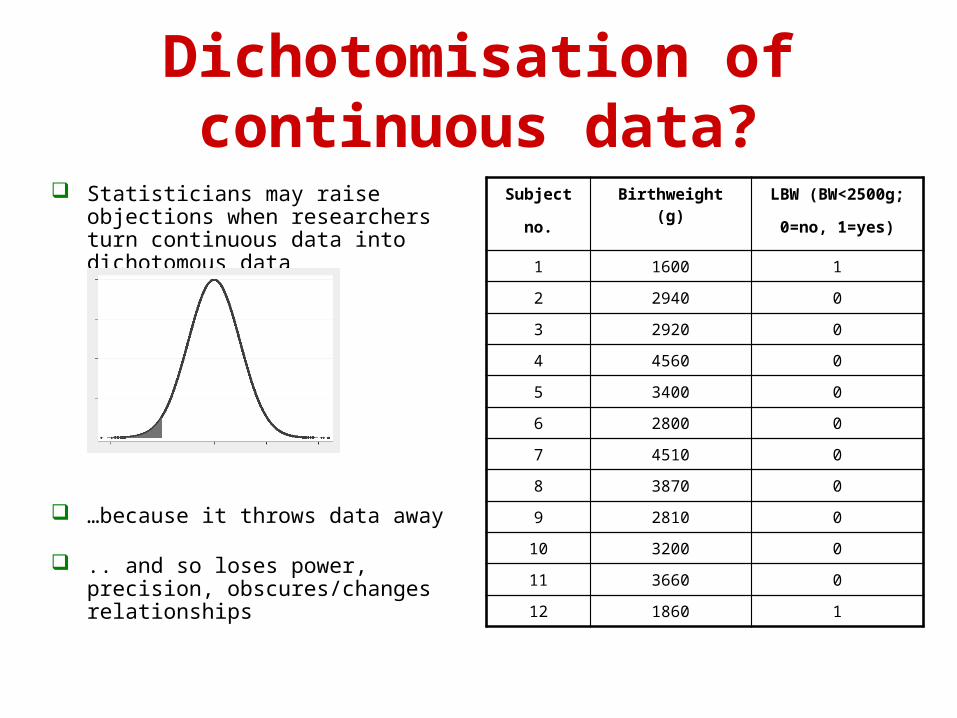
Dichotomisation of continuous data?
Statisticians may raise objections when researchers turn continuous data into dichotomous data
…because it throws data away
.. and so loses power, precision, obscures/changes relationships
Subject
no.
Birthweight (g) LBW (BW<2500g;
0=no, 1=yes)
1 1600 1
2 2940 0
3 2920 0
4 4560 0
5 3400 0
6 2800 0
7 4510 0
8 3870 0
9 2810 0
10 3200 0
11 3660 0
12 1860 1

So why do doctors and researchers dichotomise?
Clinical Practice: cut-offs commonly used to define point at which treatment starts eg
anti-hypertensive treatment commonly starts when diastolic blood pressure ≥90mmHg
statins may be given if cholesterol level above say 5.3
Epidemiological/clinical research: cut-offs used to indicate poor outcome eg
low birthweight (<2500g) widely used as indicator of poor outcome of pregnancy at population level
specific cut-off for pain scores used as indication patient has ‘responded’ to pain treatment
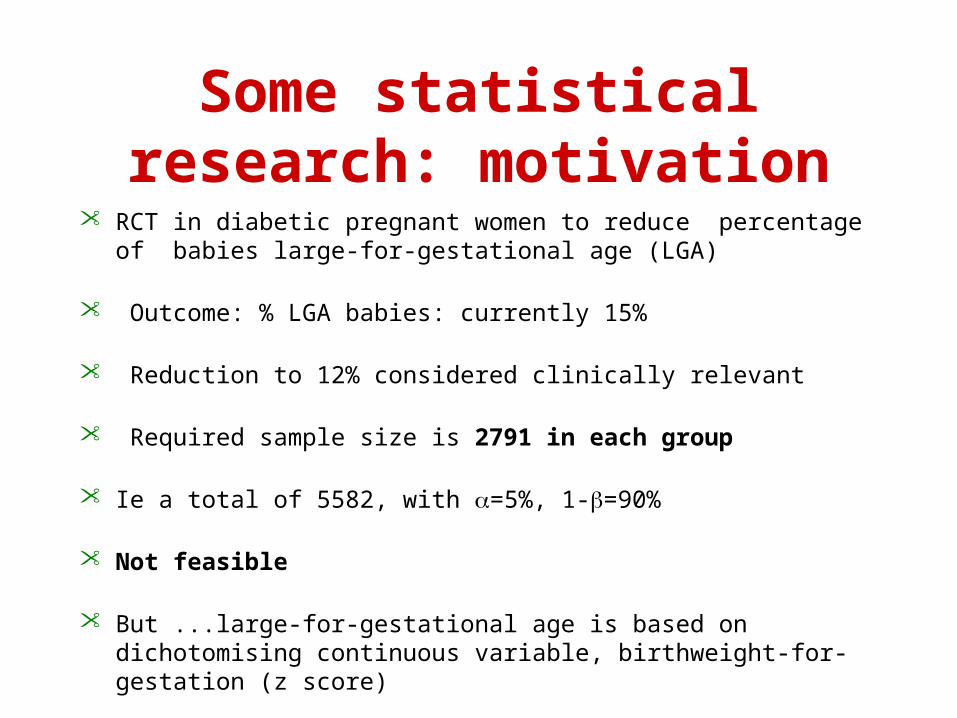
Some statistical research: motivation
• RCT in diabetic pregnant women to reduce percentage of babies large-for-gestational age (LGA)
• Outcome: % LGA babies: currently 15%
• Reduction to 12% considered clinically relevant
• Required sample size is 2791 in each group
• Ie a total of 5582, with =5%, 1-=90%
• Not feasible
• But ...large-for-gestational age is based on dichotomising continuous variable, birthweight-for-gestation (z score)
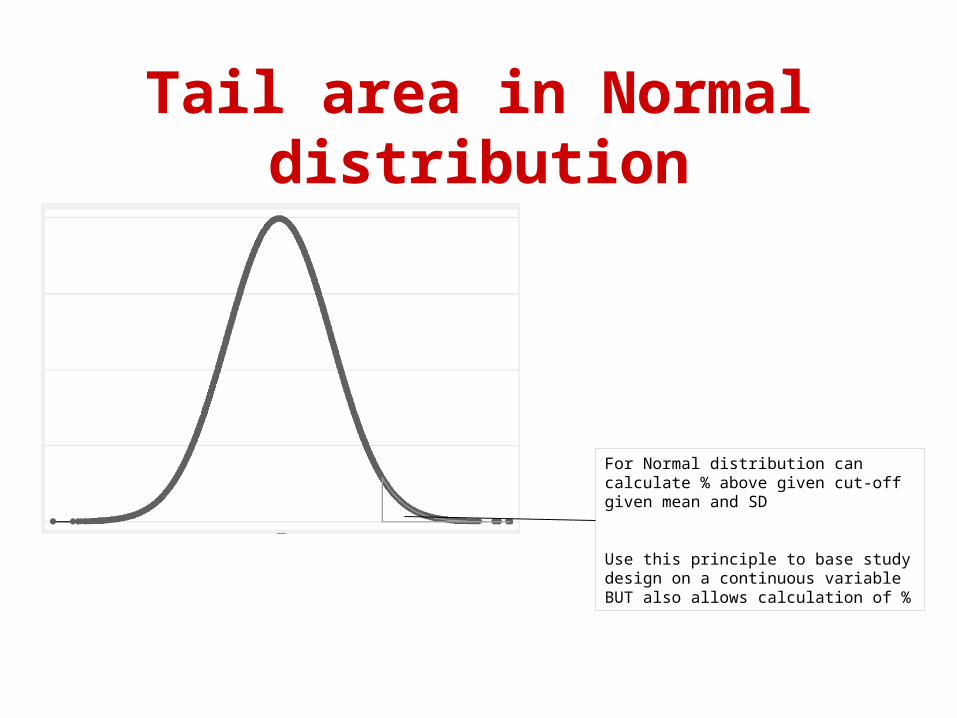
Tail area in Normal distribution
For Normal distribution can calculate % above given cut-off given mean and SD
Use this principle to base study design on a continuous variable BUT also allows calculation of %
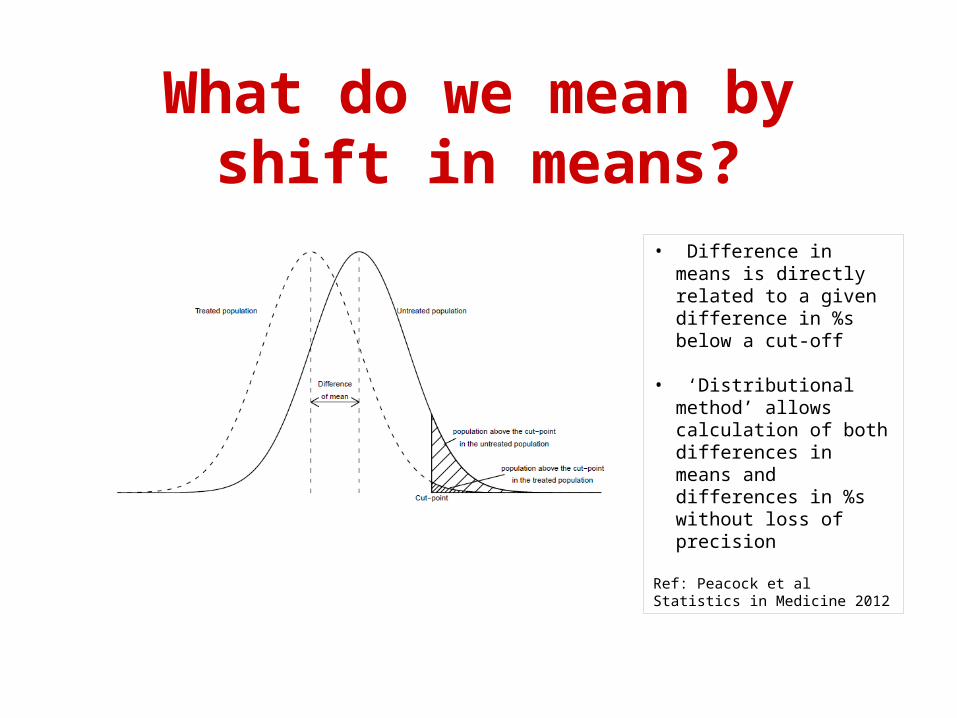
What do we mean by shift in means?
• Difference in means is directly related to a given difference in %s below a cut-off
• ‘Distributional method’ allows calculation of both differences in means and differences in %s without loss of precision
Ref: Peacock et al Statistics in Medicine 2012
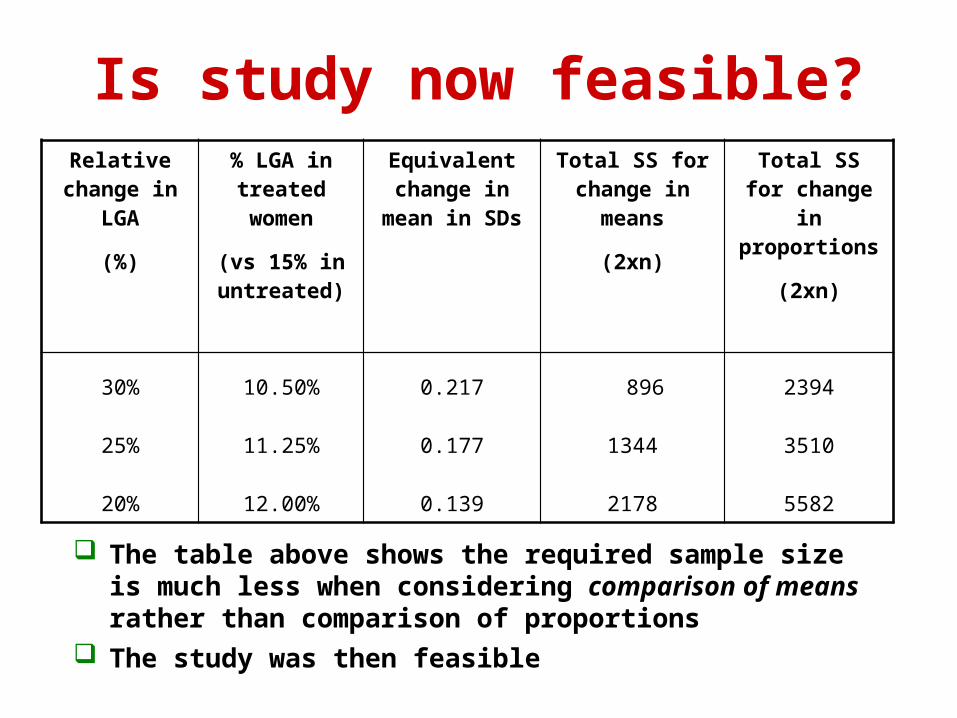
Is study now feasible?Relative
change in LGA
(%)
% LGA in treated women
(vs 15% in untreated)
Equivalent change in
mean in SDs
Total SS for change in
means
(2xn)
Total SS for change in
proportions
(2xn)
30%
25%
20%
10.50%
11.25%
12.00%
0.217
0.177
0.139
896
1344
2178
2394
3510
5582
The table above shows the required sample size is much less when considering comparison of means rather than comparison of proportions
The study was then feasible

Results….
Can now get difference in means with 95% CI plus difference in proportions with derived 95% CI so meet needs of both stakeholders while maintaining statistical rigour
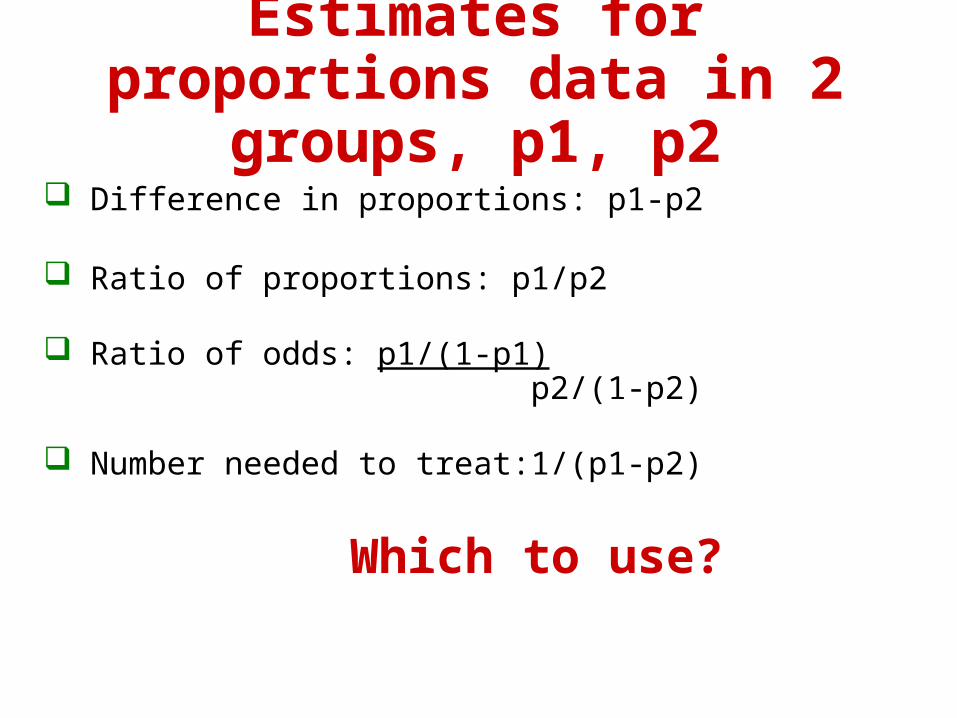
Estimates for proportions data in 2 groups, p1, p2
Difference in proportions: p1-p2
Ratio of proportions: p1/p2
Ratio of odds: p1/(1-p1) p2/(1-p2)
Number needed to treat:1/(p1-p2)
Which to use?
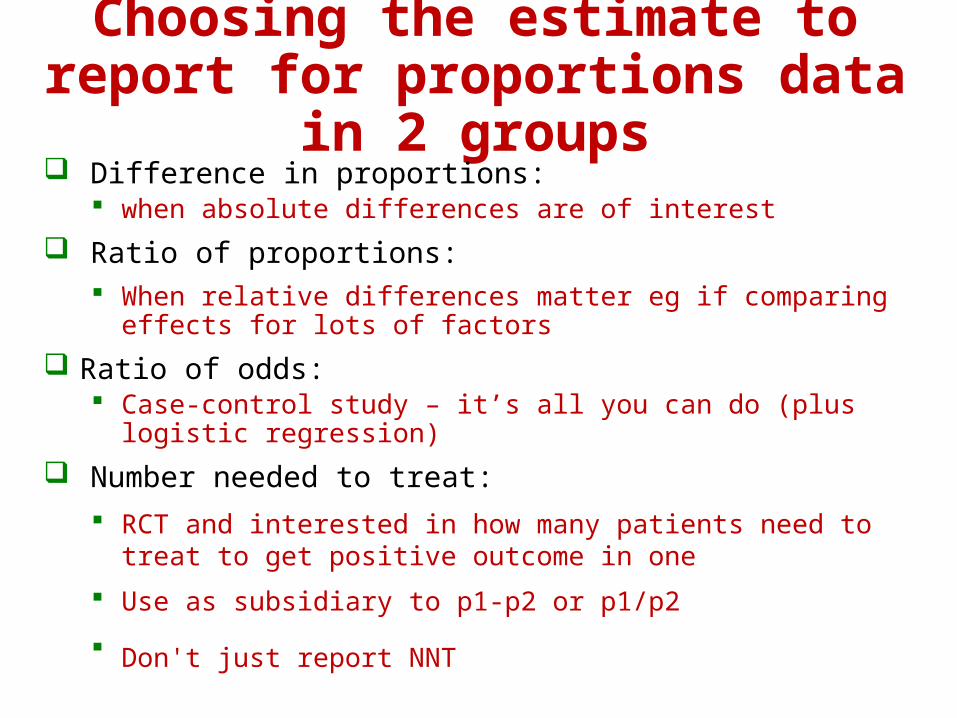
Choosing the estimate to report for proportions data in 2 groups
Difference in proportions: when absolute differences are of interest
Ratio of proportions: When relative differences matter eg if comparing effects
for lots of factors
Ratio of odds: Case-control study – it’s all you can do (plus logistic
regression)
Number needed to treat:
RCT and interested in how many patients need to treat to get positive outcome in one
Use as subsidiary to p1-p2 or p1/p2
Don't just report NNT
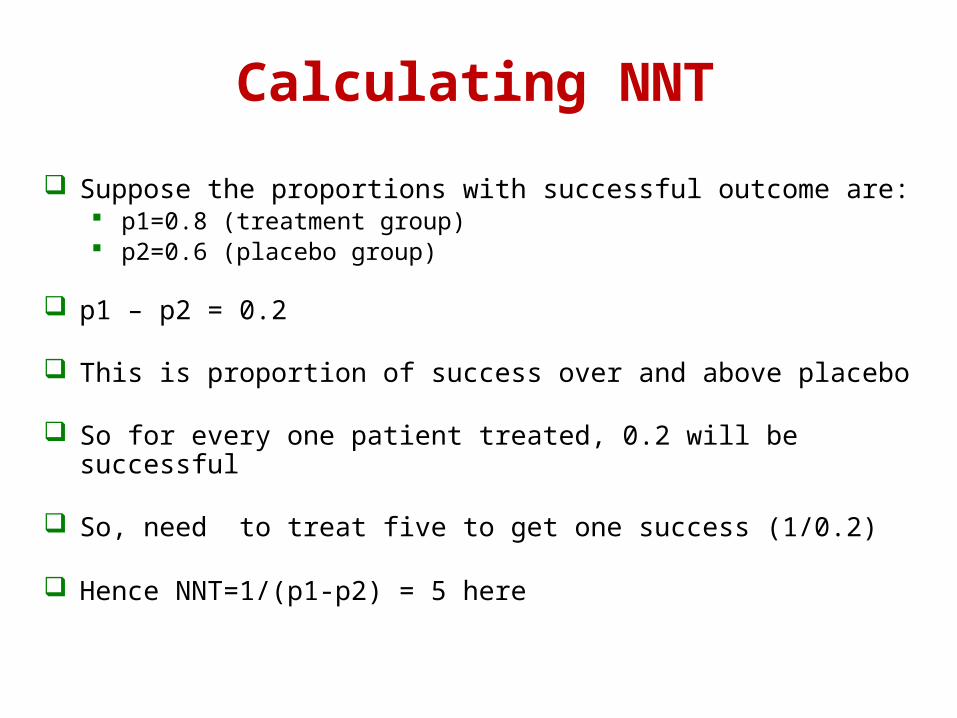
Calculating NNT
Suppose the proportions with successful outcome are: p1=0.8 (treatment group) p2=0.6 (placebo group)
p1 – p2 = 0.2
This is proportion of success over and above placebo
So for every one patient treated, 0.2 will be successful
So, need to treat five to get one success (1/0.2)
Hence NNT=1/(p1-p2) = 5 here
Sample size and power (1)
What happens if a study comparing 2 groups is too small?
Eg.in a small drug trial, difference between new & old drug is not significant – it’s hard to know if:
i) new drug really doesn’t work or ii) trial is too small to show a difference
Sample size and power (2)
Need to know study question & design before doing calculations (+ draft protocol)
Need idea of what size of effects we expect/hope to find
Want good precision for estimates
Want to minimise chance of drawing wrong conclusion, due to:i) poor precisionii) false positive (type 1 error) iii) false negative (type 2 error)
Type 1 error
We conclude there is a difference between the groups (ie get a significant finding) when there is no difference in the underlying population
ie by chance we get an unusual sample
This is defined by the cut-off for significance and is usually set at 0.05 or 5% -- known as the significance level
Note: this means we get a false significant result on average 1/20 times
Avoid by careful analysis:i) choice of significance level
ii) define questions in advance – no fishing!
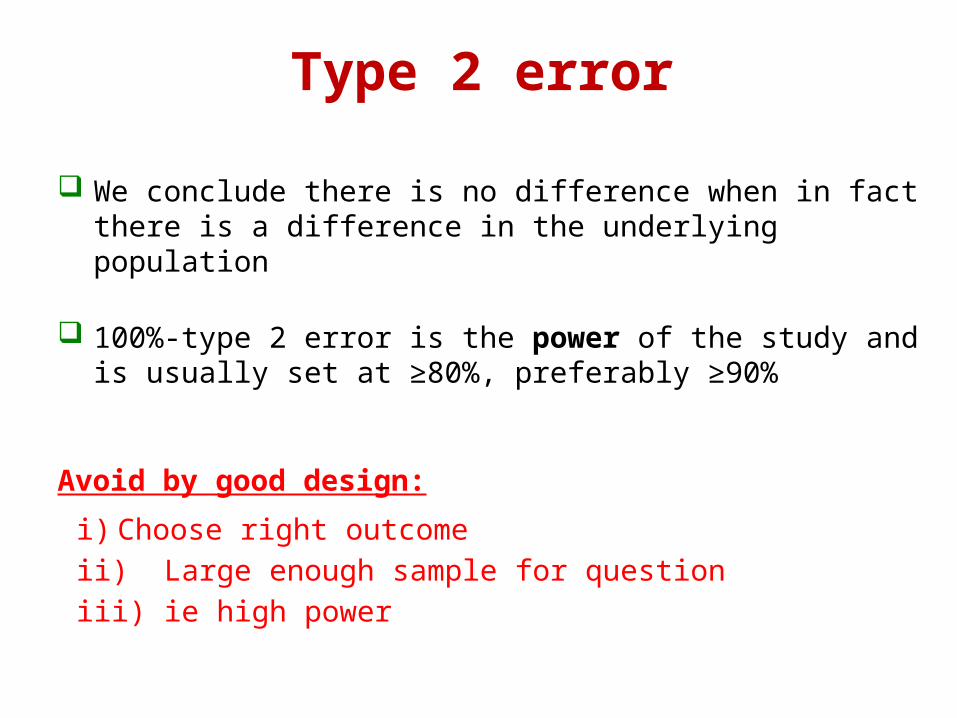
Type 2 error
We conclude there is no difference when in fact there is a difference in the underlying population
100%-type 2 error is the power of the study and is usually set at ≥80%, preferably ≥90%
Avoid by good design:
i) Choose right outcome
ii) Large enough sample for question
iii) ie high power
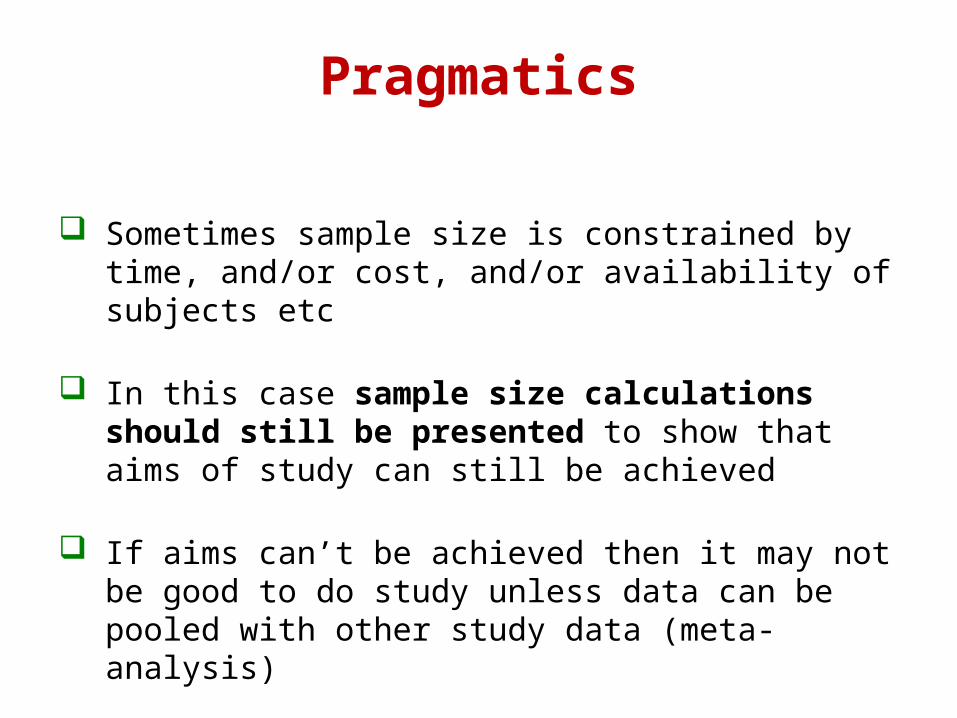
Pragmatics
Sometimes sample size is constrained by time, and/or cost, and/or availability of subjects etc
In this case sample size calculations should still be presented to show that aims of study can still be achieved
If aims can’t be achieved then it may not be good to do study unless data can be pooled with other study data (meta-analysis)

What is a clinically important or clinically meaningful difference? Sample size calculations for comparative studies need estimate of
size of difference that would be considered important
ie size of difference that researcher would not want to fail to detect in his/her study
Researcher’s decision not statistician’s one
Can be difficult to decide on:- consult literature other studies colleagues.... if unsure
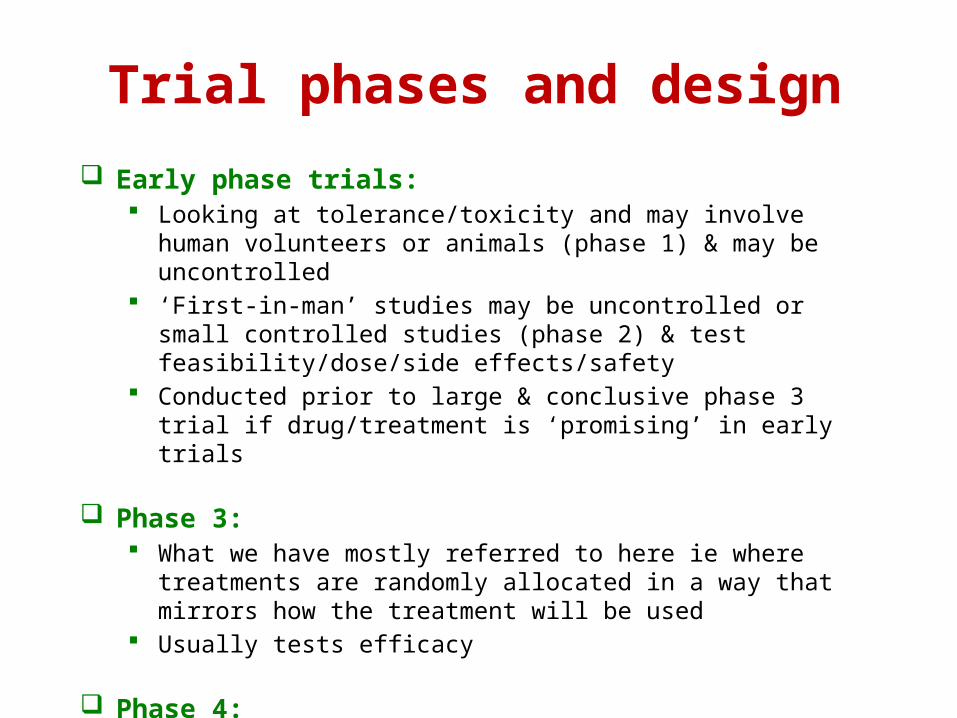
Trial phases and design
Early phase trials: Looking at tolerance/toxicity and may involve human volunteers or
animals (phase 1) & may be uncontrolled ‘First-in-man’ studies may be uncontrolled or small controlled
studies (phase 2) & test feasibility/dose/side effects/safety Conducted prior to large & conclusive phase 3 trial if drug/treatment
is ‘promising’ in early trials
Phase 3: What we have mostly referred to here ie where treatments are
randomly allocated in a way that mirrors how the treatment will be used
Usually tests efficacy
Phase 4: Post-marketing surveillance - safety
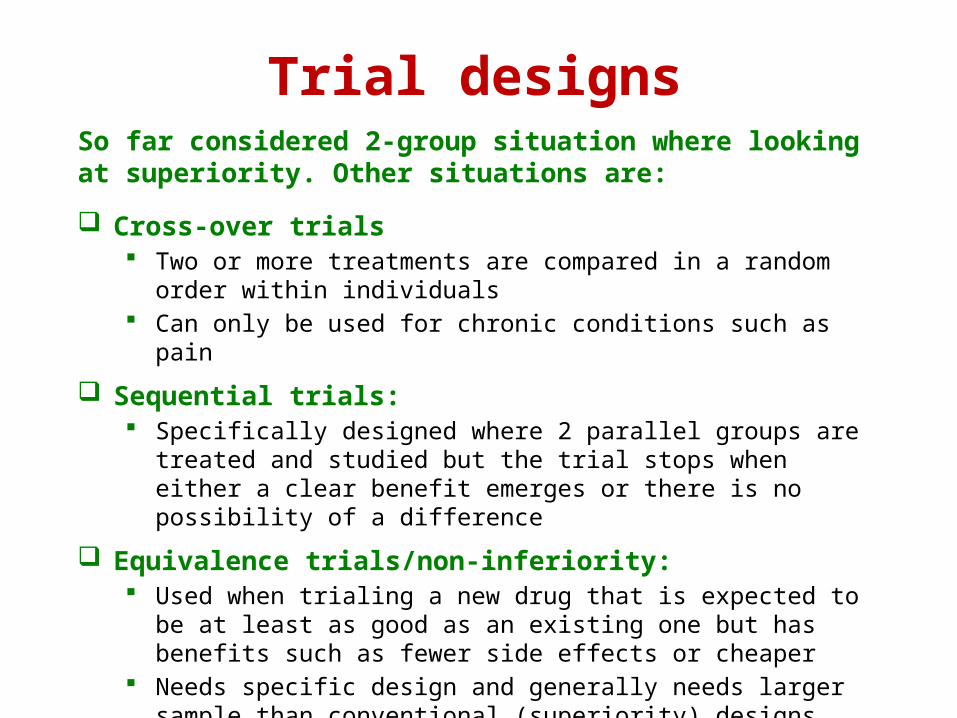
Trial designsSo far considered 2-group situation where looking at superiority. Other situations are:
Cross-over trials Two or more treatments are compared in a random order within
individuals Can only be used for chronic conditions such as pain
Sequential trials: Specifically designed where 2 parallel groups are treated and
studied but the trial stops when either a clear benefit emerges or there is no possibility of a difference
Equivalence trials/non-inferiority: Used when trialing a new drug that is expected to be at least as
good as an existing one but has benefits such as fewer side effects or cheaper
Needs specific design and generally needs larger sample than conventional (superiority) designs
Design: What is the hypothesis?
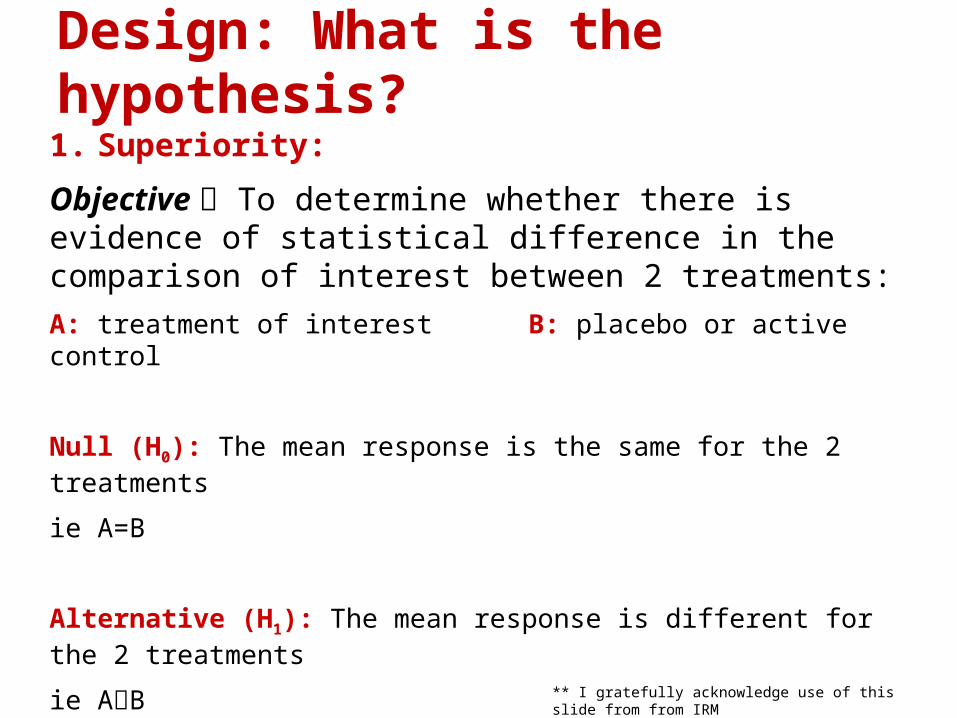
1. Superiority:
Objective To determine whether there is evidence of statistical difference in the comparison of interest between 2 treatments:
A: treatment of interest B: placebo or active control
Null (H0): The mean response is the same for the 2 treatments
ie A=B
Alternative (H1): The mean response is different for the 2 treatments
ie AB (either A>B or B>A)
** I gratefully acknowledge use of this slide from from IRM

2. Equivalence:
Objective To demonstrate that 2 treatments have no clinically meaningful difference
Null (H0): The 2 treatments have different mean responses such that: ie either (A-B) ≤ -d or (A-B) ≥ +d
implies: A not equivalent to B
Alternative (H1): The 2 treatments means are the same such that:
ie either –d < (A-B) < +dimplies A equivalent to B
Design: What is the hypothesis?
d = largest difference clinically acceptable
** I gratefully acknowledge use of this slide from from IRM
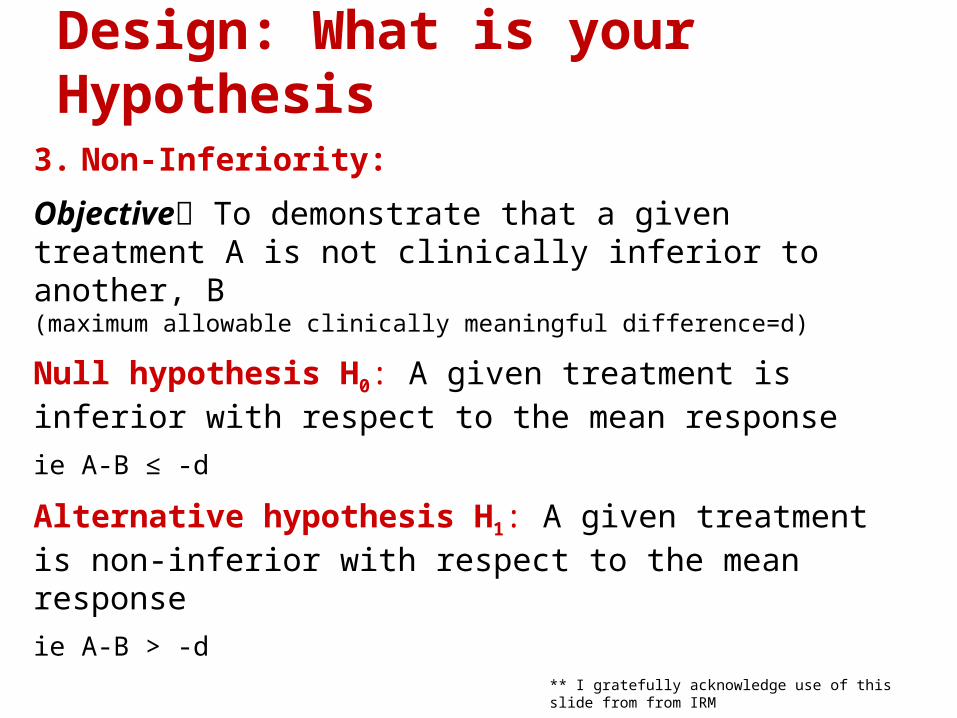
3. Non-Inferiority:
Objective To demonstrate that a given treatment A is not clinically inferior to another, B(maximum allowable clinically meaningful difference=d)
Null hypothesis H0: A given treatment is inferior with respect to the mean response
ie A-B ≤ -d
Alternative hypothesis H1: A given treatment is non-inferior with respect to the mean response
ie A-B > -d
Design: What is your Hypothesis
** I gratefully acknowledge use of this slide from from IRM
Interim Analysis
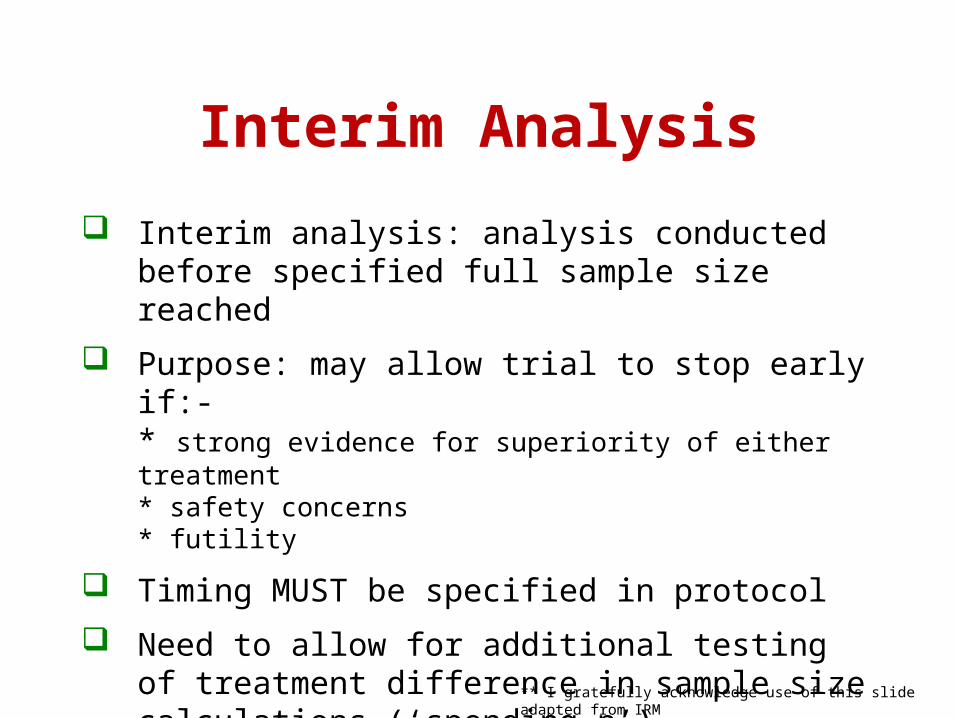
Interim analysis: analysis conducted before specified full sample size reached
Purpose: may allow trial to stop early if:- * strong evidence for superiority of either treatment* safety concerns* futility
Timing MUST be specified in protocol
Need to allow for additional testing of treatment difference in sample size calculations (‘spending p’)
** I gratefully acknowledge use of this slide adapted from IRM
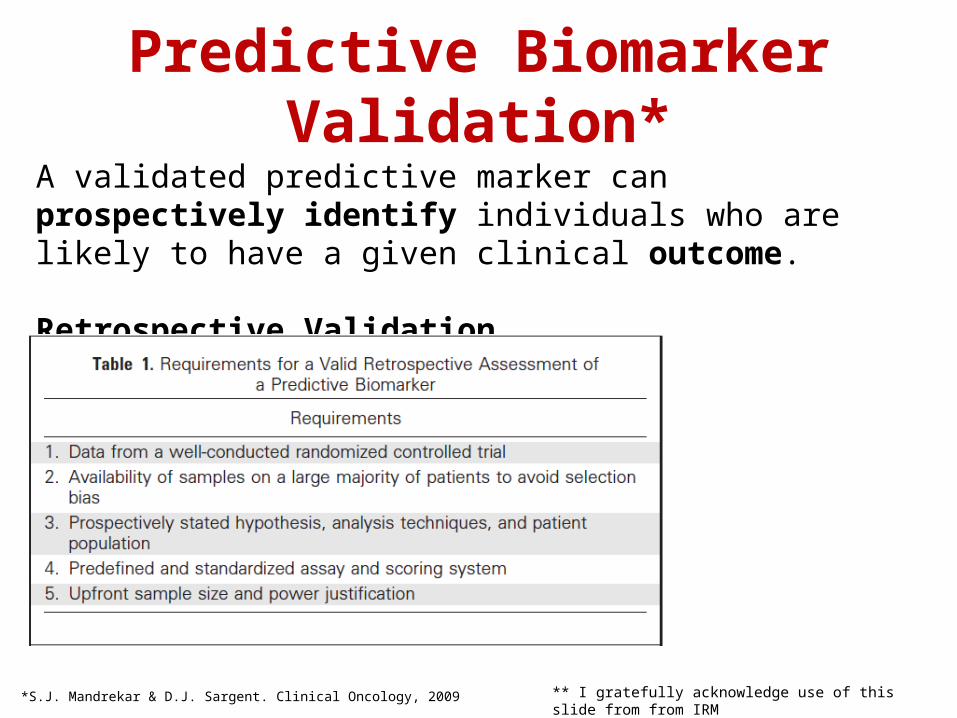
Predictive Biomarker Validation*
*S.J. Mandrekar & D.J. Sargent. Clinical Oncology, 2009
A validated predictive marker can prospectively identify individuals who are likely to have a given clinical outcome.
Retrospective Validation
** I gratefully acknowledge use of this slide from from IRM
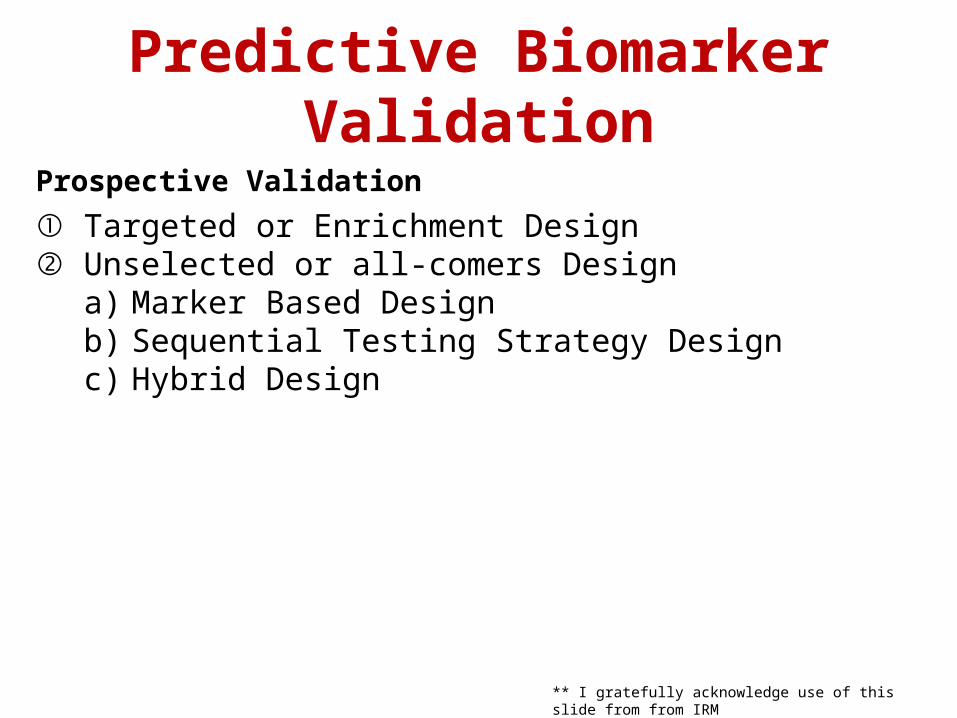
Predictive Biomarker Validation
Prospective Validation
① Targeted or Enrichment Design② Unselected or all-comers Design
a) Marker Based Designb) Sequential Testing Strategy Designc) Hybrid Design
** I gratefully acknowledge use of this slide from from IRM
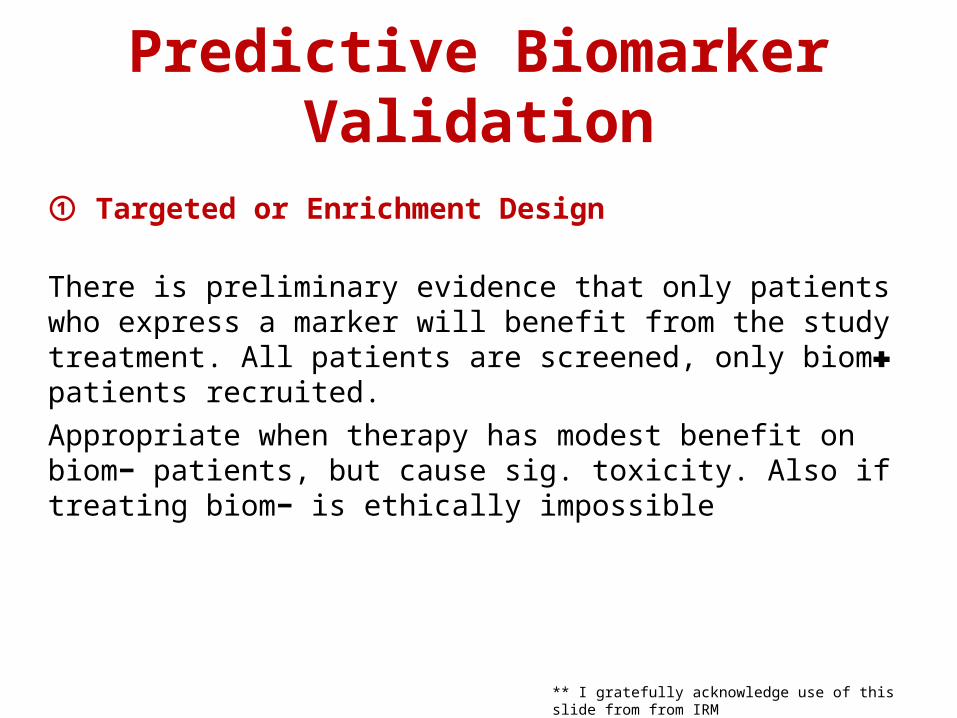
Predictive Biomarker Validation
① Targeted or Enrichment Design
There is preliminary evidence that only patients who express a marker will benefit from the study treatment. All patients are screened, only biom patients recruited.✚
Appropriate when therapy has modest benefit on biom− patients, but cause sig. toxicity. Also if treating biom− is ethically impossible
** I gratefully acknowledge use of this slide from from IRM
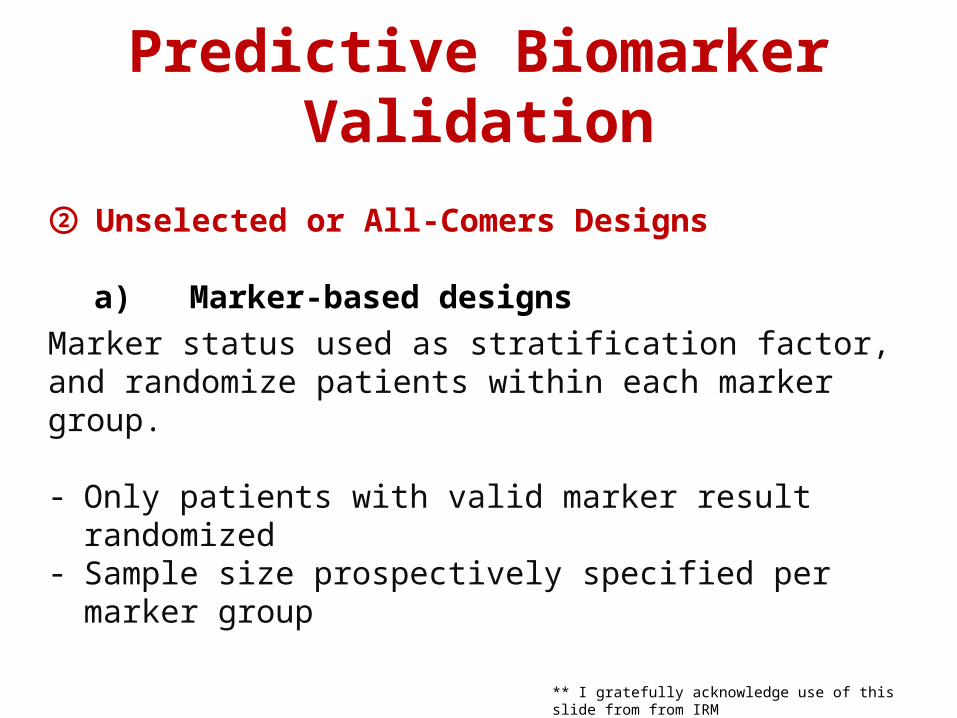
② Unselected or All-Comers Designs
a) Marker-based designs
Marker status used as stratification factor, and randomize patients within each marker group.
- Only patients with valid marker result randomized- Sample size prospectively specified per marker group
Predictive Biomarker Validation
** I gratefully acknowledge use of this slide from from IRM
References & further reading
Janet Peacock & Philip Peacock
THE OXFORD HANDBOOK OF MEDICAL STATISTICS
Oxford University Press 2010(chapter 1 , p6-23 [clinical trials], 62-70 [sample size])
Janet Peacock & Sally Kerry
PRESENTING MEDICAL STATISTICS FROM PROPOSAL TO PUBLICATION
Oxford University Press 2006(chapter 3, p19-24 for how to do sample size calculations in Stata)