basic statistics of the community : comparison …aei.pitt.edu/70294/1/1975-76.pdf · oecd...
TRANSCRIPT

MISTIQUE DES COMMUNAUTES EUROPEENNES STATISTICAL OFFICE OF THE EUROPEAN COMMUNITIES STATISTISCHES AM
■ iTUTO STATISTICO DELLE COMUNITÀ EUROPEE BUREAU VOOR DE STATISTIEK DER EURC
'ESE GEMEENSCHAPPEN DET STATISTISKE DEPARTEMENT FOR DE EUROPÆ ISKE FÆ LLESSKABER OFFICE STATISTIOUE DES COMMI
IAUTES EUROPEENNES STATISTICAL OFFICE OF THE EUROPEAN COMMUNITIES STATISTISCHES AMT OER EUROPAISCHEN GEMEINSCF
*FTEN ISTITUTO STATISTICO OELLE COMUNITÀ EUROPEE BUREAU VOOR DE STATISTIEK DER EUROPESE GEMEENSCHAPPEN DET S"
R DE EUROPÆ ISKE F Æ LLESSKABER OFFICE STATISTIOUE DES COMMUNAUTES EUROPEENNES STATtST
¡AL OFFICE OF THE EUROPEAN COMMUNITIES STATISTISCHES AMT DER EUROPAISCHEN GEMEINSCHAFTEN ISTITUTO STATISTICO DEL
E COMUNITÀ EUROPEE BUREAU VOOR DE STATISTIEK DER EUROPESE GEMEENSCHAPPEN DET STATISTISKE DEPARTEMENT FOR DE
JROPÆ ISKE FÆ LLESSKABER OFFICE STATISTIOUE DES COMMUNAUTES EUROPEENNES STATISTICAL OFFICE OF THE EUROPEAN CC
■ riSCHES AMT DER EUROPAISCHEN GEMEINSCHAFTEN ISTITUTO STATISTICO DELLE COMUNITÀ EUROPEE BUREAl
YOOR DE STATISTIEK DER EUROPESE GEMEEN5CHAPPEN DET STATISTISKE DEPARTEMENT Γ OR DE EURQPÆJSjtE_£ÆJA^SSKABER_^
ÍFFICE STATISTIOUE DES C O M M l [ H
DER EUROPAISCHEN GEMEIN ■ . ^ ^ ^ ^ ^ ^ ^ ^ ^ ^ ^ ^ ^ ^ ^
ESL GEMEENSCHAPPEN DET
JAUTES EUROPEENNES STAT
TITUTO STATISTICO
TATISTISKE DEPARTEMENT FOR
ICAL OFFICE OF THE EUROPEAN
E COMUNITÀ EUROPEE BURE
UROPÆ ISKE FÆ LLESSKABER
«(UNITIES STATISTISCHES AM
)OR DE STATISTIEK DER EUROI
tiQUE DESCOMMUI
( EUROPAISCHEN GEMEINSCHAI
ÌEMEENSCHAPPEN DET STATIS|
ï EUROPEENNES CE OF THE EUROPEAN COMMUNITIES
eurostat
UROPÆISKE FÆLLESSKABER OFFICE STATISTIQUE DES COMMI
IMMUNITIES STATISTISCHES AMT DER EUROPAISCHEN GEMEINSC
U VOOR DE STATISTIEK DER EUROPESE GEMEENSCHAPPEN DET í
OFFICE STATISTIOUE DES COMMUNAUTES EUROPEENNES STATISI
DER EUROPAISCHEN GEMEINSCHAFTEN ISTITUTO STATISTICO DEI
SE GEMEENSCHAPPEN DET STATISTISKE DEPARTEMENT FOR DE
UTES EUROPEENNES STATISTICAL OFFICE OF THE EUROPEAN CO*
EN ISTITUTO STATISTICO DELLE COMUNITÀ EUROPEE BUREAU \
Ì T I S K E DEPARTEMENT FOR DE EUROPÆ ISKE FÆ LLESSKABER OF
OFFICE OF THE EUROPEAN COMMUNITIES STATISTISCHES AMT DE
STATISTISCHES AMT OER EUROPAISCHEN GEMEINSCHAFTEt*
OMUNITA EUROPEE BUREAU VOOR DE STATISTIEK DER EUROPESE GEMEENSCHAPPEN DET STATISTISKE
DEPARTEMENT FOR DE EURO! ÎUE DES COMMUNAUTES EUROPEENNES STATISTICAL OFFICI
MPEAN COMMUNITIES STATISTISCHES AMT DER EUROPAISCHEN GEMEINSCHAFTEN ISTITUTO STATISTICO DELLE COMUNIT
BUREAU VOOR OE STATISTIEK DER EUROPESE GEMEENSCHAPPEN DET STATISTISKE DEPARTEMENT FOR DE EUROPÆ ISK
.UE DES COMMUNAUTES EUROPEENNES STATISTICAL OFFICE OF THE EUROPEAN COMMUNITIES ■
STATISTISCHES AMT DER EUROPÄISCHEN GEMEINSCHAFTEN ISTITUTO STATISTICO DELLE COMUNITÀ EUROPEE BUREAU VOOR DE STi
I EUROPESE GEMEENSCHAPPEN DET STATISTISKE DEPARTEMENT FOR DE EUROPÆ ISKE FÆ LLESSKABER OFFICE STATIST
QUE DES COMMUNAUTES EUROPEENNES STATISTICAL OFFICE OF THE EUROPEAN COMMUNITIES STATISTISCHES AMT DER EUROPAIÍ
: H E N GEMI r TUTO STATISTICO DELLE COMUNITÀ EUROPEE BUREAU VOOR DE STATISTIEK DER EUROPESE GEMEENSC
^ P P E N DET STATISTISKE DEPARTEMENT FOR DE EUROPt ISKE F * LLESSKABER OFFICE STATISTIQUE DES COMMUNAUTES EUROPE
BASIC STATISTICS
OF THE COMMUNITY
Comparison with some European countries,
Canada, the United States of America, Japan
and the Union of Soviet Socialist Republics
19751976

rea eurostat
DE EUROPÆISKE FÆLLESSKABERS STATISTISKE KONTOR
STATISTISCHES AMT DER EUROPÄISCHEN GEMEINSCHAFTEN
STATISTICAL OFFICE OF THE EUROPEAN COMMUNITIES
OFFICE STATISTIQUE DES COMMUNAUTÉS EUROPÉENNES
ISTITUTO STATISTICO DELLE COMUNITÀ EUROPEE
BUREAU VOOR DE STATISTIEK DER EUROPESE GEMEENSCHAPPEN
Luxembourg, Centre Europeen. Boîte pönale 1907 T e l 47 941 Tele« Comeur Lu 3*23
1049 Bruxelles, Bâtiment Betlaymont. 200. rue de la Lo· (Bureau de liaison! Tel 7358040
Denne publikation kan lä; gennem de «algssiede'. som er nasvnt ρ Λ bagsiden al dette h.rlie
Diese Verol leni l ichung ist beiden auf der Ruck sei le des E inbands aufgeführten Vertnebsitellen erhältlich
This publication is obtainable from the sales agents mentioned on the back of the cover
Pour obtenir cette publication, prière de s'adresser aux bureaux de vente dont les adresses sont indiquées ai
Per ottenere Questa pubblicazione. Si prega di rivolgersi agli uff ici d i vendita ■ cui indirizzi sono indicati sul
dorso della copertina
Deze publikatie is verkrijgbaar bij verkoopkantoren de adressen op de omslag vermeld zijn

BASIC STATISTICS OF THE COMMUNITY
Comparison with some European countries, Canada, the United States of America, Japan and the Union of Soviet Socialist Republics
Fourteenth edition
This publication is a/so available in Danish, German, French, Italian and Dutch

This material must not be reproduced in other publications without acknowledgement of the source
SYMBOLS AND ABBREVIATIONS USED
0 nil
0* datum less than half the unit used
0.0* datum less than half the last decimal place used
not available
Φ uncertain or estimated
estimate made by Eurostat
< less than
> more than
% percentage
ρ provisional
Mio ' mil l ion
Mrd '000 mill ion
Mt millions of tons
mm millimetre
km kilometre
ha hectare
sq km square kilometre
kg kilogramme
t metric ton
t = t ton for ton
tee ton coal equivalent
hi hectolitre
eu. m cubic metre
GCV Gross calorific value
Teal teracalory = 109 kilocalory
kWh kilowatt-hour
GWh gigawatt-hour = 106 kWh
MW megawatt = 103 kilowatt
Eur Unit of account of the European Communities = 0,888671 g of fine gold
DM German marks
Ffr French francs
Lit Italian lire
Fl Guilders
Fb Belgian francs
Fix Luxembourg francs
C Pounds sterling
Dkr Danish crowns
$ Dollars
Dr Drachma
Lt Turkish lire
Nkr Norwegian crowns
Skr Swedish crowns
Sfr Swiss francs
Sch Schillings (Austrian)
Esc Escudos
Mkf Finnish markka
Pes Pesetas
R Roubles
GDP Gross domestic product
AA Agricultural Area
EUROSTAT Statistical Office of the European Communities
EC European Communities
ECSC European Coal and Steel Community
EUR-6 Total of the six first member countries of the EC
EUR-9 Total of member countries of the EC
OECD Organization for Economic Cooperation and Development
UN United Nations
ILO International Labour Office
FAO Food and Agriculture Organization
AOM Overseas States, territories and departments associated with the EC
UIC International Union of Railways
IATA International Air Transport Association
CST Statistical and Tariff Classification for International Trade
NACE General Nomenclature of Economic Activities in the European Communities

CONTENTS
Table Page
I .POPULATION
1 Area, population, density per sq. kilometre and estimated population growth 11 2 Population by age and sex (Ό00) 12 3 Population by age and sex (% of total) 13 4 Births, marriages and deaths 14 5 Size of private households 15
I I . LABOUR FORCE
6 Civilian labour force by occupational status (Ό00) 16 7 Civilian labour force by occupational status (%) 17 8 Civilian employment by main sectors of economic activity ('0001 18 9 Civilian employment by main sectors of economic activity (%) i g
10 Trends in unemployment 20
I I I . NATIONAL ACCOUNTS
11 Gross domestic product at market prices 21 12 Volume indices of gross domestic product at market prices 22 13 Annual rates of growth of gross domestic product at market prices —
1964 - 1974 at constant prices 23 14 Gross domestic product at market prices by branch (%) 24 15 Cost-structure of gross domestic product at market prices (%) 25 16 Use of gross domestic product at market prices (%) 26 17 Use of gross domestic product at market prices (Mrd Eur) 27 18 Gross fixed capital formation by products (%} 28 19 Taxes and actual social contributions 29
IV. RESEARCH AND EDUCATION
20 Number of pupils and students 30 21 Number of pupils and students by level 32 22 Pupils and students of the third level (full-time education) 33 23 Public expenditure on research and development (budget appropriations). . 34
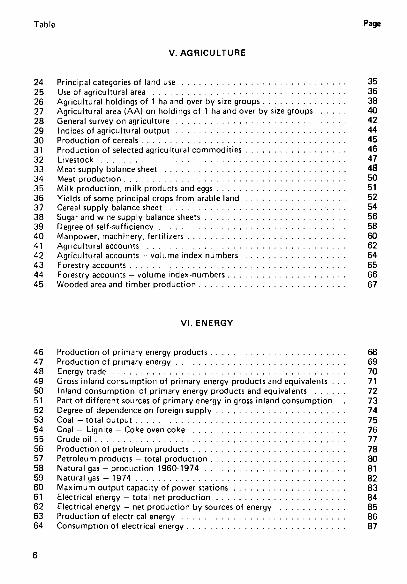
Table Page
V. AGRICULTURE
24 Principal categories of land use 35 25 Use of agricultural area 36 26 Agricultural holdings of 1 ha and over by size groups 38 27 Agricultural area (AA) on holdings of 1 ha and over by size groups 40 28 General survey on agriculture 42 29 I ndices of agricultural output 44 30 Production of cereals 45 31 Production of selected agricultural commodities 46 32 Livestock 47 33 Meat supply balance sheet 48 34 Meat production 50 35 Milk production, milk products and eggs 51 36 Yields of some principal crops from arable land 52 37 Cereal supply balance sheet 54 38 Sugar and wine supply balance sheets 56 39 Degree of self-sufficiency 58 40 Manpower, machinery, fertilizers 60 41 Agricultural accounts 62 42 Agricultural accounts - volume index-numbers 64 43 Forestry accounts 65 44 Forestry accounts — volume index-numbers 66 45 Wooded area and timber production 67
V I . ENERGY
46 Production of primary energy products 68 47 Production of primary energy 69 48 Energy trade 70 49 Gross inland consumption of primary energy products and equivalents . . . 71 50 Inland consumption of primary energy products and equivalents 72 51 Part of different sources of primary energy in gross inland consumption . . 73 52 Degree of dependence on foreign supply 74 53 Coal - total output 75 54 Coal - Lignite - Coke oven coke 76 55 Crude oil 77 56 Production of petroleum products 78 57 Petroleum products — total production 80 58 Natural gas - production 1960-1974 81 59 Natural gas - 1974 82 60 Maximum output capacity of power stations 83 61 Electrical energy — total net production 84 62 Electrical energy — net production by sources of energy 85 63 Production of electrical energy 86 64 Consumption of electrical energy 87

Table
V I I . INDUSTRY
65 Output of iron ore 88 66 Production of copper, lead and zinc ores, bauxite and potash 89 67 Production of pig iron, steel and finished rolled products 90 68 Production of crude steel 91 69 Consumption of steel per head of population 92 70 Production of aluminium, copper, lead, zinc and tin 93 71 Production of cement and building bricks 94 72 Production of certain basic chemicals 95 73 Chemicals: production of ammonia, fertilizers and plastics 96 74 Production of man-made fibres 97 75 Spindles and looms installed 98 76 Motor vehicles, production and assembly 99 77 Merchant vessels under construction and launched 100 78 Production of tobacco 101 79 Production of cotton and woollen yarns and fabrics 102 80 Production of wood pulp, paper and board 103 81 General indices of industrial production 104 82 Building: number of dwellings completed 105
V I I I . TRANSPORT
83 Railways: length of line, passenger-kilometres and ton-kiiometres 106 84 Rail freight traffic 107 85 Inland waterways 108 86 Civil aviation 109 87 Merchant fleets 110 88 Merchant shipping - International traffic 111 89 Length of road network by administrative categories 112 90 Goods transport between the Community-countries (EUR-61 113 91 Road traffic accidents 114
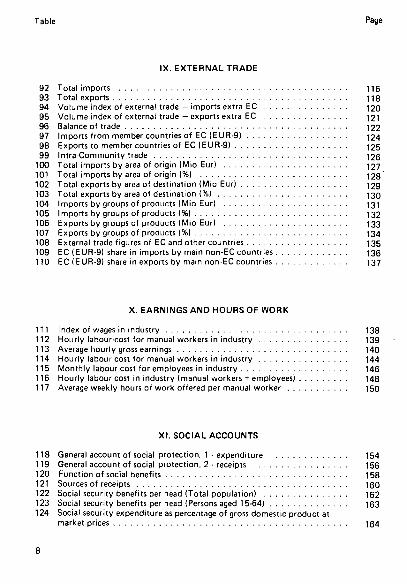
Table Page
IX. EXTERNALTRADE
92 Total imports 116 93 Total exports ι ,8 94 Volume index of external trade — imports extra EC 120 95 Volume index of external trade - exports extra EC 121 96 Balance of trade 122 97 Imports from member countries of EC (EUR-9) 124 98 Exports to member countries of EC (EUR-9) 125 99 Intra-Community trade 126
100 Total imports by area of origin (Mio Eur) 127 101 Total imports by area of origin (%) 128 102 Total exports by area of destination (Mio Eur) 129 103 Total exports by area of destination (%) 130 104 Imports by groups of products (Mio Eur) 131 105 Imports by groups of products (%) 132 106 Exports by groups of products (Mio Eur) I33 107 Exports by groups of products (%) I34 108 External trade figures of EC and other countries I35 109 EC (EUR-9) share in imports by main non-EC countries 136 110 EC (EUR-9) share in exports by main non-EC countries I37
X. EARNINGS AND HOURS OF WORK 111 Index of wages in industry 138 112 Hourly labour-cost for manual workers in industry 139 113 Average hourly gross earnings 140 114 Hourly labour cost for manual workers in industry 144 115 Monthly labour cost for employees in industry 146 116 Hourly labour cost in industry (manual workers + employees) 148 117 Average weekly hours of work offered per manual worker 150
XI . SOCIAL ACCOUNTS
118 General account of social protection. 1 -expenditure 154 119 General account of social protection. 2 - receipts 156 120 Function of social benefits 158 121 Sources of receipts 160 122 Social security benefits per head (Total population) 162 123 Social security benefits per head (Persons aged 15-64) 163 124 Social security expenditure as percentage of gross domestic product at
market prices 164

Table
X I I . STANDARD OF LIVING
125 Nutritional value of food consumption 165 126 Consumption of selected vegetable products 166 127 Consumption of selected animal products 167 128 Consumption of energy and stiel per head of population 168 129 Motor vehicles in use 169 130 Television sets and telephones in use 170 131 Health services 171
X I I I . PRICES
132 Wholesale price index 172 133 Consumer price index 173
XIV. FINANCE
134 Conversion rates in Eur 174 135 Balances of payments by main heading 176 136 Central government debt 178 137 Money market rates 179 138 Money supply (in Eur) 180 139 Money supply (in national currencies) 181 140 Financial market rates 182 141 Index of share prices 183 142 Gross reserves in gold and convertible currencies 184 143 Official gross reserves of gold and convertible currencies 185 144 International Monetary Fund positions (IMF) 186
XV. REGIONAL POPULATION AND GROSS DOMESTIC PRODUCT
145 Area and population 146 Area and population 147 Area and population 148 Area and population 149 Area and population 150 GDP at market prices 151 GDP at market prices 152 GDP at market prices 153 GDP at market prices 154 GDP at market prices 155 Origin of GDP at market prices 156 Origin of GDP at market prices 157 Origin of GDP at market prices 158 Origin of GDP at market prices 159 Origin of GDP at market prices
Germany 187 France 189
Italy 190 Netherlands, Belgium, Luxembourg 191 United Kingdom, Ireland, Denmark 192
Germany 193 France 195
Italy 196 Netherlands, Belgium, Luxembourg 197 United Kingdom, Ireland, Denmark 198
Germany 199 France 201
Italy 202 Netherlands, Belgium, Luxembourg 203 United Kingdom, Ireland. Denmark 204

Table Page
XVI . ADDITIONAL FIGURES FOR IRON AND STEEL INDUSTRY AND MINING
160 Personnel employed in the Community's coal-mining, iron-mining and iron and steel industries 206
161 Supply of iron ore in the Community (EUR-6) 208 162 Consumption of steel in the Community 209 163 Production of finished steel in the Community (EUR-6) 210 164 Al l iron and steel products - Imports by ECSC (EUR-6) from non-ECSC
countries 211 165 All iron and steel products - Exports from ECSC (EUR-6) to non-ECSC
countries 212 166 All iron and steel products: Intra-Community (EUR-6) trade 213 167 Hourly labour cost for manual workers 214 168 Accidents in the iron and steel industry (injury rates) 215 169 Accidents in the iron and steel industry (average number of calendar days
lost) 216
10

, POPULATION
Table 1
AREA. POPULATION, DENSITY PER SQ. KILOMETRE AND ESTIMATED POPULATION GROWTH
Middle of 1974
1 2 3 4 5 6
/ 8 9
IO 11 17 13 14 15 IC 1/ 18 li) 20 71 22
Country
EUR 9
GL'I m,my Frinire: Hilly Nr lhr i l . in .h Βι.Ίψι.ιη Luxiini Un 1 Kiniiili i in l i r l .m. Duumin k
Giuuiu: 1 in kry Noi W. IV Sweden Swil/ui kind Ausin.ι Poi 1II||,il F inland Sii.iiri USSR USA C,III,III.ι J.ipiin
World
Area
Ό00 sq km
1 528.2
248.6 547.0 301.3
40.8 30.5
2.6 244.0
70.3 43.1
132.0 814.6 323.9 450.0
41.3 83.9 91.6
337.0 504.8
22 402.0 9 363.1 9 976.1
3700
135 897.0
Population
Ό00
257 835
62 054 52 507 55413 13 545 9 772
357 56 056
3 086 5 045
8 962 38 270
3 987 8 161 6 481 7 528 8 735 4 682
35 225 252 064 211 909
22 479 109671
3 890 000
Density per sq km
169
250 96
184 332 320 137 230
44 117
68 47 12 18
157 90 95 14 70 11 23
2 296
29
Projected population 000
1980
263 507
61 940 55 302 57 181 14 190 9 867
364 56 214
3 309 5 140
9 479 45 767
4 100 8 334 6 636 7 778 9 283 4 570
36413 270 634 229 000
25 299 115972
4 401 000
1985
268 962
61 814 57 744 58 773 14 729 9 933
370 56 878
3 519 5 202
9 740 52 010
4 196 8 436 6 864 8018 9 663 4 524
38 061 286 882 244 000
27 347 120 798
4 858 000

I. POPULATION
Table 2
POPULATION BY AGE AND SEX 1974
V00
1 2 3 4 5 6 7 8 9
10 11 12 13 14 15 16 17 18 If) 70 21 72
Country
EUR-9
Germany (a) F rance Italy Netherlands Belijium Luxembourg Uniteti Kingdom Ireland Denmark
Greece Turkey(b| Norway Sweden Switzerland Austria (c) Portugal (b) Finland (d) Spain (c) USSR (d| USA (d) Canada Japan (d|
Under 15
male
7 109 6 494 6 897 1 793 1 135
37 6 803
492 587
1 116 7 673
491 866 745 933
1 245 559
4 853 34 874 28 929
3 165 13 294
fern.
6 756 6 224 6 541 1 712 1 082
35 6 449
470 560
1 050 7231 466 822 712 889
1 206 537
4 626 33 586 27 819
3 020 12 676
From 15 to 64
male
19 268 16 551 17 445 4 337 3 101
121 17 516
"900 1 628
2 795 9 674 1 255 2 660 2 046 2 168 2 5 1 1 1 511
10 425 76 037 64 453
7 070 35 901
fern.
20 248 16 268 17 927 4 261 3 104
118 17 572
881 1 607
2 927 9 543 1 230 2 600 2 078 2 405 2 816 1 577
10 835 90 849 66 688
7 005 37 579
65 and over
male
3 269 2 683 2 765
617 547
19 2 986
157 286
477 716 229 528 311 401 333 164
1 364 3 506 8671
809 3 444
fern.
5 326 4 287 3 838
825 803
27 4 730
186 377
597 829 303 668 458 660 500 278
1 935 8 607
12 278 1 026 4 438
Total
male
29 646 25 728 27 107
6 747 4 783
177 27 305
1 548 2 501
4 388 18 063
1 975 4 054 3 102 3 502 4 089 2 234
16 642 114417 102 053
11 044 52 639
fern.
32 330 26 779 28 306
6 798 4 989
180 28 751
1 538 2 544
4 574 17 603
1 998 4 090 3 248 3 954 4 522 2 392
17 396 133 042 106 785
11 051 54 693
ta) 1973 (bl 1970 Icl 1971 Idi 1972
12

I. POPULATION
POPULATION BY AGE AND SEX
1974
Table 3
% oí total
I
2 3
4
5
6
7
8
9
10
11
12 13
14
15
16
17
18
19
20
21
72
Country
EUR-9
Germany (a)
France Italy
Netherlands
Belgium
Luxembourg
United Kingdom
Ireland
Denmark
G reece
Turkey (b) Norway
Sweden
Switzerland
Austria (c)
Portugal (b)
Finland (a)
Spain (c)
USSR (d) USA (d)
Canada
Japan (d)
Under 15
male
11.5 12.4
12.4
13.2
11.6
10.4
12.1
15.9
11.6
12.4
21.5
12.4
10.6
11.8
12.5
14.5
12.1
14.3
14.1
13.8
14.3 12.4
fern.
10.9 11.8
11.8
12.6
11.1
9.8
11.5
15.2
11.1
11.7
20.3 11.7
10.1
11.2
11.9
14.0
11.6
13.6
13.6
13.3
13.7
11.8
Fro •π 15
to 64
male
31.1 31.5
31.5
32.0 31.7
33.9
31.2
29.2
32.3
31.2
27.1
31.6
32.7
32.2
29.1
29.2
32.7
30.6
30.7
30.9
32.0
33.4
fern.
32.6 31.0
32.4
31.5
31.8
33.0
31.4
28.6
31.8
32.7
26.8
31.0
31.9
32.7
32.3
32.7
34.1
31.8
36.7
31.9
31.7
35.0
65 and
over
male
5.3 5.1
5.0
4.6
5.6
5.3
5.4
5.1
5.7
5.3
2.0
5.7
6.5
4.9
5.4
3.9
3.5
4.0
1.4
4.2
3.7
3.2
fern.
8.6 8.2
6.9
6.1
8.2
7.6
8.4
6.0 7.5
6.7
2.3
7.6
8.2
7.2
8.8
5.8
6.0
5.7
3.5
5.9
4.6 4.1
Total
male
47.9 49.0
48.9
49.8
48.9
49.6
48.7
50.2
49.6
48.9
50.6
49.7
49.8
48.9
47.0
47.5
48.3
48.9
46.2
48.9
50.0
49.0
fern.
52.1 51.0
51.1
50.2
51.1
50.4
51.3
49.8
50.4
51.1
49.4
50.3
50.2
51.1
53.0
52.5
51.7
51.1
53.8
51.1
50.0
51.0
lal 1973, lb) 1970. Id 1971. Idi 1972.
13

I. POPULATION
Table 4
BIRTHS, MARRIAGES AND DEATHS 1974
1 2 3 4 5 6 7 8 9
10 11 12 13 14 1b 16 17 18 19 20 21 22
Country
EUR-9
Germany France Italy Netherlands Belgium Luxembourg United Kingdom Ireland Denmark
Greece Turkey(b) Norway Sweden Switzerland Austria Portugal Finland Spain USSR USA Canada |a) Japan
Births
'000
3 489
623 800 871 186 124
4 741
69 71
144
61 110 85 97
169 62
681 4 589 3 166
343 2 030
per '000
population
13.5
10.1 15.2 15.7 13.8 12.7 11.0 13.2 22.3 14.2
16.1 39.6 15.4 13.4 13.1 12.8 19.3 13.3 19.3 18.2 15.0 15.5 18.6
Marr
'000
1 850
377 394 404 110 74
2 435
23 31(a)
68
28 45 38 49 81 35
268 2 515(a) 2 225
205 1 009
ages
Per '000
population
7.2
6.1 6.3 6.3 8.1 7.6 6.2 7.8 7.3 6.1(a)
7.6
7.1 5.5 6.0 6.6 9.3 7.5 7.6
10.1(a) 10.5 9.1 9.2
Deaths
'000
2 785
725 551 529 108 116
4 667
34 51
76
40 86 56 94 96 45
295 2 199 1 933
164 711
per '000 population
10.8
11.7 10.5 9.5 8.0
11.9 12.1 11.9 11.2 10.2
8.5 14.6 10.1 10.6 8.8
12.5 11.1 9.6 8.4 8.7 9.1 7.4 6.5
Infant mortality
18.2
21.1 14.6 22.6 11.2 18.8 13.5 16.7 17.1 11.5(a)
24.0
11.9 9.2
13.2 23.4 38.4 10.1 13.7 26.4
6.5 15.6 11.3
(al 1973. (b) 1967.
14
I. POPULATION
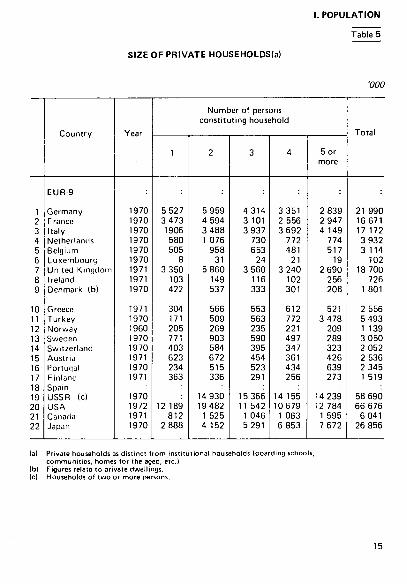
Table 5
SIZE OF PRIVATE HOUSEHOLDSÍa)
(a) Private households as distinct f rom institutional households (boarding schools, communit ies, homes for the aged, etc.).
(b) Figures relate to private dwellings, (c| Households of two or more persons
'000
1 2 3 •1 5 6 7 8 9
10 11 12 13 14 16 16 17 18 19 20 21 22
Country
EUR-9
Germany France Italy Netherlands Belgium Luxembourg United Kingdom Ireland Denmark (b)
Greece Turkey Norway Sweden Switzerland Austria Portugal Finland Spain USSR (c) USA Canada Japan
Year
1970 1970 1970 1970 1970 1970 1971 1971 1970
1971 1970 1960 1970 1970 1971 1970 1971
1970 1972 1971 1970
1
5 527 3 473 1906
580 505
8 3 350
103 422
304 171 205 771 403 623 234 363
12 189 812
2 888
Number of persons constituting household
2
5 959 4 594 3 488 1 076
958 31
5 860 149 537
566 509 269 903 584 672 515 336
14 930 19 482
1 525 4 152
3
4 314 3 101 3 937
730 653
24 3 560
116 333
553 563 235 590 395 454 523 291
15 366 11 542
1 046 5 291
4
3 351 2 556 3 692
772 481
21 3 240
102 301
612 772 221 497 347 361 434 256
14 155 10679
1 063 6 853
5 or more
2 839 2 947 4 149
774 517
19 2 690
256 208
521 3 478
209 289 323 426 639 273
14 239 12 784
1 595 7 672
Total
21 990 16 671 17 172 3 932 3 114
102 18 700
726 1 801
2 556 5 493 1 139 3 050 2 052 2 536 2 345 1 519
58 690 66 676
6 041 26 856
15

I I . LABOUR FORCE
Table 6
CIVILIAN LABOUR FORCE
BY OCCUPATIONAL STATUS
1974(a)
■ooo
1
2
3
4
5
6
7
8
9
10
11
12
13
14
15
16
17
18
19 20
21
22
Country
EUR9
Germany
France
Italy
Netherlands (b)
Belgium
Luxembourg
United Kingdom
Ireland
Denmark
Greece
Turkey
Norway
Sweden
Switzerland
Austria
Portugal
Finland
Spain
USSR
USA
Canada
Japan
Employers,
own
account
workers
and
family
workers
17 486
4 063
4 058
5 278
719 634
24 1 977
303
429
279
358
751
760
415
8 160
1 002
16 380
Wage
earners
and
salaried employees
84 782
21 626
17 108
13 437
3 860
3 164
127
22 790
744
1 926
1 375
3 521
2 288
2 349
1 739
76 249
7 757
35 950
Civilian
employment
102 270
25 689
21 166
18715
4 579
3 801
151
24 767
1 047
2 355
3 320
13 810
1 654
3 879
3 097
3 039
3 109
2 154
12 844
84 409
8 759
52 330
Un
employed
2 576
582
501
560
143
94
0
543
64
89
100
740
26
98
0
29
51
159
4 304
520
670
Total
104 846
26 271
21 667
19 275
4 722
3 895
151
25310
1 111
2 444
3 420
14 550
1 680
3 977
3 097
3 068
3 462
2 205
13 003
88714
9 279
52 990
la) EUR: figures 1974: other countries 1973 Source: OECD.
(b) ManYears.
16

I I . LABOUR FORCE
CIVILIAN LABOUR FORCE BY OCCUPATIONAL STATUS
1974(a)
Table 7
l 2 3 4 5 6 7 8 9
in 11 12 13 14 15 I l i 17 18 19 20 21 22
Country
EUR-9
Germany France Italy Netherlands Belgium Luxembourg United Kingdom Ireland Denmark
Greece Turkey Norway Sweden Switzerland Austria Portugal Finland Spain USSR USA Canada Japan
Employers, own
account workers
and family
workers
16.7
15.5 18.7 27.4 15.2 16.3 15,9
7.8 27.3 17.6
16.6 9.0
24.5 22.0 18.8
8.5 10.8 30.9
Wage earners
and salaried
employees
80.8
82.3 79.0 69.7 81.8 81.3 84.1 90.1 66.9 78.8
81.8 88.5
74.6 67.9 78.9
86.6 83.6 67.8
Civilian employment
97.5
97.8 97.7 97.1 97.0 97.6
100.0 97.9 94.2 96.4
97.1 94.9 98.5 97.5
100.0 99.1 89.8 97.7 98.8
95.1 94.4 98.8
Unemployed
2.5
2.2 2.3 2.9 3.0 2.4 0.0 2.1 5.8 3.6
2.9 5.1 1.5 2.5
0 0.9
2.3 1.2
4.9 5.6 1.3
Total
100
100 100 100 100 100 100 100 100 100
loo 100 100 100 100 100 100 100 100 loo 100 100 loo.
lal EUR-9: ligures 1974; other countries 1973. Source: OECD.
17
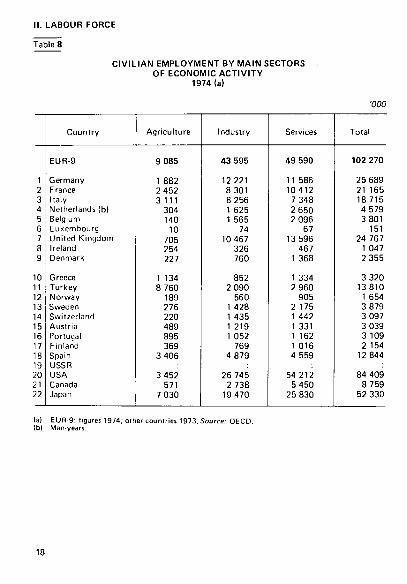
LABOUR FORCE
Table 8
CIVILIAN EMPLOYMENT BY MAIN SECTORS OF ECONOMIC ACTIVITY
1974(a)
VOO
1 2 3 4 5 6 7 8 9
10 11 12 13 14 15 16 17 18 19 20 21 22
Country
EUR-9
Germany France Italy Netherlands (b) Belgium Luxembourg United Kingdom Ireland Denmark
Greece Turkey Norway Sweden Switzerland Austria Portugal Finland Spain USSR USA Canada Japan
Agriculture
9 085
1 882 2 452 3111
304 140
10 705 254 227
1 134 8 760
189 276 220 489 895 369
3 406
3 452 571
7 030
Industry
43 595
12 221 8 301 8 256 1 625 1 565
74 10 467
326 760
852 2 090
560 1 428 1 435 1 219 1 052
769 4 879
26 745 2 738
19 470
Services
49 590
11 586 10412
7 348 2 650 2 096
67 13 596
467 1 368
1 334 2 960
905 2 175 1 442 1 331 1 162 1 016 4 559
54 212 5 450
25 830
Total
102 270
25 689 21 165 18715 4 579 3 801
151 24 767
1 047 2 355
3 320 13 810
1 654 3 879 3 097 3 039 3 109 2 154
12 844
84 409 8 759
52 330
(a) EUR-9: figures 1974; other countries 1973. Source: OECD. (bl Man-years.
18

II. LABOUR FORCE
CIVILIAN EMPLOYMENT BY MAIN SECTORS OF ECONOMIC ACTIVITY
1974 (a)
Table 9
1 2 3 4 5 6 7 8 9
10 11 12 13 14 15 16 17 18 19 20 21 22
Country
EUR-9
Germany France Italy Netherlands Belgium Luxembourg United Kingdom Ireland Denmark
Greece Turkey Norway Sweden Switzerland Austria Portugal Finland Spain USSR USA Canada Japan
Agriculture
8.9
7.3 12.0 16.6 6.6 3.7 6.6 2.8
24.3 9.6
34.2 63.4 11.4
7.1 7.1
16.1 28.8 17.1 26.5
4.1 6.5
13.4
Industry
42.6
47.6 39.2 44.1 35.5 41.2 49.0 42.3 31.1 32.3
25.7 15.1 33.9 36.8 46.3 40.1 33.8 35.7 38.0
31.7 31.3 37.2
Services
48.5
45.1 49.2 39.3 57.9 55.1 44.4 54.9 44.6 58.1
40.2 21.4 54.7 56.1 46.6 43.8 37.4 47.2 35.5
64.2 62.2 49.4
Total
100
100 100 100 100 100 100 100 100 100
100 100 100 100 100 100 100 100 100
100 100 100
la) EUR-9: figures 1974; other countries 1973. Source: OECD.
19

.LABOUR FORCE
Table 10
TRENDS IN UNEMPLOYMENT 1970 = 100
1 2 3 4 5 6 7 8 9
10 11 12 13 14 15 16 17 18 19 20 21 22
Country
Germany France Italy Netherlands Belgium Luxembourg United Kingdom Ireland Denmark
Greece Turkey Norway Sweden Switzerland Austria Portugal Finland Spain USSR USA Canada Japan
1969
120 96
108 118 116
93 86
153
133 122
148
151 95
69 77 97
1970
100 100 100 100 100 100 100 100 100
loo 100 100 100 100 100 100 100 100 100 100 100 100
1971
124 125 100 123 97
130 100 159
171
90
120 133
122 112 109
1972
165 138 114 205 122
145 109 135
233 181
121 :
134 107
118 114 124
1973
183 126 110 209 126
104 102 124
217 166
100 :
124 82
105 105 114
1974
391 141 92
255 136
98 98
524
208 136
124 106 122
70

I I I . NATIONAL ACCOUNTS
Table 11
GROSS DOMESTIC PRODUCT AT MARKET PRICES
(at current prices and current exchange rates) (a)
Mrd Eur
1 2 3 4 5 6 7 8 9
10 11 12 13 14 lb 16 17 18 19 70 21 22
Country
EUR-9
Germany France Italy Netherlands Belgium Luxembourg United Kingdom Ireland Denmark
Greece Turkey Norway Sweden Switzerland Austria Portugal Finland Spain USSR USA Canada Japan
1966
448.6
121.7 104.9 63.2 20.4 17.8 0.7
105.9 2.8
11.1
6.6 10.1
23.8 15.2 10.3 4.1 8.7
24.2
748.2 57.9
102.6
1967
472.4
122.8 113.1 69.6 22.4 19.1 0.7
109.7 3.0
12.0
7.2 11.2
25.8 16.2 10.9 4.6 8.8
26.8
792.5 62.2
121.3
1968
497.7
133.7 124.0
75.1 24.8 20.4
0.8 103.5
3.0 12.3
7.8 12.4 8.9
27.4 17.4 11.6 5.1 8.1
25.9
862.7 67.8
143.7
1969
549.7
151.9 135.3 82.7 28.1 22.7
0.9 110.5
3.5 14.1
8.9 13.8 9.7
29.6 18.9 12.8
5.6 9.3
28.9
927.9 74.5
166.3
1970
617.7
185.5 141.0 92.7 31.7 25.2
1.1 121.1
3.9 15.6
9.9 12.7 11.2 33.0 20.6 14.3 6.2
10.4 32.3
983.2 82.3
196.9
1971
685.2
206.2 156.9 100.9 35.8 27.7
1.1 135.2
4.4 17.0
10.9 12.4 12.4 35.5 23.5 16.4 6.9
11.3 36.4
1 056.9 93.4
220.9
1972
762.7
235.7 176.1 109.3 41.7 31.6
1.2 142.9
5.0 19.1
11.5 15.1 13.6 38.1 27.2 18.6
7.9 12.3 42.9
1 070.2 97.0
270.0
1973
837.0
275.2 199.6 110.9 47.6 36.0
1.5 139.3
5.1 21.8
12.9 16.8 15.5 40.3 32.2 21.8
8.9 13.9 48.6
1 038.0 97.1
327.4
1974
918.1
304.9 213.0 119.8
55.4 42.1
1.7 151.4
5.3 24.5
15.3 23.5 18.7 45.3 37.2 26.3
17.6 58.7
1 118.4 116.5 364.0
ia) For exchange rates used see table 134 on page 174, It must be emphasized that these exchange rates do not reflect the relationships between the domestic purchasing powers of the currencies.
21

III. NATIONAL ACCOUNTS
Table 12
VOLUME INDICES OF GROSS DOMESTIC PRODUCT AT MARKET PRICES
1970= 100
1 2 3 4 5 6 7 8 9
10 11 12 13 14 15 16 17 18 19 20 21 22
Country
EUR-9
Germany France Italy Netherlands Belgium Luxembourg United Kingdom Ireland Denmark
Greece Turkey Norway Sweden Switzerland Austria Portugal Finland Spain USSR USA Canada Japan
1965
80
80 77 75 76 79 83 90 80 81
71 73 80 82 83 78 74 78 73
84 79 58
1966
83
82 80 79 78 81 84 91 80 83
75 81 84 84 85 82 77 80 79
90 85 64
1967
85
82 84 85 82 85 85 94 85 86
79 86 89 87 87 84 83 82 83
92 88 72
1968
90
88 88 90 88 88 89 97 92 90
84 91 92 91 90 88 91 84 88
97 93 81
1969
95
94 94 95 94 94 96 98 97 97
93 96 97 95 95 93 93 92 94
100 97 90
1970
100
100 100 100 100 100 100 100 100 100
100 100 100 100 100 100 100 100 100
100 100 100
1971
103
103 105 102 104 104 101 102 104 103
107 110 105 101 104 105 106 102 104
103 106 107
T972
107
107 111 105 108 110 105 105 108 108
116 117 110 103 107 112 115 110 114
109 112 116
1973
113
112 118 111 113 117 113 111 114 112
125 122 114 107 111 118 124 117 123
116 120 128
1974
116
112 122 115 117 121 118 112 115 112
121 133 119 111 113 124
122 129
113 123 126
22

I I I . NATIONAL ACCOUNTS
Table 13
ANNUAL RATES OF GROWTH
OF GROSS DOMESTIC PRODUCT AT MARKET PRICES
1964-1974 (at constant prices)
1
2
3 4
5
6
7
8
9
10
11
12 13
14
16
16
17
18 19
20
21 77
Country
EUR 9
Germany
France
Italy Netherlands
Belgium
Luxembourg
United Kingdom
Ireland
Denmark
Greece
Turkey
Norway Sweden
Switzerland
Austria
Portugal (a)
Finland
Spain
USSR
USA
Canada
Japan
Total
4.1
4.0
5.3
4.7
5.0
4.7
3.7
2.5
3.9
3.8
6.5 6.4
4.5
3.5
5.0
6.7
5.1 10.4
3.7
5.2
8.6
Per head
of total
population
3.5
3.3
4.4
4.0
3.8
4.3
2.9
2.1
3.2
3.1
5.9
3.8
3.8
2.9
4.6
7.2
4.8
9.2
2.6
3.6
7.3
Per head
of occupied population
4.0
4.2
4.5
4.8
4.4
4.2
2.5
2.4
4.1
2.9
7.0
5.0 3.4
2.7
6.0
7.3
4.8
9.2
1.6
2.0
7.4
lal 1963 ■ 1973
73

I I I . NATIONAL ACCOUNTS
Table 14
GROSS DOMESTIC PRODUCT AT MARKET PRICES BY BRANCH (a)
1973
1 2 3 4 5 6 7 8 9
10 11 12 13 14 15 16 17 18 19 2Ü 21 22
Country
EUR-9 EUR-6
Germany France Italy Netherlands Belgium Luxembourg United Kingdom Ireland Denmark
Greece (b) Turkey Norway Sweden Switzerland Austria Portugal Finland Spain USSR USA Canada Japan
Agriculture, forestry
and fishing
5.2
3.0 6.5 8.7 5.4 3.8 4.0 2.4
7.5
16.1 27.0
5.8 3.8
5.9 14.6 10.7 11.9
4.4 4.7 5.4
Industry
(incl. construc
tion)
46.6
51.8 45.4 40.7 39.9 39.8 53.7 40.7
37.1
27.7 28.3 33.6 37.1
45.5 39.0 39.7 33.1
33.9 32.4 44.9
Services ond
genera! government
50.0
46.5 51.1 51.5 53.3 54.1
* 40 .2 ' 54.0
50.9
49.9 40.8 55.3 48.0
41.7 36.7 38.6 48.2
63.9 50.6 53.6
Gross domestic product
at market prices
100
100 100 100 100 100 100 100
100
100 100 100 100
100 100 100 100
100 100 100
(a) The total of the. three groups is not equal to 100, the difference being consti tuted by the balance of taxes l inked to imports, by the imputed output of bank services and for some countries by a statistical adjustment.
24

III. NATIONAL ACCOUNTS
COST-STRUCTURE OF GROSS DOMESTIC PRODUCT AT MARKET PRICES
1974
Table 15
1 2 3 4 5 6 7 8 9
in 11 17 13 14 15 16 17 18 19 .'0 21 22
Country
EUR-9
Germany France Italy Netherlands Belgium Luxembourg United Kingdom Ireland Denmark
Greece (a) Turkey (a) Norway Sweden Switzerland Austria Portugal (b) Finland Spain (b) USSR USA Canada Japan (b)
Compensation
of employees
56.9
55.7 52.4 55.0 60.1 55.7 58.5 64.5 54.9 58.0
33.0
55.3 61.5
51.2 44.0 52.2 52.0
61.6 54.2 48.4
Taxes linked
to produc
t ion and
imports minus sub
sidies
10.9
11.0 12.7 9.5 9.8 8.5 8.0
10.0 12.7 13.6
13.2 11.2 11.5 12.1
14.7 9.7 9.4 6.8
8.9 12.6 6.2
Consumption of
fixed capital
10.7
11.8 11.7 9.5 8.7 9.1
15.3 10.3
7.6 9.4
6.0 5.9
14.3 10.4
10.6 5.0
10.0 8.0
10.8 10.9 13.6
Net operating
surplus
21.5
21.5 23.2 26.0 21.4 26.7 18.1 15.1 24.8 19.0
47.8
18.9 16.0
23.5 41.3 28.4 33.2
18.7 22.3 31.8
Gross domestic product
at market prices
100
100 100 100 100 100 100 100 100 100
100 100 100 100
100 100 100 100
100 100 100
(a) 1972. (bl 1973.
25

I I I . NATIONAL ACCOUNTS
Table 16
USE OF GROSS DOMESTIC PRODUCT AT MARKET PRICES
1974
1 2 3 4 5 6 7 8 9
10 11 12 13 14 15 16 17 18 19 20 21 22
Country
EUR-9
Germany France Italy Netherlands Belgium Luxembourg United Kingdom Ireland Denmark
Greece Turkey (a) Norway Sweden Switzerland (b) Austria Portugal (b) Finland Spain (b) USSR USA Canada Japan
Private consump
tion on the
economic territory
61.4
58.2 61.7 66.9 55.8 58.7 53.4 63.7 71.0 56.5
70.9(c) 72.2(c) 51.4 52.0 56.1 53.9 72.3(c) 49.6 71.4
62.9 55.5 52.4
Collective
consumption of
general government
15.5
13.9 13.0 14.0 17.2 14.7 12.1 20.5 18.2 23.2
13.6 14.0 16.5 23.6 11.6 15.3 13.5 17.1 11.3
19.2 19.2 10.1
Gross fixed
capital formation
22.8
22.8 25.1 23.4 22.2 22.7 25.5 20.1 24.7 21.9
21.7 17.6 32.1 22.0 28.8 28.0 20.1 29.0 21.7
17.5 23.2 34.3
Change in
stocks
1.3
0.1 1.8 1.8 2.3 2.1 1.8 1.4 3.3 1.6
3.7 0.3 1.8 2.1 0.8 3.3
- 0 . 1 9.0 1.9
1.0 1.9 3.8
Balance of
exports and
imports of goods
and services
- 1.1
5.0 - 1.5 - 6.1
2.5 1.8 7.1
- 5.7 - 17.2 - 3.2
- 9.9 - 4.1 - 1.8
0.3 2.6
- 0.6 - 5.8 - 0.5 - 6.3
- 0.6 0.1
- 0.5
Gross domestic product
at market prices
100
100 100 100 100 100 100 100 100 100
100 100 100 100 loo 100 100 100 100
100 100 100
(al 1972. (b) 1973. (cl Private national consumption.
26

I I I . NATIONAL ACCOUNTS
USE OF GROSS DOMESTIC PRODUCT AT MARKET PRICES
1974
Table 17
Mrd Eur
1 2 3 4 5 6 7 8 9
10 11 12 13 14 15 16 1 / 18 19 20 21 22
Country
EUR-9
Germany France Italy Netherlands Belgium Luxembourg United Kingdom Ireland Denmark
Greece Turkey (a) Norway Sweden Switzerland (b) Austria Portugal (b) Finland Spain (b) USSR USA Canada Japan
Private consump
t i o n on the
economic territory
559.5
177.4 131.3 80.2 30.9 24.7
0.9 96.4
3.8 13.8
10.9(c) 10.9(c) 9.6
23.5 18.1 14.2 6.4(c) 8.7
34.7
703.1 64.6
190.9
Collective
consumption
of general govern
ment
140.5
42.4 27.6 16.8 9.5 6.2 0.2
31.1 1.0 5.7
2.1 2.1 3.1
10.7 3.7 4.0 1.2 3.0 5.5
215.2 22.4 36.6
Gross fixed
capital formation
210.3
69.5 53.4 28.0 12.3 9.6 0.4
30.4 1.3 5.4
3.3 2.7 6.0
10.0 9.3 7.4 1.8 5.1
10.5
195.2 27.0
124.7
Change in
stocks
11.2
0.3 3.9 2.2 1.3 0.9 0.0 2.1 0.2 0.4
0.6 0.0 0.3 0.9 0.3 0.8
- 0 . 0 1.5 0.9
11.2 2.2
13.7
Balance of
exports and
imports of goods
and services
- 3.3
15.2 - 3.2 - 7.3
1.4 0.8 0.1
- 8.6 - 0.9 - 0.8
- 1.5 - 0.6 - 0.3
0.1 0.8
- 0.2 - 0.5 - 0.8
3.1
0.2 - 1.9
Gross domestic product
at market
prices
918.1
304.9 213.0 119.8
55.4 42.1
1.7 151.4
5.3 24.5
15.2 15.1 18.7 45.3 32.2 26.3
8.9 17.6 48.6
1 118.4 116.5 364.0
la) 1972 lb) 1973. Icl Private national consumption.
27
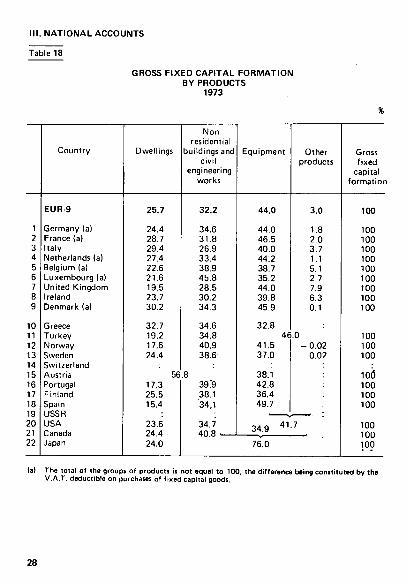
Ml. NATIONAL ACCOUNTS
Table 18
GROSS FIXED CAPITAL FORMATION
BY PRODUCTS
1973
1
2
3
4
5
6
7
8
9
10
11
12
13 14
15
16
17
18
19
20
21
22
Country
EUR-9
Germany (a)
France (a)
Italy
Netherlands (a)
Belgium (a)
Luxembourg (a)
United Kingdom
Ireland
Denmark (a)
Greece
Turkey
Norway
Sweden
Switzerland
Austria
Portugal
Finland
Spain
USSR USA
Canada Japan
Dwellings
25.7
24.4
28.7
29.4
27.4
22.6
21.6
19.5
23.7
30.2
32.7
19.2
17.6
24.4
56
17.3 25.5
15.4
23.6 24.4
24.0
Non
residential
buildings and
civil
engineering
works
32.2
34.6
31.8
26.9
33.4
38.9
45.8
28.5
30.2
34.3
34.6
34.8
40.9
38.6
.8
39.9
38.1
34,1
34.7 40 8 ■
Equipment
44.0
44.0
46.5
40.0
44:2
38.7
35.2
44.0
39.8
45.9
32.8
4e 41.5
37.0
38.1
42.8
36.4
49.7
Othc
produ
3.0
1.8
2.0
3.7
1.1
5.1
2.7
7.9
6.3
0.1
.0
- 0 . 0
0.0
34.9~4lT7
76.0
r Gross
cts fixed
capital
formation
100
100
100
100
100
100
100
100
100
100
100
2 100
2 100
10(5
100
100
100
100
100
100
(a) The total of the groups of products is not equal to 100, the difference being consti tuted by the V.A.T. deductible on purchases of f ixed capital goods.
28

III. NATIONAL ACCOUNTS
TAXES AND ACTUAL SOCIAL CONTRIBUTIONS 1974
Table 19
1 2 3 4 5 6 7 8 9
Country
EUR-9
Germany France Italy Netherlands Belgium Luxembourg United Kingdom Ireland Denmark
Taxes and actual
social contributions,
total
Eur mio
342 441
116 064 77 493 37 846 25 596 16 555
687 55 552
1 779 10 869
Taxes linked
to production
and imports
Current taxes on
income and
wealth
Capital taxes
Actual social
contributions
in % of total
34.9
32.4 40.2 36.4 25.2 30.2 28.0 36.8 55.8 36.2
32.1
33.7 20.4 20.9 34.8 37.7 43.2 43.4 30.9 62.2
0.6
0.2 0.6 1.0 0.5 0.7 0.4 1.3 1.7 0.4
32.4
33.7 38.8 41.7 39.6 31.4 28 4 18.5 11.7
1.3
29

IV. RESEARCH AND EDUCATION
Table 20
School-year
1962/63 1963/64 1964/65 1965/66 1966/67 1967/68 1968/69 1969/70 1970/71 1971/72 1972/73 1973/74
1962/63 1963/64 1964/65 1965/66 1966/67 1967/68 1968/69 1969/70 1970/71 1971/72 1972/73 1973/74
EUR-9 Germany
'000
40 238 41 100 42 344 43 598 44 921 46 232 47 588 48 723 49 632
7 462 7 594 7 755 7 983 8 268 8 644 8 975 9 447 9 877
10 337 10719 11 053
France
8 933 9 065 9 2 1 3 9 374 9 436 9 633 9 888
10081 10 206 10 362 10 555 10614
% of total population
16.4 16.7 17.1 17.5 17.9 18.2 18.6 19.0 19.2
13.0 13.1 13.2 13.5 13.9 14.5 14.9 15.6 16.1 16.8 17.3 17.8
18.7 18.8 18.9 19.1 19.0 19.3 19.7 19.9 19.9 20.0 20.2 20.2
NUMBER OF PUPILS
Italy
7 279 7 521 7 771 8 043 8 276 8 520 8 784 9 082 9 449 9 781
10 077 10313
14.2 14.6 14.9 15.3 15.7 16.1 16.5 16.9 17.5 18.0 18.4 18.6
(full-time
Netherlands
2 352 2 375 2 407 2 451 2 491 2 545 2 599 2 655 2 719 2 795 2 851 2915
19.7 19.6 19.6 19.7 19.8 20.0 20.2 20.4 20.6 21.0 21.2 21.5
(al Excl. nursery schools and apprenticeships
30
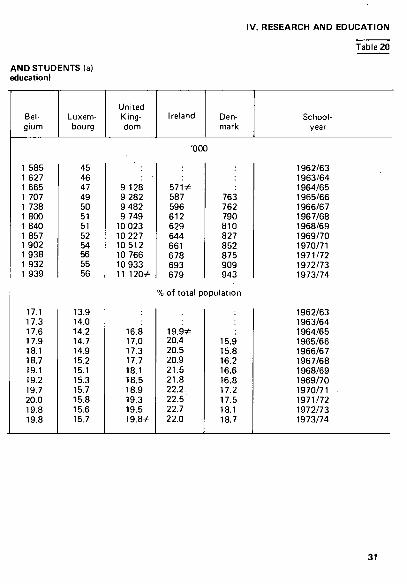
AND STUDENTS (al education)
IV. RESEARCH AND EDUCATION
Table 20
Belgium
1 585 1 627 1 665 1 707 1 738 1 800 1 840 1 857 1 902 1 938 1 932 1 939
17.1 17.3 17.6 17.9 18.1 18.7 19.1 19.2 19.7 20.0 19.8 19.8
Luxembourg
45 46 47 49 50 51 51 52 54 56 55 56
13.9 14.0 14.2 14.7 14.9 15.2 15.1 15.3 15.7 15.8 15.6 15.7
United Kingdom
9 128 9 282 9 482 9 749
10 023 10 227 10512 10 766 10 933 11 1 2 0 *
16.8 17.0 17.3 17.7 18.1 18.5 18.9 19.3 19.5 19 .8 *
Ireland Denmark
'000
5 7 1 * 587 596 612 629 644 661 678 693 679
763 762 790 810 827 852 875 909 943
% of total population
1 9 . 9 * 20.4 20.5 20.9 21.5 21.8 22.2. 22.5 22.7 22.0
15.9 15.8 16.2 16.6 16.8 17.2 17.5 18.1 18.7
School-year
1962/63 1963/64 1964/65 1965/66 1966/67 1967/68 1968/69 1969/70 1970/71 1971/72 1972/73 1973/74
1962/63 1963/64 1964/65 1965/66 1966/67 1967/68 1968/69 1969/70 1970/71 1971/72 1972/73 1973/74
31

IV. RESEARCH AND EDUCATION
NUMBER OF PUPILS AND STUDENTS BY LEVEL
Schoolyear EUR-9 Ger
many Italy Nether
lands Belgium Luxembourg
United Kingdom
1969/70 1970/71 1971/72 1972/73 1973/74
1969/70 1970/71 1971/72 1972/73 1973/74
1969/70 1970/71 1971/72 1972/73 1973/74
6 198 6 385 6 6 1 6 6 778 7 034
23 148 23 675 23 941 23 950 24 000
19 001 19 558 20 387 2 1 3 1 2 22 004
1 127 1 196 1 282 1 386 1 464
3 886 4 296 4 491 4 526 4 497
4 940 4 899 5 068 5 347 5 6 2 1
2 116 2 213 2 298 2 371 2 458
5 218 5 147 5 042 4 987 4 954
4 156 4 294 4 515 4 714 4 798
1 560 1 587 1 620 1 567 1 605
4 819 4 929 4 997 5 043 5 040
3 640 3 833 4 0 1 8 4 225 4 426
're-School level
493 493 493 497 508
First level
1 523 1 530 1 533 1 531 1 524
466 457 450 444 443
1 020 1 044 1 041 1 005
987
Second level
967 1011 1 068 1 118 1 176
Third leve
717 727 742 768 784
7.4 7.8 8.3 8.5 8.6
36.4 31.7 33.2 31.3 31.6
14.1 20.2 20.9 21.4 21.9
320 305 332 362 3 7 0 *
5 842 5 881 5 972 5 982 6 1 3 0 *
3 997 4 174 4 320 4 468 4 5O0#
97.0 103.6 101.7 105.1 136.4
422.8 427.6 431.3 433.2 408.0
195.3 208.5 219.8 231.1 241.7
11.9 20.9 31.3 37.6 41.4
381.1 389.3 400.7 414.1 428.6
373.9 384.1 391.7 403.2 416.2
1969/70 1970/71 1971/72 1972/73 1973/74
2 770 3 000 3 259 3 460 3 631
620 684 777 848 934
707 764 806 855 866
622 687 766 809 847
165 178 193 202 215
119 126 148 143 151
1.7 1.9 2.1 2.1 2.3
438 457 474 482 4 9 0 *
24.0 26.2 27.1 28.6 29.6
72.0 78.2 82.9 92.0 98.2

IV. RESEARCH AND EDUCATION
PUPILS AND STUDENTS OF THE THIRD LEVEL (full-time education)
Table 22
Schoolyear EUR-9 Germany France Italy
Netherlands Belgium
Luxembourg
.United Kingdom Ireland Denmark
in absolute value (χ '000)
1962/63 1965/66 1970/71 1971/72 1972/73 1973/74
1 932* 3 000 3 259 3 460 3 632
474 517 684 777 848 934
315 421 764 806 855 866
314 408 687 766 809 847
96 120 178 193 202 215
64 84 125 132 141 149
in % of the total school-population
1.0 1.2 1.9 2.1 2.2 2.3
222 309 457 474 482 490*
19.4 26.2 27.1 28.6 29.6
51.0 78.2 82.9 92.0 98.2
1962/63 1965/66 1970/71 1971/72 1972/73 1973/74
4.2 5.7 6.0 6.2 6.4
5.7 5.8 6.2 6.7 7.0 7.5
3.0 3.8 6.2 6.4 6.6 6.7
3.7 4.4 6.2 6.7 6.9 7.1
3.5 4.1 5.5 5.9 6.0 6.3
3.2 3.9 5.3 5.5 5.9 6.2
2.0 2.3 3.1 3.3 3.5 3.6
2.4* 3.2 4.2 4.3 4.3 4.3*
2.9 3.4 3.5 3.6 3.6
6.7 9.0 9.1 9.7
10.0

IV. RESEARCH AND EDUCATION
PUBLIC EXPENDITURE ON RESEARCH AND DEVELOPMENT (Budget appropriations)
Germany Italy
Netherlands Belgium
Luxembourg
United Kingdom Ireland Denmark
in Mio Eur (current exchange rates)
1971 1972 1973 1974 1 9 7 5 *
1971 1972 1973 1974 1 9 7 5 *
1971 1972 1973 1974 1 9 7 5 *
7 185.0 7 992.2 9 058.1 9 645.8
10 343.8
7 185.0 7 992.2 9 058.1
10 063.9 11 019.2
28.36 31.38 35.34 39.08 42.64
2 309.3 2 744.6 3 394.0 3 701.2 3 955.9
2 306.3 2 623.6 3 086.2 3 256.0 3 480.1
37.62 42.54 49.80 52.47 56.20
2 011.6 2 198.1 2 404.8 2 494.4 2 730.5
2 011.6 2 198.1 2 404.8 2 699.2 2 905.4
ir
39.26 42.51 46.13 51.41 54.82
454.7 441.9 467.9 440.7 485.2
in Mio Eu
454.9 446.4 545.8 573.3 689.3
333.3 380.2 448.2 504.3 585.8
(exchange
333.0 369.9 430.1 467.4 543.0
226.5 266.0 279.5 334.4 345.0
rates 197C
226.2 258.9 272.0 325.4 335.7
Eur per capita (exchange rates 1
8.44 8.23 9.94
10.35 12.35
25.29 27.71 32.00 34.51 39.79
23.30 26.66 27.92 33.31 34.27
1 734.0 1 953.5 1 760.7 2 003.0 2 046.4
1 734.0 1 953.5 2 159.1 2 567.0 2 858.4
31.18 35.01 38.54 45.78 50.95
15.1 18.4 21.5 22.7 2 6 4
15.1 18.4 264 2 9 0 37 0
5.08 6.13 8.65 9.40
11.86
103.9 122.2 132.3 145.1 168.6
103.9 123.4 133.6 146.6 170.3
20.95 24.73 26.60 29.06 33.70
in % of the gross domestic product
1971 1972 1973 1974 1 9 7 5 *
1 05 1 05 1 09
1.02
1.11 1.16 1.23 1.21 1.22
1.28 1.25 1.20 1.17 1.12
0.46 0.41 0.43 0.37 0.38
0.93 0.91 0.94 0.91 0.96
0.81 0.83 0.78 0.80 0.73
1.30 1.32 1.28 1.34 1.21
0.34 0.35 0.42 0.43 0.42
0.60 0.63 0.60 0.59 0.61

V. AGRICULTURE
Table 24
PRINCIPAL CATEGORIES OF LAND USE 1973
1 2 3 4 5 S 7 8 9
10 11 12 13 14 15 16 17 18 19 70 71 22
Country
EUR 9
Germany France Italy Netherlands Belgium Luxembourg Uniteti Kingdom Ireland Denmark
Greece (c) Turkey (d) Norway Sweden Switzerland Austria Portugal (c) Finland Spain USSR USA (g) Canada (h) Japan (i)
World
Agricu turai area
'000 ha
93 684
13 429 32 459 17 482 2 110 1 568
133 18 683(b) 4 844 2 976
8 870 54 331
904 3 7 1 8 2017 3 793 4 405(e) 2 766
32 280 607 901 435 330
68 663 5 685
4 466 000
%of total area
61.4
54.0 59.1 58.0 57.3 51.4 51.3 76.6 68.9 69.1
67.2 69.6
2.8 8.3
48.9 45.2 49.5
8.2 63.9 27.1 46.5 68.8 15.3
33.3
Arable land (a)
%
Permanent meadows
and pastures
of agricultural
area
55.3
60.2 57.6 70.0 40.0 53.2 47.4 38.3 25.3 89.3
40.9 51.9 87.4 81.2 19.0 42.5 88.0 98.1 65.0 38.2 43.9 63.7 93.2
33.0
44.7
39.8 42.4 30.0 60.0 46.8 52.6 61.7 74.7 10.7
59.1 48.1 12.6 18.8 81.0 57.5 12.0
1.9(f) 35.0 61.8 56.1 36.3
6.8
67.0
(a) Incl. land under permanent cul t ivat ion {orchards, vineyards etc.). (b) Moreover 442 000 ha statistically insignificant holdings w i thout breakdown (c) 1968. (d) 1973 permanent grassland: 1967. le) Incl. 800 302 ha of temporary crops in association w i th permanent crops or forests If) On agricultural holdings, (g) 1969. <h) 1971. (i) 1972.
35

II. AGRICULTURE
Table 25
Land use
Agricultural used area
Arable land
Cereals Wheat Rye lb) Barley Oats I d Maize Other cereals
Rice
Dried pulses Roots and tuber crops
Potatoes Sugar beet Fodder beet Other roots and tuber crops
Industrial crops Green fodder from arable land Vegetables and other commercial
horticulture (d) Other area le)
Permanent grassland
Permanent grassland for mowing Permanent grassland for grazing
Land under permanent crops
Fruit Olive growing Vineyards Other land under permanent crops
EUR-9 (a)
93 486
47 075
26416 11 055
961 8 7 1 9 2 812 2 781
85 202
456 4 220 1 409 1 651
821 340
847 12 164
1 735 1 034
4 1 4 6 2
11 690(f) 28 240(f)
4 950
1 076 1 087 2 707
80
Germany
13 344
7 874
5 298 1 631
735 1 665 1 159
108
0
32 1 112
467 369 255
21
136 870
397 29
5 264
3 864 1 400
206
87 0
99 20
France
32 441
17 235
9 8 1 9 4 140
122 2 712
846 1 916
81 15
55 1 328
307 538 310 173
496 4 710
546 270
13 597
4 787 8 8 1 0
1 609
249 30
1 316 13
Italy
17 503
9 310
4 726 3 544
16 201 210 750
4 186
252 357 137 193
12 15
75 2 690
450 573
5 214
1 154 4 060
2 979
604 1 057 1 291
26
Netherlands
2 101
807
261 130 22 73 33
2 0* 0
12 279 159 116
4 0*
28 121
82 24
1 255
42
35 0 0* 7
(a) Where statistics are available. (b) Incl. maslin. (c) Incl. mixed grains others than maslin. (d) Market gardening and kitchen gardens. (e) Agricultural seeds, plants for green manu (f) Excl. Netherlandsand Denmark.
36
ing, fallow.
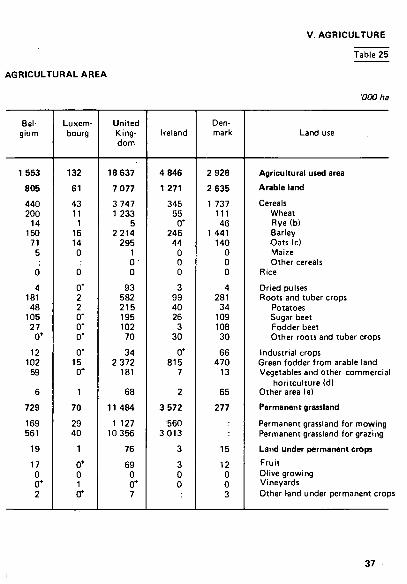
AGRICULTURAL AREA
V. AGRICULTURE
Table 25
'000 ha
Belgium
1 553
805
440 200
14 150
71 5
0
4 181 48
105 27
0*
12 102
59
6
729
169 561
19
17 0 0* 2
Luxembourg
132
61
43 11
1 16 14 0
0
0* 2 2 0* 0* 0*
0* 15 0*
1
70
29 40
1
0* 0 1 0*
United Kingdom
18 637
7 077
3 747 1 233
5 2214
295 1 0 ' 0
93 582 215 195 102
70
34 2 372
181
68
11484
1 127 10356
76
69 0 0* 7
Ireland
4 846
1 271
345 55
0* 246
44 0 0 0
3 99 40 26
3 30
0* 815
7
2
3 572
560 3 013
3
3 0 0
Denmark
2 928
2 635
1 737 111 46
1 441 140
0 0 0
4 281
34 109 108 30
66 470
13
65
277
15
12 0 0 3
Land use
Agricultural used area
Arable land
Cereals Wheat Rye (b) Barley Oats (cl Maize Other cereals
Rice
Dried pulses Roots and tuber crops
Potatoes Sugar beet Fodder beet Other roots and tuber crops
Industrial crops Green fodder from arable land Vegetables and other commercial
horitculture (d) Other area (el
Permanent grassland
Permanent grassland for mowing Permanent grassland for grazing
Land under permanent crops
Fruit Olive growing Vineyards Other land under permanent crops
37

V. AGRICULTURE
Table 26
AGRICULTURAL HOLDINGS OF 1 HA 1974
Size groups (ha AA)
EUR-9 EUR-6 Germany
France Italy (a)
1-< 5 5-<10
1 0 - < 2 0 20- < 50
» 5 0
Total
1 < 5 5 - < 1 0
1 0 - < 2 0 20- < 50
» 5 0
Total
Number of holdings (χ '000)
2 250 941 940 854 322
5 307
42.4 17.7 17.7 16.1 6.1
100
2 145 826 776 672 209
4 628
46.3 17.8 16.8 14.5 4.5
100
323.9 184.6 220.6 175.5 25.3
930
34.8 19.8 23.7 18.9 2.7
100
262.0 197.0 297.0 365.0 140.0
1 487.0 387.2 182.2 80.2 36.8
1 261
20.8 15.6 23.6 28.9 11.1
100
2 173
68.4 17.8 8.4 3.7 1.7
100
1-< 5 5 - < 1 0
1 0 - < 2 0 20- < 50
» 5 0
Total
100 100 100 100 100
100
95.3 87.8 82.5 78.7 64.9
87.2
14.4 19.6 23.5 20.5
7.9
17.5
11.6 20.9 31.6 42.7 43.5
23.8
66.1 41.1 19.4 9.4
11.4
40.9
38

AND OVER BY SIZE GROUPS
V. AGRICULTURE
Netherlands
37.0 31.8 45.1 29.9
3.1
147
25.2 21.6 30.7 20.3
2.1
100
1.6 3.4 4.8 3.5 1.0
2.8
Belgium
33.5 25.1 29.6 18.6 3.2
110
30.5 22.8 26.9 16.9 2.9
100
1.5 2.7 3.1 2.2 1.0
2.1
Luxembourg
Number
1.2 0.7 1.2 2.4 0.4
6
19.9 12.4 19.7 40.7
7.3
100
0.1 0.1 0.1 0.3 0.1
0.1
United Kingdom
of holdings (x
40.9 34.9 44.1 73.7 83.8
277
% 14.8 12.6 15.9 26.6 30.3
100
1.8 3.7 4.7 8.6
26.0
5.2
Ireland (a)
Ό00)
48.0 54.0 82.0 66.0 20.0
270
17.8 20.0 30.4 24.4
7.4
100
2.1 5.7 8.7 7.7 6.2
5.1
Denmark
16.0 26.1 38.3 42.6
9.6
133
12.1 19.7 28.8 32.1
7.3
100
0.7 2.8 4.1 5.0 2.9
2.5
Size groups (ha AA)
1-< 5 5 - < 1 0
1 0 - < 2 0 20- < 50
» 5 0
Total
1-< 5 5 - < 1 0
1 0 - < 2 0 20- < 50
» 5 0
Total
1-< 5 5 - < 1 0
1 0 - C 2 0 20- < 50
» 5 0
Total
39
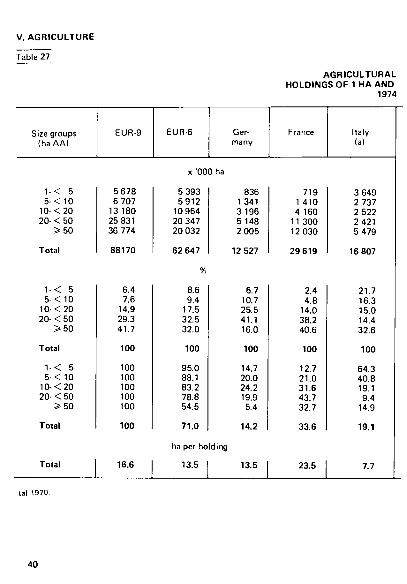
V. AGRICULTURE
Table 27
AGRICULTURAL HOLDINGS OF 1 HA AND
1974
Size groups (haAA)
EUR-9 EUR-6 Germany
France Italy
1-< 5 5 - < 1 0
10-<20 20- < 50
>50
Total
1 5
10 20
1 5
< 5 < 1 0 < 2 0 < 5 0 » 5 0
< 5 < 1 0
10-<20 20 < 5 0
» 5 0
Total
Total
5 678 6 707
13 180 25 831 36 774
88170
6.4 7.6
14.9 29.3 41.7
100
100 100 100 100 100
loo
16.6
χ '000 ha
5 393 5912
10 964 20 347 20 032
62 647
836 1 341 3 196 5 148 2 005
12 527
8.6 9.4
17.5 32.5 32.0
100
95.0 88.1 83.2 78.8 54.5
71.0
ha per ho
13.5
6.7 10.7 25.5 41.1 16.0
100
14.7 20.0 24.2 19.9
5.4
14.2
Id ing
13.5
719 1 410 4 160
11 300 12 030
29 619
2.4 4.8
14.0 38.2 40.6
100
12.7 21.0 31.6 43.7 32.7
33.6
23.5
3 649 2 737 2 522 2 421 5 479
16 807
21.7 16.3 15.0 14.4 32.6
100
64.3 40.8 19.1 9.4
14.9
19.1
7.7
(a) 1970.
40
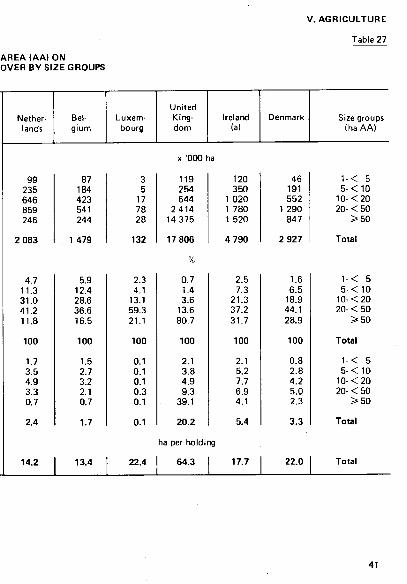
AREA (AA) ON OVER BY SIZE GROUPS
V. AGRICULTURE
Table 27
Netherlands
99 235 646 859 246
2 083
4.7 11.3 31.0 41.2 11.8
100
1.7 3.5 4.9 3.3 0.7
2.4
14.2
Belgium
87 184 423 541 244
1 479
5.9 12.4 28.6 36.6 16.5
100
1.5 2.7 3.2 2.1 0.7
1.7
13.4
Luxembourg
3 5
17 78 28
132
2.3 4.1
13.1 59.3 21.1
100
0.1 0.1 0.1 0.3 0.1
0.1
22.4
United Kingdom
Ireland (a)
χ '000 ha
119 254 644
2 4 1 4 14 375
17 806
% 0.7 1.4 3.6
13.6 80.7
100
2.1 3.8 4.9 9.3
39.1
20.2
ha per holdi
64.3
120 350
1 020 1 780 1 520
4 790
2.5 7.3
21.3 37.2 31.7
100
2.1 5.2 7.7 6.9 4.1
5.4
19
1 , 7
Denmark
46 191 552
1 290 847
2 927
1.6 6.5
18.9 44.1 28.9
100
0.8 2.8 4.2 5.0 2.3
3.3
22.0
Size groups (ha A A)
1 -< 5 5- < 10
1 0 - < 2 0 20- < 50
» 5 0
Total
1 < 5 5 - < 1 0
1 0 - < 2 0 20- < 50
» 5 0
Total
1 < 5 5 - < 1 0
1 0 - < 2 0 20- < 50
> 5 0
Total
Total
41

V. AGRICULTURE
Table 28 GENERAL SURVEY
Characteristics
Total number of agricultural holdings (χ Ό00)
Woodland Agricultural area used (AA)
AA owner farmed AA tenant farmed
Arable land Permanent meadow and pasture Permanent crops
Cereals Wheat Grain maize
Potatoes Sugar beet Forage roots and tubers
Dried vegetables Industrial plants Green fodder crops on arable lane
Fresh vegetables Fruit plantations Vineyards
Equines Cattle/Buffaloes
Dairy cows
Sheep Pigs
Laying hens Broilers
EUR-6
5 888
1 848 5 855
5 260 2 406
4 657 3 279 2 871
3 754 2 922 1 070
2316 373
1 508
443 208
2414
1 243 577
2 093
936 3 049 2 357
446 2 429
3 375 1 673
Germany
1 074.6
France
1 587.6
Italy
2 849.9
of which: holdings
474.2 1 071.0
999.3 631.5
956.2 929.9 153.4
896.1 659.8
56.3
758.8 115.6 621.9
26.7 31.1
490.0
56.4 91.5 72.3
96.4 793.4 713.4
28.3 751.1
725.3 30.1
658.9 1 583.3
1 348.9 928.7
1 285.0 1 207.6
720.8
1 052.0 762.2 352.1
895.0 55.1
773.1
114.0 119.4 891.8
221.8 139.2 659.9
294.4 1 051.5
815.5
173.7 655.6
1 203.9 775.2
695.5 2 832.6
2 627.6 599.1
2 149.2 852.0
1 957.8
1 621.8 1 411.3
659.4
485.3 136.1
290.2 48.1
950.8
900.8 319.7
1 359.2
443.3 939.5 604.4
211.0 857.6
1 304.6 852.5
Netherlands
184.6
wi th . . .
6.8 181.1
140.3 112.2
121.3 136.2
21.6
73.2 24.5
0.4
76.2 33.2 29.7
6.4 3.1
24.1
36.7 14.6
0
50.1 130.8 116.3
19.8 75.8
48.7 2.8
Belgium
184.0
8.7 179.5
136.6 129.2
138.8 146.9
16.3
104.4 60.2
2.1
95.4 32.7 80.0
4.8 5.8
52.8
27.2 11.0
0
51.1 127.9 101.4
12.8 83.7
87.5 12.1
Luxembourg
7.6
3.7 7.6
7.4 5.3
6.6 6.6 1.5
6.1 4.4
0
4.8 0*
2.8
0.4 0.1 4.1
0.1 0.5 1.3
0.6 6.1 5.5
0.3 4.8
4.9 0.4
42

V. AGRICULTURE
ON AGRICULTURE 1970/71 Table 28
Characteristics
Total area of agricultural holdings (χ '000 ha)
Woodland Agricultural area used (AA)
AA owner farmed AA tenant farmed
Arable land Permanent meadow and pasture Permanent crops
Area under:
Cereals Wheat Grain maize
Potatoes Sugar beet Forage roots and tubers
Dried vegetables Industrial plants Green fodder crops on arable land
Fruit vegetables Fruit plantations Vineyards
Number of animals (χ '000):
Equines Cattle/Buffaloes
Dairy cows
Sheep Pigs
Laying hens Broilers
EUR-6
78 023
9 4 1 1 63 588
39 490 23 695
33 705 24 945
4 752
20 034 9 154 2 241
1 107 1 141 1 045
312 673
7 685
794 2 431
1 343 52 169 18 573
16 701 45 800
169 741 177 386
Germany
15 236
1 831 12651
8 964 3616
7 310 5114
159
5 131 1 500
114
490 314 330
29 129 812
65 77
197 14 674
5 480
971 19 898
50 508 21 993
France
35 039
Italy
23 650
consisting of:
3 083 29 940
16 438 14 568
16014 12 330
1 488
9 201 3 669 1 441
311 400 671
60 469
4 310
230 1 200
452 21 400
7 280
9 052 10 703
43 156 54 704
4 423 17 179
12 454 3 328
8716 5 423 3 040
4 836 3 651
683
100 234
199 48
2 384
442 1 153
533 8 701 2 861
5 987 5 835
43 013 59 618
Netherlands
2 342
42 2 143
1 112 1 030
818 1 282
43
360 142
1
157 104
9
17 15 61
38 0
86 4 3 1 4 1 895
575 5 533
17 846 30 060
Belgium
1 603
15 1 540
440 1 100
783 727
21
461 181
2
47 89 34
7 12
104
19 0
74 2 887
995
113 3 728
14 996 10 981
Luxembourg
153
17 135
82 53
64 69
1
45 11
0
2 0* 1
0* 0*
14
0* 1
1 193 62
3 103
222 30
43
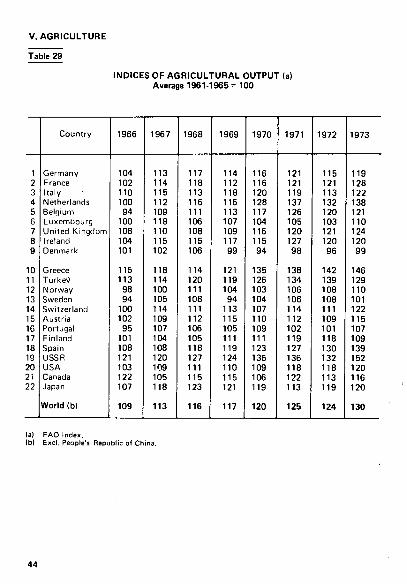
V. AGRICULTURE
Table 29
INDICES OF AGRICULTURAL OUTPUT (a) Average 1961-1965= 100
1 2 3 4 5 6 7 8 9
10 11 12 13 14 15 16 17 18 19 20 21 22
Country
Germany France Italy Netherlands Belgium Luxembourg United Kingdom Ireland Denmark
Greece Turkey Norway Sweden Switzerland Austria Portugal Finland Spain USSR USA Canada Japan
World (b)
1966
104 102 110 100 94
100 108 104 101
115 113 98 94
100 102 95
101 108 121 103 122 107
109
1967
113 114 115 112 109 118 110 115 102
118 114 100 105 114 109 107 104 108 120 109 105 118
113
1968
117 118 113 116 111 106 108 115 106
114 120 111 108 111 112 106 105 118 127 111 115 123
116
1969
114 112 118 116 113 107 109 117 99
121 119 104 94
113 115 105 111 119 124 110 115 121
117
1970
116 116 120 128 117 104 116 115 94
135 126 103 104 107 110 109 111 123 135 109 106 119
120
1971
121 121 119 137 126 105 120 127 98
138 134 106 106 114 112 102 119 127 136 118 122 113
125
1972
115 121 113 132 120 103 121 120 96
142 139 108 108 111 109 101 118 130 132 118 113 119
124
1973
119 128 122 138 121 110 124 120 99
146 129 110 101 122 115 107 109 139 152 120 116 120
130
lal FAO Index. lb) Excl. People's Republic of China.
44
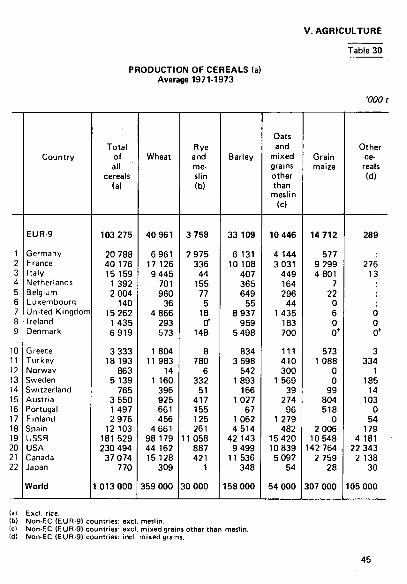
V. AGRICULTURE
PRODUCTION OF CEREALS (a) Average 1971-1973
Table 30
•mot
1 2 3 4 5 6 7 8 9
10 11 12 13 14 15 16 17 18 19 20 21 22
Country
EUR-9
Germany France Italy Netherlands Belgium Luxembourg United Kingdom Ireland Denmark
Greece Turkey Norway Sweden Switzerland Austria Portugal Finland Spain USSR USA Canada Japan
World
Total of all
cereals (a)
103 275
20 788 40 176 15 159
1 392 2 004
140 15 262
1 435 6 919
3 333 18 193
863 5 139
765 3 550 1 497 2 976
12 103 181 529 230 494
37 074 770
1 013 000
Wheat
40 961
6 961 17 126 9 445
701 960
36 4 866
293 573
1 804 11 983
14 1 160
396 925 661 456
4 661 98 179 44 162 15 128
309
359 000
Rye and mesiin (b)
3 758
2 975 336
44 155
77 5
18 0*
148
8 780
6 332
51 417 155 125 261
11 058 887 421
1
30 000
Barley
33 109
6 131 10 108
407 365 649
55 8 937
959 5 498
834 3 598
542 1 893
166 1 027
67 1 062 4 514
42 143 9 499
11 536 348
158 000
Oats and
mixed grains other than
mesiin (cl
10 446
4 144 3 031
449 164 296
44 1 435
183 700
111 410 300
1 569 39
274 96
1 279 482
15 420 10 839
5 092 54
54 000
Grain maize
14 712
577 9 299 4 801
7 22
0 6 0 0*
573 1 088
0 0
99 804 518
0 2 006
10 548 142 764
2 759 28
307 000
Other cereals (d)
289
276 13
0 0 0*
3 334
1 185
14 103
0 54
179 4 181
22 343 2 138
30
105 000
(a) Excl. rice. (b) Non-EC (EUR-9) countries: excl. mesiin. (c) Non-EC (EUR-9) countries: excl. mixed grains other than mesiin. (d) Non-EC (EUR-9) countries: incl. mixed grains.
45
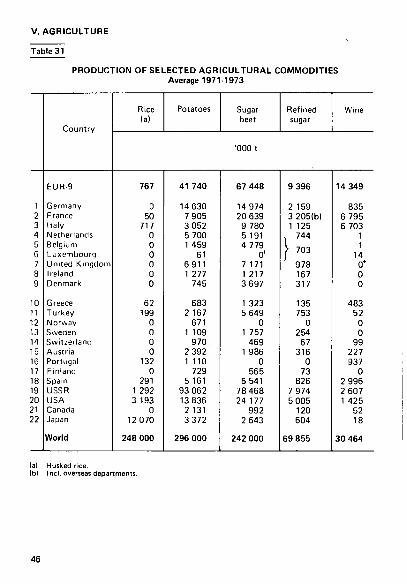
V. AGRICULTURE
Table 31
PRODUCTION OF SELECTED AGRICULTURAL COMMODITIES Average 1971-1973
1 2 3 4 5 6 7 8 9
10 11 12 13 14 15 16 17 18 19 20 21 22
Country
EUR-9
Germany France Italy Netherlands Belgium Luxembourg United Kingdom Ireland Denmark
Greece Turkey Norway Sweden Switzerland Austria Portugal Finland Spain USSR USA Canada Japan
World
Rice (a)
Potatoes Sugar beet
Refined sugar
Wine
'000 t
767
0 50
717 0 0 0 0 0 0
62 199
0 0 0 0
132 0
291 1 292 3 193
0 12 070
248 000
41 740
14 630 7 905 3 052 5 700 1 459
61 6 9 1 1 1 277
745
683 2 167
671 1 109
970 2 392 1 110
729 5 161
93 062 13 836
2 131 3 372
296 000
67 448
14 974 20 639
9 780 5 191 4 779
0* 7 171 1 217 3 697
1 323 5 649
0 1 757
469 1 986
0 565
5 541 78 468 24 177
992 2 643
242 000
9 396
2 159 3 205(b) 1 125
. 744
\ 703
978 167 317
135 753
0 254
67 316
0 73
826 7 974 5 005
120 604
69 855
14 349
835 6 795 6 703
1 1
14 0* 0 0
483 52
0 0
99 227 937
0 2 996 2 607 1 425
52 18
30 464
(a) Husked rice. (b) Incl, overseas departments.
46

V. AGRICULTURE
LIVESTOCK
1974(a)
Table 32
'000
1
2
3
4
5
6
7
8
9
10
11
12
13
14
15
16 17
18
19 20
21
T.'
Country
EUR-9
Germany
France
Italy
Netherlands
Belgium
Luxembourg
United Kingdom
Ireland
Denmark
Greece
Turkey
Norway
Sweden
Switzerland
Austria
Portugal
Finland
Spain
USSR
USA
Canada
Japan
World
Date
of
census
XII -1974
XII - 1974
XII - 1974
XII -1974
XII - 1974
XII -1974
XII - 1974
XII - 1974
XII -1974
: -1974
- 1974
- 1974
- 1974
- 1974
-1974
-1974
-1974
-1974
- 1974
• 1974 - 1974
■ 1974
: - 1 9 7 4
Cattle
Total
79 336
14 420
24 300
8 243
4 7 1 4
2 889
214
14914
6 497
3 145
1 058
13 431
955
1 898
1 973
2 624
1 150
1 905
4413
106 699
127 670
13318
3 750
1 309 178
of which
dairy
cows
25 223
5 389
7 751
2 927
2215
997
73
3 387
1 344
1 130
483
4 297
406
751
900
1 068
202
819
1 690
42 300
11 221
2 080
1 187
200 062
Pigs
69 772
20 213
12 092 8 814
7 153
4 666
95
7 885
796
8 058
700
13
747
2 355
2 065
3 290
2 100
1 049
8 308
70 032
61 100
7 007
7 800
670 659
Sheep
and
goats
44 938
1 078
11 372
8 953
490
85 5
20 187
2 7 1 1
57(b)
12 550
54 615
1 702
377
429 185
4 635
148
18513
148 534
17 744
605
140
1 430 584
(a) Lines 10-22: Source FAO. (bl V I - 1974.
47
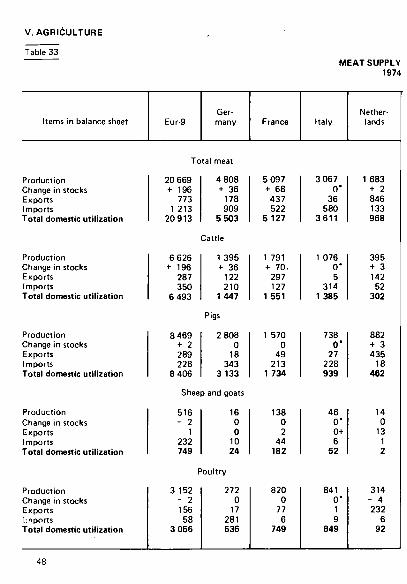
V. AGRICULTURE
Table 33 MEAT SUPPLY
1974
Items in balance sheet
Production Change in stocks Exports Imports Total domestic utilization
Production Change in stocks Exports Imports Total domestic utilization
Production Change in stocks Ex ports Im ports Total domestic utilization
Production Change in stocks Exports Im ports Total domestic utilization
Production Change in stocks Exports Imports Total domestic utilization
Eur-9 Germany
Total meat
20 669 + 196
773 1 213
20 913
4 808 + 36
178 909
5 503
Cattle
6 626 + 196
287 350
6 493
1 395 + 36
122 210
1447
Pigs
8 469 + 2 289 228
8 406
2 808 0
18 343
3 133
Sheep and goats
516 - 2
1 232 749
16 0 0
10 24
Poultry
3 152 - 2 156
58 3 056
272 0
17 281 536
France
5 097 + 68
437 522
5 127
1 791 + 70.
297 127
1 551
1 570 0
49 213
1 734
138 0 2
44 182
820 0
77 6
749
Italy
3 067 0"
36 580
3 6 1 1
1 076 0" 5
314 1 385
738 0 '
27 228 939
46 0 ' 0+ 6
52
841 οι 9
849
Netherlands
1 683 + 2 846 133 968
395 + 3 142
52 302
882 + 3 435
18 462
14 0
13 1 2
314 - 4 232
6 92
48

V. AGRICULTURE
Table 33 ÌALANCESHEET
Slaughtering weight incl. slaughtering fats ('000 t)
Belgium/ Luxembourg
United Kingdom
Ireland Denmark Items in balance sheet
141 0 '
364 158 935
3 129 + 23
136 1 204 4 173
Total meat
622 + 28
315 6
284
1 121 + 37
764 3
323
Production Change in stocks Exports Imports Total domestic utilization
Cattle
315 0 '
33 30
312
1 079 + 21
66 362
1 354
337 + 28
242 1
67
623 0"
243 16
396
4 0" 0+ 8
12
977 + 0 '
26 517
1468
252 2
27 214 441
Pigs
133 0
38 3
98
237 + 37
127 1
74
738 - 1 564
1 176
Sheep and goats
45 0
11 0 i
34
Production Change in stocks Exports Imports Total domestic utilization
Production Change in stocks Exports Imports Total domestic utilization
Production Change in stocks Exports Imports Total domestic utilization
Poultry
116 0"
34 12 94
656 + 2
3 14
665
38 0 3 0
35
95 0
59 0
36
Production Change in stocks Exports Imports Total domestic utilization
49

V. AGRICULTURE
Table 34
MEAT PRODUCTION (a) 1974
'000 t (carcass weight, excl. offal fat)
1 2 3 4 5 6 7 8 9
10 11 12 13 14 15 16 17 18 19 20 21 22
Country
EUR-9
Germany France Italy Netherlands Belgium Luxembourg United Kingdom Ireland Denmark
Greece Turkey Norway Sweden Switzerland Austria (e) Portugal Finland Spain USSR USA Canada Japan (g)
World
Total meat and
offal (b)
20 361
4 694 5 107 2 671 1 787 1 167
21 3 047
724 1 143
433 507 182 478 449 586 346 276
1 906 14 700(c) 24 767
2 241 2 227
123 354
Beef and veal (cl
6 479
1 381 1 886
847 392 292
10 998(d) 429 244
94 202
64 145 148 212(f)
81 114 411
6 391 10 601
920 290
43 360
Pigmeat (c)
8 431
2 718 1 510
676 969 682
11 982 131" 752
99 1
77 278 239 280(f) 115 126 710
5 500 6 203
645 1 100
42 438
Mutton lamb and
goats (c)
499
16 133
32 16 3 0
254 44
1
96 211
19 4 3 2
24 1
155 1 030
217 7 1
6 971
(a) Gross home product ion: incl. meat equivalent of animals exponed alive but not incl. meal equivalent of animals imported alive.
(b) For FAO figures (line 10 - 20), product ion refers to animals slaughtered wi th in the boundaries <c) Excl. of fal . (d) Excl. meat equivalent of animals imported for fattening. (e) Incl. slaughter fats. (f) Incl. of fal . (g) Commercial product ion.
50

V. AGRICULTURE
MILK PRODUCTION, MILK PRODUCTS AND EGGS 1974 (a)
Table 35
V00 t
1 2 3 4 5 6 7 8 9
10 11 12 13 14 15 16 17 18 19 20 21 22
Country
EUR-9
Germany France Italy Netherlands Belqium Luxemuuu'Q United Kingdom Ireland Denmark
Greece Turkey Norway Sweden Switzerland Austria Portugal Finland Spain USSR USA Canada Japan
World
Milk
101 896
21 823 30 607
9 966 9 9 1 5 3 834
262 16 287 4 291 4 9 1 1
1 566 4 437 1 825 3 083 3 340 3 250
603 3 133 5 599
92 265 52 352
7 570 4 810
424 205
Butter
1661
511 543
71 172 91
8 54 74
137
6 114
20 45 33 39
2 78 14
1 360 431 110 36
6 266
Cheese (b)
2 878
596 916 518 379
42 1
217 59
150
140 106
58 75 99 74
8 49 50
1 331 1 687
147 43
10 718
Eggs
3 726
890 734 631 283 223
3 849
40 73
98 135 41
106 40 85 40 76
453 3 024 3 897
314 1 655
22 789
lal Lines 10 to 23: FAO. (b) Incl. fresh cheese.
51

V. AGRICULTURE
Table 36
YIELDS OF SOME
Product EUR-9 Germany
France Italy
1950
Wheat Barley Maize Total cereals
Rice (a)
Peas Potatoes Sugar beet Fodder beet Lucerne Permanent meadows
19.2 22.5
19.4
38.8
182 339
15.5 244 362 465
71.6 45.4
25.8 24.0 25.5 23.1
17.8 16.3 12.4 15.9
29.5
16.0 131 (c) 344 458
47.0 33.4
16.5 11.7 15.5 15.7
39.5
5.2(b) 63
257
45.4 36.6
32.3 33.6 33.9 27.9
0
29.6 240 435 615
1974 ρ
Wheat Barley Maize Total cereals
Rice (a)
Peas Potatoes Sugar beet Fodder beet Lucerne Permanent meadows
40.4 39.8 49.5 40.4
41.8
286 399 660
55.0
47.6 42.3 48.4 42.8
0
27.0 311 447 944 (e)
80.8 70.1
46.1 36.8 46.2 42.0
32.7
26.1 25.0 56.7 31.1
42.5
36.0(b)' 10.7(b) 237 408 487
72.6 46.0
160 394 499
62.5 50.2
57.3 43.0 50.3 50.4
0
36.4 392 452 754
(a) Husked. (b) Incl. chick-peas. (c) Excl. potatoes grown in market gardens. (d) For Belgium first mowing only. (e) Non-comparable wi th 1950 because of changes in methodology.
52

'RINCIPAL CROPS FROM ARABLE LAND
V. AGRICULTURE
Table 36
100 kg/ha
Luxembourg
United Kingdom
Ireland Denmark Product
1950
31.1 31.2 35.4 29.5
0
31.2 235 427 815
63.4(d)
18.2 18.6 0
17.0
0
8.9 185
589 46.3 33.0
26.4 24.2
0 23.6
0
193 308
31.7
22.5 24.2
0 22.2
0
214 246
35.0 32.7
0 29.4
0
176 377 528
83.8
Wheat Barley Maize Total cereals
Rice (a)
Peas Potatoes Sugar beet Fodder beet Lucerne Permanent meadows
1974 ρ
52.1 46.8 50.1 47.4
0
35.7 363 425 874
95.8 80.5
32.0 31.2
0 31.0
0
325
600 50.0 63.7
49.7 41.2 32.4 43.7
0
35.6 316 236 611
40.0
44.5 42.4
0 41.8
0
278 360 418
53.5 41.5
41.9
0
40.2 271 428 515
Wheat Barley Maize Total cereals
Rice (a)
Peas Potatoes Sugar beet Fodder beet Lucerne Permanent meadows
53
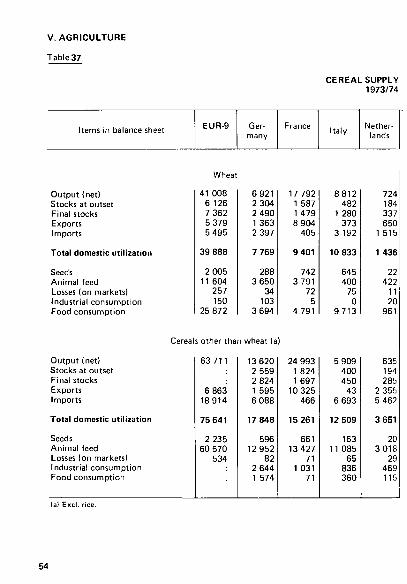
V. AGRICULTURE
Table 37
CEREAL SUPPLY 1973/74
Items in balance sheet EUR-9 Germany Italy
Output (net) Stocks at outset Final stocks Exports Imports
Total domestic utilization
Seeds Animal feed Losses (on markets) Industrial consumption Food consumption
Cereal
Output (net) Stocks at outset Final stocks Exports Imports
Total domestic utilization
Seeds Animal feed Losses (on markets) Industrial consumption Food consumption
Wheat
41 008 6 126 7 362 5 379 5 495
39 888
2 005 11 604
257 150
25 872
s other tha
63 711
6 863 18914
75 641
2 235 60 570
534
6 921 2 304 2 490 1 363 2 397
7 769
288 3 650
34 103
3 694
n wheat (a
13 620 2 559 2 824 1 595 6 088
17 848
596 12 952
82 2 644 1 574
17 792 1 587 1 479 8 904
405
9 401
742 3 791
72 5
4 791
24 993 1 824 1 697
10 325 466
15 261
661 13 427
71 1 031
71
8812 482
1 280 373
3 192
10 833
645 400
75 0
9713
5 909 400 450
43 6 693
12 509
163 11 085
65 836 360
724 184 337 650
1 515
1436
22 422
11 20
961
635 194 285
2 355 5 462
3 651
20 3 018
29 469 115
54

BALANCE SHEET
V. AGRICULTURE
Table 37
VOO t
Belgium Luxembourg
United Kingdom
Items in balance sheet
1 049 192 428 473
1 253
1 593
37 495
6 7
1 048
4 939 1 159 1 136
162 3 142
7 942
240 2 601
24 15
5 062^
229 140 140
8 219
440
11 72 19
0 338
542 78 72
158 84
474
20 173
16 0
265
Output (net) Stocks at outset Final stocks Exports Imports
Total domestic utilization
Seeds Animal feed Losses (on markets) Industrial consumption Food consumption
Cereals other than wheat (a)
1 205
996 3 503
3 712
31 2 804
7 842
28
10 190 1 063"
880" 429
4 716
14 658
426 10 350
31
1 068 106 132 88
528
1 481
46 1 162
66 181
26
6 091 419 415 230 656
6 521
292 5 772
183 127 147
Output (net) Stocks at outset Final stocks Exports Imports
Total domestic utilization
Seeds Animal feed Losses (on markets) Industrial consumption Food consumption
55

V. AGRICULTURE
Table 38
SUGAR AND WINE 1973/74
Items in balance sheet EUR-9 (al
Ger many
France (a) Italy Nether
lands
Sugar (in '000 t of white sugar equivalent)
Output Stocks at outset Final stocks Exports Imports
Total domestic utilization
Animal feed Losses ¡on markets) Food consumption
Output Stocks at outset Final stocks Exports (c) Imports (c)
Total domestic utilization
Losses (total) (e) Industrial use Wine
9 521 3 297* 2 557* 1 926(b) 2 081(b)
10 416
40 5'
10371
Wine (in '000 hi)
2 266 698 587 341 282
2 318
11 0
2 307
170 646 61 286 86 986 3 221(b) 7 226(b)
148 951
1 142 23 180 124 629
10 751 11 244 13 728
665 5 846
13 448
0 1 085
12 363
3 258 999 806
1 562 230
2119
5 0
2 114
82 987 33 038 42 691 5 940(d) 6 403(d)
73 797
680 18 642 54 475
1 037 318 201 52 720
1 822
9 0
1 813
76 716 15 047 27 565 8 640 606
56 164
435 3 450
52 279
765 233 186 324 136
624
1 0
623
0 308 329 22
1 256
1 213
13 0
1 200
(a) Sugar: incl. overseas departments. (b) Excl. ¡ntra-EUR-9 trade in sugar. (c) Foreign trade figures al low for a reduction to 75 % of the real volume for vermouths and
aromatic wines. (d) Excl. vermouths and aromatic wines. (e) Losses on the market and losses of product ion accurred after the crop declaration.
56
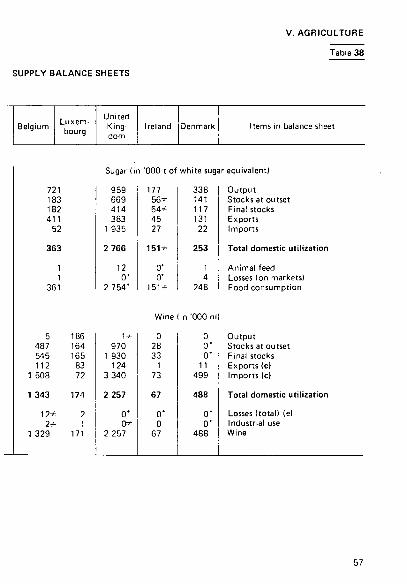
V. AGRICULTURE
Table 38
SUPPLY BALANCE SHEETS
Belgium Luxembourg
United Kingdom
Ireland Denmark Items in balance sheet
Sugar (in '000 t of white sugar equivalent)
5 487 545 112
1 508
1 343
1 2 * 2 *
1 329
186 164 165 83 72
174
2 1
171
721 183 182 411
52
363
1 1
361
959 669 414 383
1 935
2 7 6 6
12 0 '
2 7 5 4 '
177 5 6 * 6 4 * 45 27
1 5 1 *
0* 0'
151=?=
338 141 117 131 22
253
1 4
248
Output Stocks at outset Final stocks Exports Imports
Total domestic utili
Animal feed Losses (on markets) Food consumption
1 = 970
1 930 124
3 340
2 257
0" 0 *
2 257
Wine (in '000 hi)
0 2S 33
73
0 ' 0
67
0 0 ' 0 '
11 499
488
0 ' 0 '
488
Output Stocks at outset Final stocks Exports (c) Imports (c)
Total domestic u
Losses (total) (el Industrial use Wine
57

V. AGRICULTURE
Table 39 DEGREE OF 1973/74
Products EUR-9 Germany
France Italy
Wheat Rye Barley Oats Maize Total grain Rice
Potatoes Sugar Vegetables Fresh frui t Citrus fruit Wine
Milk, raw Cheese Butter
Beef Veal Pork Poultry Total meat Fish (c)
Vegetable oils and fats Offal fat Marine oils and fats Total oils and fats
Crop products
103 94
103 95 59 91 90
100 911a) 93 80 42
115
89 93 86 91 18 80
0
91 98 39 52
0 80
Livestock products
107 93
99 104 100 103 98 57
101 90
116
97 72 87 50 85 20
Oils and fats
22 80 22 40
9 109
8 39
189 124 180 107 173 173
24
104 1541a)
96 102
1 112
lb)
100 117 111
126 107 87
110 100 62
28 95 0*
48
81 77 24 68 50 63
228
96 57
110 122 115 137
96 88 61
61 61 72 98 74 36
46 71
0 50
50 84 70
142 0*
27 0
127 123 196 61
0 0
101 239 340
97 869 210 357 185 65
8 69 0*
36
(a) Incl. French overseas departments, (bl 1974. I d 1972/73.
58

SELF-SUFFICIENCY
V. AGRICULTURE
Table 39
Belgium Luxembourg
United Kingdom
Ireland Products
Crop products
66 92 61 87
2 42
0
108 199 123 57
0
62 38 93 99
0' 67
0
98 35 76 36
0 0
50
98 88 0 67 0
104 117 104 27 0 0
114 97 99 93 0 95 0
102 134 76 60 0 0
Wheat Rye Barley Oats Maize Total grain Rice
Potatoes Sugar Vegetables Fresh frui t Citrus fruit Wine
Livestock products (b)
100 48 99
95 121 176 112 127 15
100 66 11 74 93 67 99 73 50
100 555 188
639 0
134 109 255 104
101 290 297 329 400 427 264 354 271
Milk, raw Cheese Butter
Beef Veal Pork Poultry Total meat Fish (c)
1 73
0 34
5 39
18
Oils and fats
0 750
20 80
0 143 262 111
Vegetable oils and fats Offal fat Marine oils and fats Total oils and fats
59

V. AGRICULTURE
Table 40
MANPOWER,
Characteristics EUR-9 EUR-6 Germany France Italy
Farm occupiers Family members Non-family workers
Total including: Men Persons aged 65 and over
Tractors number (χ '000) number per 100 ha AA
Combine harvesters number (χ '000) number per 100 ha under cereals
Milking machinery inst. number (χ '000) number per 100 dairy cows
4 554 4.9
478
2 147 1 516 1 147
4810
3 507 273
3 794 5.7
366
I.I
040 5 3
480" 580 ' 100'
750' 75 '
1 425
10 7
171 *
3.2
480 *
Agricultural 1974
799 428 194
1 421
1 153 78
622b) 399b) 809b)
1 830b)
1 290b) 94b)
Important 1974
337 4.1
151
1.5
347 4.5
781 4.5
26 bl
0.5
70 cl 1.9
Nitrogenous fertilizers
(a) EUR-6: Persons principally occupied (harmonized figures) IRL : Only men principally occupied. UK, DK: Persons regularly occupied
(b) 1973. <c) 1970.
Consumption of in pure
1973/74 '000 t kg per ha AA
Phosphatic fertilizers '000 t kg per ha AA
Potassic fertilizers '000 t kg per ha AA
5 564 60
4 707 50
4 467 48
4 195 63
3 860 58
3 574 53
1 101 83
917 69
1 163 87
1 833 57
2 184 67
1 819 56
672 39
476 27
268 15
60

AGRICULTURE
Table 40
MACHINERY, FERTILIZERS
Netherlands
Belgium
Luxem-) bourg ! King- Ireland Den
mark Characteristics
manpower (χ '000) (ai
154 70 36
260
210 15
88 35
7
130
97 10 '
4,6 4.1 0.5 ;
9 2
6.7 ! 0.8 :
280' 87
23 7
604
522
} 211 34
245
133 7
21
161
150'
agricultural machinery
148 = 7.0
92 = 4.2
95 6.2
8
19
48 4.7
9 6.4
2
4.4
4 5.6
474 2.5
61
1.6
146 4.1
103 ' 2.1
7
2.0
35 c) 2.2
183 6.4
44
2.5
Farm occupiers Family members Non-family workers
Total including: Men Persons aged 65 and over
Tractors number Ι χ Ό00) number per 100 ha AA
Combine harvesters number (x '000) number per 100 ha under cereals
Milking machinery inst. number (χ Ό00) number per 100 dairy cows
chemical fertilizers nutrient content
Nitrogenous fertilizers 412 196
no 52
123 59
165 106
156 107
193 124
12 93
7 51
8 58
874 47
499 28
496 27
130 27
193 40
181 37
365 124
155 53
216 74
'000 t kg per ha AA
Phosphatic fertilizers '000 t kg per ha AA
Potassic fertilizers '000 t kg per ha AA
61

V. AGRICULTURE
AGRICULTURAL
Heading
Final crop production (b)
Final livestock production (b)
Final agricultural production (c)(d)
Intermediate consumption (d)
Gross value added at market pr ices (d)
- Taxes linked to production
Gross value added at factor cost
- Depreciation
Net value added at factor cost
1963 1973 p 1974p
1963 1973p 1974p
1963 1973p 1974 p
1963 1973 p 1974 p
1963 1973p 1974p
1963 1973p 1974p
1963 1973p 1974 p
1963 1973 p 1974 p
1963 1973 p 1974p
1963 1973p 1974p
11 558 22 088 22 604
15 449 29 273 28 792
26 856 52 369 52 496
7 859 19 800 22 641
18 996 32 570 29 855
651 1 458 1 707
496 878 560
19 152 33 150 31 002
1 850 4 304 4 943
17 301 28 845 26 060
Ger-many
2 357 4 132 4 332
5 077 9 490 9 674
7 233 13 623 14 044
2 884 6 767 7 191
4 349 6 856 6 854
433 690 620
220 317 307
4 562 7 230 7 167
605 1 571 1 786
3 957 5 658 5 381
3 501 8 051 7 455
5 843 9 988 9 128
9 344 18 852 17 365
2 404 6 260 7 687
6 940 12 593 9 678
76 260 693
193 423
87
6 823 12 430 10 284
590 1 403 1 587
6 233 11 027 8 698
Italy
4 565 7 585 8 326
2 497 4 663 4 966
7 112 12314 13 357
1 259 2 993 3 636
5 853 9 321 9 720
26 494 351
51 66 65
5 829 9 749
10C07
498 1 045 1 219
5 331 8 704 8 788
(a) Crop veers, e.g. 1974: 1. 6. 1974 - 31. 5. 1975. lb) Before deduction of subsidies not allocated to products (Germany); excluding taxes linked to production
(Italy! and VAT (1973 and 1974; France. Netherlands and Belgium), (cl After deduction of subsidies not allocated to products (Germany); Including agricultural services (Germany).
taxes linked to production (Italy) and VAT (1973 and 1974: France and Belgium). Id) Netherlands:'1973 and 1974 excl. VAT.
6 2

V. AGRICULTURE
Netherlands
692 1 515 1 618
1 204 3 248 3 3 1 2
1 896 4 761 4 930
868 2 323 2 502
1 038 2 438 2 428
107 0
30 69 92
1 115 2 369 2 336
87 190 244
1 028 2 179 2 091
Belgium
428 777 854
790 1 819 1 643
1 218 2 733 2 7 1 1
438 1 425 1 588
780 1 308 1 123
10 14 43
1 2 8
789 1 319 1 157
64 86 97
725 1 233 1 061
Luxem bourg
15 22 19
38 65 69
53 86 89
17 32 37
36 54 52
0* 0 0
1 1 1
35 53 51
6 9
10
29 44 41
United King
dom (a
2 537 2 904
5 053 5 142
7 589 8 046
4 382 4 983
3 208 3 063
289 444
- 123 - 140
3 620 3 647
625 770
2 995 2 877
Ireland Denmark
613 860
2 228 2 249
2 841 3 109
1 365 1 453
1 475 1 655
20 17
192 216
1 303 1 457
Year
1963 1973 p 1974 p
1963 1973 p 1974 p
1963 1973p 1974 p
1983 1973p 1974p
1963 1973 p 1974p
1963 1973 p 1974 p
1963 1973 p 1974p
1963 1973p 1974 p
1963 1973p 1974 p
1963 1973 p 1974 p
Heading
Final crop production (b)
Final livestock production (b)
Final agricultural production (c)(d)
Intermediate consumption (d)
Gross value added at market prices (d)
+ Subsidies
— Taxes linked to production
Gross value added at factor cost
- Depreciation
Net value added at factor cost
63

V. AGRICULTURE
AGRICULTURAL ACCOUNTS Volume index-numbers .
1970 = 100
Heading
Final crop production (b)
Final livestock production (b)
Final agricultural production (c) (d)
Intermediate consumption (d)
Gross value added at market prices (d)
Year
1963 1973p 1974p
1963 1973p 1974p
1963 1973p 1974p
1963 1973p 1974p
1963 1973p 1974p
EUR-9 EUR-6
111.7 111.1
105.9 110.6
108.5 111.1
112.7 112.7
106.2 110.1
Germany
93.8 116.7 117.6
82.5 100.5 104.2
84.0 105.9 109.0
73.3 102.5 97.4
94.1 109.0 119.9
France
76.6 118.9 113.1
88.8 106.6 113.4
83.4 112.1 113.3
66.5 125.0 128.8
90.9 106.3 106.3
Italy
85.7p 102.1 102.9
73.4p 108.3 111.3
81.0p 104.4 106.1
64.3p 111.4 113.2
86.2p 102.3 103.9
Netherlands
70.4 116.9 126.2
70.8 114.3 121.8
70.7 115.2 123.3
70.3 118.4 118.4
71.0 112.4 127.4
Belgium
115.2 119.9
111.0 110.0
109.0 112.3
108.5 112.9
109.7 111.6
Luxembourg
97.8 101.7 89.7
94.5 103.5 111.2
95.4 103.0 105.4
75.7 106.4 108.8
107.8 100.9 103.3
United King
dom la)
106.9 105.8
105.7 105.0
106.0 105.3
99.1 99.6
115.1 112.7
Ireland Den-
mark
118.5 154.0
103.9 105.6
106.9 115.6
103.6 103.3
110.0 127.1
lal Crop ye»*, B. g. 1974: 1.6. 1974 -31 . 5. 1975. (b) Before deduction of subsidies not allocated to products (Germany); excluding taxes linked to production (Italy) and VAT ΙΓ ronco ond Ν et herland t). (c) After deduction of subsidies not allocated to products (Germany); including agricultural services (Germany), taxes linked to production (Italy) and
VAT (France). (d) Netherlands: excl. VAT.

FORESTRY ACCOUNTS
V. AGRICULTURE
Table 43
Heading
Gross timber output, total (a)
Final forestry production (b)
Intermediate consumption
Gross value added at market prices
+ Subsidies
- Taxes linked to production
Gross value added at factor cost
- Depreciation
Net value added at factor cost
Year
1963 1972 1973
1963 1972 1973
1963 1972 1973
1963 1972 1973
1963 1972 1973
1963 1972 1973
1963 1972 1973
1963 1972 1973
1963 1972 1973
Germany
379 504 655
386 522 676
52 146 177
335 376 499
0 0
18
38 22 23
297 354 494
23 37 38
274 317 456
France
430 747 986
430 747 986
95 73 86
335 674 900
0 0
62 104 139
273 570 761
22 48 54
251 522 707
Italy
171 143 118
175 147 121
14 17 15
161 129 107
1 1 1
160 128 106
3 6 7
157 121 99
Belgium
40 48 64
40 49 65
3 5 7
37 44 58
0 0 0
5 1 1
31 43 57
3 3 4
29 40 53
Luxembourg
2.1 2.5
2.1 2.5
0.1 0.2
2.0 2.3
0 0
0.2 0.1
1.8 2.1
0.1 0.1
1.7 2.0
Denmark
20 22
20 22
3 3
18 19
0 0
2 3
15 17
(a) Including other products (France!; excluding taxes linked to production ( I taly). (b) Including forestry services (Belgium and Luxembourg), other products (Germany, Italy and Luxembourg)
and taxes l inked to product ion ( I taly).
65

V. AGRICULTURE
Table 44
FORESTRY ACCOUNTS Volume index-numbers
1970= 100
Heading
Gross timber output, total (a)
Final forestry production (b)
Intermediate consumption
Gross value added at market prices
Year
1963 1972 1973
1963 1972 1973
1963 1972 1973
1963 1972 1973
Germany
83.7 84.3
108.8
83.1 84.9
108.9
52.1 94.8
102.0
91.9 82.1
110.9
France
89.8 101.3 104.7
89.8 101.3 104.7
201.8 107.9 116.5
79.1 100.7 103.6
Italy
100.7p 84.3 69.6
100.6p 84.2 70.2
89.6p 115.6 93.8
101.5p 81.1 67.9
Belgium
99.8 104.7 109.1
98.1 103.6 107.5
84.1 108.0 113.5
99.9 103.1 106.7
Luxembourg
77.2 70.8
77.7 71.2
76.6 88.3
77.8 70.0
Denmark
93.6 83.3
93.6 83.3
94.7 84.2
93.4 83.2
{a) Including other products (France); excluding taxes linked to production (Italy), (b) Including forestry contract works (Belgium and Luxembourg), other products (Germany, Italy and
Luxembourg) taxes linked to production (Italy).
66

I. AGRICULTURE
WOODED AREA AND TIMBER PRODUCTION 1972
Table 45
1 2 3 4 5 6 7 8 9
10 11 12 13 14 15 1G 1 7 18 19 20 21 27
Country
EUR-9
Germany France Italy Netherlands Belgium Luxembourg United Kingdom Ireland Denmark
Greece Turkey Norway Sweden Switzerland
Portugal F inland Spain USSR USA Canada Japan
World
Wooded area (a)
('000 ha)
31999
7 207 14 765 6 292
303 617
83 1 983
277 472
2 512(b) 10 584(b)
8 990(b) 23 441(b)
1 008(b) 3 352(b) 3 108(b)
21 741(b) 26 706(b)
910 009(b) 307 101(b) 443 108(b)
25 053(b)
4 126 000(b)
Total production
of roundwood ('000 cu.m)
80 309
23 762 33 392 13 120
1 500 2671
160 3 365
422 1917
2 794(b) 18 304(b)
8 333(b) 55 503(b)
4 000(b) 12 515(b) 7 000(b)
42 240(b) 14 491(b)
333 000(b) 329 078(b) 124 169(b) 44 596(b)
2 436 165(b)
Production of sawn
softwood (b)
('000 cu.m)
15 302
7 535 5 896
712 86
380 22
277 34
360
172 1 816 1 971
12 625 1 475 5 199 1 750 7 356 1 770
103 850 74 201 31 766 32 344
333 066
Production of sawn
hardwood (b)
('000 cu.m)
8 725
2 057 3 880 1 449
179 320
9 365
16 450
147 526
46 220 175 264 160 119 712
14 850 16 079
1 369 10 839
95 566
(a) Figures refer mostly to previous years. (b) Source: FAO.
67

VI. ENERGY
Table 46
PRODUCTION OF PRIMARY ENERGY PRODUCTS
Mio tee
Year
1960 1961 1962 1963 1964
1965 1966 1967 1968 1969
1970 1971 1972 1973 1974
EUR-9
516.1
482.8
490.3 508.9 503.8 522.0 526.6
Germany
183.8 185.6 186.2 189.7 191.9
184.9 175.8 162.6 166.6 170.6
175.7 175.2 171.5 172.4 172.7
France
75.0 72.6 72.4 70.6 72.6
75.2 76.0 71.9 68.5 70.2
68.8 63.0 61.1 56.7 56.7
Italy
28.2 27.4 26.7 29.2 28.6
29.6 30.7 30.8 31.5 32.6
33.8 33.2 34.5 34.3 34.5
Netherlands
15.4 15.9 15.0 15.1 15.5
16.6 17.0 19.0 25.2 32.7
42.0 54.0 69.6 82.5 96.9
Belgium
20.8 19.5 19.9 19.6 19.4
18.0 15.8 15.1 13.6 12.2
10.5 10.1
9.6 8.2 7.6
Luxembourg
0.01 0.03 0.02 0.02 0.02
0.04 0.04 0.05 0,05 0.04
0.05 0.03 0.03 0.03 0.04
United Kingdom
189.6
161.9
157.0 160.8 155.0 166.1 156.1
Ireland
1.7
2.5
2.4 2.3 2.2 1.7 1.8
Denmark
0.55
0.12
0.04 0.01 0.12 0.11 0,13
World
4 486 4 470 4 722 5015 5 330
5 592 5911 6 055 6 450 6 860
7 263 7 437 8 098 8 550 8 326

VI. ENERGY
PRODUCTION OF PRIMARY ENERGY 1974
Table 47
'000 tee
l 2 3 4 5 6 7 8 9
10 11 1? 13 14 15 16 17 18 19 20 .'1 22
Country
EUR-9
Germany France Italy Netherlands Belgium Luxembourg United Kingdorr Ireland Denmark
Greece Turkey Norway Sweden Switzerland Austria Portugal Finland Spain USSR USA Canada Japan
World
Coal (a) -
223 849
96 011 20 820
2 742
7 387 0
98 819 68
0
0 5 120
430 0 0 0
230 0
10 240 524 000 536 920
17 370 20 330
1824 370 (e)
Lignite
37 803
34 649 1 277
405 0 0 0 0
(d)1 472 0
4 650 1 870
0 0 0
1 820 0 0
1 450 56 000
4 640 1 150
0
270 000 (e)
Crude petroleum
15 058
8 853 1 680 1 563 2 251
0 0
588 0
123
0 5 000 2 390
0 0
3 290 0 0
2 700 653 000 707 600 138 700
1 000
4 100 000
Natural gas
185 899
22 631 9 124
18 333 92 816
67 0
42 928 0 0
0 0
18 0 0
2 790 0 0 0
289 500 713 000
99 700 3 500
1 556 000 (e)
Pri-mary elec
tricity (b)
60 994
9 375 22 627 13 764
1 057 128 39
13 698 297
7
821 1 026
26 790 20 760 12 180
7 760 2 740 4 350
13 270 51 670
149 280 79 960 36 630
576 000
Total primary energy
(c)
526 604
172 749 56 671 34 533 96 866
7 630 44
156 140 1 837
134
5 471 13016 29 628 20 760 12 180 15 660
2 970 4 350
25 230 1 574 170 2 111 440
336 880 61 460
8 326 370
(a) Except for the Communi ty countries (EUR-9), product ion figures for hard coal are given ton for ton.
(b) Primary electric energy has been converted into hard-coal equivalent on the basis of a calor i f ic^ equivalent necessary for the product ion of 1 kWh in steam generating stations. Except for ihe Communi ty countries (EUR-9), a conversion factor of 350 gm hard-coal equivalent per kWh has been adopted.
(c) Including wood , garbage etc. for the Communi ty countries (EUR-6). (d) Peat. (e) Excl. People's Republic of China.
69

VI. ENERGY
Table 48
ENERGY TRADE (a) Net imports l+); Net exports (—)
Mio tee
Year
1960 1961 1962 1963 1964
1965 1966 1967 1968 1969
1970 1971 1972 1973 1974
EUR-9
(a)
+ 367.5
+ 663.5
+ 748.6 + 775.5 + 818.9 + 875.6 + 847.8
(bl
+ 338.7
+ 616.8
+ 702.6 + 727.4 + 766.0 + 821.2 + 802.0
Germany
+ 23.6 + 31.1 + 44.6 + 59.6 + 74.3
+ 90.8 + 103.6 + 108.4 + 121.3 + 140.6
+ 167.1 + 177.1 + 194.3 + 213.4 + 194.7
France
+ 53.0 + 58.4 + 63.3 + 81.4 + 87.4
+ 91.8 + 96.9 + 109.1 + 120.0 + 133.0
+ 158.0 + 169.1 + 183.3 + 208.7 + 213.3
Italy
+ 42.5 + 50.2 + 60.8 + 70.4 + 77.1
+ 86.8 + 99.8 + 106.6 + 115.9 + 125.7
+ 140.6 + 143.8 + 151.3 + 162.0 + 165.2
Netherlands
+ 19.4 + 21.0 + 26.3 + 30.4 + 33.2
+ 35.2 + 38.1 + 38.3 + 40.7 + 40.9
+ 41.9 + 32.1 + 29.1 + 22.7 + 5.9
Belgium
+ 11.8 + 13.7 + 17.3 + 22.3 + 24.9
+ 27,8 + 29.6 + 31.1 + 39.1 + 44.1
+ 51.5 + 52.7 + 56.4 + 61.9 + 63.1
Luxembourg
+ 4.9 + 4.9 + 5.0 + 5.1 + 5.6
+ 5.6 + 5.5 + 5.4 + 5.9 + 6.4
+ 6.7 + 6.6 + 6.8 + 7.2 + 7.8
United Kingdom
+ 77.0
+ 138.7
+ 145.6 + 157.3 + 159.9 + 161.6 + 160.6
Ireland
+ 4.2
+ 6.4
+ 7.2 + 8.2 + 8.0 + 8.7 + 8.5
Denmark
+ 17.1
+ 27.1
+ 30.0 + 28.4 + 29.6 + 29.5 + 28.8
(a) Excl. bunkers exported. (b) Incl. bunkers exported.

V I . ENERGY
GROSS INLAND CONSUMPTION OF PRIMARY ENERGY PRODUCTS AND EQUIVALENTS (a)
Table 49
Mio tee
Year
1960 1961 1962 1963 1964
1965 1966 1967 1968 1969
1970 1971 1972 1973 1974
EUR-9
862.3
1 120.9
1 189.5 1 200.5 1 260.4 1 337.3 1 311.8
Germany
209.8 214.2 229.4 248.2 255.8
263.2 264.0 266.8 289.5 314.8
337.2 339.5 354.8 379.8 372.4
France
123.2 127.3 136.2 149.4 155.8
161.6 164.5 174.5 185.4 200.6
214.5 223.2 235.2 256.6 250.1
Italy
65.3 71.7 80.6 90.8 96.7
105.5 116.3 125.6 135.5 146.6
160.0 162.7 172.9 182.7 188.1
Netherlands
31.1 32.4 35.7 39.6 41.0
44.5 46.2 50.2 55.7 61.1
69.3 72.3 82.5 87.8 86.1
Belgium
32.8 34.0 37.5 40.7 40.7
42.1 41.6 44.5 50.0 54.6
58.3 57.8 63.2 66.4 64.6
Luxembourg
4.8 4.9 5.0 5.2 5.6
5.6 5.6 5.5 5.9 6.4
6.6 6.6 6.8 7.3 7.9
United . King
dom
266.1
298.8
305.5 301.5 306.6 318.2 306.6
Ireland
5.6
8.6
9.1 10.1 10.1 10.7 10.3
Denmark
16.8
26.4
28.1 26.8 28.2 28.0 25.6
(a) Production of primary energy products + net imports and changes In stocks of primarv and secondary energy products (see SOEC's 'Energy Statistics').

VI . ENERGY
Table 50
INLAND CONSUMPTION OF PRIMARY ENERGY PRODUCTS AND EQUIVALENTS (a)
1973
Mio tee
1 2 3 4 5 6 7 8 9
10 11 12 13 14 15 16 17 18 19 20 21 22
Country
EUR-9
Germany France Italy Netherlands Belgium Luxembourg United Kingdom Ireland Denmark
Greece Turkey Norway Sweden Switzerland Austria Portugal Finland Spain USSR USA Canada Japan
World
Coal and
lignite
317.3
118.9 41.1 11.5 4.5
16.7 3.6
115.2 2.5 3.2
5.0 6.5 1.2 2.2 0.5 6.1 0.8 3.9
15.6 470.7 508.2
26.8 80.7
2 484.6(c)
Crude petroleum
792.8
208.7 176.8 136.2 41.9 39.3
2.4 154.7
7.9 24.8
13.3 16.3 10.3 38.5 20.9 16.5 8.3
17.6 48.1
456.3 1 109.1
109.0 326.6
3 593.0
Natural gas
168.4
39.2 19.7 20.7 41.5 10.5 0.3
36.6 0 0
0 0 0 0
0.2 5.1
0 0
1.3 320.9 839.0
59.6 7.8
1617.9(c)
Primary elec
tr icity
lb)
57.2
11.9 18.9 13.8
- 0.1 - 0.2
1.0 11.7 0.3
- 0.1
0.8 0.9
23.6 22.0 11.0 6.2 2.6 5.1
15.3 42.5
131.2 67.4 30.7
529.4
Total energy
1 337.4
379.8 256.6 182.7 87.8 66.4
7.3 318.2
10.7 28.0
19.1 23.7 35.1 62.7 32.6 33.9 11.7 26.6 80.3
1 290.4 2 587.5
262.8 445.8
8 224.9
(a) Production of primary energy products + net trade and changes in stocks of primary and secondary energy products (see SOEC's 'Energy Statistics').
(b) Primary electric energy has been converted into hard-coal equivalent on the basis of calorific equivalent necessary for the product ion of 1 kWh in steam generating stations. Except for the Communi ty countries (EUR-9), a conversion factor of 350 gm hard-coal equivalent per kWh has been adopted.
(c) Excl. People's Republic of China.
72

VI . ENERGY
PART OF DIFFERENT SOURCES OF PRIMARY ENERGY
IN GROSS INLAND CONSUMPTION Community
Table 51
Year
1960 1961 1962 1963 1964
1965 1966 1967 1968 1969
1970 1971 1972 1973 1974
1963 1969 1970 1971 1972 1973 1974
Hard coal
52.1 49.3 47.0 43.7 40.1
36.2 32.4 30.3 27.9 26.0
22.4 20.0 17.5 16.4 17.0
51.0 31.8 28.0 24.8 21.5 20.9 20.7
Lignite
7.0 6.8 6.6 6.3 6.2
5.4 5.0 4.7 4.5 4.3
3.9 3.7 3.6 3.6 3.9
4.4 3.2 3.0 2.8 2.8 2.8 3.0
Crude petroleum
EUR-6
29.8 33.3 36.9 40.2 45.9
48.5 51.7 53.8 55.5 56.8
59.3 50.8 61.5 61.7 58.4
EUR-9
37.5 54.2 56.7 58.4 59.5 59.3 56.6
Natural gas
2.7 3.0 3.1 3.0 3.2
3.3 3.8 4.6 6.0 7.2
8.7 10.5 12.3 13.5 15.3 .
2.5 5.8 7.4 9.5
11.7 12.6 14.6
Primary electricity
8.4 7.5 6.3 6.7' 5.5
6.4 7.0 6.3 6.0 5.5
5.6 4.8 4.9 4.6 5.2
5.0 4.8 4.8 4.4 4.5 4.3 4.9
Total energy
100 100 100 100 100
100 100 100 100 100
100 100 100 100 100
100 100 100 100 100 100 100
73

VI . ENERGY
Table 52
DEGREE OF DEPENDENCE ON FOHhIGN SUPPLY (a)
Year
1960 1961 1962 1963 1964
1965 1966 1967 1968 1969
1970 1971 1972 1973 1974
EUR-9
39.3
55.0
59.1 60.6 60.8 61.4 61.1
Germany
9.6 12.8 17.7 22.4 27.2
32.6 37.1 38.8 40.1 42.8
57.9 50.6 53.2 54.8 51.1
France
41.0 43.7 44.3 52.6 54.1
55.0 57.0 60.4 62.4 63.8
71.0 73.1 75.0 78.2 82.3
Italy
58.1 62.8 68.1. 70.2 71.5
73.5 76.5 76.8 78.0 78.2
81.8 81.8 81.1 83.0 83.1
Netherlands
50.9 49.6 58.6 63.2 65.8
62.8 66.6 61.5 56.1 47.7
42.3 26.2 15.6 6.3
- 9.1
Belgium
32.6 35.8 40.9 49.4 54.7
59.3 64.0 63.4 72.0 73.5
81.8 84.6 82.7 86.4 91.2
Luxembourg
99.8 99.4 99.5 99.7 99.7
99.3 99.2 99.2 99.1 99.3
99.2 99.5 99.5 99.6 99.4
United Kingdom
26.3
43.8
45.1 49.5 49.7 48.3 50.2
Ireland
71.9
73.0
76.1 80.5 77.8 80.7 82.2
%
Denmark
98.0
99.6
100 100
99.6 99.6 99.5
(a) As defined by the ratio:-Net imports minus bunkers
Gross inland consumption of primary sources and equivalents
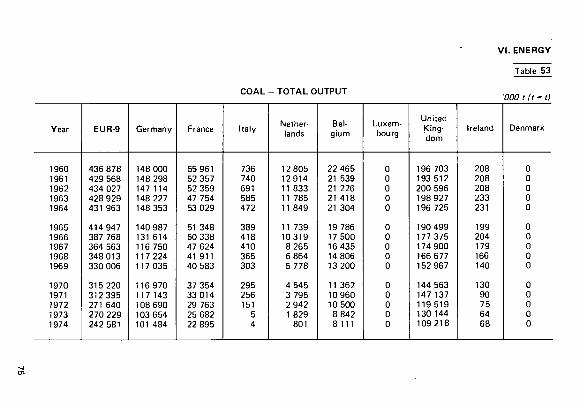
VI. ENERGY
Table 53
COAL TOTAL OUTPUT ■000 t it = ti
Year
1960
1961
1962
1963
1964
1965
1966
1967
1968
1969
1970
1971
1972
1973
1974
EUR-9
436 878
429 568
434 027
428 929
431 963
414 947
387 768
364 563
348 013
330 006
315 220
312395
271 640
270 229
242 581
Germany
148 000
148 298
147 114
148 227
148 353
140 987
131 614
116 750
117 224
117 035
116 970
117 143
108 690
103 654
101 484
France
55 961
52 357
52 359
47 754
53 029
51 348
50 338
47 624
41 911
40 583
37 354
33 014
29 763
25 682
22 895
Italy
736
740
691
585
472
389
418
410
365
303
295
256
151
5
4
Nether-
lands
12 805
12914
11 833
11 785
11 849
11 739
10319
8 265
6 864
5 778
4 545
3 795
2 942
1 829
801
Bel-
gium
22 465
21 539
21 226
21 418
21 304
19 786
17 500
16 435
14 806
13 200
11 362
10 960
10 500
8 842
8111
Luxem-
bourg
0
0
0
0
0
0
0
0
0
0
0
0
0
0
0
United
King-
dom
196 703
193 512
200 596
198 927
196 725
190 499
177 375
174 900
166 677
152 967
144 563
147 137
119 519
130 144
109 218
Ireland
208
208
208
233
231
199
204
179
166
140
130
90
75
64
68
Denmark
0
0
0
0
0
0
0
0
0
0
0
0
0
0
0

VI. ENERGY
Table 54
COAL - LIGNITE - COKE OVEN COKE 1974
'OOOt
1 2 3 4 5 6 7 8 9
10 11 12 13 14 15 16 17 18 19 20 21 22
Country
EUR-9
Germany France Italy Netherlands Belgium Luxembourg United Kingdom Ireland Denmark
Greece Turkey Norway Sweden Switzerland Austria Portugal Finland Spain USSR USA Canada Japan
World
Coal
Output
242 581
101 484 22 895
4 801
8111 0
109 218 68
0
0 5 120
430 0 0 0
230 0
10 240 524 000 536 920
17 370 20 330
1 824 370
Balance of trade
+
. + + + + + + + + +
+ + + + + + +
--+ +
36 268
10673 15 833 12 830 3 376 9 097
605 1 979
853 3 471
1 011 0
492 1 440
209 2 884
306 3 932 3 243
16 502 53 144
1 567 64 019
0
Available
278 849
90 811 38 728 .12 834
4 177 17 208
605 111 197
921 3 471
1 011 5 120
922 1 440
209 2 884
536 3 932
13 483 507 498 483 776
18 937 84 349
1 824 370
Lignite
Production (a)
130 764
126 044 2 760 1960
0 0 0 0 0 0
14 080 5 660
0 0 0
3 630 0 0
2 900 160 000
14 060 3 480
80
821 520
Coke oven coke
Production
82 278
34 921 12 282 8 566 2 683 8 050
0 15 775
0 0
400 1 300
320 480
0 1 730
0 100
4 100 82 500 55 820
5 440 37 500
346 680
(a) A l l qualities added t = t.
76

VI . ENERGY
CRUDE OIL 1974
(a) Condensates included. (b) Atmospheric distillation, (end of year). (c) Excluding trade within the Community.
Table 55
1 2 3 4 b 6 7 8 9
10 11 12 13 14 15 16 17 18 19 20 21 22
Country
EUR-9
Germany France Italy Netherlands Belgium Luxembourg United Kingdom Ireland Denmark
Greece Turkey Norway Sweden Switzerland Austria Portugal Finland Spain USSR USA Canada Japan
World
Production la)
I mports Crude oil refinery
intake
Refining capacity
(b)
'OOOt
10 530
6 191 1 175 1 093 1 574
0 0
411 0
86
0 3 500 1 670
0 0
2 300 0 0
1 900 457 000 494 850
97 000 700
2 870 260
571 328(c)
103 319 129 814 120 236 63 927 30 398
0 111 646
2 625 9 363
9 962 6 730
10 049 5 999 6 505 5 758 9 468
43 866
177 020 40 461
-239 810
574 943
108 985 128 077 119 787 64 560 30 348
0 111 210
2~652 9 324
12 970 6 329
10 229 5 953
8 675 5 780 9 305
44 987
609 847 86 655
234 561
805 625
148 810 169 385
' 196 842 91 667 46 584
0 138 592
2 789 10 956
20 468 15712 8 366
12 350 6 872
10 956 6 800 9 761
58 017
707 971 93 502
255 665
77
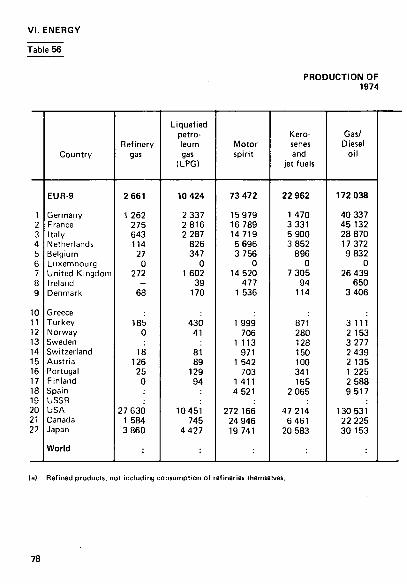
VI. ENERGY
Table 56
PRODUCTION OF 1974
1 2 3 4 5 6 7 8 9
10 11 12 13 14 15 16 17 18 19 20 21 22
Country
EUR-9
Germany France Italy Netherlands Belgium Luxembourg United Kingdom Ireland Denmark
G reece Turkey Norway Sweden Switzerland Austria Portugal Finland Spain USSR USA Canada Japan
World
Refinery gas
2 661
1 262 275 643 114
27 0
272
-68
185 0
18 126 25
0
27 630 1 584 3 860
Liquefied petroleum gas
(LPG)
10 424
2 337 2 816 2 287
826 347
0 1 602
39 170
430 41
81 89
129 94
10451 745
4 427
Motor spirit
73 472
15 979 16 789 14719
5 696 3 756
0 14 520
477 1 536
1 999 706
1 113 971
1 542 703
1 411 4 521
272 166 24 946 19 741
Kerosenes and
jet fuels
22 962
1 470 3 331 5 900 3 852
896 0
7 305 94
114
871 280 128 150 100 341 165
2 065
47 214 6 461
20 583
Gas/ Diesel
oil
172 038
40 337 45 132 28 870 17 372 9 832
0 26 439
650 3 406
3 1 1 1 2 153 3 277 2 439 2 135 1 225 2 588 9 517
130 531 22 225 30 153
(a) Refined products, not including consumption of refineries themselves.
78

VI . ENERGY
PETROLEUM PRODUCTS (a)
Tabel 56
'000 t
Residual fuel oi l
196 068
26 597 39 256 51 323 23 171 11 251
0 40 020
1 251 3 199
5 587 2 262 4 720 1 667 3 550 2 507 3 464
21 380
58 632 20 834
106 224
Lubricants
5 516
1 459 1 302
623 576 101
0 1 455
0 0
37 19 92
0 263
89 0
10013 644
2 190
Bitumen
14 262
4 464 3 714 1 812 1 003
880 0
2 129 0
260
239 68
182 380
26 353
28 284 2 968 4 699
Other products
35 584
5 066 5 976 6 713 8 359 1 724
0 7 524
45 177
335 357
1 200 125
73 300 298
4 7 1 8
48 378 3 698
23 526
Total
532 987
98 971 118 591 112 890 60 969 28 814
0 101 266
2 556 8 930
12 794 5 886
10 080 5 633 8 258 5 345 8 373
42 187
633 299 84 105
215 403
1 2 3 4 5 6 7 8 9
10 11 12 13 14 15 16 17 18 19 20 21 22
Country
EUR-9
Germany France Italy Netherlands Belgium Luxembourg United Kingdom Ireland Denmark
Greece Turkey Norway Sweden Switzerland Austria Portugal Finland Spain USSR USA Canada Japan
World
79

VI. ENERGY
Table 57
PETROLEUM PRODUCTS - TOTAL PRODUCTION (a)
Mio t
Year
1960 1961 1962 1963 1964
1965 1966 1967 1968 1969
1970 1971 1972 1973 1974
EUR-9
152.6 173.7 194.4 218.8 254.4
292.8 327.9 350.2 390.9 442.5
498.7 509.0 540.0 578.1 533.1
Germany
26.5 32.8 36.9 43.5 53.4
61.1 70.1 73.8 83.8 89.8
98.6 99.8
102.8 109.1 99.0
France
29.8 33.8 36.4 42.4 48.8
56.3 61.9 69.6 74.3 82.6
94.8 10.4 11.5
124.4 118.6
Italy
29.0 32.9 39.3 45.5 54.1
65.2 76.4 81.4 89.1 99.0
111.6 111.5 114.3 121.4 112.9
Netherlands
18.5 19.5 22.4 22.9 26.3
29.1 31.6 32.9 36.5 48.6
58.5 57.5 66.1 69.4 61.0
Belgium
6.5 7.4 8.0 1.4 1.6
1.8 1..8 1.3 2.4 2.6
28.2 28.5 34.5 35.5 28.8
Luxembourg
0 0 0 0 0
0 0 0 0 0
0 0 0 0 0
United Kingdom
40.9 45.6 48.9 49.6 54.6
60.9 66.3 68.0 77.0 85.1
94.7 98.2 99.4
105.9 101.3
Ireland
1.4 1.4 1.5 1.5 1.7
2.0 1.5 2.5 2.2 2.3
2.6 2.8 2.6 2.6 2.6
Denmark
0.0 0.2 1.2 2.0 2.9
3.4 4.4 5.9 6.5 8.5
9.7 10.3 9.8 9.8 8.9
(a) Production in the refineries.
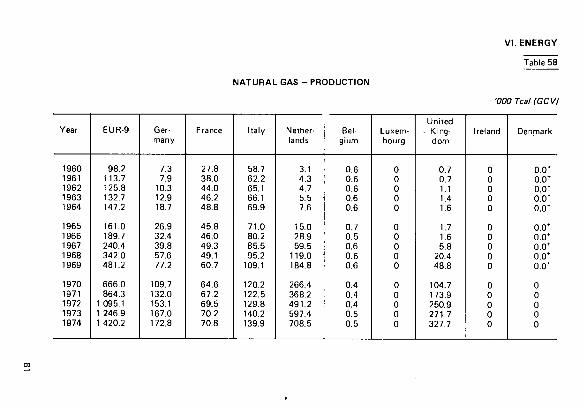
NATURAL GAS - PRODUCTION
V I . ENERGY
Table 58
'000 Tcal (GCV)
Year
1960 1961 1962 1963 1964
1965 1966 1967 1968 1969
1970 1971 1972 1973 1974
EUR-9
98.2 113.7 125.8 132.7 147.2
161.0 189.7 240.4 342.0 481.2
666.0 864.3
1 095.1 1 246.9 1 420.2
Germany
7.3 7.9
10.3 12.9 18.7
26.9 32.4 39.8 57.6 77.2
109.7 132.0 153.1 167.0 172.8
France
27.8 38.0 44.0 46.2 48.8
45.8 46.0 49.3 49.1 60.7
64.6 67.2 69.5 70.2 70.8
Italy
58.7 62.2 65.1 66.1 69.9
71.0 80.2 85.5 95.2
109.1
120.2 122.5 129.8 140.2 139.9
Netherlands
3.1 4.3 4.7 5.5 7.6
15.0 28.9 59.5
119.0 184.8
266.4 368.2 491.2 597.4 708.5
Belgium
0.6 0.6 0.6 0.6 0.6
0.7 0.5 0.6 0.6 0.6
0.4 0.4 0.4 0.5 0.5
Luxembourg
0 0 0 0 0
0 0 0 0 0
0 0 0 0 0
United . King
dom
0.7 0.7 1.1 1.4 1.6
1.7 1.6 5.8
20.4 48.8
104.7 173.9 250.9 271.7 327.7
Ireland
0 0 0 0 0
0 0 0 0 0
0 0 0 0 0
Denmark
0.0* 0.0* 0.0* 0.0* 0.0*
0.0* 0.0* 0.0* 0.0* 0.0*
0 0 0 0 0

VI. ENERGY
Table 59
NATURAL GAS 1974
1 2 3 4 5 6 7 8 9
10 11 12 13 14 15 16 17 18 19 20 21 22
Country
EUR-9
Germany France Italy Netherlands Belgium Luxembourg United Kingdom Ireland Denmark
Greece Turkey Norway Sweden Switzerland Austria Portugal Finland Spain USSR USA Canada Japan
World
Reserves
10 ' m3
4 934
315 165 340
2 685 0 0
1 415 0
14
0 7
700 0 0
27 0 0
17 22 996
7 080 1 487
48
72 400
Production
1 0 9 m 3
159.2
19.8 7.6
14.5 83.7
0 0
33.6 0 0
0 0 0 0 0
2.2 0 0 0
261.0 633.6
94.6 2.8
1320
'000 Tcal (GCV)
(a)
1 420.2
172.8 70.8
139.9 708.5
0.5 0
327.7 0 0
0 0
0.1 0 0
21.3 0 0 0*
2 174.7 5 443.3
761.0 26.8
11880
Balance of
exchanges
Gross inland
consumpt ion (b)
'000 Tcal (GCV)
+ 62.7
+ 191.3 + 100.1 + 37.9 - 368.5 + 92.5 + 3.3 + 6.1
0 0
0 0 0 0
+ 3.6 + 19.6
0 + 3.7 + 8.3 - 18.2 + 222.4 -240 .7 + 45.0
0
1467.1
362.7 156.9 177.4 340.0
93.0 3.3
333.8 0 0
0 0
0.1 0
3.6 40.2
0 3.7 7.8
2 115.9 5 644.6
416.6 71.8
11 880
(a) Coll iery methane included. (b) Variations of stocks accounted for.
82

VI . ENERGY
Table 60
MAXIMUM OUTPUT CAPACITY OF POWER STATIONS
Situation end 1974 MW
1 2 3 4 5 6 7 8 9
10 11 12 13 14 15 16 1 / 18 19 20 .'1 22
Country
EUR-9
Germany France Italy Netherlands Belgium Luxembourg United Kingdom Ireland Denmark
G reece Turkey (a) Norway Sweden Switzerland Austria Portugal Finland Spain USSR USA Canada Japan (b)
World
Hydro
40 251
4 775 16 334 14 875
0 459 972
2 296 532
8
1 289 996
16 240 12 435
6 008 2 121 2 250
11 613 36 978 64 283 36 675 23 538
Geothermal
382
0 0
382 0 0 0 0 0 0
0 0 0 0 0 0 0 0 0
441 0
30
1 100
Nuclear
12 118
3 261 2 868
552 502 400
0 4 536
0 0
0 0 0
2 604 1 010
0 0 0
1 073 4 088
30 084 2 540 3 713
59 682
Conventional thermal
202 294
58 100 25 423 22 540 13014 7 895
214 67 587
1 568 5 953
2 680 2 083
158 6 913
3 233 791
4 580 10 530
164 376 398 975
18 168 76 726
(a) Situation at31. 12. 1973. lb) Situational 31.3. 1975.
83

VI . ENERGY
Table 61
ELECTRICAL ENERGY - TOTAL NET PRODUCTION
G Wh
Year
1960 1961 1962 1963 1964
1965 1966 1967 1968 1969
1970 1971 1972 1973 1974
EUR-9
406 570 432 990 471 123 510 947 546 904
583 094 611 360 639 334 691 537 758 073
806 551 850 364 906 695 973 029 990 588
Germany
111 381 119 073 129 364 140 374 153 071
160 555 165 877 172 249 189 701 2 ÎO 985
226 919 242 880 257 166 280 148 292 600
France
72304 76 641 83 251 88 471 93 930
101 442 106 111 111 637 117 925 131 516
140 708 148 998 163 652 174 480 180 402
Italy
55 282 59 360 63 054 69 723 74 618
80 655 87 121 93 549 100 249 106 329
112 842 119 764 129 678 139 103 142 266
Netherlands
15 633 16 656 18214 19 839 21 739
23 657 26 372 28 454 31 847 35 253
38 878 42 747 47 214 50 227 52 927
Belgium
14 118 14 968 16410 17 800 19 478
20 365 21 518 22 362 25 027 27 664
28 961 31 597 35 664 39 121 40 764
Luxembourg
1 388 1 451 1 450 1 765 2 128
2 220 2 198 2 141 1 963 2 119
2 070 2 269 2 160 2 105 2 006
United Kingdom
129 071 137 514 151 008 163 140 171 540
183 384 189 140 195 362 208 263 222 628
231 789 238 599 245 264 262 879 254 477
Ireland
2 214 2 357 2 597 2 847 3 079
3 437 3 714 4 100 4 465 5 006
5 520 5 970 6 529 6 962 7 500
Denmark
5 179 4 970 5 775 6 988 7 321
7 379 9 309 9 480 12 097 16 573
18 864 17 540 19 368 18 004 17 646

ELECTRICAL ENERGY: NET PRODUCTION IN THE COMMUNITY
BY SOURCES OF ENERGY USED
V I . ENERGY
Table 62
'000 GWh
Year Hydro Geo-thermal
Nuclear
Conventional thermal
Coal (a)
Brown coal
Petroleum
products
Natural gas
Deri-vated gases and
others
Total Net
produc t ion
EUR-6
1960 1961 1962 1963 1964
99.3 93.1 87.7
102.3 86.8
2.1 .2.1 2.2 2.3 2.4
0.1 0.3 0.5 0.8 3.0
104.9 116.0 131.2 128.7 144.7
30.1 33.1 36.2 38.8 42.8
13.7 22.4 32.0 40.7 62.6
6.1 7.5 8.6 8.3 8.4
13.7 13.6 13.3 12.1 14.3
168.6 192.6 221.4 232.6 272.8
270.1 288.1 311.7 338.0 365.0
1965 1966 1967 1968 1969
105.5 113.7 105.3 111.1 110.0
2.4 2.5 2.4 2.5 2.6
4.4 5.3 6.8 7.3
11.0
140.6 140.1 153.2 157.3 162.2
42.8 43.5 46.1 51.6 55.6
69.4 76.9 85.4 94.7
118.1
8.2 11.3 14.5 22.5 31.2
15.7 15.9 16.6 19.7 22.2
275.6 287.7 315.8 345.8 390.3
388.9 409.2 430.4 466.7 513.9
1970 1971 1972 1973 1974
116.3 103.6 106.1 103.1 115.2
2.5 2.5 2.4 2.3 2.3
14.2 17.8 26.2 29.2 31.8
143.4 152.9 139.7 130.7 127.4
56.7 58.4 63.4 71.7 77.4
145.7 168.8 193.7 220.8 204.6
46.6 59.5 76.7 96.9
120.2
24.9 24.8 27.4 30.4 32.0
417.4 464.4 500.9 550.5 561.6
550.4 588.3 635.5 685.2 711.0
EUR-9
1969 1970 1971 1972 1973 1974
115.0 122.7 108.3 111.1 108.3 121.0
2.6 2.5 2.5 2.4 2.3 2.3
36.7 37.0 41.8 51.8 53.5 61.1
326.7 305.8 306.5 277.3 301.4 278.0
57.7 58.5 60.1 65.0 73.3 79.0
163.4 206.6 243.3 287.7 301.8 285.9
32.5 47.3 61.8 82.8
100.5 130.2
23.4 26.0 26.0 28.5 31.9 33.1
603.7 644.2 697.9 741.4 808.9 806.2
758.1 806.5 850.4 906.7 973.0 990.6
1969 1970 1971 1972 1973 1974
15.2 15.2 12.7 12.3 11.1 12.2
0.3 0.3 0.3 0.3 0.2 0.2
4.8 4.6 4.9 5.7 5.5 6.2
43.1 37.9 36.0 30.6 31.0 28.0
7.7 7.3 7.1 7.1 7.5 8.0
21.5 25.6 28.6 31.7 31.0 28.9
4.3 5.9 7.3 9.1
10.3 13.2
3.1 3.2 3.1 3.2 3.3 3.3
79.7 79.9 82.1 81.7 83.2 81.4
100 100 100 100 100 100
(a) Hard coal and black lignite. 85

VI . ENERGY
Table 63
PRODUCTION OF ELECTRICAL ENERGY 1974
GH<f,
1 2 3 4 5 6 7 8 9
10 11 12 13 14 15 16 17 18 19 20 21 22
Country
EUR-9
Germany France Italy Netherlands Belgium Luxembourg United Kingdom Ireland Denmark
Greece Turkey Norway Sweden Switzerland Austria Portugal Finland Spain USSR USA Canada Japan (b)
World
Total generation
1 048 989
311 710 188211 148 905
55 350 42 761
2 078 273 319
7 899 18 756
15 024 13 477 76 646 75 130 38 153 33 881 10 745 27 358 80 919
975 750 2 093 280
289 020 464 165
6 247 000
Hydro
120 962
17618 56 830 39 129
0 679 905
4 777 1 000
24
2 340 2 970
76 189 56 623 28 563 22 322
7 766 12 301 30 962
130 710 304 014 210 423
84 336
1 380 000
Net productior
Geo-thermal
2 340
0 0
2 340 0 0 0 0 0 0
0 0 0 0 0 0 0 0 0
2 703 0
6 700
Nuclear
61076
11 446 13 932 3 227 3 102
137 0
29 232 0 0
0 0 0
1 902 6 730
0 0 0
6 9 1 5
112 740 13 864 18 623
228 700 (Ç)
(a)
Conventional
thermal
806 210
263 536 109 640 97 570 49 825 39 948
1 101 220 468
6 500 17 622
11 857 9 950
71 14 901 2 117
10 554 2712
13917 39 777
784 650 1 548 222
56 109 337 001
4 264 600
Total
990 588
292 600 180 402 142 266
52 927 40 764
2 006 254 477
7 500 17 646
14 196 12 920 76 260 73 246 37 410 32 876 10 478 26 218 77 654
915 360 1 967 649
280 396 439 960
5 880 000
(a) i.e. after deduction of the amount taken by station auxiliaries. (b) Fiscal year 1.4. 74-31.3. 75. Id Excl. USSR.
86

VI. ENERGY
CONSUMPTION OF ELECTRICAL ENERGY 1974
Table 64
GWh
1 2 3 4 5 6 7 8 9
io 11 12 13 14 15 16 17 18 19 20 21 72
Country
EUR-9
Germany France Italy Netherlands Belgium Luxembourg United Kingdom Ireland Denmark
Greece Turkey Norway Sweden Switzerland Austria Portugal Finland Spain USSR USA Canada Japan (a)
World
Total net pro
duction
990 588
292 600 180 402 142 266
52 927 40 764
2 006 254 477
7 500 17 646
14 196 12 920 76 260 73 246 37410 32 876 10 478 26 218 77 654
915 360 1 967 649
280 396 439 960
5 880 000
Net imports
+ 8 856
+ 5916 186
+ 2 293 - 1 479
325 + 2 681 + 50
11 83
+ 43 0
- 5 543 + 2 937 - 3 231 - 2 959 + 44 + 3 110 - 1 135 - 10 850 + 12514 - 12 500
0
0
Consumption for
pumping water
7 850
2 247 380
2 231 0
631 1 159
896 306
0
0 110 40 28
1 730 679
85 0
1 110
5 794 1 700 1 410
525
Transp. and
distr. losses
63 693
14 383 11 761 11 699
2 672 2 035
105 18 424
771 1 843
1 062 1 410 6 507 7 500 3 199 2 280 1 326 2 2 1 8 9 116
77 760 169 620
23 436 22 614
000*
Consumpt ion
of the internal market
927 901
281 886 168 075 130 629 48 776 37 773
3 423 235 207
6 4 1 2 15 720
13 177 11 400 64 170 68 155 29 250 26 958
9 111 27 110 66 293
826 750 1 804 749
243 300 415 936
5 355 000
(a) Fiscal year 1 . 4 . 7 4 - 3 1 . 3 . 7 5 .
87

VII. INDUSTRY
Table 65
OUTPUT OF IRON ORE 1974
1 2 3 4 5 6 7 8 9
10 11 12 13 14 15 16 17 18 19 20 21 22
Country
EUR-9
Germany France Italy Netherlands Belgium Luxembourg United Kingdom Ireland Denmark
Greece Turkey Norway Sweden Switzerland Austria Portugal Finland Spain USSR USA Canada Japan
World
Total ore mined
'000 t
67613
5671 54 730
795 0
123 2 687 3 602
0 6
2 001 1 650 3916
36 960 0
4 245 28
934 8 583
223 200 85 704 47 300
779
851 100
Iron content
'000 t
19 150
1 565 15 580
252 0
43 724 984
0 2
866 838
2 553 22 829
0 1 372
13 350
4 463 121 309
50 700 29 089
455
474 300
%
28
28 28 32
0 35 27 27
0 33
43 51 65 62
0 32 49 37 52 54 59 61 58
56
88
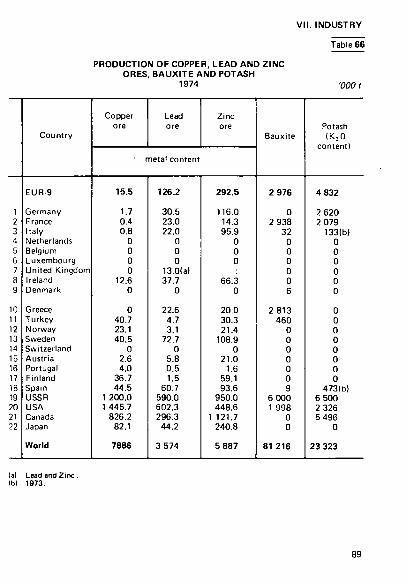
VI I . INDUSTRY
Table 66
PRODUCTION OF COPPER, LEAD AND ZINC ORES, BAUXITE AND POTASH
1974 '000 t
1 2 3 4 5 6 7 8 9
10 11 12 13 14 15 16 17 18 19 20 .'1 22
Country
EUR-9
Germany France Italy Netherlands Belgium Luxembourg United Kingdom Ireland Denmark
Greece Turkey Norway Sweden Switzerland Austria Portugal Finland Spain USSR USA Canada Japan
World
Copper ore
Lead ore
Zinc ore
' metal content
15.5
1.7 0.4 0.8
0 0 0 0
12.6 0
0 40.7 23.1 40.5
0 2.6 4.0
36.7 44.5
1 200.0 1 445.7
826.2 82.1
7886
126.2
30.5 23.0 22.0
0 0 0
13.0(a) 37.7
0
22.6 4.7 3.1
72.7 0
5.8 0.5 1.5
60.7 590.0 602.3 296.3
44.2
3 574
292.5
116.0 14.3 95.9
0 0 0
66.3 0
20.0 30.3 21.4
108.9 0
21.0 1.6
59.1 93.6
950.0 448.6
1 121.7 240.8
5 887
Bauxite
2 976
0 2 938
32 0 0 0 0 0 6
2 813 460
0 0 0 0 0 0 9
6 000 1 998
0 0
81 216
Potash (K 2 0
content)
4 832
2 620 2 079
1331b) 0 0 0 0 0 0
0 0 0 0 0 0 0 0
4731b) 6 500 2 326 5 496
0
23 323
la) Lead and Zinc, (bl 1973.
89

VI I . INDUSTRY
Table 67
PRODUCTION OF PIG IRON, STEEL AND FINISHED ROLLED PRODUCTS
1974
'000 t
l 2 3 4 5 6 7 8 9
10 11 12 13 14 15 16 17 18 19 20 21 22
Country
EUR-9
Germany France Italy Netherlands Belgium Luxembourg United Kingdom Ireland Denmark
Greece Turkey Norway Sweden Switzerland Austria Portugal Finland Spain USSR USA Canada Japan
World |c)
Crude pig iron
112 079
40 221 22 517 11 761 4 804
13 152 5 468
14 155 0 0
1 220 1 530 2 979
33 3 443
365 1 381 6 930
98 340 87 007
9 422 40 437
479 200
Crude steel
155 587
53 232 27 020 23 798
5 840 16 225 6 448
22 379 110 535
850 1 464
944 5 989
592 4 699
387 1 656
11 647 136 206 135 290
13 627 117 131
683 000
Finished rolled
products (a)
115 474
38 859 20 594 18 378 3 884
12 137 4 515
16 576 76
457
1 000 645 480
4 216 700
3 369 335
1 124 8 450
97 950 95 654(b) 10 043
100 169
506 200
(a) For the nine member countries of the EC, only those finshed rolled products covered by the ECSC Treaty; since for other countries additional products are included, the figures are not comparable.
(b) Shipments. (c) Excl . China ( P R ) .
90

PRODUCTION OF CRUDE STEEL
V I I . INDUSTRY
Table 68
'000 t
Year
1960 1961 1962 1963 1964
1965 1966 1967 1968 1969
1970 1971 1972 1973 1974
EUR-9
98 118 96 301 94 217 96 476 109 956
113 893 110272 114625 125 437 134 722
138 070 128 136 139 109 150 073 155 587
Germany
34 100 33 458 32 563 31 597 37 339
36 821 35316 36 744 41 159 45316
45 041 40313 43 705 49 521 53 232
France
17 300 17 577 17 234 17 554 19 781
19 599 19 594 19 658 20 403 22 510
23 774 22 843 24 054 25 270 27 020
Italy
8 462 9 383 9 757 10 157 9 793
12 680 13 639 15 890 16 964 16 428
17 277 17 452 19813 20 995 23 798
Netherlands
1 950 1 978 2 096 2 354 2 659
3 145 3 255 3 401 3 706 4 712
5 042 5 083 5 585 5 623 5 840
Belgium
7 181 7 002 7 351 7 525 8 725
9 162 8911 9 712 11 568 12 832 12 607 12 445 14 532 15 522 16 225
Luxembourg
4 084 4 113 4 010 4 032 4 559
4 585 4 390 4 481 4 834 5 521
5 462 5 241 5 457 5 924 6 448
United King-
'· dom
24 695 22 439 20 820 22 880 26 651
27 438 24 705 24 277 26 277 26 845
28 314 24 209 25 387 26 649 22 379
Ireland
30 28 19 19 53
52 57 62 66 76
80 80 77 116 110
Denmark
317 323 367 359 396
412 405 401 460 482
473 471 498 453 535
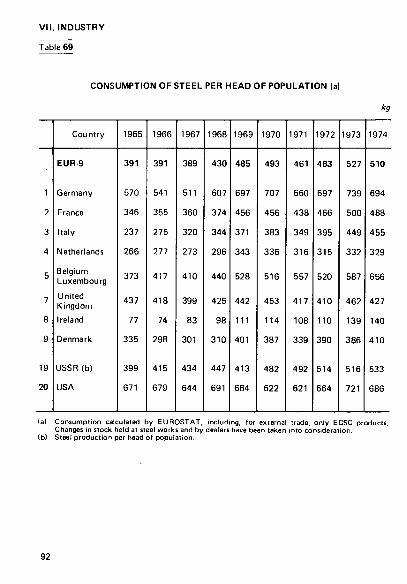
VI I . INDUSTRY
Table 69
CONSUMPTION OF STEEL PER HEAD OF POPULATION (a)
kg
1
2
3 4
5
7 8
9
19 20
Country
EUR-9
Germany
France
Italy
Netherlands
Belgium Luxembourg United Kingdom Ireland
Denmark
USSR (b)
USA
1965
391
570
346
237
266
373
437
77 335
399 671
1966
391
541
355
275
277
417
418
74
298
415
679
1967
389
511
360
320
273
410
399
83 301
434
644
1968
430
607
374
344
296
440
425
98
310
447
691
1969
485
697
456
371
343
528
442
111
401
413
684
1970
493
707
456
383
336
516
453
114
387
482
622
1971
461
660
438
349
316
557
417
108
339
492
621
1972
483
697
466
395
315
520
410
110 390
514
664
1973
527
739
500
449
332
587
462 139
386
516
721
1974
510
694
488
455
329
656
427
140 410
533
686
(a) Consumption calculated by EUROSTAT, including, for external trade, only ECSC products. Changes in stock held at steel works and by dealers have been taken into consideration.
(b) Steel product ion per head of populat ion.
92

VI I . INDUSTRY
PRODUCTION OF ALUMINIUM, COPPER, LEAD, ZINC AND TIN
1974
Table 70
'000 t
1 2 3 4 5 6 7 8 9
10 I 1 12 13 14 15 16 17 18 19 20 .'1 '2
Country
EUR-9
Germany France Italy Netherlands Belgium Luxembourg United Kingdom Ireland Denmark
Greece Turkey Norway Sweden Switzerland Austria Portugal Finland Spain USSR USA Canada Japan
World
Aluminium
1 834.9
688.9 393.3 212.2 247.4
0 0
293.1 0 0
146.6 0
648.6 82.5 87.2 91.6
0 0
189.6 2 200.0 4 447.9 1 008.8 1 118.4
13911
Copper (refined)
1 020.0
423.6 43.9 13.7
, o ) 378.7 1 160.1
0 0
0 31.1 24.8 59.9
0 26.7
0 38.3
123.5 1 350.0 1 938.3
559.1 996.0
8 852
Lead (refined)
990.4
321.4 177.7
73.5 26.4
99.6
276.9 0
14.9
14.8 3.0
0 40.9
0 15.6
0 0
82.0 660.0 751.6 126.4 227.9
4 225
Zinc
1 315.4
400.0 276.7 196.4 68.0
289.9
84.4 0 0
0 0
71.9 0 0
16.5 0
92.2 130.0 980.0 574.9 437.7 850.8
6 001
Tin (refined)
17.7
2.5 0 0 0
3.4
11.8 0 0
0 0 0 0 0 0
0.6 0
5.9 15.0 6.0
0 1.3
220
93
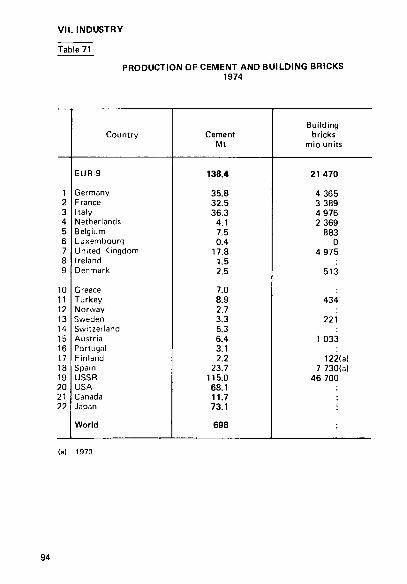
VI I . INDUSTRY
Table 71
PRODUCTION OF CEMENT AND BUILDING BRICKS 1974
1 2 3 4 5 6 7 8 9
10 11 12 13 14 15 16 17 18 19 20 21 22
Country
EUR 9
Germany France Italy Netherlands Belgium Luxembourg United Kingdom Ireland Denmark
Greece Turkey Norway Sweden Switzerland Austria Portugal Finland Spain USSR USA Canada Japan
World
Cement Mt
138.4
35.8 32.5 36.3
4.1 7.5 0.4
17.8 1.5 2.5
7.0 8.9 2.7 3.3 5.3 6.4 3.1 2.2
23.7 115.0 68.1 11.7 73.1
698
Building bricks
mio units
21470
4 365 3 389 4 976 2 369
883 0
4 975
513
434
221
1 033
122(a) 7 730(a)
46 700
94
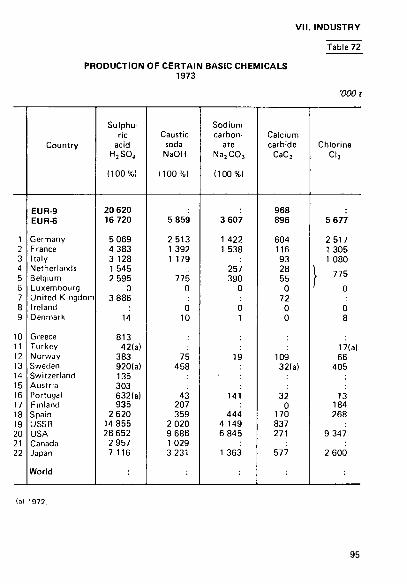
VI I . INDUSTRY
PRODUCTION OF CERTAIN BASIC CHEMICALS 1973
Table 72
'000 t
1 2 3 4 5 6 7 8 9
10 11 12 13 14 15 16 17 18 19 70 21 22
Country
EUR-9 EUR-6
Germany France Italy Netherlands Belgium Luxembourg United Kingdom Ireland Denmark
Greece Turkey Norway Sweden Switzerland Austria Portugal Finland Spain USSR USA Canada Japan
World
Sulphuric
acid H 2 S0 4
(100%)
20 620 16 720
5 069 4 383 3 128 1 545 2 595
0 3 886
14
813 42(a)
383 920(a) 135 303 632(a) 935
2 620 14 855 28 652
2 957 7 116
Caustic soda
NaOH
(100%)
5 859
2 513 1 392 1 179
775 0
0 10
75 458
43 207 359
2 020 9 688 1 029 3 231
Sodium carbon
ate Na jCOj
(100%)
3 607
1 422 1 538
257 390
0
0 1
19
141
444 4 149 6 845
1 363
Calcium carbide
CaC2
968 896
604 116 93 28 55
0 72
0 0
109 32(a)
32 0
170 837 271
577
Chlorine Cl2
5 677
2517 1 305 1 080
I 775 ' 0
0 8
17(a) 66
405
13 184 268
9 347
2 600
(a) 1972.
95

VII. INDUSTRY
Table 73
CHEMICALS: PRODUCTION OF AMMONIA, FERTILIZERS AND PLASTICS
1973 or 1973/74 (a)
(a) Crop year, (bl 1974. (cl 1973. Id) 1972.
'000
I 2 3 4 5 6 7 8 9
10 11 12 13 14 15 16 17 18 19 20 21 22
Country
EUR-9
Germany France Italy Netherlands Belgium Luxembourg United Kingdom Ireland Denmark
Greece Turkey Norway Sweden Switzerland Austria Portugal Finland Spain USSR USA Canada Japan
World
Synthetic
ammonia N2
1973
2 064 1 923 1 435 2 165
546 0
13
110
307 233 239 726
11 527
3 973
Nitrogenous fertilizers
N
1973/74 (a)
7 179
1 473 1 642 1 130 1 459
652 0
755
68(b)
255 153(c) 445 178
24 231 164 240 753(c)
7 241(c) 9 152
822 2 204
Phosphate fertilizers P2Os
1973/74 (a)
4 958
962 1 693
442 350 789 176 438
108(b)
163 142(c) 128 176
4 155 90
202 683
3 240(c) 6 0 1 3
740 736
Potash fertilizers
K 2 0
1973/74 (a)
5 973
2 408 2 082
233 0+ 0 0
472 0
778(b)
0 0
144(c) 0 0 0 0 0+
490 5 918(c) 2 346 5 073
Plastics
1973
16 015
6 482 2 532 2 514 1 315
773 0
2 399 0
164(d) 417(dl
276 65
189(d) 695
2 304 11 880
805 6 420
96

VI I . INDUSTRY
Table 74
PRODUCTION OF MAN-MADE FIBRES 1974
'000 t
I 2 3 4 5 6 7 8 9
10 11 12 13 14 15 16 17 18 19 20 21 22
Country
EUR-9
Germany France Italy Netherlands Belgium Luxembourg United Kingdom Ireland Denmark
Greece Turkey Norway Sweden Switzerland Austria Portugal Finland Spain USSR USA Canada Japan
World
Cel
Yarn
281
74.0 42.1 54.2 39.5
0 70.7
0 0
5.4 0.4
0 2.5 4.1
14.9 3.0 0.9
22.0 267.0 241.9
14.6 115.6
1 286
Fib
ulosic
Staple
453
98.7 83.7 85.4
0 24.1
0 160.8
0 0
0 5.5
28.8 32.6
0 88.6
1.4 36.2 46.0
301.6 419.8
26.1 357.8
2 442
re
Non-cellulosic
Yarn
902
376.9 98.8
. 131.7
> 88.2
200.3 6.0
5.2 16.0
0 1.1
49.5 0
1.5
49.7 191.0
1 352.4 65.4
499.5
3 765
Staple
1002
390.0 138.9
, 209.0
} 64.6
' 195.8 2.0 1.7
0 26.5
0 0
23.0 18.6 8.4
0 78.5
127.5 1 262.6
26.6 651.2
3 780
97
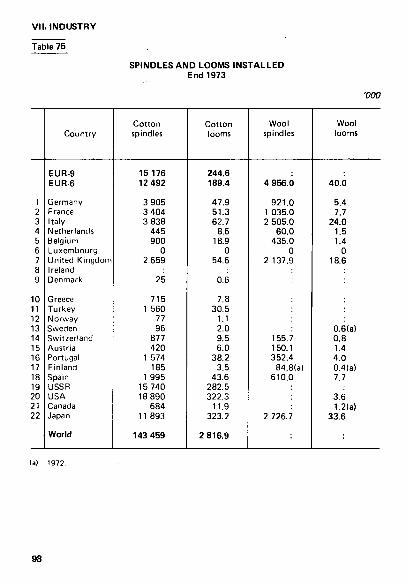
VI I . INDUSTRY
Table 75
SPINDLES AND LOOMS INSTALLED End 1973
VOO
1 2 3 4 5 6 7 8 9
10 11 12 13 14 15 16 17 18 19 20 21 22
Country
EUR-9 EUR-6
Germany France Italy Netherlands Belgium Luxembourg United Kingdom Ireland Denmark
Greece Turkey Norway Sweden Switzerland Austria Portugal Finland Spain USSR USA Canada Japan
World
Cotton spindles
15 176 12 492
3 905 3 404 3 838
445 900
0 2 659
25
715 1 560
77 96
877 420
1 574 185
1 995 15 740 18 890
684 11 893
143 459
Cotton looms
244.6 189.4
47.9 51.3 62.7
8.6 18.9
0 54.6
0.6
7.8 30.5
1.1 2.0 9.5 6.0
38.2 3.5
43.6 282.5 322.3
11.9 323.2
2 816.9
Wool spindle
4 956.1
921.( 1 035.( 2 505(
60,( 435.(
( 2 137.S
155.-150. 352.'
84.f 610.C
2 726.;
Wool s looms
) 40.0
) 5.4 ) 7.7 ) 24.0 ) 1.5 ) 1.4 ) 0 ) 18.6
0.6(a) 0.8 1.4 4.0
lia) 0.4(a) 7.7
3.6 1.2(a)
33.6

VI I . INDUSTRY
Table 76
MOTOR VEHICLES, PRODUCTION AND ASSEMBLY 1974
-OOC7
1 2 3 4 5 6 7 8 9
10 11 17 13 14 15 16 17 18 19 20 21 22
Country
EUR-9
Germany France Italy Netherlands Belgium Luxembourg United Kingdom Ireland Denmark
Greece Turkey Norway Sweden Switzerland Austria Portugal Finland Spain USSR USA Canada Japan (a)
World
Passengers cars
Production
9 271.2
2 840.1 3 045.2 1 631.3
69.0 151.5
0 1 534.1
0 0
0
0 326.7
0.2 1.5
0 0
704.6 1 119.0 7 324.5 1 184.9 3 931.8
25 566.2
Assembly
682.5
0 0 0
16.9 605.0
0 0
53.9 6.7
0 0 0 0 0 0
61.5 0 0 0 0 0 0
744
Commerc al motor vehicles
Production
1 271.1
265.4 417.5 141.8
13.1 30.7
0 402.6
0 0
0 0 0
41.6 1.3 7.3
0 0
132.8 727.0
2 746.5 376.4
2 620.0
8 692.3
Assembly
62.4
0 0 0
4.0 49.3
0 0
8.5 0.6
0 0 0 0 0 0
20.1(b) 0 0 0 0 0 0
825
(a) Excl. three-wheeled vehicles. (b) 1973.
99

VI I . INDUSTRY
Table 77
MERCHANT VESSELS UNDER CONSTRUCTION AND LAUNCHED (a)
'000 tons gross
1 2 3 4 5 6 7 8 9
10 11 12 13 14 15 16 17 18 19 20 21 22
Country
EUR-9
Germany France Italy Netherlands Belgium Luxembourg United Kingdom Ireland Denmark
Greece Turkey Norway Sweden Switzerland Austria Portugal Finland Spain USSR USA Canada Japan
World |b)
Under construction
end June 1975
9 853
1 918 1 958 2 130 1 277
206 0
1 976 28
360
171 115 813
1 975 0 5
233 405
1 994
1 772 230
13 541
34 280
Launched in 1974
7 878
2 151 1 349 1 028
723 218
0 1 281
3 1 125
151 18
1 012 2 206
0 0
95 206
1 428
801 142
17 609
34 624
(a) Ships of 100 tons gross or over, excluding ships w i thout engines. (b) Excl. People's Republics of China and USSR.
100

VII. INDUSTRY
PRODUCTION OF TOBACCO 1974
Table 78
1 2 3 4 5 6 7 8 9
10 11 12 13 14 15 16 17 18 19 20 21 22
Country
EUR-9
Germany France Italy Netherlands Belgium Luxembourg United Kingdom Ireland Denmark
Greece Turkey Norway Sweden Switzerland Austria Portugal Finland Spain USSR USA Canada Japan
World
Cigars and cigarillos
(mio)
10 597
2 595 916 130
2 518 2 120
0 1 400
0 918
0 2 0
251 666
64 0 0
465 0
8 372 631(b)
0
29 000
Cigarettes (mio)
537 276
143 179 82 068 66 360 34 167 25 733
3 200 168 200
6 100(b) 8 269
20 679 53 000
645(b) 9 9 1 9
27 995 14 226 11 064
7 370(b) 38 434
362 500 637 000
56 034(b) 292 767
3 700 000
Tobacco ('000 t)
(a)
68.6
7.2 9.9 1.8
22.3 4.6
0* 16.4 2.7(b) 3.8
0 0.1 5.1 6.3 0.9(b) 0.3 0.2 0.9 0.9
0 69.6
8.9(b) 0
390
(a) Smoking and chewing tobacco, snuff. lb) 1973.
101

VI I . INDUSTRY
Table 79
PRODUCTION OF COTTON AND WOOLLEN YARNS AND FABRICS (a)
1973
'000 t
I 2 3 4 5 6 7 8 9
10 11 12 13 14 15 16 17 18 19 20 21 22
Country
EUR-9
Germany France Italy Netherlands Belgium Luxembourg United Kingdom Ireland Denmark
Greece Turkey Norway Sweden Switzerland Austria Portugal Finland Spain USSR USA Canada Japan
World
Cotton
Yarns
1 212
390.9 280.4 237.3
39.2 90.7
0 165.6
5.1 2.7
68.4 260.0
6.0 8.0
39.1 49.8
120.1 14.9
143.2 1 535.0 1 591.0
99.0 511.0
Fabrics
842
256.1 198.3 170.9 67.1 72.5
0 72.0
2.9 1.7
32.3 143.0
6.4 7.9
24.1 27.9 94.9 15.5
130.4 1 012.0
757.0 19.0(b)
300.0(b)
Wool
Yarns
1062
136.4 151.8 420.5
18.8 83.9
0 235.2
12.6 2.4
12.1 3.1 5.1 3.3
16.9 19.7 33.7
3.4(b) 47.5
393.0 454.0
16.2(b) 198.4
Fabrics
391
47.7 65.7
165.9 16.1 12.5
0* 79.9
1.9 1.5
2.1 3.1 8.3 9.0
12.2 2.4(b)
39.0
44.7 9 7
143.1
(a) The figures in this table must be treated wi th great reserve as regards comparabil i ty between countries. National statistics are far f rom consistent in their inclusion of mixed yarns and fabrics
(b) 1972.
102
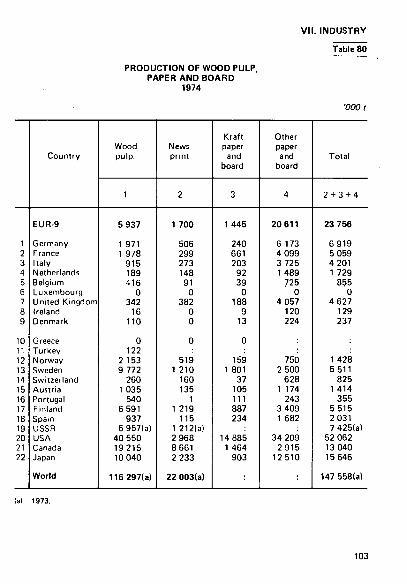
V I I . INDUSTRY
PRODUCTION OF WOOD PULP, PAPER AND BOARD
1974
Table 80
'000 t
1 2 3 4 5 6 7 8 9
10 11 12 13 14 15 16 17 18 19 20 21 22
Country
EUR-9
Germany France Italy Netherlands Belgium Luxembourg United Kingdom Ireland Denmark
Greece Turkey Norway Sweden Switzerland Austria Portugal Finland Spain USSR USA Canada Japan
World
Wood pulp.
1
5 937
1 971 1 978
915 189 416
0 342
16 110
0 122
2 153 9 772
260 1 035
540 6 591
937 6 957(a)
40 550 19215 10 040
116 297(a)
Newsprint
2
1 700
506 299 273 148 91
0 382
0 0
0
519 1 210
160 135
1 1 219
115 1 212(a) 2 968 8 661 2 233
22 003(a)
Kraft paper
and board
3
1 445
240 661 203
92 39
0 188
9 13
0
159 1 801
37 105 111 887 234
14 885 1 464
903
Other paper and
board
4
20 611
6 173 4 099 3 725 1 489
725 0
4 057 120 224
750 2 500
628 1 174
243 3 409 1 682
34 209 2 9 1 5
12510
Total
2 + 3 + 4
23 756
6 919 5 059 4 201 1 729
855 0
4 627 129 237
1 428 5 511
825 1 414
355 5 515 2 031 7 425(a)
52 062 13 040 15 646
147 558(a)
103

VII. INDUSTRY
Table 81
GENERAL INDICES OF INDUSTRIAL PRODUCTION (a) 1970 = 100
1 2 3 4 5 6 7 8 9
10 11 12 13 14 15 16 17 18 19 20 21 22
Country
EUR-9
Germany France Italy Netherlands Belgium Luxembourg United Kingdom Ireland Denmark
Greece Turkey Norway Sweden Switzerland Austria Portugal Finland Spain USSR USA Canada Japan
World lb)
1967
81
76 80 86 73 84 83 90 80 81
76
89 83 81 77
76 74 80 94 86 66
83
1968
87
83 84 91 82 88 88 96 89 87
81
92 88 85 83 82 80 80 86 99 92 76
89
1969
95
94 95 94 91 97
100 99 95 98
91
96 94 92 92 90 91 91 92
104 97 88
96
1970
100
100 100 100 100 100 100 100 100 100
100 100 100 100 100 100 100 100 100 100 100 100 100
100
1971
102
102 104 100 106 102
99 100 104 104
111
104 101 102 106 93
102 103 108 100 106 103
104
1972
107
106 111 104 111 109 103 102 108 112
127
109 104 104 114 113 114 119 115 108 113 110
112
1973
115
113 119 115 118 116 115 111 119 117
. 147
115 111 110 120 112 121 137 123 117 122 127
122
1974
115
112 122 119 121 121 119 108 122 120
144
119 118 111 126
123 150 134 117 126 124
(a) Excl. construct ion. (b) Excl. People's Rep. of China, Mongolia, Dem. People's Rep. of Korea and Oem. Rep. of
Vietnam.
104
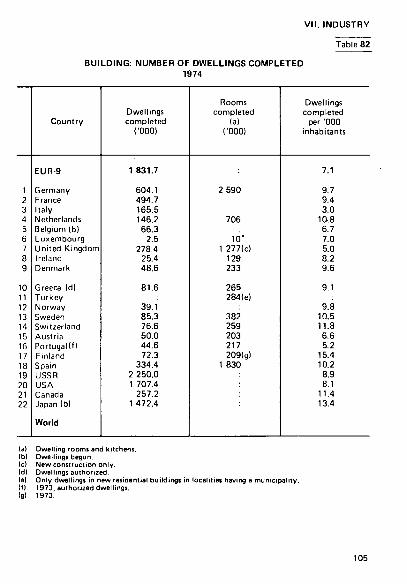
VI I . INDUSTRY
Table 82
BUILDING: NUMBER OF DWELLINGS COMPLETED 1974
1 2 3 4 5 6 7 8 9
10 11 12 13 14 15 16 17 18 19 20 21 22
Country
EUR-9
Germany France Italy Netherlands Belgium (b) Luxembourg United Kingdom Ireland Denmark
Greece (d) Turkey Norway Sweden Switzerland Austria Portugal (f l Finland Spain USSR USA Canada Japan (b)
World
Dwellings completed
(ΌΟ0)
1 831.7
604.1 494.7 165.5 146.2 66.3
2.5 278.4
25.4 48.6
81.6
39.1 85.3 76.6 50.0 44.6 72.3
334.4 2 250.0 1 707.4
257.2 1 472.4
Rooms completed
(a) (Ό00)
2 590
706
10" 1 277(c)
129 233
265 284(e)
382 259 203 217 209(g)
1 830
Dwellings completed
per '000 inhabitants
7.1
9.7 9.4 3.0
10.8 6.7 7.0 5.0 8.2 9.6
9.1
9.8 10.5 11.8 6.6 5.2
15.4 10.2
8.9 8.1
11.4 13.4
(a) Dwelling rooms and kitchens. (b) Dwellings begun. (c) New construction only. (d) Dwellings authorized. (e) Only dwellings in new residential buildings in localities having a municipal i ty. (f) 1973, authorized dwellings. (g) 1973.
105
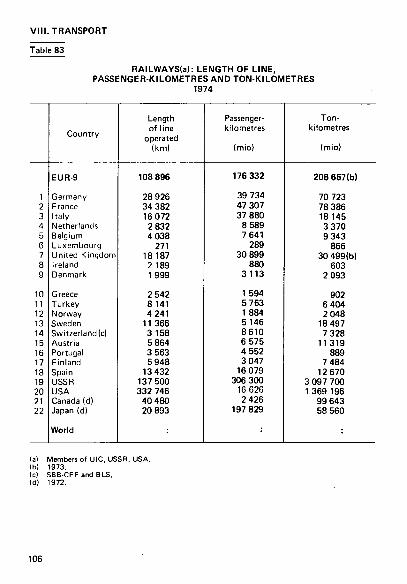
VIII. TRANSPORT
Table 83
RAILWAYS(a): LENGTH OF LINE, PASSENGER-KILOMETRES AND TON-KILOMETRES
1974
1 2 3 4 5 6 7 8 9
10 11 12 13 14 15 16 17 18 19 20 21 22
Country
EUR-9
Germany France Italy Netherlands Belgium Luxembourg United Kingdom Ireland Denmark
Greece Turkey Norway Sweden Switzerland (c) Austria Portugal Finland Spain USSR USA Canada(d) Japan (d)
World
Length of line
operated (km)
108 896
28 926 34 382 16 072
2 832 4 038
271 18 187
2 189 1 999
2 542 8 141 4 241
11 366 3 158 5 864 3 563 5 948
13 432 137 500 332 746
40 480 20 893
Passenger-kilometres
(mio)
176 332
39 734 47 307 37 880
8 589 7 641
289 30 899
880 3113
1 594 5 753 1 884 5 146 8610 6 575 4 552 3 047
16 079 306 300
16 626 2 426
197 829
Ton-kilometres
(mio)
206 657(b)
70 723 78 386 18 145 3 370 9 343
866 30 499(b)
603 2 093
902 6 404 2 048
18 497 7 328
11319 889
7 484 12 670
3 097 700 1 369 196
99 643 58 560
(a) Members of UIC, USSR, USA. lb) 1973. (c) SBB-CFFandBLS. (d) 1972.
106
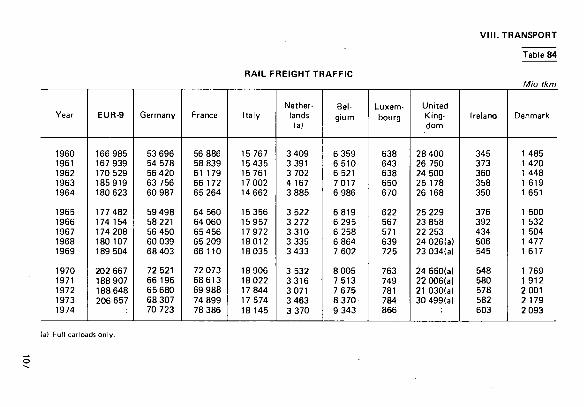
V I I I . TRANSPORT
RAIL FREIGHT TRAFFIC
Table 84
Mio tkm
Year
1960 1961 1962 1963 1964
1965 1966 1967 1968 1969
1970 1971 1972 1973 1974
EUR-9
166 985 167 939 170 529 185919 180 623
177 482 174 154 174 208 180 107 189 504
202 667 188 907 188 648 206 657
Germany
53 696 54 578 56 420 63 756 60 987
59 498 58 221 56 450 60 039 68 403
72 521 66 196 65 680 68 307 70 723
France
56 886 58 839 61 179 66 172 65 264
64 560 64 060 65 456 65 209 66 110
72 073 68613 69 988 74 899 78 386
Italy
15 767 15 435 15 761 17 002 14 662
15 356 15 957 17 972 18012 18 035
18 906 18 022 17 844 17 574 18 145
Netherlands la)
3 409 3 391 3 702 4 167 3 885
3 522 3 272 3 310 3 335 3 433
3 532 3316 3 071 3 463 3 370
Belgium
6 359 6510 6 521 7017 6 986
6819 6 295 6 258 6 864 7 602
8 005 7 513 7 675 8 370 9 343
Luxembourg
638 643 638 650 670
622 567 571 639 725
763 749 781 784 866
United Kingdom
28 400 26 750 24 500 25 178 26 168
25 229 23 858 22 253 24 026(a) 23 034(a)
24 550(a) 22 006(a) 21 030(a) 30 4991a)
Ireland
345 373 360 358 350
376 392 434 506 545
548 580 578 582 603
Denmark
1 485 1 420 1 448 1 619 1 651
1 500 1 532 1 504 1 477 1 617
1 769 1 912 2 001 2 179 2 093
(a) Full carloads only.

VIII. TRANSPORT
Table 85
INLAND WATERWAYS 1974
1 2 3 4 5 6 7 8 9
10 11 12 13 14 15 16 17 18 19 20 21 22
Country
EUR-9
Germany France Italy Netherlands Belgium Luxembourg United Kingdom Ireland Denmark
Greece Turkey Norway Sweden Switzerland Austria Portugal Finland Spain USSR USA Canada Japan
World
Length of inland
waterways in use (km)
4 506 8 568 2 237 4 787 1 533
37 569
Ó 736
21 358
6 675
154 798
Vessels
Number
4 937 6614
19 529 4611
16 56
0
465 213
n service
Capaci ('000 1
4 3 i : 2 92S
7 14 2 44C
K 1É
C
Ton-kilo
metres 1 (mio)
! 50 972 1 13 738
33 197 6 853
0
108

VIII. TRANSPORT
CIVIL AVIATION 1973
Source; I A T A , World Air Transport Statistics, 1973. (a) I A T A member only. (b) International and domestic scheduled services. (c) Leased aircraft included. (d) Norway, Denmark and Sweden (SAS Company).
Table 86
1 2 3 4 5 6 7 8 9
10 11 12 13 14 15 16 17 18 19 20 .»1 22
Country
EUR-9 EUR-6
Germany France Italy Netherlands Belgium Luxembourg United Kingdom Ireland Denmark (d)
Greece Turkey Norway (d) Sweden(d) Switzerland Austria Portugal Finland Spain USSR USA Canada Japan
World
Number of
airlines (a)
6
1 2 1 1 1 0 3 1
1 1
1
1 1 1 1 1
14 4 1
Number of
aircraft
368(c)
81 129(c)
81 54 23
0 211
15
45 18
74
43(c) 9
22 26 79
1 872(c) 189(c)
86
Passen-ger-km (mio)
(b)
51 516
11 106 17 846 9 783 9 071 3 710
0 25 167
1 756
3 731 1 649
7 469
6 728 579
3 621 1 060 8 991
238 011 20 652 15 999
Available seat/km
(mio) (bl
91 995
20 131 30 419 18 051 16 805 6 589
0 43 868
2 673
6 360 2 931
14 234
11 939 1 221 6 248 2 198
15914
457 049 31 660 25 107
Load factor
%
56
55 59 54 54 56
0 57 66
59 56
52
56 47 58 48 56
52 65 64
109

VIII. TRANSPORT
Table 87
MERCHANT FLEETS (a) 1 July 1974
1 2 3 4 5 6 7 8 9
10 11 12 13 14 15 16 17 18 19 20 21 22
23
24
Country
EUR-9
Germany France Italy Netherlands Belgium Luxembourg United Kingdom Ireland Denmark
Greece Turkey Norway Sweden Switzerland Austria Portugal Finland Spain USSR USA Canada Japan
Liberia
Panama
World
Total merchant
fleet 1974 '000 tons gross
69 088
7 980 8 835 9 322 5 501 1 215
0 31 566
209 4 460
21 759 972
24 853 6 227
200 97
1 243 1 508 4 949
18 176 14 429
2 460 38 708
55 322
11 003
311323
Mean trend
1967-1974 %p.a.
5.3
4.4 7.1 5.9 0.1 4.1
0 5.9
5.5
18.4
4.5 3.9
5.7 10.4
7.8 - 5.4
0.5 13.0
14.0
13.0
8.1
% share of world oil tanker
fleet
24.4
1.7 4.3 2.8 1.9 0.3
0 11.7 0.0* 1.7
5.8 0.3 9.4 1.7 0.0* 0.0* 0.4 0.6 1.7 2.8 3.8 0.2
12.4
26.1
3.6
129 491(b)
Source: Lloyd's Register of Shipping -(a) Excl. ships under 100 tons gross. (b) '000 tons gross.
Statistical Tables, 1974.
110

V I I I . TRANSPORT
Table 88
MERCHANT SHIPPING International traffic
1973 Mio t
1 2 3 4 5 6
/ 8 9
10 11 12 13 14 15 16 17 18 19 20 21 22
Country
EUR-9
Germany France Italy Netherlands Belgium Luxembourg United Kingdom Ireland (a) Denmark
Greece Turkey Norway Sweden Switzerland Austria Portugal Finland Spain USSR USA Canada Japan
World
Receptions
Tota
no.; 187.Í 237.: 261.Í
62.:
c 222.É
29.: 33.:
25.: 16.C
44.e t t
10.' 24.' 74.
of which: from
Community countries (EUR-9)
26.7 10.0 10.7
1 17.3 5.2
I 0 40.0
> : .
)
0 ) 0
) 1
Expeditions
Tota
27.Í 30. : 37.C 88.1 37.1
C 56.4 20.2
8.:
8.E 4.£
31.7 C 0
3.6 12.8 15.2
of which: to
Community countries (EUR-9)
1 6.7 11.8 13.4 54.6
8.9 0
16.2
. : :
0 0
Source for non-member countries: Economic Commission for Europe, Geneva. (a) Incl. Bantry Bay crude oi l transhipments of 17,2 mio t .
111
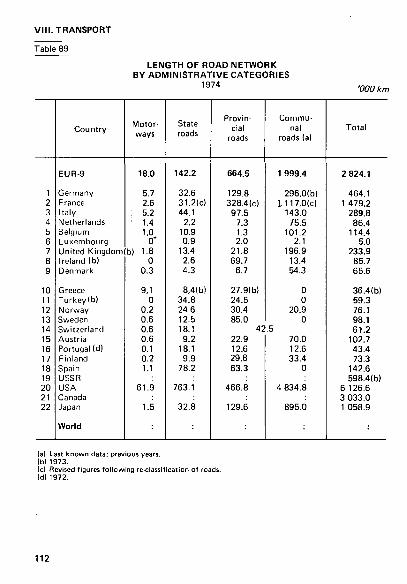
VIII. TRANSPORT
Table 89
LENGTH OF ROAD NETWORK BY ADMINISTRATIVE CATEGORIES
1974 '000 km
1
2
3 4
5
6
7
8
9
10
11
12
13
14
15
16 17
18
19
20
21
22
Country
EUR9
Germany
France
Italy
Netherlands
Belgium Luxembourg
United Kingdom
Ireland (b)
Denmark
Greece Turkey(b)
Norway
Sweden
Switzerland
Austria Portugal (d)
Finland
Spain
USSR USA
Canada
Japan
World
Motor
ways
18.0
5.7
2.6
■ 5.2 : 1.4
1.0 0*
b) 1.8
0
0.3
9,1
0
0.2
0.6
0.6
0.6
0.1
0.2
1.1
61.9
1.5
State
roads
142.2
32.6
31.2(c)
44.1
2.2
10.9 0.9
13.4
2.6
4.3
8,41b)
34.8
24 6
12.5
18.1
9.2
18.1
9.9 78.2
763.1
32.8
Provin
cial
roads
664.5
129.8
328.4(c)
97.5
7.3
1.3 2.0
21.8
69.7
6.7
27.9(b)
24.5
30.4
85.0 42
22.9
12.6 29.8
63.3
466.8
129.6
Commu
nal
roads (a)
1 999.4
296.0(b)
1117.0(c)
143.0
75.5
101.2 2.1
196.9
13.4
54.3
0
0
20.9
0 .5
70.0
12.6
33.4
0
4 834.8
895.0
Total
2 824.1
464.1
1 479.2
289.8
86.4
114.4 5.0
233.9
85.7
65.6
36.4(b)
59.3
76.1
98.1
61.2
102.7
43.4
73.3
142.6
598.4(b)
6 126.6
3 033.0
1 058.9
(a) Last known data; previous years. (b) 1973. (c) Revised figures fol lowing reclassification of roads. Id) 1972.
112

V I I I . TRANSPORT
Table 90
GOODS TRANSPORT
BETWEEN THE COMMUNITY COUNTRIES (EUR6)
1972 ■mo t
^ \ Intake
Departure \ .
Germany
France
Italy
Netherlands
Belgium
Luxembourg
C F
R
M
T
C F
R
M
T
C F
R
M
T
C
F
R
M
T
C F
R
M
T
C
F
R
M
T
Ger
many
10 022
13021 8 117
952
32 112
3 082
0
2310
1 359
6 751
3 798
52 775
10 345
12 297
79 215
2 705
6 623
5 252
1 261
15 841
1 372
383
987
0
2 742
France
10 007
3 398
4814
499 18718
1 821
0
1 562
4 733
8 1 1 6
774
4 256
2 147
2 030
9 207
4 098
4 978
11 049
702
20 827
937
6
(b)
943
Italy
4 462
0 1 394
301
6 157
5 923
0
1 390
3 295
11 148
471
0
469
3 644
4 584
627
0
333
1 037
1 997
119
0
(b)
0
119
Nether
lands
2 504
27 708
10 804
813
41 829
392
3 291
1 426 1 249
6 358
298
0
298
2 776
3 372
1 900
8 337
219
10 456
(b)
(b) (b)
0
Bel
gium
3 038
8 406
3 822
345
15611
7 852
4 859
6 622
546
19 879
451
0 297
638
1 386
730
22 183
5 734
1 457
30 104
1 484
(b)
(b)
0
1 484
Luxem
bourg
3 745
362
(a)
0
4 107
3 120
244
(a)'
0
3 364
2
0
(al 0
2
9
159
(a)
0
168
1 599
21
0
1 620
Total
23 756 39 874
20 834
1 958
86 422
27 309
21 415
18 095
6 042
72 861
5 654
0
4 467
9 506
19 627
5 782
79 373
18 695
19 428
123 278
10 929
19 969
16 634
3 219
50 741
3 9 1 2
389
987
0
5 288
(a) Included in ' Intake Belgium'.
(b) Included in 'Departure Belgium'. C = rai lway; F = shipping (rivers and lakes) ; R
: road; M = seashipping; T = C + F + R + M = total .
113

VIII. TRANSPORT
(a) Died w i th in 30 days fo l lowing the accident w i th exception of : - France: Wi th in 6 days - I taly: Within 7 days - Belgium: Unt i l 1970, ki l led on the spot. 'As the definition of 'persons killed' is not the same from one country to an
other, BUROSTAT has estimated adjustments of some national figures.
Table 91
Year
1965 1970 1971 1972 1973 1974
1965 1970 1971 1972 1973 1974
1965 1970 1971 1972 1973 1974
1965 1970 1971 1972 1973 1974
EUR-9
1 146 365 1 209 894 1 216 359 1 265 521 1 226 464 1 145 141
53 619" 62 553' 63 808" 65 773" 60 937" 53 845"
1 524 063" 1 644 981" 1 656 249" 1 726 546' 1 663 395" 1 524 821"
1 577 682" 1 707 534* 1 720 057" 1 792 319" 1 724 332* 1 578 666*
Germany
316 361 377 610 369 177 378 775 353 725 331 000
15 753 19 193 18 753 18811 16 302 14614
433 490 531 795 518 059 528 527 488 246 447 142
449 243 550 988 536 812 547 338 504 548 461 756
France
210 754 228 050 242 464 259 954 261 212 251 378
12150 15 034 16 061 16 545 15 469 13 327
290 256 321 556 345 463 371 818 366 310 344 320
302 406 336 590 361 524 388 363 381 779 357 647
R O A D TRAFFIC
Italy Netherlands
Accidents involving
166 093 173 132 183 302 198 205 196 352 175 126
8 990 10 208 10 104 11078 10 728 9 597
219 533 228 236 244 493 267 774 265 534 234 253
228 523 238 444 254 597 278 852 276 262 243 850
54 896 58 883 62 253 60 325 60 256 57 347 Deaths (a)
2 479 3 181 3 167 3 264 3 092 2546
Persons
61887 68 225 72 167 70 082 70 361 66 212
Total
64 366 71 406 75 334 73 346 73 453 68 758
114

VIII. TRANSPORT
ACCIDENTS
Belgium
personal injury
73 277 76 968 71 841 75 883 66 427 63 539
2 400 2 949 3014 3 072 2915 2 665
injured
98 386 104 828 96 488 103 456 94 745 87 821
casualties
100 786 107 777 99 502 106 528 97 660 90 486
Luxembourg
1 747 1 607 1 602 1 805 1 817 1 886
83 132 86 107 108 127
2 594 2 367 2 383 2 629 2 844 2 765
2 677 2 499 2 469 2 736 2 952 2 892
United Kingdom
299 229 267 457 258 727 265 106 262 413 244 259
7 952 7 499 7 699 7 763 7 406 6 883
389 985 355 866 344 328 351 914 346 332 318 035
397 937 363 365 352 027 359 677 353 738 324 918
Ireland
4 076 6 405 6 486 6 223 6 020 5 632
356 540 576 640 592 594
5311 9 269 9 629 8 954 8 760 8 228
5 667 9 809 10 205 9 594 9 352 8 882
Denmark
19 932 19 782 20 507 19 245 18 242 14 974
1 010 1 208 1 213 1 116 1 132 766
25 067 25 448 26 374 24 769 23 456 18 711
26 077 26 656 27 587 25 885 24 588 19 477
Table 91
Number
Year
1965 1970 1971 1972 1973 1974
1965 1970 1971 1972 1973 1974
1965 1970 1971 1972 1973 1974
1965 1970 1971 1972 1973 1974
115

IX. EXTERNALTRADE
Table 92
TOTAL
1 2 3 4 5 6 7 8 9
10 11 12 13 14 15 16 17 18 19 20 21 22
Country
EUR-9
Germany France Italy Netherlands Belgium Luxembourg United Kingdom Ireland Denmark
Greece Turkey Norway Sweden Switzerland Austria Portugal Finland Spain USSR USA Canada Japan
World (a)
1966
74 382
18 023 11 875
8 589 8017
} 7174
16 671 1 043 2 990
1 223 725
2 403 4 574 3 957 2 327 1 012 1 726 3 591 7 913
25 367 9 127 9 523
192 200
1967
76 993
17 351 12 377 9 827 8 337
7 176
17714 1 077 3 134
1 186 691
2 746 4 703 4 1 1 0 2 309 1 013 1 696 3 484 9 220
26 732 10 250 11 663
201 300
1968
85 335
20 150 13 927 10 286
9 293
8 333
18 959 1 175 3 213
1 392 770
2 706 5 122 4 502 2 497 1 039 1 592 3 522 9410
32 992 11 439 12 987
224 500
1969
100 763
24 926 17 222 12 467 10 991
9 989
19 956 1 413 3 800
1 594 754
2 943 5 899 5 266 2 825 1 298 2 023 4 202
10 327 36 052 13 136 15 024
255 800
1970
116 139
29 814 18 922 14 970 13 393
11 362
21 723 1 569 4 385
1 958 885
3 697 7 005 6 467 3 549 1 556 2 637 4 747
11 739 39 963 13 308 18 881
293 300
(a) Excl. the Centrally Planned Economies but incl. USSR.
116
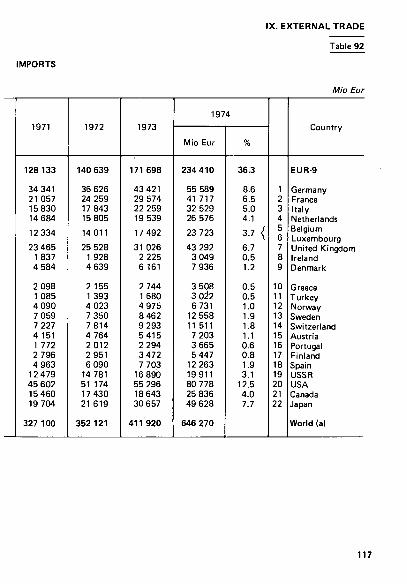
IX. EXTERNALTRADE
IMPORTS
Table 92
Mio Eur
1971
128 133
34 341 21 057 15 830 14 684
12 334
23 465 1 837 4 584
2 098 1 085 4 090 7 059 7 227 4 151 1 772 2 796 4 963
12 479 45 602 15 460 19 704
327 100
1972
140 639
36 626 24 259 17 843 15 805
14 011
25 528 1 928 4 639
2 155 1 393 4 023 7 350 7814 4 764 2 012 2 951 6 090
14 781 51 174 17 430 21 619
352 121
1973
171 698
43 421 29 574 22 259 19 539
17 492
31 026 2 225 6 161
2 744 1 680 4 975 8 462 9 293 5415 2 294 3 472 7 703
16 890 55 296 18 643 30 657
411 920
1974
Mio Eur
234 410
55 589 41 717 32 529 26 576
23 723
43 292 3 049 7 936
3 508 3 022 6 731
12 558 11 511 7 203 3 665 5 447
12 263 19911 80 778 25 836 49 628
646 270
%
36.3
8.6 6.5 5.0 4.1
3.7 {
6.7 0.5 1.2
0.5 0.5 1.0 1.9 1.8 1.1 0.6 0.8 1.9 3.1
12.5 4.0 7.7
1 2 3 4 5 6 7 8 9
10 11 12 13 14 15 16 17 18 19 20 21 22
Country
EUR-9
Germany France Italy Netherlands Belgium Luxembourg United Kingdom Ireland Denmark
Greece Turkey Norway Sweden Switzerland Austria Portugal Finland Spain USSR USA Canada Japan
World (a)
117

IX. EXTERNAL TRADE
Table 93
TOTAL
1 2 3 4 5 6 7 8 9
10 11 12 13 14 15 16 17 18 19 20 21 22
Country
EUR-9
Germany France Italy Netherlands Belgium Luxembourg United Kingdom Ireland Denmark
G reece Turkey Norway Sweden Switzerland Austria Portugal Finland Spain USSR USA Canada Japan
World la)
1966
70 394 20 134 10 897 8 038 6 750
} 6 829 14 661
682 2 402
406 491
1 562 4 273 3 305 1 683 627
1 505 1 254 8 841 29 899 9 551 9 776
180 800
1967
73 769 21 736 11 377 8 705 7 288 7 032 14 372
784 2 474
495 523
1 736 4 528 3 504 1 808 685
1 534 1 384 9 652 31 147 10 555 10 441
189 600
1968
82 871 24 842 12612 10 186 8 341 8 164 15 346
798 2 582
468 496
1 938 4 937 4 021 1 989 732
1 635 1 589 10 634 33 982 12 556 12 972
212 100
1969
96 434
29 052 '14 880 11 729 9 965 10 065 16 894
891 2 958
554 537
2 203 5 688 4 609 2412 853
1 985 1 900
11 655 37 444 13 754 15 990
242 900
1970
112 182 34 189 17 739 13 206 11 767 11 609 19 351 1 035 3 290
643 589
2 455 6 782 5 137 2 857 946
2 306 2 387 12 800 43 226 16 134 19318
279 100
la) Excl. the Centrally Planned Economies but incl. USSR.
118
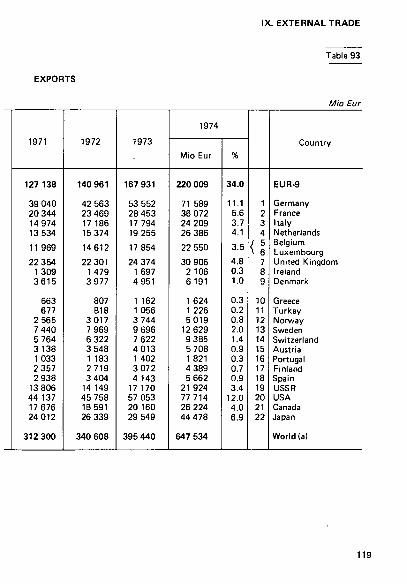
IX. EXTERNAL TRADE
EXPORTS
Table 93
Mio Eur
1971
127 138
39 040 20 344 14 974 13 534
11 969
22 354 1 309 3 6 1 5
663 677
2 565 7 440 5 764 3 138 1 033 2 357 2 938
13 806 44 137 17 676 24 012
312 300
1972
140 961
42 563 23 469 17 186 15 374
14612
22 301 1 479 3 977
807 818
3 017 7 969 6 322 3 548 1 183 2719 3 404
14 149 45 758 18 591 26 339
340 608
1973
167 931
53 552 28 453 17 794 19 255
17 854
24 374 1 697 4 951
1 162 1 056 3 744 9 696 7 622 4 0 1 3 1 402 3 072 4 143
17 170 57 053 20 160 29 549
395 440
1974
Mio Eur
220 009
71 589 36 072 24 209 26 386
22 550
30 906 2 106 6 191
1 624 1 226 5019
12 629 9 385 5 708 1 821 4 389 5 662
21 924 77 714 26 224 44 478
647 534
%
34.0
11.1 5.6 3.7 4.1
3.5
4.8 0.3 1.0
0.3 0.2 0.8 2.0 1.4 0.9 0.3 0.7 0.9 3.4
12.0 4.0 6.9
1 2 3 4
< 5 t 6
7 8 9
10 11 12 13 14 15 16 17 18 19 20 21 22
Country
EUR-9
Germany France Italy Netherlands Belgium Luxembourg United Kingdom Ireland Denmark
Greece Turkey Norway Sweden Switzerland Austria Portugal Finland Spain USSR USA Canada Japan
World (a)
119

IX. EXTERNALTRADE
Table 94
VOLUME INDEX OF EXTERNAL TRADE IMPORTS (a) EXTRA EC
Year EUR-9 EUR-6 Germany France Italy Nether
lands
Belgium/ Luxembourg
United Kingdom
Ireland Denmark
EUR-6: 1963 = 100
1960 1961 1962 1963 1964 1965 1966 1967 1968 1969 1970 1971 1972
77 82 91 100 107 112 120 121 135 152 184 185 196
76 82 93 100 112 130 133 129 152 181 207 242 209
72 78 88 100 114 115 131 136 159 191 206 220 205
62 70 82 100 92 93 107 120 129 152 180 177 166
78 86 91 100 115 120 129 135 152 178 203 218 192
78 81 88 100 113 123 138 139 161 188 205 215 195
1973 1974
119 113
117 115
EUR-9: 1970 = 142 138
107 95
100 124 117
114 127
112 102
163 126
127 109
(β) See alio page 116, 'Total importi'.

IX. EXTERNALTRADE
Table 95
VOLUME INDEX OF EXTERNAL TRADE EXPORTS (a) EXTRA EC
Year EUR-9 EUR-6 Germany France Italy Nether
lands
Belgium/ Luxembourg
United Kingdom
Ireland Denmark
EUR-6: 1 9 6 3 = 1 0 0
1960 1961 1962 1963 1964 1965 1966 1967 1968 1969 1970 1971 1972
93 95 96 100 109 121 131 141 160 172 188 202 221
82 88 92 100 111 120 134 145 168 190 206 231 229
85 91 91 100 107 117 125 132 148 171 201 216 201
72 87 96 100 117 143 163 176 210 230 241 255 250
85 89 93 loo 115 123 132 142 161 192 219 249 199
76 80 89 100 113 129 134 140 163 192 215 219 213
- (al
1973 1974
122 137
120 141
EUR-9 : 1970 = 129 153
118 139
100 134 147
140 157
118 120
107 125
119 132
See also page 118, To ta t exports

IX. EXTERNALTRADE
Table 96
BALANCE
1 2 3 '1 5 6 7 8 9
10 11 12 13 14 15 16 17 18 19 20 21 22
Country
EUR-9
Germany France Italy Netherlands Belgium Luxembourg United Kingdom Ireland Denmark
Greece Turkey Norway Sweden Switzerland Austria Portugal Finland Spain USSR USA Canada Japan
1967
- 3 224
+4 385 - 1 000 - 1 122 - 1 049
} - 144
- 3 342 - 293 - 660
- 691 - 168 - 1 010 - 175 - 606 - 501 - 328 - 162 - 2 100 + 432 + 4 4 1 5 + 305 - 1 222
1968
- 2 464
+4 692 - 1 315
. - 100 - 952
- 169
- 3 613 - 377 - 631
- 924 - 274 - 798 - 185 - 481 - 508 - 307 - 43 - 1 933 + 1 224 + 990 + 1 117 - 15
1969
- 4 330
+ 4 126 - 2 342 - 738 - 1 026
+ 76
- 3 062 - 522 - 842
- 1 040 - 217 - 740 - 211 - 657 - 413 - 445 - 38 - 2 302 + 1 328 + 1 392 + 618 + 966
1970
- 3 953
+4 375 - 1 184 - 1 763 - 1 626
+ 247
- 2 372 - 534 - 1 095
- 1 315 - 296 - 1 242 - 223 - 1 330 - 692 - 610 - 331 - 2 360 + 1 061 + 3 263 + 2 826 + 437
+ denotes export surplus. — denotes import surplus.
122

IX. EXTERNAL TRADE
OFTRADE
Table 96
Mio Eur
1971
- 995
+ 4 699
- 713
- 856
- 1 151
- 366
- 1 111
- 528
- 969
- 1 435
- 408
- 1 525
+ 381 - 1 463
- 1 013
- 739 - 439
- 2 025
+ 1 327
' - 1 465
+ 2216
+4 308
1972
+ 322 .
+ 5 937
- 790
- 657
- 431
+ 601
- 3 227
- 449
- 662
- 1 348
- 575
- 1 006
+ 619 - 1 492
- 1 216
- 829
- 232
- 2 686
- 632
- 5 4 1 6
+ 1 161
+ 4 720
1973
- 3 767
+ 10 132
- 1 122
- 4 465
- 284
+ 361
- 6 652
- 527
- 1 210
- 1 582
- 624
- 1 231
+ 1 234
- 1 671
- 1 402
- 892
- 400
- 3 560
+ 280
+ 1 757
+ 1 517
+ 1 108
1974
- 1 4 401
+ 16 000
- 5 645
- 8 320
- 190
- 1 173 {
- 1 2 386
"■ - 943
- 1 745
- 1 884
- 1 796
- 1 712
+ 71
- 2 126
- 1 495 - 1 844
- 1 058
- 6 601
+ 2 013
- 3 065
+ 388
- 5150
1
2
3
4
5
6
7
8
9
10
11
12
13
14
15
16
17
18
19
20
21
22
Country
EUR-9
Germany
France
Italy
Netherlands
Belgium
Luxembourg
United Kingdom
Ireland
Denmark
Greece
Turkey
Norway
Sweden
Switzerland
Austria
Portugal
Finland
Spain
USSR
USA
Canada
Japan
123

IX. EXTERNALTRADE
Table 97
IMPORTS FROM MEMBER COUNTRIES OF EC (EUR-9)
1 2 3 4 5 6 7 8 9
10 11 12 13 14 15 16 17 18 19 20 21 22
Country
EUR-9
Germany France Italy Netherlands Belgium Luxembourg United Kingdom Ireland Denmark
Greece Turkey Norway Sweden Switzerland Austria Portugal Finland Spain USSR USA Canada Japan
Mio
1973
88 817
22 675 16 398 10 877 11 923
12 358
10 164 1 596 2 826
1 391 923
2 248 4 683 6 387 3 494 1 037 1 418 3 302 3 375
12 413 1 985 2 542
Eur
1974
110 167
26 726 20 038 13831 15 250
15 640
12 988 2 082 3612
1 518 1 366 2 818 6 732 7 664 4 430 1 595 1 994 4 396 3 414
15 367 2 491 3 178
%(
1973
51.7
52.2 55.4 48.0 61.0
70.6
32.8 71.7 45.9
50.7 54.9 45.2 55.3 68.7 64.5 45.2 40.8 42.9 20.0 22.4 10.6 8.3
a)
1974
47.0
48.1 48.0 42.5 57.4
65.9
30.0 68.3 45.5
43.3 45.2 41.9 53.6 66.6 61.5 43.5 36.6 35.8 17.1 19.0 9.6 6.4
(a) Percentage share of total imports of import ing country.
124

IX. EXTERNALTRADE
EXPORTS TO MEMBER COUNTRIES OF EC (EUR-9)
Table 98
1 2 3 4 5 6 7 8 9
10 11 12 13 14 15 16 17 18 19 20 21 22
Country
EUR-9
Germany France Italy Netherlands Belgium Luxembourg United Kingdom Ireland Denmark
Greece Turkey Norway Sweden Switzerland Austria Portugal Finland Spain USSR USA Canada Japan
Mio
1973
88 565
25 235 15 964 8918
13 968
13 043
7 884 1 292 2 261
639 490
1 773 4 885 3 473 1 972
681 1 422 1 980 3 6 1 8
13 399 2 527 3 521
Eur
1974
111 536
32 146 19 434 10 977 18 656
15 774
10 308 1 575 2 666
813 574
2 354 6 055 4 148 2 531
878 1 899 2 684 3 548
16 981 3 296 4 780
%(
1973
52.7
47.1 56.1 50.1 72.6
73.1
32.3 76.0 45.6
55.0 46.4 47.4 50.4 45.6 49.1 48.6 46.3 47.9 21.1 23.4 12.5 11.9
a)
1974
50.7
44.9 53.9 45.3 .70.7
70.0
33.4 74.8 43.1
50.1 46.8 46.9 47.9 44.2 44.3 48.2 43.3 47.4 16.2 21.9 12.6 10.7
(a) Percentage share of total exports of exporting country.
125
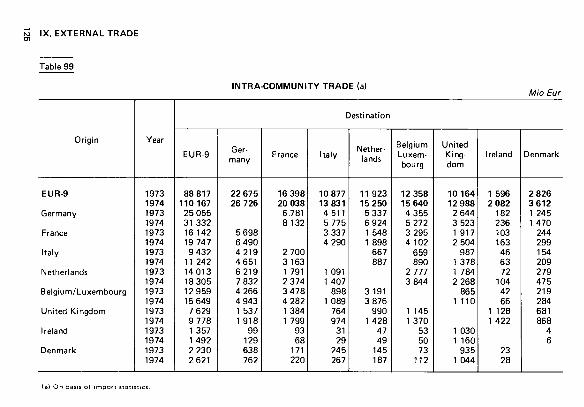
M IX. EXTERNAL TRADE
Table 99
INTRA-COMMUNITY TRADE (a) Mio Eur
Origin
EUR-9
Germany
France
Italy
Netherlands
Belgium/Luxembourg
United Kingdom
Ireland
Denmark
Year
1973 1974 1973 1974 1973 1974 1973 1974 1973 1974 1973 1974 1973 1974 1973 1974 1973 1974
Destination
EUR-9
88 817 110 167
25 055 31 332 16 142 19 747
9 432 11 242 14013 18 305 12 959 15 649
7 629 9 778 1 357 1 492 2 230 2 621
Germany
22 675 26 726
5 698 6 490 4219 4 651 6219 7 832 4 266 4 943 1 537 1 918
99 129 638 762
France
16 398 20 038
6.781 8 132
2 700 3 163 1 791 2 374 3 478 4 282 1 384 1 799
93 68
171 220
Italy
10 877 13 831
4511 5 775 3 337 4 290
1 091 1 407
898 1 089
764 974
31 29
245 267
Netherlands
11 923 15 250
5 337 6 924 1 548 1 898
667 887
3 191 3 876
990 1 428
47 49
145 187
Belgium Luxembourg
12 358 15 640
4 355 5 272 3 295 4 102
659 890
2 777 3 844
1 145 1 370
53 50 73
112
United Kingdom
10 164 12 988
2 644 3 523 1 917 2 504
987 1 378 1 784 2 268
865 1 110
1 030 1 160
935 1 044
Ireland
1 596 2 082
182 236 103 163 46 63 72
104 42 66
1 128 1 422
23 28
Denmark
2 826 3 612 1 245 1 470
244 299 154 209 279 475 219 284 681 868
4 6
nport statistic

IX. EXTERNALTRADE
TOTAL IMPORTS BY AREA OF ORIGIN 1974
Table 100
Mio Eur
1 2 3 4 5 6 7 8 9
•10 11 12 13 14 15 16 17 18 19 20 21 22
Importing country
EUR-9
Germany France Italy Netherlands Belgium Luxembourg United Kingdom Ireland Denmark
Greece Turkey Norway Sweden Switzerland Austria Portugal Finland Spain USSR USA Canada Japan
World la)
Total
imports
234 410
55 589 41 717 32 529 26 576
23 723
43 292 3 049 7 936
3 508 3 022 6 731
12 558 11 511 7 203 3 665 5 447
12 263 19911 80 778 25 836 49 628
646 270
Origin:
EUR-9
110 167
26 726 20 038 13 831 15 250
15 640
12 988 2 082 3612
1 518 1 366 2818 6 732 7 664 4 430 1 595 1 994 4 396 3 4 1 4
15 367 2 491 3 178
USA
19 384
4 332 3 262 2 491 2 368
1 541
4 7 1 2 198 481
322 280 548 826 753 207 337 276
1 906 598
— 17 401 10 149
Japan
4 175
1 080 758 351 336
272
1 130 41
207
194 159 419 308 276 102 116 114 278 822
9 964 1 167
Rest of
world
100 684
23 451 17 659 15 856 8 622
6 270
24 462 728
3 636
1 474 1 216 2 946 4 692 2818 2 464 1 617 3 064 5 683
15 077 55 447
4 777 36 301
AOM
6 128
842 2 237
827 432
869
819 36 67
(a) Excl. the trade of the Centrally Planned Economies but ¡nel. USSR.
127

IX. EXTERNALTRADE
Table 101
TOTAL IMPORTS BY AREA OF ORIGIN 1974
1 2 3 4 5 6 7 8 9
10 11 12 13 14 15 16 17 18 19 20 21 22
Importing country
EUR-9
Germany France Italy Netherlands Belgium Luxembourg United Kingdom Ireland Denmark
Greece Turkey Norway Sweden Switzerland Austria Portugal Finland Spain USSR USA Canada Japan
Total im
ports
100
100 100 100 100
100
100 100 100
100 100 100 100 100 100 100 100 100 100 100 100 100
Origin:
EUR-9
47.0
48.1 48.0 42.5 57.4
65.9
30.0 68.3 45.5
43.3 45.2 41.9 53.6 66.6 61.5 43.5 36.6 35.8 17.1 19.0 9.6 6.4
USA
8.3
7.8 7.8 7.7 8.9
6.5
10.9 6.5 6.1
9.2 9.3 8.1 6.6 6.5 2.9 9.2 5.1
15.5 3.0
-67.4 20.5
Japan
1.8
1.9 1.8 1.1 1.3
1.1
2.6 1.3 2.6
5.5 5.3 6.2 2.5 2.4 1.4 3.2 2.1 2.3 4.1
12.3 4.5
Rest of
world
43.0
42.2 42.3 48.7 32.4
26.4
56.5 23.9 45.8
42.0 40.2 43.8 37.4 24.5 34.2 44.1 56.3 46.3 75.7 68.6 18.5 73.1
AOM
2.6
1.5 5.4 2.5 1.6
3.7
1.9 1.2 0.8
128

IX. EXTERNALTRADE
TOTAL EXPORTS BY AREA OF DESTINATION 1974
Table 102
Mio Eur
l 2 3 4 5 6 7 8 9
IO 11 12 13 14 15 16 17 18 19 20 21 22
Exporting country
EUR-9
Germany France Italy Netherlands Belgium Luxembourg United Kingdom Ireland Denmark
Greece Turkey Norway Sweden Switzerland Austria Portugal Finland Spain USSR USA Canada Japan
World
Total ex
ports
220 009
71 589 36 072 24 209 26 386
22 550
30 906 2 106 6 191
1 624 1 226 5019
12 629 9 385 5 708 1 821 4 389 5 662
21 924 77 714 26 224 44 478
647 534
Destination:
EUR-9
111 536
32 146 19 434 10 977 18 656
15 774
10 308 1 575 2 666
813 574
2 354 6 055 4 148 2 531
878 1 899 2 684 3 548
16 981 3 296 4 780
USA
15 175
5 376 1 786 1 842 1 046
1 264
3 307 193 362
98 115 267 674 681
. 199 181 167 664 187
-17 440 10 355
Japan
2 645
1 007 371 258 143
175
598 18 75
25 14 52
142 328
42 28 37 85
958 8'403 1 819
Rest of
world
90 653
33 060 14 481 11 132 6 541
5 337
16 693 320
3 088
688 522
2 346 5 758 4 228 2 936
734 2 286 2 229
17 231 52 330
3 669 29 343
AOM
5 381
762 2 659
472 369
366
612 11
131
129
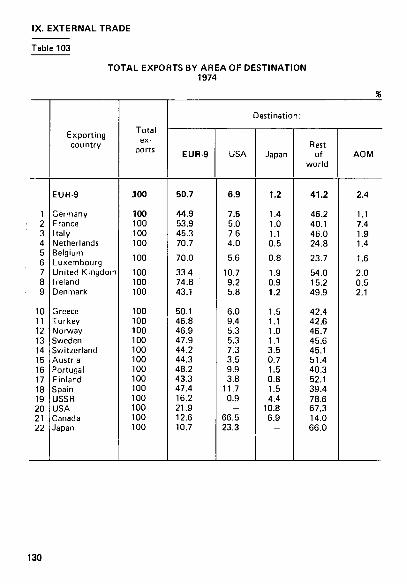
IX. EXTERNALTRADE
Table 103
TOTAL EXPORTS BY AREA OF DESTINATION 1974
1 2 3 4 5 6 7 8 9
10 11 12 13 14 15 16 17 18 19 20 21 22
Exporting country
EUR-9
Germany France Italy Netherlands Belgium Luxembourg United Kingdom Ireland Denmark
Greece Turkey Norway Sweden Switzerland Austria Portugal Finland Spain USSR USA Canada Japan
Total ex
ports
300
100 100 100 100
100
100 100 100
100 100 100 100 100 100 100 100 100 100 100 100 100
Destination:
EUR-9
50.7
44.9 53.9 45.3 70.7
70.0
33.4 74.8 43.1
50.1 46.8 46.9 47.9 44.2 44.3 48.2 43.3 47.4 16.2 21.9 12.6 10.7
USA
6.9
7.5 5.0 7.6 4.0
5.6
10.7 9.2 5.8
6.0 9.4 5.3 5.3 7.3 3.5 9.9 3.8
11.7 0.9
— 66.5 23.3
Japan
1.2
1.4 1.0 1.1 0.5
0.8
1.9 0.9 1.2
1.5 1.1 1.0 1.1 3.5 0.7 1.5 0.8 1.5 4.4
10.8 6.9
Rest of
world
41.2
46.2 40.1 46.0 24.8
23.7
54.0 15.2 49.9
42.4 42.6 46.7 45.6 45.1 51.4 40.3 52.1 39.4 78.6 67.3 14.0 66.0
AOM
2.4
1.1 7.4 1.9 1.4
1.6
2.0 0.5 2.1
130

IX. EXTERNALTRADE
IMPORTS BY GROUPS OF PRODUCTS (a) 1974
Table 104
Mio Eur
1 2 3 4 5 6 7 8 9
10 11 12 13 14 15 16 17 18 19 20 21 22
Importing country
EUR-9
Germany France Italy Netherlands Belgium Luxembourg United Kingdom Ireland Denmark
Greece Turkey (1973) Norway Sweden Switzerland Austria Portugal Finland Spain USSR (1973) USA Canada Japan
World (b)
Total imports
234 410
55 589 41 717 32 529 26 576
23 723
43 292 3 049 7 936
3 508 1 680 6 731
12 558 11 511
7 203 3 665 5 447
12 263 16 890 80 778 25 836 49 628
646 270
Food, beverages
and tobacco
(sees. 0 + 1 )
29 511
7 298 3 730 4 702 3 291
2 367
7 077 371 674
374 42
468 928
1 300 504 622 384
1 457 3 265 8 560 2 019 6 494
Mineral fuels,
lubricants and
related materials (sec. 31
47 565
10 670 9 551 8 658 4 7 1 0
3 370
8 665 424
1 519
779 178 827
2 261 1 150
875 461
1 196 3 121
564 20 280
2713 19918
Crude materials,
oils and fats (sees.
2 + 4)
26 714
6 857 4 291 4 969 2 433
2 539
4 832 224 569
343 79
616 611 571 672 407 373
1 937 1 099 5 166 1 207
11 474
Machinery and
transport equipment
(sec. 7)
. 42 935
8 268 8 906 5 090 5 449
5 337
7 308 667
1 909
987 691
2 278 3 8 1 8 2 653 2 039
943 1 543 2 573 4 402
19 770 11 783 3 431
Other (sees.
5 + 6 + 8 + 9)
87 685
22 496 15 239 9 110
10 693
10 110
15410 1 363 3 265
1 024 690
2 542 4 940 5 836 3 113 1 233 1 952 3 174 7 560
27 001 8 1 1 5 8 3 1 1
(a) Groupes according to the SOEC's Statistical and Tarif f Classification (CST). (b) Excl. the trade of the Centrally Planned Economies but incl. USSR.
131
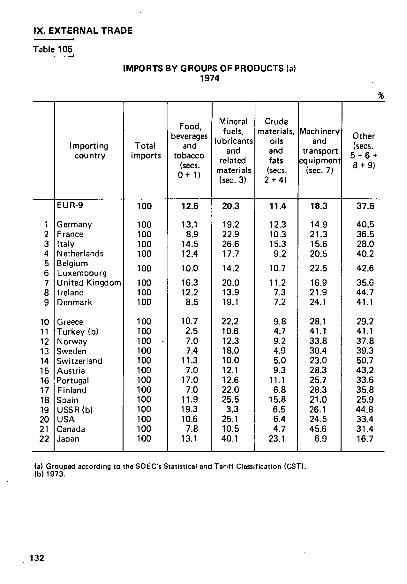
IX. EXTERNALTRADE
Table 105
IMPORTS BY GROUPS OF PRODUCTS (a) 1974
1 2 3 4 5 6 7 8 9
10 11 12 13 14 15 16 17 18 19 20 21 22
Importing country
EUR-9
Germany France Italy Netherlands Belgium Luxembourg United Kingdom Ireland Denmark
Greece Turkey (b) Norway Sweden Switzerland Austria Portugal Finland Spain USSR(b) USA Canada Japan
Total imports
100
100 100 100 100
100
100 100 100
100 100 100 · 100 100 100 100 100 100 100 100 100 100
Food, beverages
and tobacco
(sees. 0 + 1 )
12.6
13.1 8.9
14.5 12.4
10.0
16.3 12.2 8.5
10.7 2.5 7.0 7.4
11.3 7.0
17.0 7.0
11.9 19.3 10.6
7.8 13.1
Mineral fuels,
lubricants and
related materials (sec. 3)
20.3
19.2 22.9 26.6 17.7
14.2
20.0 13.9 19.1
22.2 10.6 12.3 18.0 10.0 12.1 12.6 22.0 25.5 3.3
25.1 10.5 40.1
Crude materials,
oils and fats (sees.
2 + 4)
11.4
12.3 10.3 15.3 9.2
10.7
11.2 7.3 7.2
9.8 4.7 9.2 4.9 5.0 9.3
11.1 6.8
15.8 6.5 6.4 4.7
23.1
Machinery and
transport equipment
(sec. 7)
18.3
14.9 21.3 15.6 20.5
22.5
16.9 21.9 24.1
28.1 41.1 33.8 30.4 23.0 28.3 25.7 28.3 21.0 26.1 24.5 45.6
6.9
Other (sees.
5 + 6 + 8 + 9)
37.5
40.5 36.5 28.0 40.2
42.6
35.6 44.7 41.1
29.2 41.1 37.8 39.3 50.7 43.2 33.6 35.8 25.9 44.8 33.4 31.4 16.7
(a) Grouped according to the SOEC's Statistical and Tariff Classification (CST). (b)1973.
132

IX. EXTERNALTRADE
EXPORTS BY GROUPS OF PRODUCTS (a) 1974
Table 106
Mio Eur
1 2 3 4 5 6 7 8 9
10 11 12 13 14 15 16 17 18 1» 20 21 22
Exporting country
EUR-9
Germany France Italy Netherlands Belgium Luxembourg United Kingdom Ireland Denmark
Greece Turkey (b) Norway Sweden Switzerland Austria Portugal Finland Spain USSR(b) USA Canada Japan
World
Total exports
220 009
71 589 36 072 24 209 26 386
22 550
30 906 2 106 6 191
1 624 1 056 5019
12 629 9 385 5 708 1 821 4 389 5 662
17 170 77 714 26 224 44 478
647 534
Food, beverages
and tobacco
(sees. 0 + 1 )
21 962
2 642 5 981 1 837 4 855
1 857
1 992 844
1 953
472 465 480 312 351 208 266 147
1 153 756
12184 3 139
678
Mineral fuels,
lubricants and
related materials (sec. 3)
11940
2 467 969
1 890 4 169
748
1438 28
231
146 39
321 170
21 114 52 38
383 3 289 2 754 4 143
201
Crude materials,
oils and fasts (sees. 2 + 4)
9 514
2 233 2 191
551 1 941
905
1 080 137 475
195 359 524
2413 226 521 228 860 394
2 579 9 885 5 633
952
Machinery and
transport equipment
(sec. 7)
70 948
30 422 10 879 7 750 4 399
4 236
11 348 214
1 700
43 7
1 470 4 840 2 983 1 382
231 770
1 264 3410
30 551 7 057
20 210
Other (sees.
5 + 6 + 8 + 9)
105 645
33 825 16 052 12 181 11 022
14 804
15 048 883
1 832
767 185
2 225 4 896 5 805 3 482 1 043 2 575 2 466 7 136
22 340 6 251
22 437
la) Grouped according to the SOEC's Statistical and Tar i f f Classification (CST). lb) 1973.
133
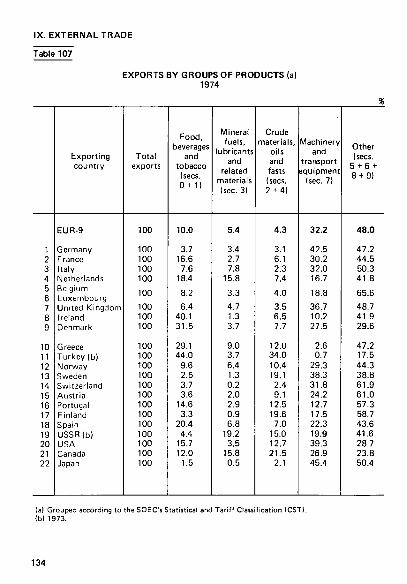
IX. EXTERNALTRADE
Table 107
EXPORTS BY GROUPS OF PRODUCTS (a) 1974
1 2 3 4 5 6 7 8 9
10 11 12 13 14 15 16 17 18 19 20 21 22
Exporting country
EUR-9
Germany France Italy Netherlands Belgium Luxembourg United Kingdom Ireland Denmark
G reece Turkey (b) Norway Sweden Switzerland Austria Portugal Finland Spain USSR(b) USA Canada Japan
Total exports
100
100 100 100 100
100 100 100 100
100 100 100 10Q 100 100 100 100 100 100 100 100 100
Food, beverages
and tobacco
(sees. 0 + 1 )
10.0
3.7 16.6
7.6 18.4
8.2 6.4
40.1 31.5
29.1 44.0
9.6 2.5 3.7 3.6
14.6 3.3
20.4 4.4
15.7 12.0
1.5
Mineral fuels,
lubricants and
related materials (sec. 3)
5.4
3.4 2.7 7.8
15.8
3.3 4.7 1.3 3.7
9.0 3.7 6.4 1.3 0.2 2.0 2.9 0.9 6.8
19.2 3.5
15.8 0.5
Crude materials,
oils and fasts (sees. 2 + 4)
4.3
3.1 6.1 2.3 7.4
4.0 3.5 6.5 7.7
12.0 34.0 10.4 19.1 2.4 9.1
12.5 19.6
7.0 15.0 12.7 21.5
2.1
Machinery and
transport equipment
(sec. 7)
32.2
42.5 30.2 32.0 16.7
18.8 36.7 10.2 27.5
2.6 0.7
29.3 38.3 31.8 24.2 12.7 17.5 22.3 19.9 39.3 26.9 45.4
Other (sees.
5 + 6 + 8 + 9)
48.0
47.2 44.5 50.3 41.8
65.6 48.7 41.9 29.6
47.2 17.5 44.3 38.8 61.9 61.0 57.3 58.7 43.6 41.6 28.7 23.8 50.4
(a) Grouped according to the SOEC's Statistical and Tarif f Classification (CST), (bl 1973.
134
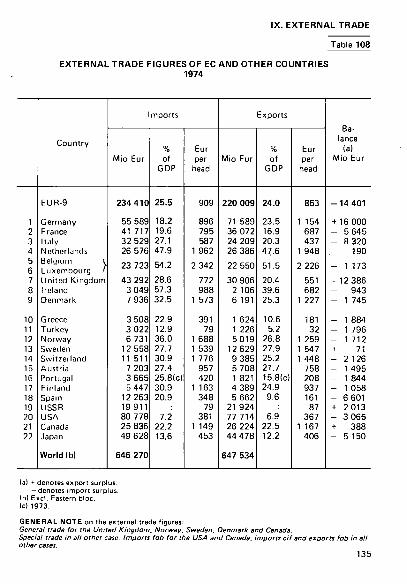
IX. EXTERNALTRADE
Table 108
EXTERNAL TRADE FIGURES OF EC AND OTHER COUNTRIES 1974
1 2 3 4 5 6 7 8 9
10 11 12 13 14 15 16 17 18 19 20 21 22
Country
EUR-9
Germany France Italy Netherlands Belgium \ Luxembourg ι United Kingdom Ireland Denmark
Greece Turkey Norway Sweden Switzerland Austria Portugal Finland Spain USSR USA Canada Japan
World (b)
Mio Eur
234 410
55 589 41 717 32 529 26 576
23 723
43 292 3 049 7 936
3 508 3 022 6 731
12 558 11 511
7 203 3 665 5 447
12 263 19911 80 778 25 836 49 628
646 270
mports
% of
GDP
25.5
18.2 19.6 27.1 47.9
54.2
28.6 57.3 32.5
22.9 12.9 36.0 27.7 30.9 27.4 25.8(c) 30.9 20.9
7.2 22.2 13.6
Eur per
head
909
896 795 587
1 962
2 342
772 988
1 573
391 79
1 688 1 539 1 776
957 420
1 163 348
79 381
1 149 453
Mio Eur
220 009
71 589 36 072 24 209 26 386
22 550
30 906 2 106 6 191
1 624 1 226 5019
12 629 9 385 5 708 1 821 4 389 5 662
21 924 77 714 26 224 44 478
647 534
Exports
% of
GDP
24.0
23.5 16.9 20.3 47.6
51.5
20.4 39.6 25.3
10.6 5.2
26.8 27.9 25.2 21.7 15.8(c) 24.9
9.6
6.9 22.5 12.2
Eur per
head
853
1 154 687 437
1 948
2 226
551 682
1 227
181 32
1 259 1 547 1 448
758 208 937 161 87
367 1 167
406
Balance
(a) Mio Eur
- 1 4 401
+ 16 000 - 5 645 - 8 320 - 190
- 1 173
- 1 2 386 - 943 - 1 745
- 1 884 - 1 796 - 1 712 + 71 - 2 126 - 1 495 - 1 844 - 1 058 - 6 601 + 2 013 - 3 065 + 388 - 5150
(a) + denotes export surplus, -deno tes import surplus.
(b) Excl. Eastern bloc. (c) 1973.
GENERAL NOTE on the external trade figures: General trade for the United Kingdom, Norway, Sweden, Denmark and Canada. Special trade in all other case. Imports fob for the USA and Canada, imports cif and exports fob in all other cases.
135
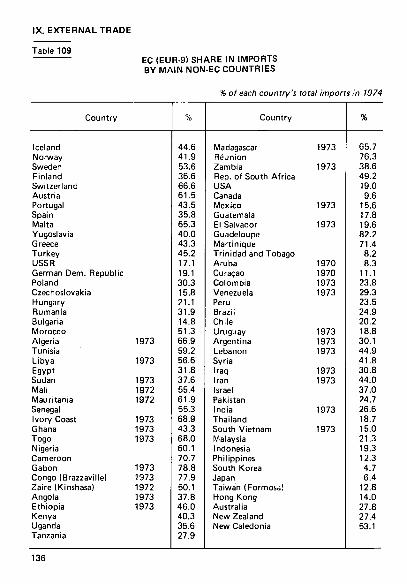
IX. EXTERNALTRADE
Table 109 EC (EUR-9) SHARE IN IMPORTS BY MAIN NON-EC COUNTRIES
i of each country's total Imports in 1974
Country
Iceland Norway Sweden Finland Switzerland Austria Portugal Spain Malta Yugoslavia Greece Turkey USSR German Dem. Republic Poland Czechoslovakia Hungary Rumania Bulgaria Morocco Algeria Tunisia Libya Egypt Sudan Mali Mauritania Senegal Ivory Coast Ghana Togo Nigeria Cameroon Gabon Congo (Brazzaville) Zaire (Kinshasa) Angola Ethiopia Kenya Uganda Tanzania
1973
1973
1973 1972 1972
1973 1973 1973
1973 1973 1972 1973 1973
%
44.6 41.9 53.6 36.6 66.6 61.5 43.5 35.8 65.3 40.0 43.3 45.2 17.1 19.1 30.3 15.8 21.1 31.9 14.8 51.3 66.9 59.2 56.6 31.8 37.6 55.4 61.9 55.3 68.9 43.3 68.0 60.1 70.7 78.8 77.9 50.1 37.8 46.0 40.3 35.6 27.9
Country
Madagascar Réunion Zambia Rep. of South Africa USA Canada Mexico Guatemala El Salvador Guadeloupe Martinique Trinidad and Tobago Aruba Curaçao Colombia Venezuela Peru Brazil Chile Uruguay Argentina Lebanon Syria Iraq Iran Israel Pakistan India Thailand South Vietnam Malaysia Indonesia Philippines South Korea Japan Taiwan (Formosa) Hong Kong Australia New Zealand New Caledonia
1973
1973
1973
1973
1970 1970 1973 1973
1973 1973 1973
1973 1973
1973
1973
%
65.7 76.3 38.6 49.2 19.0 9.6
15.6 17.8 19.6 82.2 71.4
8.2 8.3
11.1 23.8 29.3 23.5 24.9 20.2 18.8 30.1 44.9 41.8 30.8 44.0 37.0 24.7 26.G 18.7 15.0 21.3 19.3 12.3 4.7 6.4
12.8 14.0 27.8 27.4 53.1
136
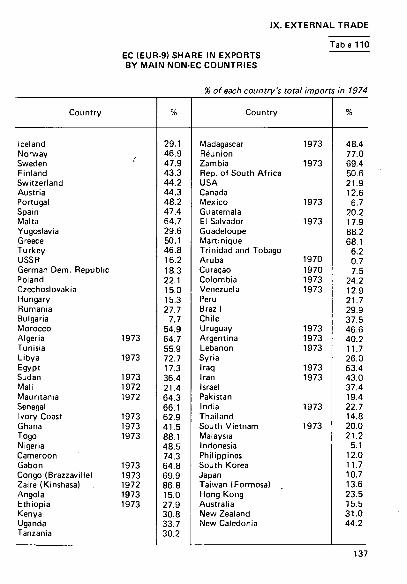
IX. EXTERNALTRADE
Table 110 EC (EUR-9) SHARE IN EXPORTS BY MAIN NON-EC COUNTRIES
Country
Iceland Norway Sweden Finland Switzerland Austria Portugal Spain Malta Yugoslavia Greece Turkey USSR German Dem. Republic Poland Czechoslovakia Hungary Rumania Bulgaria Morocco Algeria Tunisia Libya Egypt Sudan Mali Mauritania Senegal Ivory Coast Ghana Togo Nigeria Cameroon Gabon Congo (Brazzaville) Zaire (Kinshasa) Angola Ethiopia Kenya Uganda Tanzania
1973
1973
1973 1972 1972
1973 1973 1973
1973 1973 1972 1973 1973
%
29.1 46.9 47.9 43.3 44.2 44.3 48.2 47.4 64.7 29.6 50.1 46.8 16.2 18.3 22.1 15.0 15.3 27.7
7.7 54.9 64.7 55.9 72.7 17.3 36.4 21.4 64.3 66.1 62.9 41.5 88.1 48.5 74.3 64.8 69.9 86.8 15.0 27.9 30.8 33.7 30.2
% of each country's total imports in 1974
Country
Madagascar Réunion Zambia Rep. of South Africa USA Canada Mexico Guatemala El Salvador Guadeloupe Martinique Trinidad and Tobago Aruba Curaçao Colombia Venezuela Peru Brazil Chile Uruguay Argentina Lebanon Syria Iraq Iran Israel Pakistan India Thailand South Vietnam Malaysia Indonesia Philippines South Korea Japan Taiwan (Formosa) Hong Kong Australia New Zealand New Caledonia
1973
1973
1973
1973
1970 1970 1973 1973
1973 1973 1973
1973 1973
1973
1973
%
48.4 77.0 69.4 50.6 21.9 12.6 6.7
20.2 17.9 88.2 68.1
6.2 0.7 7.5
24.2 12.9 21.7 29.9 37.5 46.6 40.2 11.7 26.0 63.4 43.0 37.4 19.4 22.7 14.8 20.0 21.2
5.1 12.0 11.7 10.7 13.6 23.5 15.5 31.0 44.2
137

X. EARNINGS AND HOURS OF WORK
Table 111
INDEX OF WAGES IN INDUSTRY (Average hourly gross earnings)
Country
Germany
Total Men Women
France
Total Men Women
Italy
Total Men Women
Netherlands
Total Men Women
Belgium
Total Men Women
Luxembourg
Total Men Women
United Kingdom
Total Men Women
Denmark
Total (a) Men Women
Apri l 1964= 100
Apri l 1971
174.3 173.1 179.0
178.9 177.7 183.5
198.0 191.5 212.5
196.0 194.2 213.8
183.8 183.2 190.3
157.9 158.3 202.7
Oct. 1971
181.4 180.2 186.6
191.0 190.4 193.9
205.6 198.7 219.9
207.9 206.5 223.9
191.3 190.7 198.8
162.4 163.1 210.7
Apri l 1972
190.8 189.5 197.1
200.9 200.0 205.0
226.1 217.9 244.3
221.3 219.1 244.0
206.5 205.3 217.4
174.9 176.8 232.8
Oct. 1972
197.6 196.6 202.9
216.2 215.1 220.8
230.9 223.8 245.8
231.8 230.0 249.7
220.6 220.3 233.1
178.6 178.7 243.9
October 1972= 100
Apri l 1973
106.8 106.8 107.5
109.2 108.9 113.5
116.3 116.2 116.2
107.9 107.7 111.1
109.8 109.8 110.0
110.2 110.4 104.1
;
106.5
Oct. 1973
110.9 110.8 112.5
H'4.8 114.9 115.3
113.1 112.3 115.9
120.2 120.6 120.6
114.2 114.1 114.7
114.2 114.8 106.0
114.3 113.6
1184.4
121.3
Apri l 1974
118.7 118.4 126.5
127.5 127.7 126.5
145.6 142.7 148.2
127.3 127.1 129.0
134.9 135.5 130.2
137.4
Oct. 1974
122.9 122.4 125.9
138.4 138.6 138.0
153.8p 153.4p 155.4
143.2 142.9 145.0
142.2 143.1 137.7
138.5 136.2 152.2
146.2
(a)Excl. building and civil engineering.
138

X. EARNINGS AND HOURS OF WORK
Table 112
HOURLY LABOUR-COST FOR MANUAL WORKERS IN INDUSTRY
In national currencies and in Fb
Industry
Mining and quarrying
Manufacturing
Construction
Total industry
Year
1966 1969 1971 1972
1966 1969 1971 1972
1966 1969 1971 1972
1966 1969 1971 1972
Germany
DM
7.85 9.55
12.50 14.32
6.24 7.76
10.10 11.19
7.07 8.26
10.90 12.36
6.45 7.89
10.30 11.45
Fb
97.86 121.27 170.00 199.19
77.81 98.60
138.00 155.62
88.05 104.90 149.00 171.98
80.31 100.17 141.00 159.28
France
Ffr
10.24 13.21 16.00 17.57
6.55 8.64
11.00 12.21
6.73 8.78
10.80 11.84
6.76 8.84
11.10 12.28
Fb
103.83 127.52 144.00 153.88
66.42 83.33 99.00
106.96
68.27 84.63 97.00
103.71
68.56 85.29
100.00 107.59
Italy
Lit
1 028 1 300 1 930 2 088
789 996
1 430 1 586
803 961
1 310 1 447
793 996
1 420 1 580
F b
82.03 103.97 152.00 160.97
62.96 79.63
114.00 122.27
64.07 76.89
105.00 111.59
63.30 79.71
113.00 121.80
Netherlands
Fl
7.83 9.87
12.60
5.14 6.92 9.10
6.17 7.70
10.70
5.40 7.10 9.40
Fb
107.90 136.26 174.00
70.84 95.61
125.00
85.06 106.32 148.00
74.37 98.07
130.00
Belgium
Fb
96.72 117.79 162.00 180.43
73.60 94.37
124.00 146.25
82.46 103.54 136.00 162.53
76.32 96.77
127.00 146.64
Luxembourg
Fb
119.82 132.06 161.00 176.76
90.36 110.78 136.00 155.31
62.24 77.99 94.00
108.06
87.56 106.36 129.00 147.26

X. EARNINGS AND HOURS OF WORK
Table 113
Total men and women
AVERAGE HOURLY October
NACE
11 Extraction and briquetting of solid fuels
12 Coke ovens
13 Extraction of petroleum and natural gas
14 Mineral oil refining
21 Extraction and preparation of metalliferous ores
22 Production and preliminary processing of metals
22A Production and preliminary processing of ferrous metals 23 Extraction of minerals other than metalliferous
and energy-producing minerals; peat extraction
23A Extraction of other mineral u.e.c, peat cutting 24 Manufacture of non-metallic
mineral products
25 Chemical industry
25A Manufacture of basic industrial chemicals
26 Production of man-made fibres
31 Manufacture of metal articles
32 Mechanical engineering 33 Manufacture of office machinery
and data processing machinery
34 Electrical engineering 35 Manufacture of motor vehicles and of motor vehicle parts
and accessories
36 Manufacture of other means of transport
37 Instrument engineering
41/42 Food, drink and tobacco industry
140
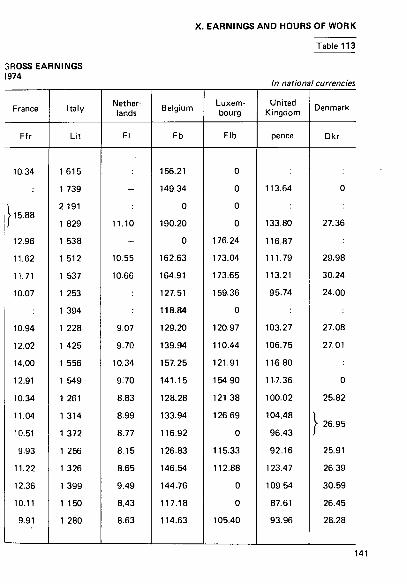
X. EARNINGS AND HOURS OF WORK
Table 113
3ROSS EARNINGS 1974
in national currencies
France
Ffr
10.34
\ 15.88
12.96
11.62
11.71
10.07
10.94
12.02
14.00
12.91
10.34
11.04
10.51
9.93
11.22
12.36
10.11
9.91
Italy
Lit
1 615
1 739
2 191
1 829
1 538
1 512
1 537
1 253
1 394
1 228
1 425
1 556
1 549
1 261
1 314
1 372
1 256
1 326
1 399
1 150
1 280
Netherlands
Fl
-
11.10
-10.55
10.66
9.07
9.70
10.34
9:70
8.83
8.99
8.77
8.15
8.65
9.49
8.43
8.63
Belgium
Fb
156.21
149.34
0
190.20
0
162.63
164.91
127.51
118.84
129.20
139.94
157.25
141.15
128.28
133.94
116.92
126.83
146.54
144.76
117.18
114.63
Luxembourg
Fib
0
0
0
0
176.24
173.04
173.65
159.36
0
120.97
110.44
121.91
154 90
121 38
12669
0
115.33
112.88
0
0
105.40
United Kingdom
pence
113.64
133.80
116.87
111.79
113.21
95.74
103.27
106.75
116 80
117.36
100.02
104.48
96.43
92.16
123.47
109 54
87.61
93.96
Denmark
Dkr
0
27.36
29.98
30.24
24.00
27.08
27.01
0
25.82
> 26.95
25.91
26.39
30.59
26.45
28.28
141

X. EARNINGS AND HOURS OF WORK
Table 113 (contd.)
AVERAGE HOURLY October
Total men and women
N"
41A
41B
42A
43
44
45
45A
45B
46
46A 47
47A
47B
48
49
50
A
Β
C
NACE
Food industry, except sugar
Confectionery of bread and sugared products
Drink industry
Textile industry
Manufacture of leather and of leather goods
Manufacture of clothing and footwear
Manufacture of footwear
Manufacture of clothing
Timber and wooden furniture industries
Wood industry (without wooden furniture) Manufacture of paper and paper products: printing and publishing Manufacture of paper and paper products
Printing and publishing
Processing of rubber and plastics
Other manufacturing industries
Building and civil engineering
Mining and quarrying including NACE 11, 13,21 and 23
Total manufacturing industries
All industries (A + Β + 50)
Germany
DM
7.99
7.47
9.15
7 85
6.97
6.99
7.02
6.94
8.87
8.57
9 56
8.74
10.29
8.72
7.80
10.00
10.10
9.11
9.28
142

X. EARNINGS AND HOURS OF WORK
Table 113 (contd.)
GROSS EARNINGS 1974
In national currencies
France
Ffr
9.49
9.19
10.64
8.94
8.23
8.11
8.74
7 8 8
8.92
8.94
12.20
11.46
12.87
9.99
9.64
1008
10.96
10.40
10.35
Italy
Lit
1 247
1 281
1 355
1 036
1 024
934
899
947
1 018
1 020
1 425
1 355
1 499
1 335
1 040
1 255
1 345
1 243
1 246
Netherlands
Fl
8.54
8 07
8.93
8.36
7.71
6.42
7.74
6.09
8.08
8.27
9 7 5
9.48
9.91
8.90
7.91
9.39
9.80
8.81
8.97
Belgium
Fb
111.34
104.92
119.51
107.06
98.11
85.44
102.70
82.09
115.35
116.93
129.86
119.92
142.21
122.94
90.01
130.07
149.87
125.28
127.01
Luxembourg
Fib
100.62
114.84
0
68.64
0
68.09
112.01
103.43
135.02
0
135.90
141.42
117.51
159.36
151.94
144.85
United Kingdom
pence
90.52
84.37
103.46
84.59
78.39
71.64
89.55
66.90
96.87
95.54
110.59
101.37
117.17
109.65
86.19
100.23
99.80
99.91
99.97
Denmark
Dkr
27.12
24.93
24.25
28.25
23.24
21.59
23.23
23.40
30.30
27.79
25.27
23.84
26.88
26.87
143

X. EARNINGS AND HOURS OF WORK
Table 114 HOURLY LABOUR COST FOR 1972
N o . NACE
Germany
DM
11 Extraction and briquetting of solid fuels 12 Coke ovens 13 Extraction of petroleum and natural gas 14 Mineral oil refining 16 Production and distribution
of electricity, gas, steam and hot water 17 Water supply: collection, purification and distribution 21 Extraction and preparation of metalliferous ores 22 Production and preliminary processing of metals 23 Extraction of minerals other than metalliferous
and energy-producing minerals; peat extraction 24 Manufacture of non-metallic
mineral products 25 Chemical industry 26 Production of man-made fibres 31 Manufacture of
metal articles 32 Mechanical engineering 33 Manufacture of office machinery
and data processing machinery 34 Electrical engineering 35 Manufacture of motor vehicles and of motor vehicle parts
and accessories 36 Manufacture of other means of transport 37 Instrument engineering 41/42 Food, drink and tobacco industry 43 Textile industry 44 Manufacture of leather and of leather goods 45 Manufacture of clothing and footwear 46 Timber and wooden furniture industries 47 Manufacture of paper and paper products;
printing and publishing 48 Manufacture of rubber and plastics 49 Other manufacturing industries 50 Building and civil engineering A Mining and quarrying including
NACE 11,13, 21 and 23 Β Total manufacturing industries
C All industries (A + Β + 50)
14.90
13.07 14.40 13.97
13.10 11.92 12.43 11.39
10.97
12.54 11.59 11.27 12.03 10.23 10.94 13.30
12.10 10.03 9.80 8.84 8.49 8.33
10.50
10.85
10.68 8.85
12.36
14.32
11.19
11.45 (al 1973. (bl Incl. NACE 26. (cl Incl. NACE 35. (d) Incl. NACE 47. lel Incl. NACE 33.
144
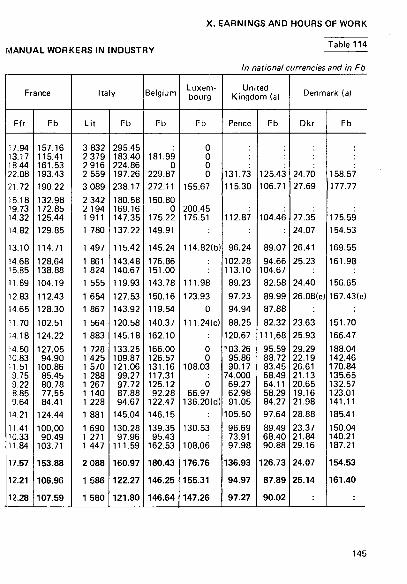
X. EARNINGS AND HOURS OF WORK
MANUAL WORKERS IN INDUSTRY Table 114
In national currencies and in F b
France
Ffr
17.94 13.17 18.44 22.08 21.72
15.18 19.73 14.32 14.82
13.10
14.68 15.85 11.89
12.83 14.65
11.70 14.18
14.50 10.83 11.51 9.75 9.22 8.85 9.64
14.21
11.41 10.33 11.84
17.57
12.21
12.28
Fb
157.16 115.41 161.53 193.43 190.22
132.98 172.85 125.44 129.85
114.71
128.64 138.88 104.19
112.43 128.30
102.51 124.22
127.05 94.90
100.86 85.45 80.78 77.55 84.41
124.44
100.00 90.49
103.71
153.88
106.96
107.59
Ita
Lit
3 832 2 379 2916 2 559 3 089
2 342 2 194 1 911 1 780
1 497
1 861 1 824 1 555
1 654 1 867 1 564 1 883
1 728 1 425 1 570 1 288 1 267 1 140 1 228
1 881
1 690 1 271 1 447
2 088
1 586
1 580
y
Fb
295.45 183.40 224.86 197.26 238.17
180.58 169.16 147.35 137.22
115.42
143.48 140.67 119.93
127.53 143.92
120.58 145.18
133.25 109.87 121.06
99.27 97.72 87.88 94.67
145.04
130.28 97.96
111.59
160.97
122.27
121.80
Belgium
Fb
181.99 0
229.87 272.11
150.80 0
175.22 149.91
145.24
176.86 151.00 143.78
150.16 119.54
140.37 162.10
166.00 126.57 131.16 117.31 125.12 92.28
122.47
146.15
139.35 95.43
162.53
180.43
146.25
146.64
Luxembourg
Fb
0 0 0 0
155.67
200.45 175.51
114.82(b)
111.98
123.93 0
111.24(c)
0 0
108.03
Ó 66.97
136.20(d)
130.53
108.06
176.76
155.31
147.26
United Kingdom (a)
Pence
131.73 115.30
112.87
96.24
102.28 113.10 89.23
97.23 94.94
88.25 120.67
103.26 95.86 90.17
74.000 69.27 62.98 91.05
105.50
96.69 73.91 97.98
136.93
94.97
97.27
Fb
125.43 106.71
104.46
89.07
94.66 104.67
82.58
89.99 87.88
82.32 111,68
95.59 88.72 83.45 68.49 64.11 58.29 84.27
97.64
89.49 68.40 90.88
126.73
87.89
90.02
Denmark (a)
Dkr
24.70 27.69
27.35 24.07
26.41
25.23
24.40
26.08(e)
23.63 25.93
29.29 22.19 26.61 21.13 20.65 19.16 21.98
28.88
23.37 21.84 29.16
24.07
25.14
Fb
158.57 177.77
175.59 154.53
169.55
161.98
156.65
167.43(e)
151.70 166.47
188.04 142.46 170.84 135.65 132.57 123.01 141.11
185.41
150.04 140.21 187.21
154.53
161.40
145

X. EARNINGS AND HOURS OF WORK Table 115 MONTHLY LABOUR COST FOR
1972
No.
11 12 13 14 16
17 21 22 23
24
25 26 31
32 33
34 35
36 37 41/42 43 44 45 46 47
48 49 50 A
Β
C
NACE
Extraction and briquetting of solid fuels Coke ovens Extraction of petroleum and natural gas Mineral oil refining Production and distribution of electricity, gas, steam and hot water Water supply: collection, purification and distribution Extraction and preparation of metalliferous ores Production and preliminary processing of metals Extraction of minerals other than metalliferous and energy-producing minerals; peat extraction Manufacture of non-metallic mineral products Chemical industry Production of man-made fibres Manufacture of metal articles Mechanical engineering Manufacture of office machinery and data processing machinery Electrical engineering Manufacture of motor vehicles and of motor vehicle parts and accessories Manufacture of other means of transport Instrument engineering Food, drink and tobacco industry Textile industry Manufacture of leather and of leather goods Manufacture of clothing and footwear Timber and wooden furniture industries Manufacture of paper and paper products; printing and publishing Manufacture of rubber and plastics Other manufacturing industries Building and civil engineering Mining and quarrying including NACE 11,13, 21 and 23 Total manufacturing industries
All industries (A + Β + 50)
Germany
DM
3 511
2 923 3 152 2 654
2 677 2919 2 538 2 650
2 367
2 740 2 727 2 374
2 364 2 874
2 439 2 718
2 359 2 152 2 151 2 068 1 998 1 930 2 158 2313
2 270 2 093 2 627
3 345
2 412
2 447
Fb
48 838
40 663 43 851 36 921
37 243 40 602 35 309 36 863
32 931
38 108 37 936 33 024
32 876 39 979
33 924 37 810
32 819 29 930 29 916 28 770 27 786 26 847 30 024 32 171
31 582 29 118 36 547
46 536
33 547
34 033
(a) 1973. ( b l i n d . NACE 26. (c) Incl. NACE 35. (d) Incl. NACE 47. (e) Incl. NACE 33. 146
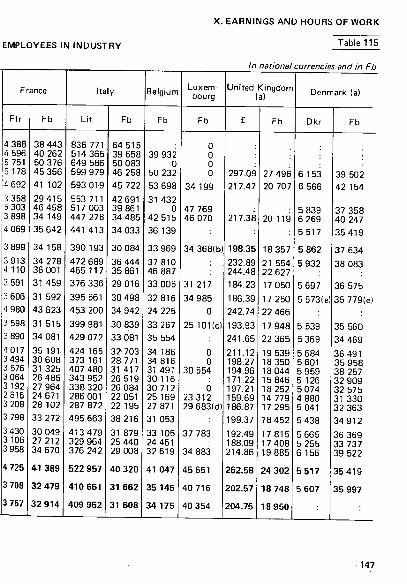
X. EARNINGS AND HOURS OF WORK
EMPLOYEES IN INDUSTRY
France
Ffr
4 388 4 596 5 751 5 178
4 692
3 358 5 303 3 898 4 069
3 899
3913 4 110 3 591
3 606 4 980
3 598 3 890
4017 3 494 3 576 3 064 3 192 2816 3 208
3 798
3 430 3 106 3 958
4 725
3 708
3 757
Fb
38 443 40 262 50 376 45 356
41 102
2 9 4 1 5 46 458 34 149
35 642
34 158
34 278 36 001 31 459
31 592 43 623
31 515 34 081
35 191. 30 608 31 325 26 485 27 964 24 671 28 102 33 272
30 049 27 212 34 670
4 1 3 8 9
32 479
32 914
Italy
Lit
836 771 514 365 649 586 599 979
593 019
553 711 517 003 447 278 441 413
390 193
472 689 465 117 376 336
395 561 453 200
399 981 429 072
424 165 373 161 407 480 343 952 338 320 286 001 287 872 495 663
413 479 329 964 376 242
522 957
410 661
409 962
Fb
64 515 39 658 50 083 46 258
45 722
42 691 39 861 34 485 34 033
30 084
36 444 35 861 29 016
30 498 34 942
30 839 33 081
32 703 28 771 31 417 26 519 26 084 22 051 22 195
38 216
31 879 25 440 29 008
40 320
31 662
31 608
Belgium
Fb
39 932 0
50 232 53 698
31 432 0
42 515 36 139
33 969
37 810 46 887 33 005
32 816 24 225
33 267 35 554
34 186 34 816 31 491 30 116 3 0 7 1 2 25 169 27 871
31 053
33 105 24 461 32 619
41 047
35 145
34 175
Luxembourg
Fb
0 0 0 0
34 199
47 769 46 070
34 368(b)
31 217
34 985 0
25 101(c)
0 0
30 554
0 23312 29 683(d)
37 783
34 883
45 651
40 716
40 354
Table 115
In national currencies and In Fb
United Kingdom (a)
£
297.09
217.47
217.38
198.35
232.89 244.48 184.23
186.39 242.74
193.93 241.65
211.12 198.27 194.96 171.22 197.21 159.69 186.87
199.37
192.49 188.09 214.86
262.58
202.57
204.75
Fb
27 496 20 707
20 119
18 357
21 554 22 627 17 050
17 250 22 466
17 948 22 365
19 539 18 350 18 044 15 846 18 252 14 779 17 295
18 452
17815 17 408 19 885
24 302
18 748
18 950
Denmark (a)
Dkr
6 153 6 566
5 839 6 269 5 5 1 7
5 862
5 932
5 697
5 573(e)
5 539 5 369
5 684 5 601 5 959 5 126 5 074 4 880 5 041 5 438
5 665 5 255 6 156
5 517
5 607
Fb
39 502 42 154
37 358 40 247 3 5 4 1 9
37 634
38 083
36 575
35 779(e)
35 560 34 469
36 491 35 958 38 257 32 909 32 575 31 330 32 363 34 912
36 369 33 737 39 522
35 419
35 997
147

X. EARNINGS AND HOURS OF WORK Table 116 HOURLY (a) LABOUR COST IN
1972
No.
11 12 13 14 16
17 21 22 23
24
25 26 31
32 33
34 35
36 37 41/42 43 44 45 46 47
48 49 50 A
Β
C
NACE
Extraction and briquetting of solid fuels Coke ovens Extraction of petroleum and natural gas Mineral oil refining Production and distribution of electricity, gas, steam and hot water Water supply: collection, purification and distribution Extraction and preparation of metalliferous ores Production and preliminary processing of metals Extraction of minerals other than metalliferous and energy-producing minerals; peat extraction Manufacture of non-metallic mineral products Chemical industry Production of man-made fibres Manufacture of metal articles
Mechanical engineering Manufacture of office machinery and data processing machinery Electrical engineering Manufacture of motor vehicles and of motor vehicle parts and accessories Manufacture of other means of transport Instrument engineering Food, drink and tobacco industry Textile industry Manufacture of leather and of leather goods Manufacture of clothing and footwear Timber and wooden furniture industries Manufacture of paper and paper products; printing and publishing Manufacture of rubber and plastics Other manufacturing industries Building and civil engineering Mining and quarrying including NACE 11 ,13 ,21 and 23 Total manufacturing industries
All industries (A + Β + 50)
Germany
DM
16.73
15.63 17.42 15.08
14.84
13.39 12.49
11.82
14.84 13.03 12.25
13.17 15.22
12.68 14.27
12.99 11.20 11.05 9.78 9.34 9.09
11.18 11.86
11.69 9.92
13.07
15.74
12.47
12.64
Fb
232.76
217.41 242.32 209.73
206.39
186.19 173.70
164.48
206.45 181.20 170.37
183.17 211.70
176.45 198.56
180.74 155.76 153.70 135.98 129.93 126.45 155.48 164.91
162.58 138.03 181.77
121.98
173.50
175.84
(a) H o u r s worked by wagt a arners and hours usually or conventionally worked by employees. (bl 1973. I d Incl. NACE 26. (dl I n d . NACE 35. lel Incl. NACE 47.
148
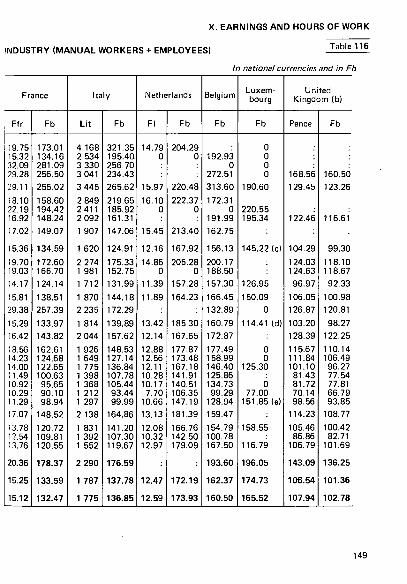
X. EARNINGS AND HOURS OF WORK
INDUSTRY (MANUAL WORKERS + EMPLOYEES)
France
Ffr
19.75 15.32 32.09 29.28
29.11
18.10 22.19 16.92 17.02
15.36
19.70 19.03 14.17
15.81 29.38
15.29 16.42
18.56 14.23 14.00 11.49 10.92 10.29 11.29 17.07
13.78 12.54 13.76
20.36
15.25
15.12
Fb
173.01 134.16 281.09 256.50
255.02
158.60 194.42 148.24 149.07
134.59
172.60 166.70 124.14
138.51 257.39
133.97 143.82
162.61 124.68 122.65 100.63 95.65 90.10 98.94
148.52
120.72 109.81 120.55
178.37
133.59
132.47
Italy
Lit
4 168 2 534 3 330 3 041 3 445
2 849 2 411 2 092 1 907
1 620
2 274 1 981 1 712
1 870 2 235
1 814 2 044
1 926 1 649 1 775 1 398 1 368 1 212 1 297
2 138
1 831 1 392 1 552
2 290
1787
1 775
Fb
321.35 195.40 256.70 234.43
265.62
219.65 185.92 161.31 147.06
124.91
175.33 152.75 131.99
144.18 172.29
139.89 157.62
148.53 127.14 136.84 107.78 105.44 93.44 99.99
164.86
141.20 107.30 119.67
176.59
137.78
136.85
Netherlands
Fl
14.79 0
15.97
16.10 0
15.45
12.16
14.86 0
11.39
11.89
13.42 12.14
12.88 12.56 12.11 10.28 10.17
7.70 10.66 13.13
12.08 10.32 12.97
12.47
12.59
Fb
204.29 0
220.48
222.37 0
213.40
167.92
205.28 0
157.28
164.23
185.30 167.65
177.87 173.48 167.18 141.91 140.51 106.35 147.19 181.39
166.76 142.50 179.09
172.19
173.93
In national currencies
Belgium
Fb
192.93 0
272.51 313.60
172.31 0
191.99 162.75
156.13
200.17 188.50 157.30
166.45 132.89
160.79 172.87
177.49 158.99 146.40 125.86 134.73 99.29
128.94 159.47
154.79 100.78 167.50
193.60
162.37
160.50
Luxembourg
Fb
0 0 0 0
190.60
220.55 195.34
145.22(c)
126.95
150.09 0
114.41 (d)
0 0
125.30
0 77.00
151.85(e)
158.55
116.79
196.05
174.73
165.52
Table 116
and in Fb
United Kingdom (b)
Pence
168.56 129.45
122.46
104.29
124.03 124.63 96.97
106.05 126.87
103.20 128.39
115.67 111.84 101.10
81.43 81.72 70.14 98.56
114.23
105.46 86.86
106.79
143.09
106.54
107.94
Fb
160.50 123.26
116.61
99.30
118.10 118.67 92.33
100.98 120.81
98.27 122.25
110.14 106.49 96.27 77.54 77.81 66.79 93.85
108.77
100.42 82.71
101.69
136.25
101.36
102.78
149
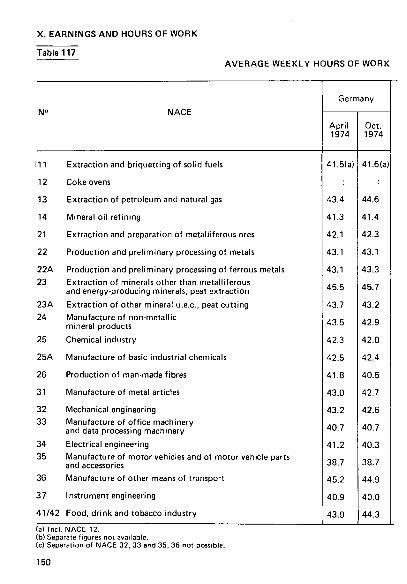
X. EARNINGS AND HOURS OF WORK
Table 117 AVERAGE WEEKLY HOURS OF WORK
N°
111
12
13
14
21
22
22A 23
23A 24
25
25A
26
31
32 33
34 35
36
37
41/42
NACE
Extraction and briquetting of solid fuels
Coke ovens
Extraction of petroleum and natural gas
Mineral oil refining
Extraction and preparation of metalliferous ores
Production and preliminary processing of metals
Production and preliminary processing of ferrous metals Extraction of minerals other than metalliferous and energy-producing minerals; peat extraction
Extraction of other mineral u.e.c, peat cutting Manufacture of non-metallic mineral products
Chemical industry
Manufacture of basic industrial chemicals
Production of man-made fibres
Manufacture of metal articles
Mechanical engineering Manufacture of office machinery and data processing machinery
Electrical engineering Manufacture of motor vehicles and of motor vehicle parts and accessories Manufacture of other means of transport
Instrument engineering
Food, drink and tobacco industry
Germany
Apri l 1974
41.5(a)
43.4
41.3
42.1
43.1
43.1
45.5
43.7
43.5
42.3
42.5
41.8
43.0
43.2
40.7
41.2
38.7
45.2
40.9
43.9
Oct. 1974
41.6(a)
44.6
41.4
42.3
43.1
43.3
45.7
43.2
42.9
42.0
42.4
40.5
42.7
42.6
40.7
40.3
38.7
44.9
40.0
44.3
(a) Incl. NACE 12. (b) Separate figures not available. (c) Separation of NACE 32. 33 and 35, 36 not possible.
150
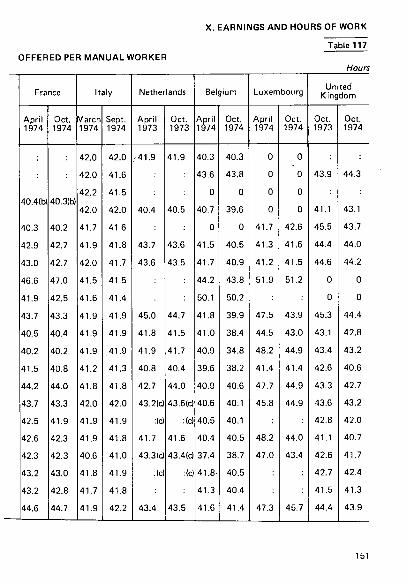
X. EARNINGS AND HOURS OF WORK
Table 117 OFFERED PER MANUAL WORKER
Hours
France
Apri l 1974
40.4(b)
40.3
42.9
43.0
46.6
41.9
43.7
40.5
40.2
41.5
44.2
43.7
42.5
42.6
42.3
43.2
43.2
44.6
Oct. 1974
40.3(b)
40.2
42.7
42.7
47.0
42.5
43.3
40.4
40.2
40.8
44.0
43.3
41.9
42.3
42.3
43.0
42.8
44.7
Italy
vlarch 1974
42.0
42.0
42.2
42.0
41.7
41.9
42.0
41.5
41.6
41.9
41.9
41.9
41.2
41.8
42.0
41.9
41.9
40.6
41.8
41.7
41.9
Sept. 1974
42.0
41.6
41.5
42.0
41.6
41.8
41.7
41.5
41.4
41.9
41.9
41.9
41.3
41.8
42.0
41.9
41.8
41.0
41.9
41.8
42.2
Netherlands
Apri l 1973
41.9
40.4
43.7
43.6
45.0
41.8
41.9
40.8
42.7
43.2(c)
:(d 41.7
43.3(c)
:(c)
43.4
Oct. 1973
41.9
40.5
43.6
43.5
44.7
41.5
41.7
40.4
44.0
43.6(c)
:(d 41.6
43.4(c)
:(c)
43.5
Belgium
Apri l 1974
40.3
43.6
0
40.7
0
41.5
41.7
44.2
50.1
41.8
41.0
40.9
39.6
40.9
40.6
40.5
40.4
37.4
41.8·
41.3
41.6
Oct. 1974
40.3
43.8
0
39.6
0
40.5
40.9
43.8
50.2
39.9
38.4
34.8
38.2
40.6
40.1
40.1
40.5
38.7
40.5
40.4
41.4
Luxerr
Apri l 1974
0
0
0
0
41.7
41.3
41.2
51.9
47.5
44.5
48.2
41.4
47.7
45.8
48.2
47.0
47.3
bourg
Oct. 1974
0
0
0
0
42.6
41.6
41.5
51.2
43.9
43.0
44.9
41.4
44.9
44.9
44.0
43.4
45.7
United Kingdom
Oct. 1973
43.9
41.1
45.5
44.4
44.6
0
0
45.3
43.1
43.4
42.6
43.3
43.6
42.8
41.1
42.6
42.7
41.5
44.4
Oct. 1974
44.3
43.1
43.7
44.0
44.2
0
0
44.4
42.8
43.2
40.6
42.7
43.2
42.0
40.7
41.7
42.4
41.3
43.9
161

X. EARNINGS AND HOURS OF WORK
Table 117 (contd.)
AVERAGE WEEKLY HOURS OF WORK
NACE
Germany
April 1974
41A Food industry, except sugar
41Β Confectionery of bread and sugared products
42A Drink industry
43 Textile industry
44 Manufacture of leather and of leather goods.
45 Manufacture of clothing and footwear
45A Manufacture of footwear
45B Manufacture of clothing
46 Timber and wooden furniture industries
46A Wood industry (without wooden furniture) 47 Manufacture of paper and paper products:
printing and publishing
47A Manufacture of paper and paper products
47B Printing and publishing
48 Processing of rubber and plastics
49 Other manufacturing industries
50 Building and civil engineering
A Mining and quarrying including NACE 11 ,13 ,21 and 23
Β Total manufacturing industries
C All industries (A + Β + 50)
44.3
42.8
44.0
41.0
41.2
39.1
38.5
39.1
42.5
43.5
42.7
43.4
42.1
41.3
41.1
42.5
42.4(a
42.0
42.1
(a) Also includes NACE 12. (b) Also includes NACE 14.
152

X. EARNINGS AND HOURS OF WORK
Table 117 (contd.)
OFFERED PER MANUAL WORKER Hours
France
April 1974
45.0
44.0
42.7
42.3
43.4
41.3
42.0
41.0
45.7
45.6
43.2
43.1
43.3
43.1
42.8
47.4
41.1 (b)
43.1
44.0
Oct. 1974
44.9
44.0
42.4
41.7
43.2
41.2
42.4
40.7
44.8
44.5
42.8
42.3
43.2
42.8
42.4
47.4
41.2 (b)
42.8
43.8
Italy
March 1974
42.0
41.9
41.9
41.6
41.7
41.4
41.2
41.5
41.9
41.9
41.6
41.9
41.2
41.9
41.9
41.0
41.6
41.7
41.7
Sept. 1974
42.1
42.1
42.2
41.5
41.8
41.4
41.2
41.5
41.8
41.7
41.4
41.7
41.1
41.8
41.8
41.4
41.6
41.7
41.7
Netherlands
Apri l 1973
43.6
43.6
42.4
43.2
43.1
42.3
41.6
42.4
43.9
44.3
42.9
43.0
42.9
42.2
43.7
42.4
43.0
43.2
Oct. 1973
43.8
43.2
42.1
42.9
41.6
42.4
41.9
42.5
43.2
43.7
42.5
42.4
42.6
42.4
42.7
42.4
43.0
43.0
Bek
Apri l 1974
41.5
39.9
42.1
39.8
41.4
38.5
38.4
38.3
41.5
42.0
41.2
41.2
41.1
40.5
40.2
42.2
41.1
40.6
40.9
ium
Oct. 1974
40.9
40.0
41.3
36.3
39.4
36.9
32.7
36.9
40.1
39.4
40.4
40.6
40.1
40.3
39.6
39.2
41.1
39.5
39.5
Luxerr
Apri l 1974
48.2
47.9
0
41.9
41.9
45.5
43.8
46.1
46.2
44.4
51.1
43.9
43.0
44.6
bourg
Oct. 1974
46.0
46.7
0
41.3
41.1
45.2
43.8
42.0
41.9
42.3
48.4
44.6
42.4
43.6
United Kingdom
Oct. 1973
44.6
45.0
44.7
41.6
40.9
37.9
38.7
37.6
44.0
45.5
43.4
44.2
42.8
43.2
41.5
46.8
48.5
42.7
43.4
Oct. 1974
44.2
44.7
44.0
40.9
40.4
37.5
37.0
37.4
42.7
44.2
42.5
43.7
41.7
42.3
41.8
46.4
47.7
42.1
42.9
153
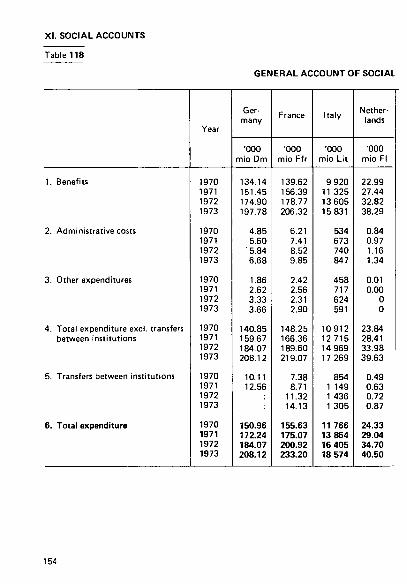
XI . SOCIAL ACCOUNTS
Table 118
GENERAL ACCOUNT OF SOCIAL
1. Benefits
2. Administrative costs
3. Other expenditures
4. Total expenditure excl. transfers between institutions
5. Transfers between institutions
6. Total expenditure
Year
1970 1971 1972 1973
1970 1971 1972 1973
1970 1971 1972 1973
1970 1971 1972 1973
1970 1971 1972 1973
1970 1971 1972 1973
Germany
'000 mio Dm
134.14 151.45 174.90 197.78
4.85 5.60
'5.84 6.68
1.86 2.62 3.33 3.66
140.85 159.67 184.07 208.12
10.11 12.56
150.96 172.24 184.07 208.12
France
'000 mio Ffr
139.62 156.39 178.77 206.32
6.21 7.41 8.52 9.85
2.42 2.56 2.31 2.90
148.25 166.36 189.60 219.07
7.38 8.71
11.32 14.13
155.63 175.07 200.92 233.20
Italy
'000 mio Lit
9 920 11 325 13 605 15831
534 673 740 847
458 717 624 591
10912 12715 14 969 17 269
854 1 149 1 436 1 305
11 766 13 864 16 405 18 574
Netherlands
'000 mio Fl
22.99 27.44 32.82 38.29
0.84 0.97 1.16 1.34
0.01 0.00
0 0
23.84 28.41 33.98 39.63
0.49 0.63 0.72 0.87
24.33 29.04 34.70 40.50
154
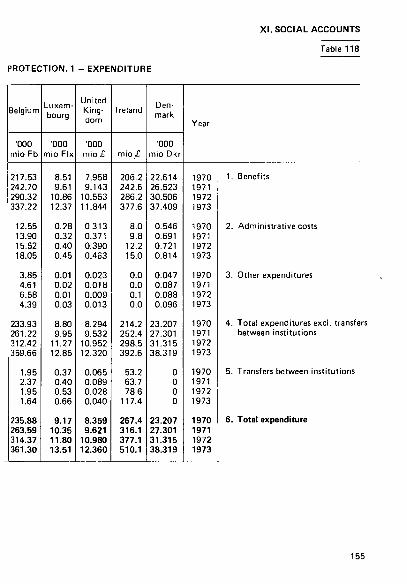
PROTECTION. 1 - EXPENDITURE
X I . SOCIAL ACCOUNTS
Table 118
'000 mio Fb
Luxembourg
'000 mio Fix
United Kingdom
'000 mio £.
Ireland
mio £
Denmark
'000 mio Dkr
Year
217.53 242.70 290.32 337.22
12.55 13.90 15.52 18.05
3.85 4.61 6.58 4.39
233.93 261.22 312.42 359.66
1.95 2.37 1.95 1.64
235.88 263.59 314.37 361.30
8.51 9.61
10.86 12.37
0.28 0.32 0.40 0.45
0.01 0.02 0.01 0.03
8.80 9.95
11.27 12.85
0.37 0.40 0.53 0.66
9.17 10.35 11.80 13.51
7.958 9.143
10.553 11.844
0.313 0.371 0.390 0.463
0.023 0.018 0.009 0.013
8.294 9.532
10.952 12.320
0.065 0.089 0.028 0.040
8.359 9.621
10.980 12.360
206.2 242.6 286.2 377.6
8.0 9.8
12.2 15.0
0.0 0.0 0.1 0.0
214.2 252.4 298.5 392.6
53.2 63.7 78.6
117.4
267.4 316.1 377.1 510.1
22.614 26.523 30.506 37.409
0.546 0.691 0.721 0.814
0.047 0.087 0.088 0.096
23.207 27.301 31.315 38.319
0 0 o o
23.207 27.301 31.315 38.319
1970 1971 1972 1973 1970 1971 1972 1973
1970 1971 1972 1973
1970 1971 1972 1973
1970 1971 1972 1973
1970 1971 1972 1973
1. Benefits
2. Administrative costs
3. Other expenditures
4. Total expenditures excl. transfers between institutions
5. Transfers between institutions
6. Total expenditure
155

XI . SOCIAL ACCOUNTS
Table 119
1. Employers' contributions
2. Households' contributions
3. Central and local government contributions
4. Income from capital
5. Other receipts
6. Total receipts excl. yield from transfers between institutions
7. Yield from transfers between institutions
8. Total receipts
Year
1970 1971 1972 1973
1970 1971 1972 1973
1970 1971 1972 1973
1970 1971 1972 1973
1970 1971 1972 1973
1970 1971 1972 1973
1970 1971 1972 1973
1970 1971 1972 1973
GENERAL ACCOUNT OF SOCIAL
Germany
'000 mio DM
70.38 81.30 94.10
109.30
36.52 39.03 46.65 55.31
36.92 41.27 46.72 51.30
3.00 3.69 4.58 5.84
1.28 1.48 (:) (:)
148.10 166.77 192.05 221.74
8.91 12.56 3.82 4.52
157.01 179.33 195.87 226.26
France
'000 mio Ffr
95.16 107.31 121.32 139.72
30.93 35.11 39.84 45.45
26.58 28.53 31.93 35.40
1.59 1.78 1.88 2.17
1.17 1.37 1.32 1.52
155.43 174.10 196.28 224.26
7.38 8.71
11.32 14.12
162.81 182.81 207.60 238.38
Italy
'000 mio Lit
6 219 7 237 8 442
10217
1 748 1 712 1 970 2 376
2 658 2 971 3 286 3 500
376 379 364 377
317 409 533 552
11 318 12 708 14 595 17 022
854 1 064 1 310 1 235
12 172 13 772 15 905 18 257
Netherlands
'000 mio Fl
13.07 15.57 17.63 21.49
10.78 12.83 14.96 18.04
3.71 4.19 5.24 6.30
2.39 2.80 3.36 4.02
0.04 0.11 0.13 0.18
29.99 35.50 41.33 50.02
0.49 0.63 0.72 0.87
30.48 36.13 42.05 50.89
156

XI. SOCIAL ACCOUNTS
PROTECTION. 2 -
Belgium
'000 mio Fb
114.89 127.57 148.58 169.89
51.89 56.76 65.62 76.01
66.40 78.84 96.31
108.09
9.37 10.20 9.89
11.46
2.89 2.79 3.37 2.54
245.45 276.17 323.78 367.99
1.95 2.37 2.00 1.63
247.40 278.54 325.78 369.61
Luxembourg
'000 mio Fix
3.53 3.85 4.37 5.00
2.44 2.66 2.98 3.48
3.01 3.60 3.81 4.27
0.79 0.86 0.93 1.02
0.04 0.04 0.07 0.06
9.81 11.01 12.16 13.82
0.37 0.42 0.50 0.64
10.18 11.43 12.66 14.46
RECEIPTS
United Kingdom
'000 mio £
3.246 3.674 4.282 5.024
1.809 2.031 2.419 2.762
3.716 4.286 5.014 5.538
0.884 0.951 1.061 1.322
0.012 0.041 0.016 0.013
9.666 10.983 12.792 14.659
0.065 0.089 0.029 0.040
9.731 11.072 12.821 14.699
Ireland
mio £
41.8 48.5 57.0 75.0
27.0 34.2 42.8 49.3
146.9 169.9 197.8 265.2
1.3 1.6 1.8 2.0
0.1 0.1 0.0 1.5
217.1 254.3 299.4 393.1
53.2 63.7 81.0
119.7
270.3 318.0 380.4 512.7
Denmark
'000 mio Dkr
2.470 2.744 3.311 4.168
1.583 1.806 2.157 0.641
19.707 23.285 26.628 34.575
0.686 0.871 0.949 1.268
0 0 0
(:) 24.446 28.706 33.061 40.652
0 0 0 0
24.446 28.706 33.061 40.652
Year
1970 1971 1972 1973
1970 1971 1972 1973
1970 1971 1972 1973
1970 1971 1972 1973
1970 1971 1972 1973
1970 1971 1972 1973
1970 1971 1972 1973
1970 1971 1972 1973
Table 119
1. Employers'contributions
2. Households' contributions
3. Central and local government contributions
4. Income from capital
5. Other receipts
6. Total receipts excl. yield from transfers between institutions
7. Yield from transfers between in stitutions
8. Total receipts
157
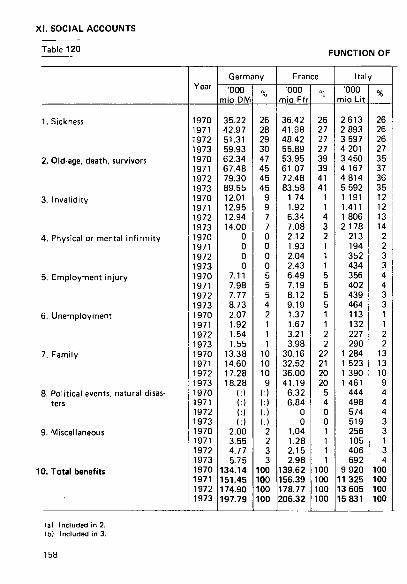
XI . SOCIAL ACCOUNTS
Table 120 FUNCTION OF
1. Sickness
2. Old-age, death, survivors
3. Invalidity
4. Physical or mental inf irmity
5. Employment injury
6. Unemployment
7. Family
8. Political events, natural disasters
9. Miscellaneous
0. Total benefits
Year
1970 1971 1972 1973 1970 1971 1972 1973 1970 1971 1972 1973 1970 1971 1972 1973 1970 1971 1972 1973 1970 1971 1972 1973 1970 1971 1972 1973 1970 1971 1972 1973 1970 1971 1972 1973 1970 1971 1972 1973
Germany
'000 mio DM
35.22 42.97 51.31 59.93 62.34 67.48 79.30 89.55 12.01 12.95 12.94 14.00
0 0 0 0
7.11 7.98 7.77 8.73 2.07 1.92 1.54 1.55
13.38 14.60 17.28 18.28
( ( ( I
) ) ) I
2.00 3.55 4.77 5.75
134.14 151.45 174.90 197.79
n .
26 28 29 30 47 45 45 45
9 9 7 7 0 0 0 0 5 5 5 4 2 1 1 1
10 10 10 9
( ( ( (
) I ) ) 2 2 3 3
100 100 100 100
France
'000 mio Ffr
36.42 41.98 48.42 55.89 53.95 61.07 72.48 83.58
1.74 1.92 6.34 7.08 2.12 1.93 2.04 2.43 6.49 7.19 8.12 9.19 1.37 1.67 3.21 3.98
30.16 32.52 36.00 41.19
6.32 6.84
0 0
1.04 1.28 2.15 2.98
139.62 156.39 178.77 206.32
V
26 27 27 27 39 39 41 41
1 1 4 3 2 1 1 1 5 5 5 5 1 1 2 2
22 21 20 20
5 4 0 0 1 1 1 1
100 100 100 100
Italy
'000 mio Lit
2613 2 893 3 597 4 201 3 450 4 167 4 814 5 592 1 191 1.411 1 806 2 178
213 194 352 434 356 402 439 464 113 132 227 290
1 284 1 523 1 390 1 461
444 498 574 519 256 105 406 692
9 920 11 325 13 605 15 831
%
26 26 26 27 35 37 36 35 12 12 13 14
2 2 3 3 4 4 3 3 1 1 2 2
13 13 10 9 4 4 4 3 3 1 3 4
100 100 100 100
(a) Included ¡n 2. Ib i Included in 3.
158

SOCIAL BENEFITS
XI. SOCIAL ACCOUNTS
Table 120
Netherlands
'000 mio Fl
6.14 7.42
10.20 11.91 9.32
10.93 12.53 14.72
1.87 2.41 3.22 3.89 1.57 2.00 1.25 1.52
0 0 0 0
0.74 0.83 1.37 1.48 3.20 3.67 4.22 4.69 0.13 0.15
0 0
0.02 0.03 0.03 0.09
22.99 27.44 32.83 38.29
%
27 27 31 31 41 40 38 38
8 9
10 10
7 7 4 4 0 0 0 0 3 3 4 4
14 13 13 12
1 1 0 0
0+ 0+ 0+ 0+
100 100 100 100
Belgium
'000 mio Fb
48.55 55.63 65.23 75.50 82.18 91.46
109.29 131.80
9.47 10.65 13.12 14.73 3.61 4.60 5.55 7.42 9.67
11.87 13.19 14.96
9.45 10.79 13.52 15.41 41.53 43.14 48.84 53.47
6.42 7.13
10.08 6.61 6.66 7.43
11.51 17.34
217.54 242.70 290.32 337.23
%
22 23 23 22 38 38 38 39
4 4 5 4 2 2 2 2 4 5 5 4 4 4 5 5
19 18 17 16
3 3 4 2 3 3 4 5
100 100 100 100
Luxembourg
'000 mio Fix
1.47 1.73 1.92 2.26 5.18 5.82 6.88 7.80
la)
0.08 0.08 0.11 0.13 0.59 0.64 0.69 0.77 0.00 0.00 0.00 0.00 0.98 1.11 1.20 1.34 0.16 0.17
0 0
0.05 0.05 0.06 0.07 8.51 9.61
10.86 12.37
%
17 18 18 18 61 60 63 63
1 1 1 1 7 7 6 6
0+ 0+ 0+ 0+ 11 11 11 11 2 2 0 0 1 1 1 1
100 100 100 100
Unit K mad
'000 m i o £
2.102 2.372 2.735 3.084 3.738 4.289 5.076 5.784 0.364 0.404 0.422 0.465 0.265 0.318 0.473 0.552 0.107 0.112 0.136 0.153 0.343 0.511 0.495 0.413 0.862 0.917 0.943 1.065
0 0 0 0
0.177 0.221 0.273 0.327 7.958 9.143
10.553 11.844
ed om
%
26 26 26 26 47 47 48 49
5 4 4 4 3 4 5 5 1 1 1 1 4 6 5 4
11 10 9 9 0 0 0 0 2 2 3 3
100 100 100 100
Ireland
mio £
59.1 68.8 83.3
110.2 76.0 89.4
104.9 135.7
20.2 26.2 29.9 36.9
(bl
0.9 1.1 1.4 1.9
11.8 13.2 16.0 19.1 35.3 39.6 44.9 67.6
0 0 0 0
2.9 4.3 5.8 6.2
206.2 242.6 286.2 377.6
%
29 28 29 29 37 37 37 36 10 11 10 10
0+ 1 1 1 6 5 6 5
17 16 16 18 0 0 0 0 1 2 2 2
100 100 100 100
Denmark
'000 mio Dkr
6.478 7.422 8.822
12.403 8.200 9.341
10.392 12.007
2.092 2.539 3.001 3.730 0.809 0.939 1.019 1.191 0.333 0.369 0.429 0.222 0.688 1.100 0.768 0.810 3.707 4.398 4.987 5.860 0.046 0.059 0.075 0.083 0.261 0.356 1.013 1.103
22.614 26.523 30.506 37.409
%
29 28 29 33 36 35 34 32
9 10 10 10 4 4 3 3 2 1 1 1 3 4 3 2
16 17 16 16 0+ 0+
1 0+
1 1 3 3
100 100 100 100
159

XI . SOCIAL ACCOUNTS
Table 121
SOURCES OF
1. Enterprises
2. Central government
3. Local government
4. Households
5. Social institutions
6. Abroad
7. Miscellaneous
8. Total receipts excl. yield from transfers between institutions
Year
1970 1971 1972 1973
1970 1971 1972 1973
1970 1971 1972 1973
1970 1971 1972 1973
1970 1971 1972 1973
1970 1971 1972 1973
1970 1971 1972 1973
1970 1971 1972 1973
Germany
'000 mio DM
51.61 59.48 69.39 81.36
46.18 51.87 58.01 63.86
8.84 10.43 11.60 13.33
37.12 39.76 48.11 56.97
3.00 3.70 4.82 6.11
0.06 0.05 0.12 0.11
1.29 1.48
(:) (:)
148.10 166.77 192.05 221.74
%
35 36 36 36
31 31 30 29
6 6 '6 6
25 24 25 26
2 2 3 3
0+ 0+ 0+ 0+
1 1
(:) (:)
100 100 100 100
France
'000 mio Ffr
77.32 86.84 97.92
114.40
37.99 41.75 46.37 51.23
5.45 6.15 7.78 8.16
31.00 35.18 39.83 45.45
2.50 2.81 3.06 3.50
0 0 0 0
1.17 1.37 1.32 1.52
155.43 174.10 196.28 224.26
%
50 50 50 51
24 24 24 23
3 .3 4 4
20 20 20 20
2 2 1 1
0 0 0 0
1 1 1 1
100 100 100 100
Italy
'000 mio Lit
5 104 5 905 6 842 8 109
3 050 3 236 3 448 3 860
637 964
1 209 1 521
1 764 1 737 2 035 2 422
444 424 512 543
2 33 16 16
317 409 533 551
11 318 12 708 14.595 17 022
%
45 47 47 48
27 25 24 23
6 8 8 9
15 14 14 14
4 3 3 3
0+ 0+ 0+ 0+
3 3 4 3
100 100 100 100
(a) Included in 2.
160

XI. SOCIAL ACCOUNTS
Table 121
RECEIPTS
Netherl
'000 mio Fl
9.60 11.39 12.76 15.79
5.10 6.27 7.53 9.93
2.01 2.01 2.48 1.94
10.78 12.83 14.96 18.04
2.46 2.89 3.47 4.14
0 0 0 0
0.04 0.11 0.13 0.18
29.99 35.50 41.33 50.02
ands
%
32 32 31 32
17 18 18 20
7 6 6 4
36 36 36 36
8 8 8 8
0 0 0 0
0+ 0+
1 0)
100 100 100 100
Belgium
'000 mio Fb
96.19 107.54 126.54 144.62
75.25 87.64
106.93 120.37
6.11 7.01 7.38 8.59
55.64 60.99 69.67 80.34
9.37 10.20 9.89
11.46
0 0 0
0+
2.89 2.79 3.37 2.61
245.45 276.17 323.78 368.99
%
39 39 39 39
31 32 33 33
3 3 2 2
23 22 22 22
3 3 3 3
0 0 0 +
1 1 1 1
100 100 100 100
Luxembourg
'000 mio Fix
2.67 2.87 3.20
' 3.71
3.44 4.10 4.47 4.97
0.36 0.40 0.45 0.51
2.47 2.70 3.01 3.52
0.83 0.90 0.96 1.05
0+ 0+ 0+ 0+
0.04 0.04 0.07 0.06
9.81 11.01 12.16 13.82
%
27 26 26 27
35 37 37 36
4 4 4 4
25 25 25 25
9 8 8 8
0 0 0 0
0+ 0+ 0+ 0+
100 100 100 100
United Kinqdom '000
mio £
2.334 2.615 3.036 3.587
3.920 4.515 5.240 5.767
0.686 0.803 0.991 1.173
1.817 2.041 2.431 2.774
0.897 0.967 1.078 1.343
0 0 0
0+
0.012 0.041 0.016 0.015
9.666 10.982 12.792 14.659
%
24 24 24 25
41 41 41 39
7 7 8 8
19 19 19 19
9 9 8 9
0 0 0
0^
0+ 0+ 0+ 0+
100 100 100 100
Ireland
mio £
24.5 28.7 34.7 47.5
163.5 188.6 219.7 292.4
(a)
27.5 34.7 42.8 49.4
1.3 1.6 1.8 2.0
0.2 0.6 0.4 0.3
0.1 0.1 0.0 1.5
217.1 254.3 299.4 393.1
%
11 11 12 12
75 74 73 74
13 14 14 13
1 1 1 1
0+ 0+ 0+ 0+
0+ 0+ 0+ 0+
100 100 100 100
Denmark '000
mio Dkr
1.529 1.678 2.154 3.104
16.861 19.562 22.121 26.747
3.700 4.665 5.452 8.442
1.671 1.930 2.369 1.091
0.685 0.871 0.949 1.268
0 0 0 0
0 0
0.016 0
24.446 28.706 33.061 40.652
%
6 6 6 7
69 68 67 66
15 16 17 21
7 7 7 3
3 3 3 3
0 0 0 0
0 0 0 0
100 100 100 100
161

XI . SOCIAL ACCOUNTS
Table 122
SOCIAL SECURITY BENEFITS PER HEAD (a) (Total population)
Yearly averages in national currencies
1 2 3 4 5 6 7 8 9
10 11 12 13 14 15 16 17 18 19 20 21 22
Country
Germany France Italy Netherlands Belgium Luxembourg United Kingdom Ireland Denmark
Greece Turkey Norway Sweden Switzerland Austria Portugal Finland Spain USSR USA Canada Japan
Currency
DM Ffr
1 000 Lit Fl
1 000 Fb 1 000 Fix
£ £ Dkr
Dr Lt Nkr Skr Fs
1 000 Sch Esc Mkf Pes R $ S
1 000 Yens
1968
1 490 1 890
131.9 1 220
16.7 19.3
2 855 61
2 075 2 995 1 085
7.6 715 945
123 340 395
21.4
1969
1 630 2 150
148.9 Î 4 1 0
18.2 20.9
3 135 90
2 370 3 355 1 285
8.3 795
1 050
132 380 440
24.5
1970
1 890 2 360
165.2 1 620
20.2 23.2
120 57.6
4 500
3 510 123
3 045 3 905 1 390
9.0 970
1 190
142 430 505
27.8
1971
2 110 2 640
188.4 1 910
22.5 26.0
140 67.4
5 230
3 9 1 5 167
3 690 4 545 1 600
10.0 1 195 1 420
152 510 585 33.7
1972
2 430 2 990
223.1 2 240
26.5 29.4
160 78.7
5 980
1973
2 750 3 430
260.1 2 570
30.7 32.9
180 102.1
7 320
(a) Since they do not cover the same field of observation the harmonized series of the EC countries are only partly comparable with those of the I LO for the other countries. Sources: E.C.: Social accounts.
Other countries: Preliminary details from 'I.L.O. — The cost of social security — Eighth international survey, 1967—71'.
162
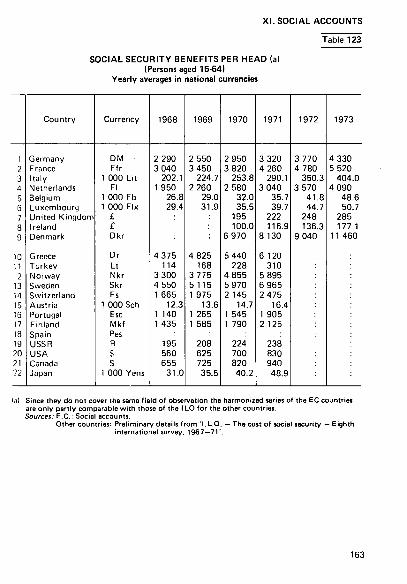
XI . SOCIAL ACCOUNTS
SOCIAL SECURITY BENEFITS PER HEAD (a) (Persons aged 15-64)
Yearly averages in national currencies
Table 123
1 ? 3 4 5 6 7 8 9
10 11 12 13 14 15 16 17 18 19 20 .'1 22
Country
Germany France Italy Netherlands Belgium Luxembourg United Kingdom Ireland Denmark
Greece Turkey Norway Sweden Switzerland Austria Portugal Finland Spain USSR USA Canada Japan
Currency
DM -Ffr
1 000 Lit Fl
1 000 Fb 1 000 Fix
£ £ Dkr
Dr Lt Nkr Skr Fs
1 000 Sch Esc Mkf Pes R S S
1 000 Yens
1968
2 290 3 040
202.1 1 950
26.8 29.4
4 375 114
3 300 4 550 1 665
12.3 1 140 1 435
195 560 655
31.0
1969
2 550 3 450
224.7 2 260
29.0 31.9
4 825 168
3 775 5 115 1 975
13.6 1 265 1 585
208 625 725 35.5
1970
2 950 3 820
253.8 2 580
32.0 35.5
195 100.0
6 970
5 440 228
4 855 5 970 2 145
14.7 1 545 1 790
224 700 820 40.2
1971
3 320 4 260
290.1 3 040
35.7 39.7
222 116.9
8 130
6 120 310
5 895 6 965 2 475
16.4 1 905 2 125
238 830 940 48.9
1972
3 770 4 780
350.3 3 570
41.8 44.7
248 136.3
9 040
1973
4 330 5 520
404.0 4 090
48.6 50.7
285 177.1
11 460
i<i) Since they do not cover the same f ield of observation the harmonized series of the EC countries are only partly comparable w i th those of the ILO for the other countries. Sources: E.C.: Social accounts.
Other countries: Preliminary details f rom ' I .L .O. — The cost of social security — Eighth International survey, 1967—71'.
163

XI. SOCIAL ACCOUNTS
Table 124
SOCIAL SECURITY EXPENDITURE AS PERCENTAGE OF GROSS DOMESTIC PRODUCT AT MARKET PRICES (a)
l 2 3 4 5 6 7 8 9
10 11 12 13 14 15 16 17 18 19 20 21 22
Country
Germany France Italy Netherlands Belgium Luxembourg United Kingdom Ireland Denmark
Greece Turkey Norway Sweden Switzerland Austria Portugal Finland Spain USSR USA Canada Japan
196
17.7 16.7 14.4 14.1 15.E 15.2
2 1968
20.4 19.1 19.0 19.7 18.1 18.8
11.4 2.0
12.6 17.3 9.7
19.4 5.2
13.4
12.0 8.8
12.7 5.6
1969
20.0 19.1 19.1 20.0 18.1 17.5
11.2 2.7
13.4 17.9 10.6 19.5
5.3 12.9
12.1 9.4
13.5 5.5
1970
20.7 18.9 18.8 20.8 18.5 16.6 16.3 13.2 19.9
11.2 3.2
15.1 18.8 10.6 18.8
5.7 13.1
11.9 10.5 14.7
5.7
1971
21.2 19.1 20.2 21.9 18.9 18.4 16.7 13.7 21.4
11.5 4.1
16.2 20.6 10.8 19.0 6.3
14.3
12.2
197
22.: 19.¿ 21.7 23.; 20.; 18.Í 17.1 .13.7 21.Ê
2 1973
22.7 19.8 21.4 24.0 20.5 18.1 17.4 15.0 23.2
(a) Since they do not cover the same field of observation the harmonized series of the EC countries are only partly comparable w i th those of the I LO for the other countries. Sources: E.C.: Social accounts.
Other countries: Preliminary details f rom ' I .L.O. — The cost of social security - Eighth international survey, 1967—71'.
164

XII. STANDARD OF LIVING
NUTRITIONAL VALUE OF FOOD CONSUMPTION 1973
Table 125
1 2 3 4 5 6 7 8 9
10 11 12 13 14 15 16 17 18 19 20 21 22
Country
EUR-9
Germany France Italy Netherlands Belgium Luxembourg United Kingdom Ireland Denmark
Greece Turkey Norway Sweden Switzerland Austria Portugal Finland Spain USSR USA Canada Japan
Calories per head per day
3 234
3 238 3219 3 343 3 176
> 3 441
3 130 3 379 3 229
2 980
3 0 1 1 2 760 3 296 3 332 3 297 3 126 2 829
3 3 1 6 3 158 2 571
Proteins (grammes per head per day)
93.0
88.0 102.7 105.3 88.8
96.3
87.9 100.5 92.2
102.1
85.0 83.9 92.5 87.8 93.2 96.4 90.2
103.6 95.9 81.2
of which: animal proteins
57.0
57.5 67.0 48.9 57.9
58.6
54.6 62.3 65.5
45.5
54.6 57.6 57.5 53.9 39.0 66.5 45.9
72.6 65.0 32.2
Fats (grammes per head per day)
151.0
168.2 157.1 127.2 149.7
180.7
139.8 143.0 160.3
103.6
146.7 121.8 154.4 167.1 123.4 132.3 111.3
163.4 147.6 68.4
Source: OECD.
165
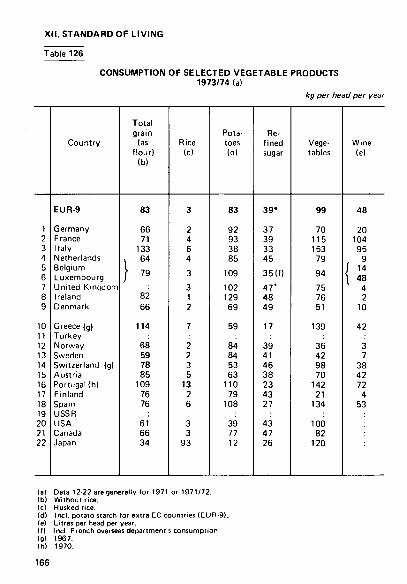
XI I . STANDARD OF LIVING
Table 126
CONSUMPTION OF SELECTED VEGETABLE PRODUCTS 1973/74 (a)
kg per head per year
1 2 3 4 5 6 7 8 9
10 11 12 13 14 15 16 17 18 19 20 21 22
Country
EUR-9
Germany France Italy Netherlands Belgium Luxembourg United Kingdom Ireland Denmark
Greece (g) Turkey Norway Sweden Switzerland (g) Austria Portugal (h) Finland Spain USSR USA Canada Japan
Total grain
(as flour)
(b)
83
66 71
133 , 64
} 79
82 66
114
68 59 78 85
109 76 76
61 66 34
Rice (c)
3
2 4 6 4
3
3 1 2
7
2 2 3 5
13 2 6
3 3
93
Potatoes (d)
83
92 93 38 85
109
102 129 69
59
84 84 53 63
110 79
108
39 77 12
Refined sugar
39*
37 39 33 45
35( f )
47" 48 49
17
39 41 46 38 23 43 27
43 47 26
Vegetables
99
70 115 153
79
94
75 76 51
139
36 42 98 70
142 21
134
100 82
120
Wine (e)
48
20 104 95
, 9 Í 14 1 48 V 4
2 10
42
3 7
38 42 72
4 53
lal Data 12-22 are generally for 1971 or 1971/72. (b) Without rice. Ic) Husked rice. Id) Incl. potato starch for extra EC countries (EUR-9!. lei Litres per head per year. (f) Incl. French overseas department's consumption. Igl 1967. (h) 1970.
166

XI I . STANDARD OF LIVING
Table 127
CONSUMPTION OF SELECTED ANIMAL PRODUCTS
1974(a)
kg per head per year
1 2 3 4 5 6 7 8 9
10 11 12 13 14 15 16 1/ 18 19 20 21 22
Country
EUR-9
Germany France Italy Netherlands Belgium Luxembourg United Kingdorr Ireland Denmark
Greece Turkey Norway Sweden Switzerland Austria Portugal Finland Spain USSR USA Canada Japan
Meat (careass weight)
81
89 97 65
\ 71 \ 92
74 92 64
43
45 53 76 80 45 55 48
108 95 25
εggs (in shell)
13.6
16.8 12.5 11.1 11.2
11.6
15.0 12.6 10.9
10.7
10.1 12.8 11.1 13.6 4.8
10.8 11.5
16.9 13.2 14.7
Total fats and oils
(pure fat content)
(b)
20
19 19 21 31
26
15 10 25
18
28 18 22 27 26 21 19
25 23 12
Butter (pure fat content)
5.7
6.0 7.8 1.8 1.6
8.5
7.4 10.7
7.1
0.9
4.3 4.5 5.7 0.5 0.6
11.9 0.2
1.8 5.0 0.5
Liquid milk
(c) (dl
99
85 81 68
138
86
144 221 141
67
173 105 129 140
57 258
93
117 140 28
(a) Data 12-22 are generally for 1972 or 1972/73. (b) Data 10 - 22, calendar year 1972. (c) Incl. skim milk used for standardized mi lk. (d) Data 1 -9, fresh products wi thout cream.
167

XI I . STANDARD OF LIVING
Table 128
CONSUMPTION OF ENERGY AND STEEL PER HEAD OF POPULATION 1974
1 2 3 4 5 6 7 8 9
10 11 12 13 14 15 16 17 18 19 20 21 22
Country
EUR-9
Germany France Italy Netherlands Belgium Luxembourg United Kingdom Ireland Denmark
Greece Turkey Norway Sweden Switzerland Austria Portugal Finland Spain USSR USA Canada Japan
World
Energy (a)
Total
tee
5.210
6.128 4.919 3.326 6.535 6.812
20.595 5.679 3.494 5.571
2.132 0.625 8.864 7.703 5.069 4.508 1.366 5.708 2.304 5.167
12.298 11.875 4.114
2.131
Electricity
Industrial uses
kWh
1 891
2 464 1 821 1 491 1 916 2 561 7 717 1 707
784 891
885 197
10 384 4 868 1 756 1 763
625 3 853 1 202 2 223 3 710 5 920 2 000
14
Other uses
kWh
1 708
2 078 1 380
866 1 685 1 304 1 871 2 489 1 293 2 221
586 133
5716 3 544 2 806 1 818
418 1 937
687 1 059 4 810 4 900 1 800
00
Steel (b)
Crude steel equivalent
kg
492
679 460 427 428
> 521
' 412 179 460
168 51
627 774 402 445 157 412 343 546 680 692 688
179(c)
(a) 1973. lb) UN figures. (c) Output per head of populat ion.
168
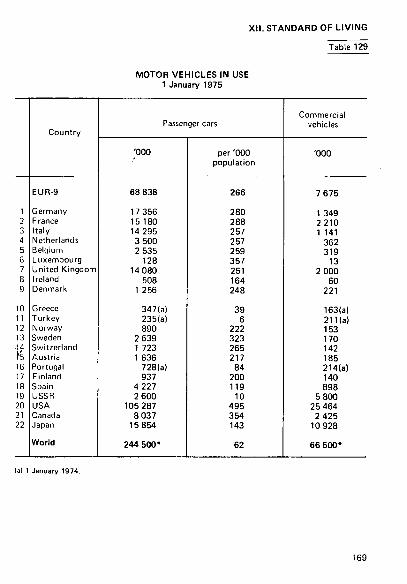
XI I . STANDARD OF LIVING
MOTOR VEHICLES IN USE
1 January 1975
Table 129
I
2
3 ■1
5
6 7
8
9
10
11
12 13 14
Γ5 10
17
18 19
20
21
22
Country
EUR-9
Germany
France
Italy
Netherlands
Belgium
Luxembourg United Kingdom
Ireland
Denmark
Greece
Turkey
Norway Sweden
Switzerland
Austria
Portugal
Finland Spain
USSR USA
Canada
Japan
World
Passenger cars
'000
68 838
17 356
15 180
14 295
3 500
2 535
128
14 080
508
1 256
347(a)
235(a)
890
2 639
1 723
1 636
728(a)
937
4 227
2 600
105 287
8 037
15854
244 500*
per'000
population
266
280
288
257
257
259
357
251
164
248
39
6
222
323
265
217
84
200
119
10
495
354
143
62
Commercial
vehicles
'000
7 675
1 349
2 210
1 141
362
319 13
2 000
60
221
163(a)
211(a) 153
170 142
185
214(a)
140
898
5 800 25 464
2 425
10 928
66 500*
id) 1 January 1974.
169
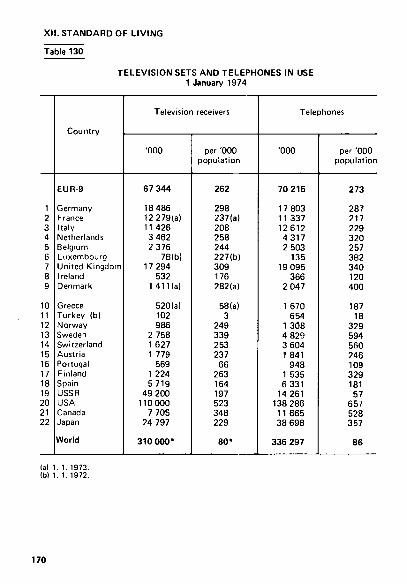
XI I . STANDARD OF LIVING
Table 130
TELEVISION SETS AND TELEPHONES IN USE 1 January 1974
1 2 3 4 5 6 7 8 9
10 11 12 13 14 15 16 17 18 19 20 21 22
Country
EUR-9
Germany France Italy Netherlands Belgium Luxembourg United Kingdom Ireland Denmark
Greece Turkey (b) Norway Sweden Switzerland Austria Portugal Finland Spain USSR USA Canada Japan
World
Television receivers
'000
67 344
18 486 12 279(a) 11 426 3 462 2 376
78(b) 17 294
532 1 411(a)
520(a) 102 986
2 758 1 627 1 779
569 1 224 5 719
49 200 110 000
7 705 24 797
310 000*
per '000 population
262
298 237(a) 208 258 244 227(b) 309 176 282(a)
58(a) 3
249 339 253 237
66 263 164 197 523 348 229
80*
Telephones
Ό00
70 215
17 803 11 337 12612 4 3 1 7 2 503
135 19 095
366 2 047
1 670 654
1 308 4 829 3 604 1 841
948 1 535 6 331
14 261 138 286
11 665 38 698
336 297
per '000 population
273
287 217 229 320 257 382 340 120 400
187 18
329 594 560 246 109 329 181
57 657 528 357
86
la) 1. 1. 1973. (b) 1. 1. 1972.
170

XI I . STANDARD OF LIVING
Table 131
HEALTH SERVICES 1972
l 2 3 4 5 6 7 8 9
10 11 12 13 14 15 16 17 18 19 20 21 22
Country
EUR-9 EUR-6
Germany France Italy Netherlands Belgium Luxembourg United Kingdom Ireland Denmark
Greece Turkey Norway Sweden Switzerland Austria Portugal Finland Spain USSR USA Canada Japan
Doctors
'000
413.6 327.7
113.6 74.6
105.1 18.1 15.9 0.4
74.3 3.6 8.1
15.5 17.4 6.0
11.9 9.8
14.4 9.0 5.8
49.3 634.0 345.3
34.5 123.4
per 100 000
population
162 170
184 141 193 136 164 108 133 118 163
173 48
152 147 153 192 102 118 143 256 165 158 116
Pharmacists
'000
117.6 96.4
23.2 28.0 37.1
1.1 6.9 0.2
17.4 1.71b) 2.0
2.6(d) 3.9 1.3 3.4 1.1(b) 2.7 2.8 4.8
16.9 47.7(c)
132.9 11.6 69.5
per 100 000
population
46 50
38 53 68
8 71 47 31 57 40
30 10 34 42 18 36 32
103 49 20 64 53 66
Hospital beds (a)
'000
2 607.6 2 007.0
701.3 506.8 575.2 136.4 83.4
3.9 518.4
34.5 47.7(c)
56.0 75.5 52.8
123.1 72.3 81.4 53.5 60.6
177.4 2 793.1 1 508.0
209.2 1 364.3
per 100 000 population
1 018 1 044
1 137 958
1 058 1 024
859 1 134
929 1 145
956
629 204
1 342 1 516 1 139 1 087
606 1 310
514 1 128
722 957
1 287
(a) Incl. clinics, mental hospitals, sanatoria and rest and convalescent homBS. (bl 1971. (cl 1970. (d) 1965.
171
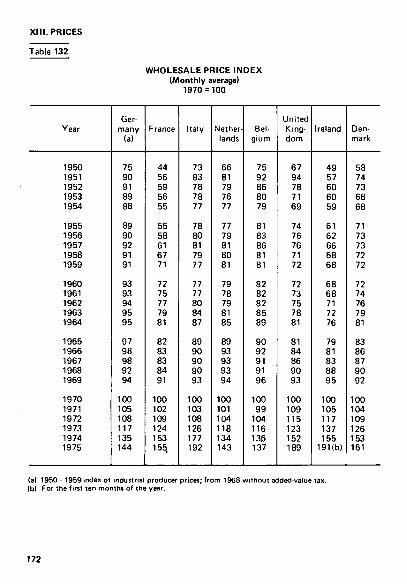
XI I I . PRICES
Table 132
WHOLESALE PRICE INDEX (Monthly average)
1970 = 100
Year
1950 1951 1952 1953 1954
1955 1956 1957 1958 1959
1960 1961 1962 1963 1964
1965 1966 1967 1968 1969
1970 1971 1972 1973 1974 1975
Germany (a)
75 90 91 89 88
89 90 92 91 91 93 93 94 95 95 97 98 98 92 94
100 105 108 117 135 144
France
44 56 59 56 55
55 58 61 67 71
72 75 77 79 81 82 83 83 84 91 100 102 109 124 153 155,
Italy
73 83 78 78 77
78 80 81 79 77
77 77 80 84 87
89 90 90 90 93
100 103 108 126 177 192
Netherlands
66 81 79 76 77
77 79 81 80 81 79 78 79 81 85 89 93 93 93 94
100 101 104 118 134 143
Belgium
75 92 86 80 79
81 83 86 81 81 82 82 82 85 89 90 92 91 91 96
100 99 104 116 136 137
United Kingdom
67 94 78 71 69 74 76 76 71 72
72 73 75 78 81 81 84 86 90 93
100 109 115 123 152 189
Ireland
49 57 60 60 59
61 62 66 68 68
68 68 71 72 76 79 81 83 88 95
100 105 117 137 155 191(b)
Denmark
58 74 73 68 68 71 73 73 72 72 72 74 76 79 81 83 86 87 90 92 100 104 109 126 153 161
(a) 1950 - 1959 index of industrial producer prices; f rom 1968 wi thout added-value tax. (b) For the first ten months of the year.
172

XI I I . PRICES
Table 133
CONSUMER PRICE INDEX (Monthly average)
1970 = 100
Year
1950 1951 1952 1953 1954
1955 1956 1957 1958 1959
1960 1961 1962 1963 1964
1965 1966 1967 1968 1969 1970 1971 1972 1973 1974
1975
Germany la)
64 69 70 69 69
70 71 73 74 75
76 79 82 84 86
89 92 93 95 97
100 105 111 119 127
135
France lb)
39 46 50 50 50 50 52 53 61 65 67 69 73 76 79
81 83 85 89 95
100 105 112 120 136
152
Italy
48 53 55 59 61 62 64 65 66 66
68 70 73 78 83
87 88 91 93 95
100 105 111 123 146 171
Netherlands
48 53 54 53 57
57 59 62 62 64
65 66 68 71 74
79 84 86 89 96 100 108 116 126 138 152
Belgium (c)
61 67 68 67 69
68 71 72 73 74
74 75 76 78 81
84 88 90 92 96
100 104 110 118 133 150
Luxembourg (c)
65 71 73 73 73
73 73 76 77 77
77 77 78 81 84
86 89 91 93 95 100 104 110 117 128
142
United Kingdom
45 49 54 55 56
59 62 64 66 66
67 69 73 74 76
80 83 85 89 94
100 109 117 128 149 185
Ireland
44 47 51 54 54
55 58 60 63 63
63 65 67 69 74 77 80 82 86 92 100 109 118 132 154
186
Denmark
42 47 49 49 49
52 55 57 57 58
59 61 65 69 71
73 78 84 91 94
100 106 113 123 142
156
(a) Incl. Saar f rom 1960 onwards; f rom 1962 incl. West Berl in. (b) Unt i l end 1962, Paris only ; f rom January 1963 onwards, France; new series as f rom 1971. (c) Excl. rent.
173

XIV. FINANCE
Table 134
CONVERSION RATES 1 Eur =
2 3 4 5 6 7 8 9
10 11 12 13 14 15 16 17 18 19 20 21 22
Country
Germany France Italy Netherlands Belgium Luxembourg United Kingdom Ireland Denmark
Greece Turkey Norway Sweden Switzerland Austria Portugal Finland Spain USSR USA Canada Japan
Currency
DM Ffr Lit. Fl Fb y Fix 1
* ) Dkr
Dr Lt Nkr Skr Fs Sch Esc Mkf Pes
US$ Can $ Yen
1960
4.20000 4.93706 625.000 3.80000
50.0000
0.357143
6.90714
30.0000 5.07616 7.14286 5.17321 4.37282 26.0000 28.7500 3.20000 60.0000
1.00000 1.10000 360.000
1961
4.03507
3.65205
9.00000 -
1962
4.00000
3.62000
1.08735
1963
1.08108
1964 1965 1966
1a) For the non-floating currencies, the conversion rate has been computed on the basis of the parity οι central rate. For the currencies which have been floated or have stayed f loating in the year indicated wi th an asterisk ( · ) , the relation wi th the Eur is a market relat ion, based: — as to the Italian lira, the pound sterling and the Irish pound, the US dollar and the yen. on the
method described in the monthly bullet in 'General Statistics' (Table 853), — as to other currencies, in combining the market rate of the US dollar in terms of these currencies
and the market relation of this currency wi th the Eur.
174

XIV. FINANCE
Table 134
IN EUR (a) (yearly averages)
1967
0.364318 6.97374
3.42191 61.1507
1968
0.416667 7.50000
4.19997 70.0000
1969
3.93852 5.17884
1970
3.66000 5.55419
11.3836
1.05'
1971
3.65514
625.191 3.61707 49.9595
7.50236
30.0775 15.0060 7.14503 5.17478 4.18870 25.2083 28.7752 4.20755
1.00258 1.01 "
359.228
1972
3.49872
631.342 3.52281 48.6572 -
0.437" 7.57831 -
32.5714 15.2000 7.21500 5.22545 4.16915 25.2971 29.5857 4.45143
1.08571 1.08'
334.400
1973
3.32811
729* 3.47410
0.511'
37.0' 17.5"
7.17170 5.46698
3.96* 24.5* 30.8" 4.79" 73.5*
1.25* 1.25* 339*
1974
3.21978 6.01* 813*
3.35507
0.534"
37.5* 17.4*
6.87144 5.50094
3.72* 23.4* 31.8* 4.70* 72.1*
1.25" 1.22* 363'
2 3 4 5 6 7 8 9
10
12 I3 I4 15 lb 18 19 20
22
175

XIV. FINANCE
Table 135
BALANCES OF PAYMENTS BY MAIN HEADING
1 2 3 4 5 6 7 8 9
10 11 12 13 14 15 16 17 18 19 20 21 22
Country
EUR-9
Germany France Italy Netherlands Belgium Luxembourg United Kingdom Ireland Denmark
Greece Turkey Norway Sweden Switzerland Austria Portugal Finland Spain USSR USA Canada Japan.
A. Goods and services
Goods (fob)
- 3 456
17 621 - 3 118 - 6 761
130
) 715
- 9 581 - 1 026 - 1 436
( b l - 2 309 - 1 504 - 1 793
(b l · 474
- 1 154
(b l - 1 077 - 5 673
- 4 422 1 255 1 149
Services
2 184
- 4 713 351 556
1 429
321
3 484 234 522
821 1 120 1 054
14
726
118 2 157
12 241 - 3 054 - 4 674
Total
- 1 272
12 908 - 2 767 - 6 205
1 559
1 036
- 6 097 - 792 - 914
- 1 488 - 384 - 739 - 460
- 428
- 959 - 3 516
7 819 - 1 799 - 3 525
B. Unrequited transfers
Private
3 790*
- 2 987 - 1 124
457 - 201
140
- 170
23
519 52 15 73
50
3 990
823 372
67
Official
- 4 543 ·
- 2 203 - 893 - 485
41
- 440
- 742
149
0 3
95 - 275
9
17 7
- 5 118 78
- 162
Total
8 333
- 5 190 - 2017
28 - 242
- 300
- 912 230 126
519 55 80
- 348
41
14 983
- 5 941 450
- 229
(a) Including 'errors and omissions', (bl Exports fob / imports cif. (c) Including capital transactions of commercial banks and 'errors and omissions'. (d) Not including capital transactions of commercial banks [see note (c) |. le) See note.(c).
176

XIV. FINANCE
Table 135
1974 - NET FLOWS IN MIO EUR
c. Total
ÍA+BI
9 605
7 718 - 4 784 - 6 233
1 317
736
-7 009 - 562 - 788
- 969 - 329 - 819 - 808
- 387
- 973 "2 533
1 878 - 1 349 - 3 754
D . Capital of non-monetary sectors
Private sector
4 588*
- 3 988 3 637 1 766
- 515
- 105
3 017
(a) 647
444 - 313
845 335
294
702 1 221
-10773
- 1 622
Official sector
- 871*
- 456 - 290
191 - 170
- 80
- 575
37
47 81
- 26 - 78
118
13 45
2 047
- 826
Total
3 717
- 4 444 3 347 1 957
685
185
2 442 601 684
491 394 819 257
412
715 1 266
- 8 726 (c) 1 998 - 2 448
E. Capital and gold of monetary sector
Commercial
banks
2 330*
- 3419 237 584
44
473
865
- 241
137 0
76 - 283
125
176 803
1 985
6 288
Central monetary insti
tutions
6 648*
592 251
3 684 - 794
- 155
2 837
345
337 466
- 245 621
- 213
57 571
997
57
Total
4 318
- 2 827 488
4 268 - 750
- 628
3 702 39
104
474 466
- 169 338
93
233 1 374
2 982 (dl- 649
6 231
F. Contra-entry to net SDRs allocations
0
0 0 0 0
0
0 0 0
0 0 0 0
0
0 0
0 0 5
G. Errors
and omissions
1 570
447 949
8 118
77
865
4 257 169 213
68
25 - 107
3 866 (e) :
- 34
1 2 3 4 5 Q 7 8 9
10 11 12 13 14 15 16 17 18 19 20 21 22
177

XIV. FINANCE
Table 136
CENTRAL GOVERNMENT DEBT
Mio Eur
1 2 3 4 b 6 7 8 9
10 11 12 13 14 15 16 17 18 19 20 21 22
Country
EUR-9
Germany France Italy Netherlands Belgium Luxembourg United Kingdom Ireland (a) Denmark
Greece Turkey Norway Sweden Switzerland Austria Portugal (a) Finland Spain USSR USA Canada Japan
Domestic
1973
33 249 13 991 25 922 11 547 15 554
281 68 554
3 936
432 278
22 218
1974
38 835 14611 31 825 12 304 16 748
282 71 628
4 774
518 212
26 562
Foreign
1973
24£ 1 49S
; ï ; 145 56
5 51C
181
29C
124
197
22! 1 36¿
1
Í 115 5Í
5 24C
16£
23E
10Í
Total
4 1973
33 498 15 490 25 929 11 559 15 696
337 74 064
2 995
4 117 9 381 1 640
568
267 760 23 304 22 342
1974
39 057 15 975 31 829 12310 16 865
337 76 868
2 092
4 940 11 273 2 182
451
269 520 27 268 26 667
lal Years 1971 and 1972.
178
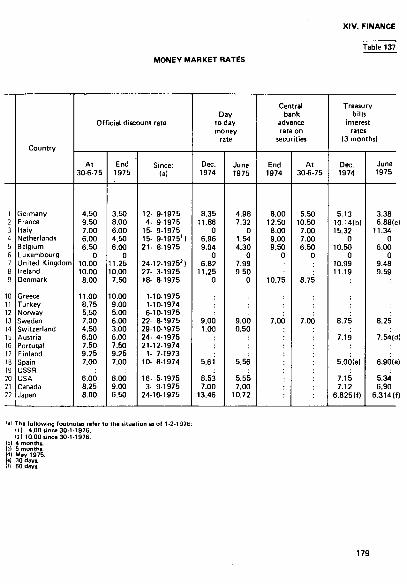
MONEY MARKET RATES
XIV. FINANCE
Table 137
l
2
3
4
5
6
7
8
9
IO
11
I2
13
14
lb
16 17
IS
Ι
ΣΟ
21
2?
Country
Germany
France
Italy
Netherlands
Belgium
Luxembourg
United Kingdom
Ireland
Denmark
Greece
Turkey
Norway
Sweden
Switzerland
Austria
Portugal
Finland
Spain
USSR
USA
Canada
Japan
Official discount rate
At
30675
4.50
9.50
7.00
6.00
6.50
0
10.00
10.00
8.00
11.00
8.75
5.50
7.00
4.50
6.00
7.50
9.25
7.00
6.00
8.25
8.00
End
1975
3.50
8.00
6.00
4.50
6.00
0
11.25
10.00
7.50
10.00
9.00
5.00
6.00
3.00
6.00
7.50
9.25
7.00
('..00
9.00
6.50
Since:
(a)
12 91975
4 91975
15 91975
15 91975'1
21 81975
24.12.1975')
27 31975
18 81975
1101975
1101974
6101975
22 81975
29101975
24 41975
21121974
1 71973
10 81974
16 51975
3 91975
24101975
Day
to day
money
rate
Dec.
1974
8.35
11.86
0
6.96
9.04
0
6.82
11.25
0
9.00
1.00
5.61
8.53
7.00
13.46
June
1975
4.98
7.32
0
1.54
4.30
0
7.99
9.50
0
9.00
0.50
5.56
5.55
7.00
10.72
Central
bank
advance
rate on
securities
End
1974
8.00
12.50
8.00
9.00
9.50
0
10.75
7.00
At
306
5 . «
10.5(
7.0C
7.0C
6.5Í
t
8.7!
7.0C
Treasury
bill
interest
rate
(3 months)
Dec.
75 1974
5.13
10.14(b)
15.32
0
10.50
0
10.99
11.19
8.75
7.19
5.0Ó(el
7.15
7.12
6.825(f)
June
1975
3.38
6.88(c)
11.34
0
6.00 0
9.48
9.59
8.25
7.54(d)
6.90(e)
5.34
6.90
6.314(f)
!a> The following footnotes refer to the situation as of 121976: ID 4.00 since 3011976. (2) 10.00 since 3011976.
b| 4 months. c| 5 months. d| Mev 1975. β) 30 days. 0 60 days.
179

XIV. FINANCE
Table 138
MONEY SUPPLY
Mio Eur
l 2 3 4 5 6 7 8 9
10 11 12 13 14 15 IG 17 18 19 20 21 22
Country
EUR-9
Germany France Italy Netherlands Belgium Luxembourg United Kingdom Ireland Denmark
Greece Turkey Norway Sweden Switzerland Austria Portugal Finland Spain USSR USA Canada Japan
Notes and coins in circulation
1973
62 997
14 756 16 134 13 996
3 553 4 947
10 8 397
413 791
1 764 1 179 1 316 2 857 4912 2 004 1 242
372 5 265
51 736 4 160
26 882
1974
64 107
16 002 16 361 12 407 3 830 5310
10 8 948
428 811
2 149 1 539 1 567 3 201 5 535 2 259 2 192
457 6 200
52 595 4 803
29 559
Scriptural money
1973
168 016
29 337 43 679 59 786
6 920 6912
277 15 879
613 4613
767 2 883 2 275 1 346 9 376 2 379 4 135
904 12 898
178 099 11 808 92 030
1974
174 040
33 204 47 622 56 586
7 922 7 590
297 15 330
570 4919
842 3 698 2 626 2 025 9 142 2 526 3 547 1 088
15617
169 924 11 689 94 270
Total
1973
231 013
44 093 59 813 73 782 10 473 11 859
287 24 276
1 026 5 404
2 531 4 062 3 591 4 203
14 288 4 383 5 377 1 276
18 163
229 835 15 968
118912
1974
238 147
49 206 63 983 68 993 11 752 12 900
307 24 278
998 5 730
2 991 5 237 4 193 5 226
14 677 4 785 5 739 1 545
21 817
222 519 16 492
123 829
180
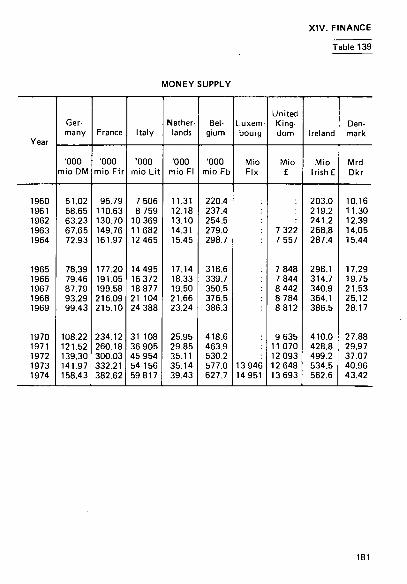
MONEY SUPPLY
XIV. FINANCE
Table 139
Year
1960 1961 1962 1963 1964
1965 1966 1967 1968 1969
1970 1971 1972 1973 1974
Germany
'000 mio DM
51.02 58.65 63.23 67.65 72.93
78.39 79.46 87.79 93.29 99.43
108.22 121.52 139.30 141.97 158.43
France
'000 mio Ffr
95.79 110.63 130.70 149.76 161.97
177.20 191.05 199.58 216.09 215.10
234.12 260.18 300.03 332.21 382.62
Italy
'000 mio Lit
7 506 8 759
10 369 11 682 12 465
14 495 16 372 18 877 21 104 24 388
31 108 36 905 45 954 54 156 59 817
Netherlands
'000 mio Fl
11.31 12.18 13.10 14.31 15.45
17.14 18.33 19.50 21.66 23.24
25.95 29.85 35.11 35.14 39.43
Belgium
'000 mio Fb
220.4 237.4 254.5 279.0 298.7
318.6 339.7 350.5 376.5 386.3
418.6 463.9 530.2 577.0 627.7
Luxembourg
Mio Fix
13 946 14 951
United Kingdom
Mio £
7 322 7 557
7 848 7 844 8 442 8 784 8812
9 635 11 070 12 093 12 648 13 693
Ireland
Mio Irish £
203.0 219.2 241.2 268.8 287.4
298.1 314.7 340.9 364.1 386.5
410.0 428.8 499.2 534.5 562.6
Denmark
Mrd Dkr
10.16 11.30 12.39 14.05 15.44
17.29 19.75 21.53 25.12 28.17
27.88 29.97 37.07 40.96 43.42

XIV. FINANCE
Table 140
FINANCIAL MARKET RATES
1 2 3 4 5 6 7 8 9
10 11 12 13 14 15 16 17 18 19 20 21 22
Country
EUR-9
Germany France Italy Netherlands Belgium Luxembourg United Kingdorr Ireland Denmark
Greece Turkey Norway Sweden Switzerland Austria Portugal (a) Finland Spain USSR USA Canada Japan
Index of shares
quotations
1970
1973
123
100 117 96
116 147 169 130 169 201
146 130 103 130 139 234 168
132 138 222
= 100
1974
86
85 95 88 89
121 181
76 113 150
137 136
78 131 357 227 170
102 115 188
Yields on shares
197
3.2' 3.11 2.5C 4.9C 3.7"
4.11
3.4< 2.4£ 3.1C
3.0c 3.K 1.9C
3 197'
4.2( 4.4f 2.9!
) 7.0( 5.3
8.0(
3.8S 3.4 -
2.8:
4.4" 4.71 2.41
Yield on fixed interest securities
Central government
1 1973
) 9.30 9.00
> 6.77 ) 7.92
7.44 6.79
) 10.71 11.59 11.07
6.19 1 7.39
5.60
: 6.01
6.30 7.56 7.26
1974
10.40 11.03 8.42 9.82 8.68 7.27
14.77 15.98 14.55
7.10 7.79 7.15
5.50
6.99 8.90 9.26
Private sector
1973
9.80 9.13 7.29 8.18 6.31 7.14
11.41
7.25 5.91 7.79
8.72 8.95
7.80 8.47 8.68
1974
11.10 11.45 9.43
10.30 8.10 9.39
16.44
7.80 7.76 8.57
9.25 11.25
8.98 10.17 10.18
(a) 1972 and 1973.
182

INDEX OF SHARE PRICES 1970= 100(a)
XIV. FINANCE
Table 141
Year
1960 1961 1962 1963 1964
1965 1966 1967 1968 1969
1970 1971 1972 1973 1974
EUR
10C 10" 12£ 12: 8E
9 EUR-6
100 110 99 94 92 85 79 77 91 104
100 95 104 110 92
Germany
102 105 81 81 91 83 77 78 103 112
100 97 106 100 85
France
89 104 115 104 90 83 79 73 78 97
100 98 109 117 95
Italy
134 153 130 112 87 85 101 93 92 102
100 78 74 96 88
Netherlands
91 99 86 90 96 88 72 76 98 109
100 95 109 116 89
Belgium
98 102 103 105 112
108 94 89 97 105
100 109 124 147 121
Luxembourg
121 141 133 122 123
128 105 90 89 98
100 110 124 169 181
United King-
. dom
69 71 66 75 80 75 75 81 114 113
100 118 150 130 76
Ireland
43 51 67 83 81 75 75 107 113
100 97 143 169 113
Denmark
96 96 97 93 110 113 118 95 100 112
100 93 131 201 150
(a) 1970 figures are taken as a basis of comparison, but are not used as a basis for weighting. Each country 's figures, prepared f rom indices varying particularly as regards weighting, were reduced to the common 'basts of comparison' for 1970. The figures must not be considered as ful ly comparable.

XIV. FINANCE
Table 142
GROSS RESERVES IN GOLD AND CONVERTIBLE CURRENCIES
Mio Eur
1 2 3 4 5 6 7 8 9
10 11 12 13 14 15 16 17 18 19 20 21 22
Country
EUR-9
Germany France Italy Netherlands Belgium Luxembourg United Kingdom Ireland Denmark
Greece Turkey Norway Sweden Switzerland Austria Portugal Finland Spain USSR USA Canada Japan
Gc hold
1973
14 520
4 348 3 532 2 458 2 041
> 1 476 I 587
15 63
118 121 33
195 2810
705 930
28 482
9 628 742 713
Id ings
1974
13 848
4 349 3 281 2 081 2 042
1 476
543 13 63
124 122 34
198 2 852
716 954
28 489
8 893 753 724
Convertible currencies
1973
34 368
20 444 3 088 1 806 2 784
1 560
3 133 757 796
661 1 511 1 081 1 639 4 006 1 390 1 313
340 4 711
8 3 152 8 162
1974
29 401
15 450 2 886 2 382 2617
1 821
2 954 801 490
599 1 295 1 355
998 4 357 1 814
900 350
4 450
4 3 025 9 078
Total
1973
48 888
24 792 6 620 4 264 4 825
3 036
3 720 772 859
779 1 632 1 114 1 834 6816 2 095 2 243
368 5 193
9 636 3 894 8 875
1974
43 249
19 799 6 167 4 463 4 659
3 297
3 497 814 553
723 1 417 1 389 1 196 7 209 2 530 1 854
378 4 939
8 897 3 778 9 802
184

OFFICIAL GROSS RESERVES OF GOLD AND CONVERTIBLE CURRENCIES
XIV. FINANCE
Table 143
Mio Eur
Year
1960 1961 1962 1963 1964
1965 1966 1967 1968 1969
1970 1971 1972 1973 1974
EUR-9
23 659 24 310 24 826 22 707 21 294
30 031 38 975 43 338 48 888 43 249
EUR-6
15 141 16 395 17 033 18 437 19 823
19 733 20 191 21 247 19 431 17 689
26 376 32 077 37 852 43 537 38 385
Germany
6 724 6 527 6 439 7 098 6 969
6 353 6 771 6 850 7 497 5 679
11 834 14 956 18 920 24 792 19 799
France
2 070 2 939 3610 4 457 5 105
5 459 5 745 6 108 4 200 3 833
4 789 6818 8 183 6 620 6 167
Italy
3 183 3 557 3619 3 181 3 673
3 867 3 702 3 819 3 881 3 855
4 951 5 676 4 903 4 264 4 463
Netherlands
1 742 1 715 1 743 1 899 2 084
2 058 2 036 2 268 1 967 2 090
2 552 2 321 3219 4 825 4 659
Belgium Luxembourg
1 422 1 657 1 622 1 802 1 992
1 996 1 952 2 202 1 886 2 232
2 250 2 306 2 627 3 036 3 297
United Kingdom
3 231 3 318 2 806 2 657 2316
3 004 3 100 2 695 2 422 2 527
2 561 5 472 3 996 3 720 3 497
Ireland Den-
394 489 412 490 633
653 853 854 772 814
mark
222 437 612
528 530 472 364 445 441 573 636 859 553
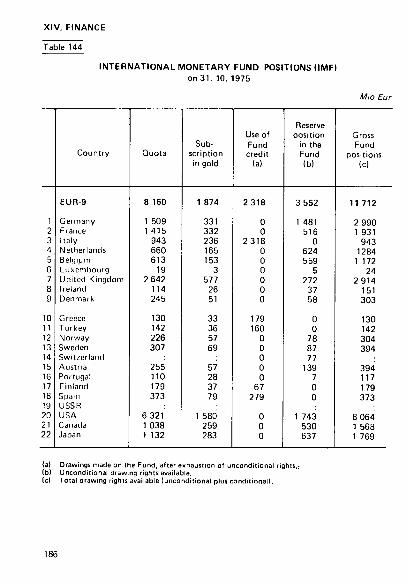
XIV. FINANCE
Table 144
INTERNATIONAL MONETARY FUND POSITIONS (IMF) on 31 . 10. 1975
Mio Eur
I 2 3 4 5 6 7 8 9
10 11 12 13 14 15 16 17 18 19 20 21 22
Country
EUR-9
Germany France Italy Netherlands Belgium Luxembourg United Kingdom Ireland Denmark
Greece Turkey Norway Sweden Switzerland Austria Portugal Finland Spain USSR USA Canada Japan
Quota
8 160
1 509 1 415
943 660 613
19 2 642
114 245
130 142 226 307
255 110 179 373
6 321 1 038 1 132
Subscription in gold
1 874
331 332 236 165 153
3 577
26 51
33 36 57 69
57 28 37 79
1 580 259 283
Use of Fund credit
(a)
2 318
0 0
2318 0 0 0 0 0 0
179 160
0 0 0 0 0
67 279
0 0 0
Reserve position
in the Fund (bl
3 552
1 481 516
0 624 559
5 272
37 58
0 0
78 87 77
139 7 0 0
1 743 530 637
Gross Fund
positions (c)
11 712
2 990 1 931
943 1284
1 172 24
2914 151 303
130 142 304 394
394 117 179 373
8 064 1 568 1 769
(a) Drawings made on the Fund, after exhaustion of unconditional II)) Uncondilional drawing rights available. (c) Total drawing rights available (unconditional plus conditional).
ights.;
186

XV. REGIONAL POPULATION AND GROSS DOMESTIC PRODUCT
Table 145
AREA AND POPULATION 1974
Territorial Units
Level 1 (a) Level II (b)
GERMANY
Schleswig-Holstein
Hamburg
Lower Saxony
Hanover Hildesheim Luneburg Stade Osnabrück Aurich Braunschweig Oldenburg
Bremen
North Rhine Westphalia
Düsseldorf Cologne Münster Detmold Arnsberg
Area sq km
248 611
15 678
753
47 426
7 354 4 764
10 160 6 943 6 101 3 129 3 471 5 506
404
34 057
5 499 7 111 7 111 6 791 7 745
Total mean population
'000
62 043
2 532
1 743
7 262
1 640 919
1 061 669 799 412 893 872
727
17 232
5 642 3 591 2 444 1 815 3 741
Density per sq km
250
162
2315
153
223 193 104 96
131 132 257 158
1 800
506
1 026 505 344 275 483
Indice 1964= 100
107.0
107.0
34.2
106.7
110.0 96.2
106.3 113.0 109.0 108.4 104.0 109.0
101.4
105.3
102.7 111.0 105.5 110.0 102.2
la) European Communi ty Regions lb) Basic administrative units.
187

XV. REGIONAL POPULATION AND GROSS DOMESTIC PRODUCT
Table 145 (contd.)
AREA AND POPULATION 1974
Territorial
Level 1 (a) Level II (b)
Hesse Darmstadt Kassel
Rhineland-Palatinate Koblenz Trier Rhine-Hesse-Palatinate
Baden-Württemberg Stuttgart Karlsruhe Freiburg Tübingen
Bavaria Upper-Bavaria Lower-Bavaria Upper-Palatinate Upper-Franconia Middle-Franconia Lower-Franconia Swabia
Saarland
West-Berlin
Area sq km
21 112 11 561 9 551
19 835
8 090 4 922 6 824
35 751 10 558 6 920 9 356 8917
70 547 17 530 10 374 9 627 7 176 7 288 8 536
10016
2 569
480
Total mean population
Ό00
5 576 4 142 1 434
3 695 1 378
479 1 837
9 232 3 487 2 399 1 864 1 482
10 851 3 557
993 976
1 074 1 531 1 202 1 516
1 107
2 036
Density per sq km
264 358 150
186 170 97
269
258 330 347 199 166
154
203 96
101 150 210 141 151
431
4 242
Indice 1964= 100
111.0 ,
111.0 111.0
105.1 105.0 102.6 105.7
113.1 109.2 135.2 108.6 100.3
110.0 120.7 102.3 107.4
38.6 108.4 '06.6 07.8
99.7
93 0
(at European Communi ty Regions. (b) Basic administrative units.
188

XV. REGIONAL POPULATION AND GROSS DOMESTIC PRODUCT
Table 146
AREA AND POPULATION 1974
Territorial Units
Level 1 lal Level II Ib)
FRANCE
Paris
Parisian Basin Champagne-Ardenne Picardie Upper-Normandy Central region Lower-Normandy Burgundy
North
East Lorraine Alsace France-Comte'
West Loire region Brittany Poitou-Charentes
South West Aquitaine Midi-Pyrénées Limousin
Middle East Rhone Alps Auvergne
Mediterranean Languedoc Provence Cote d'Azur Corsica
Area sq km
543 998
12 008
145 505 25 600 19411 12 258 39 061 17 583 31 592
12 378
48 039 23 540
8310 16 189
85 100 32 126 27 184 25 790
103 721 41 407 45 382 16 932
69 682 43 694 25 988
67 565 27 448 31 436
8 681
Tota
'000
52 499
10 074
9 630 1 357 1 672 1 600 2 129 1 311 1 561
3 959
4 939 2 376 1 502 1 061
6 747 2 703 2 539 1 505
5 500 2 532 2 229
739
6 139 4 791 1 348
5 512 1 756 3 537
219
mean population
Density per sq km
97
839
66 53 86
131 55 75 49
320
103 101 181
66
79 84 93 58
53 61 49 44
88 110
52
82 64
113 25
Indice 1964 = 100
108.7
113.4
109.0 109.2 108.6 110.7 111.3 106.5 106.0
105.5
107.2 104.3 109.8 110.2
104.9 107.1 104.5 101.9
103.4 105.1 102.8 100.0
111.2 113.3 104.0
111.1 107.3 112.8 114.7
lal European Communi ty Regions. ü)) Basic administrative units.
189
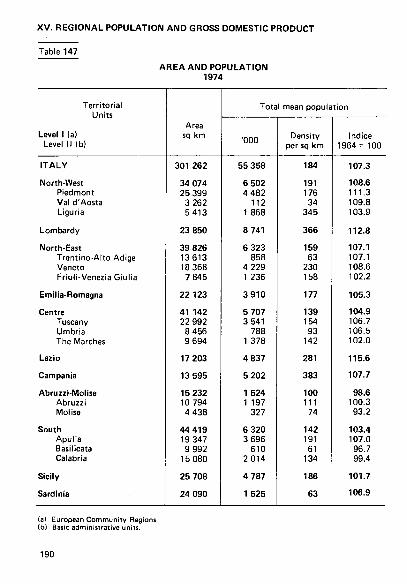
XV. REGIONAL POPULATION AND GROSS DOMESTIC PRODUCT
Table 147 AREA AND POPULATION
1974
Territorial Units
Level 1 la) Level II Ib)
ITALY
North-West Piedmont Val d'Aosta Liguria
Lombardy
North-East Trentino-Alto Adige Veneto Friuli-Venezia Giulia
Emilia-Romagna
Centre Tuscany Umbria The Marches
Lazio
Campania
Abruzzi-Molise Abruzzi Molise
South Apulia Basilicata Calabria
Sicily
Sardinia
Area sq km
301 262
34 074 25 399
3 262 5413
23 850
39 826 13613 18 368
7 845
22 123
41 142 22 992
8 456 9 694
17 203
13 595
15 232 10 794 4 438
44 419 19 347 9 992
15 080
25 708
24 090
Total mean population
'000
55 358
6 502 4 482
112 1 868
8 741
6 323 858
4 229 1 236
3 910
5 707 3 541
788 1 378
4 837
5 202
1 524 1 197
327
6 320 3 696
610 2 014
4 787
1 525
Density per sq km
184
191 176 34
345
366
159 63
230 158
177
139 154 93
142
281
383
100 111
74
142 191
61 134
186
63
Indice 1964= 100
107.3
108.6 111.3 109.8 103.9
112.8
107.1 107.1 108.6 102.2
105.3
104.9 106.7 106.5 102.0
115.6
107.7
98.6 100.3 93.2
103.4 107.0 96.7 99.4
101.7
106.9
(a) European Communi ty Regions. (b) Basic administrative units.
190
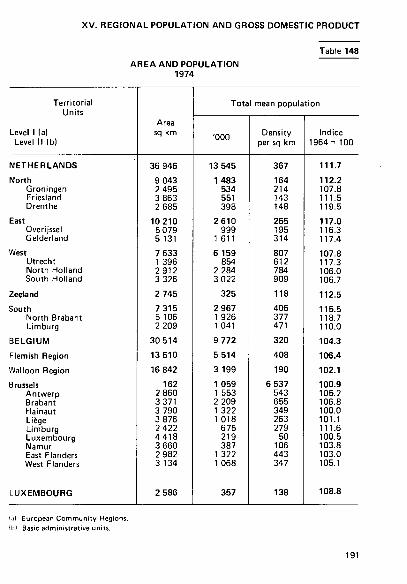
XV. REGIONAL POPULATION AND GROSS DOMESTIC PRODUCT
Table 148 AREA AND POPULATION
1974
Territorial Units
Level I (a) Level II (b)
NETHERLANDS
North Groningen Friesland Drenthe
East Overijssel Gelderland
West Utrecht North Holland South Holland
Zeeland
South North Brabant Limburg
BELGIUM
Flemish Region
Walloon Region
Brussels Antwerp Brabant Hainaut Liège Limburg Luxembourg Namur East Flanders West Flanders
LUXEMBOURG
Area sq km
36 946
9 043 2 495 3 863 2 685
10 210 5 079 5 131
7 633 1 396 2912 3 326
2 745
7 315 5 106 2 209
30 514
13 510
16 842
162 2 860 3 371 3 790 3 876 2 422 4418 3 660 2 982 3 134
2 586
Total mean population
'000
13 545
1 483 534 551 398
2610 999
1 611
6 159 854
2 284 3 022
325
2 967 1 926 1 041
9 772
5 514
3 199
1 059 1 553 2 209 1 322 1 018
675 219 387
1 322 1 068
357
Density per sq km
367
164 214 143 148
255 195 314
807 612 784 909
118
406 377 471
320
408
190
6 537 543 655 349 263 279
50 106 443 347
138
Indice 1964= 100
111.7
112.2 107.8 111.5 119.5
117.0 116.3 117.4
107.8 117.3 106.0 106.7
112.5
115.5 118.7 110.0
104.3
106.4
102.1
100.9 105.2 106.8 100.0 101.1 111.6 100.5 103.8 103.0 105.1
108.8
(a) European Communi ty Regions. lb) Basic administrative units.
191

XV. REGIONAL POPULATION AND GROSS DOMESTIC PRODUCT
Table 149 AREA AND POPULATION
1974
Territorial Units
Level 1 (a) Level 1Kb)
UNITED KINGDOM North Yorkshire and Humber North West East Midlands West Midlands East Anglia South East South West Wales Scotland Northern Ireland
IRELAND
DENMARK Storkøbenhavn
East great belt remainder
West great belt
EUR-9
Area sq km
244 022
19 350
14 198 7 994
12 179 13013 12 564
27 408 23 660
20 763
78 774
14 120
70 285
43 075
617
9 206 33 252
1 163 917
1 521 299
Total mean population
'000
56 057
3 293 4 837
6 740 3 467
5 181 1 758
17 254
3 907
2 759
5 226
1 547
3 086
5 045 1 767
570 2 709
193 570
257 758
Density per sq km
230 170 341 843 285 398
140 630 165 133
66
110
44
117 2 864
62 82
166
169
Indice 1964= 100
103.8 100.7 102.6 101.6 108.2 106.2 114.8 102.9 109.9 103.3 100.4 106.1
107.8
106.9 106.3
104.4 107.9
107.7
106.8
[a) European Communi ty Regions. (b) Basic administrative units.
192

XV. REGIONAL POPULATION AND GROSS DOMESTIC PRODUCT
Table 150
GROSS DOMESTIC PRODUCT AT MARKET PRICES (c) 1970
Territorial Units
Level 1 (a) Level II (b)
GERMANY
Schleswig-Holstein
Hamburg
Lower Saxony
Hanover Hildesheim Lüneburg Stade Osnabrück Aurich Braunschweig Oldenburg
Bremen
North Rhine Westphalia
Düsseldorf Cologne Münster Detmold Arnsberg
Gross domestic product total
Mio DM
660 033
21906
31 366
64 662
18 690 7 822
10 124 4 176 6 549 2 858 7 665 6 778
9 700
191 121
71 550 39 571 21 913 18 034 40 053
%
100
3.3
4.8
9.8
2.9 1.2 1.5 0.6 1.0 0.4 1.2 1.0
1.5
28.9
10.8 6.0 3.3 2.7 6.1
Gross domestic product per head o
DM
10 880
8 780
17 480
9 130
12 180 8 130 9 450 6 680 8 400 7 090 8910 8010
13 420
11 300
12 740 11 490 9 130
10 380 10 790
population
national average = 100
100
81
161
84
112 75 87 61 77 65 82 74
123
104
117 106 84 95 99
(a) European Communi ty Regions. (b) Basic administrative units. (c) Excl. taxes l inked to imports.
193

XV. REGIONAL POPULATION AND GROSS DOMESTIC PRODUCT
Table 150 (contd.)
GROSS DOMESTIC PRODUCT AT MARKET PRICES (c) 1970
Territorial Units
i.evel I (a) Level II (bl
Hesse
Darmstadt Kassel
Rhineland-Palatinate Koblenz Trier Rhine-Hesse-Palatinate
Baden-Württemberg
Stuttgart Karlsruhe Freiburg Tübingen
Bavaria
Upper-Bavaria Lower-Bavaria Upper-Palatinate Upper-Franconia Middle-Franconia Lower-Franconia Swabia
Saarland
West-Berlin
Gross domestic product total
Mio DM
60 930
48 895 12 035
35 954 11 647
3 859 20 448
100 692 42 878 22 865 18 709 16 240
109 110 41 559
7 399 7 695
10481 16 583 10 223 15 170
10 292
24 306
%
9.2
7.4 1.8
5.5
1.8 0.6 3.1
15.3 6.5 3.5 2.8 2.5
16.5 6.3 1.1 1.2 1.6 2.5 1.5 2.3
1.6
3.7
Gross domestic product per head o
DM
11 320 12 110 8 950
9 860
8 600 8 040
11 290
11 320 12 260 11 980 10010 10010
10 410
12 720 7 340 8 090 9 450
11 170 8 690
10 220
9 190
11 450
population
national average = 100
104
111 82
91
79 74
104
104
113 110 92 92
96
117 67 74 87
103 80 94
84
105
(a-) European Communi ty Regions. (b) Basic administrative units. (c) Excl. taxes l inked to imports.
194

XV. REGIONAL POPULATION AND GROSS DOMESTIC PRODUCT
Table 151
GROSS DOMESTIC PRODUCT AT MARKET PRICES (c) 1970
Territorial Units
Level I (a) Level II (b)
FRANCE
Paris
Parisian Basin Champagne-Ardenne Picardie Upper-Normandy Central region Lower-Ñorm andy Burgundy
North
East Lorraine Alsace Franche-Comté
West Loire region Brittany Poitou-Charentes
South West Aquitaine Midi-Pyrénées Limousin
Middle East Rhone Alps Auvergne
Mediterranean Languedoc Provence Cote d'Azur Corsica
Gross domestic product total
Mio Ffr
764 856
213 813
132 297 20 172 22 452 25 845 28 089 15 586 20 153
52 963
68 317 32 946 21 692 13 679
77 574 33 498 26 726 17 350
64 728 32 578 24 051
8 099
87 021 71 433 15 588
68 143 18 789
} 49 354
%
100
28.0
17.3 2.6 2.9 3.4 3.8 2.0 2.6
6.9
8.9 4.3 2.8 1.8
10.1 4.3 3.5 2.3
8.5 4.3 3.1 1.1
11.4 9.4 2.0
8.9 2.5
6.4
Gross domestic product per head of population
Ffr
15 070
22 360
14 200 15 420 13 890 16 800 13 720 12 180 13 200
13 740
14 300 14 240 15 000 13 440
11 720 12 750 10 700 11 610
11930 13 100 10 940 10 960
14 790 15 680 11 760
12 780 10 800
13 740
national average =100
100
148
94 102 92
112 91 81 88
91
95 95
100 89
78 85 71 77
79 87 73 73
98 104
78
85 72
91
la) European Communi ty Regions. ib) Basic administrative units. (c) Excl. taxes l inked to imports.
195

XV. REGIONAL POPULATION AND GROSS DOMESTIC PRODUCT
Table 152
GROSS DOMESTIC PRODUCT AT MARKET PRICES (c) 1970
Territorial Units
Level I (a) Level II (b)
ITALY
North-West Piedmont Val d'Aosta Liguria
Lombardy
North-East Trentino-Alto Adige Veneto Friuli-Venezia Giulia
Emilia-Romagna
Centre Tuscany Umbria The Marches
Lazio
Campania
Abruzzi-Molise Abruzzi Molise
South Apulia Basilicata Calabria
Sicily
Sardinia
Gross domestic product total
Mio Lit
56 785 341
8 767 879 5 950 923
140 811 2 676 145
12 067 786
6 562 548 872 864
4 324 353 1 365 331
4 663 805
5 917 305 3 933 575
706 432 1 277 298
5 409 798
3 634 969
1 073 207 876 092 197 115
4 047 667 2 576 296
342 789 1 108 582
3 395 971
1 214 406
%
100.0
15.4 10.5 0.2 4.7
21.3
11.6 1.5 7.6 2.4
8.2
10.4 6.9 1.2 2.3
9.5
6.4
1.9 1.5 0.3
7.1 4.5 0.6 2.0
6.0
2.1
Gross domestic product per head of population
1000 Lit
1 057
1 389 1 363 1 303 1 452
1 439
1 071 1 046 1 061 1 124
1 222
1 063 1 144
912 944
1 177
722
716 746 608
654 721 561 553
723
628
national average = 100
100
131 129 123 137
136
101 99
100 106
116
101 108 86 89
111
68
68 71 58
62 68 53 52
68
78
(a) European Communi ty Regions. (b) Basic administrative units. (c) Excl . taxes l inked to imports.
196
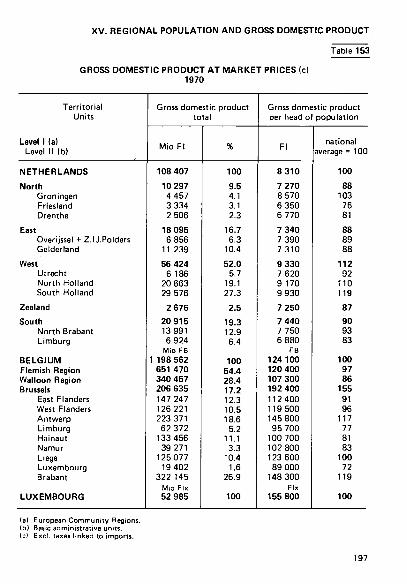
XV. REGIONAL POPULATION AND GROSS DOMESTIC PRODUCT ,
Table 153
GROSS DOMESTIC PRODUCT AT MARKET PRICES (c) 1970
Territorial Units
Level I (a) Level II (b)
NETHERLANDS
North Groningen Friesland Drenthe
East Overijssel + Ζ. IJ.Polders Gelderland
West Utrecht North Holland South Holland
Zeeland
South North Brabant Limburg
BELGIUM Flemish Region Walloon Region Brussels
East Flanders West Flanders Antwerp Limburg Hainaut Namur Liege Luxembourg Brabant
LUXEMBOURG
Gross domestic product total
Mio Fl
108 407
10 297 4 457 3 334 2 506
18 095 6 856
11 239
56 424 6 186
20 663 29 576
2 676 20 915 13 991 6 924
Mio FB 1 198 562
651 470 340 457 206 635 147 247 126 221 223 371
62 372 133 456 39 271
125 077 19 402
322 145 Mio Fix 52 985
%
100
9.5 4.1 3.1 2.3
16.7 6.3
10.4
52.0 5.7
19.1 27.3
2.5
19.3 12.9 6.4
100 54.4 28.4 17.2 12.3 10.5 18.6
5.2 11.1 3.3
10.4 1.6
26.9
100
Gross domestic product per head o
Fl
8 310
7 270 8 570 6 350 6 770
7 340 7 390 7310
9 330 7 620 9 170 9 930
7 250 7 440 7 750 6 880
FB 124 100 120 400 107 300 192 400 112 400 119 500 145 800 95 700
100 700 102 800 123 600 89 000
148 300 Fix
155 800
population
national average = 100
100
88 103
76 81
88 89 88
112 92
110 119
87 90 93 83
100 97 86
155 91 96
117 77 81 83
100 72
119
100
(a) European Communi ty Regions. (b) Basic administrative units. (c) Excl. taxes l inked to imports.
197
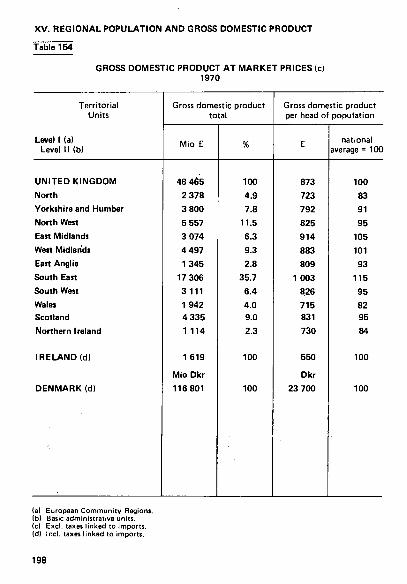
XV. REGIONAL POPULATION AND GROSS DOMESTIC PRODUCT
Table 154
GROSS DOMESTIC PRODUCT AT MARKET PRICES (c) 1970
Territorial Units
Level 1 (a) Level II (b)
UNITED KINGDOM North Yorkshire and Humber North West East Midlands
West Midlands East Anglia South East South West Wales Scotland Northern Ireland
IRELAND (d)
DENMARK (d)
Gross domestic product total
Mio ε
48 465 2 378 3 800
5 557 3 074
4 497 1345
17 306 3111 1 942 4 335 1 114
1 619
Mio Dkr
116 801
%
100 4.9 7.8
11.5 6.3 9.3 2.8
35.7 6.4 4.0 9.0 2.3
100
100
Gross domestic product per head of population
£
873 723 792
825
914 883 809
1 003 826
715 831 730
550
Dkr 23 700
national average = 100
100 83 91
95
105 101 93
115 95
82 95
84
100
100
ta) European Communi ty Regions, lb} Basic administrative units. (c) Excl. taxes l inked to imports. (d) Incl. taxes l inked to imports.
198

XV. REGIONAL POPULATION AND GROSS DOMESTIC PRODUCT
Table 155
ORIGIN OF GROSS DOMESTIC PRODUCT AT MARKET PRICES 1970
Territorial Units
Level I (a) Level II (b)
GERMANY
Schleswig-Holstein
Hamburg
Lower Saxony
Hanover Hildesheim Lüneburg Stade Osnabrück Aurich Braunschweig Oldenburg
Bremen
North Rhine Westphalia
Düsseldorf Cologne Münster Detmold Arnsberg
Agricultural, Forestry and
fishery products
Industrial products
Market services
Non-market services
3.2
8.1
0.7
6.2
3.9 4.7 5.7
16.3 9.8 8.6 2.0 9.1
1.4
2.1
1.2 1.9 4.5 5.2 1.4
53.5
41.8
45.4
50.2
52.2 50.7 57.9 35.3 49.1 43.4 54.3 41.2
42.8
56.2
57.4 50.1 55.4 56.2 60.2
32.7
35.9
44.4
31.3
43.9 44.6 36.4 48.4 41.1 48.0 43.7 49.7
45.3
31.9
41.4 48.0 40.1 38.6 38.4
1
10.6
14.2
9.5
12.3
10.5
9.8
(a) European Communi ty Regions, lb) Basic administrative units.

XV. REGIONAL POPULATION AND GROSS DOMESTIC PRODUCT
Table 155 (contd.)
ORIGIN OF GROSS DOMESTIC PRODUCT AT MARKET PRICES 1970
Territorial Units
Level 1 (a) Level II (b)
Hesse Darmstadt Kassel
Rhineland-Palatinate Koblenz Trier Rhine-Hesse-Palatinate
Baden-Württemberg
Stuttgart Karlsruhe Freiburg Tübingen
Bavaria
Upper-Bavaria Lower-Bavaria Upper-Palatinate Upper-Franconia Middle-Franconia Lower-Franconia Swabia
Saarland
West-Berlin
Agricultural, Forestry and
fishery products
Industrial products
Market services
N on-market services
2.7 1.9 6.0
4.7
4.1 9.0 4.2
3.0
2.5 2.1 4.1 4.5
4.1 2.4 9.0 5.3 3.4 3.6 5.5 5.6
1.8
0.3
49.6 50.0 48.6
54.0
50.7 42.0 58.3
58.1 59.6 57.2 54.8 59.1
53.4 51.3 50.1 52.4 60.6 54.0 53.9 55.2
52.1
55.1
37.3 48.1 45.4
30.0 |
45.2 49.0 37.5
29.1 |
37.9 40.7 41.1 36.4
32.0 |
46.3 ¡40.9 42.3 36.0 42.4 40.6 39.2
33.2
30.7
10.4
11.3
9.8
10.5
12.9
13.9
(a) European Communi ty Regions. (b) Basic administrative units.
200

XV. REGIONAL POPULATION AND GROSS DOMESTIC PRODUCT
Table 156
ORIGIN OF GROSS DOMESTIC PRODUCT AT MARKET PRICES 1970
Territorial Units
Level I la) Level II (b)
FRANCE
Paris
Parisian Basin Champagne-Ardenne Picardie Upper-Normandy Central region Lower-Normandy Burgundy
North
East Lorraine Alsace Franche-Comté
West Loire region Brittany Poitou-Charentes
South West Aquitaine Midi-Pyrénées Limousin
Middle East Rhone Alps Auvergne
Mediterranean Languedoc Provence Cote d'Azur \ Corsica '
Agricultural, Forestry and
fishery products
Industrial products
Market services
Non-market services
6.1
0.7
9.9 11.8 10.8 4.4
12.0 12.6 9.3
4.0
4.4 3.7 4.0 6.5
13.6 10.8 15.7 15.7
11.1 11.8 10.6 10.1
4.8 3.8 9.3
8.1 15.1
5.3
44.4
42.6
45.8 50.1 46.9 52.7 41.3 38.1 43.6
54.9
54.1 57.0 49.4 54.4
36.4 41.9 30.0 35.7
38.7 38.6 38.6 38.6
51.5 52.8 44.9
35.6 31.0
37.4
39.3
48.3
34.2 29.1 33.2 34.4 35.9 36.0 36.4
32.3
31.9 29.9 36.9 29.0
37.2 36.2 38.9 36.6
37.1 36.8 37.2 38.5
34.5 34.7 34.1
43.1 40.1
44.3
10.2
8.4
10.1 9.0 9.1 8.5
10.8 13.3 10.7
8.8
9.6 9.4 9.7
10.1
12.8 11.1 15.4 12.0
13.1 12.8 13.6 12.8
9.2 8.7
11.7
13.2 13.8
13.0
(al Europeen Communi ty Regions, lb) Basic administrative units.
201

XV. REGIONAL POPULATION AND GROSS DOMESTIC PRODUCT
Table 157
ORIGIN OF GROSS DOMESTIC PRODUCT AT MARKET PRICES 1970
Territorial Units
Level 1 (a) Level II (b)
ITALY
North-West Piedmont Val d'Aosta Liguria
Lombardy
North-East Trentino-Alto Adige Veneto Friuli-Venezia Giulia
Emilia-Romagna
Centre Tuscany Umbria The Marches
Lazio
Campania
Abruzzi-Molise Abruzzi Molise
South Apulia Basilicata Calabria
Sicily
Sardinia
Agricultural, Forestry and
fishery products
Industrial products
Market services
Non-market services
8.8
5.2 5.5 3.7 4.6
4.0
9.5 8.6
10.8 6.0
13.1
8.2 6.5
10.4 12.1
5.5
13.3
16.8 16.0 20.7
17.3 18.3 18.4 14.6
15.2
13.S
41.9
47.6 53.1 46.8 35.3
53.2
42.1 38.0 44.3 37.7
42.5
42.0 43.3 40.4 39.2
28.6
33.8
34.5 35.5 29.4
33.6 34.3 36.0 31.Ó
29.4
34.3
38.8
40.0 35.0 36.3 51.4
37.1
37.1 38.4 35.8 40.5
36.0
39.8 40.7 37.7 37.8
47.5
39.7
34.0 34.5 31.8
34.6 34.1 29.3 37.8
39.8
35.5
10.5
7.2 6.4
13.4 8.7
5.7
11.3 15.0 9.1
15.8
8.4
10.0 9.5
11.5 10.9
18.4
13.2
14.7 14.0 18.1
14.5 13.3 16.3 16.6
15.6
16.7
(a) European Community Regioni. (b) Basic administrative units.
202

XV. REGIONAL POPULATION AND GROSS DOMESTIC PRODUCT
Table 158
ORIGIN OF GROSS DOMESTIC PRODUCT AT MARKET PRICES 1970
Territorial Units
Level I (a) Level II (b)
NETHERLANDS
North Groningen Friesland Drenthe
East Overijssel Gelderland
West Utrecht North Holland South Holland
Zeeland
South North Brabant Limburg
BELGIUM Flemish Region Walloon Region Brussels
East Flanders West Flanders Antwerp Limburg Hainaut Namur Liege Luxembourg Brabant
LUXEMBOURG
Agricultural, Forestry and
fishery products
Industrial products
Market services
Non-market services
6.1
12.7 8.5
16.4 15.1
8.9 10.3
8.1
3.8 4.2 3.6 3.7
12.9 6.0 6.3 5.4
3.6 4.2 4.7 0.0 4.5 7.6 1.9 5.3 3.4 7.6 3.5
13.4 1.6
4.0
41.9
41.6 47.0 35.6 40.3
42.9 46.6 40.6
38.1 31.8 36.6 40.5
45.7 50.7 51.7 48.8
43.1 45.7 44.8 32.2 49.2 40.9 46.1 49.0 48.5 36.4 45.7 27.2 36.6
56.0
38.9
32.9 32.8 34.3 31.0
33.1 30.6 34.6
45.3 47.4 47.6 43.3
29.6 30.8 29.2 34.0
41.5 39.7 37.9 52.8 36.5 41.3 43.1 31.8 36.6 40.4 38.2 43.5 47.7
40.0
13.1
12.8 11.7 13.7 13.6
15.1 12.5 16.7
12.8 16.6 12.2 12.5
11.8 12.5 12.8 11.8
11.8 10.4 12.6 15.0
9.8 10.2 8.9
13.9 11.5 15.6 12.6 15.9 14.1
40.0
(a) European Communi ty Regions. (b) Basic administrative units.
203
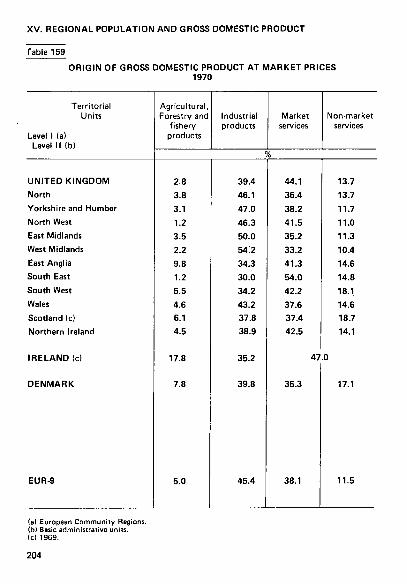
XV. REGIONAL POPULATION AND GROSS DOMESTIC PRODUCT
Table 159
ORIGIN OF GROSS DOMESTIC PRODUCT AT MARKET PRICES 1970
Territorial Units
Level 1 (a) Level II (b)
UNITED KINGDOM North Yorkshire and Humber North West East Midlands West Midlands East Anglia South East South West Wales
Scotland (c) Northern Ireland
IRELAND |c)
DENMARK
EUR-9
Agricultural, Forestry and
fishery products
Industrial products
Market services
Non-market services
2.8
3.8
3.1
1.2 3.5 2.2 9.8
1.2
5.5 4.6 6.1 4.5
17.8
7.8
5.0
39.4 46.1 47.0 46.3 50.0 54!2 34.3 30.0 34.2 43.2 37.8 38.9
35.2
39.8
45.4
44.1 36.4
38.2 41.5 35.2 33.2 41.3 54.0 42.2 37.6 37.4 42.5
47
35.3
38.1
13.7 13.7 11.7 11.0 11.3 10.4 14.6 14.8 18.1 14.6 18.7 14.1
.0
17.1
11.5
(a) European Communi ty Regions. (b) Basic administrative units. (c) 1969.
204
ADDITIONAL FIGURES FOR IRON AND STEEL INDUSTRY AND MINING
205

XVI . IRON AND STEEL
Table 160
PERSONNEL EMPLOYED IN THE COMMUNITY'S COAL-MINING End
Coal-mining
Wage-earners of which: underground
Salaried employees Total
of which: apprentices
Iron-mining
Wage-earners Salaried employees Total
of which: apprentices
Iron and steel industry
Wage-earners Salaried employees Total
of which: apprentices
ECSC industries total
Wage-earners Salaried employees Total
of which: apprentices
EUR-9
555 840 364 891
83 467 639 307
13 183 2 761
15 944 31
607 472 184 719 792 191
15 995
1 176 495 270 947
1 447 442
Germany
171 549 109 923 33 368
204 917 13 067
2 302 435
2 737 2
180 365 51 672
232 037 8 934
354 216 85 475
439 691 22 003
France
70 245 41 162 14 585 84 830
165
8 220 1 817
10 037 0
110 694 47 139
157 833 204
189 159 63 541
252 700 369
Italy
484 228 146 630
0
677 97
774 0
78 207 17 449 95 656
61
79 368 17 692 97 060
61
Netherlands
9 601 835
4 756 14 357
0
0 0 0 0
25 077
25 077 355
34 678
39 434 355
206

XVI . IRON AND STEEL
Table 160
IRON-MINING AND IRON AND STEEL INDUSTRIES 1974
Belgium Luxembourg
United Kingdom
Denmark
25 646 19 170 3 920
29 566 1 769
53 564 10 174 63 738
0
79 210 14 094 93 304
1 769
710 164 874
0
20 182 3 321
23 503 358
20 892 3 485
24 377 358
278 315 193 573
26 692 305 007
1 274 248
1 522 29
139 383 54 964
194 347 6 083
418 972 81 904
500 876 6 112
Coal-mining
Wage-earners of which: underground
Salaried employees Total
of which: apprentices
Iron-mining
Wage-earners Salaried employees Total
of which: apprentices
Iron and steel industry
Wage-earners Salaried employees Total
of which: apprentices
ECSC industries total
Wage-earners Salaried employees Total
of which: apprentices
207

XVI. IRON AND STEEL
Table 161
SUPPLY OF IRON ORE IN THE COMMUNITY (EUR-6)
■mo t
1. Production
I I . Imports from non-
ECSC countries
I I I . Exports to non-ECSC
countries
IV. Changes in stocks (b)
V. Consumption of iron
ore (c) (1 + II - I I I ± IV)
by country:
Germany
France
Italy
Netherlands
Belgium
Luxembourg
United Kingdom
1968
71 174
67 163
83
+ 2 542
135 712
45 035
41 839
11 874
4 121
18 571
14 271
1969
71 031
75 194
37
+ 449
145 739
50 286
44 599
11 745
4 895
19 428
14 786
1970
71 149
84 160
9
+ 8 365
146 935
50 355
45 661
12 476
5 228
18 689
14 525
1971
68 432
76 786
9
+ 5 372
139 837
44 755
44 094
13 190
5 932
17 782
14 083
1972
66 044
80 741
4
- 1 795
148 576
47 968
45 275
14 398
6 542
20 145
14 249
1973(a)
72 875
120 320
4
+ 3 287
189 904
55 901
47 065
15 400
7 004
21 374
14 670
28 490
(a) From 1973, figures for EUR-9, (b) Estimated: production—consumption + imports f rom non-ECSC countr ies-exports to non-ECSC
countries - ± changes in stocks.
(c) Includes consumption of iron ore in sintering plants.
208

X V I . IRON AND STEEL
Table 162
CONSUMPTION OF STEEL IN THE COMMUNITY (in terms of ingot equivalent)
V00 t
Production
Scrap used in steel mills
Net exports to non ECSC countries (a)
Changes in steelworks' stocks
Changes in merchants' stocks
Consumption of steel
by country:
Germany
France
Italy
Netherlands
Belgium-Luxemb.
United Kingdom
Ireland
Denmark
1968 1969 1970 1971 1972
EUR-6
98 634
206
16 246
+ 524
+ 109
81 961
36 501
18 827
18 473
3 771
4 389
23 4 9 8 *
2 8 5 *
1 5 0 7 *
107 327
214
12 136
- 467
+ 737
95 135
42 393
22 944
20 108
4 420
5 270
24 5 7 0 *
3 2 5 *
1 9 6 1 *
109 203
221
9 192
+ 2 477
+ 661
97 094
43 544
23 158
20 835
4 389
5 168
25 2 3 0 *
3 3 7 *
1 9 0 6 *
104 375
210
14 103
- 6,10
- 738
91 830
40 464
22 454
19 150
4 170
5 592
23 0 3 9 *
3 2 7 *
1 7 9 4 *
114 793
213
14 452
+ 2 358
+ 230
97 966
42 968
24 128
21 442
4 197
5 231
22 2 3 7 *
3 3 9 *
1 9 5 2 *
1973 1974
EUR-9
152 466
226
17617
- 7 5 0
+ 638
135 187
45 821
26 064
24 627
4 466
5 949
25 895
425
1 940
158 850
224
26 657
+ 454
+ 547
131 416
43 057
25 637
25 185
4 452
6 642
23 942
433
2 068
(a) ECSC Treaty products only.
209

XVI . IRON AND STEEL
Table 163
PRODUCTION OF FINISHED STEEL IN THE COMMUNITY (EUR-6) (by product)
Permanent way ma
terial
Heavy sec
tions
Light sec
tions
Wire rods
Rounds and
squares for
tubes
Hoop and
strip Sheets <3mm
Plates >3 mm
and wide flat steel
Coi finish
ed prod ucts)
'000 t
1 611 1 392 1 358 1 175 1 127 1 122 963
1 025 949
1 033 1 165 1 159 1 060 1 389 1 583
3 258 4 333 4 496 4 343 4 771 4 978 4 835 4 951 5 246 6 051 6 407 5 621 6 487 9 125 8 935
11 409 14 935 14 284 14 409 15 635 15 932 15 332 16 073 17516 18 847 19 128 17 103 17 846 24 086 25 536
4 067 5 373 5 223 5 480 6 379 6 787 6 637 6 969 7 648 7 921 8 293 8 111 9 040 12 024 12 842
1 482 1 980 1 831 1 772 1 994 2 003 1 941 2 065 2 227 2410 2 476 2 068 2 045 2 850 3 093
3 227 4 375 4 562 4 557 5 245 1 567 5315 5 199 5 775 6 656 6 290 5 822 6 496 8 746 8 234
7 635 10 008 10 857 11 952 13 507 13 539 14 171 15 049 17 590 19 799 19 668 19 959 22 156 29 685 29 269
6 977 7 996 7 877 7 330 8 687 9011 9 097 9 302 10 261 11 825 11 609 10610 11 367 15 560 17 575
230 684 855 954
1 209 1 839 2 326 3 155 4 220 4 337 4 428 5 089 5812 7 989 8 407
1958 1961 1962 1963 1964 1965 1966 1967 1968 1969 1970 1971 1972
(a) 1973 1974
4.0 2.8 2.6 2.3 1.9 1.9 1.6 1.6 1.3 1.3 1.5 1.5 1.3 1.2 1.4
8.2 8.5 8.8 8.4 8.1 8.2 8.0 7.8 7.3 7.7 8.1 7.5 7.9 8.2 7.7
28.7 29.2 27.9 27.7 26.7 26.4 25.3 25.2 24.5 23.9 24.1 22.7 21.7 21.6 22.1
10.2 10.5 10.1 10.5 10.9 11.2 10.9 10.9 10.7 10.0 10.4 10.7 11.0 10.8 11.1
3.5 3.9 3.6 3.4 3.4 3.3 3.2 3.2 3.1 3.1 3.1 2.7 2.5 2.6 2.7
8.1 8.6 8.9 8.8 9.0 8.6 8.8 8.1 8.1 8.4 7.9 7.7 7.9 7.8 7.1
19.2 19.6 21.0 23.0 23.1 22.4 23.4 23.6 24.6 25.1 24.7 26.4 26.9 26.6 25.4
17.5 15.6 15.4 14.1 14.8 14.9 15.0 14.6 14.5 15.0 14.6 14.1 13.8 14.0 15.2
0.6 1.3 1.7 1.8 2.1 3.1 3.8 4.9 5.9 5.5 5.6 6.7 7.0 7.2 7.3
100 100 100 100 100 100 100 100 100 100 100 100 100 100 100
(a) From 1973. figures for EUR-9.
210

X V I . IRON AND STEEL
Table 164
ALL IRON AND STEEL PRODUCTS IMPORTS BY ECSC (EUR-6) FROM NON-ECSC COUNTRIES (a)
vmt
Country 1968 1969 1970 1971 1972 1973 1974p
Total imports
imports f rom:
Scandinavia
USSR
South Africa (Rep.)
883
289
250
35
Pig iron (b)
775
264
168
41
939
212
98 36
723
159
152
35
1 310
145
298 46
1 114
134
289 63
802
124
Steel (c)
Total imports
imports f rom:
Scandinavia
Austria
Eastern Europe
among which:
USSR
Czechoslovakia
USA
Japan
3 252
667
643
798
212 257
109
225
5 383
760
827
1 120
268 368
899
615
7 249
967
723
1 135
137
374
2 170 1 035
5 720
859
774
1 564
149
619
365 1 022
7 225
870
680
1 690
146
603 518
1 348
6 725
971
756
1 646
132
590 300
1 025
4 825
758
62
465 268 610
(a) Th i rd countries other then the 9. (b) Spiegeleisen and high-carbon ferro-manganese included. (c) Total steel: ECSC and non-ECSC.
211

XVI . IRON AND STEEL
Table 165
ALL IRON AND STEEL PRODUCTS
EXPORTS FROM ECSC (EUR-6)
TO NON-ECSC COUNTRIES (a) ■ooo t
Country 1968 1969 1970 1971 1972 1973
Pig iron (b)
Total exports
Western Europe
among which:
Scandinavia
Eastern Europe
North America
among which:
United States
Latin America
Africa
Asia
among which:
Japan
439
110
28
15
214
214
15
3
82
65
433
131
25
3
128
128
43
8
122
97
415
196
46
1
104
104
12
11
92
77
285
159
35
13
66
66
21
16
10
0
290
142
32
1
107
107
19
8
11
0
725
242
57
4
152
152
92
14
220
18
Steel (c)
Total exports
Scandinavia
Switzerland
Spain
Greece
USSR
United States
Canada
Iran
China
18 686
2 096
1 249
630
390
571
6 194
393
544
449
17.650
2 640
1 486
244
314
772
4 465
374
328
418
16 972
2 652
1 563
634
316
939
4 148
186
246
370
19 774
2 349
1 461
586
337
1 176
6 309
378
317
297
21 408
1 893
1 768
837
445
1 485
5 794
535
296
474
22 959
2 161
1 707
797
486
2 845
4 731
380
573
788
30 166
1 541
858
4 068
5 329
501
(a) Thi rd countries other than the 9.
(b) Spiegeleisen and high-carbon ferro-manganese included, (cl Total steel: ECSC and non-ECSC.
212

XVI. IRON AND STEEL
Table 166
ALL IRON AND STEEL PRODUCTS INTRA-COMMUNITY (EUR-6) TRADE (a)
V00 t
Country 1968 1969 1970 1971 1972 1973 1974p
Pig iron (b)
Total imports
Imports by:
Germany
BLEU
France
Italy
Netherlands
978
115 177 211 461 14
1 056
123 199 192 516 27
1 057
150 250 112 472 72
999
109 178 236 421 55
1 007
115 183 366 302 40
1 249
176 260 385 378 40
180
280
299
657
50
Steel(c)
Total imports Imports by: Germany BLEU France Italy Netherlands
17 324
6 370 1 377 4 792 1 971 2813.
19 766
6 747 1 525 6 087 2 340 3 067
20 017
6 174 1 705 6 336 2615 3 188
20 672
7 086 1 852 6 039 2 423 3 271
23 390
7 944 2 044 7 365 2 566 3 472
25 116
7 446 2 445 7 941 3 144 4 140
25 360
6618 2 785 7 901 3 494 4 562
(a) Intra-Community trade wi th the nine Member States. (b) Spiegeleisen and high-carbon ferro-manganese included. Ic) Total steel: ECSC and non-ECSC.
213

XVI . IRON AND STEEL
Table 167
HOURLY LABOUR COST FOR MANUAL WORKERS
In national currencies and in Fb
Year
Germany
DM Fb
France
Ffr Fb
Italy
Lit Fb
Netherlands
Fl Fb
Belgium
Fb
Luxembourg
Fb
5.42 7.89 8.25 8.81 8.85
10.10 15.37
Coal-mining ( 64.88 98.10
102.78 109.90 110.71 128.26 213.83
6.56 9.71
10.24 11.15 12.59 13.38 17.95
manual workers. 66.81 98.39
103.86 112.66 126.92 129.08 157.22
559 953
1 278 1 966 2 111 2 225 4 072
underground and surface) 44.89 75.63
102.03 156.52 169.07 178.03 313.94
4.78 7.47 8.03 8.72 9.28
10.28
63.25 103.02 110.54 120.20 127.99 142.00
59.75 91.74 98.37
103.88 109.98 120.72 187.31
4.32 6.57 7.02 7.30 7.78 8.94
13.37
Iron-mining (a)
51.64 81.71 87.48 91.02 97.22
113.57 186.03
8.13 12.17 12.85 14.06 15.02 16.10 20.88
(manual
82.65 123.30 130.31 142.18 151.41 155.33 182.90
workers, undere
499 1 084 1 119 1 251 1 291 1 370 2318
40.07 86.07 89.27 99.66
103.44 109.58 178.69
round and surfat
0 0 0 0 0 0 0
0 0 0 0 0 0 0
e) 0 0 0 0 0 0 0
Iron and steel (manual workers)
5.07 7.28 7.66 7.91 8.38 9.18
11.25 12.76 12.88 15.20 17.91
60.65 90.44 95.38 98.64
104.81 116.60 153.21 174.44 179.15 222.19 270.71
4.89 7.29 7.69 8.19 9.12
10.15 11.55 13.27 15.25 17.91 22.77
49.78 73.86 77.98 82.73 91.96 97.99
103.70 119.37 133.56 156.93 184.43
610 1 013 1 062 1 155 1 210 1 334 1 644 1 860 2 043 2 497 3 172
48.99 80.44 84.71 91.88 96.93
106.75 130.17 148.66 157.54 166.54 198.68
4.12 7.09 7.80 8.45 9.21
10.16 11.53 12.86 13.90 17.13
54.49 97.81
107.37 116.54 127.03 140.28 158.31 177.59 191.99 240.01
60.83 91.28 99.38
106.02 113.67 124.38 139.40 160.24 183.65 221.14 269.04
70.31 97.34
102.92 105.25 118.01 127.07 151.25 158.96 179.91 198.17 249.63
(a) In France the Bassin de l'Est.
214
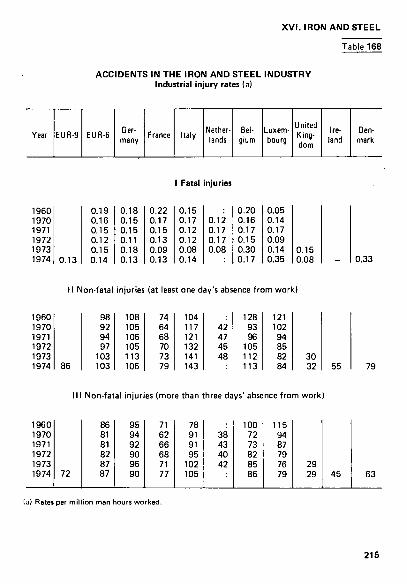
X V I . IRON AND STEEL
ACCIDENTS IN THE IRON AND STEEL INDUSTRY Industrial injury rates (a)
Table 168
Year EUR-9 EUR-6 Germany France Italy Nether
lands Belgium
Luxembourg
United Kingdom
Ireland
Denmark
I Fatal injuries
1960 1970 1971 1972 1973 1974 0.13
0.19 0.16 0.15 0.12 0.15 0.14
0.18 0.15 0.15 0.11 0.18 0.13
0.22 0.17 0.15 0.13 0.09 0.13
0.15 0.17 0.12 0.12 0.08 0.14
0.12 0.17 0.17 0.08
0.20 0.16 0.17 0.15 0.30 0.17
0.05 0.14 0.17 0.09 0.14 0.35
0.15 0.08 -
II Non-fatal injuries (at least one day's absence from work)
1960 1970 1971 1972 1973 1974 86
98 92 94 97 103 103
108 105 106 105 113 106
74 64 68 70 73 79
104 117 121 132 141 143
42 47 45 48
128 93 96 105 112 113
121 102 94 85 82 84
30 32 55 79
III Non-fatal injuries (more than three days' absence from work)
1960 1970 1971 1972 1973 1974 72
86 81 81 82 87 87
95 94 92 90 96 90
71 62 66 68 71 77
78 91 91 95 102 105
38 43 40 42
100 72 73 82 85 86
115 94 87 79 76 79
29 29 45 63
1a) Rates per million man hours worked.
215
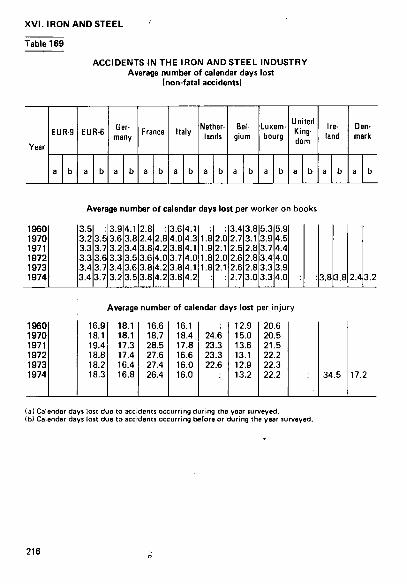
XVI . IRON AND STEEL
Table 169
ACCIDENTS IN THE IRON AND STEEL INDUSTRY Average number of calendar days lost
(non-fatal accidents)
Year
EUR-9
a b
EUR-6
a b
Germany
a b
France
a b
Italy
a b
Netherlands
a b
Belgium
a b
Luxembourg
a b
United Kingdom
a b
Ireland
a b
Denmark
a b
Average number of calendar days lost per worker on books
1960 1970 1971 1972 1973 1974 3.8 3.8 2.4 3.2
Average number of calendar days lost per injury
1960 1970 1971 1972 1973 1974
16.9 18.1 19.4 18.8 18.2 18.3
18.1 18.1 17.3 17.4 16.4 16.8
16.6 18.7 28.5 27.6 27.4 26.4
16.1 18.4 17.8 16.6 16.0 16.0
24.6 23.3 23.3 22.6
12.9 15.0 13.6 13.1 12.9 13.2
20.6 20.5 21.5 22.2 22.3 22.2 34.5 17.2
(a) Calendar days lost due to accidents occurring during the year surveyed. (bl Calendar days lost due to accidents occurring before or during the year surveyed.
216

DE EUROPÆISKE FÆLLESSKABERS STATISTISKE KONTOR
STATISTISCHES AMT DER EUROPAISCHEN GEMEINSCHAFTEN
STATISTICAL OFFICE OF THE EUROPEAN COMMUNITIES
OFFICE STATISTIOUE DES COMMUNAUTES EUROPEENNES
ISTITUTO STATISTICO DELLE COMUNITÀ EUROPEE
BUREAU VOOR DE STATISTIEK DER EUROPESE GEMEENSCHAPPEN
Generaldirekte· / Generaldirektor / Director General / Directeur generel /Diret tore generale / D ι ret i et
Assistent / Assistent / Anistani / Assistant / Assistente / Assistent
Direkterer / Direktoren / Directors / Directeurs / Direttori / Directeuren
S t i l i m e n e Methoden. Informationswesen Stati it ical methods, information ptocessinq Méthodologie siatistique. traitement de l ' information Metodologia stat t i l ica, trattamento del l ' in formatone Methodologie van de statistiek, informatieverwerking
Almen statistik og nationalregnskab
Allgemeine Statistik und Volkswutschaltl iche Gesamtrechnurtg
General statistics and national accounts
Statistiques geniales et comptes nationaux
Statistiche generali e conti nai tortali
Algemene statistiek en nationale rekeningen
Befolknings og socialstatistik
Bevolk erungs und Socialstatistik
Demographical and social stalisiics
Statistiques démographiques et seriales
Statistiche demografiche e sociali
Sociale en bevolkingsstatistiek
Lane
Sieti
Agni
Stati
Stau
Lånt
Ener Ener
Hiruqs . skovbrugs oq liskefislatistik
stik de. Landwirtschafl. Forstwirtschaft
rulluie, forests and fisheries statistics
stiques de l'agnculiure, des forets et de i.
sticho doli agricoltura, delle foreste e dell
Ibouw . bosbouw en viueri| i iat isi iek
gi, industri og handvawksst.itislifc gip . Industrie und Handwerkstatistik
j nd FISI
ι pêche
a pesca
Statistiques de l'energie de I industrie et de I Statistiche dell'energia, dell'industria e dell ', Energie . industrie en ambacht statistiek
Handels , transport og ServiceSlatiStik
Handels , Transpon und Diensileistiingsstat
Ttade, ttansport and services statistics
Statistiques des commerces, transports et se
Statistiche dei commerci, trasporti e servili
Handels , vervoeis en dienslveileningsstaiisl

This publication is delivered by the following sales agents at the price of £ 1.20 net.
Sales Offices
Belgique - België Moniteur belge -Belgisch Staatsblad
Rue de Louvain 40 - 42 -Leuvenseweg 40 - 42 1000 Bruxelles - 1000 Brussel Tél. 512 00 26 CCP 000-2005502-27 PCR 000-2005502-27 Sous-depôt - Agentschap: Librairie européenne -Europese Boekhandel Rue de la loi 244 - Wetstraat 244 1040 Bruxelles - 1040 Brussel
Danmark
J.H. Schultz - Boghandel
Möntergade 19 DK 1116 København K Tel. 141195 Girokonto 1195
BR Deutschland Verlag Bundesanzeiger Breite Straße Postfach 108 006 5000 Köln 1 Tel I0221, 21 03 48 (Fernschreiber: Anzeiger Bonn 08 882 595) Postscheckkonto 834 00 Köln
France Service de vent* en France des publications des Communautés européennes
Journal officiel
26, rue Oesaix 75732 Paris-Cedex 15 T é l . m 57861 3 9 - C C P Paris 23-96
Ireland Stationery Office
Beggar's Bush Dublin 4 Tel. 68 84 33
Italia Libreria dello Stato
Piazza G. Verdi 10 00 198 Roma - Tel, (6) 8508 CCP 1/2640 Telex 62008 Agenzie; 00187 Roma· Via XX Settembre
(Palazzo Ministero del Tesoro)
20121 Milano - Galleria Vittorio Emanuele 3 Tel.: 806406
Grand-Duché de Luxembourg Office des publications officielles dei Communautés européennes
6, rue du Commerce Boite postale 1003 - Luxembourg Tél. 490081 - C C P 191-90 Compte courant bancaire: BIL 8-109/6003/300
Nederland Staatsdrukkerij- en uitgeversbedrijf
Christoffel Plantijnstraat 's-G ra ve n hage Tel. (070)81 45 11 Postgiro 42 53 00
United Kingdom H. Af. Stationery Office
P.O. Box 569 London SE 1 9NH Tel. (01) 928 6977, ext. 365 National Giro Account No 582- 1002
United States of America
European Community Information Service
2100 M Street N.W. Suite 707 Washington D. C. 20 037 Tel, 202 872 8350
Schweiz · Suisse · Svizzera Librairie Payot
6, rue Grenus 1211 Geneve Tél. 31 89 50 CCP 12-236 Geneve
Sverige Librairie CE. Fritta 2, Fredsgatan Stockholm 16 Post Giro 193, Senk Giro 73/4015
España Libreria Mundi-Prensa
Castellò 37 Madrid 1 Tel. 2754655
Other countries
Office for Official Publications of the European Communities
Luxembourg 5,rue du Commerce CCP 191-90
Boîte postale 1003 Compte courant bancaire BIL
Tél. 49 00 81 8-109/6003/300
Office for Officiai Publications of the
CASB76001ENC