basic income, factor substitution and the future of work ... · guildford, gu2 7xh, uk. email: ......
TRANSCRIPT

CUSPAn ESRC Research Centre
Working Paper SeriesISSN: 2397-8341
Tim Jackson and Peter VictorApril 2018
Centre for the Understanding of Sustainable ProsperityWorking Paper No 11
Confronting inequality in a post-growth worldBasic income, factor substitution and the future of work

© CUSP 2018 The views expressed in this document are those of the authors and not of the ESRC or the University of Surrey. This publication and its contents may be reproduced as long as the reference source is cited.
Contact details Tim Jackson, Centre for the Understanding of Sustainable Prosperity, University of Surrey, Guildford, GU2 7XH, UK. Email: [email protected]
Acknowledgements The authors gratefully acknowledge support from the Economic and Social Research Council (ESRC grant no: ES/M010163/1 for the Centre for the Understanding of Sustainable Prosperity (www.cusp.ac.uk) which has made this paper possible.
Publication Jackson, T and P Victor 2018: Confronting inequality in a post-growth world – basic income, factor substitution and the future of work. CUSP Working Paper No 11. Guildford: University of Surrey. Online at: www.cusp.ac.uk/publications.
The Centre for the Understanding of Sustainable Prosperity is funded by the Economic and Social Research Council (ESRC). The overall aim of CUSP is to explore the economic, ecological, social and governance dimensions of sustainable prosperity and to make concrete recommendations to government, business and civil society in pursuit of it. For more information about the research programme, please visit: cusp.ac.uk.

1 | CUSP WORKING PAPER No. 11
Abstract
In a previous paper we developed a simple stock-flow consistent (SFC) model of Savings, Inequality and Growth in a Macroeconomic account (SIGMA) to test Piketty’s hypothesis that declining growth rates lead to rising inequality (Jackson and Victor 2016). In this paper, we extend that analysis to show that inequality in a ‘post-growth’ economy depends on three related structural features of the economy: the elasticity of substitution between labour and capital; the dynamics of the capital-to-output ratio, and the behaviour of the savings rate. We find that under certain conditions Piketty’s hypothesis is upheld. But we also identify conditions under which inequality is reduced significantly, even as the growth rate declines. We then test three different redistributive measures – a graduated income tax, a tax on capital and a universal basic income – in two distinct structural scenarios for an economy with a declining growth rate. We find that none of these measures is sufficient to reduce inequality when institutions aggressively favour capital over labour. Taken in combination, however, under conditions more favourable to wage labour, these same measures have the potential to eliminate inequality almost entirely, even as the growth rate declines. We discuss the implication of these findings for the ‘future of work’.
Introduction
In his bestselling book, Capital in the 21st Century, French economist Thomas Piketty (2014) has proposed a simple and potentially worrying thesis. Declining growth rates, he suggests, give rise to worsening inequalities. This thesis is particularly challenging in the context of a secular stagnation such as the one recently discussed in advanced economies. It is also potentially problematic for those who are critical of growth-based economics because it seems to suggest that, whatever the problems associated with relentless economic growth, doing without it might give rise to some unpalatable consequences.
Piketty’s statistical evidence is compelling. In the US, for example, the richest 1% of the population received over 15% of the national income in 2015, a higher proportion than at any point since 1940 (Piketty et al 2017). This trend has more than reversed the gains in equality witnessed in the immediate post-war years. Between 1946 and 1980, the lowest income

2 | CUSP WORKING PAPER No. 11
percentiles in the US received the lion’s share of the benefits from economic growth: average income growth in the lowest percentile was 6%, three times the average growth across the economy as a whole. Since 1980, it was increasingly the super-rich who benefited from whatever growth the economy could provide. The average growth rate of the top 0.001% of the population was over 6%, allowing them to increase their post-tax earnings by a factor of seven over the last three decades. The poorest 5% saw their post-tax incomes fall in real terms over the same period (Piketty et al 2017).
A key element in Piketty’s analysis – and the principal concern of this paper – is a theoretical argument about the source of this inequality. Specifically, Piketty (2014) contends that rising inequality is a direct result of declining growth rates in advanced economies. Under circumstances where growth rates decline further, he suggests, this challenge will become progressively worse. So, for example, any future movement towards a ‘secular stagnation’ (Gordon 2016, Summers 2015) is likely to be associated with even greater inequality. Equally, any policies aimed at a ‘post-growth’ society (Blewitt and Cunningham 2014, d’Alisa et al 2015, Cassiers et al 2017, Jackson 2018) might have undesirable social outcomes. Certainly, the prospects for ‘prosperity without growth’ (Jackson 2009 & 2017) or ‘managing without growth’ (Victor 2008 & 2018) would appear slim at best if Piketty’s thesis were unconditionally true: unless it were possible – through redistributive policy mechanisms – to offset these pernicious social dynamics.
Piketty’s own suggestion for combatting systemic inequality is a tax on capital assets (Piketty 2014). A heightening of conventional differential income tax rates might be another obvious policy candidate. A third potential policy, which has recently attracted a renewed interest, is the concept of a universal basic income (Gorz 1999, RSA 2015, Taylor 2017). Sometimes also referred to as a citizen’s income, a basic income is designed to provide people with a fundamental safety net under conditions of rising economic hardship. It has recently been posited, for instance, as a potential response to the threat of increased automation and declining job security (Frase 2016, Varoufakis 2016, Pulkka 2017).
The aim of this paper is to explore the efficacy of such mechanisms in the face of a declining growth rate. We draw explicitly on an earlier paper (Jackson and Victor 2016), in which we developed a stock-flow consistent (SFC) macroeconomic model of savings, inequality and growth (SIGMA) and used it to test the Piketty hypothesis under different assumptions. In the present paper, we use the same model to explore the dependency of

3 | CUSP WORKING PAPER No. 11
inequality on three structural features of the economy – the elasticity of substitution between labour and capital, the dynamics of the capital-to-output ratio, and the behaviour of the savings rate – as the growth rate declines to zero.
In pursuit of that aim, we first set out Piketty’s hypothesis in formal terms and describe briefly the structure and role of the SIGMA model in our analysis. In subsequent sections we show how an unequal initial distribution of capital assets leads to widely different inequality outcomes under different structural assumptions. We then explore the potential to mitigate rising inequality through the three redistributive policy mechanisms (differential income tax, capital tax and basic income) discussed above, under two distinct structural scenarios for the evolution of the economy. One of these structural scenarios corresponds to a future of increased automation and digitalisation, concentrated ownership, and vigorous protection of the interests of the owners of capital assets. The second corresponds to restraints on returns to capital and a more robust defence of the interests of wage labour in the economy. In the final section, we discuss the implications of this analysis for debates about the ‘future of work’.
Testing the ‘Piketty Hypothesis’
Piketty hypothesised that rising inequality is an inevitable feature of a capitalist economy in the context of a declining growth rate. He advanced this hypothesis through the formulation of two ‘fundamental laws’ of capitalism. The first of these (Piketty 2014a: 52 et seq) relates the capital stock (more precisely the capital to income ratio 𝛽) to the share of income α accruing to the owners of capital. Specifically, the first ‘fundamental law’ of capitalism states that:1
𝛼 = 𝑟𝛽, (1)
where r is the rate of return on capital. Since 𝛽is defined as K/Y where K is capital and Y is the net national income, it is easy to see that this ‘law’ is in fact an accounting identity:
1 In what follows, we suppress specific reference to time-dependency of variables except where absolutely necessary. Thus all variables should be read as time dependent unless specifically denominated with a subscripted suffix 0. Occasionally, we will have reason to use the subscripted suffix (-1) to denote the first lag of a time-dependent variable.

4 | CUSP WORKING PAPER No. 11
𝛼𝑌 = 𝑟𝐾. (2)
Formally speaking, the income accruing to capital equals the total capital multiplied by the rate of return on that capital. Though this ‘law’ on its own does not force the economy in one direction or another, it provides the accounting framework within which the evolution of relationships between capital, income and rates of return takes place. For instance, it can be seen from this identity that for any given rate of return r the share of income accruing to the owners of capital rises as the capital to income ratio rises.2
The second ‘fundamental law of capitalism’ (op cit: 168 et seq; see also Piketty 2010) states that in the long run, the capital to income ratio 𝛽 tends towards the ratio of the savings rate s to the growth rate g, ie:
𝛽 → )*𝑎𝑠𝑡 → ∞. (3)
It is in putting (2) and (3) together that we encounter the challenge inherent in Piketty’s argument. Specifically, capital’s share of income 𝛼 would be governed by the following relationship:
𝛼 → 𝑟 )*𝑎𝑠𝑡 → ∞. (4)
In other words, as growth declines, the rising capital to income ratio 𝛽 leads to an increasing share of income 𝛼 going to capital and a declining share of income going to labour. Unless the distribution of capital is itself entirely equal this relationship therefore presents the spectre of a rapidly escalating level of income inequality. Differential savings rates – in which higher income earners save proportionately more than lower income earners (or, equally, where there are lower propensities to consume from capital than from income) – would reinforce these inequalities further by allowing the owners of capital to accumulate even more capital and command even higher wages. The superior power of capital (op cit 22-25) then precipitates a rising structural inequality. As Krusell and Smith (2014: 2) point out, equation (4) is ‘alarming because it suggests that, were the economy’s growth rate to decline towards zero, as Piketty argues it will, capital’s share of income could increase explosively’.
In fact, as we showed in a previous paper (Jackson and Victor 2016), this alarm is justified only under certain conditions associated with the structure
2 We will see later that the ceteris paribus clause relating to constant r here is important. In fact, the rate of return will typically change as the capital to income ratio rises; and to the extent that this ratio declines with increasing β , it can potentially mitigate the accumulation of the capital share of income.

5 | CUSP WORKING PAPER No. 11
of the economy. In particular, capital’s share of income is highly responsive to the elasticity of substitution 𝜎 between the ‘factors of production’ capital and labour. In the earlier paper, we described a simple, five sector3 model of Savings, Inequality and Growth in a Macroeconomic Account (SIGMA) to explore the behaviour of both capital’s share of income and the implications of this on inequality as the growth rate declines to zero.4
A key feature of the SIGMA model is a division of the population into two household subsectors, which for illustrative purposes we nominate as ‘workers’ and ‘capitalists’. Initially, our simulations assume complete parity between these two sectors, in relation to population, wage income, savings behaviours, and the ownership of capital assets. In later simulations, we relax these assumptions to reflect the unequal ownership of capital in society and also to explore the potential for differences in the savings behaviours of the respective household sectors. The model as a whole was loosely calibrated on the basis of an advanced economy ‘similar to’ the UK or Canada, say. That is, the broad magnitudes of macro-economic aggregates in SIGMA are chosen to reflect values typical for these countries; the initial split between wages and profits is similar; the expenditure basis of the SIGMA economy is comparable and the initial savings rates are based on empirical data in the case study countries (Jackson and Victor 2016, Appendix 1, p218).
The SIGMA model allows us to assess the implications of a slowdown of growth on a) capital’s share of income and b) the distribution of incomes in the economy. By adding a government sector to the model, we are also able to explore the potential to mitigate regressive impacts through fiscal redistribution mechanisms. The inclusion of a banking sector allows us to establish clear relationships between the real and the financial economy. Most importantly for our purposes, we can explore the impact of a decline in the growth rate over time on the income shares from capital and labour through an endogenous rate of return, 𝑟, on capital.
To achieve this we assume, as Piketty also did (2014: 213-214), that the return to capital is given by the marginal productivity of capital, which we denote by 𝑟0. This assumption only works under conditions where there are no structural features which might lead either capital or labour to extort
3 The model comprises two households sectors (‘workers’ and ‘capitalists’), a nonfinancial firms sector, a banks sector and a government sector. 4 A user-version of the SIGMA model is available online at http://www.prosperitas.org,uk/sigma to allow the interested reader to conduct their own scenarios.

6 | CUSP WORKING PAPER No. 11
more than their ‘fair’ share of the output from production. In a sense, this assumption is a conservative one for us, to the extent that conclusions about inequality are stronger in imperfect market dynamics. Under conditions of duress, in which the owners of capital receive a rate of return 𝑟 greater than the marginal productivity of capital 𝑟0, our conclusions about any inequality which results from declining growth rates will be reinforced. Conversely, of course, we must beware of making too strong assumptions about the potential to mitigate inequality, in any situation in which the owners of capital have greater bargaining power than wage labour.
Under this assumption, the rate of return on capital can be calculated from a constant elasticity of substitution (CES) production function5 of the form first developed by Arrow et al (1961) in which output, 𝑌, is given (cf Jackson and Victor 2016, p210, Eq (20)) by:
𝑌(𝐾, 𝐿, 𝜎) = (𝑎𝐾(567)5 + (1 − 𝑎)(𝐴𝐿)
(567)5 )
5(567) , (5)
where 𝜎 is the elasticity of substitution between labour and capital, 𝑎 (as described by Arrow et al (1961) is a ‘distribution parameter’ and 𝐴 is the coefficient of technology-augmented labour, which we assume changes over time according to the change in labour productivity in the economy.6 With a little effort, it can be shown via partial differentiation of equation (5) with respect to 𝐾 that the marginal productivity of capital 𝑟0is given by:
𝑟0 =<=<0= 𝑎𝛽
675 (6)
where 𝛽 is the capital to income ratio.7 This relationship can now be used to derive the return to capital, 𝑟0𝐾, through:
𝑟0𝐾 = 𝑎𝛽675 𝐾 (7)
5 In fact, the inclusion of a broadly neoclassical production function is an unusual way to model the production relationships in an SFC model. Coming broadly from a Keynesian perspective such models tend to eschew aggregate production functions for all the well-known reasons (Cohen and Harcourt 2003, Robinson 1953). However, retaining this aspect of Piketty’s analysis allows us to compare our findings more directly with his. 6 It can be shown that, for the special case 𝜎 = 1, this CES function reduces to the familiar Cobb-Douglas production function 𝑌 = 𝐾>(𝐴𝐿)?@>. The introduction of an explicit elasticity variable allows for a more flexible exploration of the production relationship under a variety of different assumptions about the elasticity of substitution between labour and capital. 7 Note that as σ→1, this relationship returns to the ‘first law’ of capitalism (equation 1) with a = α . In other words, under an assumption of unit elasticity of substitution between capital and labour (as in the Cobb Douglas function, the constant a is given by the share of income to capital α .

7 | CUSP WORKING PAPER No. 11
Taking 𝑌 to be the national income (net of depreciation), and using Piketty’s first law of capitalism (equation 2 above) it can be shown that capital’s share of income 𝛼 is given by:
𝛼 = 𝑎𝛽5675 . (8)
Equation (8) now allows us to explore explicitly what happens to capital’s share of income under different assumptions about the elasticity of substitution 𝜎. For 𝜎 > 1, (and assuming that the capital to income ratio is greater than one) capital’s share of income is an increasing function of the capital to income ratio. As the capital to income ratio rises, capital’s share of income increases. Conversely however, when 𝜎 < 1, capital’s share of income is a decreasing function of the capital to income ratio. As the share of capital to income rises, capital’s share of income decreases. At 𝜎 = 1, which is the Cobb Douglas case, the decline in the rate of return to capital always exactly offsets the rise in the capital to income ratio, and capital’s share of income remains constant.
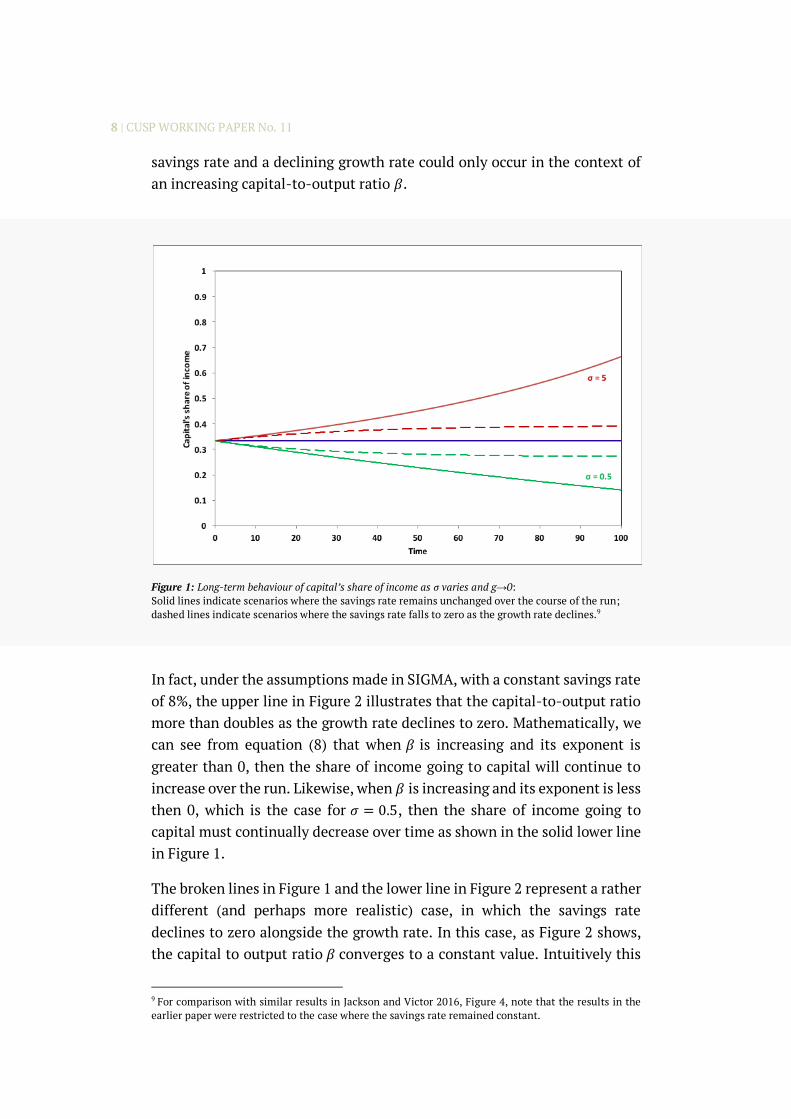
Figure 1 illustrates these results, for three different values of 𝜎: 0.5, 1 and 5. When the elasticity of substitution σ has a value of 5, capital’s share of the total income increases, in accordance with equation (8). Specifically, under a scenario where the savings rate remains constant as the growth rate declines (shown by the solid upper line in Figure 1), capital’s share of income doubles over the length of the run. Conversely, however, with an elasticity of substitution less than 1, capital’s share of income declines over the period, in spite of the fact that both 𝑠/𝑔 and 𝑟𝑠/𝑔 go to infinity. With σ equal to 0.5, and with the savings rate held constant (the solid lower line in Figure 1), capital’s share of income has more than halved over the course of the run. Note that when the elasticity of substitution is equal to 1, then capital’s share of income remains entirely unchanged as the growth rate declines.
Although it is not made explicit in equation (8), Figure 1 illustrates that the extent of the increase in capital’s share of income when 𝜎 > 1 depends on what is happening simultaneously to the savings rate s. Specifically, the solid upper line shown in Figure 1 for 𝜎 = 5 assumes that the savings rate remains constant over the run. In a closed economy, with a balanced public sector, net investment must be equal to savings.8 Consequently, a constant
8 This follows from the ‘fundamental accounting identity’: S – I = G – T + X – M, with S = savings, I = investment, G = government spending, T = taxes, X = exports and M = imports.
8 | CUSP WORKING PAPER No. 11
savings rate and a declining growth rate could only occur in the context of an increasing capital-to-output ratio 𝛽.
Figure 1: Long-term behaviour of capital’s share of income as σ varies and g→0: Solid lines indicate scenarios where the savings rate remains unchanged over the course of the run; dashed lines indicate scenarios where the savings rate falls to zero as the growth rate declines.9
In fact, under the assumptions made in SIGMA, with a constant savings rate of 8%, the upper line in Figure 2 illustrates that the capital-to-output ratio more than doubles as the growth rate declines to zero. Mathematically, we can see from equation (8) that when 𝛽 is increasing and its exponent is greater than 0, then the share of income going to capital will continue to increase over the run. Likewise, when 𝛽 is increasing and its exponent is less then 0, which is the case for 𝜎 = 0.5, then the share of income going to capital must continually decrease over time as shown in the solid lower line in Figure 1.
The broken lines in Figure 1 and the lower line in Figure 2 represent a rather different (and perhaps more realistic) case, in which the savings rate declines to zero alongside the growth rate. In this case, as Figure 2 shows, the capital to output ratio 𝛽 converges to a constant value. Intuitively this
9 For comparison with similar results in Jackson and Victor 2016, Figure 4, note that the results in the earlier paper were restricted to the case where the savings rate remained constant.

9 | CUSP WORKING PAPER No. 11
is clear. By the end of the run, there is no more growth in the economy and no net investment. Both the output and the capital stock are unchanging.
Figure 2: Long-term behaviour of the capital-to-output ratio as g→0 under different savings rate assumptions
Interestingly, under these circumstances, capital’s share of income 𝛼 remains firmly bounded. As the dotted lines in Figure 1 illustrate, when 𝜎 =5, 𝛼 converges to a value that is slightly higher than the initial share of capital, and when 𝜎 = 0.5, to a value that is slightly lower than the initial share. Mathematically, we can see from equation (8) that if 𝛽 converges to a constant value 𝛽7HH, as g goes to zero, then so does the capital share 𝛼, with values given by 𝑎𝛽7HHI.Jand𝑎/𝛽7HH , when 𝜎 = 5and0.5 respectively. For the values assumed in the SIGMA model, capital’s share of income after 100 periods moves just ±6 percentage points from the initial capital share of 33%. More importantly, once the savings rate and the growth rate have both fallen to zero, these shares remain constant. There is no indication of an ‘explosive’ increase in the share of income going to capital, even under high elasticities of substitution between labour and capital.
From the perspective of our discussion, this finding is distinctly comforting. Piketty’s hypothesis of an inevitable and potentially dramatic increase in inequality arising from a decline in the growth rate only holds under

10 | CUSP WORKING PAPER No. 11
particular circumstances. Clearly there are some instances, such as the case shown by the upper solid line in Figure 1, where an increasing proportion of the national income goes to capital and a declining (indeed eventually disappearing) proportion goes to labour. Here, the fear of an explosive increase in inequality is valid. For most other cases and, in particular for cases where the savings rate declines to zero alongside the growth rate, the share of income going to capital is either firmly bounded or else declines continually, presenting none of the dangers inherent in Piketty’s hypothesis.
The behaviour of the savings rate as the growth rate declines is going to depend in practice on the confidence of investors in being able to protect the return on capital. This will depend in its turn on the relative power of capital and labour in the economy. Our model allows us to gain some insight into this dynamic be exploring an endogenous rate of return on capital. Figure 3a shows the rates of return on capital (for different values of 𝜎) when the savings rate is held constant in the model and the growth rate declines. Figure 3b shows the rates of return when the savings rate goes to zero over the run.
In the former case, we can see that the rate of return on capital falls more or less precipitously, depending on whether 𝜎 is (respectively) lower or higher. For 𝜎 = 0.5 , the rate of return on capital falls from around 11% at the beginning of the run to around 2% at the end of the run. With low substitutability between labour and capital, it is not possible for the owners of capital to increase revenues by lowering costs and the effect of investment is simply to push up the capital to output ratio in the economy (Figure 2) without a corresponding growth in demand. By the end of the run, when the growth rate has (by construction) fallen to zero, net investment is simply soaking income away from consumption and government expenditure, building capital for no apparent reason.
There may certainly be circumstances under which the capital intensity of the economy continues to rise in this way, even as the growth rate falls. For example, we might imagine that higher capital intensity accompanies increasing automation or the implementation of artificial intelligence (AI) in once labour intensive sectors. If this were not accompanied by an increase in demand – for instance if no compensating measures were taken to provide displaced labour with some form of income – then the structure of our economies could indeed change in this more capital intensive

11 | CUSP WORKING PAPER No. 11
direction.10 But clearly a rate of return on capital such as the one visible for low values of 𝜎 , would dramatically diminish the incentive for private investment. This situation is essentially the one characterised by Keynes in the last chapter of the General Theory as ‘the euthanasia of the rentier’, in which a persistent oversupply of savings leads to a progressive decline in the rate of return on capital (Keynes 1936). So the scenario of constant savings is an unlikely one under these circumstances.
When there is an aggressive substitution of capital for labour (𝜎 = 5, the upper solid line in Figure 3a), then there is at least a chance for the private investor to stabilise their profits. But the societal challenge in this case (shown by the upper solid line in Figure 1) is the increasingly high share of income going to capital. This indeed is the one case which does fit the Piketty analysis and gives rise to the biggest fears about runaway inequality. The only real solution to this social problem would be a radical re-distribution of incomes and/or of capital assets. We address this question in a later section of the paper.
By contrast, when the savings rate falls to zero alongside the declining growth rate, the return to capital is more resilient. Some fall is still clearly visible in Figure 3b, but this stabilises relatively quickly and rates of return across the range of values of 𝜎 are considerably higher than in the case where the savings rate remains constant. Note that when the growth rate has declined to zero, a zero rate of net savings is consistent with a constant capital-to-output ratio. In fact, this assumption (of constant capital-to-output) is widely held in post-Keynesian models (see eg Godley and Lavoie 2007, Appendix 2) and to some extent justified on the basis of empirical data. Certainly, over recent years, a relatively stable capital to output ratio is to be observed in a country such as the UK (ONS 2017). This does not of course rule out changes that might occur under a different economic or social structure. But for now a savings rate that declines alongside the growth rate is consistent with a variety of values for 𝜎. The key point to note is that under these circumstances (reflected in the broken lines in Figure 1) capital’s share of income is clearly bounded – in stark contrast to the Piketty hypothesis.
10 An interesting alternative example might be the additional capital investment needed for the transition to a low-carbon economy. More generally, the investment needed to sustain and enhance ecological assets or biological diversity might lead to a rising capital-to-output ratio.

12 | CUSP WORKING PAPER No. 11
Figure 3: Long-term behaviour of the rate of return on capital as g→0 Solid lines (a) indicate scenarios where the savings rate remains unchanged over the course of the run; dashed lines (b) indicate scenarios where the savings rate falls to 0 as the growth rate declines.
0
0.02
0.04
0.06
0.08
0.1
0.12
0 10 20 30 40 50 60 70 80 90 100
Rateofreturnon
capital
Time
σ =0.5
σ =5
σ =1
0
0.02
0.04
0.06
0.08
0.1
0.12
0 10 20 30 40 50 60 70 80 90 100
Rateofreturnon
capital
Time
σ =0.5
σ =5
σ =1
a.
b.

13 | CUSP WORKING PAPER No. 11
Savings and the distribution of incomes
The functional distribution of income between labour and capital tells us little about the actual distribution of incomes in the population without some account of the ownership of capital assets. Under the conditions of our reference case, both income and wealth are equally distributed between workers and capitalists. There is no inequality in such a society, whatever happens to the share of income going to capital. Clearly this is not very realistic as a depiction of capitalist society. One of the things we know for sure, not least from Piketty’s work, is that the distribution of both wealth and incomes is already skewed in modern societies, sometimes quite excessively. In fact, as we next demonstrate, inequality in incomes can arise simply from differential savings rates between different household sectors.
Figure 4: Income inequality arising from differential savings rates (g = 2%)
Let us suppose that – for whatever reason – the savings rate of ‘workers’ is lower than the savings rate across the economy as a whole – say 5% as opposed to 8%, with the savings rate of ‘capitalists’ rising to compensate. Figure 4 shows that this apparently trivial innovation immediately introduces income inequality. The index of inequality shown in Figure 4 is constructed by taking the ratio of the disposable income of capitalists to the disposable income of workers subtracting one and multiplying by 100. The vertical axis in Figure 4 thus represents the percentage increase of capitalist incomes above worker incomes. By the end of the run and without any
0
5
10
15
20
25
30
35
40
45
50
0 10 20 30 40 50 60 70 80 90 100
Inde
xofine
quality
Time
σ =0.5
σ =5
σ =1

14 | CUSP WORKING PAPER No. 11
decline in the growth rate the disposable incomes of ‘capitalists’ are more than 40% higher than the disposable income of ‘workers’. This is a fascinating insight into the structural dynamics through which capitalism has an in-built function for the divergence of incomes (Kalecki 1939, Kaldor 1955, Galbraith 2013).
Figure 5a: Income inequality arising from differential savings rates (g → 0, s = 8%)
Figure 5b: Income inequality arising from differential savings rates (g → 0, s → 0)
0
10
20
30
40
50
60
70
80
0 10 20 30 40 50 60 70 80 90 100
Inde
xofine
quality
Time
σ =0.5
σ =5
σ =1
0
5
10
15
20
25
30
35
40
45
50
0 10 20 30 40 50 60 70 80 90 100
Inde
xofine
quality
Time
σ =0.5
σ =5
σ =1

15 | CUSP WORKING PAPER No. 11
Under conditions of slowing growth (Figure 5), as we might expect from the previous analysis, the evolution of inequality is dependent on two key factors: the elasticity of substitution 𝜎 and the behaviour of the savings rate s. Suppose first that the savings rate remains constant. Then for high σ, ie for high substitutability of labour for capital (Figure 5a), the inequality between capitalists and workers is exacerbated. When σ = 5, capitalist incomes are over 70% higher than worker incomes by the end of the scenario. By contrast, the situation is improved for low σ. Capitalist incomes are less than 10% above worker incomes at the end of the run when σ is equal to 0.5 and inequality is declining, largely because of the steep decline in the rate of return on capital (Figure 3a). For the case where the savings rate declines alongside the growth rate (Figure 5b), the results are much less differentiated. For each value of σ, inequality remains bounded and, perhaps surprisingly, inequality is lower for each value of σ than the case with a 2% growth rate (Figure 4). In these circumstances, in other words, far from increasing inequality, growth rate stagnation may, under certain conditions, actually reduce inequality.
Figure 6: Income inequality with skewed initial ownership and differential savings Solid lines indicate scenarios where the savings rate remains unchanged over the course of the run; dashed lines indicate scenarios where the savings rate falls to zero as the growth rate declines.
0
50
100
150
200
250
300
350
0 10 20 30 40 50 60 70 80 90 100
Inde
xofine
quality
Time
σ =0.5
σ =5
σ =1

16 | CUSP WORKING PAPER No. 11
The inequality shown in Figures 4 and 5 arises simply from changing the savings rates, assuming a completely equal distribution of income and capital at the outset. Figure 6 illustrates what happens, when the initial distribution of assets is unequal. For the purposes of this illustration, we assume that capitalists comprise only 20% of the population but own 80% of the wealth – a proportion not massively unrealistic from the perspective of today’s global distribution (ONS 2014, Oxfam 2015). We also assume (rather conservatively) that the distribution of wages remains proportional between the two groups, despite the skewed distribution in asset ownership: capitalists earn 20% of the wages and workers earn 80%. Finally, we maintain the savings rate differential between workers and capitalists assumed in the previous experiment.
The first thing to note from Figure 6 is that capitalist incomes are immediately around 166% higher than worker incomes at the start of the run because of the profits achievable from greater ownership of capital assets. What happens subsequently depends crucially on the evolution of the savings rate s and the value of σ, the elasticity of substitution between labour and capital.
The dependency is complex. Specifically, when the overall rate of savings across the economy is conserved through the run (shown by the solid lines in Figure 6), the level of income inequality is highly sensitive to the elasticity of substitution between labour and capital. With highσ (the upper solid line in Figure 6), capitalists can protect their return on capital by continually substituting capital for labour and suppressing wages. This leads to a steeply rising income inequality – somewhat similar to the scenario envisaged by Piketty. For lowσ under conditions of constant saving, however, (the lower solid line in Figure 6), capitalists are unable to substitute away from labour and as the growth rate slows down, rates of return to capital fall and capitalist income is moderated, leading to a significant decline in income inequality. When the savings rate declines alongside the growth rate (the dotted lines in Figure 6), then outcomes are considerably less sensitive to the value of σ. It is notable immediately that, in this case, income inequality is bounded and falling over the course of the run even for high σ.
Policy experiments
We are now in a position to explore the potential of fiscal policy measures to reduce inequality. We test these measures in two distinct scenarios,
17 | CUSP WORKING PAPER No. 11
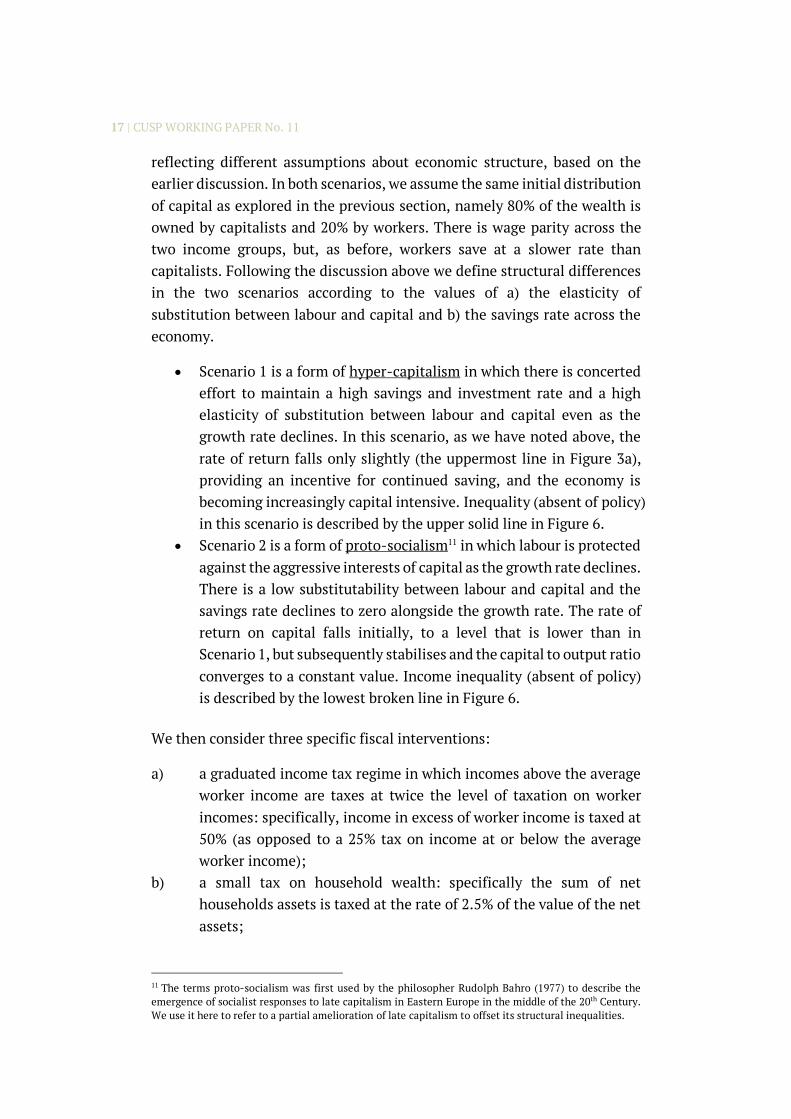
reflecting different assumptions about economic structure, based on the earlier discussion. In both scenarios, we assume the same initial distribution of capital as explored in the previous section, namely 80% of the wealth is owned by capitalists and 20% by workers. There is wage parity across the two income groups, but, as before, workers save at a slower rate than capitalists. Following the discussion above we define structural differences in the two scenarios according to the values of a) the elasticity of substitution between labour and capital and b) the savings rate across the economy.
• Scenario 1 is a form of hyper-capitalism in which there is concerted effort to maintain a high savings and investment rate and a high elasticity of substitution between labour and capital even as the growth rate declines. In this scenario, as we have noted above, the rate of return falls only slightly (the uppermost line in Figure 3a), providing an incentive for continued saving, and the economy is becoming increasingly capital intensive. Inequality (absent of policy) in this scenario is described by the upper solid line in Figure 6.
• Scenario 2 is a form of proto-socialism11 in which labour is protected against the aggressive interests of capital as the growth rate declines. There is a low substitutability between labour and capital and the savings rate declines to zero alongside the growth rate. The rate of return on capital falls initially, to a level that is lower than in Scenario 1, but subsequently stabilises and the capital to output ratio converges to a constant value. Income inequality (absent of policy) is described by the lowest broken line in Figure 6.
We then consider three specific fiscal interventions:
a) a graduated income tax regime in which incomes above the average worker income are taxes at twice the level of taxation on worker incomes: specifically, income in excess of worker income is taxed at 50% (as opposed to a 25% tax on income at or below the average worker income);
b) a small tax on household wealth: specifically the sum of net households assets is taxed at the rate of 2.5% of the value of the net assets;
11 The terms proto-socialism was first used by the philosopher Rudolph Bahro (1977) to describe the emergence of socialist responses to late capitalism in Eastern Europe in the middle of the 20th Century. We use it here to refer to a partial amelioration of late capitalism to offset its structural inequalities.

18 | CUSP WORKING PAPER No. 11
c) a citizen’s income provided to every citizen across the economy equally: specifically a universal basic income equivalent to 10% of the average worker salary is provided to everyone, whether employed or unemployed, worker or capitalist.
All three measures are introduced gradually in the model over the first twenty periods. After that point the tax rates are held constant. The first measure is relatively conventional. Graduated tax regimes are common practice in most advanced economies and many less advanced economies. A higher tax rate on income over a certain threshold is commonly used as a way of redistributing income and providing for social security for the poorest in society. The second proposal of a tax on capital assets is the one suggested by Piketty (2014a) to offset the rise in inequality that he assumes will take place when there is a declining growth rate. Though less common in practice it has a relatively long pedigree in economic thought, for instance in Henry George’s proposals for a land tax.12
The final suggestion is the universal basic income – sometimes called a citizen’s income or a social dividend. This idea too has a long pedigree. Thomas More included the idea in his 1516 description of Utopia (More 1963). Over the years, it has been advocated by a wide range of economists and political theorists (Meade 1988, Gorz 1999, McKay 2001, Wright 2005) and has been revived recently by a variety of commentators from across the political spectrum (Murray 2008, JRF 2015, RSA 2015, Varoufakis 2016). One or two pilot schemes have recently been implemented – in Finland (Guardian 2017) for example and in Alaska (BIEN 2015).
To model the citizen’s income in SIGMA, we adopted a proposal similar to those suggested by Wright (2005) and Varoufakis (2016) in which universal basic income is funded through a social dividend paid from the ownership of ‘common stock’ – that is to say equities purchased and held on behalf of the public by the nation state.
This is of course a rather striking departure from a pure capitalist model in which the ownership of productive assets is assumed to be held in private hands. But it responds explicitly to the underlying inequality in the ownership of assets. It also draws justification from the idea that profit is a form of social contract (Varoufakis 2016), which should reflect, at least in part, the investment made by the state in education, in primary research and
12 Interestingly, this type of measure was proposed (at least in pilot form) by at least two political parties in the most recent UK general election in June 2017.

19 | CUSP WORKING PAPER No. 11
in the development the means of production itself. Mazzucato (2015) has famously pointed out that every key innovation in Apple’s iPhone was funded by the US government. The assumption that only Apple’s shareholders should benefit from profits on sales of the iPhone is therefore a distortion of the social contract in favour of the owners of capital and against the interests of the public.
In our model, the state purchases equities on a year on year basis, following an adjustment model in which equities are purchased if the gap between the citizen’s income paid and the dividend from common stock is greater than zero and sold if the gap is less than zero. This structure allows the government both to stabilise the level of the citizen’s income and also to balance its equity holdings over the longer term.13
Figure 7: Tackling structural inequality through fiscal policy
Figure 7 shows the results of the simulations. There are two groups of results each associated with one of the scenarios described above. Broadly speaking, the upper set of lines (shown in red) in Figure 7 refers to Scenario 1 and the
13 SIGMA has the potential for equity purchases to be made either from tax receipts or from deficit spending. The results shown in this paper are for purchases made through deficit spending. Since common stock is an asset of the government, it is to be noted that this kind of purchase does not in itself change the net debt to equity ratio of the nation.
0
50
100
150
200
250
300
350
0 10 20 30 40 50 60 70 80 90 100
Inde
xofine
quality
Time
Scenario1 Scenario1a Scenario1b Scenario1c Scenario1abc
Scenario2 Scenario2a Scenario2b Scenario2c Scenario2abc

20 | CUSP WORKING PAPER No. 11
lower set of lines (shown in green) refers to Scenario 2, although the lowest line in Scenario 1 overlaps with several of the lines in Scenario 2.
The uppermost line of all shows the income inequality in the reference case for Scenario 1 (ie before fiscal intervention). The broken red lines below this solid upper line illustrate the impact of each intervention in turn, in terms of reducing income inequality. The lowest broken line from this Scenario, which first dips sharply down as the measures are introduced and then increases throughout the rest of the run, shows the effect of implementing all three measures together. It illustrates that these policy measures on their own, even taken together, are insufficient to contain inequality in the longer term. By the end of the run, income inequality is once again rising at an increasing pace.
By contrast, the lower set of (green) lines associated with Scenario 2 show declining income inequality throughout the run. The uppermost (broken) line from this set describes the reference case and is identical to the lowest broken line in Figure 6. The next three green lines illustrate the impact of each of the three policy interventions, taken on their own. The lowest solid (green) line in Figure 7 shows the implications of implementing all three measures together in Scenario 2. At the end of the run, the per capita income of capitalists is less than 10% higher than the per capita income of workers. In other words, inequality has almost entirely been eliminated.
As regards the relative impact of the individual measures it is to be noticed that the basic income has the least impact on inequality (at this level of implementation). This is not particularly surprising, since the basic income is given equally to both worker and capitalist households. The main distributive effect takes place therefore by removing productive assets from private ownership and reducing the returns to capital available to private asset owners. The relative effectiveness of the graduated income tax and the capital tax switch switches between the two Scenarios. In Scenario 1, an income tax is more effective (at the chosen level). In Scenario 2, the capital tax becomes the more effective instrument.
Of course, it is difficult to make hard and fast conclusions about relative effectiveness when the levels at which the various measures are applied have been chosen fairly arbitrarily. But some assessments are possible on the basis of political acceptability. For instance, an income tax band higher than 50% might struggle for acceptability in some advanced economies (such as the UK). Imposing an even higher level of income taxation might
21 | CUSP WORKING PAPER No. 11
therefore prove difficult. Although the level of capital tax is rather low (2.5%), the actual transfer of funds from private individuals is relatively large and may again suffer from political resistance. A citizen’s income of 10% of the unadjusted worker income is lower than has been proposed by some advocates. Citizen’s Income Trust proposals are around the 20% mark for example. But the Alaskan dividend is closer to this level. Moreover, higher levels of social dividend run into another kind of problem of political acceptability. At the end of the run, with a citizen’s income of 10%, the state already ends up owning between 20% and 30% of the nation’s productive assets. Doubling that income more or less doubles that level of public ownership. Clearly at that point the economy begins to look very unlike any capitalist economy of the last half a century or so.
Concluding remarks
The rising inequality within advanced economies over recent decades may, as Piketty has suggested, be a structural feature of capitalism in the 21st Century. It is not however an inevitable feature of an economy with a declining growth rate. Rather, as we have shown in this paper, the progress of inequality depends crucially on the institutional context within which a decline in the growth rate is taking place.
Under certain conditions, it is entirely possible for income inequality to rise precipitously as growth rates decline. However, we have also established that there is absolutely no inevitability at all that a declining growth rate leads to explosive (or even increasing) levels of inequality. Even under a highly-skewed initial distribution of ownership of productive assets, it is entirely possible to envisage scenarios in which income inequality declines over the longer-term, even without intervention from progressive taxation policies.
The two most critical structural factors which determine what happens are the level of savings as the growth rate declines and the degree of substitutability between labour and capital. Depending on the configuration of these factors, two radically different futures may emerge. Under one future (Scenario 1), with high substitutability between capital and labour and an increasing power of capital over labour, it is possible for the owners of capital both to maintain the level of savings and to conserve the rate of return on that investment. But this can only happen at the expense of the wages of ordinary workers. In this particular future, income inequality rises precipitously.
22 | CUSP WORKING PAPER No. 11
Under another set of conditions, strong institutions might protect the rights of workers and reduce the substitution of capital for labour. Attempts by capitalists to maintain a given savings rate under such conditions lead (Figure 3a) to a dramatic collapse in the rate of return on investment, and a partial reversal in the relative fortunes of workers and capitalists. In reality, this situation is unlikely to persist for long. Faced with plummeting rates of return, it is likely that the savings rate would itself tend to fall. Paradoxically, this decline in the savings rate tends to stabilise the decline in the rate of return on investment (Figure 3b) and this, to some extent, then protects the incomes of capitalists.
In fact, when the savings rate falls alongside the growth rate, the economy is considerably less sensitive to the substitutability between labour and capital. Rates of return fall more or less slowly according to whether the elasticity of substitution is (respectively) lower or higher, but in both cases remain comparable with those achieved in a growing economy. Not surprisingly, income inequality falls in both cases, even before fiscal interventions, as the dashed lines in Figure 6 attest.
Of particular interest to our exploration in this paper is the situation in which savings rates decline as the growth rates decline and there is in addition a low elasticity of substitution between capital and labour. Under these conditions (Scenario 2), inequality declines by over 40%, even in the absence of redistributive policies (Figure 6, lowest dashed line).
Turning next to redistributive policies, the most striking finding from our model is that even relatively progressive policies which impose a combination of higher differential tax rates, taxes on capital and a basic income (funded from returns to capital) remain ineffective in the long run in bringing down structural inequality under the hyper-capitalism described in Scenario 1. Higher capital to income rates, constant savings rates and the rigorous protection of rates of return on investment lead inevitably to the ‘explosive’ inequality highlighted by Piketty, and the best efforts of progressive fiscal policies are unlikely to be able to halt this rise. Even the much vaunted ‘solution’ of a basic income fails to curb the inevitable rise in inequality under such conditions (Scenario 1).
In the ‘proto-socialism’ of Scenario 2, on the other hand, this same combination of such measures is strikingly effective. By the end of the run, inequality between capitalists and workers is almost entirely eliminated. This could only be achieved by protecting the quality and intensity of

23 | CUSP WORKING PAPER No. 11
people’s time in the workplace and imposing some curbs on the interests of aggressive substitution of capital for labour. In fact, as we showed in our earlier paper (Jackson and Victor 2016, Figure 8), it is only really under conditions of low substitutability of capital for labour, that it is possible to maintain employment rates at anything like historical levels in the context of a declining growth rate.
It is worth remarking briefly here on the implications of this analysis for debates about the future of work. The most worrying scenario, in terms of rising inequality, is the case where there is a continual increase in the capital-to-output ratio, a high substitutability between capital and labour, and a constant savings rate. It is easy enough to recognise situations in which this occurs. For instance, an economic future characterised by increasing technological automation or digitalisation, dominated by relatively few companies with a high degree of monopoly power over labour, and a vigorous protection of the rate of return on capital poses exactly the kind of dangers that Scenario 1 highlights. Inequality (and unemployment) both rise precipitously and the long-term prospects for social (and economic) stability must be regarded as fragile at best.
On the other hand, as we have argued in this paper, it is entirely possible to envisage circumstances in which there is far less substitutability between labour and capital, the returns to capital are stabilised by a decline in the savings rate and the rights of workers are better protected from the aggressive incursions of capital. It is beyond the scope of this paper to explore the nature of such an economy in more detail. In terms of industrial structure, it is likely to involve a transition away from resource-intensive mass production processes and towards the evolution of an economy of quality and service (Jackson 2017, Chapter 8 eg). In terms of policy, it might involve institutional innovations which better represent the interests of workers in the management of firms (Ferrera 2017) and which perhaps allow government to operate as an ‘employer of last resort’ (Minsky 1986). The burgeoning literature on post-growth economics has an important role to play in more fully elaborating on such possibilities.
In summary, the idea that rising income inequality is an inevitable consequence of declining growth rates is quite clearly wrong. On the contrary, the post-growth economy might equally be headed towards lower income inequality and greater stability with respect to the substitution between labour and capital. The choice lies in the underlying structure of

24 | CUSP WORKING PAPER No. 11
economic relations and, in particular, the relations between labour and capital.
References
Arrow, K H Chenery, B Minhas and R Solow 1961. Capital-Labor Substitution and Economic Efficiency. The Review of Economics and Statistics 43(3): 225-250.
Bahro, R 1977. The Alternative in Eastern Europe. Translated by David Fernbach. London: NLB.
BIEN 2015. Alaska, USA: 2015 Dividend estimated to be near highest ever. Basic Income Earth Network. Online at: http://basicincome.org/news/2015/08/alaska-usa-dividend-amount-estimated-to-be-near-highest-ever/
Blewitt, J and R Cunningham 2014. The Post-Growth Project: How the End of Economic Growth Could Bring a Fairer and Happier Society. London: Green House.
Cassiers, I, k Maréchal and D Méda 2017. Post-growth Economics and Society: Exploring the Paths of a Social and Ecological Transition. London: Routledge.
Cohen, A. and G Harcourt 2003. Retrospectives: Whatever Happened to the Cambridge Capital Theory Controversies?. Journal of Economic Perspectives 17 (1): 199–214.
D’Alisa, G, F Damaria and G Kallis (Eds) 2014. Degrowth: a vocabulary for a new era. London: Routledge.
Ferrera, I 2017. Firms as Political Entities: saving democracy through economic bicameralism. Cambridge: Cambridge University Press.
Frase, P 2016. Four Futures: Life after Capitalism. London/New York: Verso Books.
Galbraith, J 2014. The End of Normal: The Great Crisis and the Future of Growth. New York: Simon & Schuster.
Galbraith, J 2013. The Third Crisis in Economics. Journal of Economic Issues 47(2): 311-322.
Godley, W and M Lavoie 2007. Monetary Economics – An Integrated Approach to Credit, Money, Income, Production and Wealth. London: Palgrave Macmillan.
Gordon, R 2016. The Rise and Fall of American Growth. Princeton: Princeton University Press.
Gorz, A 1999. Reclaiming Work. Oxford: Blackwell/Polity Press.
25 | CUSP WORKING PAPER No. 11
Guardian 2017. Finland trials basic income for unemployed. The Guardian. Online at: https://www.theguardian.com/world/2017/jan/03/finland-trials-basic-income-for-unemployed.
Jackson, T 2018. The post-growth challenge. CUSP Working Paper No 12. Centre for the Understanding of Sustainable Prosperity (CUSP), University of Surrey. (Forthcoming.)
Jackson, T 2017. Prosperity without Growth – foundations for the economy of tomorrow. London: Routledge.
Jackson, T and P Victor 2016. Does slow growth lead to rising inequality? Ecological Economics 121: 206–219.
JRF 2015. Could a Citizen’s Income Work? London: Joseph Rowntree Foundation. Available on line at: https://www.jrf.org.uk/sites/default/files/jrf/migrated/files/citizens-income-full.pdf
Kalecki, M 1939. Essays in the Theory of Economic Fluctuations. Keynes, J 1936. The General Theory of Employment, Interest and Money.
London: Palgrave Macmillan. Krusell P and A Smith 2014. Is Piketty’s ‘Second Law of Capitalism’
fundamental? Working Paper (1st Version). Washington DC: National Bureau of Economic Research.
Mazzucato, M 2018. The Entrepreneurial State: Debunking Public vs. Private Sector Myths. London: Penguin.
McKay, A 2001. "Rethinking Work and Income Maintenance Policy: Promoting Gender Equality Through a Citizens' Basic Income". Feminist Economics 7 (1): 97–118. doi:10.1080/13545700010022721.
Meade, J 1988. ‘Outline of Economic Policy for a Labour Government’, p 33 in Susan Howson (ed.), The Collected Papers of James Meade vol.1, Employment and Inflation, London: Unwin Hyman.
Minsky, H 1986. Stabilizing an Unstable Economy. New Haven: Yale University Press.
More, T 1516. Utopia (1st Latin edition, Louvain, 1516), English translation (1963) by Paul Turner, Harmondsworth: Penguin Classics: 43-44.
Murray, C 2008. Guaranteed Income as a Replacement for the Welfare State. Oxford: Foundation for Law, Justice and Society. Available at: http://www.fljs.org/sites/www.fljs.org/files/publications/Murray.pdf.
ONS 2017. Net Capital Stock to Output Ratio (TOTAL). London: Office for National Statistics. Online at: https://www.ons.gov.uk/economy/nationalaccounts/uksectoraccounts/timeseries/moo7/capstk

26 | CUSP WORKING PAPER No. 11
ONS 2014. Wealth and Income 2010-2012. Statistical Bulletin. Office for National Statistics. Online at: http://www.ons.gov.uk/ons/dcp171778_368612.pdf
Oxfam 2015. Wealth: having it all and wanting more. Oxford: OXFAM. Online at: http://policy-practice.oxfam.org.uk/publications/wealth-having-it-all-and-wanting-more-338125
Piketty, T 2014. Capital in the 21st Century. Cambridge, Mass: Harvard University Press.
Piketty, T 2010. On the Long-Run Evolution of Inheritance: France 1820-2050. Paris: Paris School of Economics, Working Paper.
Piketty, T, E Saez and G Zucman 2017. Distributional National Accounts: Methods and Estimates for the United States Data Appendix. Online at: http://gabriel-zucman.eu/files/PSZ2018DataAppendix.pdf.
Pulkka V 2017. A free lunch with robots – can a basic income stabilise the digital economy? Transfer 23(3): 295-311.
Robinson, J 1953. The Production Function and the Theory of Capital. Review of Economic Studies 21: 81.
RSA 2015. Creative citizen, creative state: the principled and pragmatic case for a universal basic income. London: Royal Society for the Arts.
Online at: https://www.thersa.org/discover/publications-and-articles/reports/basic-income
Summers, L 2014. U.S. Economic Prospects: Secular Stagnation, Hysteresis, and the Zero Lower Bound. Business Economics 49(2): 66-73.
Taylor, M 2017. Good work: the Taylor review of modern working practices. London: Department for Business, Energy and Industrial Strategy (BEIS). Online at: https://www.gov.uk/government/publications/good-work-the-taylor-review-of-modern-working-practices
Varoufakis, Y 2016. The Universal Right to Capital Income. Project Syndicate. Online at: https://www.project-syndicate.org/commentary/basic-income-funded-by-capital-income-by-yanis-varoufakis-2016-10?barrier=accessreg
Victor, P 2018. Managing without Growth: slower by design not by disaster (2nd Edition). Cheltenham: Edward Elgar.
Wright, E Olin 2005. "Basic Income as a Socialist Project," paper presented at the annual US-BIG Congress, University of Wisconsin 4–6 March 2005. Online at: http://www.ssc.wisc.edu/~wright/Basic%20Income%20as%20a%20Socialist%20Project.pdf