basic approach to evaluating a head ct · head ct approach first - evaluate normal anatomical...
TRANSCRIPT
BASIC APPROACH TO HEAD CT INTERPRETATION
David Zimmerman, M.D. Neuroradiology, BWH
Contents
� Basic principles of CT � CT Neuroanatomy � Disease Processes evaluated with CT
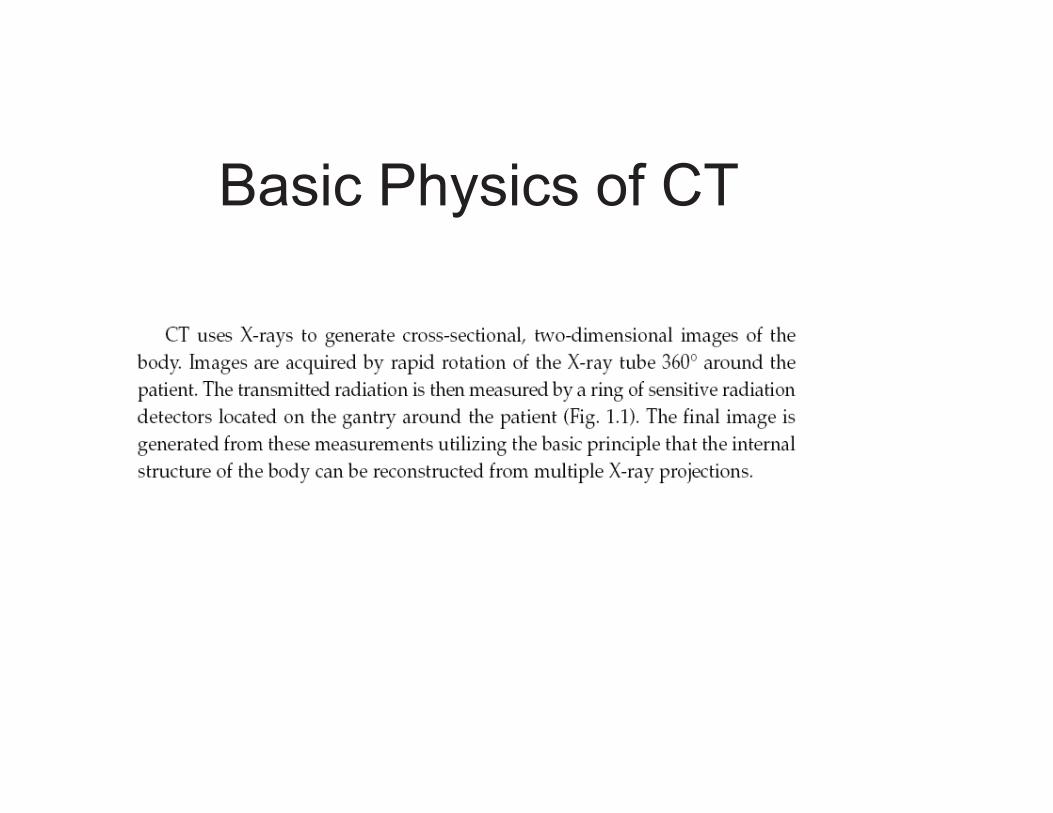
Basic Physics of CT
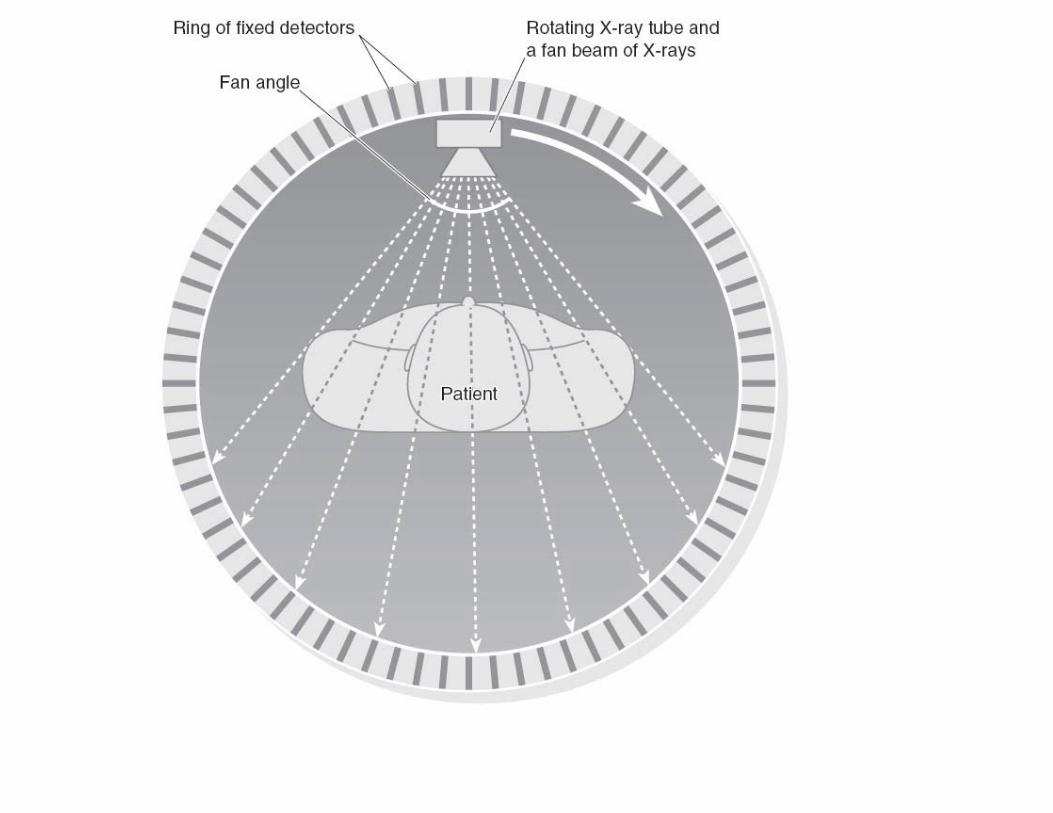
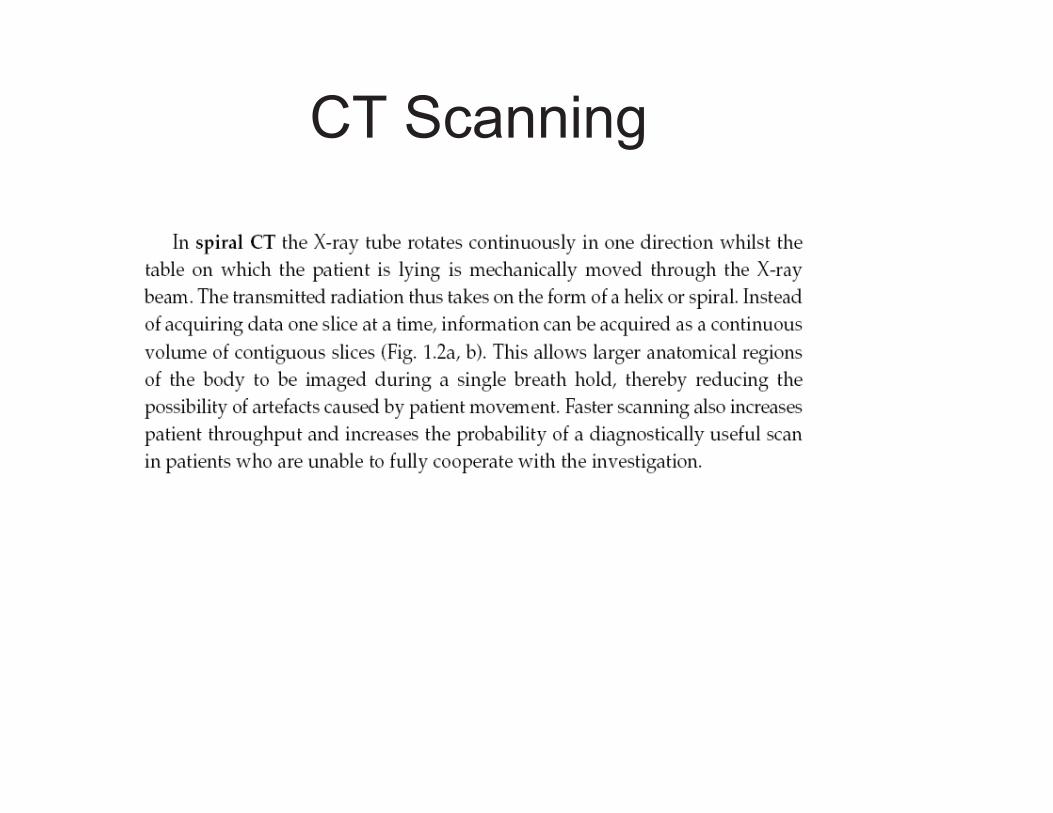
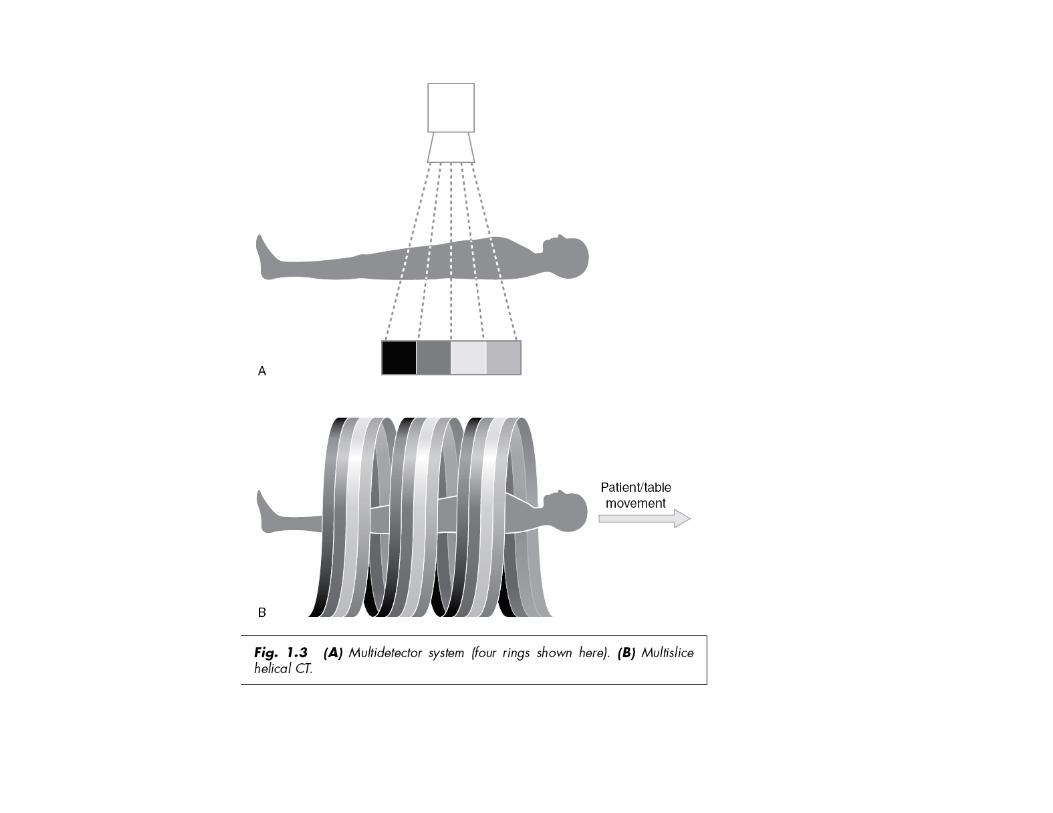
CT Scanning
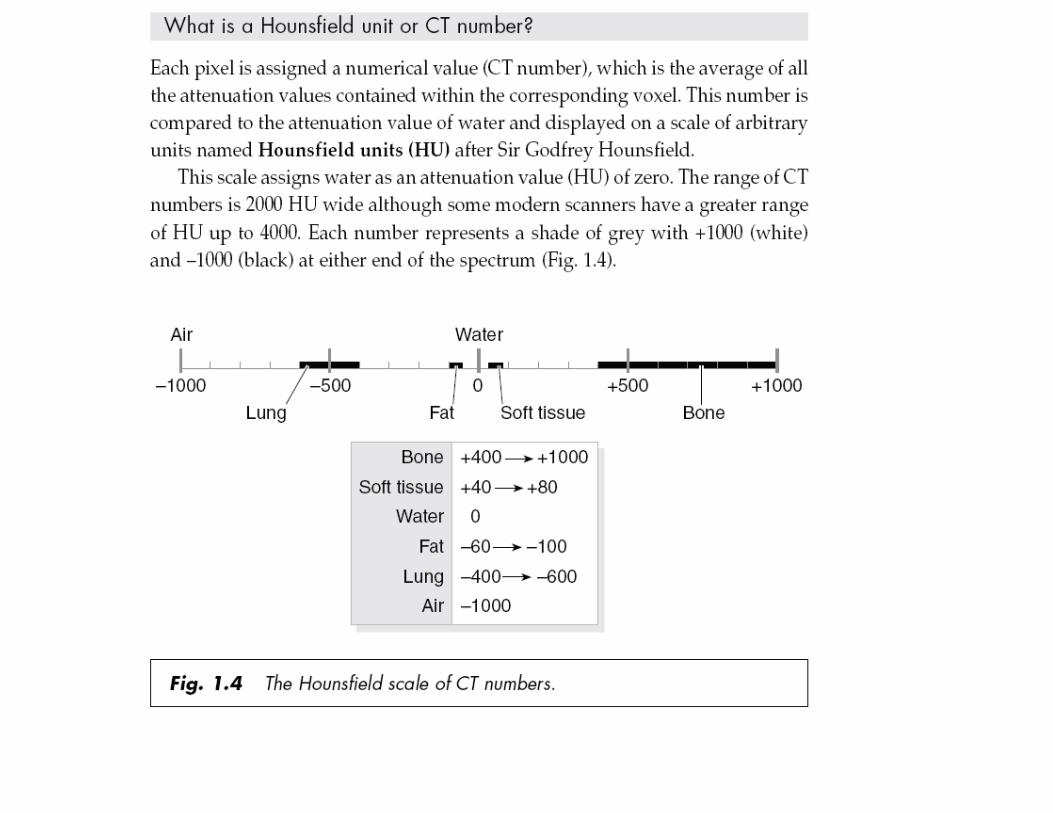
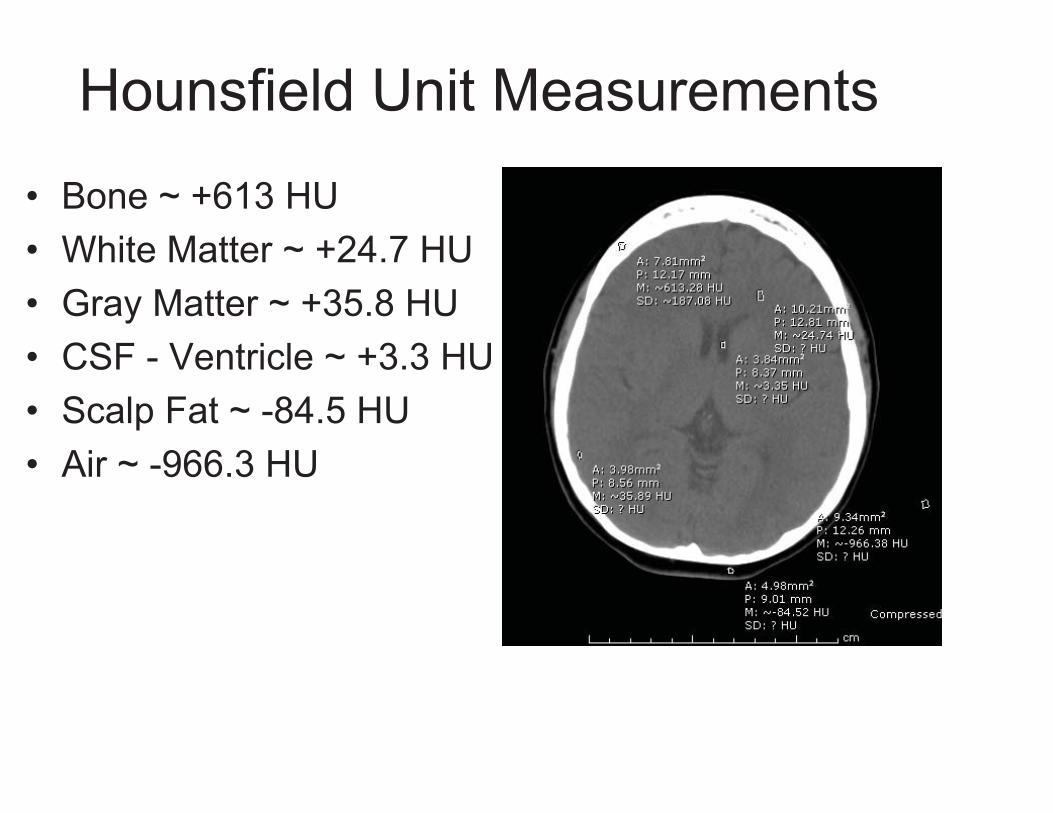
Hounsfield Unit Measurements
� Bone ~ +613 HU � White Matter ~ +24.7 HU � Gray Matter ~ +35.8 HU � CSF - Ventricle ~ +3.3 HU � Scalp Fat ~ -84.5 HU � Air ~ -966.3 HU
Tissue Density Differences � Lower density substances allow more photons
pass through to the detectors, resulting in a grayer or blacker appearance on CT – like CSF
� The X-ray beam is attenuated to a higher degree by calcium, therefore less photons pass through bone to the detectors, resulting in its ‘white’ appearance on CT
� White matter is less cellular, contains myelinated axons (fat), and has a higher water content than gray matter, resulting in slightly lower attenuation values or density

Different Window Levels
� Brain Window – shows subarachnoid hemorrhage (blood proteins/clot) is high density in the basilar cisterns with small foci of air (red arrows) related to trauma
� Soft Tissue Window – shows scalp hematoma � Bone window – shows bullet fragment and fracture


CT Artifacts

Beam Hardening Artifact from Metal Alloy in a Lodged Bullet
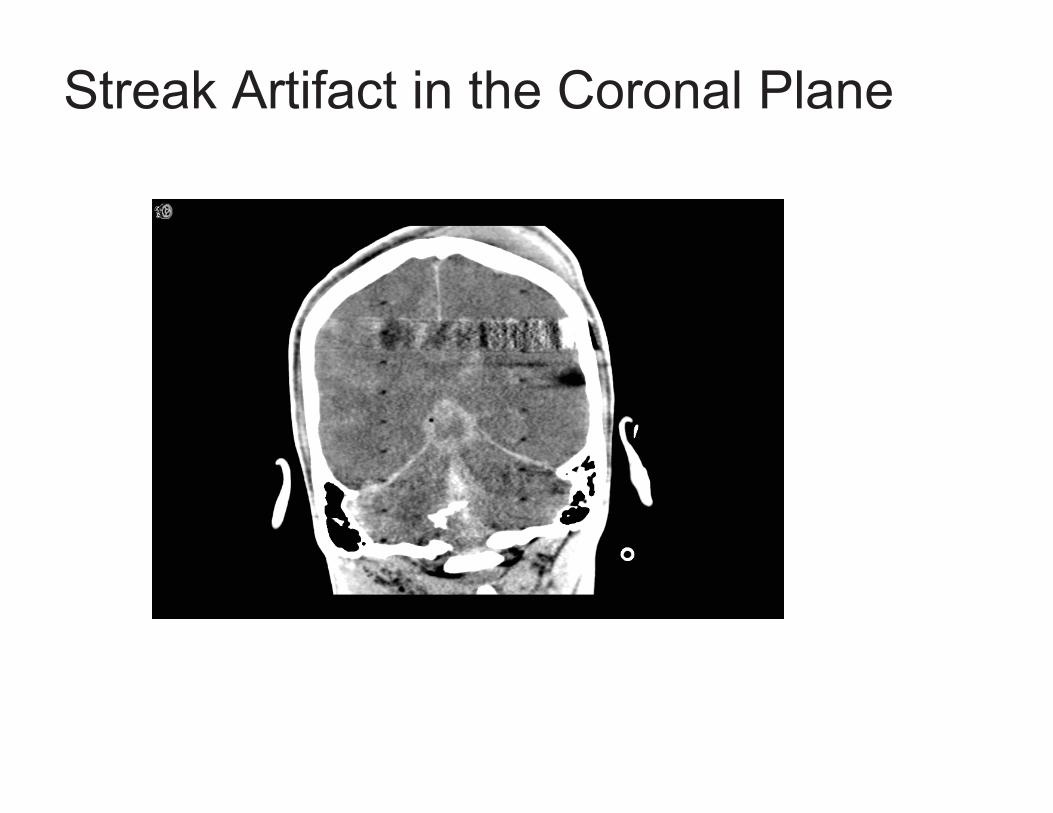
Streak Artifact in the Coronal Plane

Partial Volume Artifact � Note the red arrow, in the
extra-axial space adjacent to the right cerebellar hemisphere, there is slightly increased density related to averaging of the sigmoid sinus, cerebellum, and CSF in this slice
� Blue arrow – band of streak artifact limits evaluation of the pons

CT Neuroimaging � The head is routinely
scanned using sequential imaging in the axial plane with each section measuring 5 mm thick
� Helical imaging is used for CT angiograms of the head/neck and other parts of the body
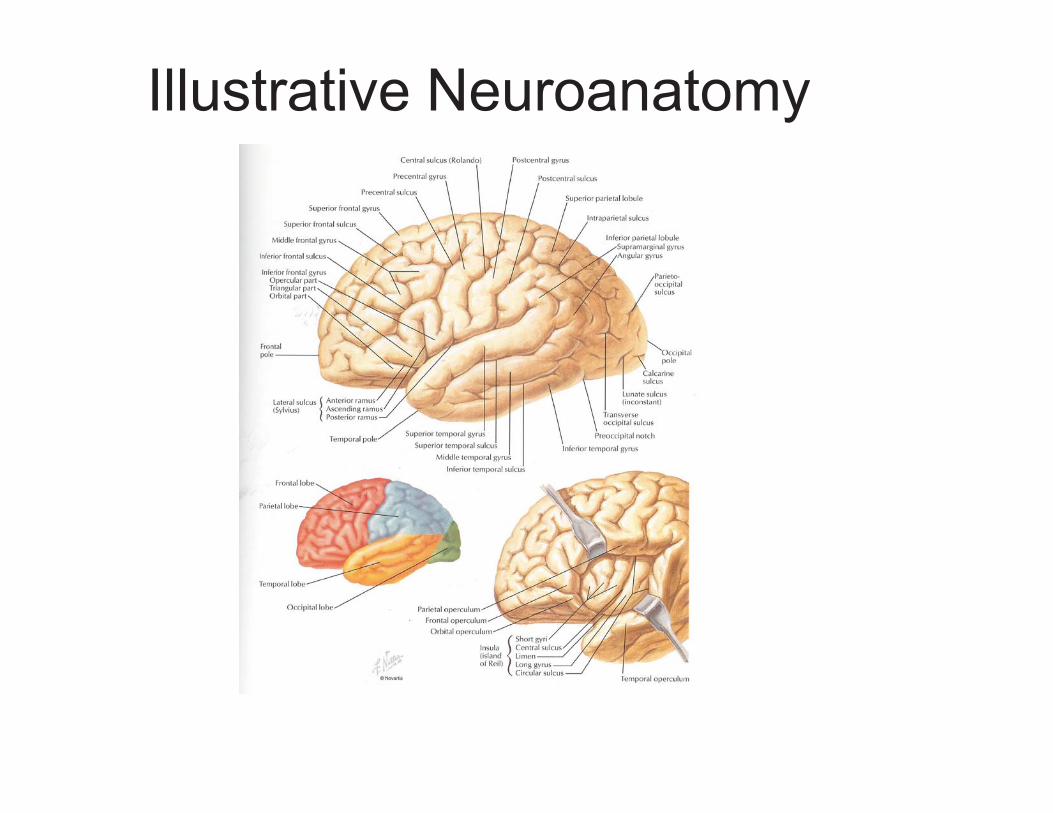
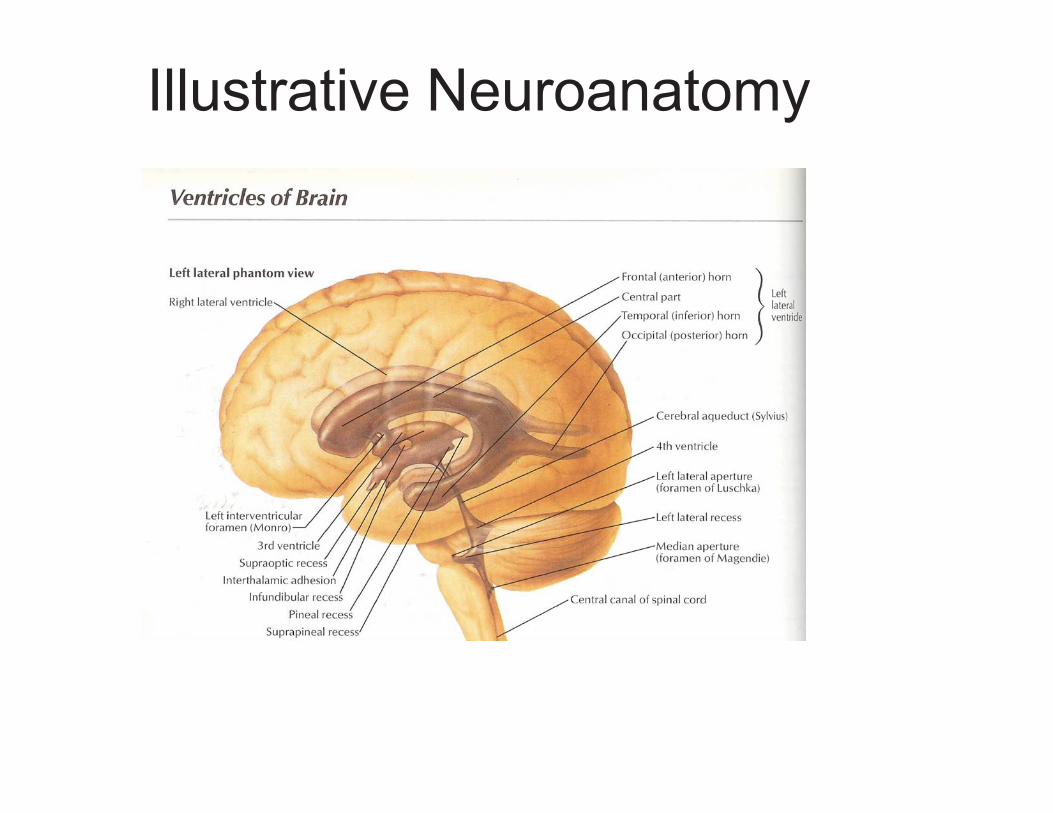
Illustrative Neuroanatomy
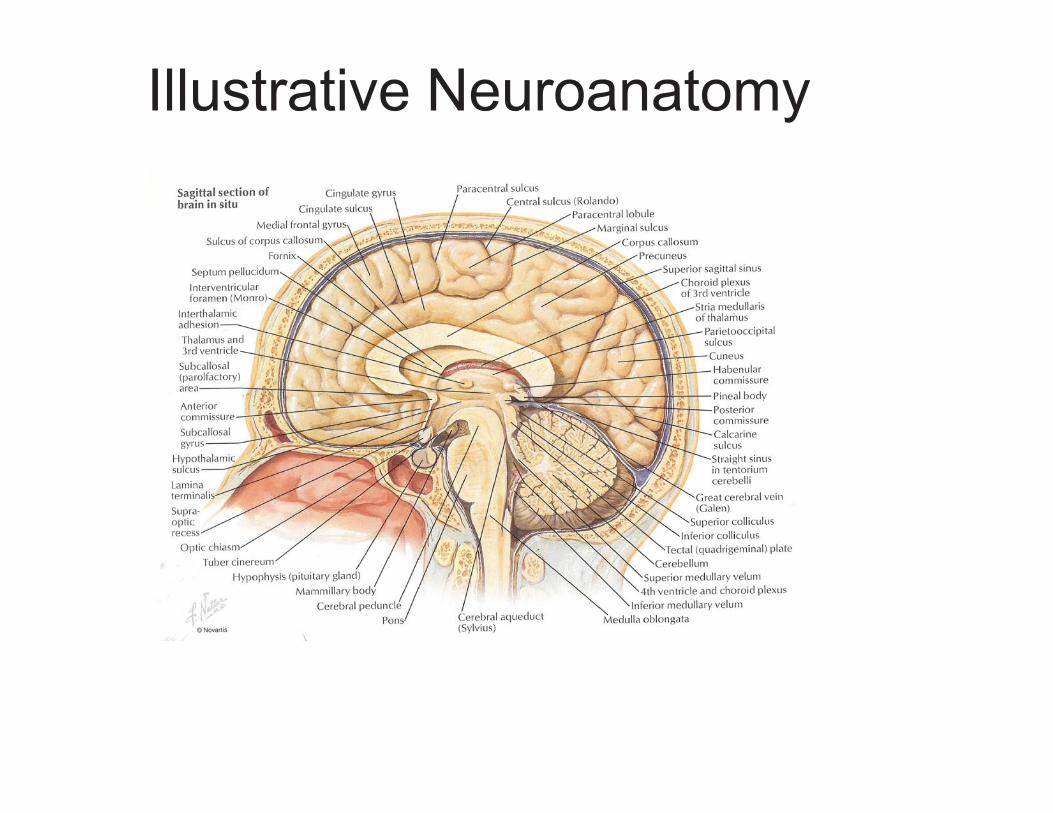
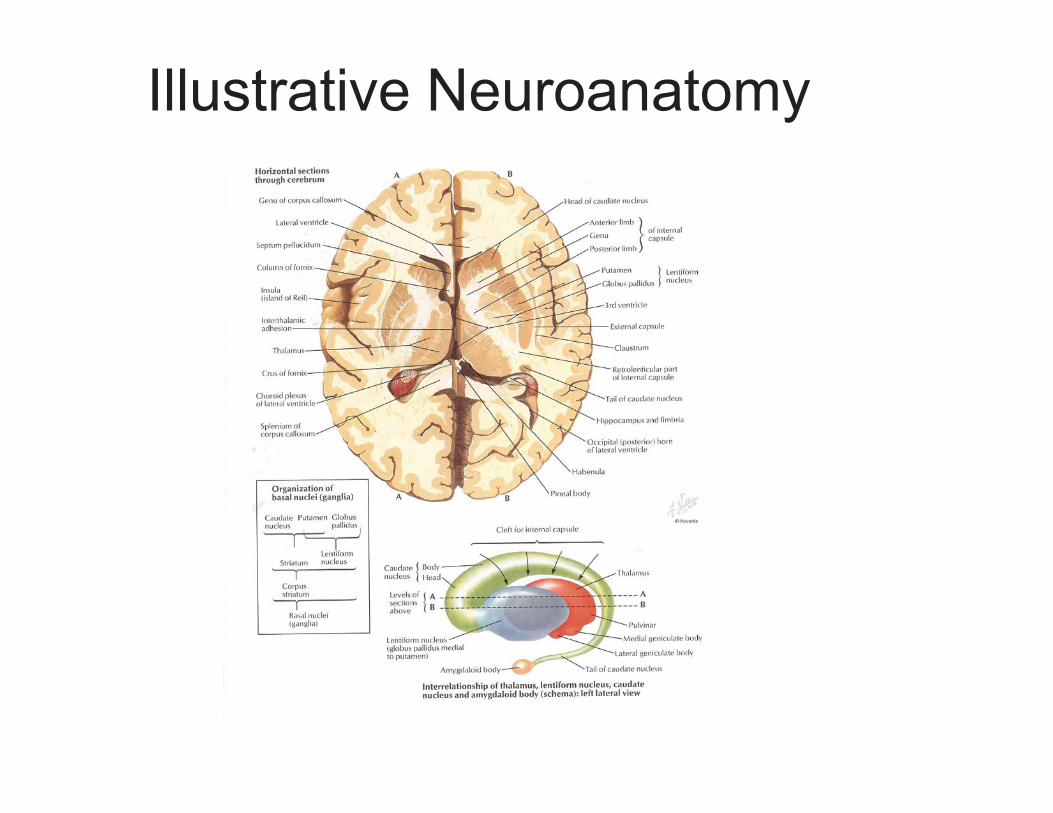
Illustrative Neuroanatomy
Illustrative Neuroanatomy
Illustrative Neuroanatomy
Head CT Approach � First - evaluate normal anatomical structures,
window for optimal brain tissue contrast � Second – assess for signs of underlying
pathology such as: mass effect, edema, midline shift, hemorrhage, hydrocephalus, subdural or epidural collection/hematoma, or infarction
� Third – evaluate sinuses and osseous structures with bone windows
� Fourth – use a soft tissue window to assess extracranial anatomy – orbits, face, scalp

Anatomy
� Red – Cerebellar Hemisphere
� Blue – Cerebellar Vermis
� Green – Medulla � Pink – Masticator
muscles � Orange – Maxillary
sinus
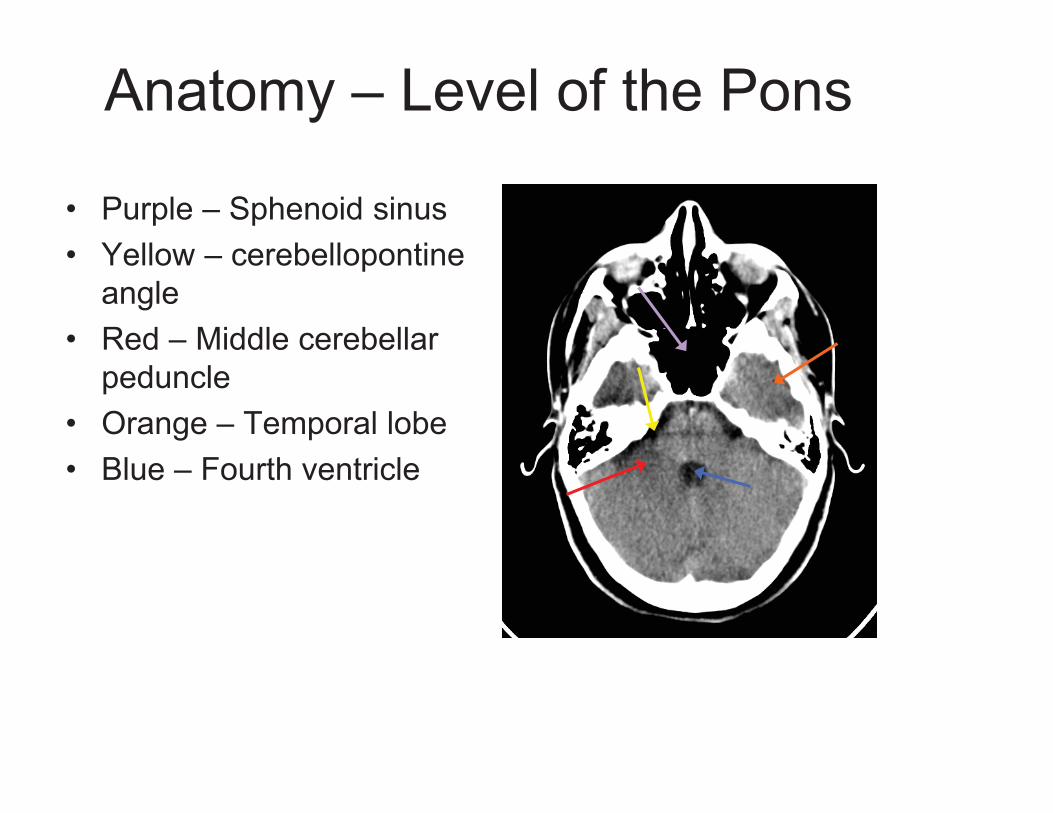
Anatomy – Level of the Pons
� Purple – Sphenoid sinus � Yellow – cerebellopontine
angle � Red – Middle cerebellar
peduncle � Orange – Temporal lobe � Blue – Fourth ventricle
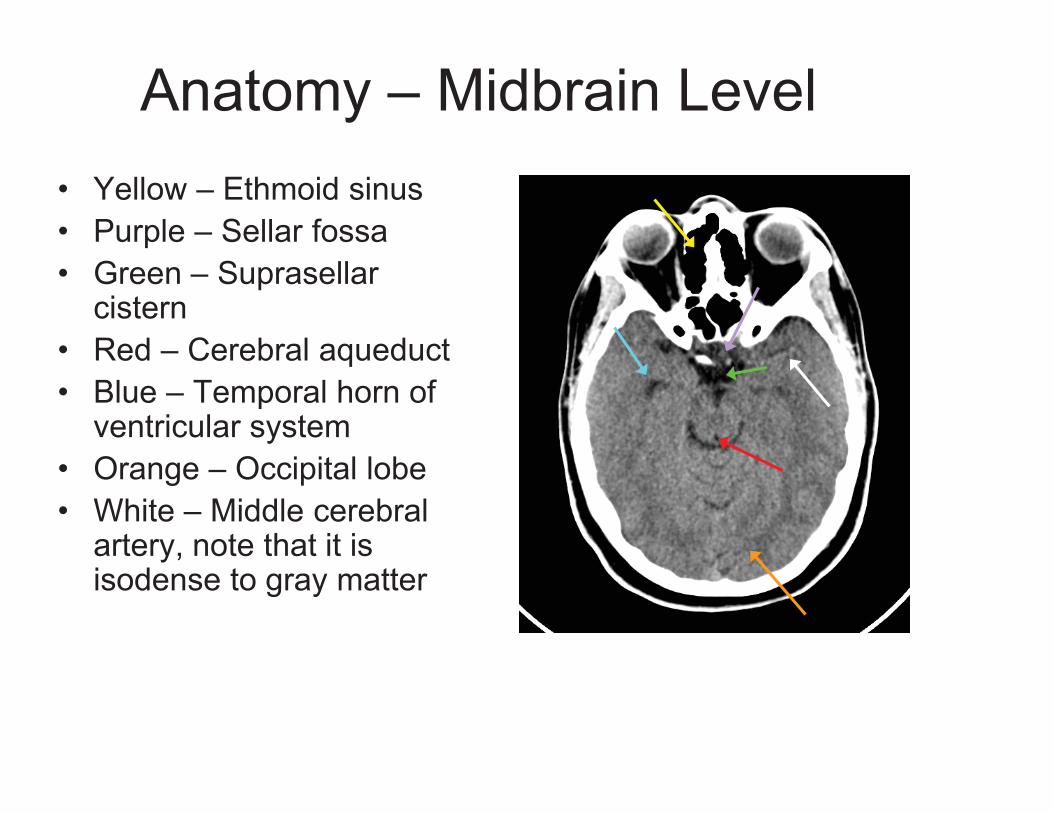
Anatomy – Midbrain Level � Yellow – Ethmoid sinus � Purple – Sellar fossa � Green – Suprasellar
cistern � Red – Cerebral aqueduct � Blue – Temporal horn of
ventricular system � Orange – Occipital lobe � White – Middle cerebral
artery, note that it is isodense to gray matter

Anatomy
� Green – Third Ventricle
� Yellow – Frontal lobe � Red – Sylvian fissure � Blue – Temporal lobe � Orange –
Quadrigeminal Plate cistern
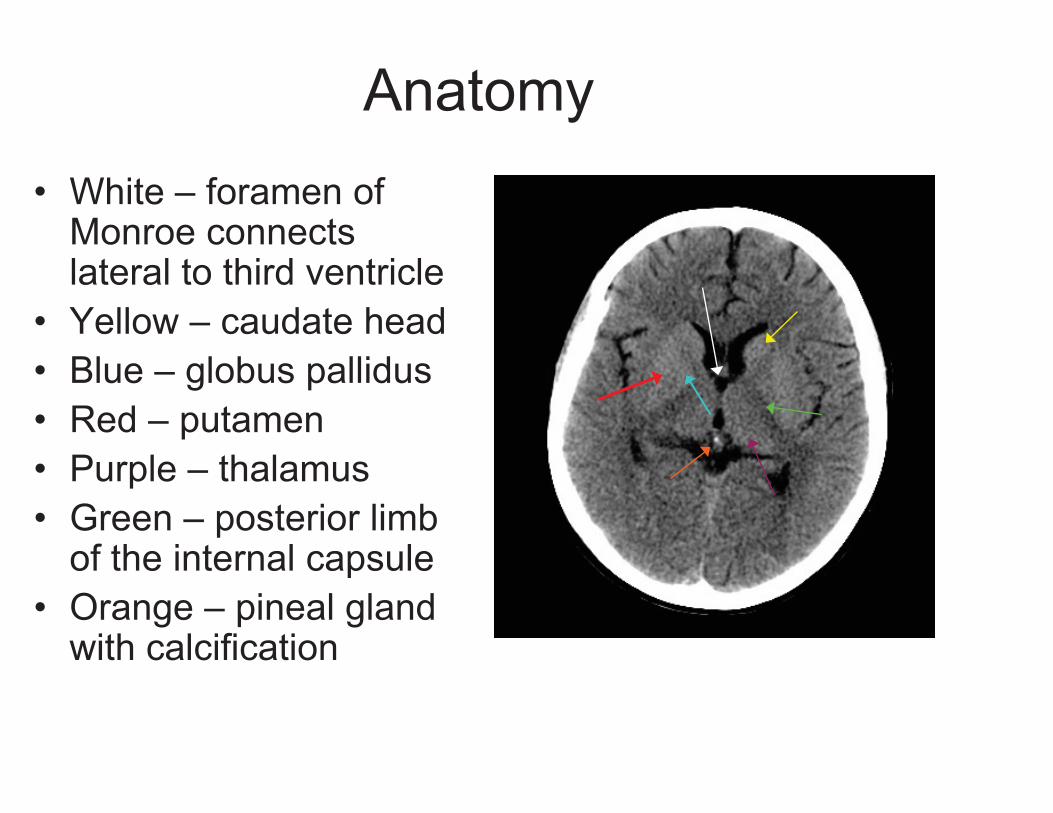
Anatomy � White – foramen of
Monroe connects lateral to third ventricle
� Yellow – caudate head � Blue – globus pallidus � Red – putamen � Purple – thalamus � Green – posterior limb
of the internal capsule � Orange – pineal gland
with calcification

Anatomy � White – genu of the corpus
callosum � Red – splenium of the
corpus callosum � Yellow – thalamus � Green – choroid plexus in
lateral ventricle � Blue – external capsule
between the insular cortex laterally and the putamen of the basal ganglia medially
Anatomy
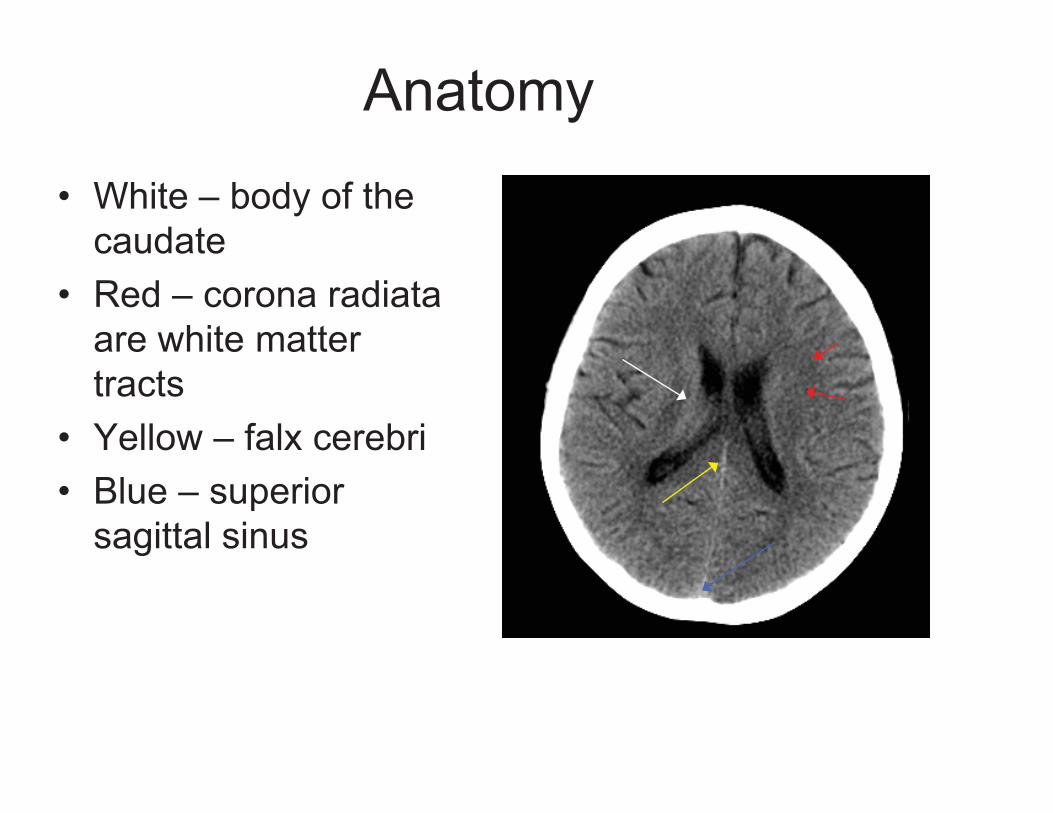
� White – body of the caudate
� Red – corona radiata are white matter tracts
� Yellow – falx cerebri � Blue – superior
sagittal sinus
Anatomy
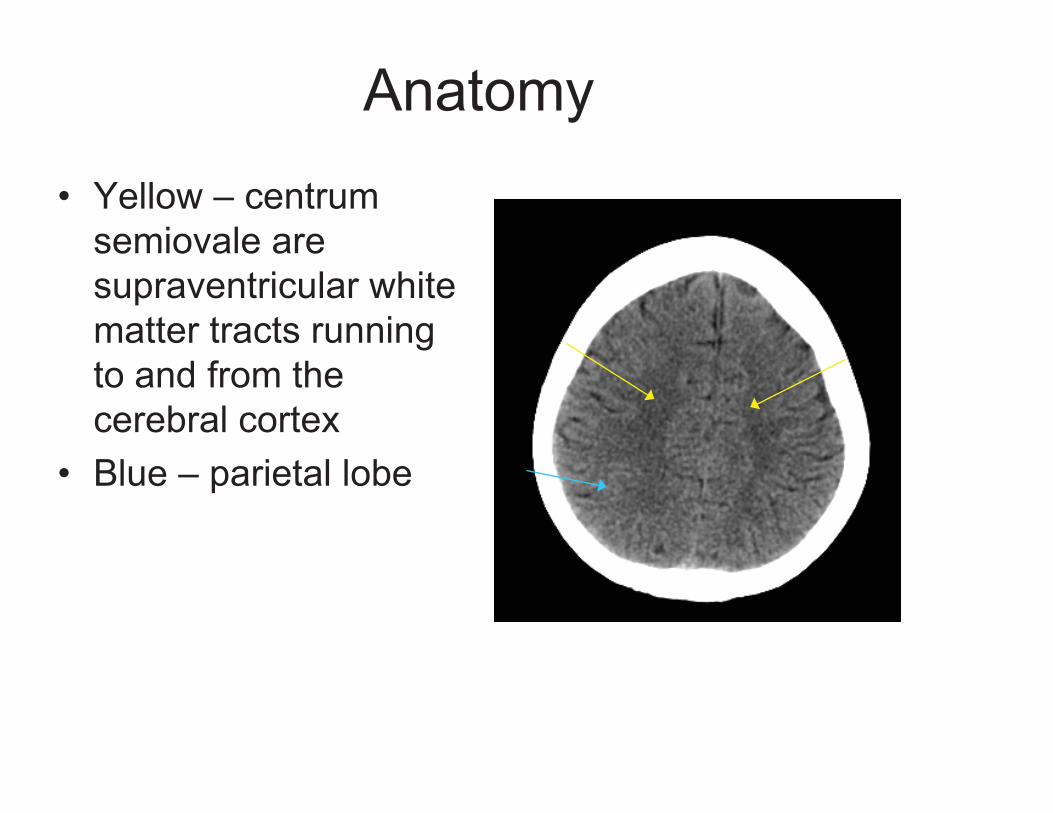
� Yellow – centrum semiovale are supraventricular white matter tracts running to and from the cerebral cortex
� Blue – parietal lobe
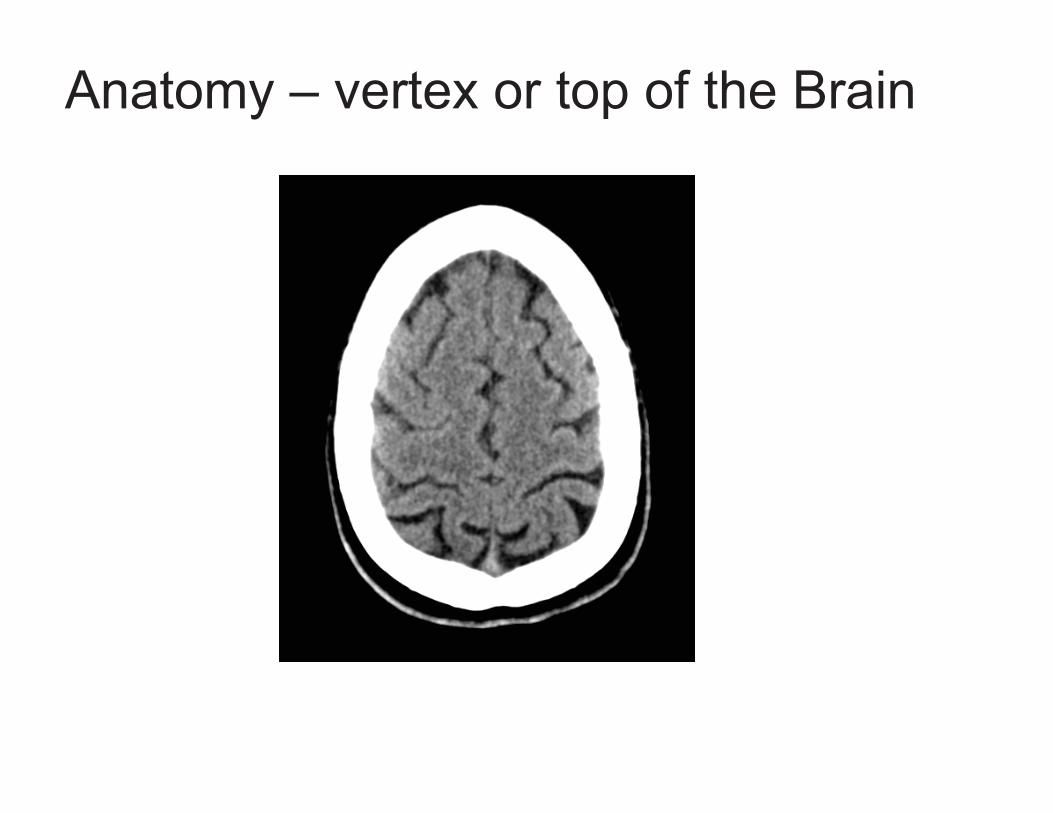
Anatomy – vertex or top of the Brain
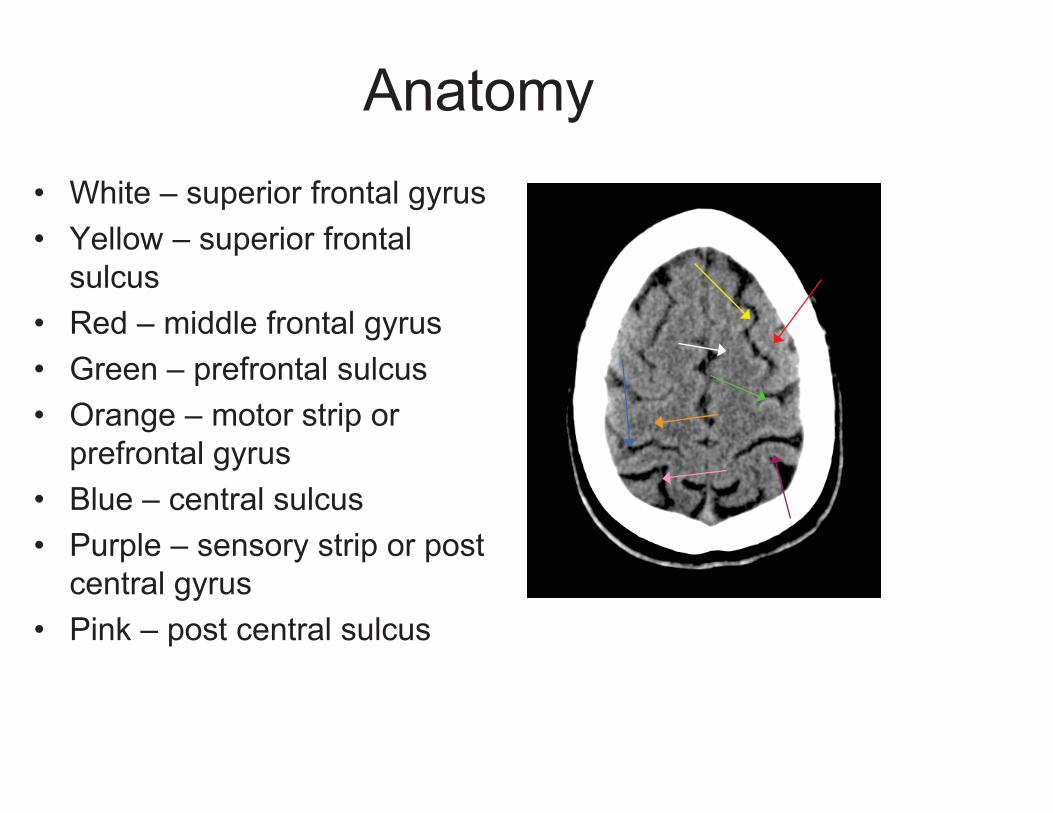
Anatomy � White – superior frontal gyrus� Yellow – superior frontal
sulcus � Red – middle frontal gyrus � Green – prefrontal sulcus � Orange – motor strip or
prefrontal gyrus � Blue – central sulcus � Purple – sensory strip or post
central gyrus � Pink – post central sulcus
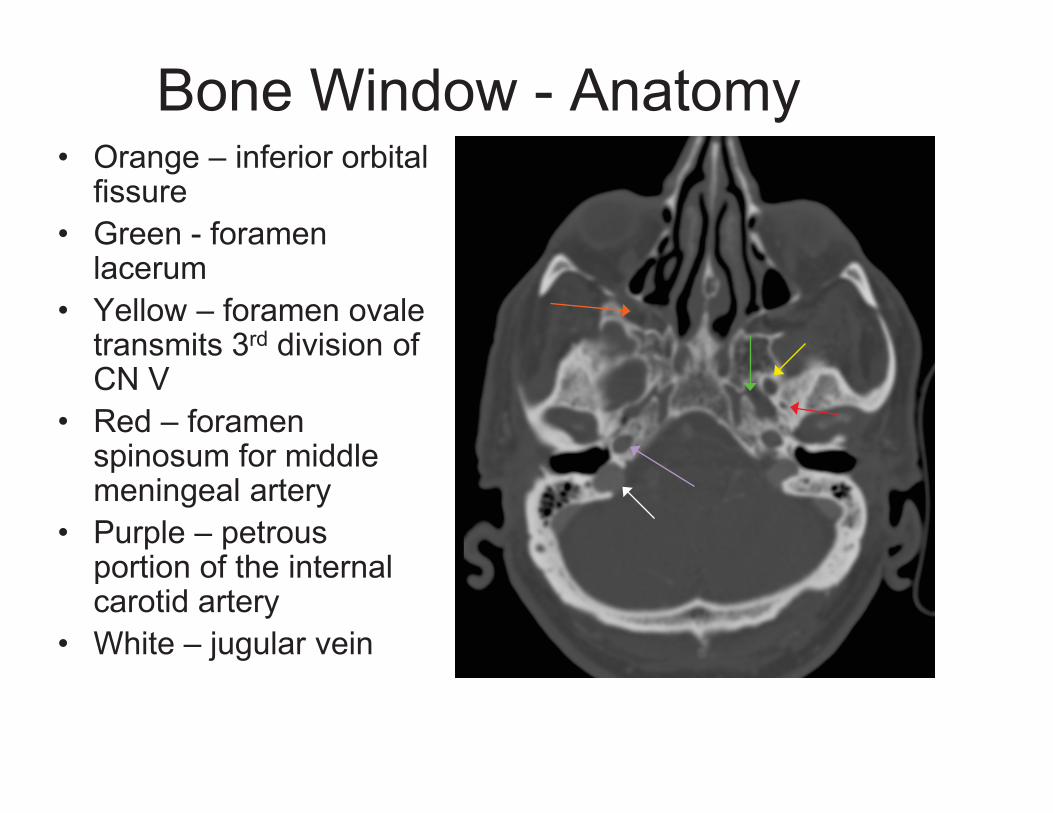
Bone Window - Anatomy � Orange – inferior orbital
fissure � Green - foramen
lacerum � Yellow – foramen ovale
transmits 3rd division of CN V
� Red – foramen spinosum for middle meningeal artery
� Purple – petrous portion of the internal carotid artery
� White – jugular vein
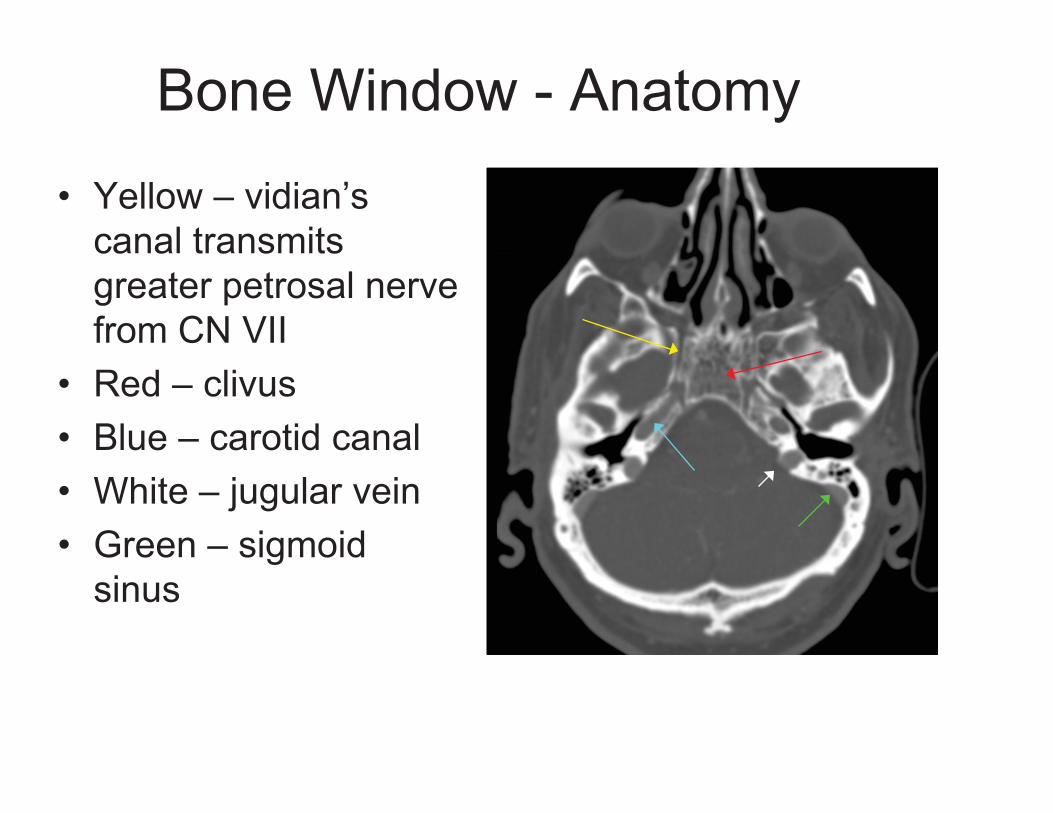
Bone Window - Anatomy
� Yellow – vidian’s canal transmits greater petrosal nerve from CN VII
� Red – clivus � Blue – carotid canal � White – jugular vein � Green – sigmoid
sinus
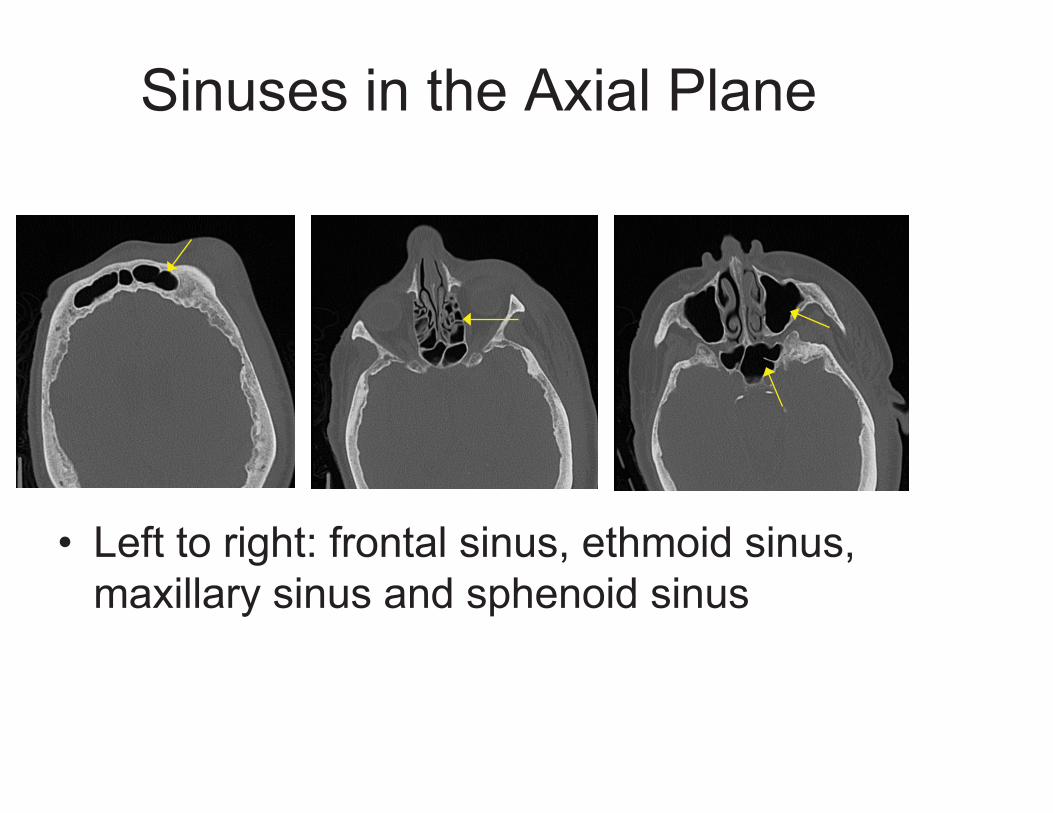
Sinuses in the Axial Plane
� Left to right: frontal sinus, ethmoid sinus, maxillary sinus and sphenoid sinus

CT Angiographic Anatomy
� Red – MCA or middle cerebral artery
� Yellow – ACA � Green – PCA � Blue – Basilar artery
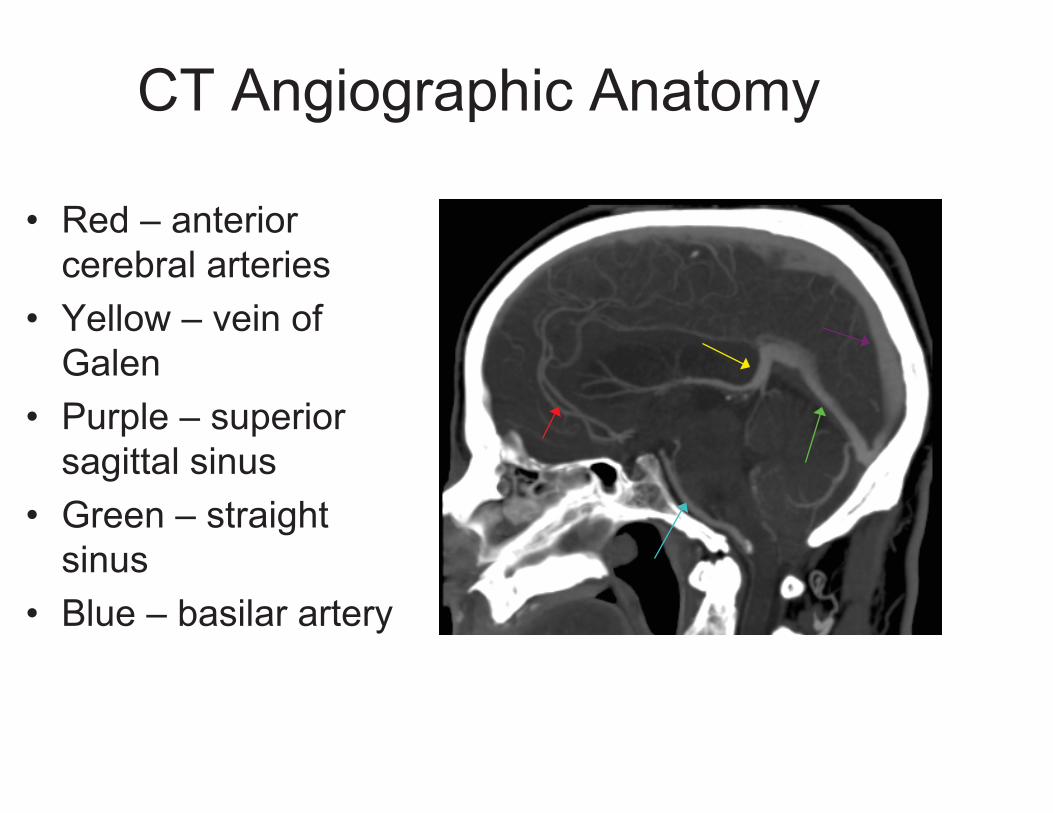
CT Angiographic Anatomy
� Red – anterior cerebral arteries
� Yellow – vein of Galen
� Purple – superior sagittal sinus
� Green – straight sinus
� Blue – basilar artery

Pathology on Head CT

Can You Find the Abnormality?
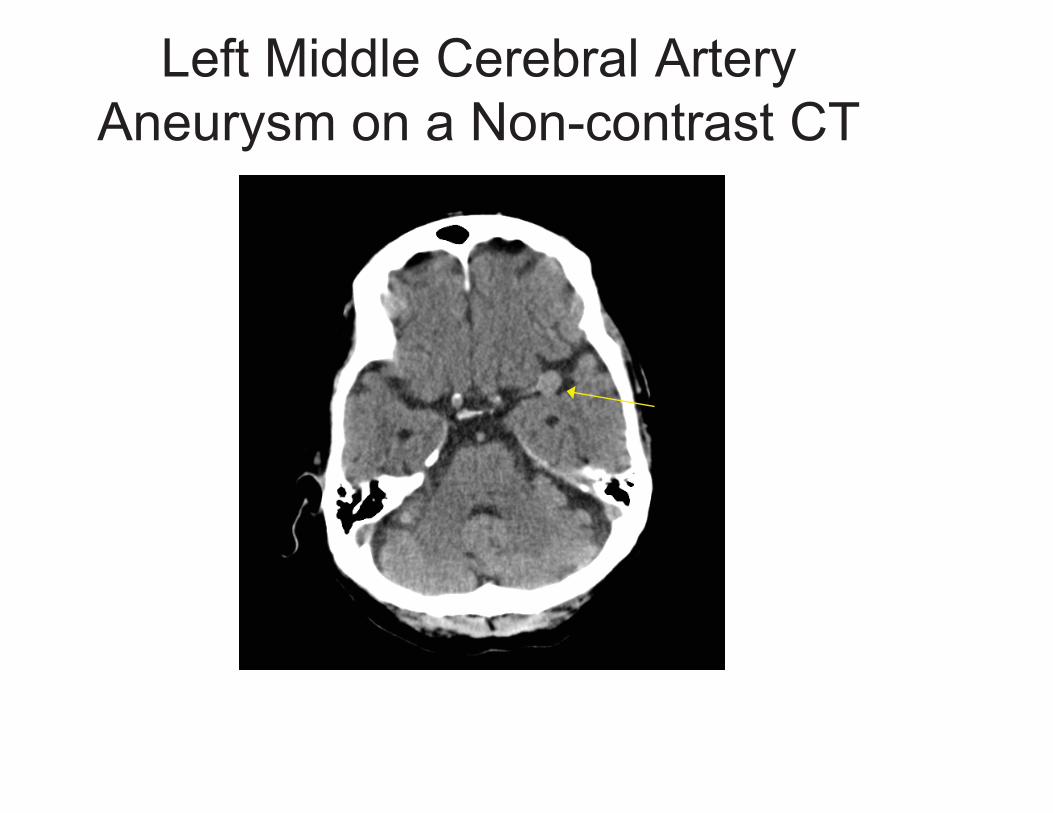
Left Middle Cerebral Artery Aneurysm on a Non-contrast CT

Left Middle Cerebral Artery Aneurysm on a Non-contrast CT
� Yellow – MCA bifercation aneurysm
� Pink – Sylvian fissure � Orange – Basilar artery � Green – Supraclinoid
ICA � Blue – Bony dorsum
sella
TRAUMA
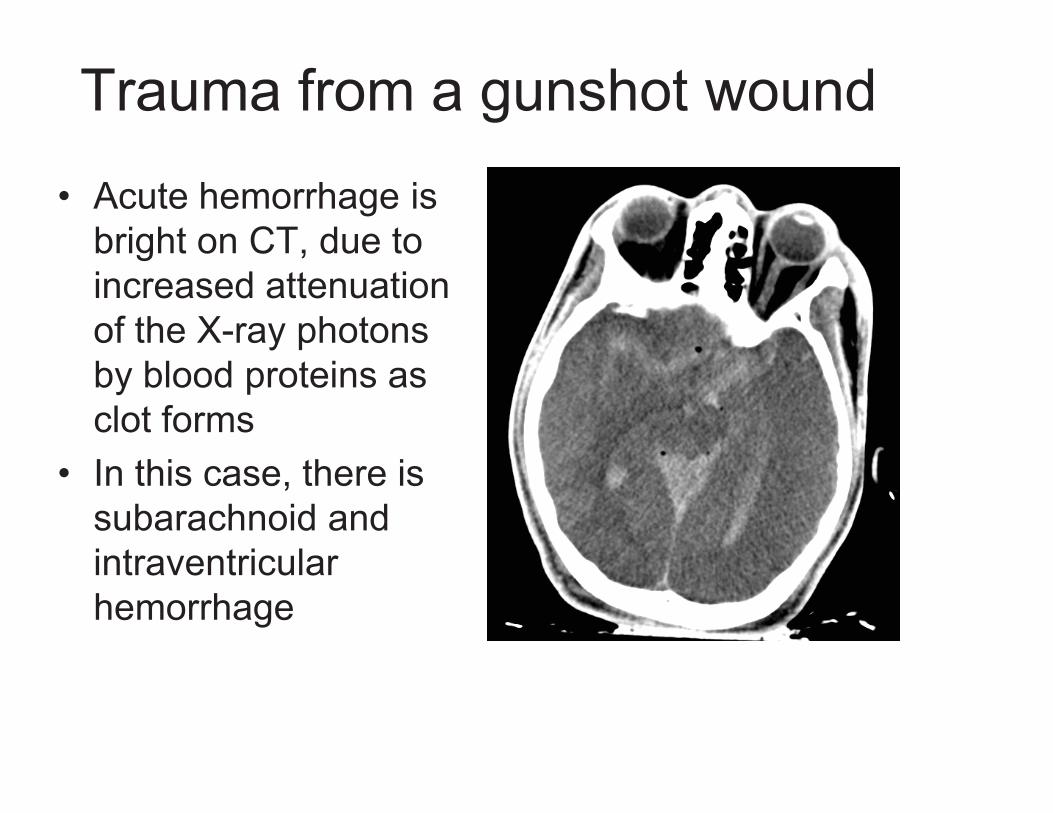
Trauma from a gunshot wound
� Acute hemorrhage is bright on CT, due to increased attenuation of the X-ray photons by blood proteins as clot forms
� In this case, there is subarachnoid and intraventricular hemorrhage
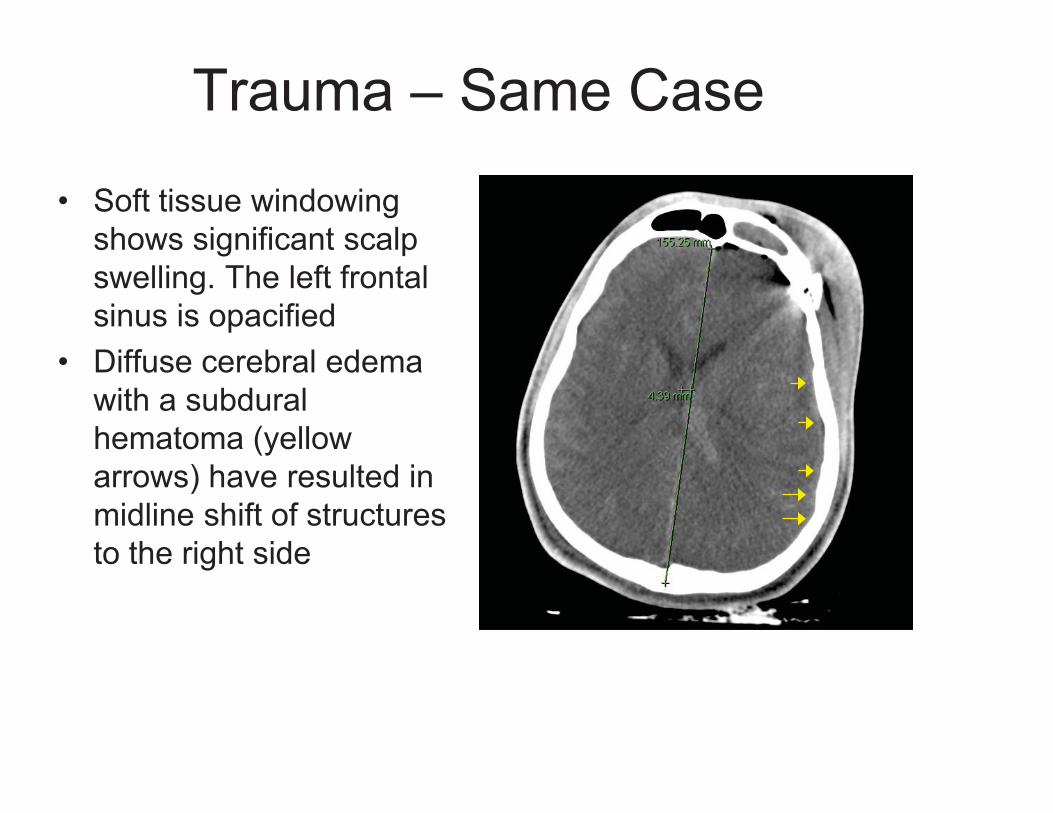
Trauma – Same Case
� Soft tissue windowing shows significant scalp swelling. The left frontal sinus is opacified
� Diffuse cerebral edema with a subdural hematoma (yellow arrows) have resulted in midline shift of structures to the right side

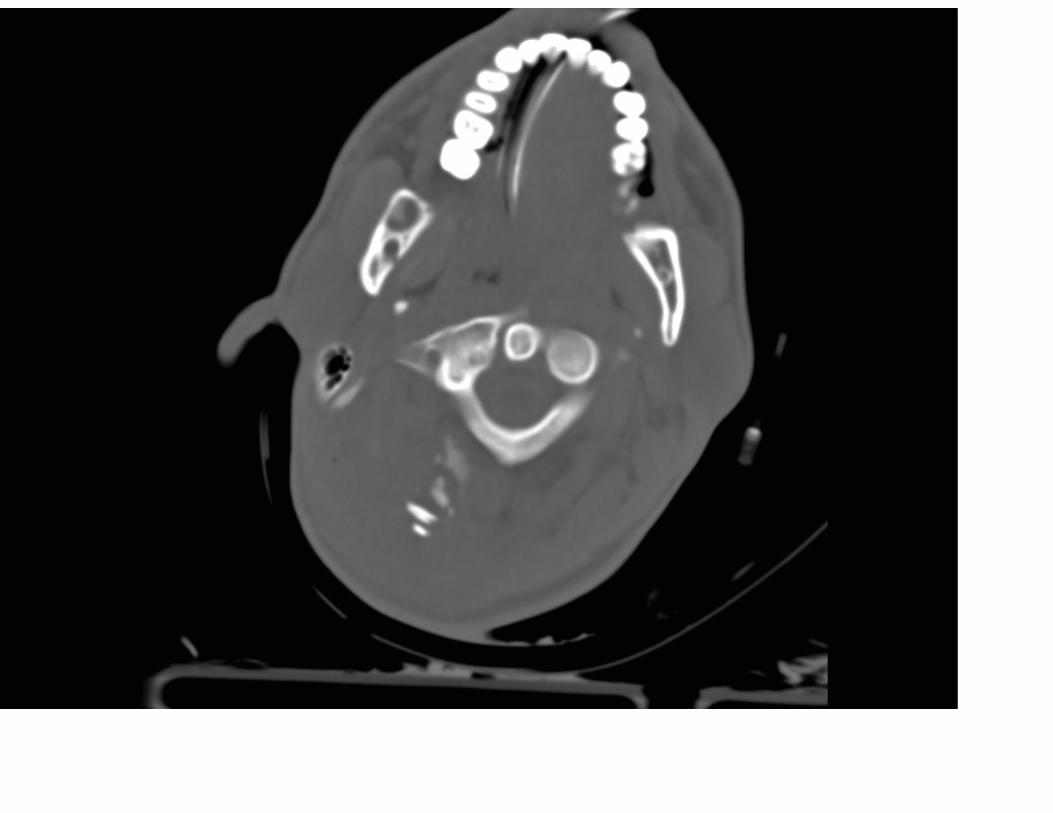
Bone Windows with Lodged Bullet
Axial CT images on following slides demonstrate the entry site of the
bullet in the right occipital skull with comminuted fracture fragments
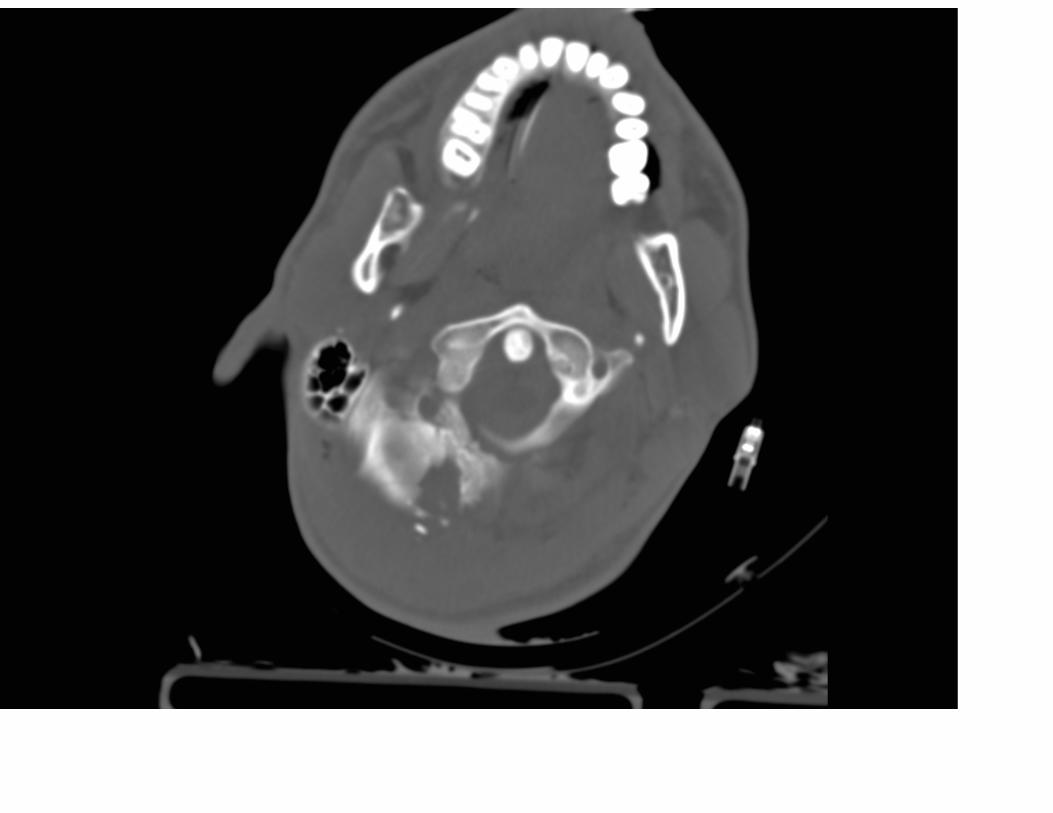
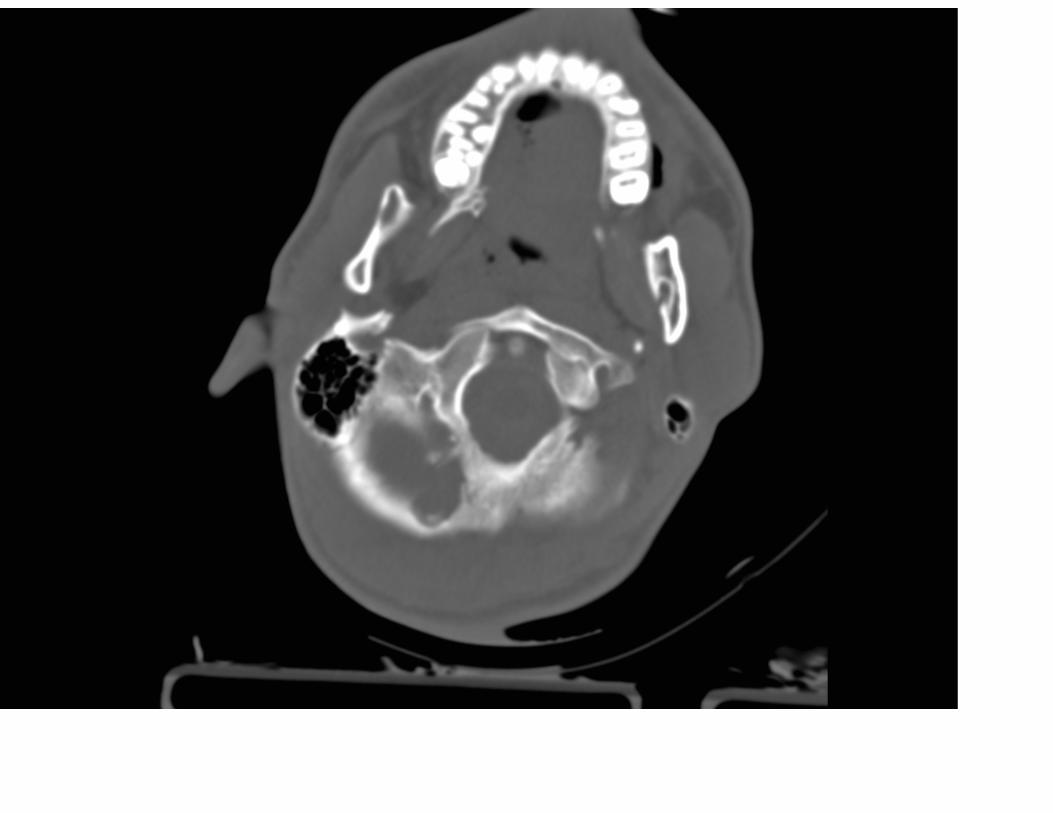
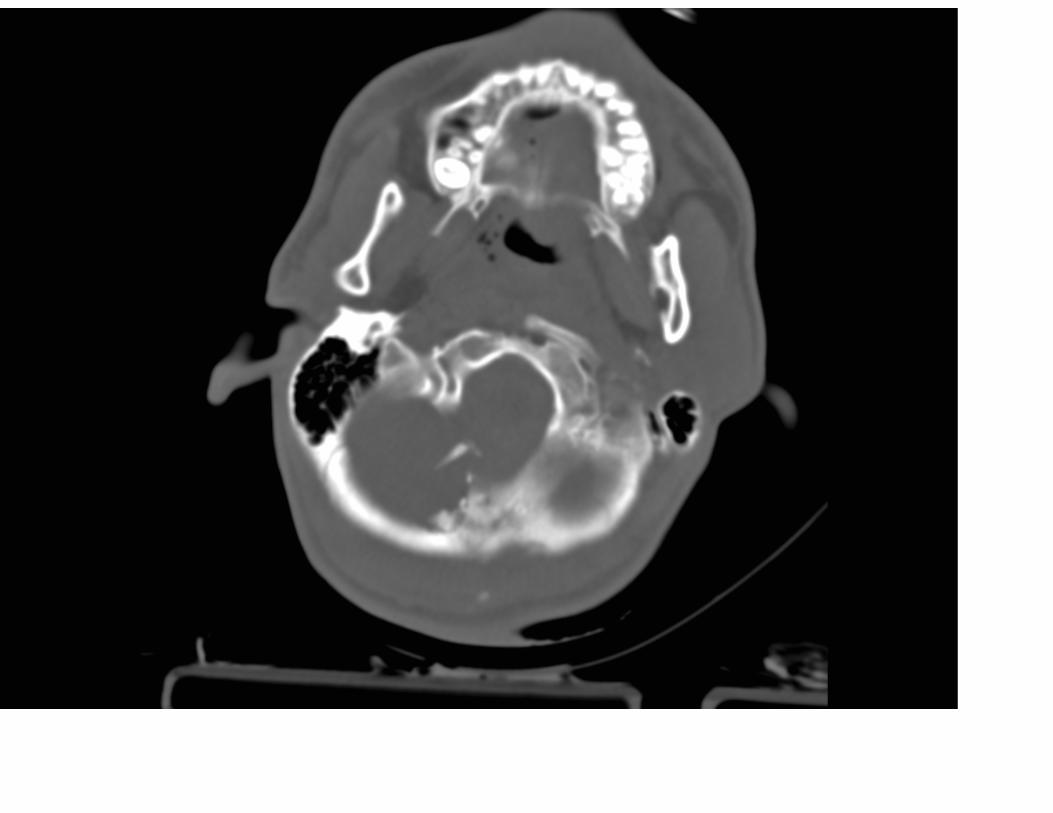

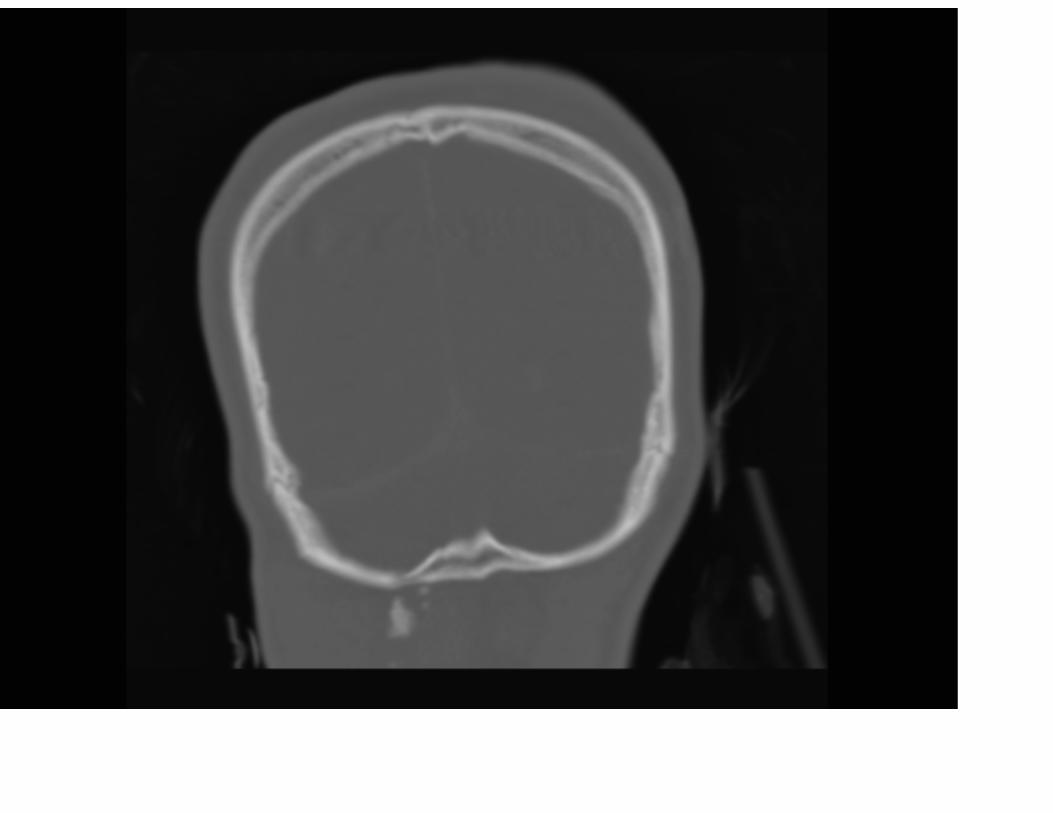
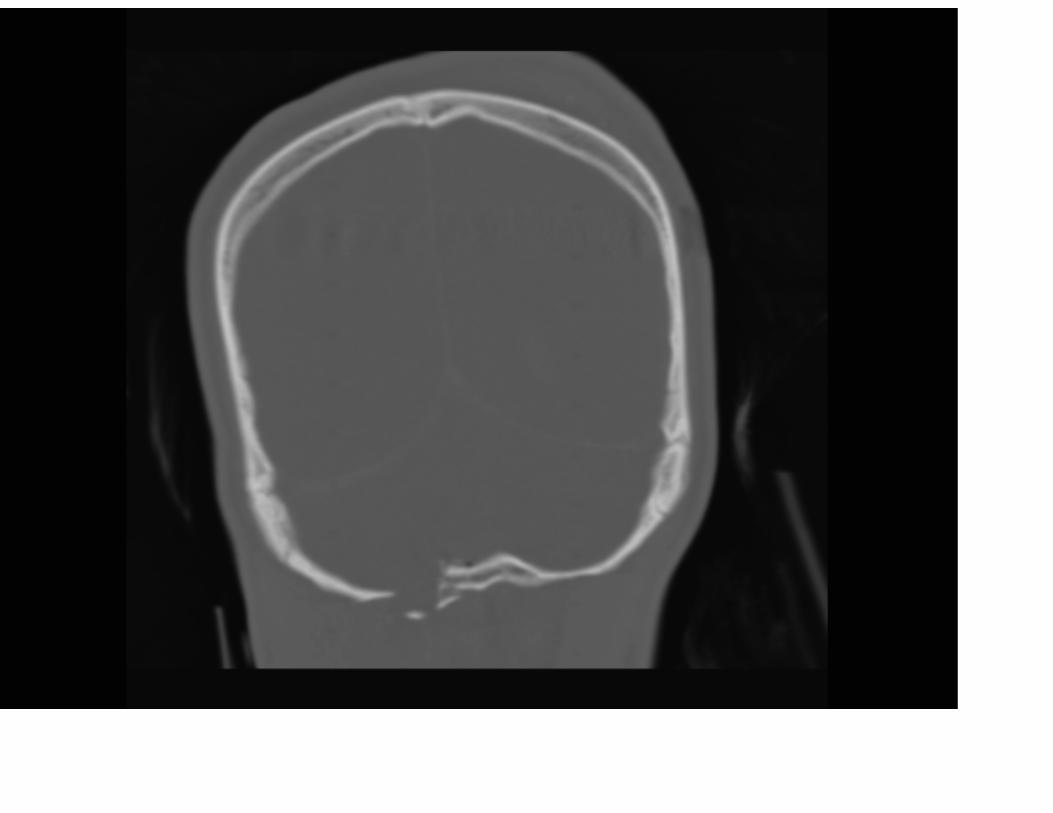
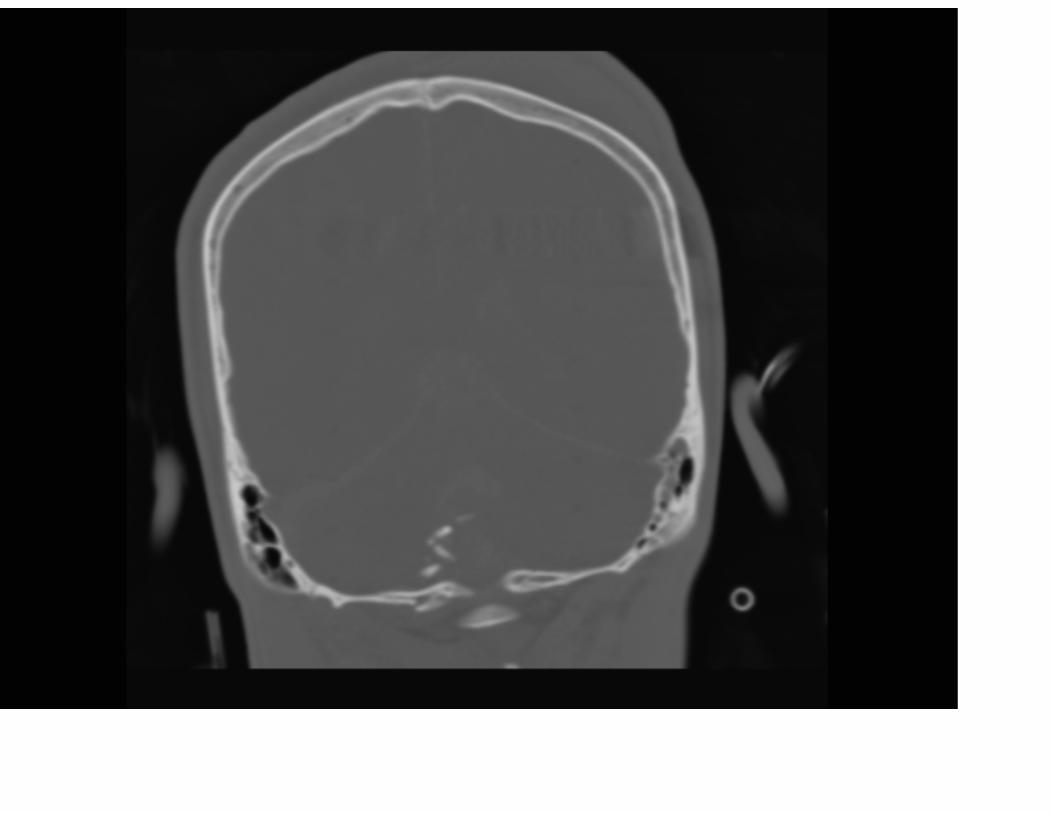
CT data can be reformatted into the coronal plane to evaluate calvarial
fractures


STROKE

Right Cerebellar Infarct
� Infarcts are initially ill-defined with lower attenuation/density or “darker gray” appearance
� Chronic infarcts are black like CSF because tissue loss from neuronal cell death liquifies and is known as encephalomalacia
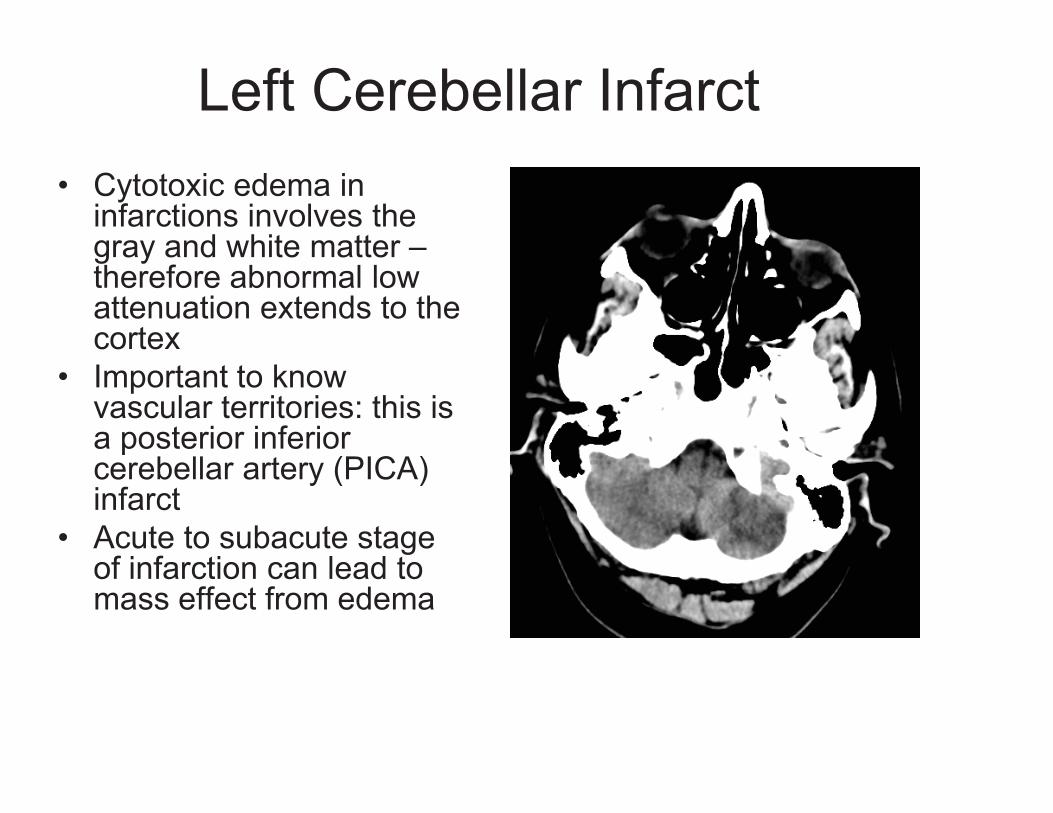
Left Cerebellar Infarct � Cytotoxic edema in
infarctions involves the gray and white matter – therefore abnormal low attenuation extends to the cortex
� Important to know vascular territories: this is a posterior inferior cerebellar artery (PICA) infarct
� Acute to subacute stage of infarction can lead to mass effect from edema
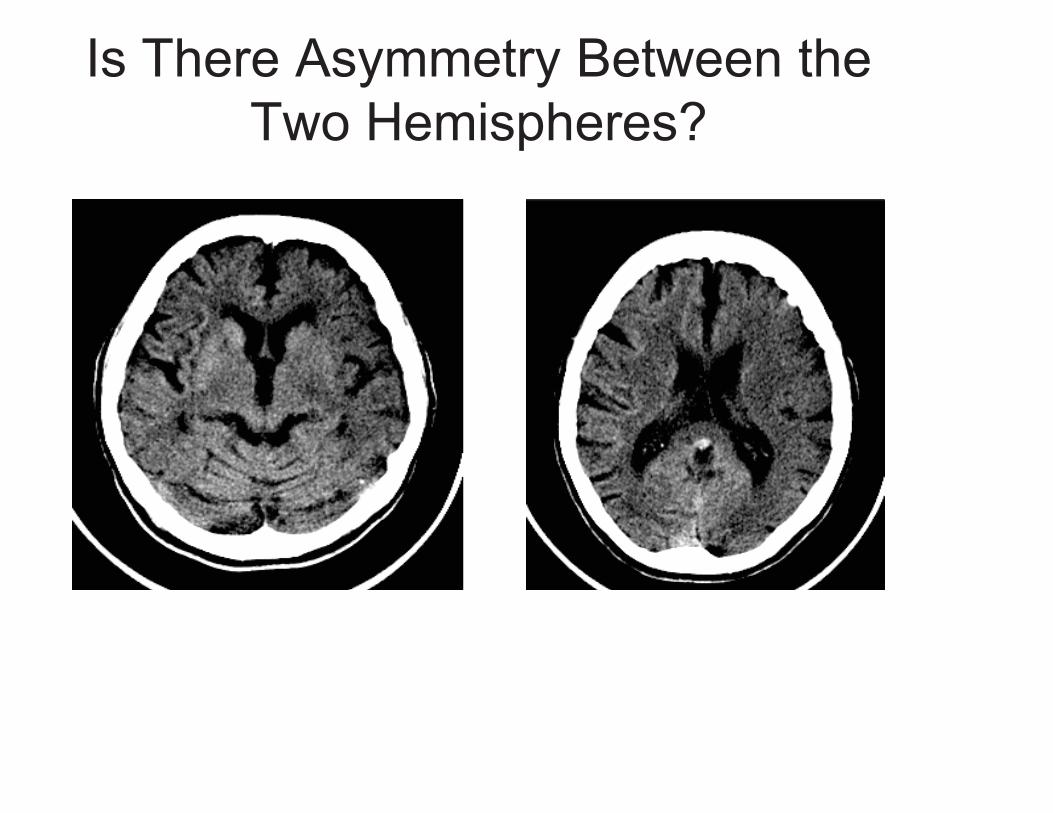
Is There Asymmetry Between the Two Hemispheres?
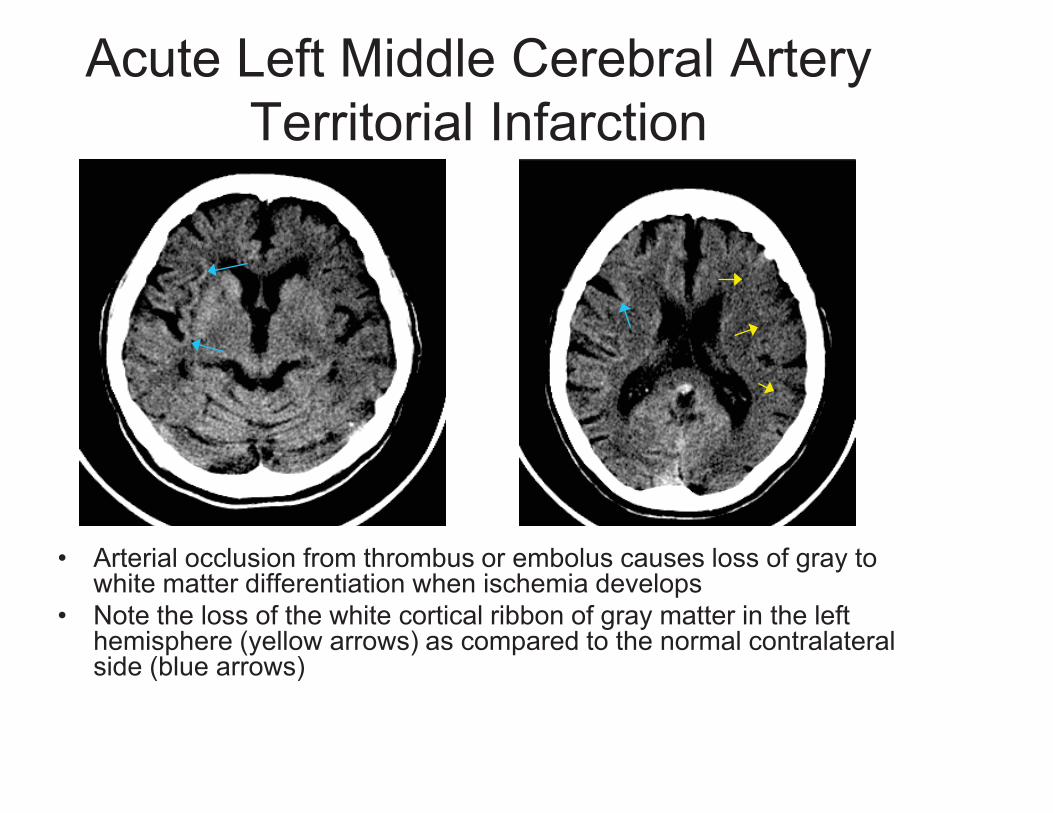
Acute Left Middle Cerebral Artery Territorial Infarction
� Arterial occlusion from thrombus or embolus causes loss of gray to white matter differentiation when ischemia develops
� Note the loss of the white cortical ribbon of gray matter in the left hemisphere (yellow arrows) as compared to the normal contralateral side (blue arrows)

Dense MCA Sign in Acute Infarct
� Notice how thrombus is whiter in the occluded left middle cerebral artery on this non-contrast study
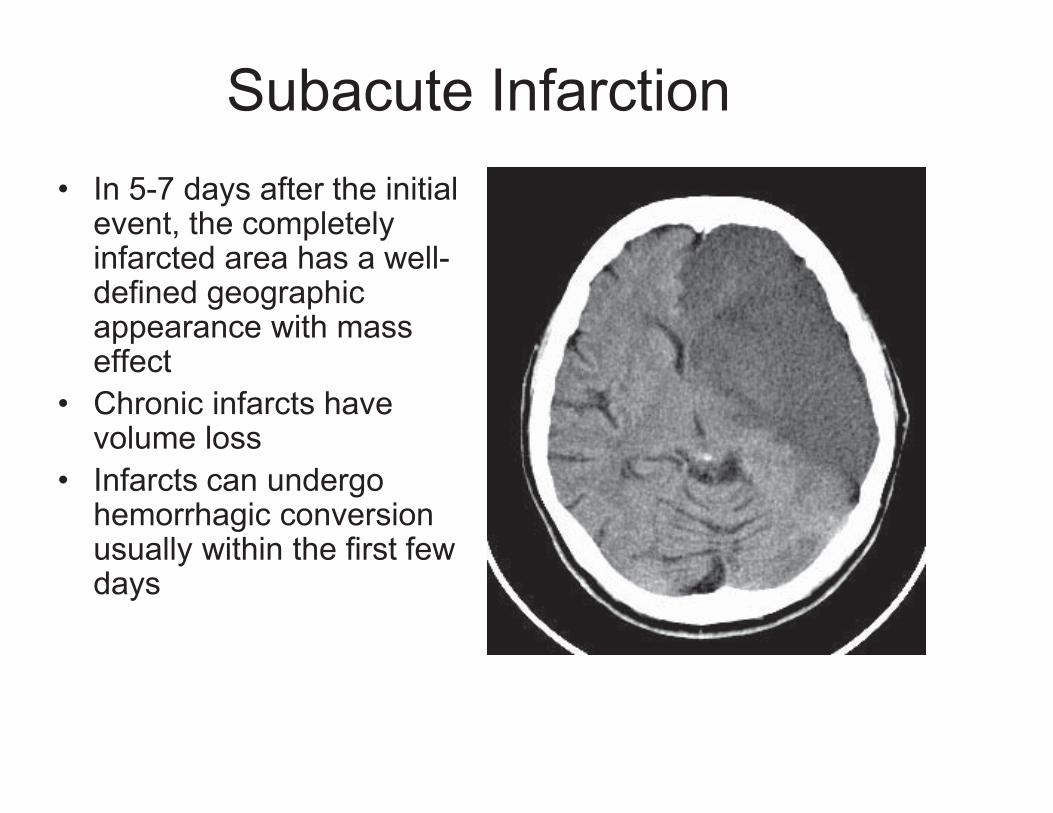
Subacute Infarction � In 5-7 days after the initial
event, the completely infarcted area has a well-defined geographic appearance with mass effect
� Chronic infarcts have volume loss
� Infarcts can undergo hemorrhagic conversion usually within the first few days
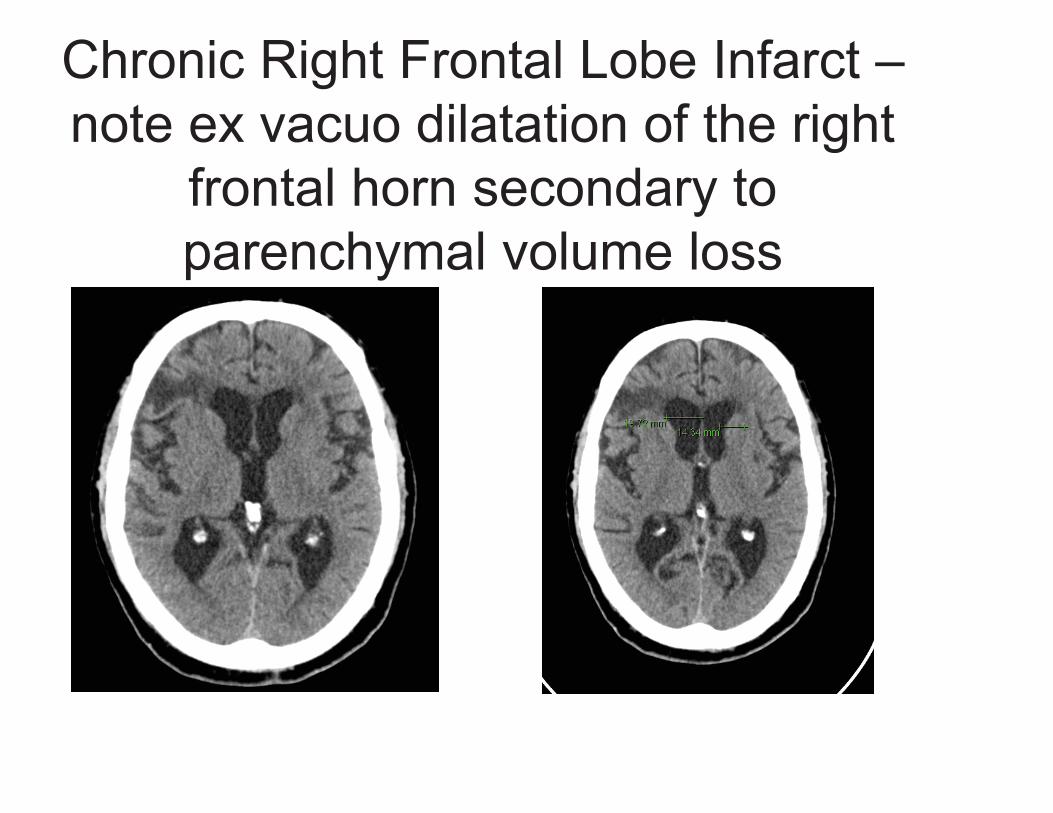
Chronic Right Frontal Lobe Infarct – note ex vacuo dilatation of the right
frontal horn secondary to parenchymal volume loss

Chronic Left MCA Infarct with parenchymal volume loss

Brain Masses and Edema
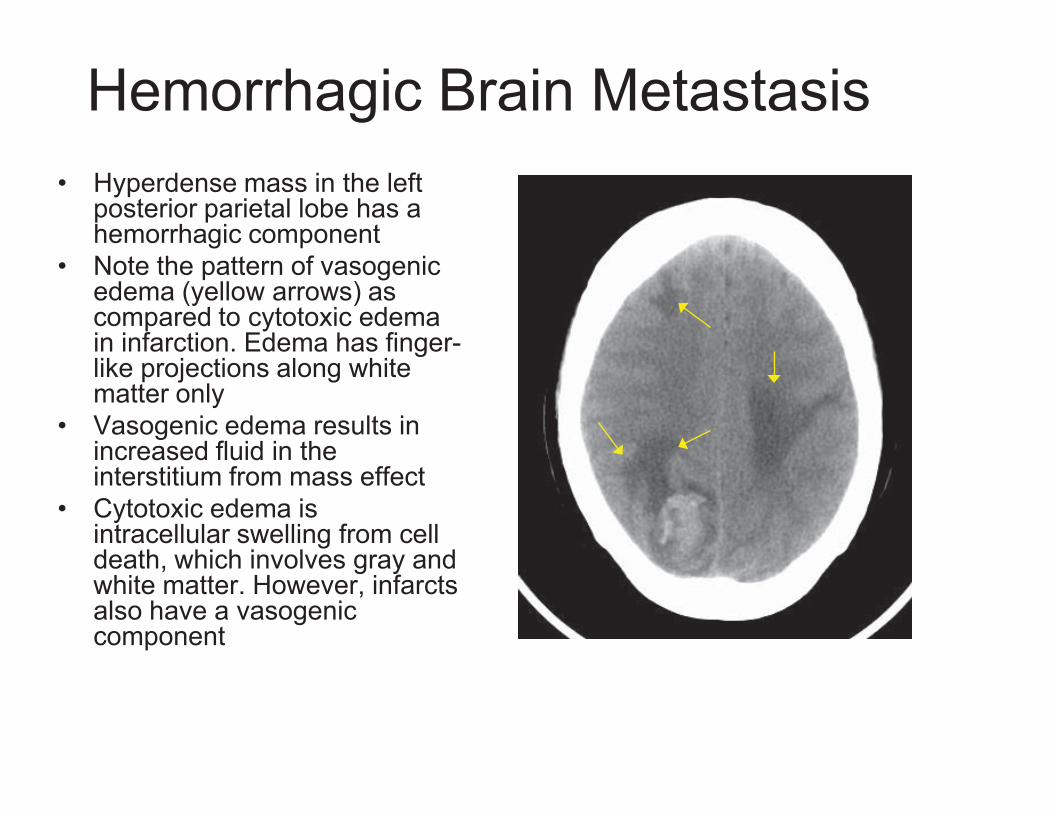
Hemorrhagic Brain Metastasis � Hyperdense mass in the left
posterior parietal lobe has a hemorrhagic component
� Note the pattern of vasogenic edema (yellow arrows) as compared to cytotoxic edema in infarction. Edema has finger-like projections along white matter only
� Vasogenic edema results in increased fluid in the interstitium from mass effect
� Cytotoxic edema is intracellular swelling from cell death, which involves gray and white matter. However, infarcts also have a vasogenic component
Glioblastoma
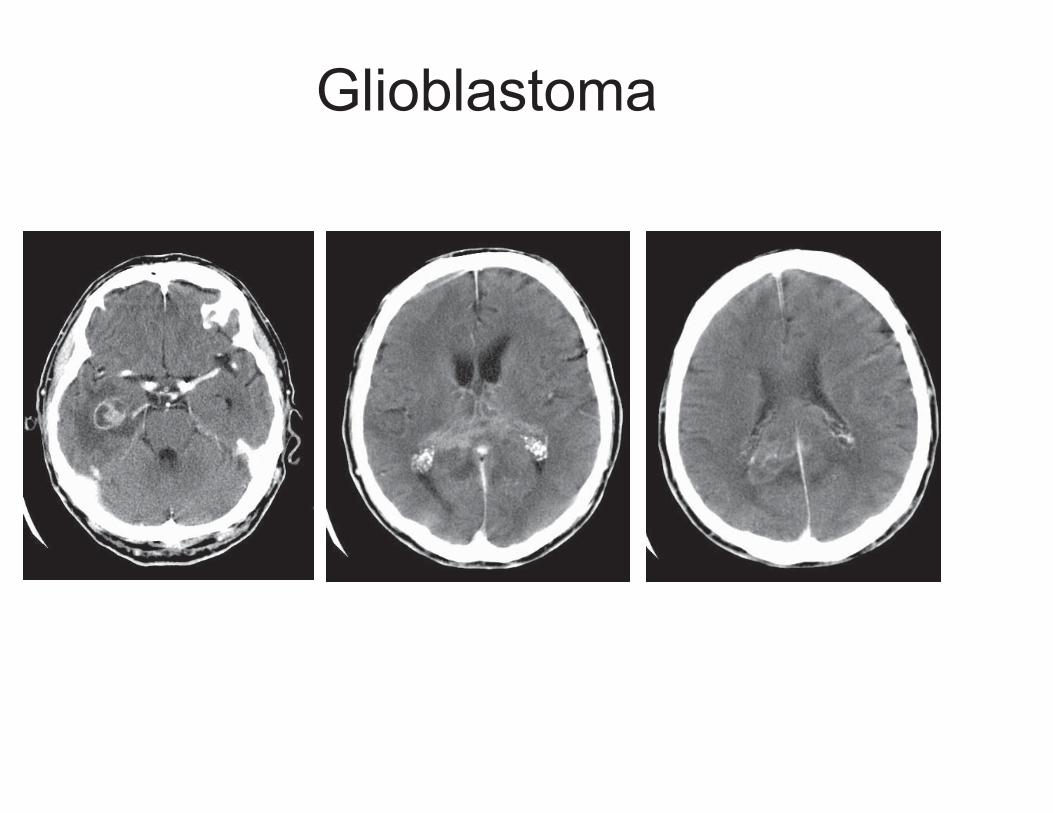
Glioblastoma � Previous slide is a contrast-enhanced CT
depicting an aggressive heterogenously enhancing mass that infiltrates the white matter and spreads across the splenium of the corpus callosum
� Glioblastoma multiforme (GBM) is by far the most common and most malignant of the glial tumors. Composed of a heterogenous mixture of poorly differentiated neoplastic astrocytes, glioblastomas primarily affect adults, and they are located preferentially in the cerebral hemispheres
Hydrocephalus
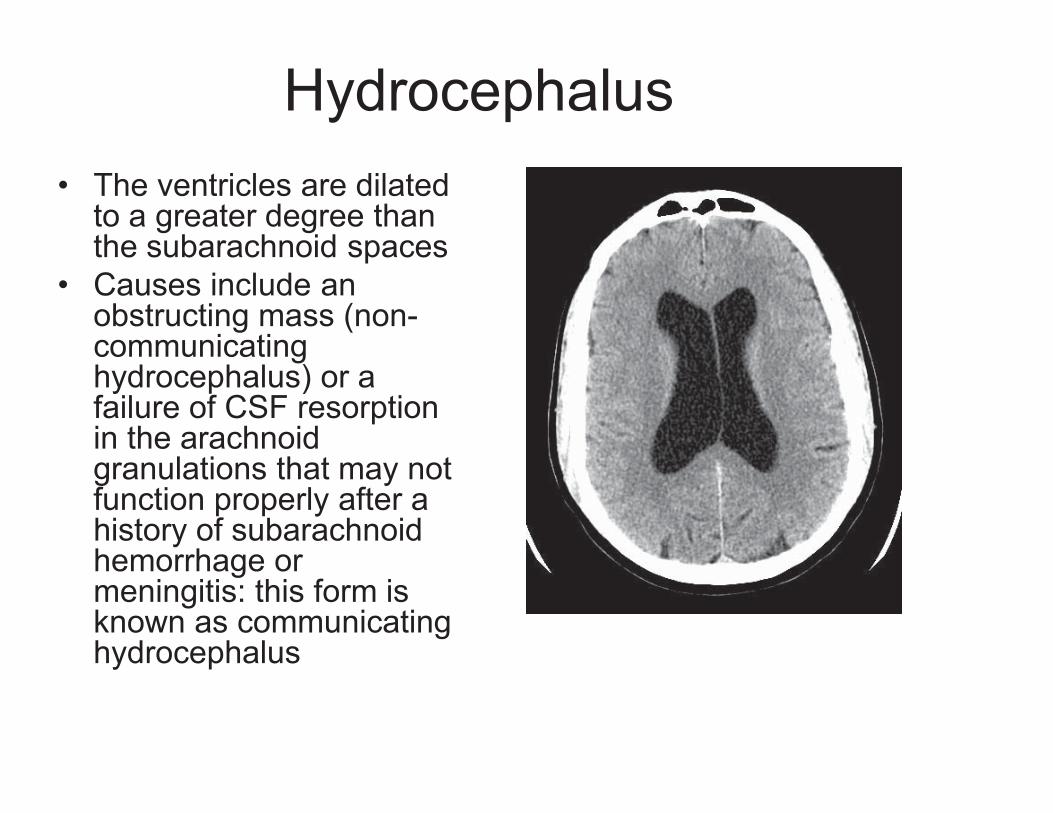
Hydrocephalus � The ventricles are dilated
to a greater degree than the subarachnoid spaces
� Causes include an obstructing mass (non-communicating hydrocephalus) or a failure of CSF resorption in the arachnoid granulations that may not function properly after a history of subarachnoid hemorrhage or meningitis: this form is known as communicating hydrocephalus

Signs of Hydrocephalus � A good indicator is
abnormal dilatation of the temporal horns, which are normally slit-like
� Note here how the temporal horns are slightly dilated, whereas the subarachnoid spaces are not

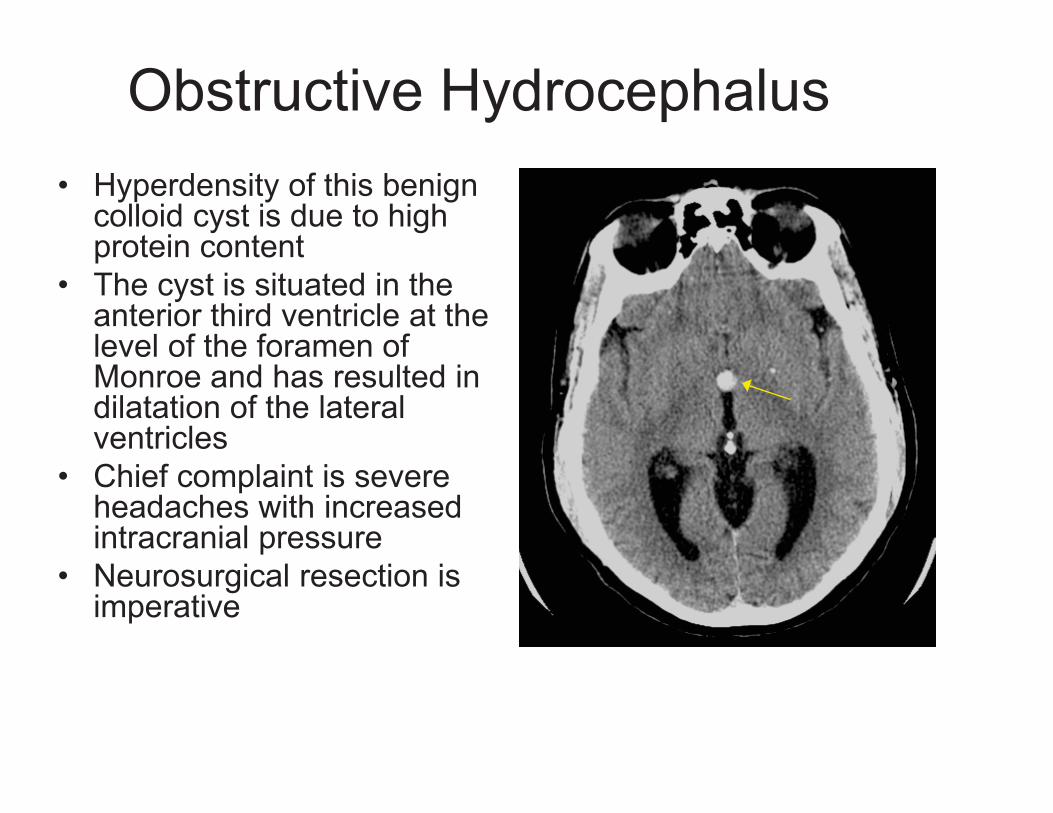
Obstructive Hydrocephalus � Hyperdensity of this benign
colloid cyst is due to high protein content
� The cyst is situated in the anterior third ventricle at the level of the foramen of Monroe and has resulted in dilatation of the lateral ventricles
� Chief complaint is severe headaches with increased intracranial pressure
� Neurosurgical resection is imperative
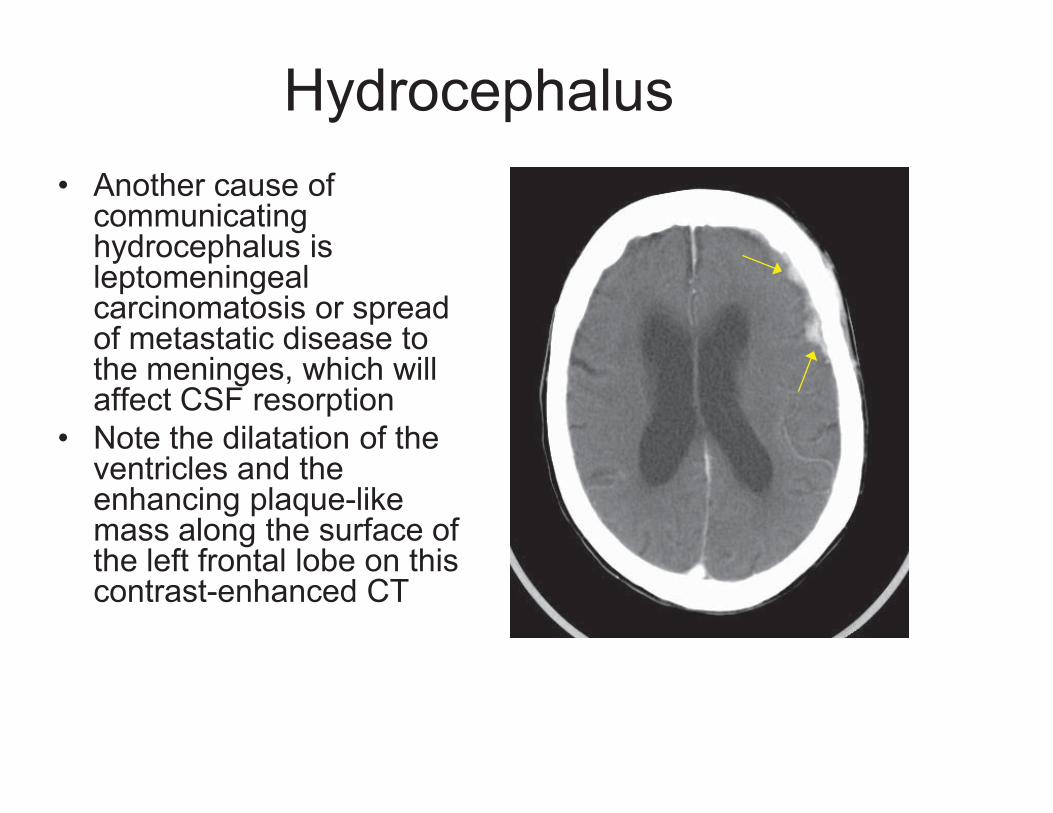
Hydrocephalus � Another cause of
communicating hydrocephalus is leptomeningeal carcinomatosis or spread of metastatic disease to the meninges, which will affect CSF resorption
� Note the dilatation of the ventricles and the enhancing plaque-like mass along the surface of the left frontal lobe on this contrast-enhanced CT
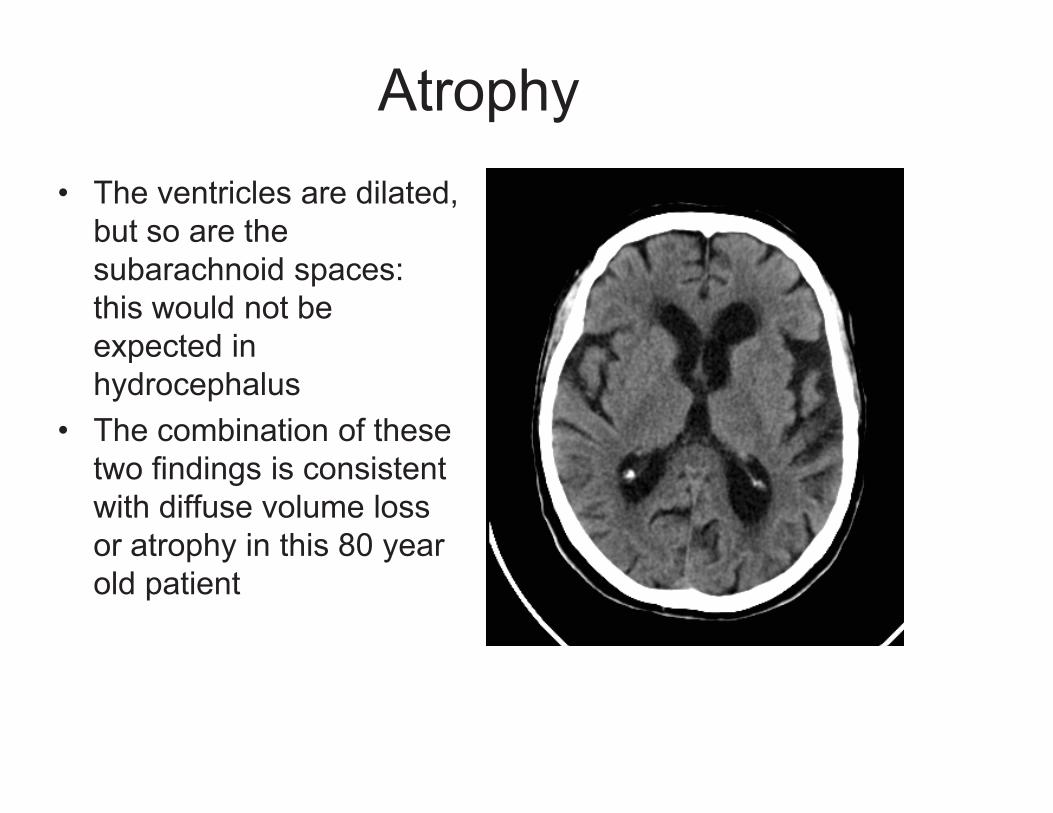
Atrophy � The ventricles are dilated,
but so are the subarachnoid spaces: this would not be expected in hydrocephalus
� The combination of these two findings is consistent with diffuse volume loss or atrophy in this 80 year old patient
Cerebral Hemorrhage
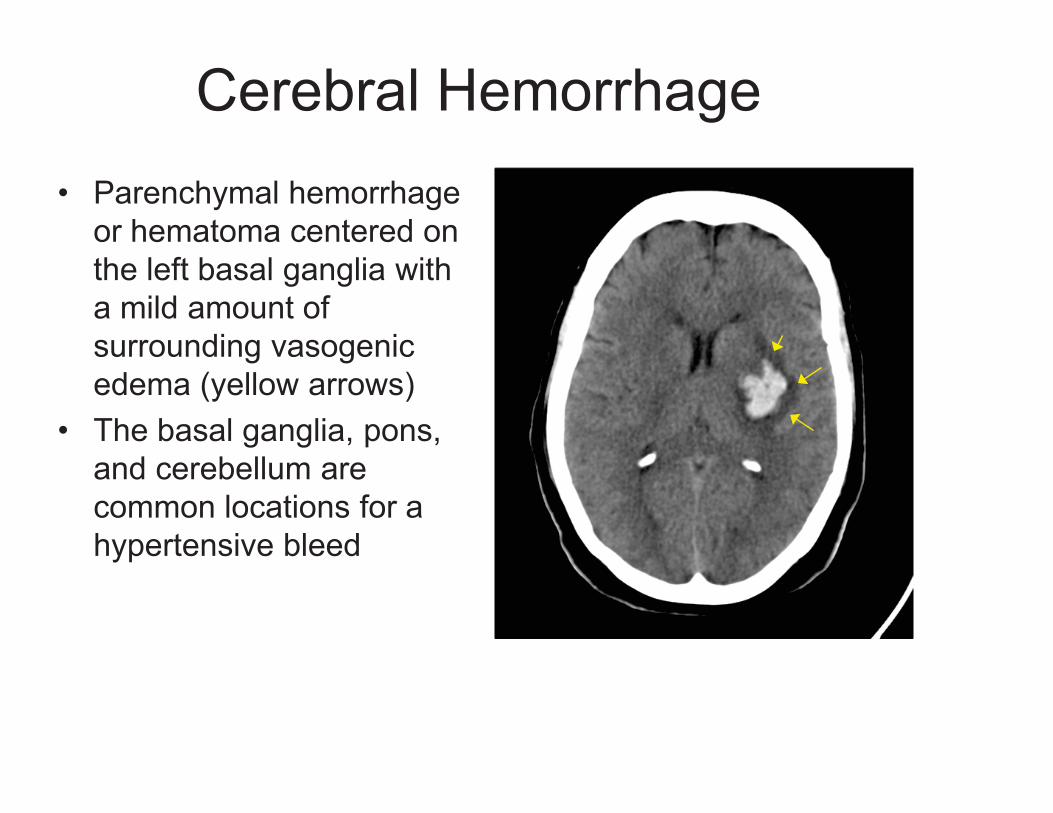
Cerebral Hemorrhage � Parenchymal hemorrhage
or hematoma centered on the left basal ganglia with a mild amount of surrounding vasogenic edema (yellow arrows)
� The basal ganglia, pons, and cerebellum are common locations for a hypertensive bleed
Causes of Parenchymal Hemorrhage
� Hypertension � Hemorrhagic Stroke � Trauma � Coagulopathy in
leukemia � Coumadin � Ruptured aneurysm � AVM and Dural fistula
� Vascular dissection � Diffuse axonal injury � Cocaine abuse � Amyloid angiopathy � Radiation
vasculopathy � Toxoplasmosis � Tumor
Subdural hematoma
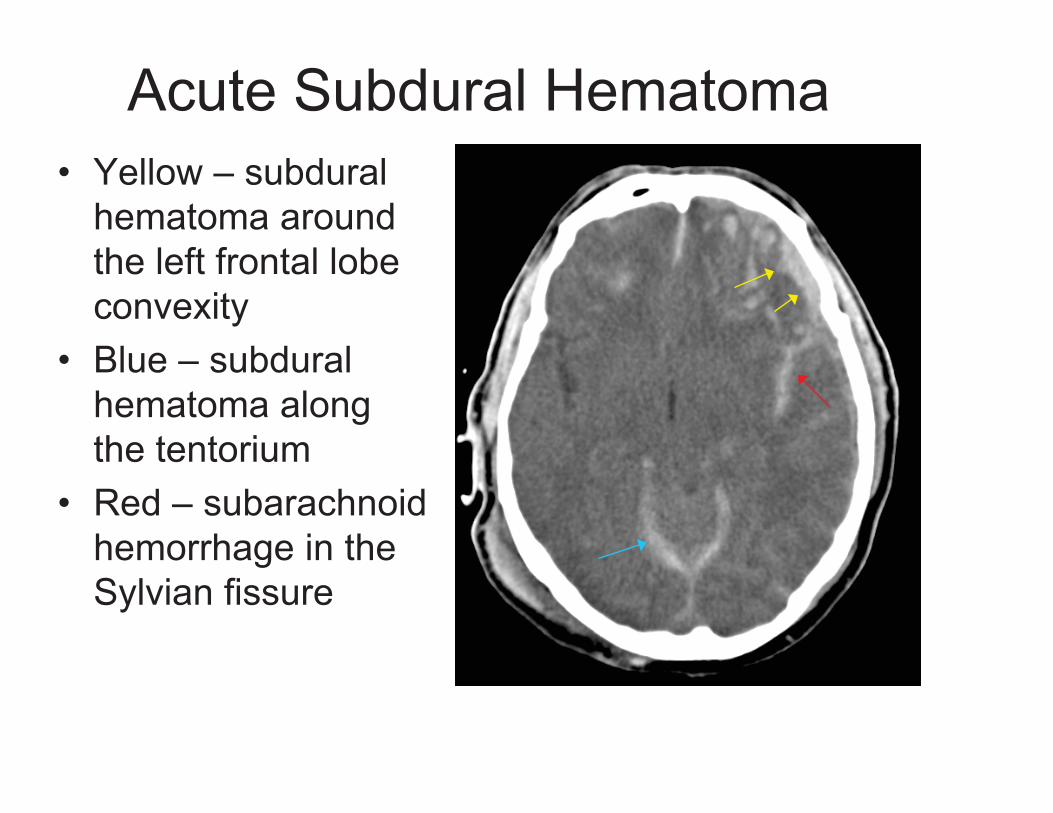
Acute Subdural Hematoma � Yellow – subdural
hematoma around the left frontal lobe convexity
� Blue – subdural hematoma along the tentorium
� Red – subarachnoid hemorrhage in the Sylvian fissure
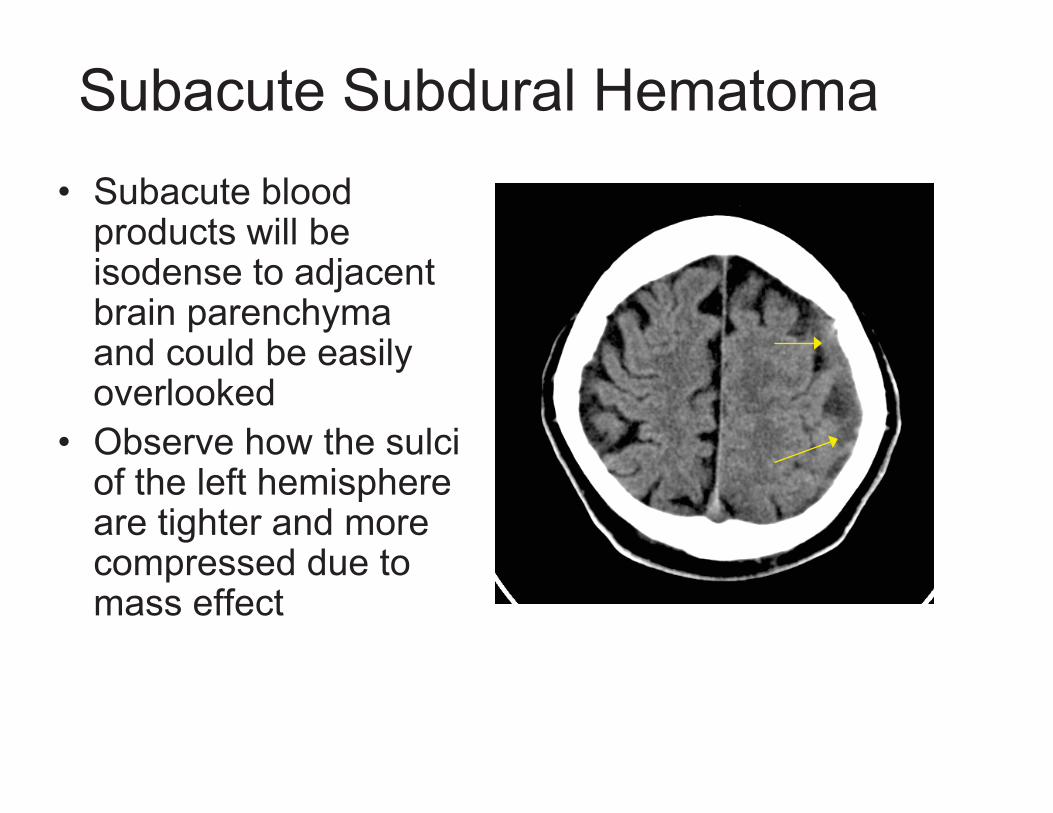
Subacute Subdural Hematoma � Subacute blood
products will be isodense to adjacent brain parenchyma and could be easily overlooked
� Observe how the sulci of the left hemisphere are tighter and more compressed due to mass effect
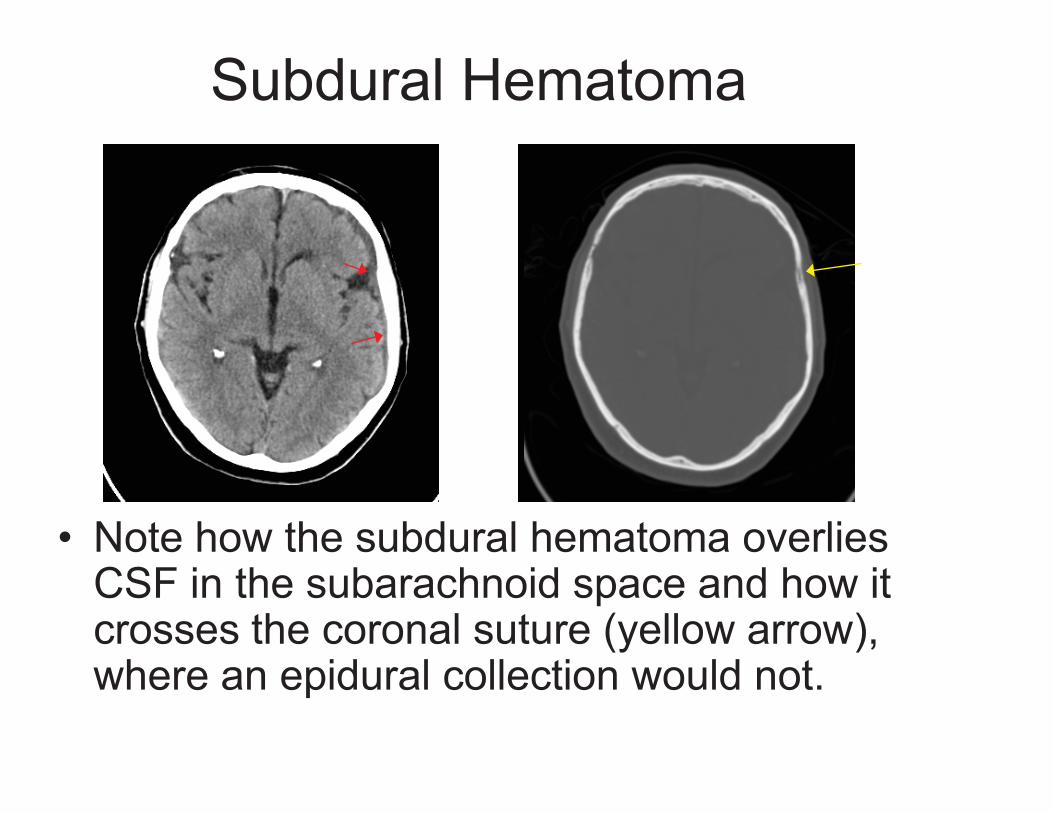
Subdural Hematoma
� Note how the subdural hematoma overlies CSF in the subarachnoid space and how it crosses the coronal suture (yellow arrow), where an epidural collection would not.

Outside the Brain with Bone and Soft Tissue Windows
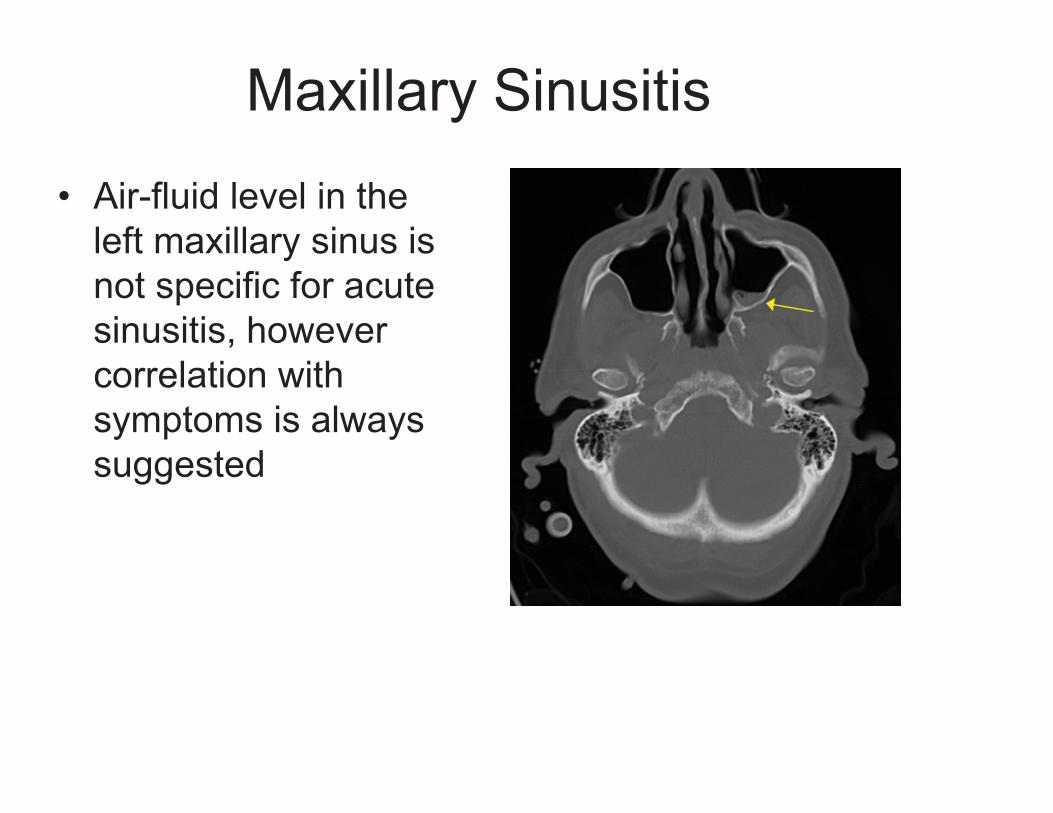
Maxillary Sinusitis
� Air-fluid level in the left maxillary sinus is not specific for acute sinusitis, however correlation with symptoms is always suggested
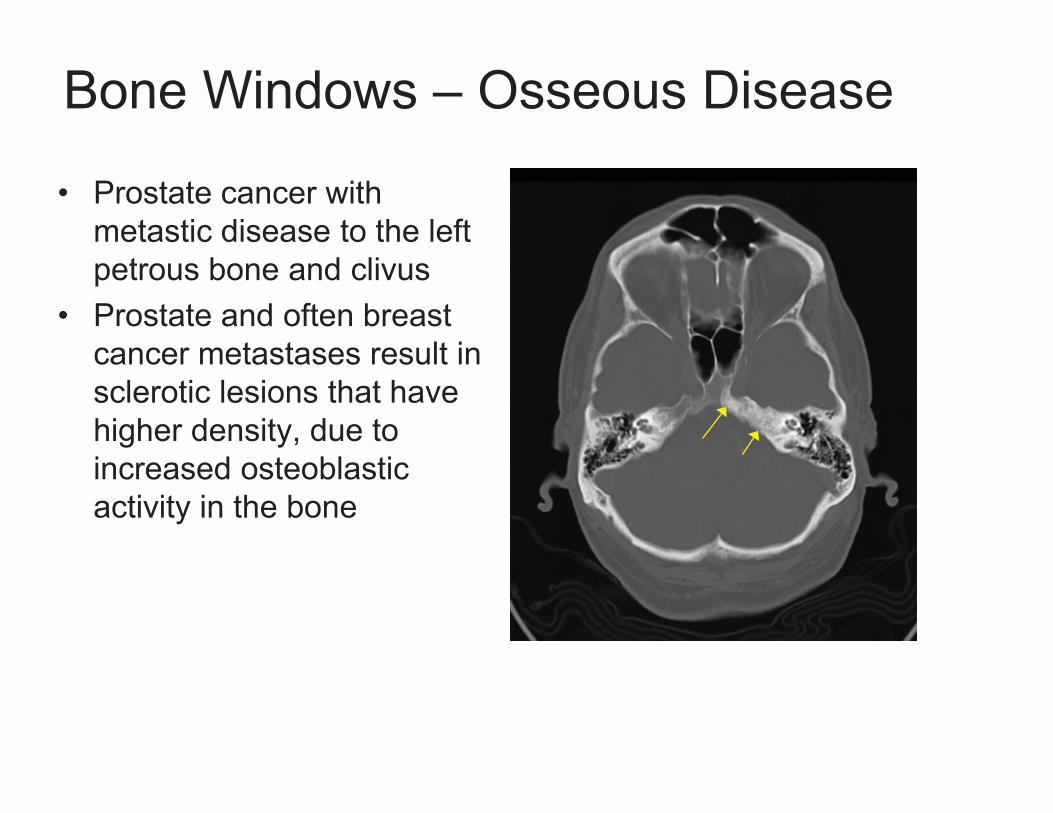
Bone Windows – Osseous Disease
� Prostate cancer with metastic disease to the left petrous bone and clivus
� Prostate and often breast cancer metastases result in sclerotic lesions that have higher density, due to increased osteoblastic activity in the bone
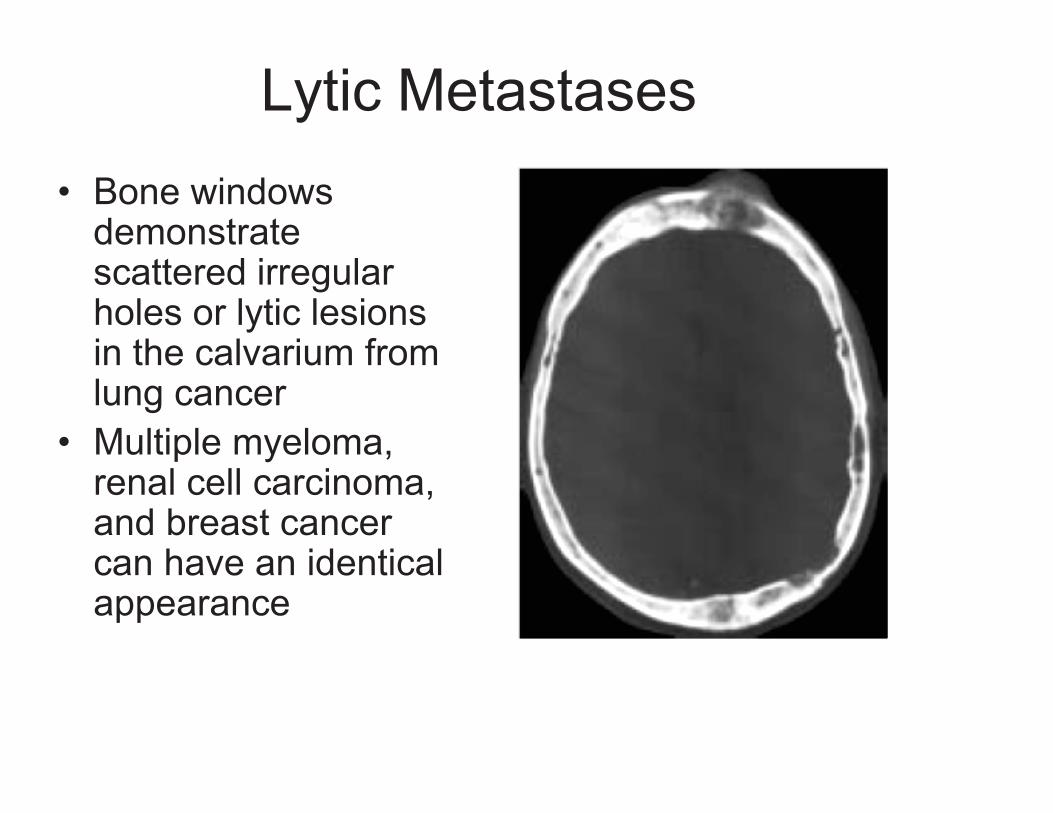
Lytic Metastases � Bone windows
demonstrate scattered irregular holes or lytic lesions in the calvarium from lung cancer
� Multiple myeloma, renal cell carcinoma, and breast cancer can have an identical appearance
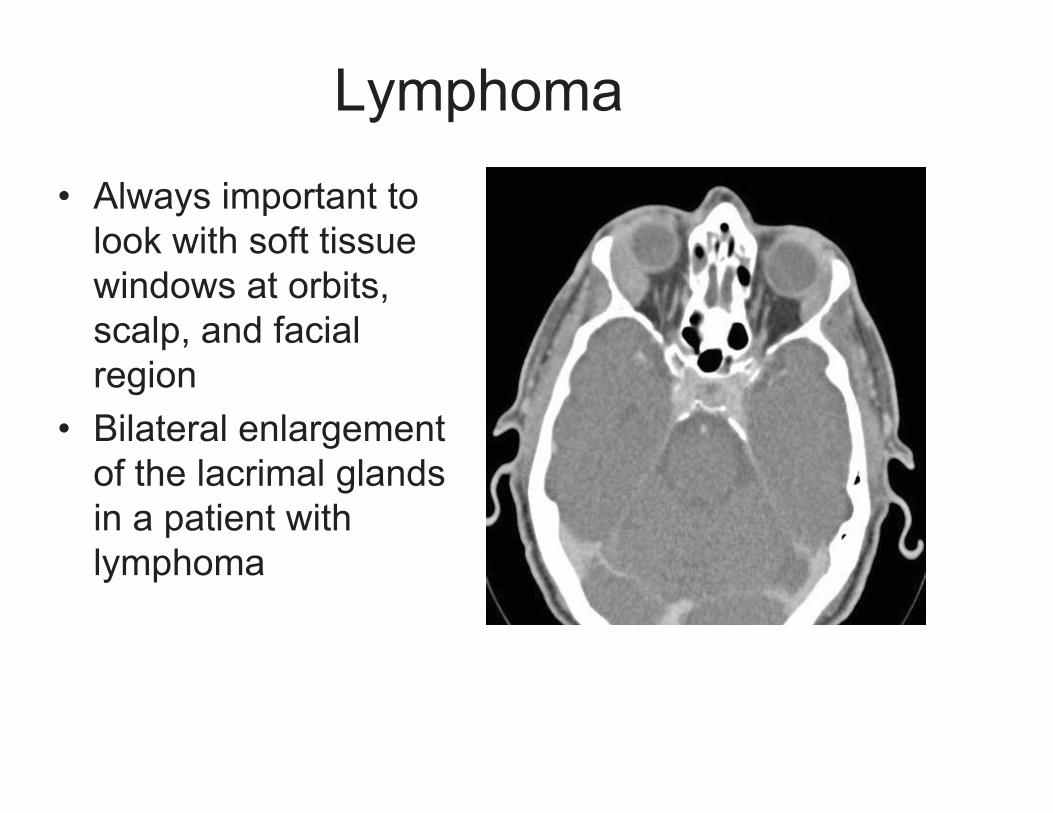
Lymphoma
� Always important to look with soft tissue windows at orbits, scalp, and facial region
� Bilateral enlargement of the lacrimal glands in a patient with lymphoma
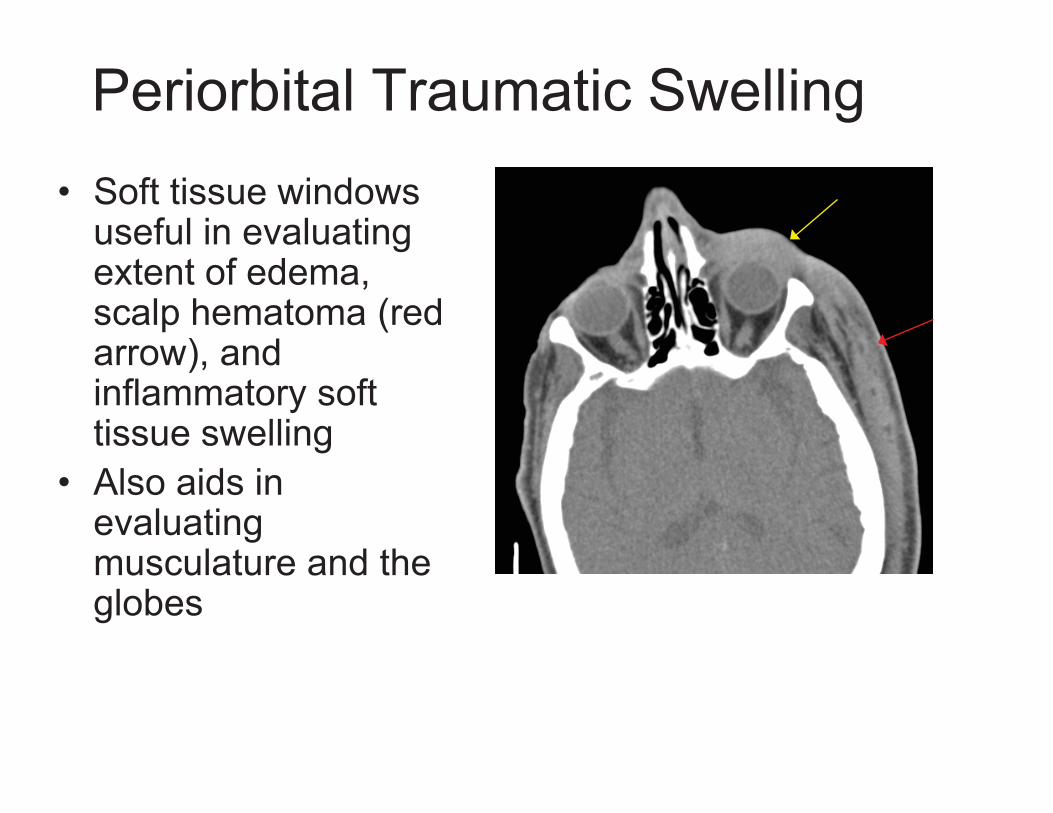
Periorbital Traumatic Swelling � Soft tissue windows
useful in evaluating extent of edema, scalp hematoma (red arrow), and inflammatory soft tissue swelling
� Also aids in evaluating musculature and the globes
Summary
� Understand the anatomy � Utilize different CT windows to assess for
pathology in the soft tissue, brain, sinuses, and bones
� GOOD LUCK!
References
� Netter, Frank. Atlas of Human Anatomy. Novartis, 1997.
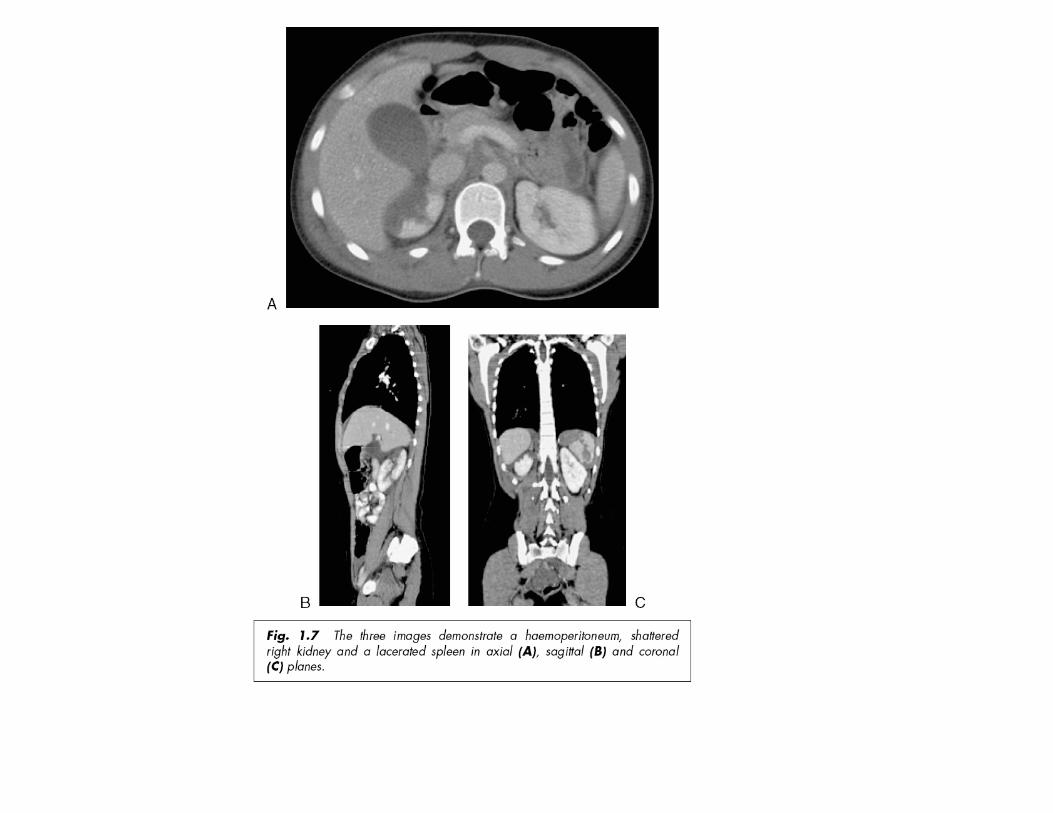
� Jackson, Simon. Cross-Sectional Imaging Made Easy. Churchill Livingstone, 2004.