baseline study: nutritional status, food security and fish
TRANSCRIPT

Baseline study: Nutritional status, food security and fish consumption among people living with HIV/AIDS in Zambia.
Banda Nyirenda, D. Sampa, M. Hüsken, S.M.C.
August 2010
Fisheries and HIV/AIDS in Africa: Investing in Sustainable Solutions
This report was produced under the Regional Programme “Fisheries and HIV/AIDS in Africa: Investing in Sustainable Solutions” by the WorldFish Center and the Food and Agriculture Organization of the United Nations (FAO), with financial assistance from the Swedish International Development Cooperation Agency (Sida) and the Norwegian Ministry of Foreign Affairs.

1
This publication should be cited as: Banda Nyirenda, B., Sampa, M. and Hüsken, S.M.C. (2010). Baseline study: Nutritional status, food security and fish consumption of people living with HIV/AIDS in Zambia. Regional Programme Fisheries and HIV/AIDS in Africa: Investing in Sustainable Solutions. The WorldFish Center. Project Report. Author’s affiliation: D. Banda Nyirenda, Ph.D.: University of Zambia M. Sampa, MSc.: Copperbelt University S.M.C. Hüsken, MSc.: The WorldFish Center Zambia
National Library of Malaysia Cataloguing-in-Publication Data
© 2011 The WorldFish Center All rights reserved. This publication may be reproduced in whole or in part for educational or non-profit purposes
without permission of, but with acknowledgment to the author(s) and The WorldFish Center. This publication may not
be reproduced for profit or other commercial purposes without prior written permission from The WorldFish Center.
To obtain permission, contact the Business Development and Communications Division at [email protected]

2
About this report
This project report is part of the Zambia component of the Regional Programme Fisheries and
HIV/AIDS in Africa: Investing in Sustainable Solutions. The baseline study that produced these data was undertaken by the lead researcher from the University of Zambia, with technical support from the WorldFish Center. The analysis and tentative conclusions are the views of the lead researcher and are not conclusive. The authors however feel strongly that these data and insights should be published and disseminated, in view of the lack of such information in the field of food and nutrition security of People Living with HIV/AIDS in Zambia, and the role of fish and fish products in particular. Further research and more extensive data sets are needed to confirm these findings and to strengthen the importance of food and nutrition security in Zambia’s development.
Acknowledgements
The researchers wish to acknowledge the Swedish International Development Cooperation Agency (Sida) and the Norwegian Ministry of Foreign Affairs for financing this study through the regional programme Fisheries and HIV/AIDS in Africa, implemented by the WorldFish Center. We would like to express our sincere thanks to the WorldFish Center staff at the Lusaka office, particularly the Country Manager, for providing support to the project team. The team wishes to thank specifically Ms. Nozomi Kawarazuka from the WorldFish Center, for her support in refining the questionnaire and reviewing the manuscript. We thank the Ministry of Livestock and Fisheries Development for supporting the study and the Ministry of Health for accepting us to carry out the interviews at their respective clinics. Special thanks goes to the health workers and the sisters in charge of Chelstone, Chongwe, and Nasenga clinics, and the home based care manager at Moomba clinic, for organizing the interviews and mobilizing the respondents to participate, and nurses who assisted with providing client information. The researchers wish to thank the University of Zambia for its support and in particular the School of Agricultural Science and the Computer Center, especially Dr. Akakandelwa who assisted with the SPSS statistical package. Last but not least the authors wish to thank the hard working field assistants, UNZA graduates: Jonathan Chuuka, Likando Lifuti, Lukonde Mwelwa, and Raphael Kyembe, who diligently administered the interactive baseline questionnaires and uploaded the data into Excel spread sheets in readiness for analysis. This research would not have been possible without the participation of and detailed answers provided by the respondents: patients of the respective clinics in Moomba, Chelstone, Nasenga and Chibombo. We wish to sincerely express our gratitude to all involved in this baseline study.
3
Summary
Under the regional programme on Fisheries and HIV/AIDS in Africa, this study under the Zambia component focuses on the role of fish consumption on human health, especially of People Living with HIV/AIDS (PLHIV). This baseline study was carried out between May and July 2010 in four selected sites in Zambia to establish baseline information of households affected by HIV/AIDS. Factors examined include household composition, education level, livelihood strategies, household food security, asset ownership, common ailments, sources of medication, the reason why children died, consumption of fish and other animal source foods, and level of nutrition education. Respondents to this study include PLHIV in four rural and peri-urban health and home base care centres in Lusaka and Central Provinces: Nasenga Rural Health Centre on the Kafue River (Lusaka Province), Moomba Rural Home Based Care in Chibombo District (Central Province), Chelstone Health Centre catering for all the peri-urban clinics within Lusaka, and Chawama Health Centre in Lusaka. A total of 145 respondents were interviewed over a period of ten days. Data collection took place using an interactive administered questionnaire and was undertaken by a team of researchers from the University of Zambia. The coded results of the questionnaire were analyzed by SPSS software 16. The narrative data was analyzed qualitatively and the results were used to explain the coded data and to make inferences on the study. The results of the baseline study demonstrated household income, and social support from family and relatives seemed to be important factors to ensure household food security. Female headed households were more likely to be vulnerable to food insecurity, and households that were able to cope better were households with children or relatives who sent help or came to look after them. However, such households were in the minority. Kapenta (Rastreneobola argentea) was the most commonly consumed animal source food. Fish in general turned out to be the most preferred source of animal foods, however, its access depends on availability of cash to the household and most PLHIV are the poorest of the poor, without regular income to afford frequent consumption of fish. Kapenta was found to be the most accessible fish due to its availability and low cost, and also the divisibility; small quantities of the small dried fish can be bought and shared as is or combined with vegetables. However, actual quantitative intake per person appeared to be low due to small purchases and sharing among household members. Homestead food production was found to be low, which is an indication that the respondents had no means to improve their productivity. Additionally, their harvests were too small to feed the family during the whole year. The respondents’ food intake was low as seen by their low Body Mass Index (BMI) and low weight, which is an indication for increased vulnerability to opportunistic infections. When assessing food insecurity, the study found that respondents with higher incomes could afford to purchase larger quantities of food and more variety in relish. If the income from sale of vegetables is not enough, a larger quantity of food cannot be bought. Respondents defined “food security” as having eaten nshima (maize meal) 2 to 3 times per day. The rural households in the study were significantly poorer than their peri urban counterparts based on occupations, incomes, and individual household asset ownership. Most of the respondents in rural areas do not have productive assets. Some rural respondents did not even

4
own chickens and their livelihood depended solely on their human power. Very few respondents owned farming implements, a radio, a bed and mattress, or a dining set. This lack of assets hampers them in their productivity, and makes these households to quickly slide into a vicious cycle: chronic hunger and illness that lead to lack of productive capacity, which results in a lack of income, and hence causes a reduced food intake, which aggravates disease. In urban areas, very poor households were also found; they are food insecure, constantly worrying about the next meal, and under pressure to find decent accommodation and pay rent. Poverty in the peri urban areas seemed to make respondents more desperate than in the rural areas where their last resort would be to go in the bush to use wild leaves for consumption. Due to limited availability and accessibility of food at household level, most of the respondents cannot practice any well intentioned training on nutrition they might have received through their respective clinic. The study found that relatively much nutrition information is given, particularly in peri urban areas. The importance of good nutrition is outlined, and respondents are given examples of what they should eat. NGOs and individual volunteers also provide information and educate respondents on nutrition (more so in urban clinics than rural clinics) but this is not useful without having food available at household level. In conclusion, the researchers recommend that inputs be made available to assist PLHIV to be food secure and enhance their response to drugs. Food distribution should be complimentary to Anti Retroviral Therapy (ART) for the most food insecure. It is also recommended that a larger national study with more respondents be conducted to verify the present results. In addition, respondents living with HIV/AIDS should be assisted with micro credits or social cash transfers to improve their livelihoods, especially their food and nutrition security.

5
Table of Contents
About this report ........................................................................................................................... 2
Acknowledgements ....................................................................................................................... 2
Summary ........................................................................................................................................ 3
Table of Contents .......................................................................................................................... 5
Acronyms ....................................................................................................................................... 7
1. Introduction ........................................................................................................................ 8
2. Objective of the study ..................................................................................................... 10 2.1 Data collection methods ...................................................................................................... 10 2.2 Study target areas ................................................................................................................. 10 2.3 Data analysis ........................................................................................................................ 11 2.4 Informed consent ................................................................................................................. 12
3. Results and Analysis .......................................................................................................... 13
3.1 Heads of household: male to female ratio ...................................................................... 13 3.2 Educational level of respondents.................................................................................... 13 3.3 Occupation of respondents ............................................................................................. 15 3.4 Food availability ............................................................................................................. 16
a. Maize..................................................................................................................16 b. Animal protein ..................................................................................................18 c. Vegetables .........................................................................................................19 d. Fruit ...................................................................................................................20
3.5 Amount of food produced for home consumption ......................................................... 20 3.6 24 Hour Food Intake Recall ........................................................................................... 22 3.7 Body Mass Index comparison by target area ................................................................. 23 3.8 Who eats first? ................................................................................................................ 24 3.9 Fish consumption and preparation ................................................................................. 25 3.10 Preference for fresh and processed fish .......................................................................... 26 3.11 Treatment received by respondents ................................................................................ 28 3.12 Source of medicine ......................................................................................................... 28 3.13 Relationship between education level and source of treatment ..................................... 29 3.14 Common child ailments ................................................................................................. 29 3.15 Reasons for child deaths ................................................................................................. 30 3.16 Nutrition information and education .............................................................................. 31 3.17 Limitations to the analysis.............................................................................................. 33
4.0 Conclusion and recommendations ................................................................................. 34
References .................................................................................................................................... 36
Annexes ........................................................................................................................................ 37 Annex 1: Detailed baseline questionnaire ................................................................................. 37 Annex 2: Details of occupation and income in target areas ...................................................... 54 Annex 3: 24 Hour Food Intake Recall per target area. .............................................................. 58 Annex 4: Common child diseases in target areas ...................................................................... 62
6
Tables Table 3.1: Heads of Household ..................................................................................................... 13 Table 3.2: Income levels in two target areas................................................................................. 14 Table 3.3: Most food insecure month ........................................................................................... 17 Table 3.4: Summary 24 Hour Food Intake Recall ........................................................................ 23 Table 3.5: Body Mass Index and Food ......................................................................................... 24 Table 3.6: Preference of fresh fish compared to processed fish by target area ............................ 27 Table 3.7: Preferred size of fish by target area ............................................................................. 27 Table 3.8: Source of medicine ...................................................................................................... 28 Table 3.9: Education level and source of treatment ...................................................................... 29 Table 3.10: Causes of child death ................................................................................................. 30 Table 3.11: Duration of child ailment before death of child ......................................................... 30 Figures Figure 3.1 Educational level of respondents ................................................................................. 14 Figure 3.2: Income Levels in Moomba (rural) and Chelstone (peri-urban) ................................. 15 Figure 3.3: Intra-household food pattern: who eats first? ............................................................. 25 Figure 3.4: Respondents’ treatment regimen ................................................................................ 28

7
Acronyms
AIDS Acquired Immune Deficiency Syndrome ART Anti-Retroviral Treatment BMI Body Mass Index CD4 Cluster of Differentiation 4 (glycoprotein) CRS Catholic Relief Services DHMT District Health Management Team E-pap Energy protein porridge Ha Hectare HEPS High Energy Protein Supplements HIV Human Immunodeficiency Virus KKCAF Kenneth Kaunda Children of Africa Foundation MUAC Mid Upper Arm Circumference NAC National HIV/AIDS/STI/TB Council (Zambia) NFNC National Food and Nutrition Commission (Zambia) OPAZ Organic Agricultural Production of Zambia PLHIV People Living with HIV PRA Participatory Rural Appraisal RDA Recommended Daily Allowance RUTF Ready to Use Therapeutic Food SDA Seventh Day Adventist SPSS Statistical Package for Social Scientists TB Tuberculosis UNAIDS Joint United Nations Programme on HIV/AIDS UNZA University of Zambia USA United States of America WHO World Health Organization ZK Zambia Kwacha

8
1 Introduction
Availability and intake of adequate amounts of nutritious foods is essential for people living with the Human Immunodeficiency Virus (HIV) and Acquired Immune Deficiency Syndrome (AIDS) to keep them healthy, active and to prolong their lives. A stronger, healthier body can better resist opportunistic infections, especially for People Living with HIV (PLHIV) and particularly in resource poor communities. Food insecurity and poor nutritional status may hasten progression into AIDS-related illnesses. It may also undermine adherence and response to Anti Retroviral Treatment (ART) and exacerbate socio-economic impacts of HIV (UNAIDS, 2008). Nutrition is therefore an important component of comprehensive care of PLHIV. Understanding food availability and accessibility, and the quantity and quality of food intake, is particularly imperative in resource limited settings where malnutrition and food insecurity are chronic or endemic, because pre-existing malnutrition exacerbates effects of HIV (Piwoz et. al., 2005). In Zambia there is scarcity of information on household food consumption by various sub groups of the community, particularly the poor and food insecure. A balanced intake of nutritious foods is an important parameter in the progression and manifestation of HIV and AIDS. There is however a lack of research evidence on the best ways to test the extent of an individual’s malnourishment regarding macro-nutrients (energy and protein) and micro-nutrients (vitamins and minerals) based on their food intake. Different foods contain varying quantities of the nutrients required for normal health, growth and body repair in sickness. In addition, the quality of food is determined by the quantity and quality of nutrients the food provides. All the required nutrients cannot be found in one food type, but some foods can provide a major part of the needed nutrients. Fish is such a food that contains high quantity and quality nutrients; it contains high biological availability of nutrients such as, proteins, fats, vitamins and minerals (Banda Nyirenda, Hüsken and Kaunda, 2009; Te Lintelo, 2008). Medical interventions carried out in Zambia, like in other poor Sub Sahara African countries, often do not have adequate information on the background of their patients and a holistic medical treatment that includes nutritional interventions for people living with HIV/AIDS and/or tuberculosis(TB) is often not provided (Science Academy of South Africa panel, 2007). In Zambia, knowledge is limited on which and how many nutrient(s) are required at various stages of progression of HIV/AIDS to mitigate the disease and how the immune system becomes dysfunctional. This has demanded the need to run statistically designed and controlled trials that are reliable, repeatable, and accurate, in order to increase our understanding of the interactions between HIV/AIDS and nutrition in the Zambian context. Well designed evidence-based nutrition intervention trials are important to establish the significance of food supplementation in the care for people living with HIV and AIDS, and how it slows down the progression of HIV and AIDS in the human body. The Kenneth Kaunda Children of Africa Foundation (KKCAF) St Clare Center for Applied Nutrition has reported positive responses to drug interventions when nutritional supplements are provided during treatment and wound healing of chronically malnourished patients living with HIV/AIDS. The KKCAF used to provide nutritional supplementation support in their HIV/AIDS Care Centres in

9
Zambia. This nutritional support included distribution during clinic hours of fish powder (from Norway), Energy-Protein porridge (E-pap), kapenta (small dried whole fish), cooking oil, juice and biscuits as energy supplements (Kaunda et. al., 2008). In their findings, Kaunda et al. report that patients who received fish supplements showed reduced opportunistic infections, reduced viral load and gained their normal body functions faster. Under the Zambia component of the regional programme on Fisheries and HIV/AIDS in Africa, a literature review was completed to explore the studies carried out on the impact of nutrition and fish supplementation on the response to Anti Retroviral Therapy, with a focus on Zambia (Banda Nyirenda et. al., 2009). This review highlighted that food insecurity has an impact on the vulnerability to and progression of HIV/AIDS, especially in rural areas. Supplementing PLHIV with nutrient dense foods such as fish (Kaunda, 2008) or nutrient dense Ready to Use Therapeutic Foods (RUTF) (CRS, 2007) has shown indications of improved response to ART. This baseline study was carried out to establish the current baseline of food consumption, food and nutrition security of PLHIV in rural and peri-urban areas, in order to form the basis for the nutritional supplementation and clinical research to be undertaken in selected communities near health centres in Zambia.

10
2. Objective of the study
The overall objective of this study is to establish a baseline of the food security and fish consumption levels of people living with HIV/AIDS in selected rural and peri-urban sites in Lusaka and Central Provinces, Zambia. The underlying question of this study is whether those who have better food security and those who consume fish regularly would show positive relationships to body weight or body mass index, as compared to those who consume less fish and other nutritious foods. Key issues that were taken into consideration in this analysis included;
- What is the socio-economic background of the respondents? - Does education of the respondents assist them in being more food secure or in choice of
food? - How much and what kind of nutrition education are respondents receiving from their care
givers? These and many other questions were posed in a detailed baseline questionnaire (Annex 1) that was individually and interactively administered by the research team to a total of 145 respondents, all of whom were patients at one of the four health centres targeted.
2.1 Data collection methods The interview instrument was developed by the researchers that contained narrative (explanations) and coded pre-selected questions with options or choices and scales (i.e. 0-5). A group of four graduated student field assistants from the University of Zambia (UNZA) (Jonathan Chuuka, Lukonde Mwelwa, Likando Lifuti and Raphael Kyembe) were trained in interactive questionnaire administration and using Participatory Rural Appraisal (PRA) methods of probing and follow up questions to assist the interviewee to provide a complete answer. These assistants together with the lead researcher made up the research team that collected and uploaded the data into Excel, after which the lead researcher and biometricians analyzed the data using SPSS software. The software package Statistical Package for Social Scientists (SPSS) was used to generate the frequencies and analysis of coded data. The narrative data contained summaries and tables generated from which inferences have been made. 2.2 Study target areas
The research was carried out at four target areas; two rural sites and two peri-urban sites. Access to the study respondents was granted by the Ministry of Health (MoH) and via the respective clinics in these sites; Nasenga Rural Health Centre and Moomba Rural Home Based Care Centre for the rural respondents, and Chelstone Health Centre and Chawama Health Centre for the peri-urban respondents. Respondents in this study were all clients of one of the four respective health centres as they were all living with HIV/AIDS. The baseline information gathered included; occupation, child health and causes of death, food availability, house hold food security, household protein sources including fish and fish products and their cleaning methods and

11
consumption, 24 hour recall, food frequency, nutrition information and education received and question from the respondents. The results of the two rural health centres will be presented together as they are similar in many aspects, the same applies to the two peri-urban health centres involved in this study. Differences between rural and peri-urban health centres will be highlighted. Nasenga rural community respondents were interviewed at Nasenga health centre, situated in Kafue South along the bank of the Kafue River for some kilometres and covers both sides of the road to Mazabuka up to the end of the Munali Hill. There is an estimated population of 250 respondents living positively with HIV/AIDS who are attending this centre. The group is continuing to grow with patients coming from the deep rural areas along the Kafue as more and more people are becoming aware of the importance of accessing ART. The health centre is now under Mazabuka District Health Management Team (DHMT) to facilitate the distribution of drugs. Before that, patients used to get their medicines from Kafue Gorge, which is far and difficult to find transport. The project team was able to interview forty (40) respondents in two days; two manuscripts were disqualified for incomplete data. Moomba rural community was accessed through Moomba Home Based Care Centre which is situated about thirty kilometres from Lusaka in Chibombo District of Central Province on the Great North Road. Moomba Home Based Care Centre has over 400 respondents living positively with HIV/AIDS and most of them are on treatment. A total of forty (40) respondents from this centre were interviewed in this study. The peri-urban community of Chelstone is located 10 kilometres North-East of Lusaka, operating as a referral centre for all the peri-urban clinics on the Great East Road within Lusaka, including Chelstone, Chainda, Avondale, and Kaunda Square. The Chelstone community was accessed through Chelstone Health Centre in Lusaka, a total of 62 respondents were interviewed in three days. The Chelstone Center is currently providing services to over 1,000 respondents. The respondents originate from all parts of Zambia, of mixed ethnicity, work positions and status in society. Some were employed in the formal sector, others were engaged in various informal businesses or were unemployed. The Chawama Community, including all compounds South of Lusaka City, was accessed through Chawama Health Center. This centre is covering the compounds on the southern and along the Kafue Road South of Lusaka, including Chawama and surrounding site and service settlements. Interviews were done as a test-run as the team had already run out of interview resources, hence there were only 11 respondents interviewed to get a feel of the difference amongst Chelstone Community with mixed social economic back grounds and Chawama, which started as unplanned settlement and servicing similar neighbourhood communities such as John Leing, John Howard, Missisi, and Chibolya neighbourhood. The respondents were from different parts of Zambia and they conversed with the multilingual research team in English, Nyanja, Bemba, Tonga, Soli/Lenje and Lozi. 2.3 Data analysis The coded data was uploaded into Excel format and later converted into SPSS spread sheets and analyzed at UNZA with the assistance of biometricians Akakendelwa Akakendelwa, Ph.D., lecturer at UNZA, and Martin Sampa, MSc., lecturer at Copper Belt University. This data was subjected to SPSS statistical analysis of frequencies and cross tabulations of information from all four peri-urban and rural areas targeted through the above mentioned health centres. The narrative results have been analyzed per health centre and integrated within the coded data set.

12
These results are discussed as whole data, looking at similarities and contrasts, and where possible, significant statistical analysis using Fishers’ test, frequencies and correlations. Statistical analysis was performed using the software Statistics Package for Social Scientists version 16 (SPSS, 2006). The results of the various parameters examined and statistical analysis results are provided in the section “Results and Analysis”. The statistical analysis of the coded data using SPSS Pearson’s Chi square’s associations of variables showed some trends, but some of these were not significant and cannot be generalized to a larger population. 2.4 Informed consent All respondents in this study were read the informed consent declaration and were asked to sign if they wanted to take part in the interview. Participation was anonymous and the research team observed strict confidentiality practices.

13
3. Results and Analysis
3.1 Heads of household: male to female ratio The study results show that 40% of the respondents were female heads of household. These women were all living with HIV/AIDS and attended one of the health centres of the study. Table 3.1 below illustrates the ratio of female headed households to male headed households. The majority (82%) were widows, often due to AIDS. One woman stated:
“I told my husband to go for testing and he refused, but I went and I am still alive”!
Table 3.1: Heads of household
Frequency Percent Valid
Percent
Cumulative
Percent
Male 87 60.0 60.0 60.0
Female 58 40.0 40.0 100.0
Total 145 100.0 100.0
The high percentage of female heads of household living with HIV/AIDS indicates a high level of vulnerability in these communities. In total there were more women infected than men that were captured at these clinics. Female headed households were found to be the most food insecure, and the study found that more women than men were harvesting very little or nothing. Women were found to make up most of the 86% of people living on less than 5 million Zambian Kwacha (ZK) (≈ USD1,000) as yearly income. Women were also found to be more heavily dependent on their children, if they have any. Food insecurity, in a context of HIV/AIDS and malnutrition, sustains a vicious cycle (Grellier and Omuru, 2008), and the female respondents were more likely to be trapped in that cycle. Male respondents were found to quickly remarry after the loss of their spouse, often due to AIDS related illnesses. However, the study found that women were extra cautious in their choice of a (new) husband, as they feared the next man would be already infected, as one woman remarked:
“Akaniletele matenda! (He will bring me disease!).”
3.2 Educational level of respondents The educational level of the respondents in this study varied and ranged from those who had never been to school to those who had completed high school education. The majority (50.3%) of the respondents had attended grade 1-7 of primary school, while 37.9% had done up from 8th to 12th grade, and 11.7% had never been to school (Figure 3.1 below).

14
Figure 3.1: Educational level of respondents
The levels of education among women headed households were found to be lower than male headed households, and the study found that these households had less income and were more food insecure than male headed households. The majority (80%) of the rural female respondents claimed they had only attended lower primary school (grade 1-4) and as a consequence they were often unemployed or working as subsistence farmers but yielding very little produce that lasted one 2-3months of the year. This lowered their standard of living, compared to those who were married or educated. This difference can be seen clearly from the income results in Table 3.2 and figure 3.2 below (further details are provided in tables 3-5 in Annex 2) where the population of respondents interviewed varied from very poor, who earned or produced nothing or very little (ZK1,2 million/ annum), to those who earned a reasonable income. Table 3.2: Income levels in two target areas. Income level Target area (% income per year)
Moomba – rural
(%)
Chelstone – peri-urban
(%)
No Income (Not Working, No spouse, No further income) 36 22
Low Income ZK 1 - 5 Million 50 42
Mid Income ZK 5.1 – 10 Million 7 20
High Income ZK > 10.1 Million 7 16
For example, in peri-urban areas like Chelstone a mechanic and a lecturer earned ZK36million (US$7,000/year) and ZK30 million (US$6,000)/year) respectively, and in Chawama area a husband of a client in formal employment who was also involved in trading, earned a total of ZK39,9million (US$8,000) annually. Thus, a higher education level of a client or spouse gave a correspondingly higher income. The data from Table 3.2 and the Figure 3.2 show that the rural areas have more people with lower income (86% lived on 0-5 million Kwacha per year) while the peri-urban area of Chelstone has 64% in the same income category.

15
Figure 3.2: Income levels in Moomba (rural) and Chelstone (peri-urban)
3.3 Occupation of respondents In both Nasenga and Moomba rural communities, the majority of client households are small scale subsistence farmers cultivating small parcels of traditional land varying from 0.25 to 2.0 hectare per household. On these plots the major crop is the staple food maize, producing varying yields from 3x50kg to 30x50kg bags per household for a year’s food supply. Other crops that are grown include groundnuts, beans, pumpkin, sweet potatoes, okra, amaranthus and rape. From some of these, such as pumpkin and sweet potato, also the leaves are eaten as relish. This seasonal farming is rain-fed agriculture and most crops grown are for home consumption. Any (small) surplus might be sold to settle debts or to purchase necessities. In many cases even those

16
who harvest very little are forced by poverty to sell the little food they grow for cash income. In Moomba, due to the high water levels after the rainy season, gardening is a major source of livelihood for the communities near the main road, as they have easy access to the market. Many young men and women are actively engaged in this vegetable gardening and trade. Other occupations in Nasenga included: carpentry, bricklaying (ZK60,000 per month); digging and selling sand (ZK100,000 per month); bar tender / waitress (ZK60,000 per month); growing vegetables for sale, selling fruits (oranges, bananas) and vegetables, managing a ntemba (small mobile grocery store) for retailing groceries. Some residents from Nasenga engage in fishing in the nearby Kafue River. These income generating activities and coping strategies make variable incomes ranging from ZK60,000 to ZK200,000 per month. Often people engage in a combination of activities, making a little bit more money. One respondent explained that they make ZK300,000 per month; the husband works as herder at a dairy farm and the wife sells fritters to school children. The majority of the households in Moomba are peasant farmers, vegetable growers and sand diggers, but there is a variety of income generating activities being undertaken by the households. In the rainy season some engage in catching small fish (called 'tu kababa' meaning small and bitter) in the semi-annual streams. In Chelstone, in of the well-off households there were several employed or self employed persons; for example one member of a household works for Olympic Milling while another is a business person and another is a brick layer. All are members of the same household and contribute to the overall household income. One of the respondents in Chelstone was in formal employment and the children also worked; one as a maid and the other did odd jobs to increase total household income and access to food and shelter. The livelihoods of the respondents in Chawama area differed depending on their occupation (those with formal education as teachers, health workers or stable business had high incomes), level of education (high level of education had more activities and income) and abilities. Two respondents had just lost their jobs and did not know what to do next, while others who combined business and formal work had enough to secure their food sources. 3.4. Food availability
In terms of food security, the study found that the most limiting constraint for rural respondents is the lack of productive assets for tilling the land and inputs to produce food and income required for decent living, food security and livelihoods. In urban areas, the main constraints are the lack of jobs and enterprises that bring in income throughout the year, as well as various resources that increase access to food and good living. The participatory method Annual Food
Availability Calendar has been used in this study to map the availability of different food types in the calendar year, namely maize, animal protein, vegetables and fruit.
a. Maize The annual food availability calendar for respondents from Nasenga showed maize as the main staple food. Maize availability mainly comes from the respondents’ own production and when that runs out it is supplemented with purchases of maize or milled maize flour from shops. A few respondents were found to produce sorghum. Green maize is the first maize to be available, before it dries end February/March each year. Respondents were found to continue eating their harvested maize for varying periods of the year depending on the production level. The months

17
with most abundant maize quantities are April to June, when all respondents indicated to have some maize or to be running out of home grown maize next month (meaning July). In this study the majority of subsistent farmers of Nasenga stated that their maize lasts only three to six months. By August most households had run out of their home grown staple maize and had to purchase from shops. The lean months for respondents in all target areas were January and February. Maize availability in Moomba is variable, just as in Nasenga, depending on the season. Maize from own production depends on how much a person produced and harvested. For those who harvest a lot, the maize stock often lasts them until the next season(5%). But most of the respondents reported to have small harvests which only lasted from three (50%) to six (45%) months. Some respondents reported that they purchase more maize at harvest time from other farmers when the commodity is cheaper. Most of the respondents keep vegetable gardens that provide income and food from April to December. These respondents market their produce in Soweto market in Lusaka, and sometimes customers come to their garden to buy. From the profit, respondents purchase maize meal in shops. The main staple for respondents in the third target area, attending the peri-urban health centres Chelstone and Chawama, is maize meal. Only three of 62 respondents in Chelstone mentioned eating rice sometimes, which is an expensive commodity and considered a luxury food. Maize stocks from peri-urban fields usually last a very short time; up to April or up to October, depending on field size and production level. Respondents with fields outside town were able to produce more. The leanest period was similar to the rural areas, from January to February, but low food levels start from December for most households that earn an income outside subsistence farming and from September for those households depending fully on subsistence farming. The study found that respondents from households with formal employment, well paid jobs 1 , and diversified businesses generally have enough money to purchase maize meal from the shop all year round. Some (3) households were able to diversify staples with rice, and pasta. But those with a low income, as shown in the tables 3-5 detailed occupation in Annex 2, depend on self-employment or small businesses. Those unemployed (36% in Moomba and 22% in Chelstone), stated that they “struggle to get maize meal every month” and hence they buy small amounts to feed their families for a day or two, depending on what they have earned on “peace work” or labour exchange for cash or food. The worst months in terms of food insecurity were January and February. The results from the respondents confirm this as shown in Table 4.3 where 89 out of 109 people said January and February were the worst months in terms of food insecurity. In rural areas such labour exchange increases the vulnerability of poor households, as it means they spend more time in other people’s fields at the expense of their own fields, whose yields will be lower due to delayed weeding.
Table 3.3: Most food insecure month Worst month (month number i.e. Dec=12, Nov=11) Total
Jan Feb Ma
r
Ap
r
Ma
y
Ju
n
Au
g
Dec
Target
area
Nasenga Count 11 7 3 1 0 0 0 0 22
Chelstone Count 27 11 1 3 2 0 1 1 46
1 By well paid we mean relative (earning over ZK10 million in Moomba (7%) and Chelstone (16%) respectively) to the majority who earned between ZK0-5 million who accounted for 86% of respondents in Moomba and 64% in Chelstone, respectively.

18
Moomba Count 13 15 2 1 0 1 0 1 33
Chawama Count 3 2 2 0 1 0 0 0 8
Total Count 54 35 8 5 3 1 1 2 109
Expected Count 54.0 35.0 8.0 5.0 3.0 1.0 1.0 2.0 109.0
b. Animal protein Fish (bream and kapenta), meat and chicken are the most common animal protein sources in all areas (Nasenga, Moomba, Chelstone and Chawama). Fish was the most preferred and most commonly consumed by fishing and retailing households in Nasenga and Chelstone due to its availability. While fish is mainly destined for sale, when they fail to sell it or have no relish, these households would cook some fish for home consumption. For poorer communities the most affordable fish was kapenta (from Siavonga) which is easy to share amongst many people in a household. The only time fish becomes scarce was during the yearly fishing ban, from December to March. Chicken and beef were said to be available all year round, but expensive (especially beef), and therefore only consumed once in a while. In Moomba area, the most commonly consumed animal protein was fish (kapenta), followed by chicken (at least once a month) and eggs by those who raise chicken at home. Meat is eaten occasionally. Three people said they did not eat kapenta because of skin reactions, two others because they do not like it. Twenty percent (20%) of the rural communities stated that they lost chickens and cattle due to animal diseases. When asked why they did not keep goats which are resilient to animal diseases, they said because goats destroy crops and the many gardens in the area. During periods of high vegetable production, most gardening households can spare a bit of money to buy animal protein, mostly kapenta. Some households reported they can go for almost six months without eating animal protein due to poverty. People with chicken would rather sell their chicken for cash than eat them, in order to buy requirements for school going children or basic household needs.
In Chelstone area, the most common sources of animal protein were beef, poultry and sausages, fish (fresh bream and kapenta), pork, chicken and caterpillars (seasonal). These are readily available as long as the households have the money for purchasing. Those who have more income will eat animal protein from varying sources 2-3 times a week. As with staple foods, access to animal protein is specifically low in the months January and February, as people are struggling to meet other household costs such as school fees. The study found that poorer rural households (36% in Moomba and 22% in Chelstone) rarely eat large fish or meat, probably once a month: “Chicken we only manage to get intestines and the head from the abattoir because the
whole chicken is too expensive”.
In both rural and peri-urban areas, respondents indicated to lack enough money to buy meat, chicken or whole large fish, as they are expensive. This is another reason why kapenta is popular: “Kapenta at least we can afford once in a while”.
The most common animal protein in Chawama area was fish, particularly kapenta, followed by chicken and then meat. Affordability varied depending on income; some households could only afford animal protein 2-3 times per month while others could access it 4-5 times per week, particularly kapenta, chicken or meat about twice a month depending on availability of money.

19
Except for those who were formally employed and had viable businesses and incomes, animal protein was generally found to be a luxury item that respondents wished for, as can be seen with the significant (P>0.05) wish for fresh bream fish in the question on fish preference (Table 3.6 in paragraph 3.10). Respondents had a strong wish for fresh fish, but all they can afford was kapenta, which is highly nutritious but not as much preferred as large bream. Some complained that kapenta had a bitter taste if you did not remove the stomachs, hence they have devised very vigorous methods of cleaning it; soaking the kapenta in hot water and washing it thoroughly until the stomach contents are removed. As a consequence, a lot of nutrients are removed, reducing the potential nutritional benefits of kapenta. A few respondents (3) claimed to develop allergic reactions to kapenta, but for the majority of respondents, kapenta is a default animal protein source when your income does not allow for more expensive fish or any other animal protein source.
c. Vegetables The most common and abundant vegetables consumed in season in all four study areas were rape, Chinese cabbage, chibwabwa (pumpkin leaves), cabbage and okra. Beans are eaten fresh or dry when in season. Chibwabwa, okra, amaranthus and rape can be dried for consumption outside the season. The worst period when vegetables are scarce is from end of August to early December when gardens are dry, except those close to streams and main rivers. Availability of vegetables varies; rape is usually not available in the rainy season from January to April, okra is availably mostly January to May, chibwabwa (pumpkin leaves) from December to April but all year round to those who engage in dry season gardening; sweet potato leaves (kalembula) from January to December. Respondents in Moomba reported to have good access to vegetables and the most common and readily available vegetables were bondwe (amaranthus), Kalembula, Chinese cabbage, rape, cabbage, chibwabwa and okra. Most of these vegetables are grown immediately after the rainy season for cash incomes and relish from March to November when stream and pond water is still available. From December to February, which is the rainy season, pumpkin leaves, amaranthus, and okra are grown. Other exotic vegetables such as cabbage, rape and tomatoes do not grow well because they get attacked by insect pests and will grow only with heavy insecticide is sprayed, which are expensive. Very few respondents reported to have vegetable gardens in the peri-urban areas of Chelstone and Chawama. The main obstacles mentioned for this were lack of land, lack of money to purchase seed, lack of equipment for watering, and having to pay for water from the City Council. Hence, the amount and diversity will vary depending on what is in season and cheaper. From December to March most wild and indigenous vegetables are abundant, and the exotic ones become more expensive and fewer. From June to August most exotic vegetables are cheaper as many gardeners flood the market. However as it gets hotter and drier, only those with irrigation systems are able to continue to produce vegetables, which causes prices to go up. The most accessible vegetables in Chawama are rape, cabbage, Chinese cabbage, chibwabwa (pumpkin leaves), spinach, kalembula (sweet potato leaves), beans, Hibiscus (lumanda) rape, okra, and bondwe (amaranthus). Respondents reported to eat each one of these vegetables at each meal time. In a ranking of relish, the most regularly consumed vegetables on a daily basis were chibwabwa, rape, Chinese cabbage and cabbage, followed by beans and then some animal protein. Availability of beans, cabbage and lumanda (Hibiscus) reduces towards November, and by December other rain fed vegetables start to grow and reach abundance in January to February

20
and then decline to be replaced by garden vegetables. In the leanest months of January and February major coping strategies include eating home grown vegetables and provide labour in exchange for food.
d. Fruit Fruit availability in Nasenga and Moomba is seasonal and depends on own production for those in the rural communities. Mangoes are available from November to January, which are a good source of vitamins. People either eat the ripe fruit or cook the young mangoes, and they are also used for selling or bartering with other foods (maize meal) or labour (weeding fields). Those who have a lot of mangoes, felt it is a food security crop as it becomes most abundant in January and February (most food insecure months) before it abruptly finishes as the rain intensifies and pumpkins and fresh maize start to mature. Guavas are equally abundant as mangoes, and are declining from February up to April. Oranges do not do well in the dry season due to lack of water. Lemons do well once the trees are established. Bananas are available all year round and papayas grow from May to September. Both are grown by a few households (21% of interviewed), who generally have one or two trees. Availability of wild fruits ranges from December to January and these are usually picked by children except those of marketable value such as Masuku, masau, ngai, mabuyu (Baobab fruit), and matobo, which are picked by adults for sale. Wild fruits become important for lean months when households are food insecure. The available fruits in Moomba included; bananas, papayas, guavas, mangos, oranges and lemons. Like in Nasenga, all fruits are seasonal and therefore access will vary. Except for mangoes, as all respondents said they have a mango tree and there are plenty. Other fruits such as oranges, papayas and bananas are not grown by all respondents; only 21% claimed to have at least one or two trees (oranges give dry fruit if not watered) and hence these fruits are not much consumed by the respondents. In the urban areas of Chelstone and Chawama the most common fruits were said to be oranges, apples and bananas, which are all available all year round, but they are expensive. The most popular abundant seasonal fruits were mangoes, avocados, and papayas. Fruits produced by the respondents, such as avocado, mangoes and papayas, are often consumed, but the majority of respondents have to purchase when they have money, which is not often. Most fruits are accessed in seasons where the respondents in Chelstone and Chawama could afford to eat fruit more regularly. Mangos are more abundant between January and February and tend to be cheaper. But accessing exotic fruits like oranges, bananas and apples is possible all year round, but it depends on purchasing power of the household. This analysis reveals that although a variety of fruits do exist throughout the year, the majority of the households do not have access to these fruits, and hence fail to get the maximum benefit of the vitamins and minerals contained in them. They may taste once in a while but not enough to provide the required quantities of these nutrients to their drained body systems. 3.5. Amount of food produced for home consumption The majority of the rural households in Nasenga consume all the produce they grow (33 out of 38 respondents), and only a few (5 out of 38) sold up to 25 percent of their produce. Most households of 6 people eat 2x50kg per month as they eat nshima 2-3 times a day. The main reason mentioned for selling home grown produce is the need for relish, soap, or other pressing

21
household needs. Over 31 respondents in Moomba kept 70-100% of their maize for home consumption, about four sold 50-70%, and only one respondent reported to sell all the maize grown by the household. Production levels are extremely low at 2 to 7 bags per annual yield. A bag of 50kg is sold at ZMK64,000 (USD13) this past marketing season (2009-2010). In Chelstone most respondents did not grow maize, as the area is in town, but those who did, are consuming 90-100% of their maize. Some households produce as much as 15x50kg bags of maize and they consume it all at household level, while having to purchase more to meet their household needs. The respondents in Chawama area do not have fields to produce anything. They live in crowded settlements and try to do some petty trading or do retail businesses in what others have produced such as tomato, onion, sweet potato and vegetables in season. Sweet potatoes are commonly grown by respondents in rural areas, mainly for household consumption, although part of the harvest might be sold. Those who grow vegetables, such as rape, sometimes sell 20 bags of rape every two weeks and selling at USD3 per bag can result in earnings up to USD60 per week. Left over rape from the sale gets eaten at the household, as it is too precious to waste or dried for future use. The study confirms that most households are faced with the worst food insecurity in January and February, when most stored food in rural areas is exhausted and the demands on the available resources increases at Christmas and needs for children returning to school in January. The study found that 89 out of 109 (82%) respondents were in extreme food insecurity in January (54) and February (35) (Table 3.3 above). February had less food insecure people because by that month, certain food crops such as pumpkin start being ready, which helps people to cope. When analysing respondents’ occupation (Table 3-5 in Annex 2) and households’ assets, the study confirmed that many assets, including livestock, were sold or consumed, and no replacement had been sourced due to lack of income. This confirms the analysis by Stillwagon (2002) that the poor sell off most movable asset such as livestock as coping strategies. The study found that in some of the poorer communities households tend to survive through exploiting nature and adopting several income generating strategies offered by their environment in order to make ends meet, for example by digging sand, burning charcoal, gardening where streams offer the opportunity (f.i. in Moomba). The study found that the frequency of many food purchases per month is interpreted by the respondents as food insecurity. Those that have less resources will not purchase sufficient food stocks to last the month. Similarly, skipping meals was an indicator of food insecurity and working in other people fields or begging from neighbours were shameful acts according to these communities. Working in other people’s fields means the client is neglecting his/her own field and will continue to be food insecure. The majority of households in Moomba have shown attempts to diversify food for their household, as they keep small vegetable gardens throughout the year to generate income to purchase food. This contributes to improved food security in an area where food production by the respondents is very low. The young people in this rural area are more involved in sand digging and selling to house builders. Charcoal burning is also a popular income generating activity, but this leaves those areas desolate and near deserts. Such activities generate extra cash for the household, which brings some food to the table and allows for the purchase of some animal protein, particularly kapenta. In most cases those who have older school drop-outs (often sons) can afford to sell sand and keep a garden at the same time, thereby facilitating the household to access other foods and some more regular animal protein like kapenta or chicken.

22
When comparing the resources available in Nasenga, this community only practiced vegetable gardening on a very small scale, probably because they started as fishing communities at the nearby Kafue River. The sand spots seemed few and not mentioned as income generating resource except by a few male respondents. The fish that had brought them into these river bank areas was almost finished due to over-fishing, and the trees are gone due to excessive charcoal burning. Most households did not call themselves fishermen and had not much access to fish for home consumption. Most respondents complained of hunger and were requesting for assistance during the time of interviews. In Nasenga we also found Plan International (an NGO) who told us that they were responsible for extending the health centre and were training the respondents on nutrition and gardening skills for increased intake of vegetables. A garden with luxuriant vegetables was growing as demonstration site next to the centre, tended by the respondents. The vegetables from this project looked healthy and if this is taken up by the respondents it could go a long way in improving the diet and incomes of these vulnerable households. The study found however that older women are tend to be left out, increasing their vulnerability, because very few can participate in gardening or charcoal burning, unless they have some money from a migrated son or daughter to hire people to cultivate their field or to engage in vegetable or charcoal retailing to raise more income. For the majority of respondents in rural areas, food access was through own production of maize and topped up with purchase and gifts from family, the church and neighbours. Most of the production (Table 3-5 in Annex 2) and analysis of the food availability calendar showed very low output that only provided food for 3-5 months. For all respondents, food security was synonymous with maize or having eaten nshima (maize porridge). They may not have good relish, but as they said, most tree leaves were good vegetables as long as they were not poisonous. Even when leaves were thought to be poisonous, respondents had developed methods of neutralizing the bitterness or poison with repeated soaking and boiling, or by adding soda bi-carbonate. In conclusion, most respondents consumed all their produce and it still was not enough. Those who sold their produce did so due to pressure of either paying off a debt or purchasing school requirements and household necessities. Those who had sold their little maize usually ended up having to purchase the same commodity at high prices from shops or neighbours later on in the non-productive lean season. 3.6 24 Hour Food Intake Recall The 24 Hour Food Intake Recall is an exercise done with individuals to recall all the food stuffs consumed within a twenty four hour period. This is categorized as breakfast, lunch and supper, with snacks indicating anything consumed between these three main meal times. Every respondent of our study participated in the 24 hour food recall exercise. The data in Table 3.4 below are summaries of different foods consumed during different times of the day by the four communities (Annex 3 provides full details). This table shows us in a snap shot what the foods consumed by the respondents from the different communities are; the most common staple for lunch and supper was nshima with vegetables (118), nshima with fish (34), nshima with beef (27), nshima and chicken (14) and nshima with pork (6). The most common break-fast food was sweet potato, buns and fritters. Some of the rural respondents in Moomba ate nshima for breakfast, lunch and supper.

23
Table 3.4: Summary 24 Hour Food Intake Recall Major Food Item Respondents food count recall
Total count Nasenga Moomba Chawama Chelstone
Sweet potatoes + tea 36 6 12 1 16
Buns /bread/fritters + tea 50 2 9 5 34
Nshima/ vegetables 118 38 40 4 36
Nshima with fish 34 5 6 4 11
Nshima and chicken 14 2 1 - 11
Nshima + pork 6 - 2 - 4
Nshima + beef 27 - 5 - 22
Porridge /nuts 13 4 4 1 1
The results from Table 3.4 confirm the narrative information from the study that fish was the most accessible animal protein, followed by chicken and then beef. Kapenta is the most accessible animal protein due to its low cost and being able to be measured in all sizes unlike other sources of protein. However, kapenta was found to be eaten less frequently. Kapenta was also cooked in groundnut sauce in order to extend the small amount of fish. If fish was small, particularly dry fish, the respondents would cook it until the bones were soft and then add a large amount of vegetables such as cabbage, pumpkin leaves, onion, tomato and oil if available, to make the vegetables taste like fish. An SPSS trend analysis showed that a higher number of people consume processed (mostly dried) fish (N=104) compared to fresh fish (N=39). Nasenga was no exception, although this area is located by the river side, where one would assume people to have more access to fresh fish. Respondents from Nasenga community said fish had actually reduced in the Kafue River and most residents of this area had relocated to specific fishing areas, while others remained and intermixed with the local people. Very few people in Nasenga were found to be in the business of fishing. Those who were, reported to sell most of their catch to maximize income. These fisher folk would not consume the fish they catch, except when some fish return from the market unsold. These might be reasons for low fish consumption in this area. 3.7 Body Mass Index comparison by target area
Body Mass Index (BMI) is a common measure of whether a client is malnourished or over nourished. Under normal circumstances, a BMI of 21-24 is said to be ideal (adequate weight for height), 20-19 is normal but tending toward underweight, and 18 and below indicates malnutrition. On the higher side of the scale, 25-29 indicates overweight, and above 30 indicates obesity. Though the measure of BMI by community was not statistically significant because of the low numbers of respondents to satisfy the Pearson’s’ Chi square or the less stringent Fishers test for association (SPSS, 2006), we observed a slight association (P>0.12), moving the majority of the rural respondents towards “thin” as more respondents had lower BMI. For the results in the peri-urban areas, there was a tendency towards “obese”. Caution in interpreting this data is required however, in that in the continuous poor health condition these respondents live in, it’s possible to mistake swelling of the client with obesity.

24
Table 3.5: Body Mass Index and Food Null hypothesis Fisher Exact
Test statistic
Df p value Comment
19.1 There is no association between BMI and how often food was bought
10.134 3 0.011 Reject
19.2 There is no association between BMI and how often one run out of food
1.484 2 0.530 Accept
19.3 There is no association between BMI and inadequate meals
1.282 3 0.733 Accept
19.4 There is no association between BMI and running out of food
3.944 3 0.285 Accept
19.5 There is no association between BMI and skipping meals
4.930 3 0.178 Accept
19.6 There is no association between BMI and resorting to wild/uncultivated foods
1.256 3 0.952 Accept
19.7 There is no association between BMI and getting food on credit
2.478 2 0.293 Accept
19.8 There is no association between BMI and borrowing food
1.220 2 1.000 Accept
19.9 There is no association between BMI and sleeping without a meal
3.985 3 0.223 Accept
19.10 There is no association between BMI and eating nshima (without relish)
2.672 2 0.378 Accept
19.11 There is no association between BMI and *performing a shameful act to obtain food
4.424 2 0.124 Accept
NB: the alpha=0.05; *Performing a shameful act was translated as begging neighbours/strangers for food or money to buy food.
There were many parameters studied under food security and associations were drawn looking at BMI, Occupations, Education and fish intake. The results in table 3.5 above show a highly significant (P>0.01) relationship between BMI and frequent purchase of staple food. This means that households that purchase food regularly were very food insecure; whenever they had resources they would buy food that would last probably a few days and then they would need to buy again. Although skipping meals and performing a shameful act were not significant at a probability of P> 0.17 and P> 0.12 respectively, probably if our client sample numbers had been higher, it could have been more significant that low food security households do skip meals and low food security would be associated with coping strategies such as begging, working for food, or even engaging in high risk sexual behaviours for access to food. In this case respondents felt begging the neighbour or working for food was shameful and skipping a meal would be better, but normally if they have small children they had no choice but to do everything possible to feed their families.
3.8 Who eats first? The study showed that most families (82 households) eat together; mother, father and children, followed by the children eating first (22 households) and the father eating first (14 households) (Fig. 3.3 below).

25
Figure 3.3: Intra-household food pattern: who eats first?
Most families in both rural and urban areas eat together; mother, father and children. And innovatively, it was noted that everyone picks their food onto their own plate so that the slow children will still have time to eat their meal. Some respondents mentioned that when food supply is low, they feed the children first to full capacity and the parents eat leftovers. A few households, especially in the rural communities, mentioned that the fathers were given food alone or with their male peers when present or when they came home late from work, and the wife and children had to eat separately. The women were also quick to disclose that when they feed the male alone, they are bound to give them more food, particularly animal protein if available. It was also noted that most of the patients within a household were not segregated. If somebody ate alone, this was because he/she ate slowly and was given food at varying times compared to the rest of the family. The study found that some of the positive changes of eating together, or giving all family members a separate plate or feeding children first have come through community training on food equity among family members, although a few (13 people) remnant households practice more traditional unequal intra-household food distribution. 3.9 Fish consumption and preparation The intake of fish and fish types varied among the respondents in the different target areas. The most common fish consumed was kapenta which the respondents said was cheaper and easily accessible. On preference, the majority of respondents said they preferred fresh and dried bream as first choice source of protein. However, they said they can rarely afford to buy bream (tilapia) because it is too expensive and not easy to share among a large family. All the respondents presented the same process for cleaning large fresh fish before cooking. The fresh fish is cleaned by removing gills, intestines, scales, and washed in clean water. The fish is then boiled whole or cut in half in a sauce pan with water, a little oil, tomato and onion if available. The cleaned fresh fish can also be fried in cooking oil and gravy made from fried chopped tomato and onion.

26
Preparation of dry fish for cooking appeared to be similar among most respondents from the different study areas. Some respondents stated that they wash the dry fish with warm or cold water, while others stated that they first clean the dry fish by removing gills and excess scales. The dry fish was then washed in warm water and boiled in water as a whole or cut in half or in several pieces to fit in the pot. Cooking oil, tomato and onion can be added when available. Another method of preparation includes washing the dry fish, allowing it to soak a little, rub it with salt and roast it over a charcoal fire or on a grill, or fry it in a pan. Dried fish can be boiled with different types of vegetables as extenders. Preparation of small fresh fish (kapenta) was done in the same manner by all respondents; removing scales, gills and intestines, then washing it in cold water, sun-dry it partially (in case it is sunny and they have time to wait) and then pan-fry. Some respondents (12 people) indicated that if the fish are too small they just wash them and fry them directly. Others (23 people) said they wash the small fish in cold water, boil them and add pounded groundnuts to thicken the gravy, or add oil, tomatoes and onion (when available) to improve the taste. Some respondents said they wash the fish in warm water and remove the intestines to reduce bitterness. When it is fried or cooked without cooking oil it is called “ukukwangula” meaning plain frying or cooking without oil and also exemplifies poverty or not being able to afford basic cooking oil. Some respondents said they do remove scales, gills, fins and intestines from small fresh fish, particularly the bigger ones. Five of the respondents in the study said they do not eat kapenta (small fish) because they develop body rashes from them, but this was not found in other respondents. Others said they simply had not eaten kapenta in a long time. Fish powder supplementation was received by some respondents living with HIV/AIDS, under the project by the Kenneth Kaunda Children Africa Foundation (KKCAF): “Nutrition supplementation to improve the response of HIV/AIDS patients to treatment”. KKCAF had provided these respondents with one kilogram of kapenta every month or 500 grams of fish powder every fortnight and a bottle of 750mls of cooking oil. This project had come to an end in February 2008 according to the respondents. In Nasenga and Moomba very few people who had received fish powder were still attending their respective clinic. Those who did receive the KKCAF supplements explained that they mixed the fish powder with pounded groundnuts and added to porridge or used it as sauce for nshima. Some added the powder to vegetables, which made it taste like dried fish with vegetables. The respondents at Chelstone had never received fish supplementation from external sources, including the clinic, as they expressed: “I have never prepared or seen fish powder” and “I do not eat fish powder“. However, they have been given donations of beans, maize and soya beans/powder. None of the interviewed respondents in Chawama had ever handled or prepared any fish powder. One elderly client of Moomba said that when her children were young, the under-five clinic advised them to pound dry kapenta and add it to children’s porridge for the prevention of malnutrition. The study did not find evidence that these practices still exist. 3.10 Preference for fresh and processed fish Fisher’s Exact Test in SPSS was not significant P> 0.11. Table 3.6 below shows a trend that a higher number of people prefer to consume processed (mostly dried) fish compared to fresh fish; 104 compared to 39 respectively. Respondents from Nasenga community next to the Kafue river was no exception, although one would assume these people to have more access to fresh fish.

27
They also indicated fresh fish was prepared immediately when they reached home, whatever remained was dried for easy storage and retail. Table 3.6: Preference for fresh fish compared to processed fish by target area
Target area 20.5a Preference between fresh or
processed fish
Total
processed Fresh
Nansenga Count 31 5 36
Chelstone Count 43 17 60
Moomba Count 24 12 36
Chawama Count 6 5 11
Total 104 39 143
Most of the respondents in all four target communities, when asked what fish they preferred, indicated to prefer large fish over small fish (135 vs. 9), as shown in Table 3.7 below. Table 3.7: Preferred size of fish by target area
Target area Size of fish preferred Total
large Small
Nansenga Count 32 4 36
Chelstone Count 57 4 61
Moomba Count 35 1 36
Chawama Count 11 0 11
Total 135 9 144

28
3.11 Treatment received by respondents All respondents interviewed in this study were on some kind of treatment by their respective clinics. The treatment that was being received by the respondents was 78% Anti-Retroviral Therapy (ART), 17.3% were those who had just started and had been put on antibiotics, the rest (4.7%) were on vitamin and some on headache tablets, as shown in figure 4.5 below. Figure 3.4: Respondents’ treatment regimen
3.12 Source of medicine When respondents are not well, 57.5% indicated that they tried home remedies before going to the clinic. Others went to the clinic directly (37.5%), while only 5% of respondents went to the pharmacy as first source of medicine (Table 3.8 below). Table 3.8: Source of medicine
Frequency Percent Valid
Percent
Cumulative
Percent
Valid home remedy 23 15.9 57.5 57.5
Clinic 15 10.3 37.5 95.0
Pharmacy 2 1.4 5.0 100.0
Total 40 27.6 100.0
Missing System 105 72.4
Total 145 100.0

29
3.13 Relationship between education level and source of treatment There was a slight relationship, though not significant, between education level and source of treatment; most respondents who had received some education got their medicines from the clinic (43 households), while those with no or very little education (1-7 years) were more likely to turn to home remedies (22 households) for ailments (Table 3.9 below). Table 3.9: Education level and source of treatment
Education level * source of treatment – cross tabulation Source of treatment Total
home remedy
clinic pharmacy
Education level 0 5 5 0 10
1-7 years 9 26 2 37
8-12 years 7 11 3 21
13+ 1 1 0 2
Total Count 22 43 5 70
From those respondents who had been to school (even at the lowest level of grade 1-7) as many as 60% went to the clinic for treatment. But the remaining 40% also included quite a number who had been to school seeking home remedies. Some respondents (8) mentioned that most times they feel too sick to go to the clinic, which is when they try some home remedy to cure the ailment. The study also found evidence that some respondents are trying all kinds of remedies that others have claimed to be working, just not to miss an opportunity to find a cure or to get better.
3.14 Common child ailments The study found the following diseases and ailments to be common among children in Nasenga: diarrhoea, fever, swollen navel, malaria, coughs, worms, TB, HIV, and meningitis. Respondents in Nasenga mentioned diarrhoea, fever and malaria as the most common illnesses among children. Most (80%) young children of patients living with HIV/AIDS were also positive and were undergoing the same treatment as their parents. Common child ailments observed in Moomba were similar to Nasenga but also included epilepsy, measles, problems with legs, persistent respiratory infections, rash on feet and legs, chicken pox, headaches, and eye problems. Respondents mentioned respiratory infections, malaria and diarrhoea as most frequent diseases in children. A few of the respondents had no children, either because they never had any or they had died. Child ailments reported in Chelstone included coughing, sneezing, malaria, rash, pneumonia, tonsils, measles, chicken pox, warts, vomiting, diarrhoea, leg aches, pus in ears, allergies on eyes, sores, flu, and stomach pain. In Chawama, child ailments included: Tuberculosis, meningitis, bronchitis, body sores, and malaria. The most common illnesses were; diarrhoea, respiratory infections (coughing, sneezing, flu), malaria, and vomiting. In some households, the children would be suffering from different ailments at the same time, others were sick continuously from one illness to another and looked frail and weak. One parent mentioned that her child had suffered a series of illnesses, such as pneumonia, tonsils, warts, regular

30
diarrhoea, vomiting and coughing. A few households had children that were rarely sick and were not living with HIV. In cases where children had been on treatment long enough, they were said to have improved greatly; from being sick all the time to being sick “sometimes”. In the four target areas, the majority of children were said to have died of common curable diseases like malaria, TB, diarrhoea, respiratory infections, as mentioned by Grellier and Omaru (2008) who included side effects of drugs. This study found a sad reality of 58 children having died out of 94 children recorded by the respondents, showing an extremely high mortality rate in children exposed to HIV/AIDS. Most ailments seem to have their roots in chronic malnutrition, low energy, low protein and low micronutrient intake, which seem to be confirmed by the low BMI measured among our poorer respondents. This result is in line with the statement of Ceasay et. al. (1997) who found that children who got sick and eventually died were often not tested for HIV/AIDS, hence no treatment was prescribed to save these children. Respondents who lost their children were tested and started on drugs. They admitted that if they had listened to advice, they would have taken their child for VCT and he/she would probably still be alive. A few respondents were found to have taken their child for VCT and noted their happiness to see the change in their children’s health. 3.15 Reasons for child deaths
The most common causes of death in children in all sites were diarrhoea, malaria, fever, and still births (Table 3.10 below, and further details in Table 16 Annex 3). The total number of children born to all respondents was 94, of whom 58 (or 62%) were found to have passed away. Table 3.10: Causes of child death
Reported cause of death N %
Malaria 5 5.3
Diarrhoea & vomiting 8 8.5
Respiratory Infection 14 14.9
Still Births 12 12.8
Other ailments (head/stomach-ache, malnutrition, not known)
12 12.8
Respiratory infection (14,9%), still births (12.8%) and diarrhoea (8.5%) were found to be the major causes of death among children. The relatively high number of women with miscarriages, pre-term deliveries and still births (N=12) confirms the statement by Brocklehurst (1998) that such child deaths are mainly due to poor nutrition, increasing the failure to maintain the foetus in the womb. The reasons for children passing away due to the various diseases were found to have varying durations of illness (Table 3.11 below).
Table 3.11: Duration of ailment before death of child (in all sites) Reason of child’s death Duration of ailment
Malaria 2 – 30 days
Meningitis 5 days
Anaemia 2 years
Fever 3 – 14 days
Vomiting and diarrhoea 1 day – 1 year
Vomiting and diarrhoea 7 days

31
Other causes of death in children as reported by respondents included swelling of legs, TB, headache and body ache, and unknown cause of death. In Moomba respondents mentioned additional diseases leading to child death; combinations of fever and cough, abnormal rash, epilepsy, cancer, stillbirth, miscarriage and dysentery. The ages of the deceased children ranged from one year to 26 years of age. 3.16 Nutrition information and education When analysing the nutrition education received, 22 out of 38 respondents in Nasenga reported to have received nutrition information or education from nurses, KKCAF, OPAD, Plan International, or Counsellors from Kafue Gorge. Five respondents said they had never been informed about nutrition to assist them in living positively with HIV/AIDS. The remaining 11 could not remember if they had received any form of nutrition education. One remembered being told to eat vegetables such as bondwe (amaranthus) and pumpkin leaves (Chibwabwa) in order to improve the CD4 count by a nurse from the clinic. In Moomba, the majority of the respondents had received nutrition information and education from various care givers, counsellors and doctors. The sources that provided nutrition information and education varied from client to client. Some mentioned KKCAF who was giving clinical and nutrition care before 2008; Matero Home Based care centre after 2008; Golden Valley Agricultural Research Trust in 2009; Chingwere Health Centre where they are being referred to because they no longer have a doctor; a group called “Back to Eden” Seventh Day Adventist (SDA) Church; and Home Based Care counsellors at Moomba Rural Home Based Care Centre itself. In Chelstone, 23 out of 62 respondents said they had not received any nutrition information or education. The remaining 39 respondents stated that they had received nutrition information from the nurses and clinic volunteer counsellors. The study found that meeting counsellors and health workers giving health related advice was perceived to be very encouraging for respondents in the peri urban health centres. In the areas Chelstone and Chawama, before a client receives their medication for the week, health staff and volunteers give informative talks on positive living, good nutrition, hygiene and many other issues. Advisory materials, written in simple English and some in local languages were also distributed during such information meetings. However, in the rural areas it was mostly NGOs who provided this kind of information. The Home Based Care Centre in Moomba has some older counsellors who were found to be very dedicated to their respondents, even in the absence of drugs or any medical help, but who needed updated information and other technical assistance to better serve their respondents. Most of the nutrition talks they could remember were by KKCAF and from the lead researcher when she had accompanied the KKCAF team on their earlier HIV/AIDS nutrition support project (Kaunda et. al., 2008). The study found that the messages and information provided through nutrition education varied between the target sites, indicating inconsistency and possible confusion about the correct behaviours to adopt regarding nutrition and positive living. However, some of the basic messages were correct. In Nasenga the respondents were advised to eat vitamin-containing foods like vegetables with oil, to add pounded peanuts and fruits, and to eat high protein foods such as fish (kapenta). A few years ago, some respondents used to receive High Energy and Protein foods (HEPS) for adding when cooking porridge. They were also advised to eat a balanced diet

32
every day. Those who had attended Mazabuka clinic were counselled by the Organic Agricultural Production of Zambia (OPAZ) to eat rape or other vegetables with groundnuts, high energy and protein-rich foods, to balance their diet and for body building, and to eat healthy foods like fruits and carrots. In Moomba, respondents were told to observe hygiene and to have a balanced nutrition. They were discouraged to eat a lot of meat, but were advised to eat more vegetables rich in vitamins and minerals to protect them from ailments and eat protein rich kapenta for growth of cells. Also, they were encouraged to eat a lot of fruit and to eat warm food. Although this is encouraging that important nutritional information does reach different target areas, it is important to note that it would require constant assistance from nutritionists to update this information for those that work with people living with HIV/AIDS. The nutrition related messages the respondents in Chelstone remembered, include the following:
• Eat a lot of vegetables, fruits and energy giving foods;
• Avoid alcohol, oily foods, also okra with soda, because it reduces the CD4 count, and eat a lot of vegetables;
• Eat vegetables mixed with groundnuts, fruits like apples and oranges, for good health;
• Pregnant women should eat a lot of bondwe (amaranthus) to help build blood;
• To eat fish, fruits and vegetables for good health;
• Drink tea with milk, porridge with ground nuts;
• Eat vegetables and fish, add groundnuts to the relish;
• Eat kapenta and beans frequently;
• Eat balanced diets, meat, fruits and vegetables;
• Mix food with groundnuts, boil fish don’t fry, eat fruits and other blood giving foods and vegetables too;
• Make sure you eat before taking medication;
• Eat clean and warm food.
In Chawama, every time the respondents would come to the clinic, the nurses and counsellors teach them on eating balanced diets and to observe good hygiene. The respondents were encouraged to eat a lot of vegetables, beans, kapenta and not just meat. Powdered groundnuts should be added to vegetables and to porridge, as this was said to be good for blood formation. Soda drinks were not healthy, but sour milk, fruits, oil and butter should be used in moderation for increasing energy. The most limiting factor to nutrition education was that most of the poor respondents said they were not able to follow up on the nutrition advice, as they did not have the required food items to eat well. The study found a disparity in nutrition information and education between the rural and the peri-urban target areas. The rural areas had few people that went to give nutritional talks; hence few respondents could remember the messages. The research team moreover observed that the health workers were so overworked that they did not have the time or energy to talk to respondents on nutritional matters. On the other hand, in peri-urban areas there were many volunteers and experts in nutrition, with various skills, whom volunteered to talk to the respondents while they waited for the clinical staff for their treatment.

33
3.17 Limitations to the analysis The data on the following parameters: migration, asset ownership, personal habits, personal health problems, physical activity, children alive, water sources, water quality, cooking fuel sources, and food consumption factors could not be analyzed due to sample limitation; samples were too small and/or answers were too diverse to analyse and find trends. Such questions would require a larger sample population of at least 200 to 500 respondents contributing to each aspect of a question, but the largest interviewed community at the four target areas of this study had only 62 respondents.

34
4 Conclusion and recommendations Tentatively, the authors draw the following conclusions from this study, although it is recognized that it needs much stronger data sets and further research in different contexts. The results of this baseline study on nutrition and food security and fish consumption among respondents affected by HIV/AIDS demonstrated the importance of having a steady source of livelihoods and food accessibility for survival. Most rural households and some peri-urban households without regular income were found to be more vulnerable to food insecurity (they could not afford nutritious foods like fish) and poor health as a consequence. Most female headed households were found to be food insecure, and those that were better able to cope had children or relatives to send help or to come and look after them, although such cases were very few. Fish is the most preferred source of protein, with kapenta (small dried fish) being the most commonly consumed animal protein, although not consumed in large quantities. However, access to fish depends on availability of cash and most people living with HIV/AIDS are the poorest of the poor without a regular income to even afford frequent consumption of kapenta. Kapenta was more accessible due to its easy availability and lower cost. Respondents are also able to buy it in small affordable quantities and extend it with vegetables. However, real quantitative intake seemed to be low due to intra household sharing among the household members. Thorough research on actual intake of protein and other foods per household member is required to establish accurate data. Analysis of home food production showed that the respondents of this study had no means to improve their productivity and their harvests were too small to provide food for the household the whole year round. In fact, food was the major vulnerability factor for these households. Generally, the respondent’s food intake is lower as seen by their low Body Mass Index (BMI), and in the rural areas, weight is on the lower side, which renders these respondents vulnerable to opportunistic infections as seen by the long list of infections reported. Analyzing food availability showed a significant relationship between the types of food available and the respondents’ capacity to purchase food several times in a month. Having little profit from the sale of their vegetables or coping strategies could be a reason for not having enough income to purchase a large quantity of food at once. Those who earned a bit more purchased food once or twice only in a month and were found to be able to afford some variety on relish. Nshima is the major staple for all respondents, and they interpreted “being food secure” with eating this traditional Zambian maize meal 2 to 3 times per day. The study confirmed that rural households were much poorer than peri-urban households, based on occupation, income and individual household asset ownership. Most of the rural respondents do not have production assets and did not own livestock, or even chickens; their livelihood depended solely on their human power, and without tools, even that is not effective. Very few respondents owned a radio, bed and mattress, or a dining set. Their health status, combined with low income and low asset ownership contributes to a vicious cycle of chronic hunger and food insecurity. In peri-urban areas, the study however also found some very poor households that are food insecure, particularly, those who had lost their jobs; these respondents are constantly worried about their next meal and under pressure to find decent accommodation and pay rent, resulting in less money for nutritious foods. Poverty in the peri-urban areas seemed to make the respondents more desperate than in the rural areas where they could eventually go into the bush

35
and pick certain forest products for consumption. But both rural and peri-urban respondents live in unacceptable poor and food insecure situations. Due to non-availability of food at household level, most of the respondents cannot practice the well intended training and information on nutrition which they have received at their respective health centre. A variety of nutrition information is given, but a disparity in nutrition information and education between the rural and the peri-urban target areas was noted. Information provided included the importance of good nutrition and examples of what people living with HIV/AIDS should eat or avoid consuming. Many NGOs and individual volunteers do provide information and educate the respondents on nutrition, more so in peri-urban clinics than in rural clinics, but this is not useful without having food. Due to the small size of this pilot study, the research team was not able to show strong positive statistical associations of the parameters of fish consumption and food insecurity. The qualitative and quantitative data gathered has provided an insight into the often desperate food insecurity and poverty faced by rural and peri-urban households where one or more household members are living with HIV/AIDS. Based on our findings, the following are key recommendations:
• Donor agencies should, through the Ministry of Livestock and Fisheries Development and the WorldFish Center, fund a larger study on fish and food consumption among people living with and affected by HIV/AIDS in Zambia. Such a study should include a variety of target groups and control groups. This is needed to confirm findings from this pilot study and to establish stronger and more significant results as the basis for nutrition interventions, in particular recommendations on fish supplementation.
• Statistically planned research on the effects of fish and fish supplementation level requirements for various stages of HIV/AIDS and ART adherence are needed in order to provide accurate information and recommendations on the quantity of kapenta or other fish varieties are required for positive impact on the treatment of people living with HIV/AIDS.
• Further research is needed on the most effective interventions that provide income generating activities for people living with HIV/AIDS who are still strong enough to work, such as the potential of small scale aquaculture.
• Social cash transfers and other social protection measures are urgently needed by government and NGOs to assist the most destitute vulnerable households in both peri-urban and rural areas to improve their food and nutritional security.
• Provision of fish supplements at the clinic, combined with adequate nutrition education, to respondents living with HIV/AIDS should be standard practice.
• There is need to establish baseline information on the nutritional and food security status and fish consumption levels of fisher folk and fish traders in different fisheries in Zambia, specifically those living with HIV/AIDS. Further insights are needed into seasonal food insecurity in fish-dependent communities and assessments of potentials for livelihood diversification in such communities.

36
References
Banda Nyirenda, D. B., Hüsken, S.M.C. and Kaunda, W. (2009). The Impact of Nutrition and Fish Supplementation on the Response to Anti Retroviral Therapy in Zambia. A literature Review. Regional Programme Fisheries and HIV/AIDS in Africa. Project report published by World Fish Center. Brocklehurst, P. & French, R. (1998). The association between maternal HIV infection and
perinatal outcome: a systematic review of the literature and meta-analysis. British Journal of Obstetric Gynaecology. 105:836-848.
Catholic Relief Services (2008). Evaluation report on HIV/AIDS patients’ response to RUTF supplementation by Valid International in health care centres.
Ceasay, S. M., Prentice, A.M., Cole, T.J., Foord, F., Weaver, L.T., Poskitt, E.M. and Whitehead, R.G. (1997). Effects on birth weight and perinatal mortality of maternal dietary supplements in rural Gambia: 5 year randomised controlled trail. British Medical Journal. 315:786-790.
FAO (2002). Living well with HIV/AIDS. A manual on nutritional care and support for people living with HIV/AIDS. Joint publication with World Health Organization. Rome, Italy.
FAO (2008). Composition of fish: www.fao.org/fishery/topic/12318. Gillespie, S. (2006). AIDS, poverty and hunger: an overview. In S. Gillespie. (ed.) Aids, Poverty
and Hunger: Challenges and responses. Washington: IFPRI. pp. 1- 32. Gillespie, S.R., and Kadiyala, S. (2005). HIV/AIDS and food and nutrition security: from evidence to action. Washington D.C.: IFPRI. Food Policy Review No. 7.
<http://www.ifpri.org/pubs/fpreview/pv07/pv07.pdf>. Grellier, R., and Omuru, E. (2008). The potential impact of HIV and AIDS on agricultural
systems and nutrition in Papua New Guinea Options. Draft report. 72 plus annexes pp. Kaunda, W., Chizyuka, M. and Phiri, M. (2008). The possible role of medicinal mushrooms and
kapenta in wound healing: A preliminary Zambian Study. Meyer, S.A. (2000). Nutritional Care and People Living With HIV. Arizona Dietetics
Association. Mesa Arizona. National Academy of Sciences (1989). Recommended Dietary Allowances 10th ed. 1989
National Academy Press Washington, DC. National Food and Nutrition Commission (2004). Nutrition Guidelines for care and support of
people living with HIV/AIDS. Ministry of Health publication, Zambia. Piwoz, E.G., and Bentley, M.E. (2005). Women’s Voices, Women’s Choices: The Challenges of
Nutrition and HIV/AIDS. J. Nutrition. 135:933-937. Stillwaggon, E. (2002). HIV/AIDS in Africa: Fertile Terrain. Journal of Development Studies. 38 (6): 1-22. Te Lintelo, D. (2008). Food security, nutrition and HIV/AIDS in African fisheries: emerging
evidence and research directions. Literature review. Regional Programme Fisheries and HIV/AIDS in Africa. Project Report published by the WorldFish Center.
UNAIDS (2008). HIV, Food Security and Nutrition. UNAIDS Policy Brief. World Health Organization (WHO) (2003). Nutrient requirements for people living with
HIV/AIDS. Report of a Technical Consultation. May 13-15, 2003. WHO, Geneva, Switzerland.

21062010 WFC Baseline Survey DBN 37
ANNEXES
Annex 1: Detailed baseline questionnaire
Baseline interview questionnaire on the impact of fish on
respondents on ART
Baseline Questionnaire on
Food and Nutrition Security and Fish Consumption among men, women and
children Living HIV/AIDS and on Treatment
Respondent Number: ___________ Gender__________
Purpose: of Study: The Questions we will ask you are about your background, the foods you eat and how you and your household are making a living. It will help us to understand your nutritional status.
Confidentiality: This information will be kept confidential together with your clinical files and will be used to assist in your medical programme. In our analysis, no reference will be made to your name and your identity will not be revealed. Participation in this research is completely voluntarily.
Consent Form: All participants in this trial will be required to give informed consent and sign an informed consent form (attached)
1. BASIC PATIENT INFORMATION
a. Anthropometric data
Weight………………………………
Height…………………………………….
Mid Arm Circumference………………………
Date of Measurement …..……………………………..
b. Please tell me about yourself as regards the following:
Marital status: …….…… Age: ………………… Education level: ……………
Place of birth …………………….... Ethnicity/Tribe: …………………………….

21062010 WFC Baseline Survey DBN 38
Informed Consent Form on Baseline Study on: Food and Nutrition Security
and Fish Consumption among men, women and children Living HIV/AIDS
and on Treatment
Date: ___________ Interviewer: _____________________________
1 District: ________________________
2. Name of Health Centre______________________
3. Village/Compound of residence: ________________________________
4. Respondent’s Number: ______________________________
a. Purpose: The Questions I will ask you are about your background, the foods
you eat and how you and your household are making a living. It will help us to
understand your nutritional status.
b. The study will be free of charge, and it is intended to provide us with
information that will assist in how to manage the nutrition status of those not well.
c. The results will be of benefit to your condition and those of others suffering
from HIV/AIDS. Answers to the questions will also, help policy makers to make
informed knowledgeable plans on treatment
d. Confidentiality: This information will be kept confidential together with your
clinical files and will be used to assist in your medical programme. In our data
analysis and reporting of results, no reference will be made to your name and
your identity will not be revealed. Participation in this research is completely
voluntarily. These statements will be made in the language of the patient.
Consent given: I…………………………………………, I have been informed
and do understand the purpose of this research and I give my full consent to
participate in this project.
Signature…………………………………………Date: …………………………….

21062010 WFC Baseline Survey DBN 39
5. Table 1: Please tell me more about members in the household that you live in
and how these are related to you?
No. Name Position in
Family e.g.
Head, spouse,
child=3,
dependent=4
Age
Sex M=1
or F=2
*Marital
Status
M=1,
W=2,
S=3 &
D=4
Education Level /
Skill
=grade level 1- 12;
Cert=13;
Diploma=14; 1st
Degree=16,
Masters=18
List Occupation
Formal=1; Farming =2;
Fishing=3; Business=4;
Artisan=5; Other=6
1
2
3
4
5
M= Married, W=Widowed, S= Single, D= Divorced
6. Table 2: Tell me more about your Occupation (s) listed above and Source(s) of
Income or livelihood
Occupation Details Monthly income or
other
Formal work =1
Farming (ha/yr)=2
Fishing (Kg catch/wk) =3
Business =4
Artisan (Black smith) =5
Other (e.g. beer brewing)=6
7. Table 3: Migration: Did any person (s) come to live in your household in the last
5 years (visiting for more than 2months)? Yes=1 /No=0
Person 1 Person 2 Person 3
Where did this person come from? Village=1; Town=2
Why did this person come to join you? Dependent=1, to help=2; Looking for work=3; Other=4
How are you related to this person? Son=1 Daughter=2 orphan=3; other=4
How do they affect food availability at HH level? Reduce FS=1; Do they assist in procuring food? Improve=2

21062010 WFC Baseline Survey DBN 40
8. Table 4: Did any person leave your household in the last 5 years? Yes=1 /
No=0 (circle one)
Explanation Person 1 Person 2 Person 3
Why did this person leave? Work=1; School=2; Married=3; Chased=4; other=5
Where did this person go to? Village=1; Town=2; Live with other family=3; Other=4
If working elsewhere, does this person send you money/food? Yes=1/ No=0
How much does this person send you (roughly in Zambia Kwacha) Make estimate
How frequent does this person send you the assistance? Monthly=1; once in a while=2; never=3
9. For Household head or adult patient
Table 5: Complete the table below on assets owned in House hold
Name & list assets Yours
(1)
Co-owned
(2)
Rented
( 3)
Number
owned
Source (own,
inherited, other)
Property (List Fixed assets; e.g. house, land)
List Major House Hold goods
List Livestock
List Farm /Fishing Implements:
List other property
What main material is used to build the wall of main living house?
Wood=1; mud bricks=2; Concrete=3; Pan bricks/tiles=4; other=5
What materials are used to build the roof of your main living house?
Wood and grass=1; decorative thatch=2; tin=3; Asbestos = 4; Tiles=5; other=6
What materials are used to build the
floor of your main living house? Mud=1; concrete=2; Tiles=3

21062010 WFC Baseline Survey DBN 41
For Example:
Property: House (s), Farm land, Shops, hammer mill, car, tractor, Bicycle,
Livestock: Chickens, Goats, Cattle, Pigs, Ducks, Sheep, Other
Farm /Fishing Implements: Plough, Ox/donkey cart, Irrigation equipment, Hoe (s), Fishing Boat/canoe
House Hold goods: Bed & mattress, Radio, TV, Sofas, Table and chairs, Electricity, Solar Panel, Telephone, Mobile phone: Other.
10. Personal Habits (that may disqualify a participant)
Table 6: Frequency of smoking and smoking and current situation
Habits Yes (1)or
No (2)
(1)
Daily
(how
many
times) (3)
Every
other
/week (4)
1/week
(5)
1/month
(6)
A few
times/yr
(7)
Do you smoke/type? E.g. Kaponda (home grown and rolled) cigarettes, snuff, other.
Do you drink alcohol/type? Chibuku or opaque beer, Hard liquor, Kachasu
If stopped, when?
Why did you stop?
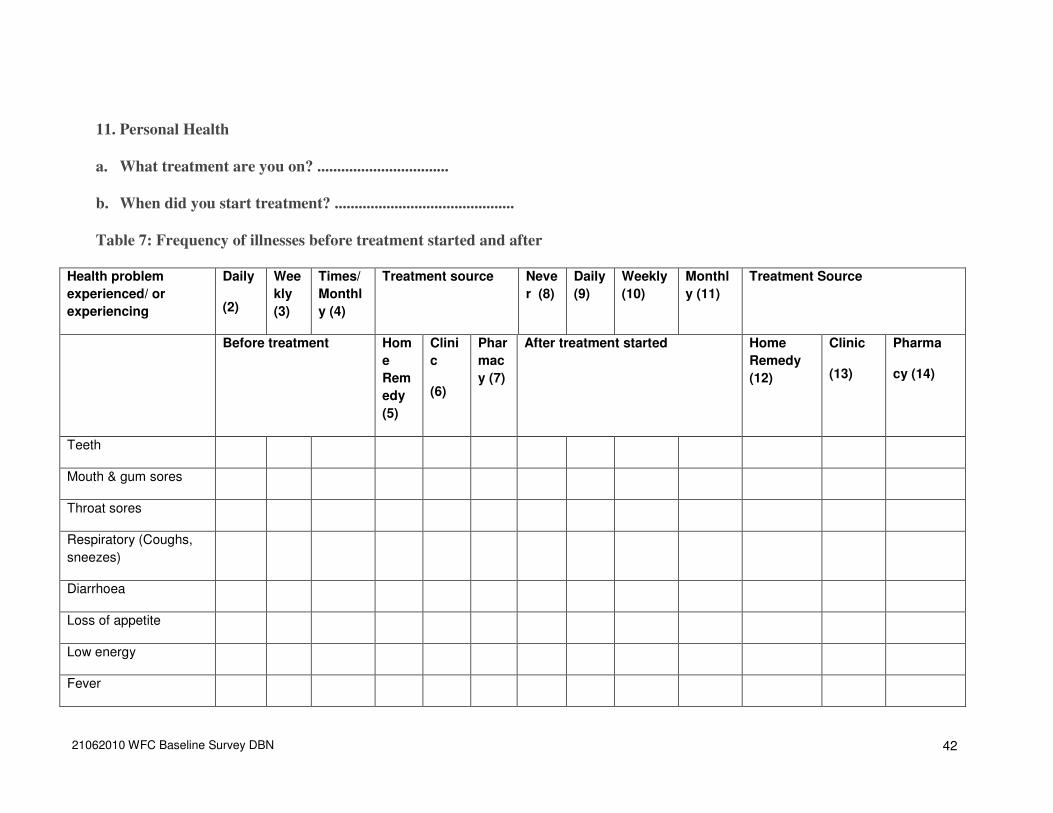
21062010 WFC Baseline Survey DBN 42
11. Personal Health
a. What treatment are you on? .................................
b. When did you start treatment? .............................................
Table 7: Frequency of illnesses before treatment started and after
Health problem
experienced/ or
experiencing
Daily
(2)
Wee
kly
(3)
Times/
Monthl
y (4)
Treatment source Neve
r (8)
Daily
(9)
Weekly
(10)
Monthl
y (11)
Treatment Source
Before treatment Hom
e
Rem
edy
(5)
Clini
c
(6)
Phar
mac
y (7)
After treatment started Home
Remedy
(12)
Clinic
(13)
Pharma
cy (14)
Teeth
Mouth & gum sores
Throat sores
Respiratory (Coughs,
sneezes)
Diarrhoea
Loss of appetite
Low energy
Fever

21062010 WFC Baseline Survey DBN 43
12. Physical Activity
Table 8: Physical Activity Level Fill in the appropriate level of activity (one
level per patient
Activity
Level
Definition Level of exercise or activity
Level 4 Level 3 Level 2 Level 1 Level 0
4 Fully active; able to carry out all pre-disease activities without restriction
3 Restricted in strenuous activity, but can move & do light work
2 Can move and care for self but unable to carry out any work. Out of bed more than 50% of time
1 Capable of limited self-care, confined to bed or chair more than 50% when awake
0 Completely disabled, cannot carryout self care, confined to bed completely
Ask the patient and also use your own observation
13. Child information and health
1. How many children has your wife or you (women) given birth to in your life, both live and dead? # _______
2. Are all the children healthy? Yes=1/No=0
3. Are you or your wife breast-feeding now? Yes=1/No=0
; did you/ your wife breast feed any other children? Yes=1/No=0
Table 9: Child Breast feeding and health
Child # Year Period of breast
feeding
Most common ailments suffered by your
children
1
2
3
4
5
14. How many of your own children are still alive? # _____

21062010 WFC Baseline Survey DBN 44
Table 10: Reasons for children who passed away?
Illness Cause of death How long was illness
(wks, months, years)
Age of Child Year of
death
Long-term =1
Short-term = 2
Sudden Accident =3
Other specify = 4
15. What are the Sources, Quantity, cost and distance to water for the house hold
use?
Table 11: Sources, cost and distance to water supply?
Drinking Cooking Washing/ Bathing
Where do you obtain your water for?
Tap/borehole=3;concrete well =2; stream/river/scoop out well=1
How far is this source of water for? *
How much (if charged) do you pay per bucket of water for?
Roughly, how many buckets of water do you use in a day in your household for (20litre container size)
*How far do you travel to fetch? 1= 0.5 km; 2= 1 km; 3= 1.5km; 4=2 km; 5= 2.5 or more.

21062010 WFC Baseline Survey DBN 45
16. How would you describe the water in your area? On scale of 5 to 1, please circle:
5= V. good (clean borehole or tap) 4= good (closed well-hand pump); 3= fair (covered well); 2= poor (open well); 1= bad (down stream)
17. What are the main sources of fuel for cooking? Chose and circle those picked
1 = firewood; 2 = Charcoal; 3 = kerosene; 4 = electricity; 5 = other specify……
18. Food Availability and Distribution in the Year in the Home
This should be done in a calendar format (given below to complete) to show foods eaten at different times of the year: XXX for abundant; XX for good; and X star for low availability; 0 or nothing for not available.
Rank the main (four) staple foods in order of:
Importance (is this the major staple, i.e. maize, cassava, or relish; fish, meat …) limit to four per category.
Availability rank (of most available of most important foods)

21062010 WFC Baseline Survey DBN 46
18.1 On the main available foods in the food calendar below, answer the following questions:
a. What is the source of the most important types of foods you consume? List in order of importance on the calendar below b. Of the food you produce, how much is available in each month of the year (use X to estimate)
Quantitative Estimate: Number of Xs mark estimate of amount: XXX= highly abundant in that month; XX= just enough: X= a little still available; if nothing available use 0 or – (dash).
Table 12: What are the main food items and their availability to you in the year?
Food Item Availability in the year
Staples Jan Feb Mar April May June July Aug Sept Oct Nov Dec
Maize (rural) Maize meal( urban)
Animal food sources
Vegetables
Fruits

21062010 WFC Baseline Survey DBN 47
18.2 c. How much do you keep for home consumption? (estimate number of bags or percentage of total produce)
d. How much do you sale? (estimate number of bags or percentage of total produce)
19. House-hold Food Security
Table 13: Household Food Security (last one month)
No. Question Coding responses (circle as appropriate)
1
During the last six month, how many times
did your household
purchase mealie meal or other staple?
Never ------------- --------------------------------------- 0 If yes,
how often Rarely (1-2times a month) ------- 1 Sometimes (1-2
times a week)---- --------------------2 Often (3-4
times a week)……………………………3
Mostly (more than 5x/week)………………………4
2 During the last month, how many days did
you worry that your household would not
have enough food or worry about where
food will come from?
Never ------------- --------------------------------------- 0 If yes,
how often Rarely (1-2times a month) ------- 1 Sometimes (1-2
times a week)---- --------------------2 Often (3-4
times a week)……………………………3
Mostly (more than 5x/week)………………………4
3 During the last six month, how many times
did you or any of your household members
have to eat smaller meals than you felt you
needed because there was not enough
food?
Never ------------- --------------------------------------- 0 If yes,
how often Rarely (1-2times a month) ------- 1 Sometimes (1-2
times a week)------------------------ 2 Often (3-4
times a week)……………………………3
Mostly (more than 5x/week)………………………4
4 During the last six month, how many days
did the food stored in your home run out
and there was no money to buy more that
day?
Never ------------- ------------------------------------------ 0 If yes,
how often Rarely (1-2times a month) ---------- 1 Sometimes (1-
2 times a week)--------------------------- 2 Often (3-4 times a
week)……………………………..3 Mostly (more than
5x/week)…………………………4
5 During the last six month, how many times
did you or any of your household members
have to skip a meal because there was not
enough food
Never ------------- ------------------------------------------ 0 If yes, how
often Rarely (1-2times a month) ------- 1 Sometimes (1-2 times
a week)---- --------------------2 Often (3-4 times
a week)……………………………3 Mostly
(more than 5x/week)………………………4
6 In the last six month, did you or any of
your household members have to eat
other kinds of food which are usually not
eaten because of a lack of resources?
(For example, eating wild/uncultivated food
or eating wheat/other grains instead of
Never ------------- --------------------------------------- 0 If yes,
how often Rarely (1-2times a month) ------- 1 Sometimes (1-2
times a week)------------------------ 2 Often (3-4 times a
week)……………………………3 Mostly
(more than 5x/week)………………………4

21062010 WFC Baseline Survey DBN 48
nshima, which usually are not eaten)
No. Question Coding responses (circle as appropriate)
7 During the last six month, how many times
did your household have to take loan
(money) or credit to buy food/maize meal?
Never ------------- ----------------------------------------0 If yes,
how often Rarely (1-2times a month) ------- 1 Sometimes (1-2
times a week)------------------------ 2 Often (3-4 times a
week)……………………………3 Mostly (more than
5x/week)………………………4
8 During the last six month, how many times
did your household have to borrow
food/maize meal?
Never ------------- --------------------------------------- 0 If yes,
how often Rarely (1-2times a month) ------- 1 Sometimes (1-2
times a week)---- --------------------2 Often (3-4 times a
week)……………………………3 Mostly (more than
5x/week)………………………4
9 In the last six month, how many days did it
happen that you or any of your household
members had to go to sleep at night
hungry because there was
not enough food?
Never ------------- --------------------------------------- 0 If yes,
how often Rarely (1-2times a month) ------- 1 Sometimes (1-2
times a week)---- --------------------2 Often (3-4 times a
week)……………………………3 Mostly (more than
5x/week)………………………4
10 During the six month, how many times did
you or any members of your household
have to eat only nshima? (without relish)
Never ------------- --------------------------------------- 0 If yes,
how often Rarely (1-2times a month) ------- 1 Sometimes (1-2
times a week)---- --------------------2 Often (3-4 times a
week)……………………………3 Mostly (more than
5x/week)………………………4
11 In the last six month, in order to acquire/
manage food for your family, did any
member of your household need to
perform an act that made you feel
ashamed (i.e. beg for food, eat scavenged
food)?
Never ------------- --------------------------------------- 0 If yes,
how often Rarely (1-2times a month) ------- 1 Sometimes (1-2
times a week)---- --------------------2 Often (3-4 times a
week)……………………………3 Mostly (more than
5x/week)………………………4
12 Compared to other months, which month
do you face most food deficit?
No, we eat same as we eat in the other months------ 0 If
yes, did you: Reduce the quantity ---------------- --1 Reduce the
quality -------------------------------------- 2 Reduced both quantity
and quality---- ----------------3
13 In the last six months, has your House
hold been food insecure?
No/ Yes Month-1
---------------------- 0 1; Month-2 ----------------
------ 0 2; Month-3 ---------------------- 0 3;
Month-4 ---------------------- 0 4.Worst month was
…………………………………… 5

21062010 WFC Baseline Survey DBN 49
20 Fish and fish products
20.1 Fishing House holds
a. Are you a fisherman/woman Yes/no; Fish retailer Yes=1/No=0
Or none (circle most appropriate)?
b. What type (s) of fish do you catch or retail? (breams=1 or Kapenta=2, other=3________________)
20.2 Non Fishing house holds
a. How often in a week do you eat fish?(Circle one)
1 2 3 4 5 6 7
20.3 Table 14: Fish types, frequency and source
Fish types How many days did you eat fish in previous five days? Circle one
Where did you get it from?
a. Fresh fish 1 2 3 4 5 1. Market 2. Fishing by household members
3. given by (…………………………..)
b. Processed fish (dried, smoked)
1 2 3 4 5 1. Market 2. Fishing by household members
3. given by(……………………….)
c. Fish powder 1 2 3 4 5 1. Market 2. Fishing by household members 3. given by(…………………..)
20.4 Table 15a&b: Fish distribution within households
a. Large fish
Fish parts Who eat the most fish? (circle most appropriate)
a. head 1. Elder 2. Farther 3. Mother 4. Boys 5. Girls
b. meats 1. Elder 2. Farther 3. Mother 4. Boys 5. Girls
c. tail 1. Elder 2. Farther 3. Mother 4. Boys 5. Girls
d. Free for all 6. Anyone can pick any piece
b. Small fish and fish powder
The distribution among household members
Small fish type? 1. Evenly ; 2 some of them eat more (who? ..............................................); 3. Some of them do not eat (who? ………...……………………………………)
Fish powder 1. Evenly 2 some of them eat more (who?.............................................................................) 3. Some of them do not eat (who? …………………………………………..)

21062010 WFC Baseline Survey DBN 50
20.5 Preference
a. Do you like fresh fish or processed fish? (Circle appropriately)
1. I prefer fresh fish; 2. I prefer processed fish; 3. I don’t like fish
b. Do you like large fish or small fish?
1. I prefer large fish; 2. I prefer small fish; 3. I don’t like both
20.6 Table 16: What is the reason why you eat fish?
Fish types The reason why you ate? (Circle appropriately)
a. Large fish 1. tasty 2. cheaper 3. good for health 4. Others (..………………………………)
b. small fish 1. tasty 2. cheaper 3. good for health 4. Others (………………………………..)
b. Processed fish
1. tasty 2. cheaper 3. good for health 4. Others (………………………………..)
c. Fish powder 1. tasty 2. cheaper 3. good for health 4. Others(…………………………………)
20.7 How do you clean fish and what are popular cooking methods?
Table 17: Popular Fish cleaning and cooking methods
Fish type How do you prepare fish for cooking and how do you cook it?
a. Large fish
b. small fish
c. fish powder
20.8 How is food shared in your household?
a. Who eats first? .............................................................................
b. Who divides the portions? ……………………………………….
c. Who gets the most food? ………………………………………… .
d. Do children require special preparation of fish and why? Please explain
20.8 Who receives which piece of fish, meat or chicken?
Table 18: Sharing of animal product parts in a household (fill in: dad, mother, visitor, boy or girl child)
Piece type Chicken Meat (beef, pork, other)
Fish
Drum stick=4

21062010 WFC Baseline Survey DBN 51
Thigh=3
Back=2
Wings=4
Breast =5
Feet=6
Meat Steak= 3
Bones =2
Gravy =1
Fish Head =4
Fish Middle=3
Fish tail=2
Gravy=1
20.10 Fish supplementation from external sources:
a. Have you been or were you receiving fish supplements?
b. Who distributes it?
c. Are you still getting it?
d. What type of fish is it?
e. How much is given per visit to the centre?
f. How often do you receive fish supplements
g. Have you consumed fish powder supplements? __YES=1 or NO=0__
h. Who distributed the fish or fish powder?
i. Do you receive other food supplements? YES=1 or NO=0; if yes name…………
21. 24 Hour food Re-call
Table 19: Please can you tell me all that you ate yesterday?
Time in: List Foods Eaten
Morning breakfast
Mid morning snacks

21062010 WFC Baseline Survey DBN 52
lunch time
Afternoon snacks
Evening supper
Bedtime snacks
22. Table 20: Food Consumption Factors: Nutrition Risk Factors on
a scale of 0-3
Factor Frequency of Occurrence ( use pebbles)
Never Occasionally Most time Always
0 1 2 3
SOCIAL FACTORS
1. Eating alone?
2 Excluded from others?
3. Feed self
4. Why eat alone or excluded? Please explain.
FOOD FACTORS
5. Do you always enjoy your meal times?
6. What is your favourite relish (among fish, meat, chicken)? List in order of priority
7. How often do you get it?
8. Is the food always warm as you like it?
9. Is the food always cold for you?

53
23. Body Condition
a. Is this your normal weight? YES=1 or NO=0
b. If not, what is your normal weight?# of kg
c. When did you start losing weight?# Months, #years in months
Items (a) and (b) will be taken by the nurse from the patient’s clinical card
24. Table 21: Nutrition Information/ Education
Issue YES=1 or NO=0 When By Whom
Have you received nutrition information?
Have you received nutrition talk/counselling?
What were the main messages you received?
25. Do you have any question on the questions we have asked or anything you want to
know about this work?
________________________________________________________________
Thank you for your time and patience in answering these questions!
Your answers will help the centre serve you better.

54
Annex 2: Details of occupation and income in target areas
Table 3: Details about occupation and income in Moomba
Occupation type
Client
Income
Client
income
Other HH
Mbr Total ZMK
Client No.
Employment per House Hold per Month ZMK
per year ZMK Income/year
HH Income/yr
1 tavern owner, trades in clothes and cream doughnuts 600,000 7,200,000 0 7,200,000
2 meat trader 200,000 2,400,000 0 2,400,000
3 Farming maize (25 by 50Kg bags per year x K65,000 ), gardening (K 150,000/Mon) 150,000 1,800,000 1,625,000 3,425,000
4
Maize farming by dependants (5x50Kg/
year ) 0 0 325,000 325,000
5 Maize prod (5x50kg) & veg tomato+kalembula 100,000 1,200,000 325,000 1,525,000
6 Garden vege K150,000/mon & popcorn K50,000/m 200,000 2,400,000 0 2,400,000
7 brick laying, on contract so income varies. 0 0 0 0
8 Maize prod (30x50kg) & veg 0 0 1,950,000 1,950,000
9 Maize 10x50Kg bags/ yr, gaderning K100, 000/mon 100,000 1,200,000 650,000 1,850,000
10 Farming 4x50Kg maize and gaderning 0 0 260,000 260,000
11 Farming of maize 5X50Kg bags/yr & garden 0 0 325,000 325,000
12 Garden K100,000/mon; maize 2x90kg bags 100,000 1,200,000 130,000 1,330,000
13 Sale of vegetables k100,000/mon 100,000 1,200,000 0 1,200,000
14 Gardening vegetables get k120,000/mon 120,000 1,440,000 0 1,440,000
15 Farming and a selling charcoal. 0 0 0 0
16 Garden k700,000 and k50,000 charcoal 700,000 8,400,000 600,000 9,000,000
17 Gardening k90,000 and charcoal 90,000 1,080,000 0 1,080,000
18 Gardening k90,000/Mon, selling fritters 90,000 1,080,000 0 1,080,000
19 Farming gnuts, maize, gardening k200,000 200,000 2,400,000 0 2,400,000
20 Trader k200,000/mon, son gardener K200000/mon 200,000 2,400,000 2,400,000 4,800,000
21 Farmers, sells charcoal K250,000 a month 250,000 3,000,000 0 3,000,000
22 Client not work 2 siblings make k700,000/mon selling sand and vegetables 700,000 8,400,000 0 8,400,000
23 Make k50,000/mon from vegetables 50,000 600,000 0 600,000
24 House wife 0 0 0 0
25 Grows vegetables 0 0 0 0

55
26 Gardening vegetables 0 0 0 0
27 Gardening K150000 150,000 1,800,000 0 1,800,000
28 Builder, Grow vegetables K70,000/mon 70,000 840,000 0 840,000
Table 4: Details about occupation and income in Chelstone
Occupation type
Client
Income
Client
I/Yr
Other HH
Mbr Total ZMK
Client No. & Employment per Household per
MonZMK
per yr
ZMK HH Income
1. Business woman 800,000 9,600,000 0 9,600,000
2. Trader 200,000 2,400,000 0 2,400,000
3. Trader 50,000 600,000 0 600,000
4. Father Clinic employee 500,000 6,000,000 0 6,000,000
5. husband business man, wife teacher 1,400,000 16,800,000 0 16,800,000
6. security officer 500,000 6,000,000 0 6,000,000
7. husband lecturer, wife-client works NGO 3,000,000 36,000,000 0 36,000,000
8. farm working but not sure about income 0 0 0 0
9. Volunteer K100,000/mon & vege sale K300,000 400,000 4,800,000 0 4,800,000
10. Security (K250,000) + Sweet potato (K30,000) 250,000 3,000,000 30,000 3,030,000
11. Sewing and selling door mats 250,000 3,000,000 0 3,000,000
12. Volunteer 190,000 2,280,000 0 2,280,000
13. Teacher + 4x50kg maize 1,600,000 19,200,000 256,000 19,456,000
14. Head works for Zambia Breweries no income 0 0 0 0
15. HH has a Brick layer + business man 0 0 0 0
16. No job 0 0 0 0
17. Cleaner at Chelstone clinic 1,100,000 13,200,000 0 13,200,000
18. Runs a grocery stall 500,000 6,000,000 0 6,000,000
19. Client maid, Head director at a school 0 0 0 0
20. Maid 200,000 2,400,000 0 2,400,000
21. head is a brick layer not sure of income 0 0 0 0
22. Head security guard 400,000 4,800,000 4,800,000
23. Farming of maize, rape, Chinese and tomatoes 100,000 1,200,000 1,200,000
24. Money lender, loses when people don’t pay 0 0 0 0
25. Husband formal employed for family legacy 500,000 6,000,000 6,000,000
26. Works in a salon 200,000 2,400,000 2,400,000
27. Husband repairs juke boxes 600,000 7,200,000 7,200,000
28. Rental house 1,000,000 12,000,000 12,000,000

56
29. HH-clearing & forwarding co-wife sells 1,500,000 18,000,000 7,200,000 25,200,000
30.Volunteer at clinic 200,000 2,400,000 2,400,000
31. Head driver, herself hair dresser 500,000 6,000,000 3,600,000 9,600,000
32. voluntary worker at clinic 200,000 2,400,000 2,400,000
33. Business woman 200,000 2,400,000 2,400,000
34. Mechanic 2,500,000 30,000,000 30,000,000
35. Husband Stone crusher 200,000 2,400,000 2,400,000
36. Voluntary worker at clinic, Daughter- restaurant 200,000 2,400,000 1,800,000 4,200,000
37. Builder k3,000,000 per year 250,000 3,000,000 0 3,000,000
38. Trader in tomatoes -K150,000 barber, mechanic 150,000 1,800,000 0 1,800,000
39. Tomato trader 100,000 1,200,000 0 1,200,000
40. Trade groundnut K100,000/mon + spouse MTN 100,000 1,200,000 0 1,200,000
41. Chips & sausages 400000+ Trade 200000/mon no rent 400,000 4,800,000 2,400,000 7,200,000
42. Voluntary work at Chelstone clinic earning 200,000 200,000 2,400,000 2,400,000
43. Ordering & selling building materials 0 0 0 0
44. Doing a voluntary work Chelstone clinic 200,000/mon 200,000 2,400,000 2,400,000
45. Grows Maize & Groundnuts, and also keep Cattle 0 0 0 0
46. Voluntary work at Chelstone clinic earning 200,000 200,000 2,400,000 2,400,000
47. Does piece works earning K300,000 per month 300,000 3,600,000 3,600,000
48. Sales freezets earning K100,000 100,000 1,200,000 1,200,000
49. Grow maize & earning K400,000 per month 400,000 4,800,000 4,800,000
50. Grows maize and groundnuts earning K300,000/month 300,000 3,600,000 3,600,000
51. Head HH rents out house K1,200,000/mon 1,200,000 14,400,000 14,400,000
52. Dependant not known Head HH income 0 0 0 0
53. Husband carpenter & joinery, she house wife 0 0 0 0
54. Father is welder, client school boy 400,000 4,800,000 0 4,800,000
55. Student, mother owns restaurant +does tailoring 800,000 9,600,000 9,600,000
56. Student, father is a business man 2,000,000 24,000,000 24,000,000
57. Student, mother sells Kapenta, eggs, sugar and salt 0 0 0 0

57
Table 5: Details about occupation and income in Chawama
Client
No. Occupation type
Client
income
Client
income Other HH Total
/month /year Income/yr Income/HH
ZMK ZMK ZMK ZMK
1 Plaiting hair (K250,000/mon) 250,000 3,000,000 0 3,000,000
2 Electrician (K250,000 per month) 250,000 3,000,000 0 3,000,000
3 Client stopped work & Husband just retrenched 0 0 0 0
4 Client retails goods (K1.6m) Husband works (K1.7m) 1,600,000 19,200,000 20,400,000 39,600,000
5 Small grocery store (K250000/mon) 250,000 3,000,000 0 3,000,000
6 Client is maid (K280000/mon) 280,000 3,360,000 0 3,360,000
7 Maid and parttime work (K450000/month) 450,000 5,400,000 0 5,400,000
8 Client not work, but keeps three brothers who support him 0 0 0 0
9 Client married doing night school, husband works 0 0 0 0
10 Client unemployed, he is running a small shop 250,000 3,000,000 0 3,000,000
11 Client works earns K2million/mon 2,000,000 24,000,000 0 24,000,000

58
Annex 3: 24 Hour Food Intake Recall per target area
Table 15a: Nasenga 24 hour Food Recall in Nasenga
Item Breakfast Lunch Supper
Sweet potatoes + TEA 5 1
Buns + tea 4
Chibwanthu/Munkhoyo 2 1
Maize samp 2 1
Nshima with vegetables
8 16 14
Nshima with fish 2 6 3
Nshima + eggs 1 3 2
Nshima + pork 1 2
Nshima + beef 1 2
Nshima + rat 1
Nshima + mushroom 1
Nshima + sour milk 1
Sub total nshima* 11 29 24
Left over nshima 1
Porridge 2 1 1
Pumpkin 1
Nothing 2 4 1
Rice 1
Table 15b: Results of the 24 hour food recall in Moomba
Item Breakfast Lunch Supper
Sweet potatoes 10 0 2

59
/tea/gnut
Nshima /fish 2 0 6
Nshima /vegetables 4 16 20
Porridge/nuts 4 0 0
Nshima/ chicken/rape 1 0 0
Tea/ fritters/ biscuits/bread
6 0 3
Nothing 1 7 3
Nshima /rat meat 1 1 2
Nshima/ beef 0 2 0
Maize Samp 0 2 0
Nshima / soy chunks 0 1 1
Milk 0 1 0
Rice 2 1 0
Nshima / sour milk 0 0 1
Table 15c: Breakfast
Item Breakfast Lunch Supper
Sweet potatoes + tea 11 5
S/potatoes/ Gnuts/ cocoa
1
Buns + tea 26 8
Macaroni 1
Maize samp
Nshima only 1
Nshima/ vegetables 1 13 22
Nshima with fish 1 2 4

60
Nshima with fish/vege 5 7
Nshima + eggs 2
Nshima and chicken 4 7
Nshima + pork 1 2
Banana nshima / pork 1
Nshima + beef 3 6
Nshima/beef/vegetable 6 7
Nshima/caterpillars 1
Nshima/ soy chunks 1 1
Mid morn /Aftn snack 2 8 2
Bread/egg/tea 2
Fruit 2 3
Beans/cabbage/tea 1
Donut + drink 1
Porridge 3 1
Soup and tea
Nothing 2 1
Rice/mince/chicken 1 1 2
Rice/soup/sugar 3
Lunch=The beef was mostly sausages, 1 offal; Sweet potatoes included gnuts; Banana nshima,
snacks before lunch and after were biscuits, fruit; sweet potatoes
Table 15d: 24 Hour food recall in Chawama
Client
No.
Food item Breakfast Lunch Supper
1 Tea/buns/fritter/bread 5
2 Tea/Sweet potatoes 1
3 Nothing 1

61
4 Nshima/fish (2)/kapenta (6)/ vegetables 1 2 5
5 Nshima / Soy chunks 1 1
6 Nshima / beef /vegetables 3 2
7 Fruit 1
8 Nshima / vegetables 3 1
9 Chips / sausage 1
10 Drink / doughnut 1
11 Egg and Bread 1
12 Porridge 1

62
Annex 4: Common child diseases in target areas
ITEM NUMBER DISEASE NAME
Most Common Diseases to all areas:
1 Diarrhoea
2 Fever
3 Persistent respiratory infections
4 Swollen navel
5 Malaria
6 Coughs
7 Worms
8 Tuberculosis (TB)
9 HIV positive
10 Meningitis
Rural Centres included the following to the above list:
11 Epilepsy
12 Measles
13 Problems with legs
14 Persistent respiratory infections
15 Rash on feet and leg
16 Chicken pox
17 Headaches
18 Eye problems