basel iii - pillar 3 - disclosures 2015 - credit suisse · basel iii pillar 3 – disclosures 2015...
TRANSCRIPT
2015
Basel III Pillar 3 – disclosures

In various tables, use of “–” indicates not meaningful or not applicable.
Basel III Pillar 3 – disclosures 2015
Introduction 2
General 2Regulatory development 2Location of disclosure 2Scope of application 4Principles of consolidation 4Restrictions on transfer of funds or regulatory capital 4Capital deficiencies 4Risk management oversight 4
Capital 5
Regulatory capital framework 5Capital structure under Basel III 5Swiss Requirements 5Description of regulatory approaches 6BIS capital metrics 15Swiss capital metrics 17
Credit risk 19
General 19Credit risk by asset class 19Securitization risk in the banking book 35Equity type securities in the banking book 39Central counterparties risk 40
Market risk 41
General 41Securitization risk in the trading book 42Valuation process 47
Interest rate risk in the banking book 48
Overview 48Major sources of interest rate risk in the banking book 48Governance of models and limits 48Risk measurement 48Monitoring and review 49Risk profile 49
Reconciliation requirements 50
Balance sheet 50Composition of BIS regulatory capital 52

2
IntroductionGENERALThese Pillar 3 disclosures as of December 31, 2015 are based on the BIS Basel III framework as implemented by the revised Swiss Capital Adequacy Ordinance and required by Swiss Financial Mar-ket Supervisory Authority FINMA (FINMA) regulation. This docu-ment should be read in conjunction with the Credit Suisse Annual Report 2015, which includes important information on regulatory capital and risk management (specific references have been made herein to this document).
In addition to Pillar 3 disclosures we disclose the way we man-age our risks for internal management purposes in the Annual Report.u Refer to “Risk management” (pages 136 to 178) in III – Treasury, Risk, Bal-ance sheet and Off-balance sheet in the Credit Suisse Annual Report 2015 for further information regarding the way we manage risk including economic capital as a Group-wide risk management tool.
Certain reclassifications may be made to prior periods to conform to the current period’s presentation.
The Pillar 3 report is produced and published semi-annually, in accordance with FINMA requirements.
This report was verified and approved internally in line with our Pillar 3 disclosure policy. The Pillar 3 report has not been audited by the Group’s external auditors. However, it also includes infor-mation that is contained within the audited consolidated financial statements as reported in the Credit Suisse Annual Report 2015.
REGULATORY DEVELOPMENTOn November 20, 2015, FINMA issued the revised circular on disclosure for banks. As the previous disclosure standards did not allow for a proper comparison of risk situations between banks, FINMA Circular 2016/01 “Disclosure – banks” has been updated to reflect enhanced international standards (see below). The revised disclosure standards have improved the information and decision-making tools for market participants and increased the comparability of institutions. The revised circular comes into force on January 1, 2016, implementing the revised standards with which all Swiss banks must comply as of December 31, 2016. Their application will be determined by the size of the bank.
On January 28, 2015, the Basel Committee on Banking Supervision (BCBS) issued the final standard for the revised Pil-lar 3 disclosure requirements. The revised disclosure requirements will enable market participants to compare bank’s disclosure of risk-weighted assets. The revisions focus on improving the trans-parency of the internal model-based approaches that banks use to calculate minimum regulatory capital requirements. The revised requirements will be effective for the year-end 2016 financial reporting.
LOCATION OF DISCLOSUREThis report provides the Basel III Pillar 3 disclosures to the extent that these required Pillar 3 disclosures are not included in the Credit Suisse Annual Report 2015.
The following table provides an overview of the location of the required Pillar 3 disclosures.
Location of disclosure
Pillar 3 requirements Pillar 3 Report 2015 Annual Report 2015
Scope of application
Top corporate entity “Scope of application” (p. 4)
Differences in basis of consolidation Description of differences: List of significant subsidiaries and associated entities: “Principles of consolidation” (p. 4) “Note 40 – Significant subsidiaries and equity method
investments (p. 383 – 385)
Changes in scope of consolidation: “Note 3 – Business developments” (p. 270)
Restrictions on transfer of funds or Overview: Detailed information: regulatory capital “Restrictions on transfer of funds or “Liquidity and funding management” (p. 106 – 113)
regulatory capital” (p. 4)
Capital deficiencies “Capital deficiencies” (p. 4)
Capital structure
“Capital structure under Basel III” (p. 5)
“Swiss requirements” (p. 5 – 6)
Capital adequacy
Group/Bank “Description of regulatory approaches” (p. 6 – 14)
“BIS capital metrics” (p. 15 – 16)
“Swiss capital metrics” (p. 17 – 18)
Significant subsidiaries Refer to “Regulatory disclosures” under
https://www.credit-suisse.com/regulatorydisclosures
3Basel III – Pillar 3
Location of disclosure (continued)
Pillar 3 requirements Pillar 3 Report 2015 Annual Report 2015
Risk management
objectives and policies
General description “Risk management oversight” (p. 137 – 140)
“Risk appetite framework” (p. 140 – 143)
“Risk coverage and management” (p. 144 – 148)
Credit risk
Credit risk management overview “Credit risk” (p. 151 – 153)
Credit risk by asset classes
Gross credit exposure, “General” (p. 20 – 22)
risk-weighted assets
and capital requirement
Portfolios subject to “Portfolios subject to PD/LGD approach” (p. 22 – 29)
PD/LGD approach
Portfolios subject to standardized and “Portfolios subject to standardized and
supervisory risk weights approaches supervisory risk weights approaches” (p. 29 – 30)
Credit risk mitigation used for “Credit risk mitigation used for A-IRB and Netting: A-IRB and standardized approaches standardized approaches” (p. 30 – 31) “Derivative instruments” (p. 174 – 176)
“Note 1 – Summary of significant accounting policies” (p. 261 – 262)
“Note 27 – Offsetting of financial assets and
financial liabilities” (p. 299 – 302)
Counterparty credit risk “Counterparty credit risk” (p. 31 – 34) Effect of a credit downgrade: “Credit ratings” (p. 113)
Impaired loans by industry distribution/industry
distribution of charges and write-offs: “Note 19 – Loans, allowance for loan losses and credit quality” (p. 288 – 291)
Securitization risk in the “Securitization risk in the banking book” (p. 35 – 39)
banking book
Equity type securities in the “Equity type securities in the banking book” (p. 39 – 40)
banking book
Market risk
Market risk management overview Quantitative disclosures: Qualitative disclosures: “General” (p. 41) “Market risk” (p. 148 – 151)
Securitization risk in the trading book “Securitization risk in the trading book” (p. 42 – 47)
Interest rate risk in the
banking book
Qualitative disclosures: Quantitative disclosures: “Interest rate risk in the banking book” (p. 48 – 49) “Banking book” (p. 164 – 165)
Operational risk
Overview: Detailed information: “Operational risk” (p. 14) “Operational risk” (p. 154 – 156)
Composition of capital
Balance sheet under the regulatory “Balance sheet” (p. 50 – 51)
scope of consolidation
Composition of capital “Composition of capital” (p. 52 – 54)
Capital instruments
Main features template Refer to “Regulatory disclosures” under
and full terms and conditions https://www.credit-suisse.com/regulatorydisclosures
Remuneration
“Compensation” (p. 217 – 248)
G-SIBs indicator
Refer to “Regulatory disclosures” under
https://www.credit-suisse.com/regulatorydisclosures
4
SCOPE OF APPLICATIONThe highest consolidated entity in the Group to which the Basel III framework applies is Credit Suisse Group. u Refer to “Regulation and supervision” (pages 25 to 39) in I – Information on the company and to “Capital management” (pages 114 to 135) in III – Treasury, Risk, Balance sheet and Off-balance sheet in the Credit Suisse Annual Report 2015 for further information on regulation.
PRINCIPLES OF CONSOLIDATION For financial reporting purposes, our consolidation principles com-ply with accounting principles generally accepted in the US (US GAAP). For capital adequacy reporting purposes, however, enti-ties that are not active in banking and finance are not subject to consolidation (i.e. insurance, commercial and certain real estate companies). Also, FINMA does not require to consolidate private equity and other fund type vehicles for capital adequacy reporting. Further differences in consolidation principles between US GAAP and capital adequacy reporting relate to special purpose entities (SPEs) that are consolidated under a control-based approach for US GAAP but are assessed under a risk-based approach for capi-tal adequacy reporting. In addition, FINMA requires us to consoli-date companies which form an economic unit with Credit Suisse or if Credit Suisse is obliged to provide compulsory financial support to a company. The investments into such entities, which are not material to the Group, are treated in accordance with the regula-tory rules and are either subject to a risk-weighted capital require-ment or a deduction from regulatory capital.
All significant equity method investments represent invest-ments in the capital of banking, financial and insurance (BFI) enti-ties and are subject to a threshold calculation in accordance with the Basel framework and the Swiss Capital Adequacy Ordinance.
RESTRICTIONS ON TRANSFER OF FUNDS OR REGULATORY CAPITALWe do not believe that legal or regulatory restrictions constitute a material limitation on the ability of our subsidiaries to pay divi-dends or our ability to transfer funds or regulatory capital within the Group.
CAPITAL DEFICIENCIESThe Group’s subsidiaries which are not included in the regulatory consolidation did not report any capital deficiencies in 2015.
RISK MANAGEMENT OVERSIGHTFundamental to our business is the prudent taking of risk in line with our strategic priorities. The primary objectives of risk man-agement are to protect our financial strength and reputation, while ensuring that capital is well deployed to support business activities and grow shareholder value. Our risk management framework is based on transparency, management accountability and indepen-dent oversight. Risk measurement models are reviewed by the Model Risk Management team, an independent validation function, and regularly presented to and approved by the relevant oversight committee.u Refer to “Risk management oversight” (pages 137 to 140), “Risk appetite framework” (pages 140 to 143) and “Risk coverage and management” (pages 144 to 148) in III – Treasury, Risk, Balance sheet and Off-balance sheet – Risk management in the Credit Suisse Annual Report 2015 for information on risk management oversight including risk culture, risk governance, risk organization, risk types and risk appetite and risk limits.
The Group is exposed to several key banking risks such as:p Credit risk (refer to section “Credit risk” on pages 19 to 40);p Market risk (refer to section “Market risk” on pages 41 to 47);p Interest rate risk in the banking book (refer to section “Interest
rate risk in the banking book” on pages 48 to 49); andp Operational risk (refer to section “Capital” on page 14).

5Basel III – Pillar 3
CapitalREGULATORY CAPITAL FRAMEWORKEffective January 1, 2013, the Basel III framework was imple-mented in Switzerland along with the Swiss “Too Big to Fail” legis-lation and regulations thereunder (Swiss Requirements). Together with the related implementing ordinances, the legislation includes capital, liquidity, leverage and large exposure requirements and rules for emergency plans designated to maintain systemically rel-evant functions in the event of threatened insolvency. Our related disclosures are in accordance with our current interpretation of such requirements, including relevant assumptions. Changes in the interpretation of these requirements in Switzerland or in any of our assumptions or estimates could result in different numbers from those shown in this report. Also, our capital metrics fluctuate dur-ing any reporting period in the ordinary course of business.u Refer to “Capital management” (pages 114 to 135) in III – Treasury, Risk, Bal-ance sheet and Off-balance sheet in the Credit Suisse Annual Report 2015 for further information.
CAPITAL STRUCTURE UNDER BASEL IIIThe BCBS, the standard setting committee within the Bank for International Settlements (BIS), issued the Basel III frame-work, with higher minimum capital requirements and conserva-tion and countercyclical buffers, revised risk-based capital mea-sures, a leverage ratio and liquidity standards. The framework was designed to strengthen the resilience of the banking sector and requires banks to hold more capital, mainly in the form of common equity. The new capital standards are being phased in from 2013 through 2018 and will be fully effective January 1, 2019 for those countries that have adopted Basel III.u Refer to the table “Basel III phase-in requirements for Credit Suisse” (page 116) in III – Treasury, Risk, Balance sheet and Off-balance sheet – Capital man-agement – Regulatory capital framework in the Credit Suisse Annual Report 2015 for capital requirements and applicable effective dates during the phase-in period.
Under Basel III, the minimum common equity tier 1 (CET1) require-ment is 4.5% of risk-weighted assets. In addition, a 2.5% CET1 capital conservation buffer is required to absorb losses in periods of financial and economic stress. Banks that do not maintain this buffer will be limited in their ability to pay dividends or make discre-tionary bonus payments or other earnings distributions.
A progressive buffer between 1% and 2.5% (with a possible additional 1% surcharge) of CET1, depending on a bank’s systemic importance, is an additional capital requirement for global systemi-cally important banks (G-SIB). The Financial Stability Board has identified us as a G-SIB and requires us to maintain a 1.5% pro-gressive buffer.
CET1 capital is subject to certain regulatory deductions and other adjustments to common equity, including the deduction of deferred tax assets for tax-loss carry-forwards, goodwill and other intangible assets and investments in banking and finance entities.
In addition to the CET1 requirements, there is also a require-ment for 1.5% additional tier 1 capital and 2% tier 2 capital. These requirements may also be met with CET1 capital. To qualify as additional tier 1 under Basel III, capital instruments must provide for principal loss absorption through a conversion into common equity or a write-down of principal feature. The trigger for such conversion or write-down must include a CET1 ratio of at least 5.125%.
Basel III further provides for a countercyclical buffer that could require banks to hold up to 2.5% of CET1 or other capital that would be available to fully absorb losses. This requirement is expected to be imposed by national regulators where credit growth is deemed to be excessive and leading to the build-up of system-wide risk.
Capital instruments that do not meet the strict criteria for inclu-sion in CET1 are excluded. Capital instruments that would no lon-ger qualify as tier 1 or tier 2 capital will be phased out. In addition, instruments with an incentive to redeem prior to their stated matu-rity, if any, are phased out at their effective maturity date, generally the date of the first step-up coupon.
SWISS REQUIREMENTSThe legislation implementing the Basel III framework in Switzerland in respect of capital requirements for systemically relevant banks goes beyond Basel III’s minimum standards, including requiring us, as a systemically relevant bank, to have the following minimum, buffer and progressive components.u Refer to the chart “Swiss capital and leverage ratio phase-in requirements for Credit Suisse” (page 117) in III – Treasury, Risk, Balance sheet and Off-balance sheet – Capital management – Regulatory capital framework in the Credit Suisse Annual Report 2015 for Swiss capital requirements and applicable effective dates during the phase-in period.
The minimum requirement of CET1 capital is 4.5% of risk-weighted assets.
The buffer requirement is 8.5% and can be met with additional CET1 capital of 5.5% of risk-weighted assets and a maximum of 3% of high-trigger capital instruments. High-trigger capital instru-ments must convert into common equity or be written off if the CET1 ratio falls below 7%.
The progressive component requirement is dependent on our size (leverage exposure) and the market share of our domestic systemically relevant business. Effective in 2015, FINMA set our progressive component requirement at 4.05% for 2019. In June 2015, FINMA notified us that, effective in 2016, the progressive component requirement for 2019 will be increased from 4.05% to 5.07% due to the latest assessment of our relevant market shares. The progressive component requirement may be met with CET1 capital or low-trigger capital instruments. In order to qualify, low-trigger capital instruments must convert into common equity or be written off if the CET1 ratio falls below a specified percentage, the lowest of which may be 5%. In addition, until the end of 2017,
6
the progressive component requirement may also be met with high-trigger capital instruments. Both high and low-trigger capital instruments must comply with the Basel III minimum requirements for tier 2 capital (including subordination, point-of-non-viability loss absorption and minimum maturity).
Similar to Basel III, the Swiss Requirements include a supple-mental countercyclical buffer of up to 2.5% of risk-weighted assets that can be activated during periods of excess credit growth. Effective September 2013, the buffer was activated and initially required banks to hold CET1 capital in the amount of 1% of their risk-weighted assets pertaining to mortgages that finance residen-tial property in Switzerland. In January 2014, upon the request of the Swiss National Bank, the Swiss Federal Council increased the countercyclical buffer from 1% to 2%, effective June 30, 2014.
In 2013, FINMA introduced increased capital charges for mortgages that finance owner occupied residential property in Switzerland (mortgage multiplier) to be phased in through January 1, 2019. The mortgage multiplier applies for purposes of both BIS and FINMA requirements.
In December 2013, FINMA issued a decree (FINMA Decree) specifying capital adequacy requirements for the Bank, on a stand-alone basis (Bank parent company), and the Bank and the Group, each on a consolidated basis, as systemically relevant institutions.u Refer to “Capital management” (pages 114 to 135) in III – Treasury, Risk, Balance sheet and Off-balance sheet in the Credit Suisse Annual Report 2015 for information on our capital structure, eligible capital and shareholders’ equity, capital adequacy and leverage ratio requirements under Basel III and Swiss Requirements.
DESCRIPTION OF REGULATORY APPROACHESThe Basel framework describes a range of options for determining the capital requirements in order to provide banks and supervisors the ability to select approaches that are most appropriate for their operations and their financial market infrastructure. In general, Credit Suisse has adopted the most advanced approaches, which align with the way risk is internally managed and provide the great-est risk sensitivity. The Basel framework focuses on credit risk, market risk, operational risk and interest rate risk in the banking book. The regulatory approaches for each of these risk exposures and the related disclosures under Pillar 3 are set forth below.
Credit riskCredit risk by asset classThe Basel framework permits banks a choice between two broad methodologies in calculating their capital requirements for credit risk by asset class, the internal ratings-based (IRB) approach or the standardized approach. Off-balance-sheet items are converted into credit exposure equivalents through the use of credit conver-sion factors (CCF).
The majority of our credit risk by asset class is with institutional counterparties (sovereigns, other institutions, banks and corpo-rates) and arises from lending and trading activity in the investment banking businesses and the private, corporate and institutional banking businesses. The remaining credit risk by asset class is
with retail counterparties and mostly arises in the private, corpo-rate and institutional banking businesses from residential mort-gage loans and other secured lending, including loans collateral-ized by securities. u Refer to “Credit risk by asset class” in section “Credit risk” on pages 19 to 34 for further information.
Advanced-internal ratings-based approachUnder the IRB approach, risk weights are determined by using internal risk parameters and applying an asset value correlation multiplier uplift where exposures are to financial institutions meet-ing regulatory defined criteria. We have received approval from FINMA to use, and have fully implemented, the advanced-internal ratings-based (A-IRB) approach whereby we provide our own esti-mates for probability of default (PD), loss given default (LGD) and exposure at default (EAD).
PD parameters capture the risk of a counterparty defaulting over a one-year time horizon. PD estimates are mainly derived from models tailored to the specific business of the respective obli-gor. The models are calibrated to the long run average of annual internal or external default rates where applicable. For portfolios with a small number of empirical defaults, low default portfolio techniques are used.
LGD parameters consider seniority, collateral, counterparty industry and in certain cases fair value markdowns. LGD esti-mates are based on an empirical analysis of historical loss rates and are calibrated to reflect time and cost of recovery as well as economic downturn conditions. For much of the private, corporate and institutional banking businesses loan portfolio, the LGD is pri-marily dependent upon the type and amount of collateral pledged. The credit approval and collateral monitoring process are based on loan-to-value limits. For mortgages (residential or commercial), recovery rates are differentiated by type of property.
EAD is either derived from balance sheet values or by using models. EAD for a non-defaulted facility is an estimate of the expected exposure upon default of the obligor. Estimates are derived based on a CCF approach using default-weighted aver-ages of historical realized conversion factors on defaulted loans by facility type. Estimates are calibrated to capture negative operating environment effects.
We have received approval from FINMA to use the inter-nal model method (IMM) for measuring counterparty risk for the majority of our derivative and secured financing exposures.
Risk weights are calculated using either the PD/LGD approach or the supervisory risk weights (SRW) approach for certain types of specialized lending.
Standardized approachUnder the standardized approach, risk weights are determined either according to credit ratings provided by recognized external credit assessment institutions or, for unrated exposures, by using the applicable regulatory risk weights. Less than 10% of our credit risk by asset class is determined using this approach.

7Basel III – Pillar 3
Credit risk
Central counterparties (CCP) risk
Advanced approach
Credit valuation adjustment (CVA) risk
Advanced approach
Standardized approach
Market risk
Advanced approach
Standardized approach
Internal models approach (IMA)
Standardized measurement method (SMM)
Regulatory VaR
Stressed VaR
Risks not in VaR (RNIV)
Incremental Risk Charge
Ratings-based approach (RBA)
Supervisory formula approach (SFA)
Other supervisory approaches1
Credit risk by asset class
Advanced-internal ratings-based (A-IRB) approach
Standardized approach
PD/LGD
Supervisory risk weights (SRW)
Operational risk
Advanced measurement approach (AMA)
Equity type securities in the banking book
Advanced approach – IRB simple approach
Securitization risk in the banking book
Advanced-internal ratings-based (A-IRB) approach
Standardized approach
Ratings-based approach (RBA)
Supervisory formula approach (SFA)
1 For trading book securitization positions covering the approach for nth-to-default products and portfolios covered by the weighted average risk weight approach.
Regulatory approaches for different risk categories
Settlement risk / Exposures below 15% threshold
Standardized approach – Fixed risk weights
Non-counterparty-related risk
Standardized approach – Fixed risk weights
Comparison of the standardized and internal model approaches for calculating risk-weighted assets for credit risk
BackgroundWe have regulatory approval to use a number of internal models for calculating our Pillar 1 capital charge for credit risk (default risk). These include the A-IRB approach for risk weights, IMM for deriv-atives credit exposure, and repo Value-at-Risk (VaR) for Securities Financing Transactions (SFT). These modelled based approaches are used for the vast majority of credit risk exposures, with the standardized approaches used for only a relatively small proportion of credit exposures.
Regulators and investors are increasingly interested in the dif-ferences between capital requirements under modelled and stan-dardized approaches. This is due, in part, to ongoing and future regulatory changes by the BCBS, such as the new standard-ized approach for counterparty credit risk (SA-CCR), proposed changes to the standardized approach for credit risk and capi-tal floors. As such, the FINMA now requires us to disclose fur-ther information on differences between credit risk risk-weighted assets computed under internal modelled approaches, and cur-rent standardized approaches. FINMA also requires us to disclose the differences between the exposure at default based on inter-nal modelled approaches and the exposure at default used in the Leverage ratio.
8
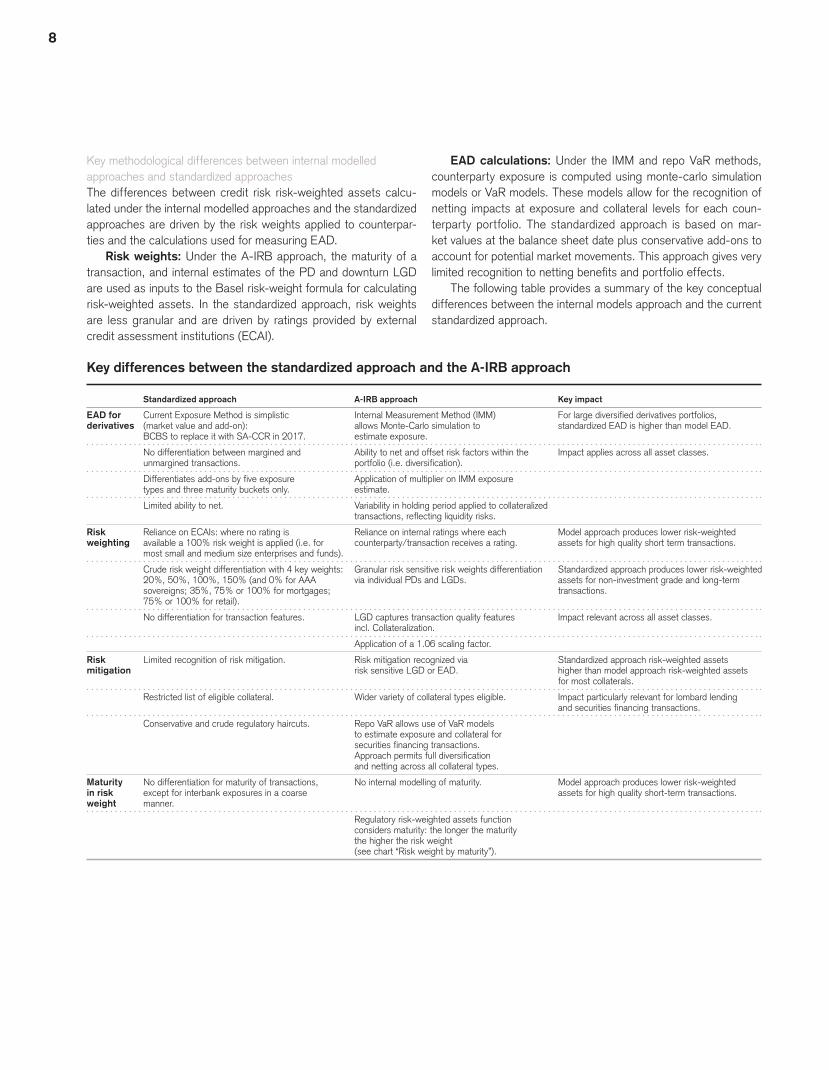
Key methodological differences between internal modelled approaches and standardized approachesThe differences between credit risk risk-weighted assets calcu-lated under the internal modelled approaches and the standardized approaches are driven by the risk weights applied to counterpar-ties and the calculations used for measuring EAD.
Risk weights: Under the A-IRB approach, the maturity of a transaction, and internal estimates of the PD and downturn LGD are used as inputs to the Basel risk-weight formula for calculating risk-weighted assets. In the standardized approach, risk weights are less granular and are driven by ratings provided by external credit assessment institutions (ECAI).
EAD calculations: Under the IMM and repo VaR methods, counterparty exposure is computed using monte-carlo simulation models or VaR models. These models allow for the recognition of netting impacts at exposure and collateral levels for each coun-terparty portfolio. The standardized approach is based on mar-ket values at the balance sheet date plus conservative add-ons to account for potential market movements. This approach gives very limited recognition to netting benefits and portfolio effects.
The following table provides a summary of the key conceptual differences between the internal models approach and the current standardized approach.
Key differences between the standardized approach and the A-IRB approach
Standardized approach A-IRB approach Key impact
EAD for Current Exposure Method is simplistic Internal Measurement Method (IMM) For large diversified derivatives portfolios, derivatives (market value and add-on): allows Monte-Carlo simulation to standardized EAD is higher than model EAD. BCBS to replace it with SA-CCR in 2017. estimate exposure.
No differentiation between margined and Ability to net and offset risk factors within the Impact applies across all asset classes. unmargined transactions. portfolio (i.e. diversification).
Differentiates add-ons by five exposure Application of multiplier on IMM exposure
types and three maturity buckets only. estimate.
Limited ability to net. Variability in holding period applied to collateralized
transactions, reflecting liquidity risks.
Risk Reliance on ECAIs: where no rating is Reliance on internal ratings where each Model approach produces lower risk-weighted weighting available a 100% risk weight is applied (i.e. for counterparty/transaction receives a rating. assets for high quality short term transactions. most small and medium size enterprises and funds).
Crude risk weight differentiation with 4 key weights: Granular risk sensitive risk weights differentiation Standardized approach produces lower risk-weighted 20%, 50%, 100%, 150% (and 0% for AAA via individual PDs and LGDs. assets for non-investment grade and long-term sovereigns; 35%, 75% or 100% for mortgages; transactions. 75% or 100% for retail).
No differentiation for transaction features. LGD captures transaction quality features Impact relevant across all asset classes. incl. Collateralization.
Application of a 1.06 scaling factor.
Risk Limited recognition of risk mitigation. Risk mitigation recognized via Standardized approach risk-weighted assets mitigation risk sensitive LGD or EAD. higher than model approach risk-weighted assets for most collaterals.
Restricted list of eligible collateral. Wider variety of collateral types eligible. Impact particularly relevant for lombard lending and securities financing transactions.
Conservative and crude regulatory haircuts. Repo VaR allows use of VaR models
to estimate exposure and collateral for
securities financing transactions.
Approach permits full diversification
and netting across all collateral types.
Maturity No differentiation for maturity of transactions, No internal modelling of maturity. Model approach produces lower risk-weighted
in risk except for interbank exposures in a coarse assets for high quality short-term transactions. weight manner.
Regulatory risk-weighted assets function
considers maturity: the longer the maturity
the higher the risk weight
(see chart “Risk weight by maturity”).

9Basel III – Pillar 3
Risk weight by maturity
0%
5%
10%
15%
20%
25%
30%
0 1 2 3 4 5 6
Ris
k W
eigh
t (R
W)
Maturity (in Years)
A-IRB, AA-rated corporate, senior unsecured
A-IRB, AA-rated corporate, senior secured
Standardized Approach: AA-rated corporate
The following chart shows standardized risk weights, and model based (A-IRB) risk weights for loans of varying maturity. The graphs are plotted for a AA-rated corporate senior unsecured loan with a LGD of 45% (consistent with Foundation-IRB), and a AA-rated corporate senior secured loan with a LGD of 36%. The graphs show that standardized risk weights are not sensitive to maturity, whereas A-IRB risk weights are sensitive to maturity. In particular, under A-IRB, lower maturity loans receive lower risk weights reflecting an increased likelihood of repayment for loans with a shorter maturity.
Key methodological differences between internally modelled EAD and EAD used in leverage ratioThe exposure measure used in the leverage ratio also differs from the exposure measure used in the internal modelled approach. The main methodological difference is that leverage ratio exposure estimates do not take into account physical or financial collateral, guarantees or other credit risk mitigation techniques to reduce the credit risk. Leverage ratio exposures also do not fully reflect net-ting and portfolio diversification. As a result, leverage ratio expo-sures are typically larger than model based exposures.
The following table shows the internal model-based EAD, along with average risk weight and risk-weighted assets, com-pared to an estimate of the exposure measure used in the leverage ratio calculation. Estimates are provided at Basel asset class level. As expected, leverage ratio exposure measures exceed internal model-based EAD, with the largest differences for banks and cor-porates, where the impacts of netting, diversification, and credit risk mitigation are largest.
Leverage ratio estimate
A-IRB
approach Leverage
A-IRB A-IRB risk- ratio: approach approach weighted total EAD risk assets exposures
Basel asset class (CHF billion) weight (%) (CHF billion) (CHF billion) 1
Corporates 195 41 84 379
Banks 36 25 9 94
Sovereigns 88 4 4 102
Retail 182 13 26 190
1 The leverage ratio estimate excludes trading book inventory, as credit risk capital for this business is capitalised under the market risk capital requirement. In addition, the estimate does not include Multilateral Development Banks (MDB), public sector entities and non-credit exposures. Asset class leverage ratio based exposures and standard approach calculations are approximate and provided on a best efforts basis.
It should be noted that credit risk capital requirements based of the internal model based approach are not directly comparable to capital requirements under the leverage ratio. The reason for this is that the 3% leverage ratio capital requirement can be met with total tier 1 capital, including capital for market risk and operational risk.
Comparison of credit risk risk-weighted assets under the internal models approach with risk-weighted assets computed under the standardized approach for credit riskCredit risk risk-weighted assets computed under the standardized approach are higher than those based on the internal models for which we have received regulatory approval. Higher risk-weights under the standardized approach rules are a material driver of the higher risk-weighted assets for all Basel asset classes. The standardized exposure calculations also lead to some higher risk-weighted assets, with the corporate and bank asset classes being most significantly affected.

10
Corporates
0%
20%
40%
60%
80%
100%
120%
140%
160%
0.0% 0.5% 1.0% 1.5% 2.0% 2.5% 3.0% 3.5% 4.0% 4.5%
Ris
k W
eigh
t ("
RW
")
Probability of Default ("PD")/ internal rating
Corporates
IRB Approach Standardised Approach
AAA to BB+ BB to B+
Corporate asset classThe table “Leverage ratio estimate” shows that the EAD for cor-porates computed under the internal model approach is CHF 195 billion. The EAD for corporates under the standardized approach is significantly higher. This difference is driven mainly by the stan-dardized exposure calculations for OTC derivatives and the expo-sure calculations for secured financing transactions. For these products, exposures calculated under the standardized approach are higher than the model based exposures because the stan-dardized approach does not fully recognize the benefits of netting, portfolio diversification and collateral. The exposure calculated under the leverage ratio is higher than the EAD computed using internal models. This is because credit risk mitigation, netting and portfolio diversification are not reflected in the leverage ratio expo-sure calculation.
Another significant driver of the increase in credit risk risk-weighted assets under the standardized approach are higher risk weights. The exposure weighted-average risk weight under the internal model approach is 41%. This is significantly lower than the risk weights assigned to corporates under the standardized approach.
The following graph shows the risk weights assigned to counterparties under the A-IRB approach and the standardized approach. For the IRB risk weight curve, an LGD value of 45% and a maturity adjustment of 2.5 years are chosen, as these are the Basel Foundation IRB parameters. The Group’s exposure weighted-average maturity of its corporate portfolio is lower than the foundation IRB value of 2.5 years, and lower maturities would result in a lower model-based risk weight curve than shown in the following graph. In addition, the PD for each rating shown in the graph are consistent with the Group’s PD masterscale. For counterparties in the AAA to BB+ range (based on external rat-ings), higher risk weights (20%, 50% and 100%) are assigned under the standardized approach than under the A-IRB approach. For the corporate asset class, over three-quarters of the Group’s exposures are in this range (based on internal ratings), and this is a key driver for the higher risk-weighted assets under the stan-dardized approach. The different treatments of loan maturity in the model based approach and standardized approach are not a mate-rial cause of risk-weighted assets differences.
An additional driver of higher risk weights within the corporate asset class are counterparties without an external rating. Under the standardized approach, counterparties without an external rat-ing receive a fixed risk weight of 100%. This applies to a large proportion of the Group’s exposures, among them specialized lending and managed funds. This fixed standardized risk weight is typically higher than the model based risk weight with for example, the average model based risk weight of specialized lending being approximately 30%.u Refer to “Credit risk by asset class” in section “Credit risk” on pages 19 to 34 for further information on EAD and risk weights for each credit rating for the cor-porate asset class.
Bank asset classThe table “Leverage ratio estimate” shows that the EAD for banks under the internal model approach is CHF 36 billion. The EAD for banks calculated under the standardized approach is significantly higher. This is driven predominantly by the exposure calculations for both OTC derivatives and secured financing transactions and, to a lesser extent, the exposure calculations for listed and cen-trally cleared derivatives. For these products, exposures calculated under the standardized approach are much higher than the model based exposures because the standardized approach does not fully recognize the benefits of netting, portfolio diversification and collateral. The exposures calculated under the leverage ratio are significantly higher than the EAD computed using internal models. This is because credit risk mitigation, netting and portfolio diversi-fication are not reflected in the leverage ratio exposure calculation.
In addition, there is a significant increase in credit risk risk-weighted assets under the standardized approach due to higher credit risk-weights. The exposure weighted-average risk-weight under the internal model approach is 25%. This is significantly lower than the risk weights assigned to banks under the standard-ized approach where a significant amount of the Group’s expo-sures would attract a risk weight of 50%.
The following graph shows the risk weights assigned to counterparties under the A-IRB approach and the standardized approach. For the IRB risk weight curve, an LGD value of 45% and a maturity adjustment of 2.5 years are chosen, as these are the Basel Foundation IRB parameters. The Group’s exposure weighted-average maturity of its bank portfolio is lower than the foundation IRB value of 2.5 years, and lower maturities would result in a lower model based risk weight curve than shown in the following graph. In addition, the PD for each rating shown in the graph are consistent with the Group’s PD masterscale. The graph shows that counterparties in the AAA to BBB+ range (based on external ratings) attract higher risk weights (20% and 50%) under the standardized approach than under the A-IRB approach. Approximately three-quarters of the Group’s exposures

11Basel III – Pillar 3
Banks
0%
20%
40%
60%
80%
100%
120%
140%
160%
0.0% 0.5% 1.0% 1.5% 2.0% 2.5% 3.0% 3.5% 4.0% 4.5%
Ris
k W
eigh
t ("
RW
")
Probability of Default ("PD")/ internal rating
Corporates
IRB Approach Standardised Approach
AAA to BB+ BB to B+
Sovereigns
0%
20%
40%
60%
80%
100%
120%
140%
160%
0.0% 0.5% 1.0% 1.5% 2.0% 2.5% 3.0% 3.5% 4.0% 4.5%
Ris
k W
eigh
t ("
RW
")
Probability of Default ("PD")/ internal rating
Corporates
IRB Approach Standardised Approach
AAA to BB+ BB to B+
fall in this range (based on internal ratings) and this leads to higher risk-weighted assets under the standardized approach for these counterparties. The different treatments of loan maturity in the model based approach and standardized approach are not a mate-rial cause of risk-weighted assets differences.u Refer to “Credit risk by asset class” in section “Credit risk” on pages 19 to 34 for further information on EAD and risk weights for each credit rating for the bank asset class.
Sovereign asset classThe table “Leverage ratio estimate” shows that the EAD for sov-ereigns under the internal model approach is CHF 88 billion. This is comparable to the EAD calculated under the standardized approach and the leverage ratio exposure. This is because the majority of the sovereign exposure is in the form of uncollateral-ized loans, i.e. there are no material differences in the exposure calculation.
The impact of employing standardized credit risk weights to the sovereign portfolio is an overall increase in credit risk risk-weighted assets. The exposure weighted-average risk weight under the internal model approach is less than 4%. This is lower than the risk weights assigned to counterparties under the standardized approach.
The following graph shows the risk weights assigned to counterparties under the A-IRB approach and the standardized approach. For the IRB risk weight curve, an LGD value of 45% and a maturity adjustment of 2.5 years are chosen, as these are the Basel Foundation IRB parameters. The Group’s exposure weighted-average maturity of its sovereign portfolio is lower than the foundation IRB value of 2.5 years, and lower maturities would result in a lower model-based risk weight curve than shown in the following graph. In addition, the PD for each rating shown in the graph are consistent with the Group’s PD masterscale. The graph shows that counterparties in the AAA to A range (based on exter-nal ratings) would attract lower risk weights (0% and 20%) under the standardized approach than under the A-IRB approach. The majority of the Group’s exposures have extremely low risk-weights
under the A-IRB approach and would attract risk weights of 0% under the standardized approach. The remaining exposures would receive higher risk weights under the standardized approach (20%, 50% or 100%) than under the A-IRB approach. Overall, this would lead to higher risk-weighted assets under the standard-ized approach. The different treatments of loan maturity in the model based approach and standardized approach are not a mate-rial cause of risk-weighted assets differences.u Refer to “Credit risk by asset class” in section “Credit risk” on pages 19 to 34 for further information on EAD and risk weights for each credit rating for the sov-ereign asset class.
Retail asset classThe EAD of the retail asset class under the internal model approach is CHF 182 billion, which is comparable to the EAD calculated under the standardized approach and the leverage ratio. This is because the majority of retail exposure is on-balance sheet exposure.
The application of the standardized approach would lead to higher credit risk risk-weighted assets. The exposure weighted-average risk weight is 13% using internal model approach. This is lower than the risk weights assigned to counterparties under the standardized approach. The maturity of the loan has no impact on the modelled risk weights in the retail asset class.
The retail portfolio consists mainly of residential mortgage loans, lombard lending and other retail exposures, and further analysis for each of these portfolios is provided below:
Residential mortgages: Under the standardized approach, fixed risk weights are applied depending on the loan-to-value (LTV), i.e. risk weight of 100% for LTV > 80%, risk weight of 75% for 80% > LTV > 67% and risk weight of 35% for LTV < 67%. The internal model-based approach however takes into account borrowers’ ability to service debt more accurately, including mort-gage affordability and calibration to large amounts of historic data. The Group’s residential mortgage portfolio is focused on the Swiss market and the Group has robust review processes over borrow-ers’ ability to repay. This results in the Group’s residential mortgage

12
portfolio having a low average LTV and results in an average risk weight of 12% under the A-IRB approach.
Lombard lending: For lombard lending, the average risk weight using internal models is 13%. Risk-weighted assets under the standardized approach and the model-based approach are comparable for these exposures.
Other retail exposures: Other retail exposures are risk-weighted at 75% or 100% under the standardized approach. This yields higher risk-weighted assets compared to the A-IRB approach where the average risk-weight is 27%.
ConclusionOverall, the Group’s credit risk risk-weighted assets would be sig-nificantly higher under the standardized approach than under the internal model based approach. For most Basel asset classes, this is due to standardized risk weights being much higher than the IRB risk weights for high quality investment grade lending, which is where the majority of the Group’s exposures are. For certain asset classes, standardized exposure calculations also lead to signifi-cantly higher risk-weighted assets. This is where the standardized exposure methods give limited recognition to economic offsetting and diversification for derivatives and SFTs at a portfolio level.
The credit risk risk-weighted assets under the standardized approaches described above may not be reflective of the capi-tal charges under the new standardized approach for credit risk on which the BCBS has recently consulted. This proposed stan-dardized approach for credit risk is likely to be more risk sensi-tive and less dependent on external ratings. In addition, there is a new standardized approach for counterparty credit risk (SA-CCR), which prescribes a standardized calculation of EAD for derivative transactions. SA-CCR, which is to be implemented by 2017, will more accurately recognize the risk mitigating effect of collateral and the benefits from legal and economic offsetting. These regu-latory changes could potentially lead to very different results to the ones described above.
The credit risk risk-weighted assets computed under the inter-nal model-based approach provide a more risk-sensitive indication of the credit risk capital requirements and are more reflective of the economic risk of the Group. The use of models produces a strong link between capital requirements and business drivers, and promotes a proactive risk culture at the origination of a transaction and strong capital consciousness within the organization. A rigor-ous monitoring and control framework also ensures compliance with internal as well as regulatory standards. In addition, bench-marking exercises performed by regulators and industry associa-tions provide useful information for assessing the appropriateness and conservativeness of internal models. In the industry associa-tion’s 2013 benchmark analysis, the Group’s calibration of internal PD and LGD models was close to the industry mean.
Securitization risk in the banking bookFor securitizations, the regulatory capital requirements are cal-culated using IRB approaches (the RBA and the SFA) and the
standardized approach in accordance with the prescribed hierarchy of approaches in the Basel regulations. External ratings used in regulatory capital calculations for securitization risk exposures in the banking book are obtained from Fitch, Moody’s, Standard & Poor’s or Dominion Bond Rating Service. u Refer to “Securitization risk in the banking book” in section “Credit risk” on pages 35 to 39 for further information on the IRB approaches and the standard-ized approach.
Equity type securities in the banking bookFor equity type securities in the banking book except for significant investments in BFI entities, risk weights are determined using the IRB Simple approach based on the equity sub-asset type (listed equity and all other equity positions). Significant investments in BFI entities (i.e. investments in the capital of BFI entities that are outside the scope of regulatory consolidation, where the Group owns more than 10% of the issued common share capital of the entity) are subject to a threshold treatment as outlined below in the section “Exposures below 15% threshold”. Where equity type securities represent non-significant investments in BFI entities (i.e., investments in the capital of BFI entities that are outside the scope of regulatory consolidation, where the Group does not own more than 10% of the issued common share capital of the entity), a threshold approach is applied that compares the total amount of non-significant investments in BFI entities (considering both trad-ing and banking book positions) to a 10% regulatory defined eli-gible capital amount. The amount above the threshold is phased-in as a capital deduction and the amount below the threshold contin-ues to be risk-weighted according to the relevant trading book and banking book approaches. u Refer to “Equity type securities in the banking book” in section “Credit risk” on pages 39 to 40 for further information.
Credit valuation adjustment riskCredit Valuation Adjustment (CVA) is a regulatory capital charge designed to capture the risk associated with potential mark-to-market losses associated with the deterioration in the creditworthi-ness of a counterparty.
Under Basel III, banks are required to calculate capital charges for CVA under either the Standardized CVA approach or the Advanced CVA approach (ACVA). The CVA rules stipulate that where banks have permission to use market risk VaR and coun-terparty risk IMM, they are to use the ACVA unless their regulator decides otherwise. FINMA has confirmed that the ACVA should be used for both IMM and non-IMM exposures.
The regulatory CVA capital charge applies to all counterparty exposures arising from over-the-counter (OTC) derivatives, exclud-ing those with central counterparties (CCP). Exposures arising from SFT are not required to be included in the CVA charge unless they could give rise to a material loss. FINMA has confirmed that Credit Suisse can exclude these exposures from the regulatory capital charge.

13Basel III – Pillar 3
Central counterparties riskThe Basel III framework provides specific requirements for exposures the Group has to CCP arising from OTC derivatives, exchange-traded derivative transactions and SFT. Exposures to CCPs which are considered to be qualifying CCPs by the regulator will receive a preferential capital treatment compared to exposures to non-qualifying CCPs.
The Group can incur exposures to CCPs as either a clearing member, or as a client of another clearing member. Where the Group acts as a clearing member of a CCP on behalf of its client (client trades), it incurs an exposure to its client. Since the exposure to the client is to be treated as a bilateral trade, the risk-weighted assets from these exposures are represented under “credit risk by asset class”. Where the Group acts as a client of another clearing member the risk-weighted assets from these exposures are also represented under “credit risk by asset class”.
The exposures to CCP (represented as “Central counterparties (CCP) risks”) consist of trade exposure, default fund exposure and contingent exposure based on trade replacement due to a clearing member default. While the trades exposure includes the current and potential future exposure of the clearing member (or a client) to a CCP arising from the underlying transaction and the initial margin posted to the CCP, the default fund exposure is arising from default fund contributions to the CCP.
Settlement riskRegulatory fixed risk weights are applied to settlement exposures. Settlement exposures arise from unsettled or failed transactions where cash or securities are delivered without a corresponding receipt.
Exposures below 15% thresholdSignificant investments in BFI entities, mortgage servicing rights and deferred tax assets that arise from temporary differences are subject to a threshold approach, whereby individual amounts are compared to a 10% threshold of regulatory defined eligible capital. In addition amounts below the individual 10% thresholds are aggregated and compared to a 15% threshold of regulatory defined eligible capital. The amount that is above the 10% thresh-old is phased-in as a CET1 deduction. The amount above the 15% threshold is phased-in as a CET1 deduction and the amount below is risk weighted at 250%.
Other itemsOther items include risk-weighted assets related to immaterial portfolios for which we have received approval from FINMA to apply a simplified Institute Specific Direct Risk Weight as well as risk-weighted assets related to items that were risk-weighted under Basel II.5 and are phased in as capital deductions under Basel III.
Market riskWe use the advanced approach for calculating the capital requirements for market risk for the majority of our exposures.
The following advanced approaches are used: the internal mod-els approach (IMA) and the standardized measurement method (SMM).
We use the standardized approach to determine our market risk for a small population of positions which represent an immate-rial proportion of our overall market risk exposure.u Refer to section “Market risk” on pages 41 to 47 for further information on market risk.
Internal models approachThe market risk IMA framework includes regulatory Value-at-Risk (VaR), stressed VaR, risks not in VaR (RNIV) and Incremental Risk Charge (IRC). RNIV includes certain stressed RNIV. In 2014 Com-prehensive Risk Measure was discontinued due to the small size of the correlation trading portfolio. We now use the standard rules for this portfolio.
Regulatory VaR, stressed VaR and risks not in VaRWe have received approval from FINMA, as well as from certain other regulators of our subsidiaries, to use our VaR model to cal-culate trading book market risk capital requirements under the IMA. We apply the IMA to the majority of the positions in our trad-ing book. We continue to receive regulatory approval for ongo-ing enhancements to the VaR methodology, and the VaR model is subject to regular reviews by regulators. Stressed VaR repli-cates a VaR calculation on the Group’s current portfolio taking into account a one-year observation period relating to significant financial stress and helps to reduce the pro-cyclicality of the mini-mum capital requirements for market risk. The VaR model does not cover all identified market risk types and as such we have also adopted a RNIV category which was approved by FINMA in 2012.
Incremental Risk ChargeThe IRC capitalizes issuer default and migration risk in the trad-ing book, such as bonds or credit default swaps, but excludes securitizations and correlation trading. We have received approval from FINMA, as well as from certain other regulators of our sub-sidiaries, to use our IRC model. We continue to receive regulatory approval for ongoing enhancements to the IRC methodology, and the IRC model is subject to regular reviews by regulators.
The IRC model assesses risk at 99.9% confidence level over a one year time horizon assuming that positions are sold and replaced one or more times, depending on their liquidity which is modeled by the liquidity horizon. The portfolio loss distribution is estimated using an internally developed credit portfolio model designed to the regulatory requirements.
The liquidity horizon represents time required to sell the posi-tions or hedge all material risk covered by the IRC model in a stressed market. Liquidity horizons are modelled according to the requirements imposed by Basel III guidelines.
The IRC model and liquidity horizon methodology have been validated by the Model Risk Management team in accordance with the firms validation umbrella policy and Risk Model Validation Sub-Policy for IRC.

14
Standardized measurement methodWe use the SMM which is based on the ratings-based approach (RBA) and the supervisory formula approach (SFA) for securitiza-tion purposes (see also Securitization risk in the banking book) and other supervisory approaches for trading book securitization positions covering the approach for nth-to-default products and portfolios covered by the weighted average risk weight approach.u Refer to “Securitization risk in the trading book” in section “Market risk” on pages 42 to 47 for further information on the standardized measurement method and other supervisory approaches.
Operational riskWe have used an internal model to calculate the regulatory capital requirement for operational risk under the Advanced Measure-ment Approach (AMA) since 2008. In 2014, we introduced an enhanced internal model that incorporated recent developments regarding operational risk measurement methodology and associ-ated regulatory guidance. FINMA approved the revised model for calculating the regulatory capital requirement for operational risk with effect from January 1, 2014. We view the revised model as a significant enhancement to our capability to measure and under-stand the operational risk profile of the Group that is also more conservative compared with the previous approach.
The model is based on a loss distribution approach that uses historical data on internal and relevant external losses of peers to generate frequency and severity distributions for a range of potential operational risk loss scenarios, such as an unauthorized trading incident or a material business disruption. Business experts and senior management review, and may adjust, the parameters of these scenarios to take account of business environment and internal control factors, such as risk and control self-assessment results and risk and control indicators, to provide a forward-look-ing assessment of each scenario. Insurance mitigation is included
in the regulatory capital requirement for operational risk where appropriate, by considering the level of insurance coverage for each scenario and incorporating haircuts as appropriate. The inter-nal model then uses the adjusted parameters to generate an over-all loss distribution for the Group over a one-year time horizon. The AMA capital requirement represents the 99.9th percentile of this overall loss distribution. The AMA capital requirement is allocated to businesses using a risk-sensitive approach that is designed to be forward looking and incentivize appropriate risk management behaviors.
In 2015, we made enhancements to the modelling approach including improvements to the treatment of litigation-related losses. Although past litigation losses and litigation-related provi-sions were incorporated in the model, for FINMA regulatory capital purposes an add-on was previously used to capture the aggregate range of reasonably possible litigation-related losses that are dis-closed in our financial statements but are not covered by existing provisions. These reasonably possible losses are now fully cap-tured within the model using an analytical approach and the add-on has therefore been removed with FINMA approval. We also made enhancements to further align the operational risk scenarios with other key components of the operational risk framework as well as to ensure consistency with the stress scenario framework developed for enterprise-wide risk management purposes.u Refer to “Operational risk” (pages 154 to 156) in III – Treasury, Risk, Balance sheet and Off-balance sheet – Risk management in the Credit Suisse Annual Report 2015 for information on operational risk.
Non-counterparty-related riskRegulatory fixed risk weights are applied to non-counterparty-related exposures. Non-counterparty-related exposures arise from holdings of premises and equipment, real estate and investments in real estate entities.

15Basel III – Pillar 3
BIS CAPITAL METRICSRegulatory capital and ratiosRegulatory capital is calculated and managed according to Basel regulations and used to determine BIS ratios. BIS ratios compare
eligible CET1 capital, tier 1 capital and total capital with BIS risk-weighted assets.u Refer to “Risk-weighted assets” (pages 124 to 125) in III – Treasury, Risk, Balance sheet and Off-balance sheet – Capital management in the Credit Suisse Annual Report 2015 for information on risk-weighted assets movements in 2015.
Summary of BIS risk-weighted assets and capital requirements – Basel III
end of 2015 2014
Risk- Capital Risk- Capital weighted require- weighted require-
assets ment 1 assets ment 1
CHF million
Credit risk
Advanced-IRB 126,014 10,081 123,854 9,908
Standardized 3,642 291 3,789 303
Credit risk by asset class 129,656 10,372 127,643 10,211
Advanced-IRB 8,771 702 11,849 948
Standardized 6,833 546 761 61
Securitization risk in the banking book 15,604 1,248 12,610 1,009
Advanced – IRB Simple 12,696 1,016 15,292 1,223
Equity type securities in the banking book 12,696 1,016 15,292 1,223
Advanced CVA 16,471 1,318 15,092 1,207
Standardized CVA 49 4 38 3
Credit valuation adjustment risk 16,520 1,322 15,130 1,210
Standardized – Fixed risk weights 12,410 993 12,640 1,011
Exposures below 15% threshold 2 12,410 993 12,640 1,011
Advanced 2,142 171 3,427 274
Central counterparties (CCP) risk 2,142 171 3,427 274
Standardized – Fixed risk weights 269 22 552 44
Settlement risk 269 22 552 44
Advanced 470 38 1,050 84
Standardized 3,431 274 4,319 346
Other items 3 3,901 312 5,369 430
Total credit risk 193,198 15,456 192,663 15,413
Market risk
Advanced 29,469 2,358 34,049 2,724
Standardized 330 26 419 34
Total market risk 29,799 2,384 34,468 2,758
Operational risk
Advanced measurement 66,438 5,315 58,413 4,673
Total operational risk 66,438 5,315 58,413 4,673
Non-counterparty-related risk
Standardized – Fixed risk weights 5,515 441 5,866 469
Total non-counterparty-related risk 5,515 441 5,866 469
Total BIS risk-weighted assets and capital requirements 294,950 23,596 291,410 23,313
of which advanced 262,471 20,998 263,026 21,042
of which standardized 32,479 2,598 28,384 2,271
1 Calculated as 8% of risk-weighted assets based on BIS total capital minimum requirements.2 Exposures below 15% threshold are risk-weighted at 250%. Refer to table “Additional information” in section “Reconciliation requirements” for further information.3 Includes risk-weighted assets of CHF 2,997 million and CHF 3,853 million as of the end of 2015 and 2014, respectively, related to items that were risk-weighted under Basel II.5 and are
phased in as capital deductions under Basel III. Refer to table “Additional information” in section “Reconciliation requirements” for further information.

16
BIS eligible capital – Basel III
Group Bank
end of 2015 2014 2015 2014
Eligible capital (CHF million)
CET1 capital 42,072 43,322 40,013 40,853
Total tier 1 capital 53,063 49,804 50,570 47,114
Total eligible capital 62,682 60,751 60,242 58,111
The following table presents the Basel III phase-in requirements for each of the relevant capital components and discloses the Group’s and the Bank’s current capital metrics against those requirements.
BIS capital ratios – Basel III – Group
end of 2015 2014
Ratio Requirement 2 Excess Ratio Requirement 2 Excess
Capital ratios (%)
Total CET1 1 14.3 4.5 9.8 14.9 4.0 10.9
Tier 1 18.0 6.0 12.0 17.1 5.5 11.6
Total capital 21.3 8.0 13.3 20.8 8.0 12.8
1 Capital conservation buffer and G-SIB buffer requirement will be phased in from January 1, 2016 through January 1, 2019.2 Excludes countercyclical buffer that was required as of September 30, 2013. As of the end of 2015 and 2014, our countercyclical buffer was CHF 351 million and CHF 297 million, which
is equivalent to an additional requirement of 0.1% and 0.1% of CET1 capital, respectively.
BIS capital ratios – Basel III – Bank
end of 2015 2014
Ratio Requirement 2 Excess Ratio Requirement 2 Excess
Capital ratios (%)
Total CET1 1 13.9 4.5 9.4 14.4 4.0 10.4
Tier 1 17.6 6.0 11.6 16.6 5.5 11.1
Total capital 21.0 8.0 13.0 20.5 8.0 12.5
1 Capital conservation buffer and G-SIB buffer requirement will be phased in from January 1, 2016 through January 1, 2019.2 Excludes countercyclical buffer that was required as of September 30, 2013. As of the end of 2015 and 2014, our countercyclical buffer was CHF 286 million and CHF 246 million, which
is equivalent to an additional requirement of 0.1% and 0.1% of CET1 capital, respectively.
17Basel III – Pillar 3
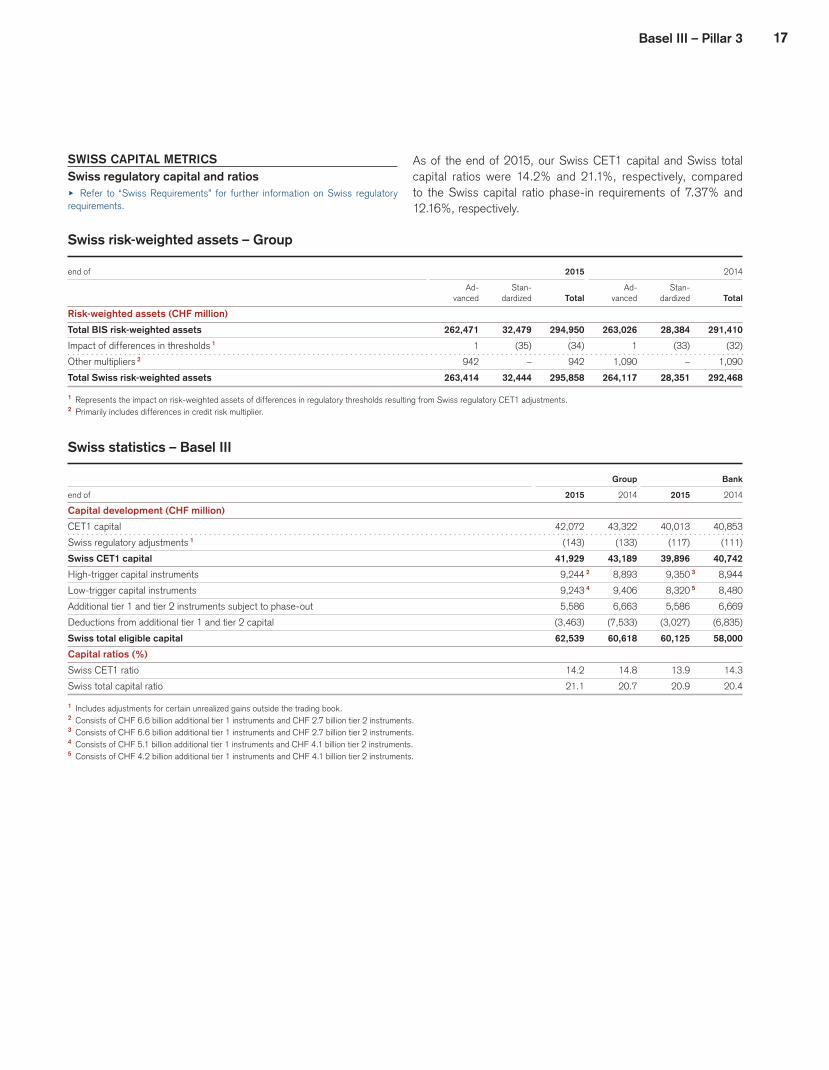
SWISS CAPITAL METRICSSwiss regulatory capital and ratiosu Refer to “Swiss Requirements” for further information on Swiss regulatory requirements.
As of the end of 2015, our Swiss CET1 capital and Swiss total capital ratios were 14.2% and 21.1%, respectively, compared to the Swiss capital ratio phase-in requirements of 7.37% and 12.16%, respectively.
Swiss risk-weighted assets – Group
end of 2015 2014
Ad- Stan- Ad- Stan-
vanced dardized Total vanced dardized Total
Risk-weighted assets (CHF million)
Total BIS risk-weighted assets 262,471 32,479 294,950 263,026 28,384 291,410
Impact of differences in thresholds 1 1 (35) (34) 1 (33) (32)
Other multipliers 2 942 – 942 1,090 – 1,090
Total Swiss risk-weighted assets 263,414 32,444 295,858 264,117 28,351 292,468
1 Represents the impact on risk-weighted assets of differences in regulatory thresholds resulting from Swiss regulatory CET1 adjustments.2 Primarily includes differences in credit risk multiplier.
Swiss statistics – Basel III
Group Bank
end of 2015 2014 2015 2014
Capital development (CHF million)
CET1 capital 42,072 43,322 40,013 40,853
Swiss regulatory adjustments 1 (143) (133) (117) (111)
Swiss CET1 capital 41,929 43,189 39,896 40,742
High-trigger capital instruments 9,244 2 8,893 9,350 3 8,944
Low-trigger capital instruments 9,243 4 9,406 8,320 5 8,480
Additional tier 1 and tier 2 instruments subject to phase-out 5,586 6,663 5,586 6,669
Deductions from additional tier 1 and tier 2 capital (3,463) (7,533) (3,027) (6,835)
Swiss total eligible capital 62,539 60,618 60,125 58,000
Capital ratios (%)
Swiss CET1 ratio 14.2 14.8 13.9 14.3
Swiss total capital ratio 21.1 20.7 20.9 20.4
1 Includes adjustments for certain unrealized gains outside the trading book.2 Consists of CHF 6.6 billion additional tier 1 instruments and CHF 2.7 billion tier 2 instruments.3 Consists of CHF 6.6 billion additional tier 1 instruments and CHF 2.7 billion tier 2 instruments.4 Consists of CHF 5.1 billion additional tier 1 instruments and CHF 4.1 billion tier 2 instruments.5 Consists of CHF 4.2 billion additional tier 1 instruments and CHF 4.1 billion tier 2 instruments.

18
The following table presents the Swiss Requirements for each of the relevant capital components and discloses our current capital metrics against those requirements.
Swiss capital requirements and coverage
Group Bank
Capital requirements Capital requirements
Minimum Buffer Progressive Minimum Buffer Progressive
end of component component component Excess 2015 component component component Excess 2015
Risk-weighted assets (CHF billion)
Swiss risk-weighted assets – – – – 295.9 – – – – 287.9
2015 Swiss capital requirements 1
Minimum Swiss capital ratio 4.50% 5.12% 2 2.54% – 12.16% 4.50% 5.12% 2 2.54% – 12.16%
Minimum Swiss capital (CHF billion) 13.3 15.2 7.5 – 36.0 13.0 14.8 7.3 – 35.0
Swiss capital coverage (CHF billion)
Swiss CET1 Capital 13.3 8.5 – 20.1 41.9 13.0 8.3 – 18.7 39.9
High-trigger capital instruments – 6.7 – 2.6 9.2 – 6.5 – 2.9 9.4
Low-trigger capital instruments – – 7.5 1.8 9.2 – – 7.3 1.0 8.3
Additional tier 1 and tier 2 instruments
subject to phase-out – – – 5.6 5.6 – – – 5.6 5.6
Deductions from additional tier 1 and
tier 2 capital – – – (3.5) (3.5) – – – (3.0) (3.0)
Swiss total eligible capital 13.3 15.2 7.5 26.6 62.5 13.0 14.8 7.3 25.1 60.1
Capital ratios (%)
Swiss total capital ratio 4.50% 5.12% 2.54% 8.98% 21.14% 4.50% 5.12% 2.54% 8.73% 20.89%
Rounding differences may occur.1 The Swiss capital requirements are based on a percentage of risk-weighted assets.2 Excludes countercyclical buffer that was required as of September 30, 2013.
19Basel III – Pillar 3
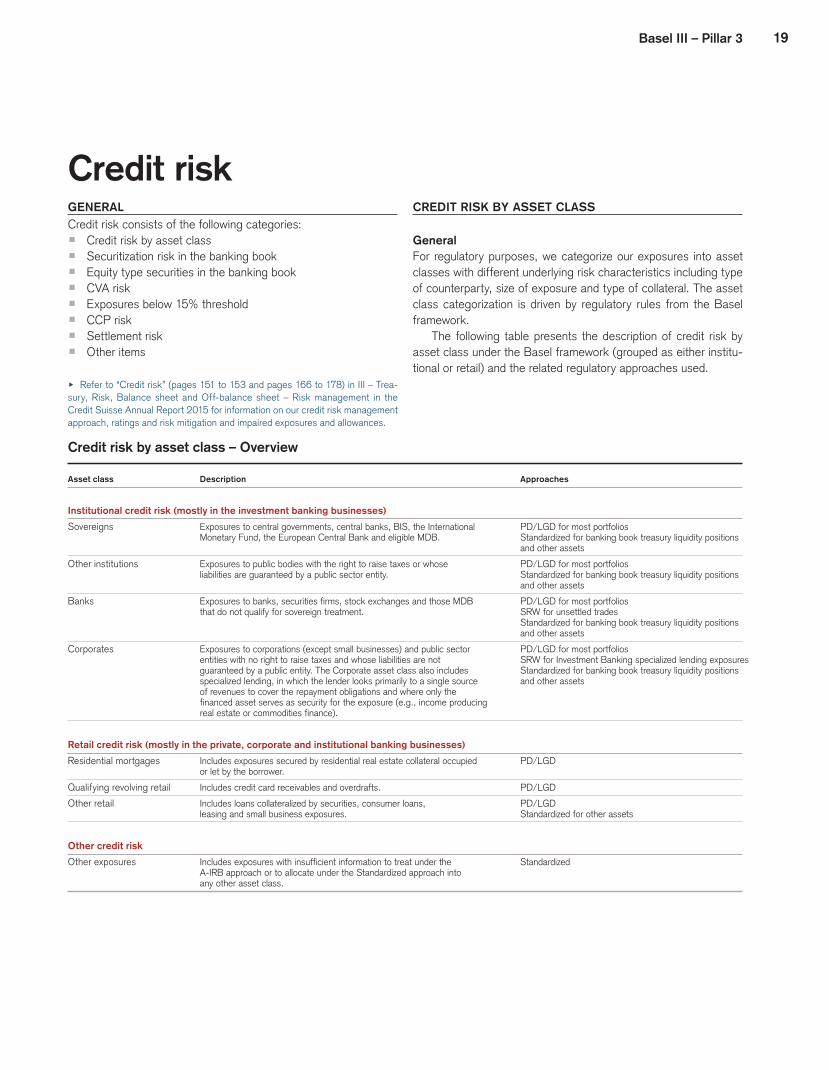
Credit riskGENERALCredit risk consists of the following categories:p Credit risk by asset classp Securitization risk in the banking bookp Equity type securities in the banking bookp CVA riskp Exposures below 15% thresholdp CCP riskp Settlement riskp Other items
u Refer to “Credit risk” (pages 151 to 153 and pages 166 to 178) in III – Trea-sury, Risk, Balance sheet and Off-balance sheet – Risk management in the Credit Suisse Annual Report 2015 for information on our credit risk management approach, ratings and risk mitigation and impaired exposures and allowances.
CREDIT RISK BY ASSET CLASS
GeneralFor regulatory purposes, we categorize our exposures into asset classes with different underlying risk characteristics including type of counterparty, size of exposure and type of collateral. The asset class categorization is driven by regulatory rules from the Basel framework.
The following table presents the description of credit risk by asset class under the Basel framework (grouped as either institu-tional or retail) and the related regulatory approaches used.
Credit risk by asset class – Overview
Asset class Description Approaches
Institutional credit risk (mostly in the investment banking businesses)
Sovereigns Exposures to central governments, central banks, BIS, the International PD/LGD for most portfolios
Monetary Fund, the European Central Bank and eligible MDB. Standardized for banking book treasury liquidity positions
and other assets
Other institutions Exposures to public bodies with the right to raise taxes or whose PD/LGD for most portfolios
liabilities are guaranteed by a public sector entity. Standardized for banking book treasury liquidity positions
and other assets
Banks Exposures to banks, securities firms, stock exchanges and those MDB PD/LGD for most portfolios
that do not qualify for sovereign treatment. SRW for unsettled trades
Standardized for banking book treasury liquidity positions
and other assets
Corporates Exposures to corporations (except small businesses) and public sector PD/LGD for most portfolios
entities with no right to raise taxes and whose liabilities are not SRW for Investment Banking specialized lending exposures
guaranteed by a public entity. The Corporate asset class also includes Standardized for banking book treasury liquidity positions
specialized lending, in which the lender looks primarily to a single source and other assets
of revenues to cover the repayment obligations and where only the
financed asset serves as security for the exposure (e.g., income producing
real estate or commodities finance).
Retail credit risk (mostly in the private, corporate and institutional banking businesses)
Residential mortgages Includes exposures secured by residential real estate collateral occupied PD/LGD
or let by the borrower.
Qualifying revolving retail Includes credit card receivables and overdrafts. PD/LGD
Other retail Includes loans collateralized by securities, consumer loans, PD/LGD
leasing and small business exposures. Standardized for other assets
Other credit risk
Other exposures Includes exposures with insufficient information to treat under the Standardized
A-IRB approach or to allocate under the Standardized approach into
any other asset class.
20
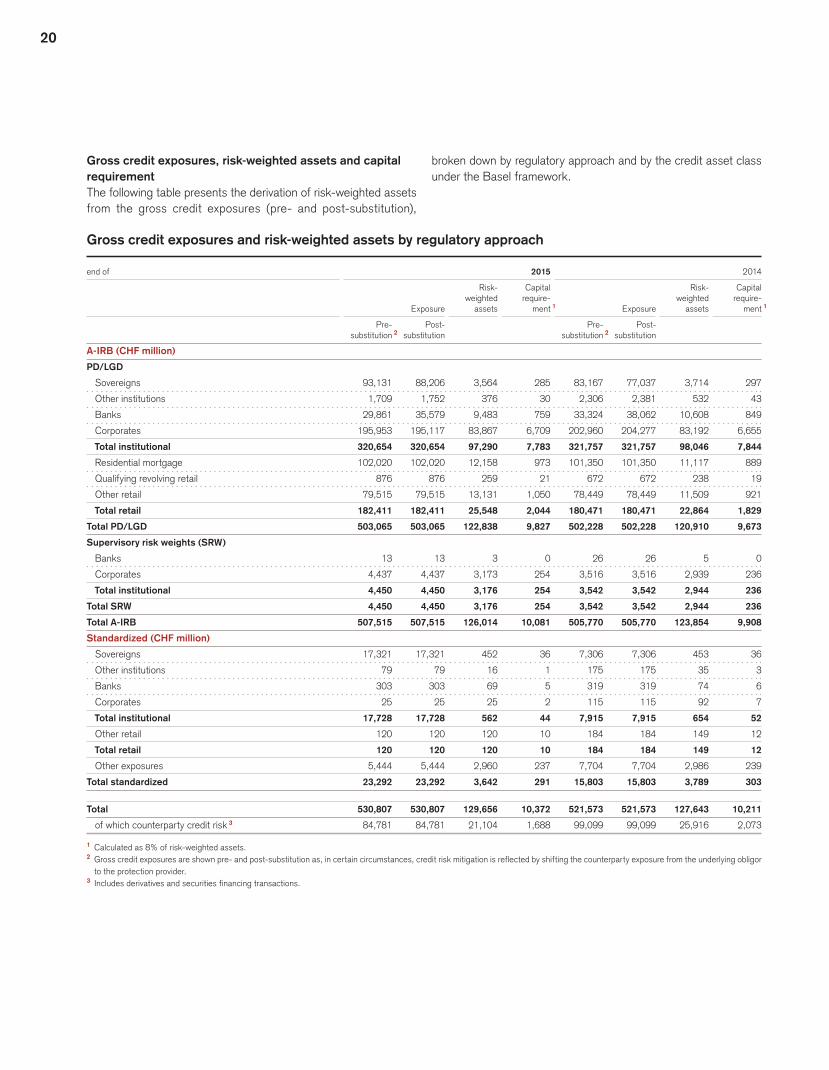
Gross credit exposures, risk-weighted assets and capital requirementThe following table presents the derivation of risk-weighted assets from the gross credit exposures (pre- and post-substitution),
broken down by regulatory approach and by the credit asset class under the Basel framework.
Gross credit exposures and risk-weighted assets by regulatory approach
end of 2015 2014
Risk- Capital Risk- Capital weighted require- weighted require-
Exposure assets ment 1 Exposure assets ment 1
Pre- Post- Pre- Post-
substitution 2 substitution substitution 2 substitution
A-IRB (CHF million)
PD/LGD
Sovereigns 93,131 88,206 3,564 285 83,167 77,037 3,714 297
Other institutions 1,709 1,752 376 30 2,306 2,381 532 43
Banks 29,861 35,579 9,483 759 33,324 38,062 10,608 849
Corporates 195,953 195,117 83,867 6,709 202,960 204,277 83,192 6,655
Total institutional 320,654 320,654 97,290 7,783 321,757 321,757 98,046 7,844
Residential mortgage 102,020 102,020 12,158 973 101,350 101,350 11,117 889
Qualifying revolving retail 876 876 259 21 672 672 238 19
Other retail 79,515 79,515 13,131 1,050 78,449 78,449 11,509 921
Total retail 182,411 182,411 25,548 2,044 180,471 180,471 22,864 1,829
Total PD/LGD 503,065 503,065 122,838 9,827 502,228 502,228 120,910 9,673
Supervisory risk weights (SRW)
Banks 13 13 3 0 26 26 5 0
Corporates 4,437 4,437 3,173 254 3,516 3,516 2,939 236
Total institutional 4,450 4,450 3,176 254 3,542 3,542 2,944 236
Total SRW 4,450 4,450 3,176 254 3,542 3,542 2,944 236
Total A-IRB 507,515 507,515 126,014 10,081 505,770 505,770 123,854 9,908
Standardized (CHF million)
Sovereigns 17,321 17,321 452 36 7,306 7,306 453 36
Other institutions 79 79 16 1 175 175 35 3
Banks 303 303 69 5 319 319 74 6
Corporates 25 25 25 2 115 115 92 7
Total institutional 17,728 17,728 562 44 7,915 7,915 654 52
Other retail 120 120 120 10 184 184 149 12
Total retail 120 120 120 10 184 184 149 12
Other exposures 5,444 5,444 2,960 237 7,704 7,704 2,986 239
Total standardized 23,292 23,292 3,642 291 15,803 15,803 3,789 303
Total 530,807 530,807 129,656 10,372 521,573 521,573 127,643 10,211
of which counterparty credit risk 3 84,781 84,781 21,104 1,688 99,099 99,099 25,916 2,073
1 Calculated as 8% of risk-weighted assets.2 Gross credit exposures are shown pre- and post-substitution as, in certain circumstances, credit risk mitigation is reflected by shifting the counterparty exposure from the underlying obligor
to the protection provider.3 Includes derivatives and securities financing transactions.
21Basel III – Pillar 3
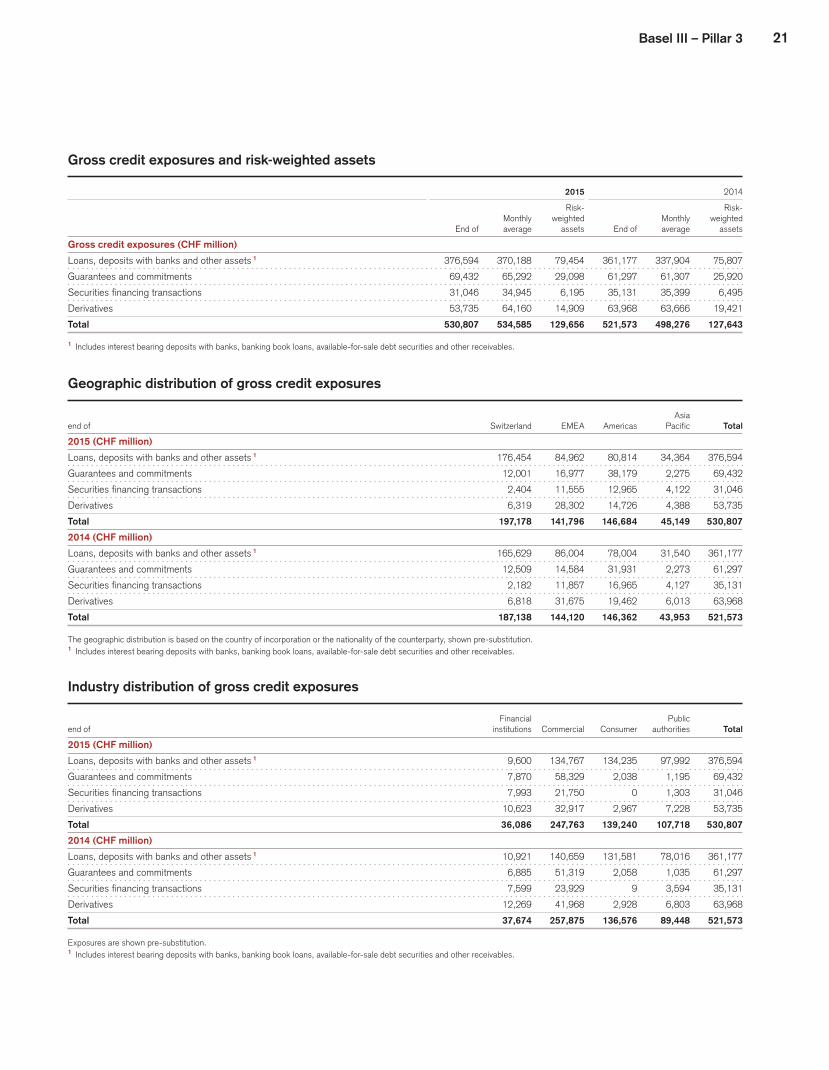
Gross credit exposures and risk-weighted assets
2015 2014
Risk- Risk-
Monthly weighted Monthly weighted
End of average assets End of average assets
Gross credit exposures (CHF million)
Loans, deposits with banks and other assets 1 376,594 370,188 79,454 361,177 337,904 75,807
Guarantees and commitments 69,432 65,292 29,098 61,297 61,307 25,920
Securities financing transactions 31,046 34,945 6,195 35,131 35,399 6,495
Derivatives 53,735 64,160 14,909 63,968 63,666 19,421
Total 530,807 534,585 129,656 521,573 498,276 127,643
1 Includes interest bearing deposits with banks, banking book loans, available-for-sale debt securities and other receivables.
Geographic distribution of gross credit exposures
Asia
end of Switzerland EMEA Americas Pacific Total
2015 (CHF million)
Loans, deposits with banks and other assets 1 176,454 84,962 80,814 34,364 376,594
Guarantees and commitments 12,001 16,977 38,179 2,275 69,432
Securities financing transactions 2,404 11,555 12,965 4,122 31,046
Derivatives 6,319 28,302 14,726 4,388 53,735
Total 197,178 141,796 146,684 45,149 530,807
2014 (CHF million)
Loans, deposits with banks and other assets 1 165,629 86,004 78,004 31,540 361,177
Guarantees and commitments 12,509 14,584 31,931 2,273 61,297
Securities financing transactions 2,182 11,857 16,965 4,127 35,131
Derivatives 6,818 31,675 19,462 6,013 63,968
Total 187,138 144,120 146,362 43,953 521,573
The geographic distribution is based on the country of incorporation or the nationality of the counterparty, shown pre-substitution.1 Includes interest bearing deposits with banks, banking book loans, available-for-sale debt securities and other receivables.
Industry distribution of gross credit exposures
Financial Public
end of institutions Commercial Consumer authorities Total
2015 (CHF million)
Loans, deposits with banks and other assets 1 9,600 134,767 134,235 97,992 376,594
Guarantees and commitments 7,870 58,329 2,038 1,195 69,432
Securities financing transactions 7,993 21,750 0 1,303 31,046
Derivatives 10,623 32,917 2,967 7,228 53,735
Total 36,086 247,763 139,240 107,718 530,807
2014 (CHF million)
Loans, deposits with banks and other assets 1 10,921 140,659 131,581 78,016 361,177
Guarantees and commitments 6,885 51,319 2,058 1,035 61,297
Securities financing transactions 7,599 23,929 9 3,594 35,131
Derivatives 12,269 41,968 2,928 6,803 63,968
Total 37,674 257,875 136,576 89,448 521,573
Exposures are shown pre-substitution.1 Includes interest bearing deposits with banks, banking book loans, available-for-sale debt securities and other receivables.

22
Remaining contractual maturity of gross credit exposures
within within
end of 1 year 1 1-5 years Thereafter Total
2015 (CHF million)
Loans, deposits with banks and other assets 2 178,341 146,768 51,485 376,594
Guarantees and commitments 21,644 44,532 3,256 69,432
Securities financing transactions 30,857 189 0 31,046
Derivatives 14,551 18,827 20,357 53,735
Total 245,393 210,316 75,098 530,807
2014 (CHF million)
Loans, deposits with banks and other assets 2 204,879 105,497 50,801 361,177
Guarantees and commitments 19,514 39,686 2,097 61,297
Securities financing transactions 34,690 434 7 35,131
Derivatives 22,420 18,940 22,608 63,968
Total 281,503 164,557 75,513 521,573
1 Includes positions without agreed residual contractual maturity.2 Includes interest bearing deposits with banks, banking book loans, available-for-sale debt securities and other receivables.
Portfolios subject to PD/LGD approach Rating modelsThe majority of the credit rating models used in Credit Suisse are developed internally by Credit Analytics, a specialized unit in Credit Risk Management (CRM). These models are independently vali-dated by Model Risk Management team prior to use in the Basel III regulatory capital calculation, and thereafter on a regular basis. Credit Suisse also uses models purchased from recognized data and model providers (e.g. credit rating agencies). These models are owned by Credit Analytics and are validated internally and fol-low the same governance process as models developed internally.
All new or material changes to rating models are subject to a robust governance process. Post development and validation of a
rating model or model change, the model is taken through a num-ber of committees where model developers, validators and users of the models discuss the technical and regulatory aspects of the model. The relevant committees opine on the information provided and decide to either approve or reject the model or model change. The ultimate decision making committee is the Risk Processes and Standards Committee (RPSC). The responsible Executive Board Member for the RPSC is the Chief Risk Officer. The RPSC sub-group responsible for credit risk models is the Credit Method-ology Steering Committee (CMSC). RPSC or CMSC also review and monitor the continued use of existing models on an annual basis.
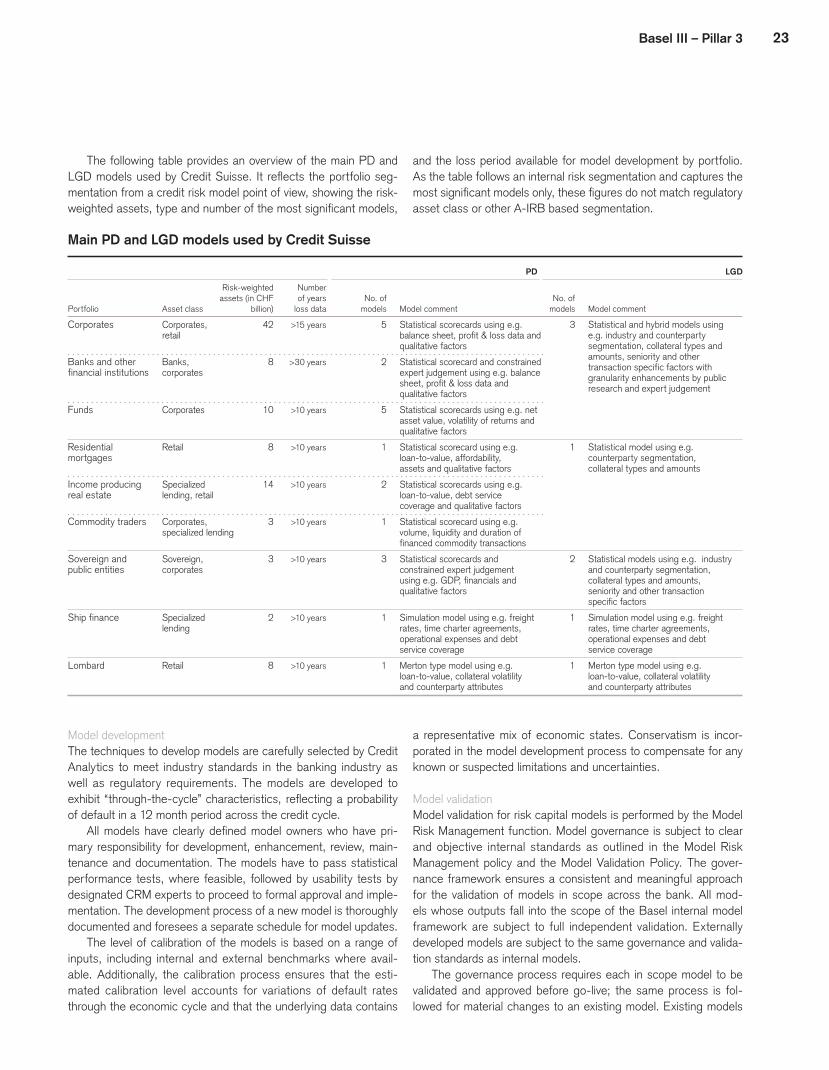
23Basel III – Pillar 3
The following table provides an overview of the main PD and LGD models used by Credit Suisse. It reflects the portfolio seg-mentation from a credit risk model point of view, showing the risk-weighted assets, type and number of the most significant models,
and the loss period available for model development by portfolio. As the table follows an internal risk segmentation and captures the most significant models only, these figures do not match regulatory asset class or other A-IRB based segmentation.
Main PD and LGD models used by Credit Suisse
PD LGD
Risk-weighted Number
assets (in CHF of years No. of No. of
Portfolio Asset class billion) loss data models Model comment models Model comment
Statistical and hybrid models using
e.g. industry and counterparty
segmentation, collateral types and
amounts, seniority and other
transaction specific factors with
granularity enhancements by public
research and expert judgement
Corporates Corporates, 42 >15 years 5 Statistical scorecards using e.g. 3
retail balance sheet, profit & loss data and
qualitative factors
Banks and other Banks, 8 >30 years 2 Statistical scorecard and constrained
financial institutions corporates expert judgement using e.g. balance
sheet, profit & loss data and
qualitative factors
Funds Corporates 10 >10 years 5 Statistical scorecards using e.g. net
asset value, volatility of returns and
qualitative factors
Statistical model using e.g.
counterparty segmentation,
collateral types and amounts
Residential Retail 8 >10 years 1 Statistical scorecard using e.g. 1
mortgages loan-to-value, affordability,
assets and qualitative factors
Income producing Specialized 14 >10 years 2 Statistical scorecards using e.g.
real estate lending, retail loan-to-value, debt service
coverage and qualitative factors
Commodity traders Corporates, 3 >10 years 1 Statistical scorecard using e.g.
specialized lending volume, liquidity and duration of
financed commodity transactions
Sovereign and Sovereign, 3 >10 years 3 Statistical scorecards and 2 Statistical models using e.g. industry public entities corporates constrained expert judgement and counterparty segmentation, using e.g. GDP, financials and collateral types and amounts, qualitative factors seniority and other transaction specific factors
Ship finance Specialized 2 >10 years 1 Simulation model using e.g. freight 1 Simulation model using e.g. freight lending rates, time charter agreements, rates, time charter agreements, operational expenses and debt operational expenses and debt service coverage service coverage
Lombard Retail 8 >10 years 1 Merton type model using e.g. 1 Merton type model using e.g. loan-to-value, collateral volatility loan-to-value, collateral volatility and counterparty attributes and counterparty attributes
Model developmentThe techniques to develop models are carefully selected by Credit Analytics to meet industry standards in the banking industry as well as regulatory requirements. The models are developed to exhibit “through-the-cycle” characteristics, reflecting a probability of default in a 12 month period across the credit cycle.
All models have clearly defined model owners who have pri-mary responsibility for development, enhancement, review, main-tenance and documentation. The models have to pass statistical performance tests, where feasible, followed by usability tests by designated CRM experts to proceed to formal approval and imple-mentation. The development process of a new model is thoroughly documented and foresees a separate schedule for model updates.
The level of calibration of the models is based on a range of inputs, including internal and external benchmarks where avail-able. Additionally, the calibration process ensures that the esti-mated calibration level accounts for variations of default rates through the economic cycle and that the underlying data contains
a representative mix of economic states. Conservatism is incor-porated in the model development process to compensate for any known or suspected limitations and uncertainties.
Model validationModel validation for risk capital models is performed by the Model Risk Management function. Model governance is subject to clear and objective internal standards as outlined in the Model Risk Management policy and the Model Validation Policy. The gover-nance framework ensures a consistent and meaningful approach for the validation of models in scope across the bank. All mod-els whose outputs fall into the scope of the Basel internal model framework are subject to full independent validation. Externally developed models are subject to the same governance and valida-tion standards as internal models.
The governance process requires each in scope model to be validated and approved before go-live; the same process is fol-lowed for material changes to an existing model. Existing models

24
are subject to an ongoing governance process which requires each model to be periodically validated and the performance to be moni-tored annually. The validation process is a comprehensive quantita-tive and qualitative assessment with goals that include: p to confirm that the model remains conceptually sound and the
model design is suitable for its intended purpose;p to verify that the assumptions are still valid and weaknesses
and limitations are known and mitigated;p to determine that the model outputs are accurate compared to
realized outcome;p to establish whether the model is accepted by the users and
used as intended with appropriate data governance;p to check whether a model is implemented correctly;p to ensure that the model is fully transparent and sufficiently
documented.
To meet these goals, models are validated against a series of quantitative and qualitative criteria. Quantitative analyses may include a review of model performance (comparison of model out-put against realized outcome), calibration accuracy against the lon-gest time series available, assessment of a model’s ability to rank order risk and performance against available benchmarks. Qualita-tive assessment typically includes a review of the appropriateness of the key model assumptions, the identification of the model limi-tations and their mitigation, and ensuring appropriate model use. The modeling approach is re-assessed in light of developments in the academic literature and industry practice.
Results and conclusions are presented to senior risk manage-ment including the RPSC; shortcomings and required improve-ments identified during validation must be remediated within an agreed deadline. The Model Risk Management function is inde-pendent of model developers and users and has the final say on the content of each validation report.
Stress testing of parametersThe potential biases in PD estimates in unusual market condi-tions are accounted for by the use of long run average estimates. Credit Suisse additionally uses stress-testing when back-testing PD models. When predefined thresholds are breached during back-testing, a review of the calibration level is undertaken. For LGD/CCF calibration stress testing is applied in defining Downturn LGD/CCF values, reflecting potentially increased losses during stressed periods.
Descriptions of the rating processes All counterparties that Credit Suisse is exposed to are assigned an internal credit rating. The rating is assigned at the time of ini-tial credit approval and subsequently reviewed and updated on an ongoing basis. Rating determination is based on relevant quantita-tive data (such as financial statements and financial projections) and qualitative factors relating to the counterparty which is used by CRM by employing a quantitative model which incorporates expert judgement through a well governed model override process in the
assignment of a credit rating or PD, which measures the counter-party’s risk of default over a one-year period.
Counterparty and transaction rating process – Corporates (excluding corporates managed on the Swiss platform), banks and sovereigns (primarily in the investment banking businesses)Where rating models are used, the models are an integral part of the rating process, and the outputs from the models are com-plemented with other relevant information by credit officers via a robust model-override framework where information not captured by the models is taken into account by experienced credit officers. In addition to the information captured by the rating models, credit officers make use of peer analysis, industry comparisons, exter-nal ratings and research and the judgment of credit experts to complement the model ratings. This analysis emphasizes a forward looking approach, concentrating on economic trends and financial fundamentals. Where rating models are not used the assignment of credit ratings is based on a well-established expert judgment based process which captures key factors specific to the type of counterparty.
For structured and asset finance deals, the approach is more quantitative. The focus is on the performance of the underlying assets, which represent the collateral of the deal. The ultimate rating is dependent upon the expected performance of the under-lying assets and the level of credit enhancement of the specific transaction. Additionally, a review of the originator and/or servicer is performed. External ratings and research (rating agency and/or fixed income and equity), where available, are incorporated into the rating justification, as is any available market information (e.g., bond spreads, equity performance).
Transaction ratings are based on the analysis and evaluation of both quantitative and qualitative factors. The specific factors ana-lyzed include seniority, industry and collateral. The analysis empha-sizes a forward looking approach.
Counterparty and transaction rating process – Corporates managed on the Swiss platform, mortgages and other retail (primarily in the private, corporate and institutional banking businesses) For corporates managed on the Swiss platform and mortgage lending, the PD is calculated directly by proprietary statistical rat-ing models, which are based on internally compiled data compris-ing both quantitative factors (primarily loan-to-value ratio and the borrower’s income level for mortgage lending and balance sheet information for corporates) and qualitative factors (e.g., credit histories from credit reporting bureaus). In this case, an equiva-lent rating is assigned for reporting purposes, based on the PD band associated with each rating. Collateral loans (margin lend-ing), which form the largest part of “Other retail”, is also following an individual PD and LGD approach for loans managed on the Swiss platform, while a pool PD and pool LGD approach is fol-lowed elsewhere. Both approaches are calibrated to historical loss experience. Most of the collateral loans are loans collateralized by securities.
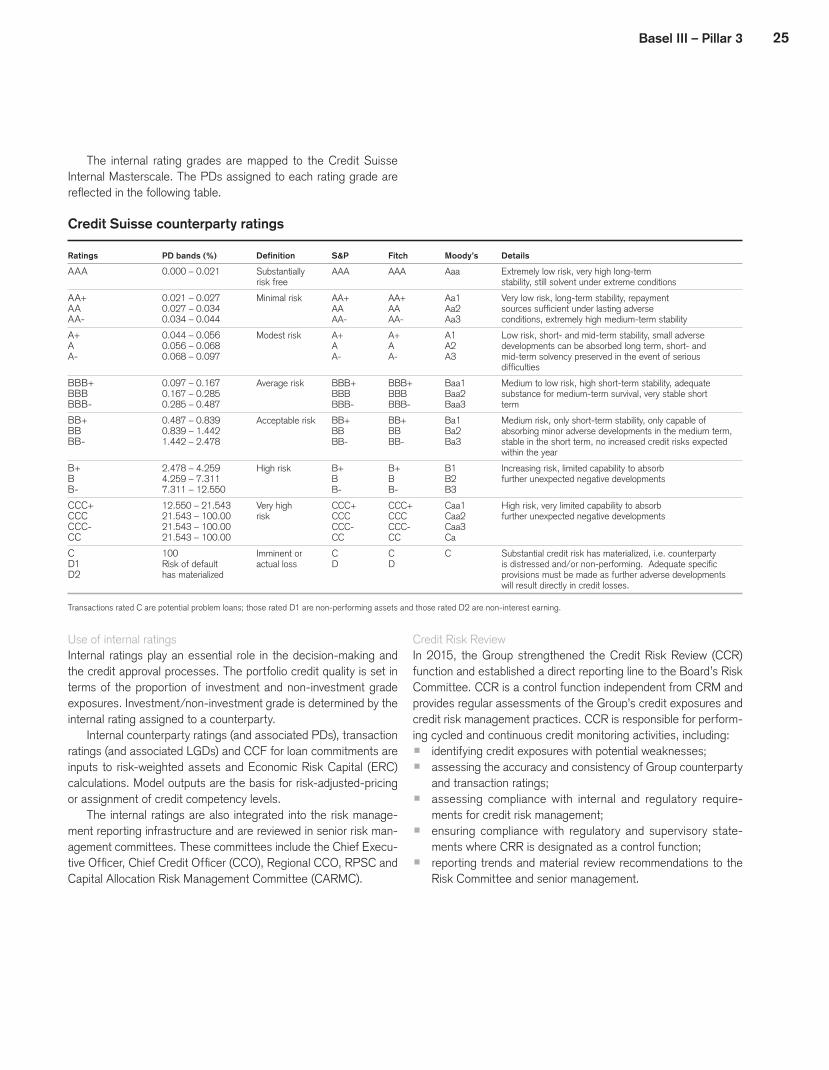
25Basel III – Pillar 3
The internal rating grades are mapped to the Credit Suisse Internal Masterscale. The PDs assigned to each rating grade are reflected in the following table.
Credit Suisse counterparty ratings
Ratings PD bands (%) Definition S&P Fitch Moody’s Details
AAA 0.000 – 0.021 Substantially AAA AAA Aaa Extremely low risk, very high long-term
risk free stability, still solvent under extreme conditions
AA+ 0.021 – 0.027 Minimal risk AA+ AA+ Aa1 Very low risk, long-term stability, repayment AA 0.027 – 0.034 AA AA Aa2 sources sufficient under lasting adverse
AA- 0.034 – 0.044 AA- AA- Aa3 conditions, extremely high medium-term stability
A+ 0.044 – 0.056 Modest risk A+ A+ A1 Low risk, short- and mid-term stability, small adverse A 0.056 – 0.068 A A A2 developments can be absorbed long term, short- and A- 0.068 – 0.097 A- A- A3 mid-term solvency preserved in the event of serious difficulties
BBB+ 0.097 – 0.167 Average risk BBB+ BBB+ Baa1 Medium to low risk, high short-term stability, adequate BBB 0.167 – 0.285 BBB BBB Baa2 substance for medium-term survival, very stable short BBB- 0.285 – 0.487 BBB- BBB- Baa3 term
BB+ 0.487 – 0.839 Acceptable risk BB+ BB+ Ba1 Medium risk, only short-term stability, only capable of BB 0.839 – 1.442 BB BB Ba2 absorbing minor adverse developments in the medium term, BB- 1.442 – 2.478 BB- BB- Ba3 stable in the short term, no increased credit risks expected within the year
B+ 2.478 – 4.259 High risk B+ B+ B1 Increasing risk, limited capability to absorb
B 4.259 – 7.311 B B B2 further unexpected negative developments
B- 7.311 – 12.550 B- B- B3
CCC+ 12.550 – 21.543 Very high CCC+ CCC+ Caa1 High risk, very limited capability to absorb
CCC 21.543 – 100.00 risk CCC CCC Caa2 further unexpected negative developments
CCC- 21.543 – 100.00 CCC- CCC- Caa3
CC 21.543 – 100.00 CC CC Ca
C 100 Imminent or C C C Substantial credit risk has materialized, i.e. counterparty D1 Risk of default actual loss D D is distressed and/or non-performing. Adequate specific D2 has materialized provisions must be made as further adverse developments will result directly in credit losses.
Transactions rated C are potential problem loans; those rated D1 are non-performing assets and those rated D2 are non-interest earning.
Use of internal ratingsInternal ratings play an essential role in the decision-making and the credit approval processes. The portfolio credit quality is set in terms of the proportion of investment and non-investment grade exposures. Investment/non-investment grade is determined by the internal rating assigned to a counterparty.
Internal counterparty ratings (and associated PDs), transaction ratings (and associated LGDs) and CCF for loan commitments are inputs to risk-weighted assets and Economic Risk Capital (ERC) calculations. Model outputs are the basis for risk-adjusted-pricing or assignment of credit competency levels.
The internal ratings are also integrated into the risk manage-ment reporting infrastructure and are reviewed in senior risk man-agement committees. These committees include the Chief Execu-tive Officer, Chief Credit Officer (CCO), Regional CCO, RPSC and Capital Allocation Risk Management Committee (CARMC).
Credit Risk ReviewIn 2015, the Group strengthened the Credit Risk Review (CCR) function and established a direct reporting line to the Board’s Risk Committee. CCR is a control function independent from CRM and provides regular assessments of the Group’s credit exposures and credit risk management practices. CCR is responsible for perform-ing cycled and continuous credit monitoring activities, including:p identifying credit exposures with potential weaknesses;p assessing the accuracy and consistency of Group counterparty
and transaction ratings;p assessing compliance with internal and regulatory require-
ments for credit risk management;p ensuring compliance with regulatory and supervisory state-
ments where CRR is designated as a control function;p reporting trends and material review recommendations to the
Risk Committee and senior management.

26
Institutional credit exposures by counterparty rating under PD/LGD approach
2015 2014
Exposure- Exposure- Undrawn Exposure- Exposure- Undrawn
Total weighted weighted commit- Total weighted weighted commit-
exposure average average risk ments exposure average average risk ments
(CHF m) LGD (%) weight (%) 1 (CHF m) (CHF m) LGD (%) weight (%) 1 (CHF m)
Sovereigns
AAA 46,768 3.22 0.54 22 33,353 5.56 0.79 21
AA 33,718 6.33 2.00 221 36,154 6.36 1.72 137
A 3,063 10.84 2.60 – 1,185 38.52 14.36 –
BBB 3,065 41.51 32.04 – 5,349 44.82 29.03 2
BB 1,257 48.79 66.95 – 711 26.91 56.96 –
B or lower 335 41.40 159.58 2 281 42.48 173.03 –
Default (net of specific provisions) – – – – 4 – – –
Total credit exposure 88,206 – – 245 77,037 – – 160
Exposure-weighted average CCF (%) 2 99.83 – – – 99.79 – – –
Other institutions
AAA – – – – – – – –
AA 973 44.02 10.25 204 1,538 45.21 10.82 227
A 259 42.50 16.18 44 174 40.42 16.81 39
BBB 482 44.86 40.73 96 536 43.41 38.93 101
BB 5 42.28 85.14 – 47 43.73 75.48 6
B or lower 33 12.19 36.81 4 86 27.37 72.76 4
Default (net of specific provisions) 0 – – – – – – –
Total credit exposure 1,752 – – 348 2,381 – – 377
Exposure-weighted average CCF (%) 2 70.17 – – – 75.27 – – –
Banks
AAA – – – – – – – –
AA 7,543 51.68 11.18 761 7,577 51.00 11.75 930
A 19,850 53.16 15.65 2,578 20,779 51.76 17.85 2,599
BBB 5,079 46.30 40.04 312 6,603 45.39 41.00 278
BB 2,641 51.47 83.54 50 2,364 49.70 77.06 74
B or lower 397 50.94 172.99 19 587 40.17 124.04 46
Default (net of specific provisions) 69 – – 11 152 – – –
Total credit exposure 35,579 – – 3,731 38,062 – – 3,927
Exposure-weighted average CCF (%) 2 94.89 – – – 94.46 – – –
Corporates
AAA – – – – – – – –
AA 39,447 46.01 10.86 7,993 46,771 48.29 12.97 8,522
A 38,437 46.28 17.93 11,804 46,692 38.79 16.28 10,783
BBB 49,490 37.12 35.59 12,196 49,069 35.93 34.05 10,280
BB 48,931 32.73 62.98 10,620 43,584 33.60 67.54 6,515
B or lower 17,015 27.17 104.13 5,625 17,312 30.47 102.92 6,181
Default (net of specific provisions) 1,797 – – 81 849 – – 20
Total credit exposure 195,117 – – 48,319 204,277 – – 42,301
Exposure-weighted average CCF (%) 2 73.74 – – – 75.87 – – –
Total institutional credit exposure 320,654 – – 52,643 321,757 – – 46,765
1 The exposure-weighted average risk weights in percentage terms is the multiplier applied to regulatory exposures to derive risk-weighted assets, and may exceed 100%.2 Calculated before credit risk mitigation.

27Basel III – Pillar 3
Retail credit exposures by expected loss band under PD/LGD approach
2015 2014
Exposure- Exposure- Undrawn Exposure- Exposure- Undrawn
Total weighted weighted commit- Total weighted weighted commit-
exposure average average risk ments exposure average average risk ments
(CHF m) LGD (%) weight (%) 1 (CHF m) (CHF m) LGD (%) weight (%) (CHF m)
Residential mortgages
0.00%-0.15% 96,708 15.30 9.27 1,222 95,468 15.74 8.46 1,298
0.15%-0.30% 3,232 23.28 35.12 77 3,695 28.75 29.50 102
0.30%-1.00% 1,728 23.56 57.94 15 1,820 28.97 52.53 26
1.00% and above 129 22.45 114.65 – 148 24.98 100.87 –
Defaulted (net of specific provisions) 223 – – 3 219 – – 1
Total credit exposure 102,020 – – 1,317 101,350 – – 1,427
Exposure-weighted average CCF (%) 2 98.15 – – – 97.94 – – –
Qualifying revolving retail
0.00%-0.15% – – – – – – – –
0.15%-0.30% – – – – – – – –
0.30%-1.00% 769 50.00 23.35 – 491 50.00 23.35 –
1.00% and above 106 20.00 60.59 – 180 20.00 60.59 –
Defaulted (net of specific provisions) 1 – – – 1 – – –
Total credit exposure 876 – – – 672 – – –
Exposure-weighted average CCF (%) 2 99.98 – – – 99.98 – – –
Other retail
0.00%-0.15% 68,647 55.15 8.66 1,239 72,559 53.58 10.55 1,192
0.15%-0.30% 2,271 62.87 35.12 45 924 60.79 31.91 73
0.30%-1.00% 3,786 46.27 45.06 90 2,406 44.30 48.46 73
1.00% and above 4,444 57.99 80.41 45 2,407 46.39 65.96 48
Defaulted (net of specific provisions) 367 – – 2 153 – – 3
Total credit exposure 79,515 – – 1,421 78,449 – – 1,389
Exposure-weighted average CCF (%) 2 94.69 – – – 94.91 – – –
Total retail credit exposure 182,411 – – 2,738 180,471 – – 2,816
1 The exposure-weighted average risk weights in percentage terms is the multiplier applied to regulatory exposures to derive risk-weighted assets, and may exceed 100%.2 Calculated before credit risk mitigation.

28
Loss analysis – regulatory expected loss vs. cumulative actual lossThe following table shows the regulatory expected loss as of the beginning of the years compared with the cumulative actual loss
incurred during the year ended December 31, 2015 and 2014, respectively, for those portfolios where credit risk is calculated using the IRB approach.
Analysis of expected loss vs. cumulative actual loss
2015 2014
Expected Expected
loss loss
(beginning Cumulative (beginning Cumulative
of year) actual loss of year) actual loss
Losses (CHF million)
Sovereigns 19 0 13 0
Banks 300 235 275 221
Other institutions 2 187 2 260
Corporates 1 1,741 1,079 1,496 903
Residential mortgages 84 25 93 23
Other retail (including qualifying revolving retail) 311 164 315 272
Total losses 2,457 1,690 2,194 1,679
1 Excludes specialized lending portfolios that are not subject to the PD/LGD approach.
Regulatory expected lossRegulatory expected loss is a Basel III measure based on Pillar 1 metrics which is an input to the capital adequacy calculation. Regulatory expected loss can be seen as an expectation of aver-age future loss as derived from our IRB models, and is not a pre-diction of future impairment. For non-defaulted assets, regula-tory expected loss is calculated using PD and downturn estimates of LGD and CCF. For the calculation of regulatory expected loss for defaulted accrual accounted assets, PD is 100% and LGD is based on an estimate of likely recovery levels for each asset.
Cumulative actual lossCumulative actual loss comprises two parts: the opening impair-ment balance and the specific impairment losses for loans held at amortized cost and actual value charges providing an equivalent impairment measure for both fair value loans and counterparty
exposures as if these were loans held at amortized cost (excluding any realized CDS gains). The actual value charges may not neces-sarily be the same as the fair value movements recorded through the consolidated statements of operations.
Cumulative actual loss can also include charges against assets that were originated during the year and were therefore outside of the scope of the regulatory expected loss calculated at the beginning of the year. Cumulative actual loss does not include the effects on the impairment balance of amounts written off during the year.
The average cumulative actual loss over the last two years is below the expected loss estimates reflecting a level of conserva-tism in the corporate and residential mortgage rating models.
The following table presents the components of the cumulative actual loss.
Cumulative actual loss
2015 2014
Opening Specific Actual Total Opening Specific Actual Total impairment impairment value actual impairment impairment value actual balance losses charges loss balance losses charges loss
CHF million
Sovereigns 0 0 0 0 77 0 (77) 0
Banks 243 0 (8) 235 221 0 0 221
Other institutions 193 0 (6) 187 187 (3) 76 260
Corporates 1 622 256 201 1,079 611 124 168 903
Residential mortgages 22 3 0 25 25 (2) 0 23
Other retail 91 73 0 164 196 76 0 272
Total 1,171 332 187 1,690 1,317 195 167 1,679
1 Excludes specialized lending portfolios that are not subject to the PD/LGD approach.

29Basel III – Pillar 3
Credit Model Performance – estimated vs. actual The following tables present the estimated and actual PD, LGD and CCF for assets under the IRB approach. They represent multi-year averages and, hence, are not intended to predict outcomes in any particular year, and cannot be regarded as predictions of the corresponding actual reported results.
Estimated PD, LGD and CCF are taken from each model and then mapped to the regulatory asset class. In the tables below, the comparison between actual and estimated parameters is derived from the latest available internal multi-year model development and calibration data. Disclosed numbers are not directly comparable to previous years due to extension of the covered period.
Analysis of expected credit model performance vs. actual results – private, corporate and institutional banking businesses
PD of total LGD of defaulted
portfolio (%) assets (%)
Estimated Actual Estimated Actual
Corporates 0.77 0.39 38 25
Residential mortgages 0.36 0.12 15 7
Other retail
Lombard 0.09 0.04 65 29
Other 2.27 1.85 32 23
CCF of defaulted assets only disclosed on a total private, corporate and institutional banking businesses basis. Estimated CCF: 27%; actual CCF: 16%.
Analysis of expected credit model performance vs. actual results – investment banking businesses
PD of total LGD of defaulted
portfolio (%) assets (%)
Estimated Actual Estimated Actual
Sovereigns 1.69 0.31 52 2
Banks 1.64 0.23 50 19
Corporates and other institutions 2.12 0.35 36 35
CCF of defaulted assets only disclosed on a total investment banking businesses basis. Estimated CCF: 63%; actual CCF: 55%.
Portfolios subject to the standardized and supervisory risk weights approachesStandardized approachUnder the standardized approach, risk weights are determined either according to credit ratings provided by recognized ECAIs or, for unrated exposures, by using the applicable regulatory risk weights. Less than 10% of our credit risk is determined using this approach. Balances include banking book treasury liquidity positions.
Supervisory risk weights approachFor specialized lending exposures, internal rating grades are mapped to one of five supervisory categories, associated with a specific risk weight under the SRW approach.
Equity IRB Simple approachFor equity type securities in the banking book, risk weights are determined using the IRB Simple approach, which differentiates by equity sub-asset types (listed equity and all other equity positions). From January 1, 2014, the risk weighting for private equity posi-tions was increased to 400%, in line with the treatment applied to other equity positions.
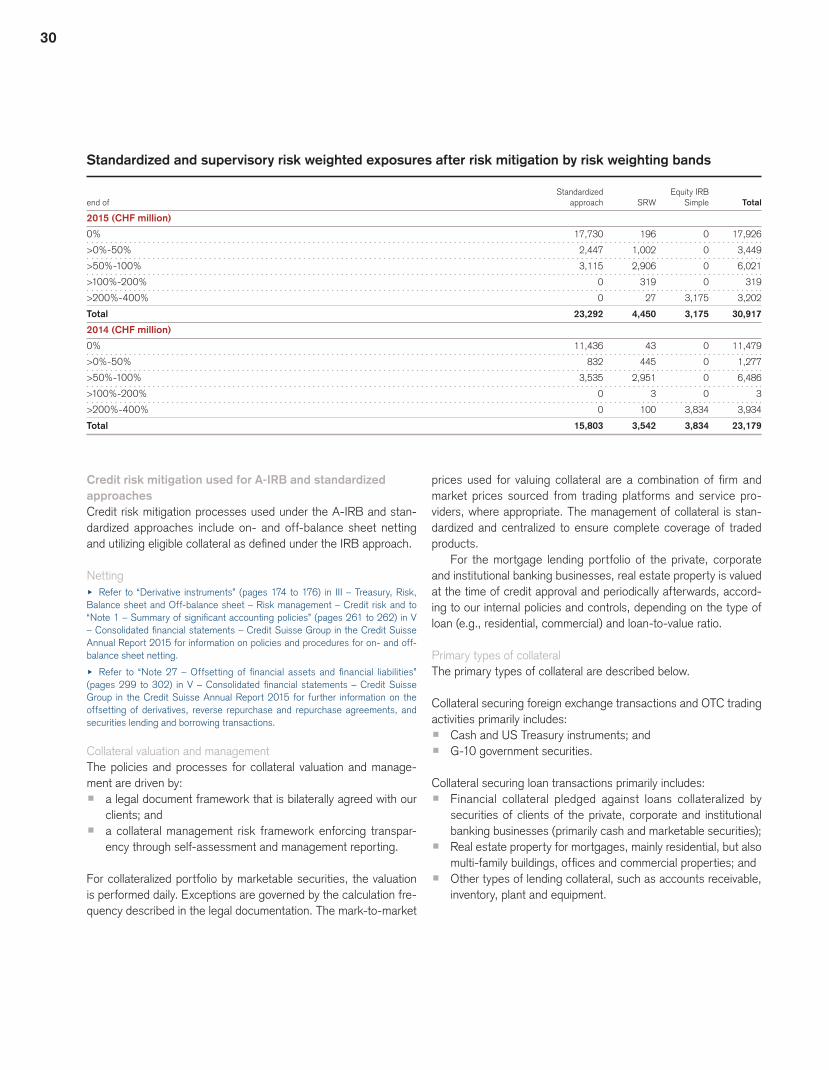
30
Standardized and supervisory risk weighted exposures after risk mitigation by risk weighting bands
Standardized Equity IRB
end of approach SRW Simple Total
2015 (CHF million)
0% 17,730 196 0 17,926
>0%-50% 2,447 1,002 0 3,449
>50%-100% 3,115 2,906 0 6,021
>100%-200% 0 319 0 319
>200%-400% 0 27 3,175 3,202
Total 23,292 4,450 3,175 30,917
2014 (CHF million)
0% 11,436 43 0 11,479
>0%-50% 832 445 0 1,277
>50%-100% 3,535 2,951 0 6,486
>100%-200% 0 3 0 3
>200%-400% 0 100 3,834 3,934
Total 15,803 3,542 3,834 23,179
Credit risk mitigation used for A-IRB and standardized approachesCredit risk mitigation processes used under the A-IRB and stan-dardized approaches include on- and off-balance sheet netting and utilizing eligible collateral as defined under the IRB approach.
Nettingu Refer to “Derivative instruments” (pages 174 to 176) in III – Treasury, Risk, Balance sheet and Off-balance sheet – Risk management – Credit risk and to “Note 1 – Summary of significant accounting policies” (pages 261 to 262) in V – Consolidated financial statements – Credit Suisse Group in the Credit Suisse Annual Report 2015 for information on policies and procedures for on- and off-balance sheet netting.
u Refer to “Note 27 – Offsetting of financial assets and financial liabilities” (pages 299 to 302) in V – Consolidated financial statements – Credit Suisse Group in the Credit Suisse Annual Report 2015 for further information on the offsetting of derivatives, reverse repurchase and repurchase agreements, and securities lending and borrowing transactions.
Collateral valuation and management The policies and processes for collateral valuation and manage-ment are driven by:p a legal document framework that is bilaterally agreed with our
clients; andp a collateral management risk framework enforcing transpar-
ency through self-assessment and management reporting.
For collateralized portfolio by marketable securities, the valuation is performed daily. Exceptions are governed by the calculation fre-quency described in the legal documentation. The mark-to-market
prices used for valuing collateral are a combination of firm and market prices sourced from trading platforms and service pro-viders, where appropriate. The management of collateral is stan-dardized and centralized to ensure complete coverage of traded products.
For the mortgage lending portfolio of the private, corporate and institutional banking businesses, real estate property is valued at the time of credit approval and periodically afterwards, accord-ing to our internal policies and controls, depending on the type of loan (e.g., residential, commercial) and loan-to-value ratio.
Primary types of collateral The primary types of collateral are described below.
Collateral securing foreign exchange transactions and OTC trading activities primarily includes:p Cash and US Treasury instruments; andp G-10 government securities.
Collateral securing loan transactions primarily includes:p Financial collateral pledged against loans collateralized by
securities of clients of the private, corporate and institutional banking businesses (primarily cash and marketable securities);
p Real estate property for mortgages, mainly residential, but also multi-family buildings, offices and commercial properties; and
p Other types of lending collateral, such as accounts receivable, inventory, plant and equipment.

31Basel III – Pillar 3
Concentrations within risk mitigationOur investment banking businesses are active participants in the credit derivatives market and trades with a variety of market par-ticipants, principally commercial banks and broker dealers. Credit derivatives are primarily used to mitigate investment grade coun-terparty exposures.
Concentrations in our lending portfolio of the private, corpo-rate and institutional banking businesses arise due to a significant
volume of mortgages in Switzerland. The financial collateral used to secure loans collateralized by securities worldwide is generally diversified and the portfolio is regularly analyzed to identify any underlying concentrations, which may result in lower loan-to-value ratios. u Refer to “Credit risk” (pages 151 to 153) in III – Treasury, Risk, Balance sheet and Off-balance sheet – Risk management in the Credit Suisse Annual Report 2015 for further information on risk mitigation.
Credit risk mitigation used for A-IRB and standardized approaches
Other Eligible
Eligible eligible guarantees/
financial IRB credit
end of collateral collateral derivatives
2015 (CHF million)
Sovereigns 290 0 5,308
Other institutions 14 84 101
Banks 973 0 1,114
Corporates 8,526 36,275 19,762
Residential mortgages 3,996 82,884 29
Other retail 67,114 3,669 263
Total 80,913 122,912 26,577
2014 (CHF million)
Sovereigns 711 0 6,823
Other institutions 3 103 96
Banks 1,684 0 1,025
Corporates 6,761 34,408 17,951
Residential mortgages 3,817 81,933 45
Other retail 66,347 4,325 244
Total 79,323 120,769 26,184
Excludes collateral used to adjust EAD (e.g. as applied under the internal models method).
Counterparty credit riskCounterparty exposureCounterparty credit risk arises from OTC and exchange-traded derivatives, repurchase agreements, securities lending and bor-rowing and other similar products and activities. The subsequent credit risk exposures depend on the value of underlying market factors (e.g., interest rates and foreign exchange rates), which can be volatile and uncertain in nature.
We have received approval from FINMA to use the internal model method for measuring counterparty risk for the majority of our derivative and secured financing exposures.
Credit limitsAll credit exposure is approved, either by approval of an individual transaction/facility (e.g., lending facilities), or under a system of credit limits (e.g., OTC derivatives). Credit exposure is monitored daily to ensure it does not exceed the approved credit limit. These credit limits are set either on a potential exposure basis or on a notional exposure basis. Potential exposure means the possible future value that would be lost upon default of the counterparty on
a particular future date, and is taken as a high percentile of a dis-tribution of possible exposures computed by our internal exposure models. Secondary debt inventory positions are subject to sepa-rate limits that are set at the issuer level.u Refer to “Credit risk” (pages 166 to 178) in III – Treasury, Risk, Balance sheet and Off-balance sheet – Risk management in the Credit Suisse Annual Report 2015 for further information on counterparty credit risk, including transaction rat-ing, credit approval process and provisioning.
Wrong-way exposuresCorrelation risk arises when we enter into a financial transaction where market rates are correlated to the financial health of the counterparty. In a wrong-way trading situation, our exposure to the counterparty increases while the counterparty’s financial health and its ability to pay on the transaction diminishes.
Capturing wrong-way risk requires the establishment of basic assumptions regarding correlations for a given trading product. We have multiple processes that allow us to capture and estimate wrong-way risk.

32
Credit approval and reviewsA primary responsibility of CRM is to monitor counterparty expo-sure and the creditworthiness of a counterparty, both at the initia-tion of the relationship and on an ongoing basis. Part of the review and approval process is an analysis and discussion to understand the motivation of the client and to identify the directional nature of the trading in which the client is engaged. Credit limits are agreed in line with the Group’s risk appetite framework taking into account the strategy of the counterparty, the level of disclosure of financial information and the amount of risk mitigation that is present in the trading relationship (e.g., level of collateral).
Exposure adjusted risk calculationMaterial trades that feature specific wrong-way risk are applied a conservative treatment for the purpose of calculating exposure profiles. The wrong-way risk framework applies to OTC, securities financing transactions and centrally cleared trades.
Wrong-way risk arises if the exposure the Group has against a counterparty is expected to be high when the probability of default of that counterparty is also high. Wrong-way risk can affect the exposure against a counterparty in two ways:p The mark-to-market of a trade can be large if the counter-
party’s PD is high.p The value of collateral pledged by that counterparty can be low
if the counterparty’s PD is high.
Two main types of wrong-way risk are distinguished:p “General wrong-way risk” arises when the likelihood of default
by counterparties is materially positively correlated with general market risk factors.
p “Specific wrong-way risk” arises when potential exposure to a specific counterparty is materially positively correlated with the counterparty’ probability of default due to the nature of the transactions with the counterparty.
There are two variants of specific wrong-way risk:p If there is a legal connection between the counterparty and
the exposure, e.g. the Group buying a put from a counter-party on shares of that counterparty or a parent/subsidiary of that counterparty or a counterparty pledging its own shares or bonds as collateral.
p More general correlation driven specific wrong-way risk.
The presence of wrong-way risk is detected via automated checks for legal connection and via means of stress scenarios and histori-cal time series analyses for correlation.
For those instances where a material wrong-way risk pres-ence is detected, limit utilization and default capital are accordingly adjusted.
Regular reporting of wrong-way risk at both the individual trade and portfolio level allows wrong-way risk to be identified and
corrective action taken in the case of heightened concern by CRM. Reporting occurs at various levels: p Country exposure reporting – Exposure is reported against
country limits established for emerging market countries. Exposures that exhibit wrong-way characteristics are given higher risk weighting versus non-correlated transactions, resulting in a greater amount of country limit usage for these trades.
p Counterparty exposure reporting – Transactions that contain wrong-way risk are risk-weighted as part of the daily exposure calculation process, as defined in the credit analytics exposure methodology document. This ensures that correlated transac-tions utilize more credit limit.
p Correlated repurchase and foreign exchange reports – Monthly reports produced by CRM capturing correlated repurchase and foreign exchange transactions. This information is reviewed by relevant CRM credit officers.
p Scenario risk reporting – In order to identify areas of poten-tial wrong-way risk within the portfolio, a set of defined sce-narios are run monthly. The scenarios are determined by CRM and involve combining existing scenario drivers with specific industries to determine where portfolios are sensitive to these stressed parameters, e.g. construction companies / rising interest rates.
p Scenario analysis is also produced for hedge funds which are exposed to particular risk sensitivities and also may have col-lateral concentrations due to a specific direction and strategy.
p In addition, and where required, CRM may prepare periodic trade level scenario analysis, in order to review the risk drivers and directionality of the exposure to a counterparty.
The Front Office is responsible for identifying and escalating trades that could potentially give rise to wrong-way risk.
Any material wrong-way risk at portfolio or trade level should be escalated to senior CRM executives and risk committees.
Effect of a credit rating downgradeOn a daily basis, we monitor the level of incremental collateral that would be required by derivative counterparties in the event of a Credit Suisse ratings downgrade. Collateral triggers are main-tained by our collateral management department and vary by counterparty. u Refer to “Credit ratings” (page 113) in III – Treasury, Risk, Balance sheet and Off-balance sheet – Liquidity and funding management in the Credit Suisse Annual Report 2015 for further information on the effect of a one, two or three notch downgrade as of December 31, 2015.
The impact of downgrades in the Bank’s long-term debt ratings are considered in the stress assumptions used to determine the conservative funding profile of our balance sheet and would not be material to our liquidity and funding needs. u Refer to “Liquidity and funding management” (pages 106 to 113) in III – Trea-sury, Risk, Balance sheet and Off-balance sheet in the Credit Suisse Annual Report 2015 for further information on liquidity and funding management.

33Basel III – Pillar 3
Credit exposures on derivative instrumentsWe enter into derivative contracts in the normal course of business for market making, positioning and arbitrage purposes, as well as for our own risk management needs, including mitigation of inter-est rate, foreign currency and credit risk. Derivative exposure also includes economic hedges, where the Group enters into derivative contracts for its own risk management purposes but where the contracts do not qualify for hedge accounting under US GAAP. Derivative exposures are calculated according to regulatory meth-ods, using either the current exposures method or approved inter-nal models method. These regulatory methods take into account potential future movements and as a result generate risk expo-sures that are greater than the net replacement values disclosed for US GAAP.
As of the end of 2015, no credit derivatives were utilized that qualify for hedge accounting under US GAAP. u Refer to “Derivative instruments” (pages 174 to 176) in III – Treasury, Risk, Balance sheet and Off-balance sheet – Risk management – Credit risk in the Credit Suisse Annual Report 2015 for further information on derivative instru-ments, including counterparties and their creditworthiness.
u Refer to “Note 32 – Derivative and hedging activities” (pages 325 to 330) in V – Consolidated financial statements – Credit Suisse Group in the Credit Suisse Annual Report 2015 for further information on the fair value of derivative instruments and the distribution of current credit exposures by types of credit exposures.u Refer to “Note 27 – Offsetting of financial assets and financial liabilities” (pages 299 to 302) in V – Consolidated financial statements – Credit Suisse Group in the Credit Suisse Annual Report 2015 for further information on netting benefits, netted current credit exposures, collateral held and net derivatives credit exposure.
Derivative exposure at default after netting
end of 2015 2014
Derivative exposure at default (CHF million)
Internal models method 44,875 53,802
Current exposure method 8,860 10,166
Total derivative exposure 53,735 63,968
Collateral used for risk mitigation
end of 2015 2014
Collateral used for risk mitigation for the internal models method (CHF million)
Financial collateral – cash / securities 27,104 32,463
Other eligible IRB collateral 232 723
Total collateral used for the internal models method 27,336 33,186
Collateral used for risk mitigation for the current exposure method (CHF million)
Financial collateral – cash / securities 3,715 4,077
Other eligible IRB collateral 712 589
Total collateral used for the current exposure method 4,427 4,666
Credit derivatives that create exposures to counterparty credit risk (notional value)
end of 2015 2014
Protection Protection Protection Protection
bought sold bought sold
Credit derivatives that create exposures to counterparty credit risk (CHF billion)
Credit default swaps 409.4 364.5 619.0 570.3
Total return swaps 7.7 0.1 12.5 0.1
Other credit derivatives 39.6 10.5 65.8 19.8
Total 456.7 375.1 697.3 590.2

34
Allowances and impaired loansThe following tables provide additional information on allowances and impaired loans by geographic distribution and changes in the allowances for impaired loans.
Geographic distribution of allowances and impaired loans
Allowances Allowances Impaired
individually collectively Impaired loans
evaluated evaluated loans with without Total for for Total specific specific impaired
end of impairment impairment allowances allowances allowances loans
2015 (CHF million)
Switzerland 433 171 604 1,078 185 1,263
EMEA 8 9 17 56 65 121
Americas 175 32 207 275 113 388
Asia Pacific 34 4 38 201 0 201
Total 650 216 866 1,610 363 1,973
2014 (CHF million)
Switzerland 451 170 621 1,051 69 1,120
EMEA 11 8 19 72 17 89
Americas 78 33 111 174 7 181
Asia Pacific 0 7 7 0 0 0
Total 540 218 758 1,297 93 1,390
The geographic distribution of impaired loans is based on the location of the office recording the transaction. This presentation does not reflect the way the Group is managed.
Changes in the allowances for impaired loans
2015 2014
Allowances Allowances Allowances Allowances
individually collectively individually collectively
evaluated evaluated evaluated evaluated
for for for for
impairment impairment Total impairment impairment Total
Changes in the allowances for impaired loans (CHF million)
Balance at beginning of period 540 218 758 654 215 869
Net additions/(releases) charged to income statement 296 (1) 295 142 3 145
Gross write-offs (229) 0 (229) (349) 0 (349)
Recoveries 28 0 28 41 0 41
Net write-offs (201) 0 (201) (308) 0 (308)
Provisions for interest 18 0 18 20 0 20
Foreign currency translation impact and other adjustments, net (3) (1) (4) 32 0 32
Balance at end of period 650 216 866 540 218 758
u Refer to “Loans” in “Note 1 – Summary of significant accounting policies” (pages 263 to 265) in V – Consolidated financial statements – Credit Suisse Group in the Credit Suisse Annual Report 2015 for further information on defini-tions of past due and impaired loans.
u Refer to “Note 19 – Loans, allowance for loan losses and credit quality” (pages 284 to 292) in V – Consolidated financial statements – Credit Suisse Group in the Credit Suisse Annual Report 2015 for further information on allow-ances and impaired loans by industry distribution and the industry distribution of charges and write-offs.
35Basel III – Pillar 3
SECURITIZATION RISK IN THE BANKING BOOKThe following disclosures, which also considers the “Industry good practice guidelines on Pillar 3 disclosure requirements for securiti-zation”, refer to traditional and synthetic securitizations held in the banking book and regulatory capital on these exposures calculated according to the Basel III IRB and standardized approaches to securitization exposures.u Refer to “Note 34 – Transfers of financial assets and variable interest entities” (pages 335 to 344) in V – Consolidated financial statements – Credit Suisse Group in the Credit Suisse Annual Report 2015 for further information on securi-tization, the various roles, the use of SPEs, the involvement of the Group in con-solidated and non-consolidated SPEs, the accounting policies for securitization activities and methods and key assumptions applied in valuing positions retained/purchased.
A traditional securitization is a structure where an underlying pool of assets is sold to an SPE which pays for the assets by issuing tranched securities collateralized by the underlying asset pool. A synthetic securitization is a tranched structure where the credit risk of an underlying pool of assets is transferred, in whole or in part, through the use of credit derivatives or guarantees that may serve to hedge the credit risk of the portfolio. Many synthetic securitiza-tions are not accounted for as securitizations under US GAAP. In both traditional and synthetic securitizations, risk is dependent on the seniority of the retained interest and the performance of the underlying asset pool.
The Group has both securitization and re-securitization trans-actions in the banking book referencing different types of underly-ing assets including real estate loans (commercial and residential), commercial loans and credit card loans. The key risks retained are related to the performance of the underlying assets. These risks are summarized in the securitization pool level attributes: PDs of underlying loans (default rate), severity of loss (LGD) and prepay-ment speeds. The transactions may also be exposed to general market risk, credit spread and counterparty credit risk.
The Group classifies securities within the transactions by the nature of the collateral (prime, sub-prime, Alt-A, commercial, etc.) and the seniority each security has in the capital structure (i.e. senior, mezzanine, subordinate etc.), which in turn will be reflected in the transaction rating. The Group’s internal risk methodology is designed such that risk charges are based on the place the
particular security holds in the capital structure, the less senior the bond the higher the risk charges.
For re-securitization risk, the Group’s risk management models take a ‘look through’ approach where the behavior of the underly-ing securities or constituent counterparties are modeled based on their own particular collateral positions. These are then transmitted to the re-securitized position. No additional risk factors are con-sidered within the re-securitization portfolios in addition to those identified and measured within securitization risk.
The Group is active in various roles in connection with securiti-zation, including originator, investor and sponsor. As originator, the Group creates or purchases financial assets (e.g., residential mort-gages or corporate loans) and then securitizes them in a traditional or synthetic transaction that achieves significant risk transfer to third party investors. The Group acts as liquidity provider to Alpine Securitization Corp. (Alpine), a multi-seller commercial paper con-duit administered by Credit Suisse.
In addition, the Group invests in securitization-related products created by third parties and provides interest rate and currency swaps to SPEs involved in securitization activity.
Retained banking book exposures for mortgage, asset-backed securities (ABS) and collateralized debt obligation (CDO) transac-tions are risk managed on the same basis as similar trading book transactions. Other transactions will be managed in line with their individual structural or parameter requirements. The Group has also put in place a set of key risk limits for the purpose of manag-ing the Group’s risk appetite framework in relation to securitiza-tions and re-securitizations. The internal risk capital measurement is both consistent with securitization transactions and with similar structures in the trading book.
There are no instances where the Group has applied credit risk mitigation approaches to banking book securitization or re-securitization exposures.
In the normal course of business it is possible for the Group’s managed separate account portfolios and the Group’s controlled investment entities, such as mutual funds, fund of funds, private equity funds and other fund linked products to invest in the securi-ties issued by other vehicles sponsored by the Group engaged in securitization and re-securitization activities. To address potential conflicts, standards governing investments in affiliated products and funds have been adopted.
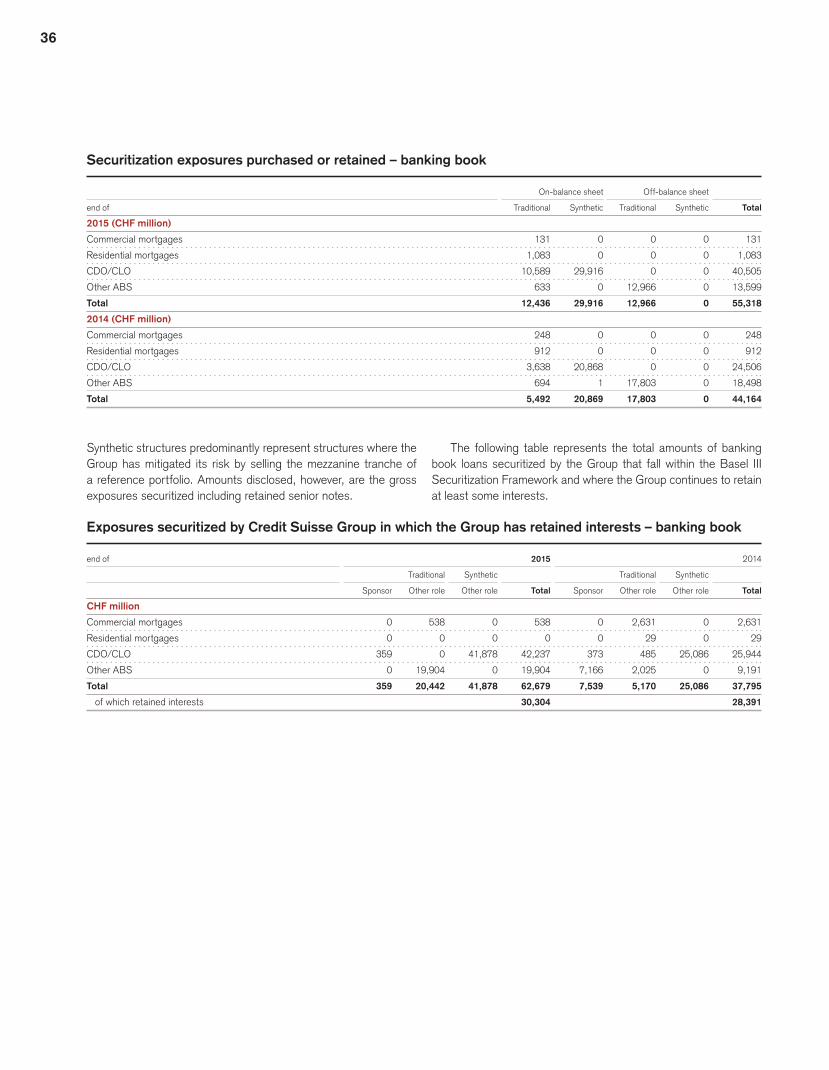
36
Securitization exposures purchased or retained – banking book
On-balance sheet Off-balance sheet
end of Traditional Synthetic Traditional Synthetic Total
2015 (CHF million)
Commercial mortgages 131 0 0 0 131
Residential mortgages 1,083 0 0 0 1,083
CDO/CLO 10,589 29,916 0 0 40,505
Other ABS 633 0 12,966 0 13,599
Total 12,436 29,916 12,966 0 55,318
2014 (CHF million)
Commercial mortgages 248 0 0 0 248
Residential mortgages 912 0 0 0 912
CDO/CLO 3,638 20,868 0 0 24,506
Other ABS 694 1 17,803 0 18,498
Total 5,492 20,869 17,803 0 44,164
Synthetic structures predominantly represent structures where the Group has mitigated its risk by selling the mezzanine tranche of a reference portfolio. Amounts disclosed, however, are the gross exposures securitized including retained senior notes.
The following table represents the total amounts of banking book loans securitized by the Group that fall within the Basel III Securitization Framework and where the Group continues to retain at least some interests.
Exposures securitized by Credit Suisse Group in which the Group has retained interests – banking book
end of 2015 2014
Traditional Synthetic Traditional Synthetic
Sponsor Other role Other role Total Sponsor Other role Other role Total
CHF million
Commercial mortgages 0 538 0 538 0 2,631 0 2,631
Residential mortgages 0 0 0 0 0 29 0 29
CDO/CLO 359 0 41,878 42,237 373 485 25,086 25,944
Other ABS 0 19,904 0 19,904 7,166 2,025 0 9,191
Total 359 20,442 41,878 62,679 7,539 5,170 25,086 37,795
of which retained interests 30,304 28,391

37Basel III – Pillar 3
Losses related to securitizations recognized during the period – banking book
Traditional Synthetic
in Sponsor Other role Other role Total
2015 (CHF million)
Commercial mortgages 0 7 0 7
CDO/CLO 0 0 15 15
Total 0 7 15 22
2014 (CHF million)
Commercial mortgages 0 8 0 8
CDO/CLO 0 0 22 22
Total 0 8 22 30
Impaired or past due assets securitized – banking book
end of 2015 2014
Traditional Synthetic Traditional Synthetic
Sponsor Other role Other role Total Sponsor Other role Other role Total
CHF million
Commercial mortgages 0 481 0 481 0 2,316 0 2,316
CDO/CLO 0 0 163 163 0 40 171 211
Total 0 481 163 644 0 2,356 171 2,527
Securitization and re-securitization exposures by regulatory capital approach – banking book
Securitization exposure Re-securitization exposure Total
EAD Risk- EAD Risk- EAD Risk-
purchased/ weighted purchased/ weighted purchased/ weighted
end of retained assets retained assets retained assets
2015 (CHF million)
Ratings-based approach (RBA) 4,457 2,015 0 0 4,457 2,015
Supervisory formula approach (SFA) 39,416 6,756 0 0 39,416 6,756
Total advanced approaches 43,873 8,771 0 0 43,873 8,771
Standardized approach 1 11,092 6,522 353 311 11,445 6,833
Total 54,965 15,293 353 311 55,318 15,604
2014 (CHF million)
Ratings-based approach (RBA) 11,792 2,495 8,171 4,592 19,963 7,087
Supervisory formula approach (SFA) 23,234 4,717 88 45 23,322 4,762
Total advanced approaches 35,026 7,212 8,259 4,637 43,285 11,849
Standardized approach 1 879 761 0 0 879 761
Total 35,905 7,973 8,259 4,637 44,164 12,610
1 Positions under the standardized approach are risk weighted at >50%-100%.

38
Securitization and re-securitization exposures under RBA by rating grade – banking book
Securitization exposure Re-securitization exposure Total
EAD Risk- EAD Risk- EAD Risk-
purchased/ weighted purchased/ weighted purchased/ weighted
end of retained assets retained assets retained assets
2015 (CHF million)
AAA 1,819 152 0 0 1,819 152
AA 1,087 105 0 0 1,087 105
A 1,133 212 0 0 1,133 212
BBB 300 173 0 0 300 173
BB 14 70 0 0 14 70
B or lower or unrated 104 1,303 0 0 104 1,303
Total 4,457 2,015 0 0 4,457 2,015
2014 (CHF million)
AAA 1 6,608 495 7,619 2,333 14,227 2,828
AA 1 1,970 167 150 64 2,120 231
A 1 2,614 247 102 70 2,716 317
BBB 1 459 161 111 266 570 427
BB 1 35 100 91 629 126 729
B or lower or unrated 1 106 1,325 98 1,230 204 2,555
Total 11,792 2,495 8,171 4,592 19,963 7,087
1 Prior period has been corrected.
Securitization and re-securitization exposures under SFA by risk weight band – banking book
Securitization exposure Re-securitization exposure Total
EAD Risk- EAD Risk- EAD Risk-
purchased/ weighted purchased/ weighted purchased/ weighted
end of retained assets retained assets retained assets
2015 (CHF million)
0%-10% 23,344 1,684 0 0 23,344 1,684
>10%-50% 15,104 2,924 0 0 15,104 2,924
>50%-100% 524 421 0 0 524 421
>100%-650% 350 573 0 0 350 573
>650%-1250% 94 1,154 0 0 94 1,154
Total 39,416 6,756 0 0 39,416 6,756
2014 (CHF million)
0%-10% 8,425 625 0 0 8,425 625
>10%-50% 14,330 2,670 46 9 14,376 2,679
>50%-100% 322 181 42 36 364 217
>100%-650% 65 106 0 0 65 106
>650%-1250% 92 1,135 0 0 92 1,135
Total 23,234 4,717 88 45 23,322 4,762
Securitization activity The Group synthetically securitized CHF 10.4 billion of counter-party exposure within the investment banking businesses and
CHF 5.3 billion within the private, corporate and institutional busi-nesses (all categorized as CDO/CLO – synthetic).
The following table represents new securitization activity dur-ing the period.
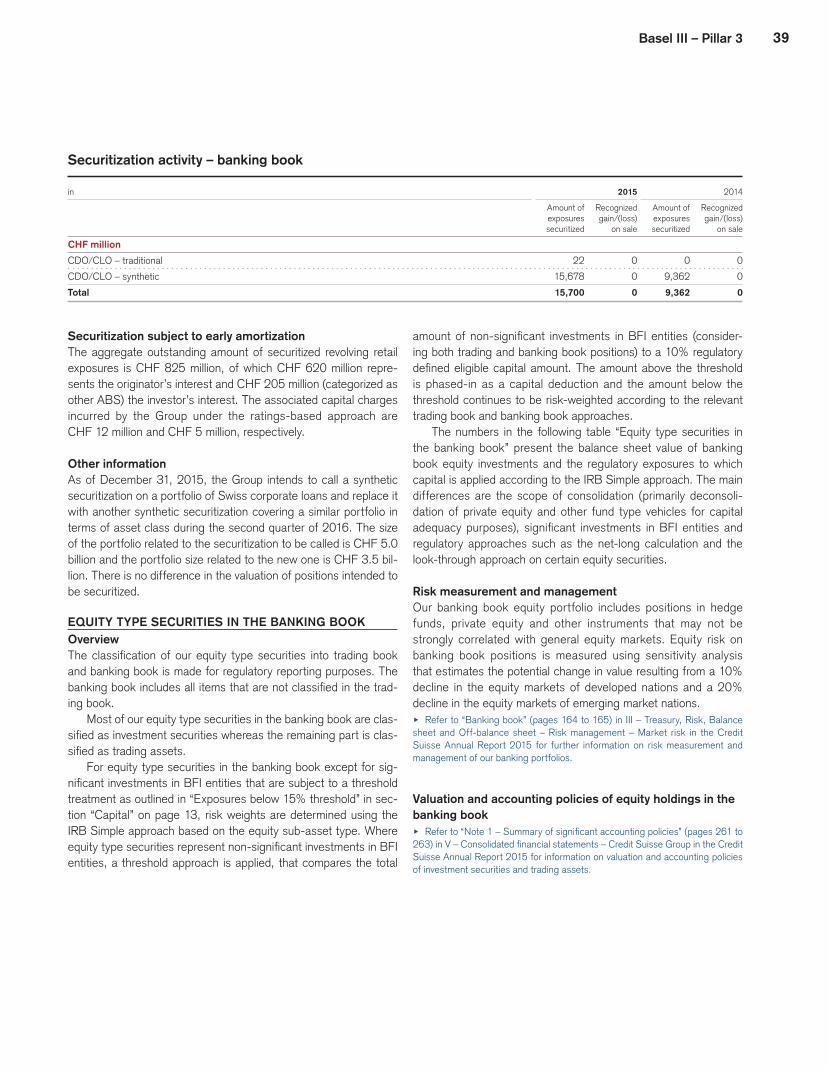
39Basel III – Pillar 3
Securitization activity – banking book
in 2015 2014
Amount of Recognized Amount of Recognized
exposures gain/(loss) exposures gain/(loss) securitized on sale securitized on sale
CHF million
CDO/CLO – traditional 22 0 0 0
CDO/CLO – synthetic 15,678 0 9,362 0
Total 15,700 0 9,362 0
Securitization subject to early amortizationThe aggregate outstanding amount of securitized revolving retail exposures is CHF 825 million, of which CHF 620 million repre-sents the originator’s interest and CHF 205 million (categorized as other ABS) the investor’s interest. The associated capital charges incurred by the Group under the ratings-based approach are CHF 12 million and CHF 5 million, respectively.
Other informationAs of December 31, 2015, the Group intends to call a synthetic securitization on a portfolio of Swiss corporate loans and replace it with another synthetic securitization covering a similar portfolio in terms of asset class during the second quarter of 2016. The size of the portfolio related to the securitization to be called is CHF 5.0 billion and the portfolio size related to the new one is CHF 3.5 bil-lion. There is no difference in the valuation of positions intended to be securitized.
EQUITY TYPE SECURITIES IN THE BANKING BOOKOverviewThe classification of our equity type securities into trading book and banking book is made for regulatory reporting purposes. The banking book includes all items that are not classified in the trad-ing book.
Most of our equity type securities in the banking book are clas-sified as investment securities whereas the remaining part is clas-sified as trading assets.
For equity type securities in the banking book except for sig-nificant investments in BFI entities that are subject to a threshold treatment as outlined in “Exposures below 15% threshold” in sec-tion “Capital” on page 13, risk weights are determined using the IRB Simple approach based on the equity sub-asset type. Where equity type securities represent non-significant investments in BFI entities, a threshold approach is applied, that compares the total
amount of non-significant investments in BFI entities (consider-ing both trading and banking book positions) to a 10% regulatory defined eligible capital amount. The amount above the threshold is phased-in as a capital deduction and the amount below the threshold continues to be risk-weighted according to the relevant trading book and banking book approaches.
The numbers in the following table “Equity type securities in the banking book” present the balance sheet value of banking book equity investments and the regulatory exposures to which capital is applied according to the IRB Simple approach. The main differences are the scope of consolidation (primarily deconsoli-dation of private equity and other fund type vehicles for capital adequacy purposes), significant investments in BFI entities and regulatory approaches such as the net-long calculation and the look-through approach on certain equity securities.
Risk measurement and managementOur banking book equity portfolio includes positions in hedge funds, private equity and other instruments that may not be strongly correlated with general equity markets. Equity risk on banking book positions is measured using sensitivity analysis that estimates the potential change in value resulting from a 10% decline in the equity markets of developed nations and a 20% decline in the equity markets of emerging market nations. u Refer to “Banking book” (pages 164 to 165) in III – Treasury, Risk, Balance sheet and Off-balance sheet – Risk management – Market risk in the Credit Suisse Annual Report 2015 for further information on risk measurement and management of our banking portfolios.
Valuation and accounting policies of equity holdings in the banking booku Refer to “Note 1 – Summary of significant accounting policies” (pages 261 to 263) in V – Consolidated financial statements – Credit Suisse Group in the Credit Suisse Annual Report 2015 for information on valuation and accounting policies of investment securities and trading assets.
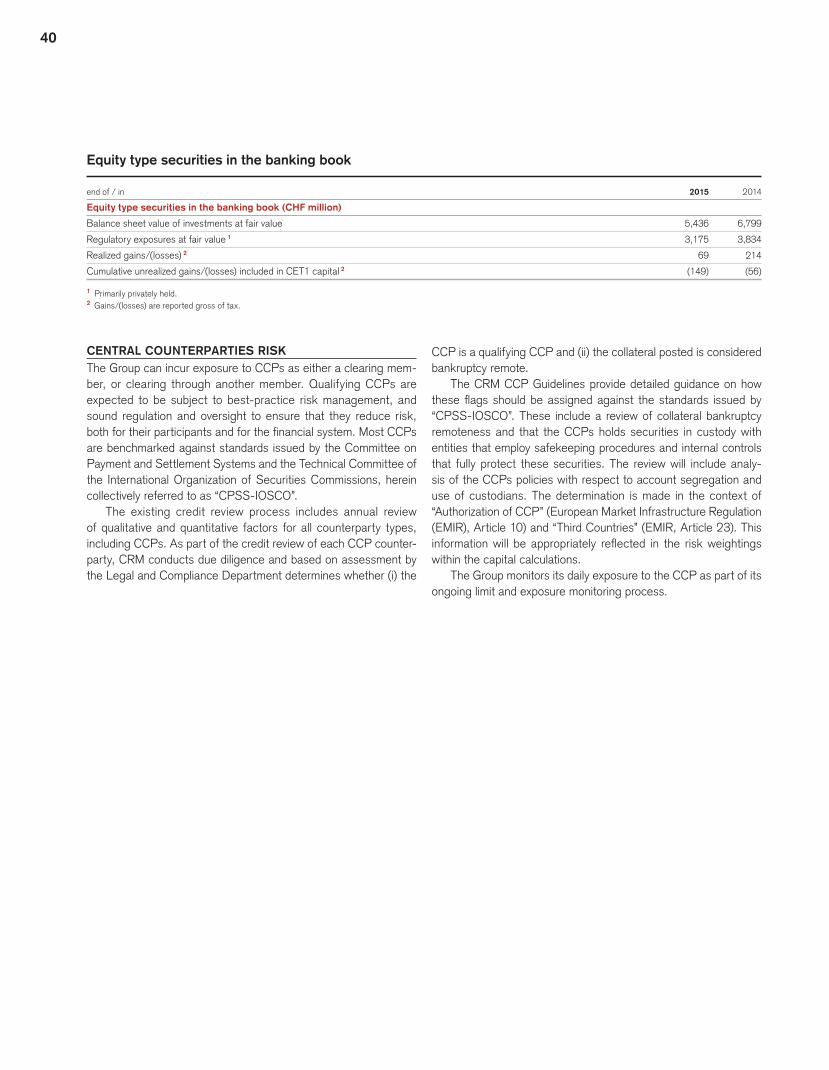
40
Equity type securities in the banking book
end of / in 2015 2014
Equity type securities in the banking book (CHF million)
Balance sheet value of investments at fair value 5,436 6,799
Regulatory exposures at fair value 1 3,175 3,834
Realized gains/(losses) 2 69 214
Cumulative unrealized gains/(losses) included in CET1 capital 2 (149) (56)
1 Primarily privately held.2 Gains/(losses) are reported gross of tax.
CENTRAL COUNTERPARTIES RISK The Group can incur exposure to CCPs as either a clearing mem-ber, or clearing through another member. Qualifying CCPs are expected to be subject to best-practice risk management, and sound regulation and oversight to ensure that they reduce risk, both for their participants and for the financial system. Most CCPs are benchmarked against standards issued by the Committee on Payment and Settlement Systems and the Technical Committee of the International Organization of Securities Commissions, herein collectively referred to as “CPSS-IOSCO”.
The existing credit review process includes annual review of qualitative and quantitative factors for all counterparty types, including CCPs. As part of the credit review of each CCP counter-party, CRM conducts due diligence and based on assessment by the Legal and Compliance Department determines whether (i) the
CCP is a qualifying CCP and (ii) the collateral posted is considered bankruptcy remote.
The CRM CCP Guidelines provide detailed guidance on how these flags should be assigned against the standards issued by “CPSS-IOSCO”. These include a review of collateral bankruptcy remoteness and that the CCPs holds securities in custody with entities that employ safekeeping procedures and internal controls that fully protect these securities. The review will include analy-sis of the CCPs policies with respect to account segregation and use of custodians. The determination is made in the context of “Authorization of CCP” (European Market Infrastructure Regulation (EMIR), Article 10) and “Third Countries” (EMIR, Article 23). This information will be appropriately reflected in the risk weightings within the capital calculations.
The Group monitors its daily exposure to the CCP as part of its ongoing limit and exposure monitoring process.

41Basel III – Pillar 3
Market riskGENERALMarket risk is managed under the IMA approach and under the approved securitization methodologies. Validation of the IMA mod-els is performed by the Model Risk Management team, an inde-pendent function, and is subject to clear and objective internal standards as outlined in the Validation Policy.
The following table shows risk-weighted assets for all market risk measures including the standardized approach.u Refer to “Market risk” (pages 148 to 151 and pages 161 to 166) in III – Trea-sury, Risk, Balance sheet and Off-balance sheet – Risk management in the Credit Suisse Annual Report 2015 for further information on market risk, includ-ing information on risk measurement, VaR, risks not in VaR, stress testing and backtesting.
Risk-weighted assets for market risk
end of 2015 2014
Risk-weighted assets for market risk (CHF million)
Total internal models approach 24,157 26,469
of which regulatory VaR 3,947 3,225
of which stressed VaR 9,612 11,113
of which risks not in VaR 8,028 7,695
of which Incremental Risk Charge 2,570 4,436
Total standardized measurement method 5,312 7,580
of which ratings-based approach 5,145 7,172
of which supervisory formula approach 99 0
of which other supervisory approaches 68 408
Total advanced approach 29,469 34,049
Total standardized approach 330 419
Total risk-weighted assets for market risk 29,799 34,468
Regulatory VaR, stressed VaR and Incremental Risk Charge
Regulatory Stressed
in / end of VaR 1 VaR 1 IRC 2
2015 (CHF million)
Average 30 85 297
Minimum 17 58 171
Maximum 53 126 573
End of period 47 78 182
2014 (CHF million)
Average 22 89 382
Minimum 16 60 185
Maximum 39 127 679
End of period 33 78 332
All numbers disclosed are spot numbers. Regulatory VaR, stressed VaR and IRC exclude trading book securitizations, in line with BIS guidance.1 For regulatory and stressed VaR, one-day VaR based on a 99% confidence level is presented, which is a ten-day VaR adjusted to a one-day holding period.2 IRC is based on a 99.9% confidence level over a one year time horizon.
42
SECURITIZATION RISK IN THE TRADING BOOKu Refer to “Note 34 – Transfers of financial assets and variable interest entities” (pages 335 to 344) in V – Consolidated financial statements – Credit Suisse Group in the Credit Suisse Annual Report 2014 for further information on securi-tization, the various roles, the use of SPEs, the involvement of the Group in con-solidated and non-consolidated SPEs, the accounting policies for securitization activities, methods and key assumptions applied in valuing positions retained/purchased and gains/losses relating to RMBS and CMBS securitization activity in 2015.
Roles in connection with trading book securitizationWithin its mortgage business there are four key roles that the Group undertakes within securitization markets: issuer, under-writer, market maker and financing counterparty. The Group holds one of the top trading franchises in market making in all major securitized product types and is a top issuer and underwriter in the re-securitization market in the US as well as being one of the top underwriters in ABS securitization in the US. In addition the Group also has a relatively small correlation trading portfolio.
Securitization and re-securitization activitiesThe Group’s key objective in relation to trading book securitization is to meet clients’ investment and divestment needs by making markets in securitized products across all major collateral types, including residential mortgages, commercial mortgages, asset finance (i.e. auto loans, credit card receivables, etc.) and corporate loans. The Group focuses on opportunities to intermediate trans-fers of risk between sellers and buyers.
The Group is also active in new issue securitization and re-securitization. The Group’s Asset Finance team provides short-term secured warehouse financing to clients who originate credit card, auto loan, and other receivables, and the Group sells asset-backed securities collateralized by these receivables to provide its clients long-term financing that matches the lives of their assets.
The Group purchases loans and bonds for the purpose of securitization and sells these assets to sponsored SPEs which in turn issue new securities. Re-securitizations of previously issued residential mortgage-backed securities (RMBS) securities occur when certificates issued out of an existing securitization vehicle are sold into a newly created and separate securitization vehicle. Often, these re-securitizations are initiated in order to repackage an existing security to give the investor a higher rated tranche.
Risks assumed and retainedKey risks retained while securities or loans remain in inventory are related to the performance of the underlying assets (real estate loans, commercial loans, credit card loans, etc.). These risks are summarized in the securitization pool level attributes: PD of underlying loans (default rate), the severity of loss and prepayment speeds. The Group maintains models for both government-guar-anteed and private label mortgage products. These models project the above risk drivers based on market interest rates and volatility as well as macro-economic variables such as housing price index, projected GDP and inflation, unemployment etc.
In its role as a market maker, the Group actively trades in and out of positions. Both Front Office and Risk Management continu-ously monitor liquidity risk as reflected in trading spreads and trad-ing volumes. To address liquidity concerns a specific set of limits on the size of aged positions are in place for the securitized posi-tions we hold.
The Group classifies securities by the nature of the collateral (prime, sub-prime, Alt-A, commercial, etc.) and the seniority each security has in the capital structure (i.e. seniors, mezzanine, sub-ordinate etc.), which in turn will be reflected in the transaction risk assessment. Risk Management monitors portfolio composition by capital structure and collateral type on a daily basis with subor-dinate exposure and each collateral type subject to separate risk limits. In addition, the internal risk methodology is designed such that risk charges are based on the place the particular security holds in the capital structure, the less senior the bond the higher the risk charges.
For re-securitization risk, the Group’s risk management models take a ‘look through’ approach where they model the behavior of the underlying securities based on their own collateral and then transmit that to the re-securitized position. No additional risk fac-tors are considered within the re-securitization portfolios in addi-tion to those identified and measured within securitization risk.
With respect to both the wind-down corporate correlation trad-ing portfolio and the on-going transactions the key risks that need to be managed includes default risk, counterparty credit risk, cor-relation risk and cross effects between spread and correlation.
Both correlation and first-to-default are valued using a correla-tion model which uses the market implied correlation and detailed market data such as constituent spread term structure and con-stituent recovery. The risks embedded in securitization and re-securitizations are similar and include spread risk, recovery risk, default risk and correlation risk. The risks for different seniority of tranches will be reflected in the tranche price sensitivities to each constituent in the pools.
Monitoring of changes in credit and market risk of securiti-zation exposuresThe Group has in place a comprehensive risk management pro-cess whereby the front office and Risk Management work together to monitor positions and position changes, portfolio structure and trading activity and calculate a set of risk measures on a daily basis using risk sensitivities and loss modeling methodologies.
For the mortgage business the Group also uses monthly remit-tance reports (available from public sources) to get up to date information on collateral performance (delinquencies, defaults, pre-payment etc.).
The Group has also put in place a set of limits for the pur-pose of managing the Group’s risk appetite framework in rela-tion to securitizations and re-securitizations. These limits will cover exposure measures, risk sensitivities, VaR and capital measures with the majority monitored on a daily basis. In addition within the Group’s risk management framework an extensive scenario
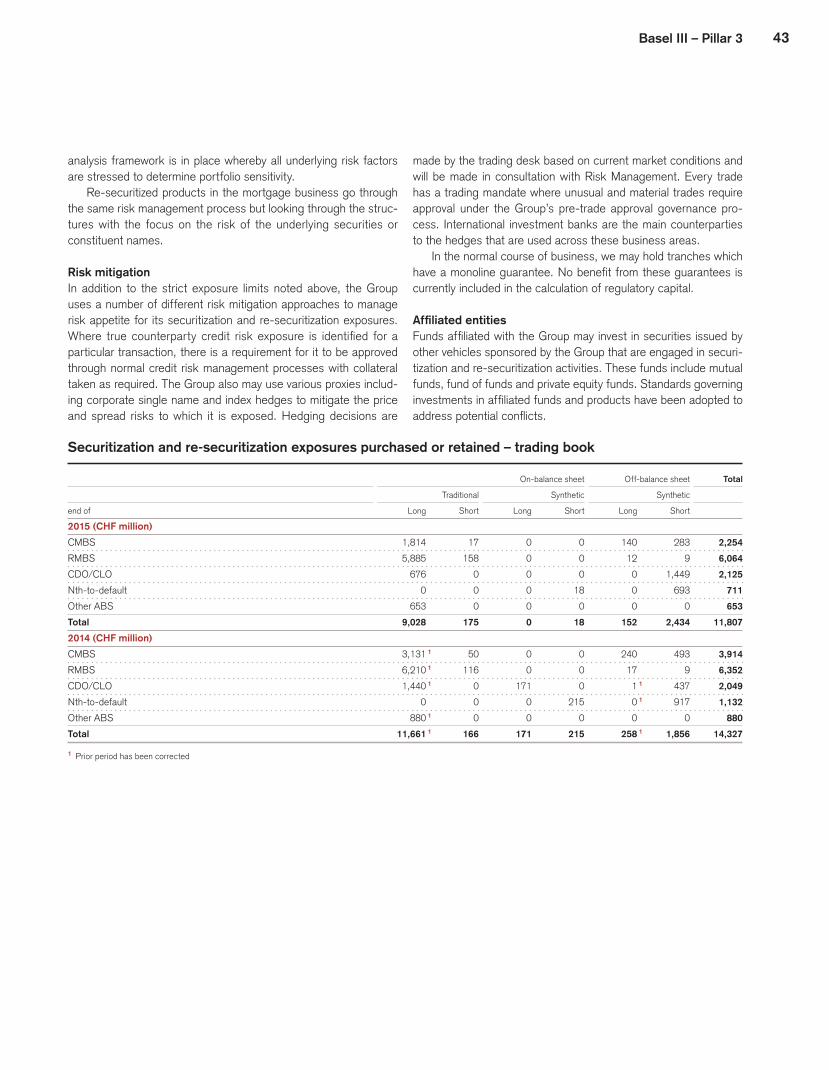
43Basel III – Pillar 3
analysis framework is in place whereby all underlying risk factors are stressed to determine portfolio sensitivity.
Re-securitized products in the mortgage business go through the same risk management process but looking through the struc-tures with the focus on the risk of the underlying securities or constituent names.
Risk mitigationIn addition to the strict exposure limits noted above, the Group uses a number of different risk mitigation approaches to manage risk appetite for its securitization and re-securitization exposures. Where true counterparty credit risk exposure is identified for a particular transaction, there is a requirement for it to be approved through normal credit risk management processes with collateral taken as required. The Group also may use various proxies includ-ing corporate single name and index hedges to mitigate the price and spread risks to which it is exposed. Hedging decisions are
made by the trading desk based on current market conditions and will be made in consultation with Risk Management. Every trade has a trading mandate where unusual and material trades require approval under the Group’s pre-trade approval governance pro-cess. International investment banks are the main counterparties to the hedges that are used across these business areas.
In the normal course of business, we may hold tranches which have a monoline guarantee. No benefit from these guarantees is currently included in the calculation of regulatory capital.
Affiliated entitiesFunds affiliated with the Group may invest in securities issued by other vehicles sponsored by the Group that are engaged in securi-tization and re-securitization activities. These funds include mutual funds, fund of funds and private equity funds. Standards governing investments in affiliated funds and products have been adopted to address potential conflicts.
Securitization and re-securitization exposures purchased or retained – trading book
On-balance sheet Off-balance sheet Total
Traditional Synthetic Synthetic
end of Long Short Long Short Long Short
2015 (CHF million)
CMBS 1,814 17 0 0 140 283 2,254
RMBS 5,885 158 0 0 12 9 6,064
CDO/CLO 676 0 0 0 0 1,449 2,125
Nth-to-default 0 0 0 18 0 693 711
Other ABS 653 0 0 0 0 0 653
Total 9,028 175 0 18 152 2,434 11,807
2014 (CHF million)
CMBS 3,131 1 50 0 0 240 493 3,914
RMBS 6,210 1 116 0 0 17 9 6,352
CDO/CLO 1,440 1 0 171 0 1 1 437 2,049
Nth-to-default 0 0 0 215 0 1 917 1,132
Other ABS 880 1 0 0 0 0 0 880
Total 11,661 1 166 171 215 258 1 1,856 14,327
1 Prior period has been corrected

44
Outstanding exposures securitized by the Group – trading book
Traditional Synthetic Total
end of Sponsor 1 Originator 1 Sponsor 1 Originator 1
2015 (CHF million)
CMBS 7,283 35,996 0 0 43,279
RMBS 433 93,174 0 0 93,607
Other ABS 0 2,343 0 0 2,343
Total 7,716 131,513 0 0 139,229
2014 (CHF million)
CMBS 7,898 26,903 0 0 34,801
RMBS 1,696 88,495 0 0 90,191
Other ABS 0 5,184 0 0 5,184
Total 9,594 120,582 0 0 130,176
Amounts disclosed from January 1, 2010 onwards following the publication of the Pillar 3 requirements in 2009.1 Where the Group is both the sponsor and sole originator, amount will only be shown under originator. Originator is defined as the entity that transfers collateral into an SPE, including third
party collateral transferred into the SPE via the entity’s balance sheet.
Outstanding exposures securitized in which the Group has retained interests – trading book
Exposures securitized Total
end of Traditional Synthetic
2015 (CHF million)
CMBS 22,351 3,242 25,593
RMBS 54,109 11,953 66,062
CDO/CLO 15,428 378 15,806
Other ABS 1,913 759 2,672
Total 93,801 16,332 110,133
2014 (CHF million)
CMBS 50,584 0 50,584
RMBS 55,837 664 56,501
CDO/CLO 6,758 1,698 8,456
Other ABS 766 0 766
Total 113,945 2,362 116,307

45Basel III – Pillar 3
Exposures under standardized measurement method – trading book
Securitization exposure Re-securitization exposure Total
EAD Risk- EAD Risk- EAD Risk-
purchased/ weighted purchased/ weighted purchased/ weighted
end of retained assets retained assets retained assets
2015 (CHF million)
Ratings-based approach (RBA)
CMBS 2,242 393 12 106 2,254 499
RMBS 5,878 1,325 186 1,945 6,064 3,270
CDO/CLO 543 247 163 717 706 964
Other ABS 653 407 0 5 653 412
Total RBA 9,316 2,372 361 2,773 9,677 5,145
Supervisory formula approach (SFA)
CDO/CLO 1,419 99 0 0 1,419 99
Total SFA 1,419 99 0 0 1,419 99
Other supervisory approaches
Nth-to-default 711 68 0 0 711 68
Total other supervisory approaches 711 68 0 0 711 68
Total 11,446 2,539 361 2,773 11,807 5,312
2014 (CHF million)
Ratings-based approach (RBA)
CMBS 3,803 1,892 111 43 3,914 1,935
RMBS 6,068 585 280 1,974 6,348 2,559
CDO/CLO 1,292 1,159 455 784 1,747 1,943
Other ABS 880 610 0 125 880 735
Total RBA 12,043 4,246 846 2,926 12,889 7,172
Supervisory formula approach (SFA)
CDO/CLO 302 0 0 0 302 0
Total SFA 302 0 0 0 302 0
Other supervisory approaches
Nth-to-default 1,132 405 0 0 1,132 405
RMBS 1 4 3 0 0 4 3
Total other supervisory approaches 1,136 408 0 0 1,136 408
Total 13,481 4,654 846 2,926 14,327 7,580
1 The weighted average approach is applied to these positions.
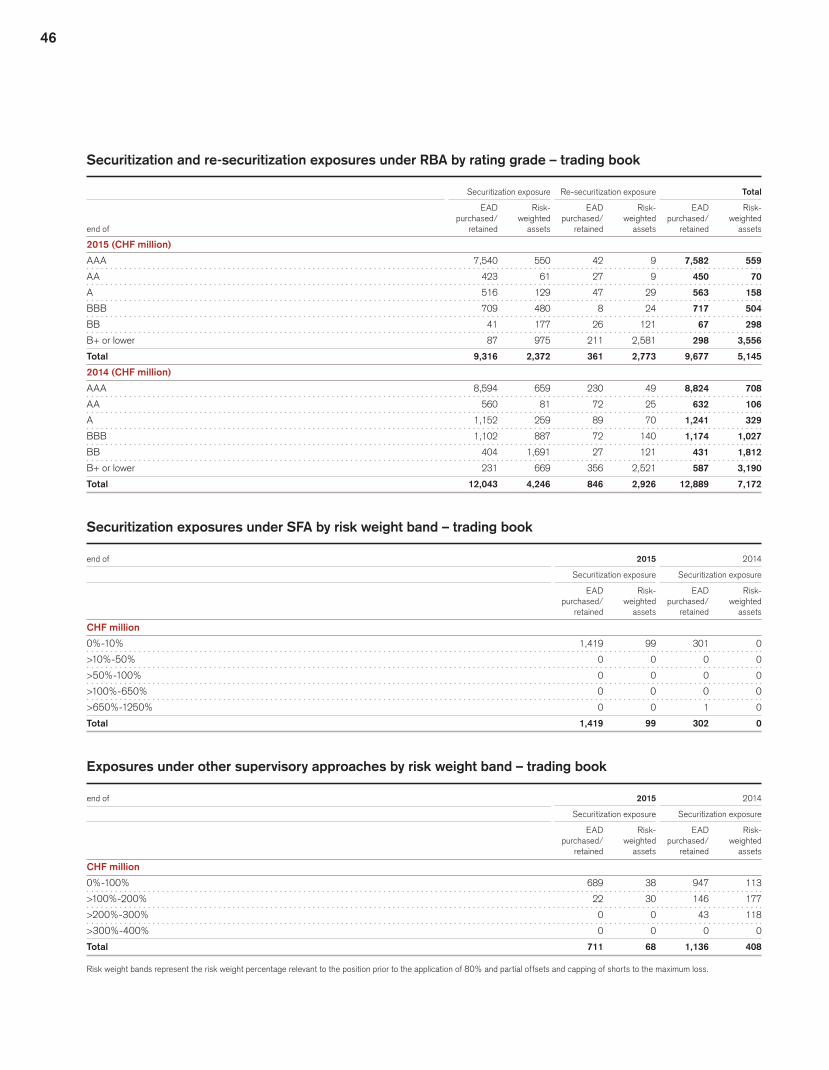
46
Securitization and re-securitization exposures under RBA by rating grade – trading book
Securitization exposure Re-securitization exposure Total
EAD Risk- EAD Risk- EAD Risk-
purchased/ weighted purchased/ weighted purchased/ weighted
end of retained assets retained assets retained assets
2015 (CHF million)
AAA 7,540 550 42 9 7,582 559
AA 423 61 27 9 450 70
A 516 129 47 29 563 158
BBB 709 480 8 24 717 504
BB 41 177 26 121 67 298
B+ or lower 87 975 211 2,581 298 3,556
Total 9,316 2,372 361 2,773 9,677 5,145
2014 (CHF million)
AAA 8,594 659 230 49 8,824 708
AA 560 81 72 25 632 106
A 1,152 259 89 70 1,241 329
BBB 1,102 887 72 140 1,174 1,027
BB 404 1,691 27 121 431 1,812
B+ or lower 231 669 356 2,521 587 3,190
Total 12,043 4,246 846 2,926 12,889 7,172
Securitization exposures under SFA by risk weight band – trading book
end of 2015 2014
Securitization exposure Securitization exposure
EAD Risk- EAD Risk-
purchased/ weighted purchased/ weighted
retained assets retained assets
CHF million
0%-10% 1,419 99 301 0
>10%-50% 0 0 0 0
>50%-100% 0 0 0 0
>100%-650% 0 0 0 0
>650%-1250% 0 0 1 0
Total 1,419 99 302 0
Exposures under other supervisory approaches by risk weight band – trading book
end of 2015 2014
Securitization exposure Securitization exposure
EAD Risk- EAD Risk-
purchased/ weighted purchased/ weighted
retained assets retained assets
CHF million
0%-100% 689 38 947 113
>100%-200% 22 30 146 177
>200%-300% 0 0 43 118
>300%-400% 0 0 0 0
Total 711 68 1,136 408
Risk weight bands represent the risk weight percentage relevant to the position prior to the application of 80% and partial offsets and capping of shorts to the maximum loss.

47Basel III – Pillar 3
Securitization activity – trading book
in 2015 2014
Original Original
amount of Recognized amount of Recognized
exposures gain/(loss) exposures gain/(loss) securitized on sale securitized on sale
CHF million
CMBS – traditional 12,921 (1) 6,096 8
RMBS – traditional 25,849 3 32,786 13
Total 38,770 2 38,882 21
Other informationAs of December 31, 2015, the Group holds the following positions with the intent to securitize: government-guaranteed commercial loans of USD 2.7 billion, government-guaranteed residential pass-through securities of USD 2.5 billion, residential and commercial whole loans of USD 1.6 billion. The actual securitizations are sub-ject to future market conditions. There is no difference in the valu-ation of positions intended to be securitized.
VALUATION PROCESSThe Basel capital adequacy framework and FINMA circular 2008/20 provide guidance for systems and controls, valuation methodologies and valuation adjustments and reserves to provide prudent and reliable valuation estimates.
Financial instruments in the trading book are carried at fair value. The fair value of the majority of these financial instruments is marked to market based on quoted prices in active markets or observable inputs. Additionally, the Group holds financial instru-ments which are marked to models where the determination of fair values requires subjective assessment and varying degrees of judgment depending on liquidity, concentration, pricing assump-tions and the risks affecting the specific instrument.
Control processes are applied to ensure that the reported fair values of the financial instruments, including those derived from
pricing models, are appropriate and determined on a reasonable basis. These control processes include approval of new instru-ments, timely review of profit and loss, risk monitoring, price veri-fication procedures and validation of models used to estimate the fair value. These functions are managed by senior management and personnel with relevant expertise, independent of the trading and investment functions.
In particular, the price verification function is performed by Product Control, independent from the trading and investment functions, reporting directly to the Chief Financial Officer, a mem-ber of the Executive Board.
The valuation process is governed by separate policies and procedures. To arrive at fair values, the following type of valua-tion adjustments are typically considered and regularly assessed for appropriateness: model, parameter, credit and exit-risk-related adjustments.
Management believes it complies with the relevant valuation guidance and that the estimates and assumptions used in valua-tion of financial instruments are prudent, reasonable and consis-tently applied. u Refer to “Fair valuations” (page 58) in II – Operating and financial review – Credit Suisse – Information and developments, to “Fair value” (page 99) in II – Operating and financial review – Critical accounting estimates and to “Note 35 – Financial instruments” (pages 344 to 370) in V – Consolidated financial state-ments – Credit Suisse Group in the Credit Suisse Annual Report 2015 for further information on fair value.
Risk-weighted assets for market risk under the standardized approach
end of 2015 2014
Risk-weighted assets for market risk under the standardized approach (CHF million)
Interest rate risk 0 0
Equity position risk 0 0
Foreign exchange risk 329 418
Commodity risk 1 1
Total 330 419

48
Interest rate risk in the banking bookOVERVIEWCredit Suisse monitors and manages interest rate risk in the bank-ing book by established systems, processes and controls. Risk sensitivity figures are provided to estimate the impact of changes in interest rates, which is one of the primary ways in which these risks are assessed for risk management purposes. In addition, Risk Division confirms that the economic impacts of adverse par-allel shifts in interest rates of 200 basis points and adverse inter-est rate shifts calibrated to a 1-year holding period with a 99% confidence level are significantly below the threshold of 20% of eligible regulatory capital used by the regulator to identify banks that potentially run excessive levels of non-trading interest rate risk. Given the low level of interest rate risk in the banking book, Credit Suisse does not have any regulatory requirement to hold capital against this risk.
MAJOR SOURCES OF INTEREST RATE RISK IN THE BANKING BOOKThe interest rate risk exposures in the non-trading positions (syn-onymously used to the term “banking book”) mainly arise from the retail banking activities of the Swiss Universal Bank division, the positioning strategy with respect to our replicated non-interest bearing assets and liabilities (including the equity balance) and the outstanding capital instruments. The vast majority of interest rate risk in the banking book is managed by Treasury and Swiss Uni-versal Bank on a portfolio basis.
The interest rate risk from retail banking activities results from the transactions with repricing maturities that either are or are not contractually determined. For most parts of the latter, such as vari-able rate mortgages and some types of deposits, which do not have a direct link to market rates in their repricing behavior, it is more suitable to manage them on a portfolio basis rather than on individual trade level. The interest rate risk associated with these products, referred to as non-maturing products, is estimated using the methodology of replicating portfolios: Based on the historical behavior of interest rates and volume of these products it assigns the position balance associated with a non-maturing banking product to time bands that are presumed to reflect their empirical repricing maturities. The methodology is based, where reasonably possible, on the principle of finding a stable relationship between the changes of client rates of the non-maturing products and an underlying investment or funding portfolio. Where this is not pos-sible, the maturity of the product is assessed based on volume stability only. These allocations to time bands can then be used to evaluate the products’ interest rate sensitivity. The structure and parameters of the replicating portfolios are reviewed periodically to ensure continued relevance of the portfolios in light of changing market conditions and client behavior.
For managing parts of the interest rate risk of the corporate balance sheet with respect to our non-interest bearing assets and liabilities (including the equity balance) Credit Suisse assigns
tenors to balance sheet positions that reflect a fair investment or funding profile for the underlying balance sheet items. This strat-egy is implemented by Treasury and the resulting interest rate risk is measured against a pre-defined benchmark.
Changing market rates give rise to changes in the fair values of the outstanding capital instruments that have been issued for funding of the bank. To some extent, on an individual basis, this risk is being mitigated by using swaps to replace fixed payment obligations into floating ones. In addition to these transactions on individual basis, the residual interest rate risk is also managed holistically by Treasury.
GOVERNANCE OF MODELS AND LIMITSThe major part of interest rate risk in the banking book is managed centrally by Treasury and Swiss Universal Bank within approved limits using hedging instruments such as interest rate swaps. The Board of Directors defines the risk appetite, i.e. a set of risk lim-its, for the Group on an annual basis. Limits to the divisions are governed by the CARMC; the divisional Risk Management Com-mittees may assign limits on more granular levels for entities, busi-nesses, books, collections of books. The models used for mea-suring risk are reviewed and approved by the RPSC, where the frequency depends on the criticality of the model. Operational decisions on the use of the models (e.g. in terms of maximum tenor and allocation of tranches to the time bands in the replicating portfolios) is governed by the CARMC. For interest rate risk in the banking book, Risk Division is responsible for monitoring the limit usage and escalating potential limit breaches.
RISK MEASUREMENTThe risks associated with the non-trading interest rate-sensitive portfolios are measured using a range of tools, including the fol-lowing key metrics:p Interest rate sensitivity (DV01): Expresses the linear approxi-
mation of the impact on a portfolio’s fair value resulting from a one basis point (0.01%) parallel shift in yield curves, where the approximation tends to be closer to the true change in the portfolio’s fair value for smaller parallel shifts in the yield curve. The DV01 is a transparent and intuitive indicator of linear direc-tional interest rate risk exposure, which does not rely on statis-tical inference.
p VaR: Statistical indicator of the potential fair value loss, tak-ing into account the observed interest rate moves across yield curve tenors and currencies. In addition, VaR takes into account yield curve risk, spread and basis risks, as well as for-eign exchange and equity risk. For risk management purposes, Credit Suisse uses a VaR measure based on a one-day hold-ing period with a 98% confidence level where the considered historical values are time-weighted using a weighting scheme that assigns lower weights to observations further in the past.
49Basel III – Pillar 3
p ERC: ERC is a statistical risk indicator representing the capital the bank should hold to support the risks incurred. ERC is cali-brated to a 1-year holding period with a 99% confidence level for risk management purposes.
p Economic value scenario analysis: Expresses the impact of a pre-defined scenario (e.g. instantaneous changes in interest rates) on a portfolio’s fair value. This metric does not rely on statistical inference.
The measures listed above focus on the impact on a fair value basis, taking into account the present value of all future cash flows associated with the current positions. More specifically, the met-rics estimate the impact on the economic value of the current port-folio, ignoring dynamic aspects such as the time schedule of how changes in economic value materialize in P&L (since most non-trading books are not marked-to-market) and the development of the portfolio over time. These measures are complemented by considering an Earnings-at-Risk approach to interest rate risk: For the major part of the banking books, this is accomplished by sim-ulating the development of the net interest income over several years using scenarios of potential changes of the yield curves. This scenario analysis also takes into account the earnings impact originating from fluctuations in short term interest rates, which are regarded as riskless when analyzing the impact on economic value. In addition to the dynamic aspects, this analysis allows to distinguish between the economic and the accounting view.
MONITORING AND REVIEWThe limits and flags defined by books, collections of books, busi-nesses or legal entities relating to interest rate risk in the banking book are monitored by Risk Division at least on a monthly basis (if deemed necessary or suitable, the monitoring may be as frequent as daily), by using the metrics and methodologies outlined above. In case of breaches, this is escalated to the limit-setting body. Credit Suisse assesses compliance with regulatory requirements regarding appropriate levels of non-trading interest rate risk by estimating the economic impact of adverse 200 basis point paral-lel shifts in yield curves and adverse interest rate shifts calibrated to a 1-year holding period with a 99% confidence level and then relating those impacts to the total eligible regulatory capital. Con-sistent with regulatory requirements, Risk Division ensures that the fair value impact of this analysis is below the threshold of 20% of eligible regulatory capital in which case there are no requirements to hold additional capital. This analysis is performed for the Group and major legal entities, including the Bank, on a monthly basis.
RISK PROFILEu Refer to “Banking book” (pages 164 to 165) in III – Treasury, Risk, Balance sheet and Off-balance sheet – Risk management – Market risk in the Credit Suisse Annual Report 2015 for information on the impact of a one basis point parallel increase of the yield curves and an adverse 200 basis point move in yield curves on the fair value of interest rate-sensitive banking book positions.

50
Reconciliation requirementsBALANCE SHEETThe following table shows the balance sheet as published in the consolidated financial statements of the Group and the balance sheet under the regulatory scope of consolidation. The reference indicates how such assets and liabilities are considered in the composition of regulatory capital.
Balance sheet
Balance sheet
Regulatory Reference to
Financial scope of composition
end of 2015 statements consolidation of capital
Assets (CHF million)
Cash and due from banks 92,328 90,596
Interest-bearing deposits with banks 867 1,256
Central bank funds sold, securities purchased under
resale agreements and securities borrowing transactions 123,049 122,983
Securities received as collateral, at fair value 28,511 28,511
Trading assets, at fair value 190,737 185,638
Investment securities 3,090 2,081
Other investments 7,021 6,867
Net loans 272,995 282,430
Premises and equipment 4,644 4,724
Goodwill 4,808 4,808 a
Other intangible assets 196 196
of which other intangible assets (excluding mortgage servicing rights) 84 84 b
Brokerage receivables 34,542 34,429
Other assets 58,017 43,876
of which tax charges deferred as other assets related to regulatory adjustments 1,401 1,401 c
of which deferred tax assets related to net operating losses 1,754 1,754 d
of which deferred tax assets from temporary differences 4,425 4,426 e
of which defined-benefit pension fund net assets 825 825 f
Total assets 820,805 808,395
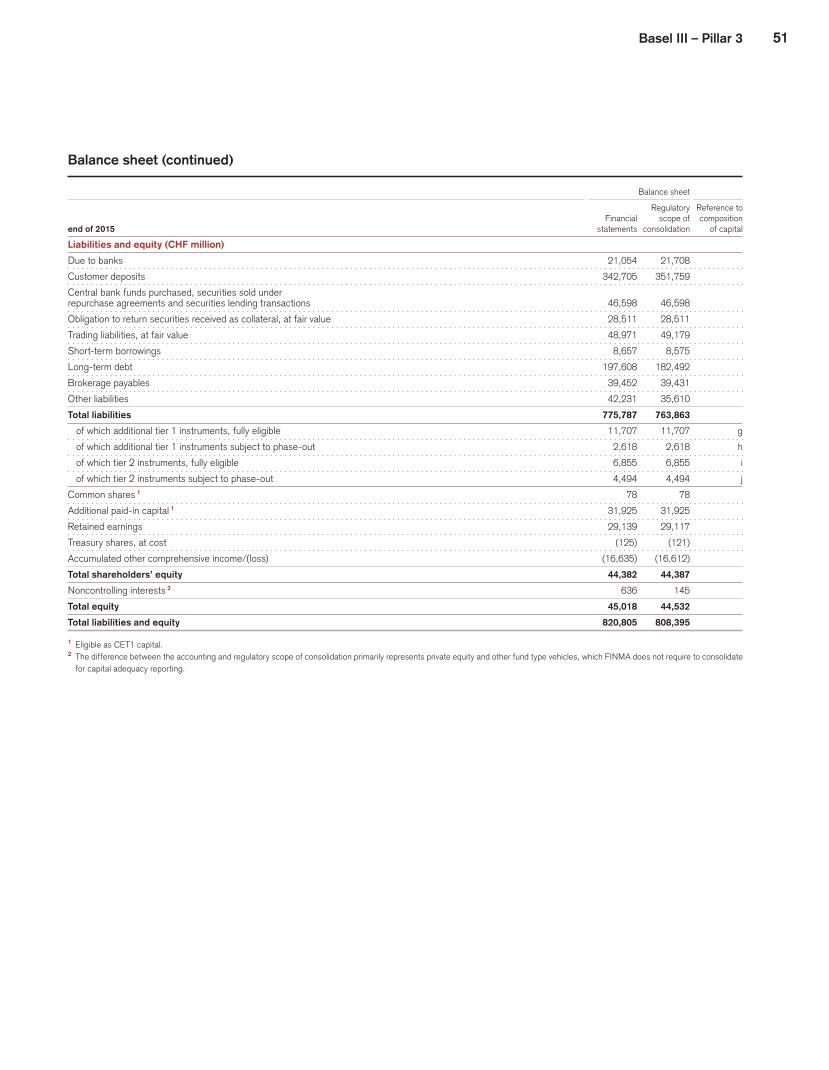
51Basel III – Pillar 3
Balance sheet (continued)
Balance sheet
Regulatory Reference to
Financial scope of composition
end of 2015 statements consolidation of capital
Liabilities and equity (CHF million)
Due to banks 21,054 21,708
Customer deposits 342,705 351,759
Central bank funds purchased, securities sold under
repurchase agreements and securities lending transactions 46,598 46,598
Obligation to return securities received as collateral, at fair value 28,511 28,511
Trading liabilities, at fair value 48,971 49,179
Short-term borrowings 8,657 8,575
Long-term debt 197,608 182,492
Brokerage payables 39,452 39,431
Other liabilities 42,231 35,610
Total liabilities 775,787 763,863
of which additional tier 1 instruments, fully eligible 11,707 11,707 g
of which additional tier 1 instruments subject to phase-out 2,618 2,618 h
of which tier 2 instruments, fully eligible 6,855 6,855 i
of which tier 2 instruments subject to phase-out 4,494 4,494 j
Common shares 1 78 78
Additional paid-in capital 1 31,925 31,925
Retained earnings 29,139 29,117
Treasury shares, at cost (125) (121)
Accumulated other comprehensive income/(loss) (16,635) (16,612)
Total shareholders’ equity 44,382 44,387
Noncontrolling interests 2 636 145
Total equity 45,018 44,532
Total liabilities and equity 820,805 808,395
1 Eligible as CET1 capital.2 The difference between the accounting and regulatory scope of consolidation primarily represents private equity and other fund type vehicles, which FINMA does not require to consolidate
for capital adequacy reporting.
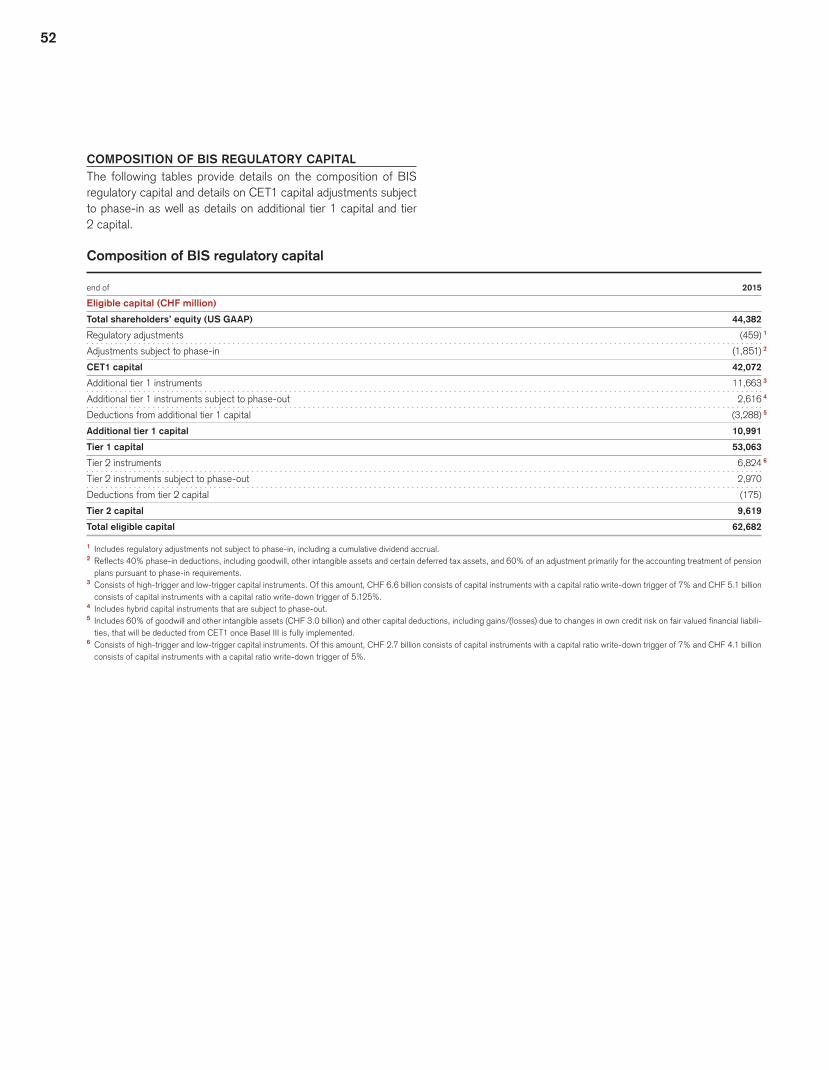
52
COMPOSITION OF BIS REGULATORY CAPITALThe following tables provide details on the composition of BIS regulatory capital and details on CET1 capital adjustments subject to phase-in as well as details on additional tier 1 capital and tier 2 capital.
Composition of BIS regulatory capital
end of 2015
Eligible capital (CHF million)
Total shareholders’ equity (US GAAP) 44,382
Regulatory adjustments (459) 1
Adjustments subject to phase-in (1,851) 2
CET1 capital 42,072
Additional tier 1 instruments 11,663 3
Additional tier 1 instruments subject to phase-out 2,616 4
Deductions from additional tier 1 capital (3,288) 5
Additional tier 1 capital 10,991
Tier 1 capital 53,063
Tier 2 instruments 6,824 6
Tier 2 instruments subject to phase-out 2,970
Deductions from tier 2 capital (175)
Tier 2 capital 9,619
Total eligible capital 62,682
1 Includes regulatory adjustments not subject to phase-in, including a cumulative dividend accrual.2 Reflects 40% phase-in deductions, including goodwill, other intangible assets and certain deferred tax assets, and 60% of an adjustment primarily for the accounting treatment of pension
plans pursuant to phase-in requirements.3 Consists of high-trigger and low-trigger capital instruments. Of this amount, CHF 6.6 billion consists of capital instruments with a capital ratio write-down trigger of 7% and CHF 5.1 billion
consists of capital instruments with a capital ratio write-down trigger of 5.125%.4 Includes hybrid capital instruments that are subject to phase-out.5 Includes 60% of goodwill and other intangible assets (CHF 3.0 billion) and other capital deductions, including gains/(losses) due to changes in own credit risk on fair valued financial liabili-
ties, that will be deducted from CET1 once Basel III is fully implemented.6 Consists of high-trigger and low-trigger capital instruments. Of this amount, CHF 2.7 billion consists of capital instruments with a capital ratio write-down trigger of 7% and CHF 4.1 billion
consists of capital instruments with a capital ratio write-down trigger of 5%.

53Basel III – Pillar 3
The following tables provide details on CET1 capital adjustments subject to phase-in and details on additional tier 1 capital and tier 2 capital. The column “Transition amount” represents the amounts that have been recognized in eligible capital as of December 31,
2015. The column “Amount to be phased in” represents those amounts that are still to be phased in as CET1 capital adjustments through year-end 2018.
Details on CET1 capital adjustments subject to phase-in
Reference Amount Balance to balance Regulatory Transition to be
end of 2015 sheet sheet 1 adjustments Total amount 2 phased in
CET1 capital adjustments subject to phase-in (CHF million)
Accounting treatment of defined benefit pension plans – – – 2,132 (2,132)
Common share capital issued by subsidiaries and held by third parties – – – 89 (89)
Goodwill 4,808 a (43) 3 4,765 (1,906) (2,859) 4
Other intangible assets (excluding mortgage-servicing rights) 84 b (13) 5 71 (28) (43) 4
Deferred tax assets that rely on future profitability (excluding temporary differences) 3,155 c, d – 3,155 (1,262) (1,893) 6
Shortfall of provisions to expected losses – – – (234) (350) 7
Gains/(losses) due to changes in own credit on fair-valued liabilities – – – (185) (278) 8
Defined-benefit pension assets 825 f (214) 5 611 (244) (367) 6
Investments in own shares – – – (8) (13) 4
Other adjustments 9 – – – (2) (3) 4
Amounts above 10% threshold 4,426 (3,918) 508 (203) (305)
of which deferred tax assets from temporary differences 4,426 e (3,918) 10 508 (203) (305) 6
Adjustments subject to phase-in to CET1 capital (1,851) (8,332)
1 Refer to the balance sheet under regulatory scope of consolidation in the table “Balance sheet”. Only material items are referenced to the balance sheet.2 Reflects 40% phase-in deductions, including goodwill, other intangible assets and certain deferred tax assets, and 60% of an adjustment primarily for the accounting treatment of pension
plans pursuant to phase-in requirements.3 Represents related deferred tax liability and goodwill on equity method investments.4 Deducted from additional tier 1 capital.5 Represents related deferred tax liability.6 Risk-weighted.7 50% deducted from additional tier 1 capital and 50% from tier 2 capital.8 Includes CHF (195) million related to debt instruments deducted from additional tier 1 capital.9 Includes cash flow hedge reserve.10 Includes threshold adjustments of CHF (4,227) million and an aggregate of CHF 309 million related to the add-back of deferred tax liabilities on goodwill, other intangible assets, mortgage
servicing rights and pension assets that are netted against deferred tax assets under US GAAP.
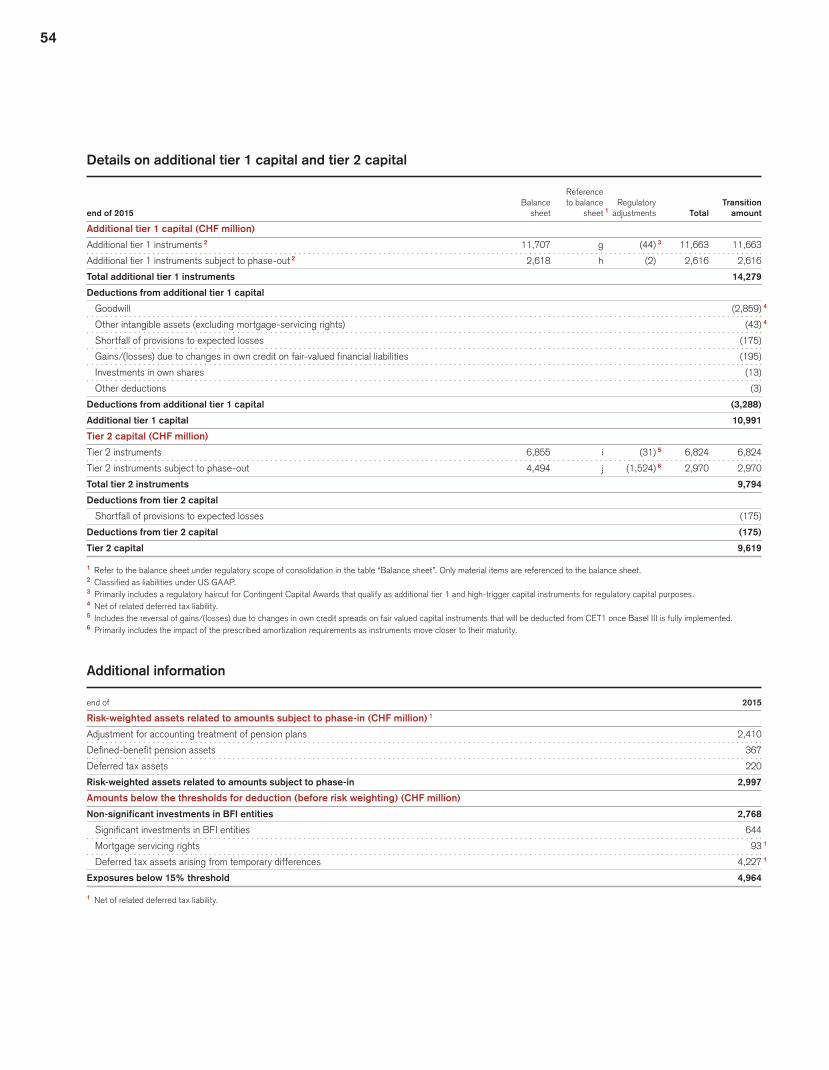
54
Details on additional tier 1 capital and tier 2 capital
Reference
Balance to balance Regulatory Transition
end of 2015 sheet sheet 1 adjustments Total amount
Additional tier 1 capital (CHF million)
Additional tier 1 instruments 2 11,707 g (44) 3 11,663 11,663
Additional tier 1 instruments subject to phase-out 2 2,618 h (2) 2,616 2,616
Total additional tier 1 instruments 14,279
Deductions from additional tier 1 capital
Goodwill (2,859) 4
Other intangible assets (excluding mortgage-servicing rights) (43) 4
Shortfall of provisions to expected losses (175)
Gains/(losses) due to changes in own credit on fair-valued financial liabilities (195)
Investments in own shares (13)
Other deductions (3)
Deductions from additional tier 1 capital (3,288)
Additional tier 1 capital 10,991
Tier 2 capital (CHF million)
Tier 2 instruments 6,855 i (31) 5 6,824 6,824
Tier 2 instruments subject to phase-out 4,494 j (1,524) 6 2,970 2,970
Total tier 2 instruments 9,794
Deductions from tier 2 capital
Shortfall of provisions to expected losses (175)
Deductions from tier 2 capital (175)
Tier 2 capital 9,619
1 Refer to the balance sheet under regulatory scope of consolidation in the table “Balance sheet”. Only material items are referenced to the balance sheet.2 Classified as liabilities under US GAAP.3 Primarily includes a regulatory haircut for Contingent Capital Awards that qualify as additional tier 1 and high-trigger capital instruments for regulatory capital purposes.4 Net of related deferred tax liability.5 Includes the reversal of gains/(losses) due to changes in own credit spreads on fair valued capital instruments that will be deducted from CET1 once Basel III is fully implemented.6 Primarily includes the impact of the prescribed amortization requirements as instruments move closer to their maturity.
Additional information
end of 2015
Risk-weighted assets related to amounts subject to phase-in (CHF million) 1
Adjustment for accounting treatment of pension plans 2,410
Defined-benefit pension assets 367
Deferred tax assets 220
Risk-weighted assets related to amounts subject to phase-in 2,997
Amounts below the thresholds for deduction (before risk weighting) (CHF million)
Non-significant investments in BFI entities 2,768
Significant investments in BFI entities 644
Mortgage servicing rights 93 1
Deferred tax assets arising from temporary differences 4,227 1
Exposures below 15% threshold 4,964
1 Net of related deferred tax liability.

55Basel III – Pillar 3
List of abbreviations A ABS Asset-backed securitiesACVA Advanced credit valuation adjustment approachA-IRB Advanced Internal Ratings-Based ApproachAMA Advanced Measurement ApproachB BCBS Basel Committee on Banking SupervisionBFI Banking, financial and insuranceBIS Bank for International SettlementsC CARMC Capital Allocation Risk Management CommitteeCCF Credit Conversion FactorCCO Chief Credit OfficerCCP Central counterpartiesCDO Collateralized Debt ObligationCET1 Common equity tier 1CLO Collateralized Loan ObligationCMBS Commercial mortgage-backed securitiesCMSC Credit Model Steering CommitteeCRM Credit Risk ManagementCRR Credit Risk ReviewCVA Credit valuation adjustmentE EAD Exposure at DefaultECAI External credit assessment institutionsEMIR European Market Infrastructure RegulationERC Economic Risk CapitalF FINMA Swiss Financial Market Supervisory Authority FINMAG G-SIB Global systemically important banks
I
IMA Internal Models Approach
IMM Internal Models Method
IRB Internal Ratings-Based Approach
IRC Incremental Risk Charge
L
LGD Loss Given Default
LTV Loan-to-value
M
MDB Multilateral Development Banks
O
OTC Over-the-counter
P
PD Probability of Default
R
RBA Ratings-Based Approach
RMBS Residential mortgage-backed securities
RNIV Risks not in value-at-risk
RPSC Risk Processes and Standards Committee
S
SFA Supervisory Formula Approach
SFT Securities Financing Transactions
SMM Standardized Measurement Method
SPE Special purpose entity
SRW Supervisory Risk Weights Approach
U
US GAAP Accounting principles generally accepted in the US
V
VaR Value-at-Risk

56
Cautionary statement regarding forward-looking information
This report contains statements that constitute forward-looking statements.
In addition, in the future we, and others on our behalf, may make statements
that constitute forward-looking statements. Such forward-looking state-
ments may include, without limitation, statements relating to the following:
p our plans, objectives or goals;
p our future economic performance or prospects;
p the potential effect on our future performance of certain contingencies;
and
p assumptions underlying any such statements.
Words such as “believes,” “anticipates,” “expects,” “intends” and “plans” and
similar expressions are intended to identify forward-looking statements but
are not the exclusive means of identifying such statements. We do not intend
to update these forward-looking statements except as may be required by
applicable securities laws.
By their very nature, forward-looking statements involve inherent risks
and uncertainties, both general and specific, and risks exist that predic-
tions, forecasts, projections and other outcomes described or implied in
forward-looking statements will not be achieved. We caution you that a
number of important factors could cause results to differ materially from the
plans, objectives, expectations, estimates and intentions expressed in such
forward-looking statements. These factors include:
p the ability to maintain sufficient liquidity and access capital markets;
p market volatility and interest rate fluctuations and developments affecting
interest rate levels;
p the strength of the global economy in general and the strength of the
economies of the countries in which we conduct our operations, in par-
ticular the risk of continued slow economic recovery or downturn in the
US or other developed countries in 2016 and beyond;
p the direct and indirect impacts of deterioration or slow recovery in residen-
tial and commercial real estate markets;
p adverse rating actions by credit rating agencies in respect of sovereign
issuers, structured credit products or other credit-related exposures;
p the ability to achieve our strategic objectives, including improved perfor-
mance, reduced risks, lower costs and more efficient use of capital;
p the ability of counterparties to meet their obligations to us;
p the effects of, and changes in, fiscal, monetary, exchange rate, trade and
tax policies, as well as currency fluctuations;
p political and social developments, including war, civil unrest or terrorist
activity;
p the possibility of foreign exchange controls, expropriation, nationalization
or confiscation of assets in countries in which we conduct our operations;
p operational factors such as systems failure, human error, or the failure to
implement procedures properly;
p actions taken by regulators with respect to our business and practices
and possible resulting changes to our business organization, practices
and policies in countries in which we conduct our operations;
p the effects of changes in laws, regulations or accounting policies or prac-
tices in countries in which we conduct our operations;
p competition in geographic and business areas in which we conduct our
operations;
p the ability to retain and recruit qualified personnel;
p the ability to maintain our reputation and promote our brand;
p the ability to increase market share and control expenses;
p technological changes;
p the timely development and acceptance of our new products and services
and the perceived overall value of these products and services by users;
p acquisitions, including the ability to integrate acquired businesses suc-
cessfully, and divestitures, including the ability to sell non-core assets;
p the adverse resolution of litigation, regulatory proceedings, and other
contingencies;
p the ability to achieve our cost efficiency goals and cost targets; and
p our success at managing the risks involved in the foregoing.
We caution you that the foregoing list of important factors is not exclusive.
When evaluating forward-looking statements, you should carefully consider
the foregoing factors and other uncertainties and events, including the infor-
mation set forth in “Risk factors” in I – Information on the company in our
Annual Report 2015.


Credit Suisse GroupParadeplatz 88070 ZurichSwitzerlandTel. +41 44 212 16 16www.credit-suisse.com