basel ii pillar 3 disclosure - alliance bank malaysia …€¦ · · 2013-06-20basel ii pillar 3...
TRANSCRIPT

BASEL II pILLAr 3 dISCLoSUrE210 Overview211 1.0 Scope of Application211 2.0 Capital
2.1 Capital Adequacy Ratios2.2 Capital Structure2.3 Risk-Weighted Assets and Capital Requirements
220 3.0 Credit Risk3.1 Distribution of Credit Exposures3.2 Past Due Loans, Advances and Financing Analysis3.3 Impaired Loans, Advances and Financing Analysis3.4 Assignment of Risk-Weights for Portfolio Under the Standardised Approach3.5 Credit Risk Mitigation3.6 Off-Balance Sheet Exposures and Counterparty Credit Risk
253 4.0 Market Risk255 5.0 Operational Risk255 6.0 Equity Exposures in Banking Book257 7.0 Interest Rate Risk/Rate of Return Risk
in the Banking Book258 8.0 Shariah Governance Disclosures
and Profit Sharing Investment Account (“PSIA”)

oVErVIEW
Bank Negara Malaysia’s (“BNM”) guidelines on capital adequacy require Alliance Bank Malaysia Berhad and its subsidiaries (“the Group”) to maintain an adequate level of capital to withstand potential losses arising from its operations. BNM’s capital adequacy guidelines cover 3 main aspects:
(a) Pillar 1 – covers the calculation of risk-weighted assets for credit risk, market risk and operational risk.
(b) Pillar 2 – involves assessment of other risks (e.g. interest rate risk in the banking book, liquidity risk and concentration risk) not covered under Pillar 1. This promotes adoption of forward-looking approaches to capital management and stress testing/risk simulation techniques.
(c) Pillar 3 – covers disclosure and external communication of risk and capital information by banks.
The Group maintains a strong capital base to support its current activities and future growth, to meet regulatory capital requirements at all times and to buffer against potential losses.
To ensure that risks and returns are appropriately balanced, the Group has implemented a Group-wide Integrated Risk Management Framework, with guidelines for identifying, measuring, and managing risks. This process includes quantifying and aggregating various risks in order to ensure the Group and each entity has sufficient capital to cushion unexpected losses and remain solvent.
In summary, the capital management process involves the following:
(i) Monitoring of regulatory capital and ensuring that the minimum regulatory requirements and approved internal ratios are adhered to.
(ii) Estimation of capital requirements based on ongoing forecasting and budgeting process.
(iii) Regular reporting of regulatory and internal capital ratios to management.
In addition, the Group’s capital adequacy under extreme but plausible stress scenarios are periodically assessed via a Group-wide stress test exercise. The results of the stress tests are reported to senior management, to provide them with an assessment of the financial impact of such events on the Group’s earnings and capital.
The Group’s Pillar 3 Disclosure is governed by the Bank Disclosure Policy on Basel II Risk-Weighted Capital Adequacy Framework – Pillar 3 which sets out the minimum disclosure standards, the approach for determining the appropriateness of information disclosed and the internal controls over the disclosure process which covers the verification and review of the accuracy of information disclosed.
BASEL II pILLAr 3 dISCLoSUrE 31 March 2013
ALLIANCE FINANCIAL GroUp BErHAd (6627-X)210

BASEL II pILLAr 3 dISCLoSUrE 31 March 2013
1.0 SCopE oF AppLICATIoN
The Pillar 3 Disclosure was prepared on a consolidated basis and comprises information on Alliance Bank Malaysia Berhad (“the Bank”), its subsidiaries and associate companies. The Group offers Conventional and Islamic banking services. The latter includes the acceptance of deposits and granting of financing under the Shariah principles via the Bank’s wholly-owned subsidiary, Alliance Islamic Bank Berhad. Information on subsidiary and associate companies are available in Note 13 and 14 of the audited financial statements of the Bank.
The basis of consolidation for the use of regulatory capital purposes is similar to that for financial accounting purposes as prescribed in Note 2(b) of the audited financial statements of the Bank, except for investments in subsidiaries engaged in nominees activities and sales distribution which are excluded from the regulatory consolidation and are deducted from regulatory capital.
There were no significant restrictions or other major impediments on transfer of funds or regulatory capital within the Group.
There were no capital deficiencies in any of the subsidiaries of the Group that were not included in the consolidation for regulatory purposes as at the financial year end.
The capital adequacy information was computed in accordance with BNM’s Capital Adequacy Framework. The Group has adopted the Standardised Approach for credit risk and market risk, and Basic Indicator Approach for operational risk.
2.0 CApITAL
In managing its capital, the Group’s objectives are:
(i) to maintain sufficient capital resources to meet the regulatory capital requirements as set forth by BNM,
(ii) to maintain sufficient capital resources to support the Group’s risk appetite and to enable future business growth, and
(iii) to meet the expectations of key stakeholders, including shareholders, investors, regulators and rating agencies.
In line with this, the Group aims to maintain capital adequacy ratios that are above the regulatory requirements, while balancing shareholders’ desire for sustainable returns and high standards of prudence.
The Group carries out stress testing to estimate the potential impact of extreme but plausible events on the Group’s earnings, balance sheet and capital. The results of the stress tests are to facilitate the formulation of action plan(s) in advance if the stress tests reveal that the Group’s capital will be adversely affected. The results of the stress tests are tabled to the Group Risk Management Committee for approval.
The Group’s and the Bank’s regulatory capital are determined under BNM’s Capital Adequacy Framework and their capital ratios comply with the prescribed capital adequacy ratios.
2013 ANNUAL REPORT 211

BASEL II pILLAr 3 dISCLoSUrE 31 March 2013
2.0 CApITAL (cont’d)
2.1 Capital Adequacy ratios
With effect from 1 January 2013, the capital adequacy ratios of the Bank and the Group are computed in accordance with BNM’s Capital Adequacy Framework issued on 28 November 2012. The Framework sets out the approach for computing regulatory capital adequacy ratios, as well as the levels of those ratios at which banking institutions are required to operate. The framework is to strengthen capital adequacy standards, in line with the requirements set forth under Basel III. The risk-weighted assets of the Bank and the Group are computed using the Standardised Approach for credit risk and market risk, and the Basic Indicator Approach for operational risk.
Accordingly, the capital adequacy ratios of the Bank and the Group as at 31 March 2013 are computed under the Capital Adequacy Framework.
The minimum regulatory capital adequacy ratios are as follows:
Calendar YearCommon Equity Tier 1 (“CET I”) Capital ratio Tier I Capital ratio Total Capital ratio
2013* 3.5% 4.5% 8.0%
2014* 4.0% 5.5% 8.0%
2015 4.5% 6.0% 8.0%
* transitional arrangements according to BNM Guidelines
For the comparative presentations, the capital adequacy ratios however have been set out in accordance with BNM’s Risk-Weighted Capital Adequacy Framework (General Requirements and Capital Components). The minimum regulatory capital adequacy requirement is 8.0% for the risk-weighted capital ratio.
ALLIANCE FINANCIAL GroUp BErHAd (6627-X)212

BASEL II pILLAr 3 dISCLoSUrE 31 March 2013
2.0 CApITAL (cont’d)
2.1 Capital Adequacy ratios (cont’d)
(a) The capital adequacy ratios of the Bank and the Group are as follows:
Bank Group
31 March 2013
Before deducting proposed dividendsCET I capital ratio 12.24% 11.22%Tier I capital ratio 13.62% 12.66%Total capital ratio 13.62% 15.37%
After deducting proposed dividendsCET I capital ratio 11.51% 10.62%Tier I capital ratio 12.90% 12.06%Total capital ratio 12.90% 14.77%
31 March 2012
Before deducting proposed dividendsCore capital ratio 14.23% 12.37% Risk-weighted capital ratio 14.28% 15.62%
After deducting proposed dividendsCore capital ratio 13.63% 11.88% Risk-weighted capital ratio 13.68% 15.13%
(b) The capital adequacy ratios of the banking subsidiaries are as follows:
Alliance Alliance Islamic Investment Bank Bank Berhad Berhad
31 March 2013
Before deducting proposed dividendsCET I capital ratio 12.93% 96.24%Tier I capital ratio 12.93% 96.24%Total capital ratio 13.72% 96.40%
After deducting proposed dividendsCET I capital ratio 12.93% 94.96%Tier I capital ratio 12.93% 94.96%Total capital ratio 13.72% 95.12%
31 March 2012
Before deducting proposed dividendsCore capital ratio 13.00% 58.39% Risk-weighted capital ratio 14.04% 58.51%
After deducting proposed dividendsCore capital ratio 12.17% 57.13% Risk-weighted capital ratio 13.21% 57.25%
The detailed capital adequacy ratios of the above banking subsidiaries are set out in the Pillar 3 Report of the respective entity.
2013 ANNUAL REPORT 213

2.0 CApITAL (cont’d)
2.2 Capital Structure
The following tables represent the Bank’s and the Group’s capital positions. Details on capital resources, including share capital, irredeemable (non-cumulative) convertible preference shares (“ICPS”), share premium and reserves are found in Note 26 and 27 of the audited financial statements of the Bank. Details on the terms and conditions of subordinated obligations are contained in Note 25 of the audited financial statements of the Bank.
The following tables present the components of CET I, Tier I and Tier II capital.
Bank Group rM’000 rM’000
31 March 2013
CET I CapitalPaid-up share capital 596,517 596,517 Share premium 201,517 201,517 Retained profits 1,641,549 1,749,256 Statutory reserves 601,561 885,744 Revaluation reserves 85,257 115,397 Other reserves – 10,018
3,126,401 3,558,449 Less: Regulatory adjustment
– Goodwill and other intangibles (241,961) (358,275)– Deferred tax assets – (11,040)– 55% of revaluation reserve (46,891) (63,468)
Total CET I Capital 2,837,549 3,125,666
Tier I CapitalICPS 4,000 4,000 Share premium 396,000 396,000 Less: Regulatory adjustment
– Investment in subsidiaries and associates (79,467) –
Total additional Tier I Capital 320,533 400,000
Total Tier I Capital 3,158,082 3,525,666
Tier II CapitalSubordinated obligations 538,495 538,495 Collective assessment allowance 183,932 221,153 Less: Regulatory adjustment
– Investment in subsidiaries and associates (722,427) (4,117)
Total Tier II Capital – 755,531
Total Capital 3,158,082 4,281,197
BASEL II pILLAr 3 dISCLoSUrE 31 March 2013
ALLIANCE FINANCIAL GroUp BErHAd (6627-X)214

2.0 CApITAL (cont’d)
2.2 Capital Structure (cont’d)
The following tables present the components of Tier I and Tier II capital and deduction from capital.
Bank Group rM’000 rM’000
31 March 2012
Tier I Capital (Core Capital)Paid-up share capital 596,517 596,517 ICPS 4,000 4,000 Share premium 597,517 597,517 Retained profits 1,397,888 1,517,252 Statutory reserves 601,561 842,167 Other reserves – 10,018 Non-controlling interests – 4,905
3,197,483 3,572,376 Less: Purchased goodwill/goodwill on consolidation (186,272) (302,065)
Deferred tax assets – (15,038)
Total Tier I Capital 3,011,211 3,255,273
Tier II CapitalSubordinated obligations 597,829 597,829 Collective assessment allowance 214,419 260,666
Total Tier II Capital 812,248 858,495
Total Capital 3,823,459 4,113,768 Less: Investment in subsidiaries (801,664) (3,620)
Total Capital Base 3,021,795 4,110,148
The comparative capital adequacy ratios and components of capital base have been restated for the effects of the change in accounting policy on collective assessment allowance. Details of the restatements are as set out on Note 53 of the financial statements of the Bank.
BASEL II pILLAr 3 dISCLoSUrE 31 March 2013
2013 ANNUAL REPORT 215

2.0 CApITAL (cont’d)
2.3 risk-Weighted Assets (“rWA”) and Capital requirements
regulatory Capital requirements
The following tables present the minimum regulatory capital requirement of the Bank and the Group:
risk-Bank Gross Net Weighted Capital2013 Exposures Exposures Assets requirementsExposure Class rM’000 rM’000 rM’000 rM’000
(i) Credit Risk
On-balance sheet exposures:Sovereigns/Central banks 4,428,064 4,428,064 – –Public sector entities 50,615 50,615 10,123 810 Banks, Development Financial Institutions (“DFIs”)
and Multilateral Development Banks (“MDBs”) 4,235,331 4,229,449 1,070,873 85,670 Insurance companies, securities firms and
fund managers 7,691 770 770 62 Corporates 9,494,895 8,839,664 7,452,448 596,196 Regulatory retail 8,350,281 7,401,539 5,551,155 444,092 Residential mortgages 6,754,731 6,745,505 2,920,155 233,612 Higher risk assets 6,765 6,756 10,133 811 Other assets 470,311 470,311 226,797 18,144 Equity exposures 99,472 99,472 109,432 8,755 Defaulted exposures 239,338 237,881 276,250 22,100
Total on-balance sheet exposures 34,137,494 32,510,026 17,628,136 1,410,252
Off-balance sheet exposures:Credit-related off-balance sheet exposures 3,940,937 3,934,084 3,365,606 269,248 Derivative financial instruments 102,250 102,250 44,484 3,559 Defaulted exposures 12,433 12,422 18,633 1,491
Total off-balance sheet exposures 4,055,620 4,048,756 3,428,723 274,298
Total on and off-balance sheet exposures 38,193,114 36,558,782 21,056,859 1,684,550
(ii) Market Risk (Note 4.0)
Interest rate risk 10,236 819 Foreign currency risk 63,818 5,105
Total 74,054 5,924
(iii) Operational Risk – – 2,060,540 164,843
Total RWA and capital requirements 38,193,114 36,558,782 23,191,453 1,855,317
Long Position
Short Position
1,270,537 (3,229)
63,818 (2,733)
1,334,355 (5,962)
BASEL II pILLAr 3 dISCLoSUrE 31 March 2013
ALLIANCE FINANCIAL GroUp BErHAd (6627-X)216

2.0 CApITAL (cont’d)
2.3 rWA and Capital requirements (cont’d)
regulatory Capital requirements (cont’d)
The following tables present the minimum regulatory capital requirement of the Bank and the Group (cont’d):
risk-Group Gross Net Weighted Capital2013 Exposures Exposures Assets requirementsExposure Class rM’000 rM’000 rM’000 rM’000
(i) Credit Risk
On-balance sheet exposures:Sovereigns/Central banks 6,293,224 6,293,224 – –Public sector entities 50,615 50,615 10,123 810 Banks, DFIs and MDBs 4,366,278 4,360,396 936,747 74,940 Insurance companies, securities firms and
fund managers 7,712 790 790 63 Corporates 11,438,538 10,530,451 8,772,591 701,807 Regulatory retail 10,534,294 9,542,026 7,169,014 573,521 Residential mortgages 8,108,149 8,098,296 3,567,034 285,363 Higher risk assets 6,833 6,823 10,235 819 Other assets 584,149 584,149 332,896 26,632 Equity exposures 137,392 137,392 147,352 11,788 Defaulted exposures 295,977 293,908 339,208 27,137
Total on-balance sheet exposures 41,823,161 39,898,070 21,285,990 1,702,880
Off-balance sheet exposures:Credit-related off-balance sheet exposures 4,546,740 4,538,237 3,825,953 306,076 Derivative financial instruments 102,250 102,250 44,484 3,559 Defaulted exposures 12,891 12,880 19,319 1,546
Total off-balance sheet exposures 4,661,881 4,653,367 3,889,756 311,181
Total on and off-balance sheet exposures 46,485,042 44,551,437 25,175,746 2,014,061
(ii) Market Risk (Note 4.0)
Interest rate risk 12,227 978 Foreign currency risk 63,818 5,105
Total 76,045 6,083
(iii) Operational Risk – – 2,603,941 208,315
Total RWA and capital requirements 46,485,042 44,551,437 27,855,732 2,228,459
Long Position
Short Position
1,525,169 (3,229)
63,818 (2,733)
1,588,987 (5,962)
BASEL II pILLAr 3 dISCLoSUrE 31 March 2013
2013 ANNUAL REPORT 217
2.0 CApITAL (cont’d)
2.3 rWA and Capital requirements (cont’d)
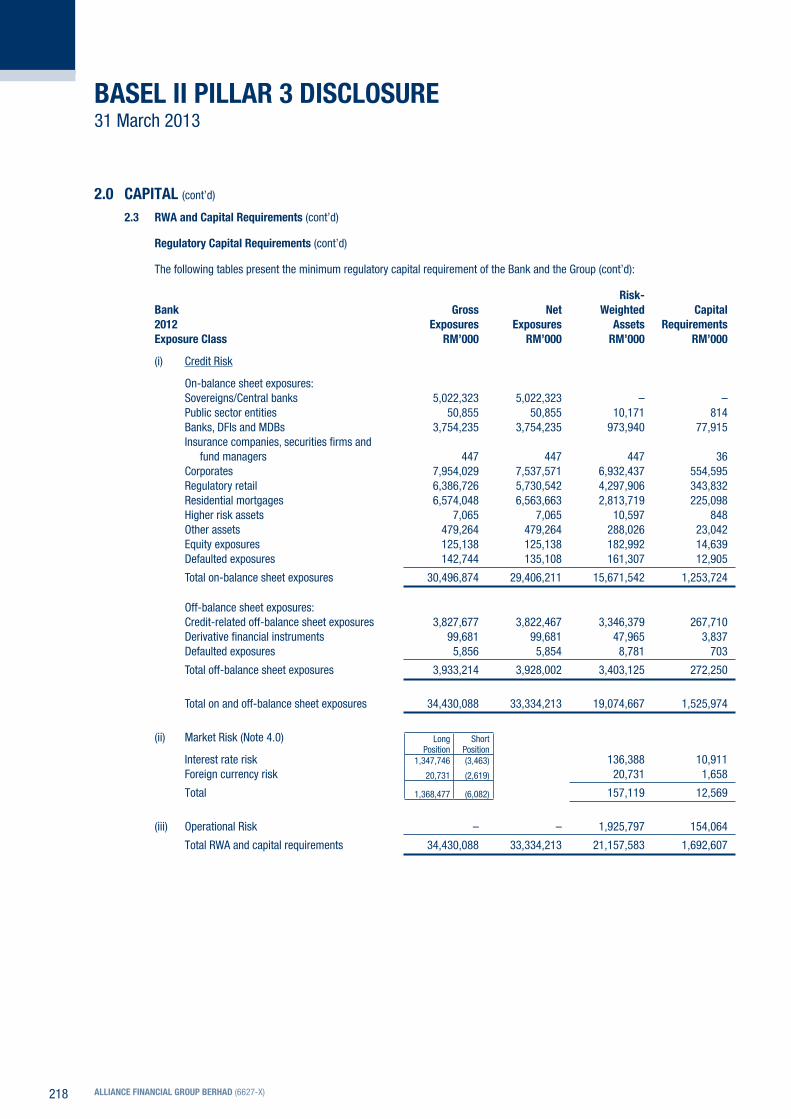
regulatory Capital requirements (cont’d)
The following tables present the minimum regulatory capital requirement of the Bank and the Group (cont’d):
risk-Bank Gross Net Weighted Capital2012 Exposures Exposures Assets requirementsExposure Class rM’000 rM’000 rM’000 rM’000
(i) Credit Risk
On-balance sheet exposures:Sovereigns/Central banks 5,022,323 5,022,323 – –Public sector entities 50,855 50,855 10,171 814Banks, DFIs and MDBs 3,754,235 3,754,235 973,940 77,915Insurance companies, securities firms and
fund managers 447 447 447 36Corporates 7,954,029 7,537,571 6,932,437 554,595Regulatory retail 6,386,726 5,730,542 4,297,906 343,832Residential mortgages 6,574,048 6,563,663 2,813,719 225,098Higher risk assets 7,065 7,065 10,597 848Other assets 479,264 479,264 288,026 23,042Equity exposures 125,138 125,138 182,992 14,639Defaulted exposures 142,744 135,108 161,307 12,905
Total on-balance sheet exposures 30,496,874 29,406,211 15,671,542 1,253,724
Off-balance sheet exposures:Credit-related off-balance sheet exposures 3,827,677 3,822,467 3,346,379 267,710Derivative financial instruments 99,681 99,681 47,965 3,837Defaulted exposures 5,856 5,854 8,781 703
Total off-balance sheet exposures 3,933,214 3,928,002 3,403,125 272,250
Total on and off-balance sheet exposures 34,430,088 33,334,213 19,074,667 1,525,974
(ii) Market Risk (Note 4.0)
Interest rate risk 136,388 10,911 Foreign currency risk 20,731 1,658
Total 157,119 12,569
(iii) Operational Risk – – 1,925,797 154,064
Total RWA and capital requirements 34,430,088 33,334,213 21,157,583 1,692,607
Long Position
Short Position
1,347,746 (3,463)
20,731 (2,619)
1,368,477 (6,082)
BASEL II pILLAr 3 dISCLoSUrE 31 March 2013
ALLIANCE FINANCIAL GroUp BErHAd (6627-X)218

2.0 CApITAL (cont’d)
2.3 rWA and Capital requirements (cont’d)
regulatory Capital requirements (cont’d)
The following tables present the minimum regulatory capital requirement of the Bank and the Group (cont’d):
risk-Group Gross Net Weighted Capital2012 Exposures Exposures Assets requirementsExposure Class rM’000 rM’000 rM’000 rM’000
(i) Credit Risk
On-balance sheet exposures:Sovereigns/Central banks 7,143,989 7,143,989 – –Public sector entities 50,855 50,855 10,171 814Banks, DFIs and MDBs 4,392,711 4,392,711 1,105,558 88,445Insurance companies, securities firms and
fund managers 476 476 476 38Corporates 9,689,833 9,031,886 8,226,723 658,138Regulatory retail 8,759,219 8,058,947 6,054,024 484,322Residential mortgages 7,620,144 7,609,112 3,313,763 265,101Higher risk assets 7,159 7,159 10,739 859Other assets 626,605 626,605 435,436 34,835Equity exposures 169,942 169,942 250,198 20,016Defaulted exposures 225,479 217,286 277,392 22,191
Total on-balance sheet exposures 38,686,412 37,308,968 19,684,480 1,574,759
Off-balance sheet exposures:Credit-related off-balance sheet exposures 4,481,607 4,462,291 3,849,888 307,991Derivative financial instruments 99,681 99,681 47,965 3,837Defaulted exposures 12,777 12,775 19,162 1,533
Total off-balance sheet exposures 4,594,065 4,574,747 3,917,015 313,361
Total on and off-balance sheet exposures 43,280,477 41,883,715 23,601,495 1,888,120
(ii) Market Risk (Note 4.0)
Interest rate risk 138,881 11,110 Equity risk 9,402 752 Foreign currency risk 20,731 1,658 Options risk 96,418 7,713
Total 265,432 21,233
(iii) Operational Risk – – 2,445,524 195,642
Total RWA and capital requirements 43,280,477 41,883,715 26,312,451 2,104,995
Note:
Under Islamic banking, the Group does not use Profit-sharing Investment Account (“PSIA”) as a risk absorbent mechanism.
The Bank and the Group do not have exposure to any Large Exposure Risk for equity holdings as specified under BNM’s Guidelines on Investment in Shares, Interest-in-Shares and Collective Investment Schemes.
Long Position
Short Position
1,497,439 (3,463)
3,419
20,731
70,122
–
(2,619)
–
1,591,711 (6,082)
BASEL II pILLAr 3 dISCLoSUrE 31 March 2013
2013 ANNUAL REPORT 219
3.0 CrEdIT rISK
Credit risk is the risk of financial loss resulting from the failure of the Bank’s borrowers or counterparties to fulfil their contractual obligations to repay their loans or settle financial commitments. Credit risk arises mainly from lending/financing activities and trading/holding of debt securities.
Credit Risk Management
The Board, via the Group Risk Management Committee (“GRMC”), established a Credit Risk Management Framework (“CRMF”) which outlines the principles for managing credit risk in the Group. The CRMF covers the credit approving structure, risk policies framework, the credit process, collateral management, review, portfolio risk management, collection, problem credit management, rating, infrastructure, fraud and stress test.
Credit approval authority is delegated to underwriters based on their experience and seniority. Credit granting decisions are based on judgmental decisions supplemented with credit rating; risk reward is a major consideration in loan pricing. Larger loans are approved by the Management Credit Committee while some are subject to concurrence by the Executive Committee.
Retail loans are subject to portfolio reviews and corporate loans are subject to periodic individual borrower or group reviews. Loans with signs of problem will be managed under the Early Warning Framework. Recovery of impaired loans are carried out by specialists independent of the lines of business.
Portfolio Review Committee for the respective lines of business, assisted by embedded business risk units, manage the portfolio quality to ensure alignment of business strategy with the Bank’s risk appetite.
Group Risk Management and business risk units are responsible to assess adequacy and effectiveness of the risk management framework, policies and guidelines.
Stress testing is used to ascertain the size of probable losses under a range of scenarios for the loan portfolio and the impact to bottom lines and capital. These stress tests are performed using different market and economic assumptions to assess possible vulnerability and effective mitigating actions when required.
The Credit Review Unit under Group Internal Audit review the credit process regularly and recommend corrective measures or enhancements. These reviews provide senior management with assurance that the policies, guidelines and limits are adhered to and that the credit process in the Bank is acceptable.
Impaired Loans and Provisions
Past due accounts are loan accounts with any payment of principal and/or interest due and not paid, but are not classified as impaired. Loans are classified as impaired if the judgmental or mandatory triggers are triggered.
Individual assessments are performed on impaired accounts with principal outstanding of RM1 million and above. The discounted cashflow method will be used to determine the recoverable amounts. The remaining loans’ portfolios are then collectively assessed for impairment allowance provision.
Prior to 1 April 2012, under the transitional provision for FRS 139 as prescribed by BNM’s Guidelines on Classification and Impairment Provisions for Loans/Financing, the Bank and the Group had maintained collective assessment allowance at 1.5% of total outstanding loans/financing net of individual assessment allowance. Upon the effective date of MFRS 139 on 1 January 2012, these transitional provisions, which were allowed under the previous FRS framework, were removed.
This change in accounting policy has been accounted for retrospectively, and has resulted in a restatement of the comparatives.
Please refer to Note 2(i)(i) of the audited financial statements of the Bank for accounting policies on impaired loans, advances and financing.
BASEL II pILLAr 3 dISCLoSUrE 31 March 2013
ALLIANCE FINANCIAL GroUp BErHAd (6627-X)220

3.0 CrEdIT rISK (cont’d)
3.1 distribution of Credit Exposures
(a) Geographical distribution
The following tables represent the Bank’s and the Group’s major type of gross credit exposure by geographical distribution. Exposure are allocated to the region in which the customer is located and are disclosed before taking account of any collateral held or other credit enhancements and after allowance for impairment where appropriate.
Geographical region East
Bank Northern Central Southern Malaysia 2013 rM’000 rM’000 rM’000 rM’000
Cash and short-term funds – 1,123,142 – – Deposits and placements with banks and
other financial institutions – 124,946 – – Financial assets held-for-trading – 1,265,298 – – Financial investments available-for-sale – 8,328,534 – – Financial investments held-to-maturity – 101,717 – – Derivative financial assets – 19,792 – – Loans, advances and financing 1,558,192 17,355,446 1,947,550 2,003,212
Total on-balance sheet 1,558,192 28,318,875 1,947,550 2,003,212 Financial guarantees 55,768 312,230 26,042 31,481 Credit related commitments and contingencies 638,075 8,407,125 811,711 810,562
Total credit exposure 2,252,035 37,038,230 2,785,303 2,845,255
Group2013
Cash and short-term funds – 1,044,219 – – Deposits and placements with banks and
other financial institutions – 153,236 – – Balances due from clients and brokers – 50,122 – – Financial assets held-for-trading – 1,519,930 – – Financial investments available-for-sale – 10,225,058 – – Financial investments held-to-maturity – 596,949 – – Derivative financial assets – 19,792 – – Loans, advances and financing 1,797,137 21,147,476 2,450,937 2,352,256
Total on-balance sheet 1,797,137 34,756,782 2,450,937 2,352,256 Financial guarantees 74,505 356,286 34,764 34,703 Credit related commitments and contingencies 738,443 9,397,039 974,144 1,220,571
Total credit exposure 2,610,085 44,510,107 3,459,845 3,607,530
BASEL II pILLAr 3 dISCLoSUrE 31 March 2013
2013 ANNUAL REPORT 221

3.0 CrEdIT rISK (cont’d)
3.1 distribution of Credit Exposures (cont’d)
(a) Geographical distribution (cont’d)
Geographical region East
Bank Northern Central Southern Malaysia 2012 rM’000 rM’000 rM’000 rM’000
Cash and short-term funds – 1,539,052 – –Deposits and placements with banks and
other financial institutions – 143,461 – –Financial assets held-for-trading – 1,342,302 – –Financial investments available-for-sale – 7,325,003 – –Financial investments held-to-maturity – 228,622 – –Derivative financial assets – 23,712 – –Loans, advances and financing 1,551,654 14,773,727 1,644,965 1,804,252
Total on-balance sheet 1,551,654 25,375,879 1,644,965 1,804,252Financial guarantees 48,823 291,800 21,381 32,904Credit related commitments and contingencies 594,161 9,126,214 524,327 867,311
Total credit exposure 2,194,638 34,793,893 2,190,673 2,704,467
Group2012
Cash and short-term funds – 1,683,092 – –Deposits and placements with banks and
other financial institutions – 93,438 – –Balances due from clients and brokers 13,825 44,051 3,888 –Financial assets held-for-trading – 1,491,995 – –Financial investments available-for-sale – 8,983,101 – –Financial investments held-to-maturity – 795,256 – –Derivative financial assets – 23,712 – –Loans, advances and financing 1,804,917 18,493,351 2,047,619 2,114,422
Total on-balance sheet 1,818,742 31,607,996 2,051,507 2,114,422Financial guarantees 67,643 332,255 27,880 36,184Credit related commitments and contingencies 659,453 10,363,305 652,725 1,333,544
Total credit exposure 2,545,838 42,303,556 2,732,112 3,484,150
BASEL II pILLAr 3 dISCLoSUrE 31 March 2013
ALLIANCE FINANCIAL GroUp BErHAd (6627-X)222

BASE
L II
pILL
Ar 3
dIS
CLoS
UrE
31 M
arch
201
3
3.0
CrEd
IT r
ISK
(con
t’d)
3.1
dist
ribut
ion
of C
redi
t Exp
osur
es (c
ont’d
)
(b)
Indu
stry
dis
trib
utio
n
The
follo
win
g ta
bles
repr
esen
t the
Ban
k’s
and
the
Grou
p’s
maj
or ty
pe o
f gro
ss c
redi
t exp
osur
e by
sec
tor.
The
anal
ysis
is b
ased
on
the
sect
or in
whi
ch th
e cu
stom
ers
are
enga
ged.
Fina
ncia
l,
Agric
ultu
re,
Go
vern
men
t in
sura
nce
& Tr
ansp
ort,
man
ufac
turin
g,
Mot
or
oth
er
and
Cent
ral
bus
ines
s st
orag
e &
who
lesa
le &
res
iden
tial
vehi
cle
con
sum
erBa
nk
ban
k se
rvic
es c
omm
unic
atio
n
reta
il tra
de
Cons
truct
ion
m
ortg
age
fina
ncin
g lo
ans
Tota
l20
13
rM
’000
r
M’0
00
rM
’000
r
M’0
00
rM
’000
r
M’0
00
rM
’000
r
M’0
00
rM
’000
Cash
and
sho
rt-te
rm fu
nds
618
,890
5
04,2
52
–
–
–
–
–
–
1,1
23,1
42
Depo
sits
and
plac
emen
ts w
ith b
anks
an
d ot
her f
inan
cial i
nstit
utio
ns
–
124
,946
–
–
–
–
–
–
1
24,9
46
Finan
cial a
sset
s he
ld-fo
r-tra
ding
1
,265
,298
–
–
–
–
–
–
–
1
,265
,298
Fin
ancia
l inv
estm
ents
ava
ilabl
e-fo
r-sal
e 2
,712
,779
5
,052
,209
9
7,68
8
336
,345
5
7,58
9
–
–
71,
924
8
,328
,534
Fin
ancia
l inv
estm
ents
hel
d-to
-mat
urity
1
01,2
56
461
–
–
–
–
–
–
1
01,7
17
Deriv
ative
fina
ncia
l ass
ets
–
19,
629
–
–
–
–
–
1
63
19,
792
Loan
s, ad
vanc
es a
nd fi
nanc
ing
–
2,5
64,5
41
88,
553
6
,509
,323
3
80,1
32
9,3
83,5
62
365
,548
3
,572
,741
2
2,86
4,40
0
Tota
l on-
bala
nce
shee
t 4
,698
,223
8
,266
,038
1
86,2
41
6,8
45,6
68
437
,721
9
,383
,562
3
65,5
48
3,6
44,8
28
33,
827,
829
Finan
cial g
uara
ntee
s –
2
8,76
7
20,
375
2
99,2
82
37,
971
–
–
3
9,12
6
425
,521
Cr
edit
rela
ted
com
mitm
ents
an
d co
ntin
genc
ies
–
950
,781
5
3,51
7
2,5
33,3
98
814
,259
–
–
6
,315
,518
1
0,66
7,47
3
Tota
l off-
bala
nce
shee
t –
9
79,5
48
73,
892
2
,832
,680
8
52,2
30
–
–
6,3
54,6
44
11,
092,
994
Tota
l cre
dit r
isk
4,6
98,2
23
9,2
45,5
86
260
,133
9
,678
,348
1
,289
,951
9
,383
,562
3
65,5
48
9,9
99,4
72
44,
920,
823
2013 ANNUAL REPORT 223

BASE
L II
pILL
Ar 3
dIS
CLoS
UrE
31 M
arch
201
3
3.0
CrEd
IT r
ISK
(con
t’d)
3.1
dist
ribut
ion
of C
redi
t Exp
osur
es (c
ont’d
)
(b)
Indu
stry
dis
trib
utio
n (c
ont’d
)
The
follo
win
g ta
bles
repr
esen
t the
Ban
k’s
and
the
Grou
p’s
maj
or ty
pe o
f gro
ss c
redi
t exp
osur
e by
sec
tor.
The
anal
ysis
is b
ased
on
the
sect
or in
whi
ch th
e cu
stom
ers
are
enga
ged
(con
t’d).
Fina
ncia
l,
Agric
ultu
re,
Go
vern
men
t in
sura
nce
& Tr
ansp
ort,
man
ufac
turin
g,
Mot
or
oth
er
and
Cent
ral
bus
ines
s st
orag
e &
who
lesa
le &
res
iden
tial
vehi
cle
con
sum
erGr
oup
ban
k se
rvic
es c
omm
unic
atio
n
reta
il tra
de
Cons
truct
ion
m
ortg
age
fina
ncin
g lo
ans
Tota
l20
13
rM
’000
r
M’0
00
rM
’000
r
M’0
00
rM
’000
r
M’0
00
rM
’000
r
M’0
00
rM
’000
Cash
and
sho
rt-te
rm fu
nds
738
,087
3
06,1
32
–
–
–
–
–
–
1,0
44,2
19
Depo
sits
and
plac
emen
ts w
ith b
anks
an
d ot
her f
inan
cial i
nstit
utio
ns
–
153
,236
–
–
–
–
–
–
1
53,2
36
Bala
nces
due
from
clie
nts
and
brok
ers
–
–
–
–
–
–
–
50,
122
5
0,12
2 Fin
ancia
l ass
ets
held
-for-t
radi
ng
1,5
19,9
30
–
–
–
–
–
–
–
1,5
19,9
30
Finan
cial i
nves
tmen
ts a
vaila
ble-
for-s
ale
3,6
53,7
18
5,8
28,9
40
158
,284
4
18,3
31
78,
449
–
–
8
7,33
6
10,
225,
058
Finan
cial i
nves
tmen
ts h
eld-
to-m
atur
ity
591
,264
5
13
5,1
72
–
–
–
–
–
596
,949
De
rivat
ive fi
nanc
ial a
sset
s –
1
9,62
9
–
–
–
–
–
163
1
9,79
2 Lo
ans,
adva
nces
and
fina
ncin
g –
2
,895
,855
1
11,1
78
7,6
26,0
69
438
,726
1
1,36
2,64
9
575
,222
4
,738
,107
2
7,74
7,80
6
Tota
l on-
bala
nce
shee
t 6
,502
,999
9
,204
,305
2
74,6
34
8,0
44,4
00
517
,175
1
1,36
2,64
9
575
,222
4
,875
,728
4
1,35
7,11
2
Finan
cial g
uara
ntee
s –
3
2,58
2
20,
468
3
69,6
36
38,
080
–
–
3
9,49
2
500
,258
Cr
edit
rela
ted
com
mitm
ents
an
d co
ntin
genc
ies
–
1,0
91,6
66
55,
548
2
,988
,350
8
47,3
21
600
,903
2
18
6,7
46,1
91
12,
330,
197
Tota
l off-
bala
nce
shee
t –
1
,124
,248
7
6,01
6
3,3
57,9
86
885
,401
6
00,9
03
218
6
,785
,683
1
2,83
0,45
5
Tota
l cre
dit r
isk
6,5
02,9
99
10,
328,
553
3
50,6
50
11,
402,
386
1
,402
,576
1
1,96
3,55
2
575
,440
1
1,66
1,41
1
54,
187,
567
ALLIANCE FINANCIAL GroUp BErHAd (6627-X)224

3.0
CrEd
IT r
ISK
(con
t’d)
3.1
dist
ribut
ion
of C
redi
t Exp
osur
es (c
ont’d
)
(b)
Indu
stry
dis
trib
utio
n (c
ont’d
)
The
follo
win
g ta
bles
repr
esen
t the
Ban
k’s
and
the
Grou
p’s
maj
or ty
pe o
f gro
ss c
redi
t exp
osur
e by
sec
tor.
The
anal
ysis
is b
ased
on
the
sect
or in
whi
ch th
e cu
stom
ers
are
enga
ged
(con
t’d).
Fina
ncia
l,
Agric
ultu
re,
Go
vern
men
t in
sura
nce
& Tr
ansp
ort,
man
ufac
turin
g,
Mot
or
oth
er
and
Cent
ral
bus
ines
s st
orag
e &
who
lesa
le &
res
iden
tial
vehi
cle
con
sum
erBa
nk
ban
k se
rvic
es c
omm
unic
atio
n
reta
il tra
de
Cons
truct
ion
m
ortg
age
fina
ncin
g lo
ans
Tota
l20
12
rM
’000
r
M’0
00
rM
’000
r
M’0
00
rM
’000
r
M’0
00
rM
’000
r
M’0
00
rM
’000
Cash
and
sho
rt-te
rm fu
nds
903,
812
635,
240
– –
– –
– –
1,53
9,05
2De
posit
s an
d pl
acem
ents
with
ban
ks
and
othe
r fin
ancia
l ins
titut
ions
–
143,
461
– –
– –
– –
143,
461
Finan
cial a
sset
s he
ld-fo
r-tra
ding
1,
342,
302
– –
– –
– –
– 1,
342,
302
Finan
cial i
nves
tmen
ts a
vaila
ble-
for-s
ale
3,07
7,91
1 3,
874,
479
84,7
66
266,
737
21,1
10
– –
– 7,
325,
003
Finan
cial i
nves
tmen
ts h
eld-
to-m
atur
ity
227,
177
1,44
5 –
– –
– –
– 22
8,62
2De
rivat
ive fi
nanc
ial a
sset
s –
23,7
12
– –
– –
– –
23,7
12Lo
ans,
adva
nces
and
fina
ncin
g –
2,22
3,07
4 95
,974
6,
004,
163
208,
517
8,13
8,88
3 14
1,71
4 2,
962,
273
19,7
74,5
98
Tota
l on-
bala
nce
shee
t 5,
551,
202
6,90
1,41
1 18
0,74
0 6,
270,
900
229,
627
8,13
8,88
3 14
1,71
4 2,
962,
273
30,3
76,7
50
Finan
cial g
uara
ntee
s –
34,5
03
19,8
17
274,
277
29,2
05
300
– 36
,806
39
4,90
8Cr
edit
rela
ted
com
mitm
ents
an
d co
ntin
genc
ies
– 1,
156,
018
66,1
85
2,54
5,11
1 1,
197,
481
2,78
7,61
5 5
3,35
9,59
8 11
,112
,013
Tota
l off-
bala
nce
shee
t –
1,19
0,52
1 86
,002
2,
819,
388
1,22
6,68
6 2,
787,
915
5 3,
396,
404
11,5
06,9
21
Tota
l cre
dit r
isk
5,55
1,20
2 8,
091,
932
266,
742
9,09
0,28
8 1,
456,
313
10,9
26,7
98
141,
719
6,35
8,67
7 41
,883
,671
BASE
L II
pILL
Ar 3
dIS
CLoS
UrE
31 M
arch
201
3
2013 ANNUAL REPORT 225
BASE
L II
pILL
Ar 3
dIS
CLoS
UrE
31 M
arch
201
3
3.0
CrEd
IT r
ISK
(con
t’d)
3.1
dist
ribut
ion
of C
redi
t Exp
osur
es (c
ont’d
)
(b)
Indu
stry
dis
trib
utio
n (c
ont’d
)
The
follo
win
g ta
bles
repr
esen
t the
Ban
k’s
and
the
Grou
p’s
maj
or ty
pe o
f gro
ss c
redi
t exp
osur
e by
sec
tor.
The
anal
ysis
is b
ased
on
the
sect
or in
whi
ch th
e cu
stom
ers
are
enga
ged
(con
t’d).
Fina
ncia
l,
Agric
ultu
re,
Go
vern
men
t in
sura
nce
& Tr
ansp
ort,
man
ufac
turin
g,
Mot
or
oth
er
and
Cent
ral
bus
ines
s st
orag
e &
who
lesa
le &
res
iden
tial
vehi
cle
con
sum
erGr
oup
ban
k se
rvic
es c
omm
unic
atio
n
reta
il tra
de
Cons
truct
ion
m
ortg
age
fina
ncin
g lo
ans
Tota
l20
12
rM
’000
r
M’0
00
rM
’000
r
M’0
00
rM
’000
r
M’0
00
rM
’000
r
M’0
00
rM
’000
Cash
and
sho
rt-te
rm fu
nds
1,06
7,24
1 61
5,85
1 –
– –
– –
– 1,
683,
092
Depo
sits
and
plac
emen
ts w
ith b
anks
an
d ot
her f
inan
cial i
nstit
utio
ns
– 93
,438
–
– –
– –
– 93
,438
Bala
nces
due
from
clie
nts
and
brok
ers
– –
– –
– –
– 61
,764
61
,764
Finan
cial a
sset
s he
ld-fo
r-tra
ding
1,
491,
995
– –
– –
– –
– 1,
491,
995
Finan
cial i
nves
tmen
ts a
vaila
ble-
for-s
ale
4,20
2,30
9 4,
237,
686
137,
155
374,
422
31,5
29
– –
– 8,
983,
101
Finan
cial i
nves
tmen
ts h
eld-
to-m
atur
ity
768,
101
21,9
49
5,20
6 –
– –
– –
795,
256
Deriv
ative
fina
ncia
l ass
ets
– 23
,712
–
– –
– –
– 23
,712
Loan
s, ad
vanc
es a
nd fi
nanc
ing
– 2,
575,
043
125,
179
7,07
5,57
6 28
3,81
1 9,
558,
392
436,
954
4,40
5,35
4 24
,460
,309
Tota
l on-
bala
nce
shee
t 7,
529,
646
7,56
7,67
9 26
7,54
0 7,
449,
998
315,
340
9,55
8,39
2 43
6,95
4 4,
467,
118
37,5
92,6
67
Finan
cial g
uara
ntee
s –
37,7
12
19,9
08
338,
361
30,5
96
300
– 37
,085
46
3,96
2Cr
edit
rela
ted
com
mitm
ents
an
d co
ntin
genc
ies
– 1,
339,
215
66,9
64
3,12
6,40
9 1,
225,
981
3,40
4,76
5 23
0 3,
845,
463
13,0
09,0
27
Tota
l off-
bala
nce
shee
t –
1,37
6,92
7 86
,872
3,
464,
770
1,25
6,57
7 3,
405,
065
230
3,88
2,54
8 13
,472
,989
Tota
l cre
dit r
isk
7,52
9,64
6 8,
944,
606
354,
412
10,9
14,7
68
1,57
1,91
7 12
,963
,457
43
7,18
4 8,
349,
666
51,0
65,6
56
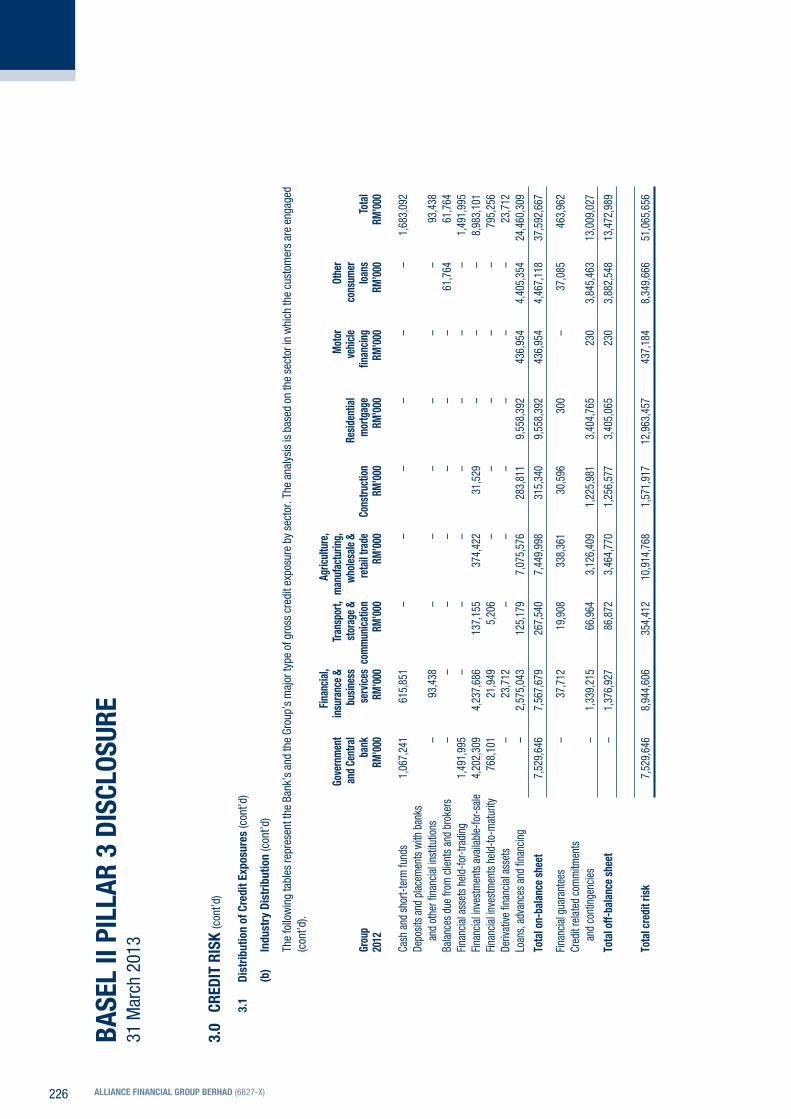
ALLIANCE FINANCIAL GroUp BErHAd (6627-X)226
BASEL II pILLAr 3 dISCLoSUrE 31 March 2013
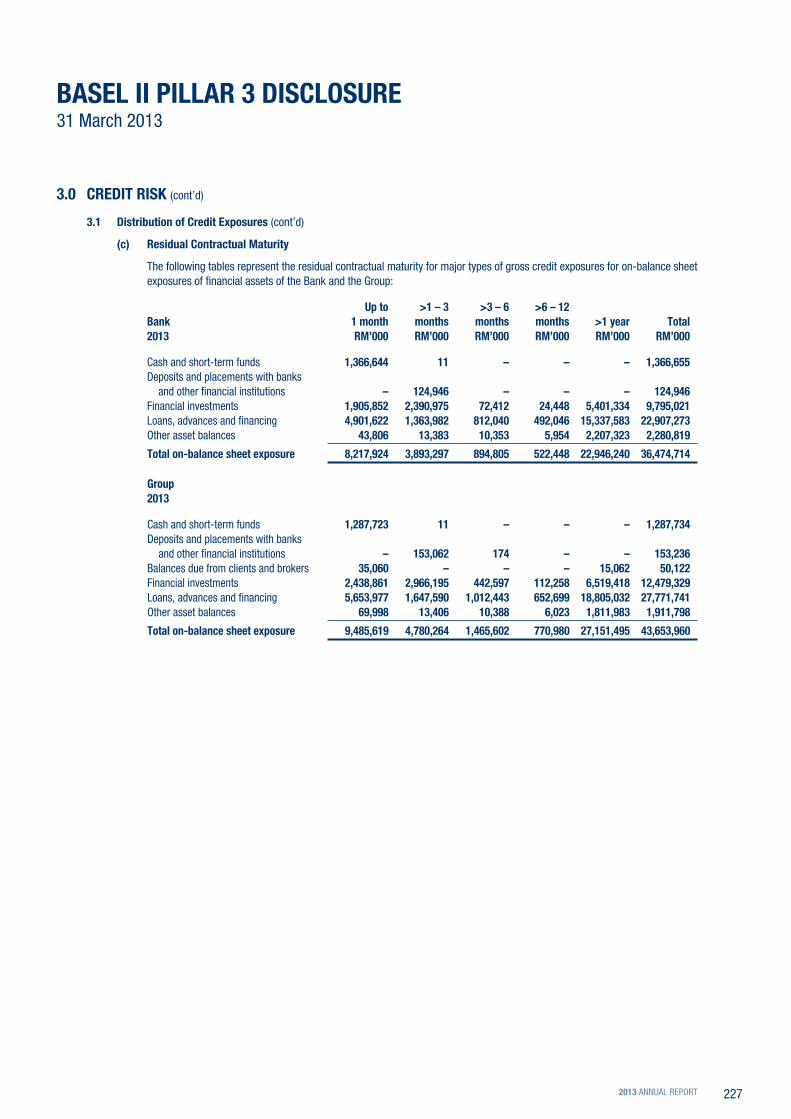
3.0 CrEdIT rISK (cont’d)
3.1 distribution of Credit Exposures (cont’d)
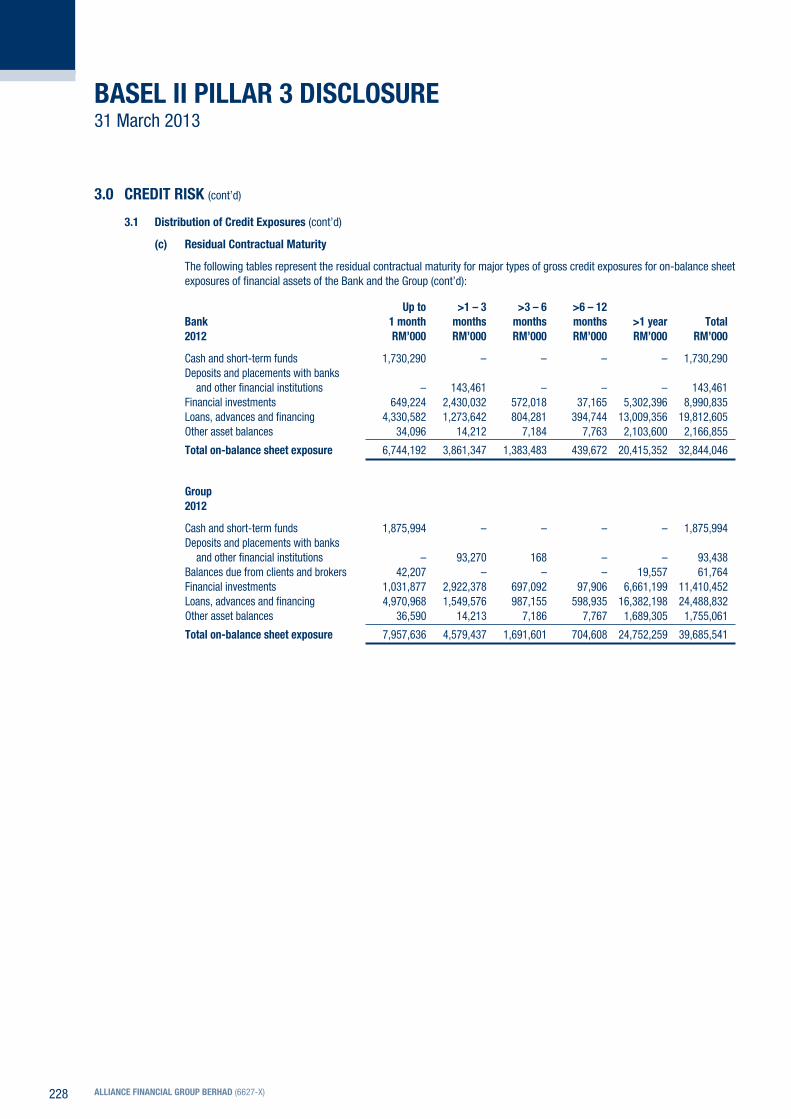
(c) residual Contractual Maturity
The following tables represent the residual contractual maturity for major types of gross credit exposures for on-balance sheet exposures of financial assets of the Bank and the Group:
Up to >1 – 3 >3 – 6 >6 – 12 Bank 1 month months months months >1 year Total2013 rM’000 rM’000 rM’000 rM’000 rM’000 rM’000
Cash and short-term funds 1,366,644 11 – – – 1,366,655 Deposits and placements with banks
and other financial institutions – 124,946 – – – 124,946 Financial investments 1,905,852 2,390,975 72,412 24,448 5,401,334 9,795,021 Loans, advances and financing 4,901,622 1,363,982 812,040 492,046 15,337,583 22,907,273 Other asset balances 43,806 13,383 10,353 5,954 2,207,323 2,280,819
Total on-balance sheet exposure 8,217,924 3,893,297 894,805 522,448 22,946,240 36,474,714
Group2013
Cash and short-term funds 1,287,723 11 – – – 1,287,734 Deposits and placements with banks
and other financial institutions – 153,062 174 – – 153,236 Balances due from clients and brokers 35,060 – – – 15,062 50,122 Financial investments 2,438,861 2,966,195 442,597 112,258 6,519,418 12,479,329 Loans, advances and financing 5,653,977 1,647,590 1,012,443 652,699 18,805,032 27,771,741 Other asset balances 69,998 13,406 10,388 6,023 1,811,983 1,911,798
Total on-balance sheet exposure 9,485,619 4,780,264 1,465,602 770,980 27,151,495 43,653,960
2013 ANNUAL REPORT 227
BASEL II pILLAr 3 dISCLoSUrE 31 March 2013
3.0 CrEdIT rISK (cont’d)
3.1 distribution of Credit Exposures (cont’d)
(c) residual Contractual Maturity
The following tables represent the residual contractual maturity for major types of gross credit exposures for on-balance sheet exposures of financial assets of the Bank and the Group (cont’d):
Up to >1 – 3 >3 – 6 >6 – 12 Bank 1 month months months months >1 year Total2012 rM’000 rM’000 rM’000 rM’000 rM’000 rM’000
Cash and short-term funds 1,730,290 – – – – 1,730,290Deposits and placements with banks
and other financial institutions – 143,461 – – – 143,461Financial investments 649,224 2,430,032 572,018 37,165 5,302,396 8,990,835Loans, advances and financing 4,330,582 1,273,642 804,281 394,744 13,009,356 19,812,605Other asset balances 34,096 14,212 7,184 7,763 2,103,600 2,166,855
Total on-balance sheet exposure 6,744,192 3,861,347 1,383,483 439,672 20,415,352 32,844,046
Group2012
Cash and short-term funds 1,875,994 – – – – 1,875,994Deposits and placements with banks
and other financial institutions – 93,270 168 – – 93,438Balances due from clients and brokers 42,207 – – – 19,557 61,764Financial investments 1,031,877 2,922,378 697,092 97,906 6,661,199 11,410,452Loans, advances and financing 4,970,968 1,549,576 987,155 598,935 16,382,198 24,488,832Other asset balances 36,590 14,213 7,186 7,767 1,689,305 1,755,061
Total on-balance sheet exposure 7,957,636 4,579,437 1,691,601 704,608 24,752,259 39,685,541
ALLIANCE FINANCIAL GroUp BErHAd (6627-X)228

BASEL II pILLAr 3 dISCLoSUrE 31 March 2013
3.0 CrEdIT rISK (cont’d)
3.2 past due Loans, Advances and Financing Analysis
Past due but not impaired loans, advances and financing are loans where the customers have failed to make a principal or interest payment when contractually due, and includes loans which are due one or more days after the contractual due date but less than 3 months.
Past due loans, advances and financing are analysed as follows:
Bank Group
2013 2012 2013 2012 rM’000 rM’000 rM’000 rM’000
Past due up to 1 month 714,766 602,109 925,366 909,157 Past due > 1 – 2 months 126,995 127,224 188,773 187,351 Past due > 2 – 3 months 5,097 15,430 17,599 30,448
846,858 744,763 1,131,738 1,126,956
Past due loans, advances and financing analysed by sector are as follows:
Bank Group
2013 2012 2013 2012 rM’000 rM’000 rM’000 rM’000
Financial, insurance & business services 13,948 42,494 14,840 43,478 Transport, storage & communication 2,741 1,332 3,279 2,835 Agriculture, manufacturing, wholesale & retail trade 79,249 48,189 91,412 55,198 Construction 10,028 9,495 10,634 14,924 Residential mortgage 534,919 459,166 627,621 516,795 Motor vehicle financing 66,442 53,242 126,990 139,333 Other consumer loans 139,531 130,845 256,962 354,393
846,858 744,763 1,131,738 1,126,956
Past due loans, advances and financing analysed by significant geographical areas:
Bank Group
2013 2012 2013 2012 rM’000 rM’000 rM’000 rM’000
Northern region 77,948 53,820 90,397 73,720 Central region 583,123 535,488 807,049 835,122 Southern region 109,411 84,411 144,953 130,463 East Malaysia region 76,376 71,044 89,339 87,651
846,858 744,763 1,131,738 1,126,956
2013 ANNUAL REPORT 229
BASEL II pILLAr 3 dISCLoSUrE 31 March 2013
3.0 CrEdIT rISK (cont’d)
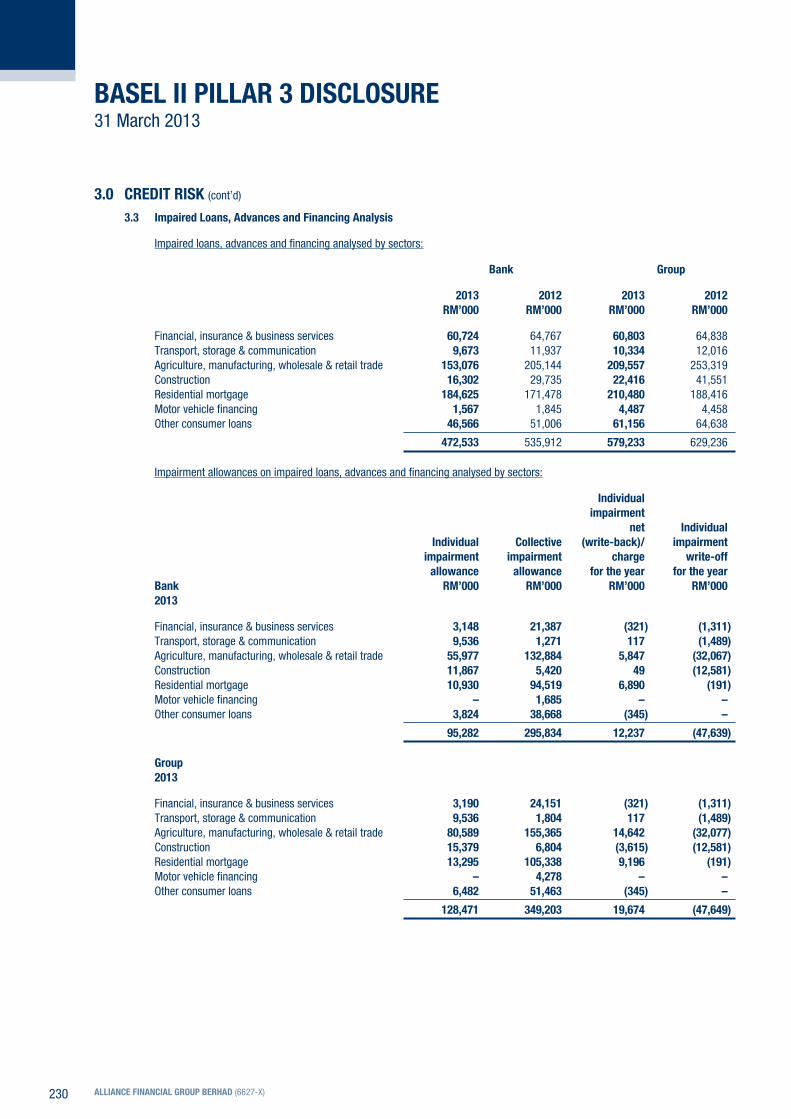
3.3 Impaired Loans, Advances and Financing Analysis
Impaired loans, advances and financing analysed by sectors:
Bank Group
2013 2012 2013 2012 rM’000 rM’000 rM’000 rM’000
Financial, insurance & business services 60,724 64,767 60,803 64,838 Transport, storage & communication 9,673 11,937 10,334 12,016 Agriculture, manufacturing, wholesale & retail trade 153,076 205,144 209,557 253,319 Construction 16,302 29,735 22,416 41,551 Residential mortgage 184,625 171,478 210,480 188,416 Motor vehicle financing 1,567 1,845 4,487 4,458 Other consumer loans 46,566 51,006 61,156 64,638
472,533 535,912 579,233 629,236
Impairment allowances on impaired loans, advances and financing analysed by sectors:
Individual impairment net Individual Individual Collective (write-back)/ impairment impairment impairment charge write-off allowance allowance for the year for the yearBank rM’000 rM’000 rM’000 rM’0002013
Financial, insurance & business services 3,148 21,387 (321) (1,311)Transport, storage & communication 9,536 1,271 117 (1,489)Agriculture, manufacturing, wholesale & retail trade 55,977 132,884 5,847 (32,067)Construction 11,867 5,420 49 (12,581)Residential mortgage 10,930 94,519 6,890 (191)Motor vehicle financing – 1,685 – –Other consumer loans 3,824 38,668 (345) –
95,282 295,834 12,237 (47,639)
Group2013
Financial, insurance & business services 3,190 24,151 (321) (1,311)Transport, storage & communication 9,536 1,804 117 (1,489)Agriculture, manufacturing, wholesale & retail trade 80,589 155,365 14,642 (32,077)Construction 15,379 6,804 (3,615) (12,581)Residential mortgage 13,295 105,338 9,196 (191)Motor vehicle financing – 4,278 – –Other consumer loans 6,482 51,463 (345) –
128,471 349,203 19,674 (47,649)
ALLIANCE FINANCIAL GroUp BErHAd (6627-X)230
BASEL II pILLAr 3 dISCLoSUrE 31 March 2013
3.0 CrEdIT rISK (cont’d)
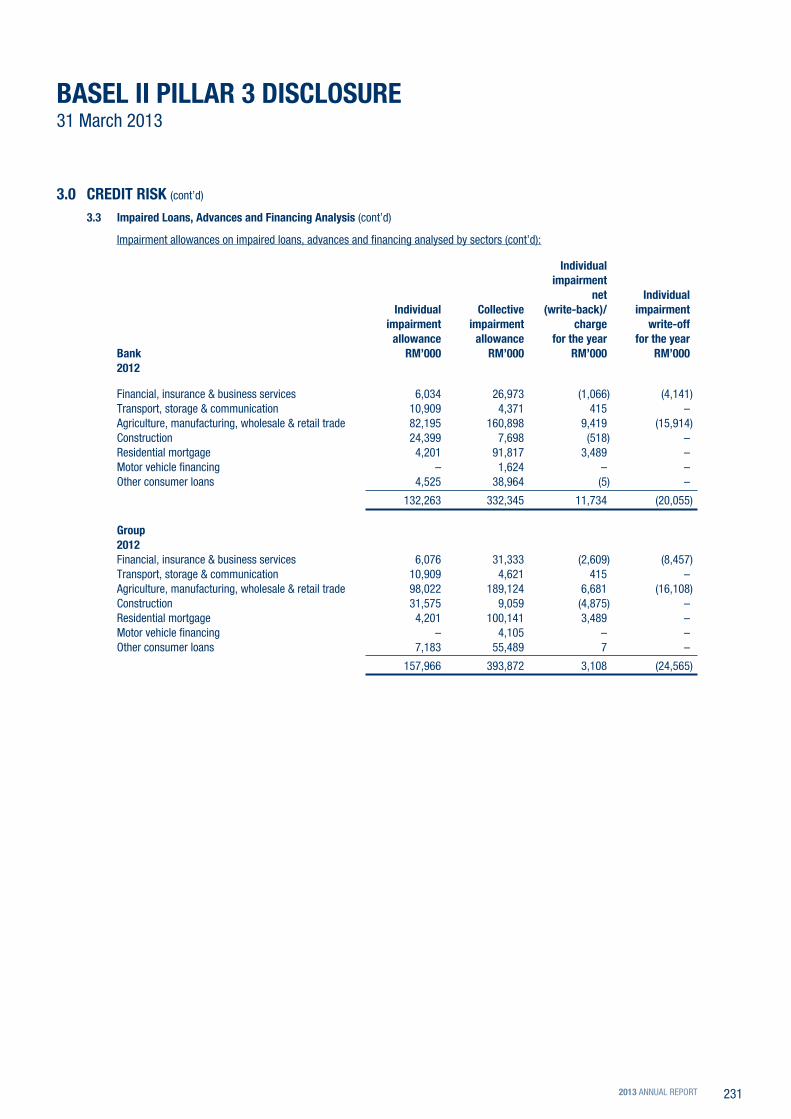
3.3 Impaired Loans, Advances and Financing Analysis (cont’d)
Impairment allowances on impaired loans, advances and financing analysed by sectors (cont’d):
Individual impairment net Individual Individual Collective (write-back)/ impairment impairment impairment charge write-off allowance allowance for the year for the yearBank rM’000 rM’000 rM’000 rM’0002012
Financial, insurance & business services 6,034 26,973 (1,066) (4,141)Transport, storage & communication 10,909 4,371 415 – Agriculture, manufacturing, wholesale & retail trade 82,195 160,898 9,419 (15,914)Construction 24,399 7,698 (518) –Residential mortgage 4,201 91,817 3,489 – Motor vehicle financing – 1,624 – – Other consumer loans 4,525 38,964 (5) –
132,263 332,345 11,734 (20,055)
Group2012Financial, insurance & business services 6,076 31,333 (2,609) (8,457)Transport, storage & communication 10,909 4,621 415 – Agriculture, manufacturing, wholesale & retail trade 98,022 189,124 6,681 (16,108)Construction 31,575 9,059 (4,875) – Residential mortgage 4,201 100,141 3,489 –Motor vehicle financing – 4,105 – –Other consumer loans 7,183 55,489 7 –
157,966 393,872 3,108 (24,565)
2013 ANNUAL REPORT 231

BASEL II pILLAr 3 dISCLoSUrE 31 March 2013
3.0 CrEdIT rISK (cont’d)
3.3 Impaired Loans, Advances and Financing Analysis (cont’d)
Impaired loans, advances and financing and the related impairment allowances by geographical areas:
Impaired loans, Individual Collective advances impairment impairment BANK and financing allowance allowance 2013 rM’000 rM’000 rM’000
Northern region 86,889 28,616 39,948 Central region 307,875 61,404 196,573 Southern region 33,245 1,822 32,524 East Malaysia region 44,524 3,440 26,789
472,533 95,282 295,834
GroUp2013
Northern region 112,029 42,819 44,441 Central region 379,755 79,860 235,943 Southern region 40,911 2,352 39,148 East Malaysia region 46,538 3,440 29,671
579,233 128,471 349,203
BANK 2012
Northern region 113,654 49,082 46,248 Central region 316,587 74,458 214,294 Southern region 48,921 4,443 44,936 East Malaysia region 56,750 4,280 26,867
535,912 132,263 332,345
GroUp2012
Northern region 139,407 57,612 52,844 Central region 378,774 91,101 261,971 Southern region 53,056 4,973 49,827 East Malaysia region 57,999 4,280 29,230
629,236 157,966 393,872
ALLIANCE FINANCIAL GroUp BErHAd (6627-X)232

BASEL II pILLAr 3 dISCLoSUrE 31 March 2013
3.0 CrEdIT rISK (cont’d)
3.3 Impaired Loans, Advances and Financing Analysis (cont’d)
Movements in loans impairment allowances are analysed as follows:
Bank Group
2013 2012 2013 2012 rM’000 rM’000 rM’000 rM’000
Individual assessment allowance:
At beginning of year– As previously stated 225,092 273,141 266,349 328,375 – Transfers to collective assessment allowance (92,829) (132,557) (108,383) (148,952)
As restated 132,263 140,584 157,966 179,423 Allowance made during the year (net) 12,237 11,734 19,674 3,108 Amount written-off (47,639) (20,055) (47,649) (24,565)Transfers to collective assessment allowance (1,579) – (1,520) –
At end of year 95,282 132,263 128,471 157,966
Collective assessment allowance:
At beginning of year– As previously stated 300,801 270,378 386,017 339,636 – Effect of change in accounting policy (61,285) (45,304) (100,528) (63,474)– Transfers from individual assessment allowance 92,829 132,557 108,383 148,952
As restated 332,345 357,631 393,872 425,114 (Write-back)/allowance made during the year (net) (8,301) 16,672 8,034 27,627 Amount written-off (29,789) (41,958) (54,223) (58,869)Transfers from individual assessment allowance 1,579 – 1,520 –
At end of year 295,834 332,345 349,203 393,872
2013 ANNUAL REPORT 233

BASE
L II
pILL
Ar 3
dIS
CLoS
UrE
31 M
arch
201
3
3.0
CrEd
IT r
ISK
(con
t’d)
3.4
Assi
gnm
ent o
f ris
k-W
eigh
ts fo
r por
tfolio
Und
er th
e St
anda
rdis
ed A
ppro
ach
The
follo
win
g ta
bles
pre
sent
the
cred
it ex
posu
res
by ri
sk-w
eigh
ts a
nd a
fter c
redi
t ris
k m
itiga
tion:
Ex
posu
res a
fter n
ettin
g and
cred
it ris
k miti
gatio
n
In
sura
nce
Tota
l
co
mpa
nies,
expo
sure
s
Se
curit
ies
afte
r To
tal
Bank
So
vere
igns/
pu
blic
Bank
s,
firm
s and
High
er
netti
ng an
d r
isk-
2013
Ce
ntra
l se
ctor
d
FIs an
d Fu
nd
re
gulat
ory
resid
entia
l ris
k ot
her
Equit
y cr
edit
risk
Weig
hted
risk
-Weig
hts
bank
s en
tities
Md
Bs
man
ager
s Co
rpor
ates
re
tail
mor
tgag
es
asse
ts
asse
ts ex
posu
res
miti
gatio
n As
sets
rM
’000
rM’
000
rM’
000
rM’00
0 rM
’000
rM’00
0 rM
’000
rM’00
0 rM
’000
rM’00
0 rM
’000
rM’00
0
0%
4,430
,381
– –
– –
– –
– 24
3,514
–
4,67
3,895
–
20%
–
50,61
5 3,
530,6
57
– 1,
734,0
20
– –
– –
– 5,
315,2
92
1,06
3,058
35
%
– –
– –
– –
4,13
1,069
–
– –
4,13
1,069
1,
445,8
74
50%
–
– 78
0,663
–
4,12
4 15
,925
1,96
9,737
–
– –
2,77
0,449
1,
385,2
25
75%
–
– –
– –
9,66
5,749
66
6,129
–
– –
10,33
1,878
7,
748,9
09
100%
–
– –
4,78
8 8,
794,8
21
33,12
6 41
,928
– 22
6,797
79
,551
9,18
1,011
9,
181,0
11
150%
–
– –
– 87
,991
35,52
0 –
11,75
6 –
19,92
1 15
5,188
23
2,782
Total
expo
sure
s 4,
430,3
81
50,61
5 4,
311,3
20
4,78
8 10
,620,9
56
9,75
0,320
6,
808,8
63
11,75
6 47
0,311
99
,472
36,55
8,782
21
,056,8
59
Risk
-weig
hted
asse
ts by
expo
sure
s –
10,12
3 1,
096,4
63
4,78
8 9,
275,6
73
7,34
3,681
2,
972,2
68
17,63
4 22
6,797
10
9,432
21
,056,8
59
Aver
age r
isk-w
eight
–
20%
25
%
100%
87
%
75%
44
%
150%
48
%
110%
58
%
Dedu
ction
from
Cap
ital b
ase
– –
– –
– –
– –
– –
–
ALLIANCE FINANCIAL GroUp BErHAd (6627-X)234
BASE
L II
pILL
Ar 3
dIS
CLoS
UrE
31 M
arch
201
3
3.0
CrEd
IT r
ISK
(con
t’d)
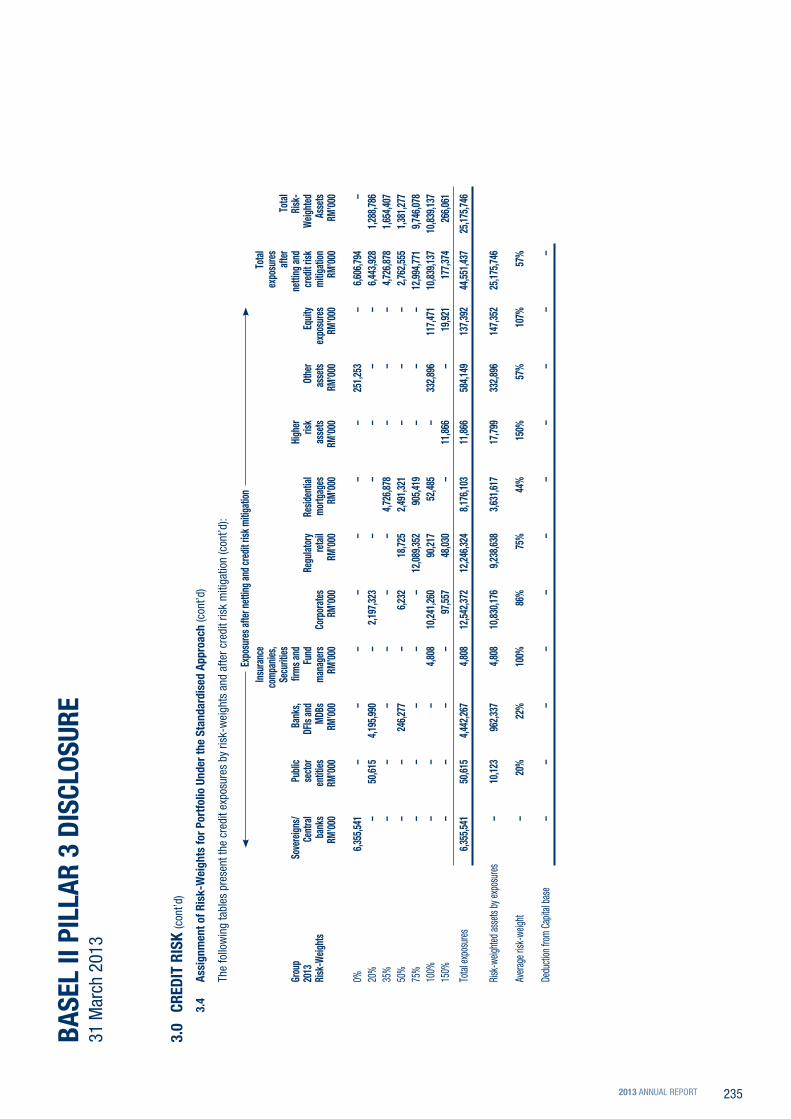
3.4
Assi
gnm
ent o
f ris
k-W
eigh
ts fo
r por
tfolio
Und
er th
e St
anda
rdis
ed A
ppro
ach
(con
t’d)
The
follo
win
g ta
bles
pre
sent
the
cred
it ex
posu
res
by ri
sk-w
eigh
ts a
nd a
fter c
redi
t ris
k m
itiga
tion
(con
t’d):
Ex
posu
res a
fter n
ettin
g and
cred
it ris
k miti
gatio
n
In
sura
nce
Tota
l
co
mpa
nies,
expo
sure
s
Se
curit
ies
afte
r To
tal
Grou
p So
vere
igns/
pu
blic
Bank
s,
firm
s and
High
er
netti
ng an
d r
isk-
2013
Ce
ntra
l se
ctor
d
FIs an
d Fu
nd
re
gulat
ory
resid
entia
l ris
k ot
her
Equit
y cr
edit
risk
Weig
hted
risk
-Weig
hts
bank
s en
tities
Md
Bs
man
ager
s Co
rpor
ates
re
tail
mor
tgag
es
asse
ts
asse
ts ex
posu
res
miti
gatio
n As
sets
rM
’000
rM’
000
rM’
000
rM’00
0 rM
’000
rM’00
0 rM
’000
rM’00
0 rM
’000
rM’00
0 rM
’000
rM’00
0
0%
6,355
,541
– –
– –
– –
– 25
1,253
–
6,60
6,794
–
20%
–
50,61
5 4,
195,9
90
– 2,
197,3
23
– –
– –
– 6,
443,9
28
1,28
8,786
35
%
– –
– –
– –
4,72
6,878
–
– –
4,72
6,878
1,
654,4
07
50%
–
– 24
6,277
–
6,23
2 18
,725
2,49
1,321
–
– –
2,76
2,555
1,
381,2
77
75%
–
– –
– –
12,08
9,352
90
5,419
–
– –
12,99
4,771
9,
746,0
78
100%
–
– –
4,80
8 10
,241,2
60
90,21
7 52
,485
– 33
2,896
11
7,471
10
,839,1
37
10,83
9,137
15
0%
– –
– –
97,55
7 48
,030
– 11
,866
– 19
,921
177,3
74
266,0
61
Total
expo
sure
s 6,
355,5
41
50,61
5 4,
442,2
67
4,80
8 12
,542,3
72
12,24
6,324
8,
176,1
03
11,86
6 58
4,149
13
7,392
44
,551,4
37
25,17
5,746
Risk
-weig
hted
asse
ts by
expo
sure
s –
10,12
3 96
2,337
4,
808
10,83
0,176
9,
238,6
38
3,63
1,617
17
,799
332,8
96
147,3
52
25,17
5,746
Aver
age r
isk-w
eight
–
20%
22
%
100%
86
%
75%
44
%
150%
57
%
107%
57
%
Dedu
ction
from
Cap
ital b
ase
– –
– –
– –
– –
– –
–
2013 ANNUAL REPORT 235

3.0
CrEd
IT r
ISK
(con
t’d)
3.4
Assi
gnm
ent o
f ris
k-W
eigh
ts fo
r por
tfolio
Und
er th
e St
anda
rdis
ed A
ppro
ach
(con
t’d)
The
follo
win
g ta
bles
pre
sent
the
cred
it ex
posu
res
by ri
sk-w
eigh
ts a
nd a
fter c
redi
t ris
k m
itiga
tion
(con
t’d):
Ex
posu
res a
fter n
ettin
g and
cred
it ris
k miti
gatio
n
In
sura
nce
Tota
l
co
mpa
nies,
expo
sure
s
Se
curit
ies
afte
r To
tal
Bank
So
vere
igns/
pu
blic
Bank
s,
firm
s and
High
er
netti
ng an
d r
isk-
2012
Ce
ntra
l se
ctor
d
FIs an
d Fu
nd
re
gulat
ory
resid
entia
l ris
k ot
her
Equit
y cr
edit
risk
Weig
hted
risk
-Weig
hts
bank
s en
tities
Md
Bs
man
ager
s Co
rpor
ates
re
tail
mor
tgag
es
asse
ts
asse
ts ex
posu
res
miti
gatio
n As
sets
rM
’000
rM’
000
rM’
000
rM’00
0 rM
’000
rM’00
0 rM
’000
rM’00
0 rM
’000
rM’00
0 rM
’000
rM’00
0
0%
5,02
8,38
7 –
–
– –
– –
– 19
1,23
9 –
5,21
9,62
6 –
20%
–
50,8
55
3,04
7,93
2 –
756,
418
–
– –
– –
3,85
5,20
5 77
1,04
135
%
– –
– –
– –
3,97
8,42
5
– –
– 3,
978,
425
1,
392,
449
50%
–
–
778,
808
– 16
6 2,
473
2,
080,
124
–
– –
2,86
1,57
1 1,
430,
785
75%
–
– –
– –
7,62
4,34
9 51
2,40
8 –
– –
8,13
6,75
7
6,10
2,56
710
0%
–
– –
4,45
9 8,
735,
100
5,30
1 49
,925
–
288,
025
9,42
9
9,09
2,23
9 9,
092,
239
150%
–
– –
– 21
,627
4
0,93
0 –
12,1
24
– 11
5,70
9 19
0,39
0 28
5,58
6
Total
expo
sure
s 5,
028,
387
50,8
55
3,82
6,74
0 4,
459
9,51
3,31
1 7,
673,
053
6,62
0,88
2 12
,124
47
9,26
4 12
5,13
8 33
,334
,213
19
,074
,667
Risk
-weig
hted
asse
ts by
expo
sure
s –
10,1
71
998,
990
4,45
9 8,
918,
908
5,78
6,19
4 2,
866,
741
18,1
86
288,
026
182,
992
19,0
74,6
67
Aver
age r
isk-w
eight
–
20%
26
%
100%
94
%
75%
43
%
150%
60
%
146%
57
%
Dedu
ction
from
Cap
ital b
ase
– –
– –
– –
– –
– –
–
BASE
L II
pILL
Ar 3
dIS
CLoS
UrE
31 M
arch
201
3
ALLIANCE FINANCIAL GroUp BErHAd (6627-X)236

BASE
L II
pILL
Ar 3
dIS
CLoS
UrE
31 M
arch
201
3
3.0
CrEd
IT r
ISK
(con
t’d)
3.4
Assi
gnm
ent o
f ris
k-W
eigh
ts fo
r por
tfolio
Und
er th
e St
anda
rdis
ed A
ppro
ach
(con
t’d)
The
follo
win
g ta
bles
pre
sent
the
cred
it ex
posu
res
by ri
sk-w
eigh
ts a
nd a
fter c
redi
t ris
k m
itiga
tion
(con
t’d):
Ex
posu
res a
fter n
ettin
g and
cred
it ris
k miti
gatio
n
In
sura
nce
Tota
l
co
mpa
nies,
expo
sure
s
Se
curit
ies
afte
r To
tal
Grou
p So
vere
igns/
pu
blic
Bank
s,
firm
s and
High
er
netti
ng an
d r
isk-
2012
Ce
ntra
l se
ctor
d
FIs an
d Fu
nd
re
gulat
ory
resid
entia
l ris
k ot
her
Equit
y cr
edit
risk
Weig
hted
risk
-Weig
hts
bank
s en
tities
Md
Bs
man
ager
s Co
rpor
ates
re
tail
mor
tgag
es
asse
ts
asse
ts ex
posu
res
miti
gatio
n As
sets
rM
’000
rM’
000
rM’
000
rM’00
0 rM
’000
rM’00
0 rM
’000
rM’00
0 rM
’000
rM’00
0 rM
’000
rM’00
0
0%
7,21
0,05
3 –
–
– –
– –
– 19
1,16
9 –
7,40
1,22
2 –
20%
–
50,8
55
3,67
3,33
6 –
1,00
6,45
3 –
–
– –
– 4,
730,
644
946,
129
35%
–
– –
– –
– 4,
439,
248
–
– –
4,43
9,24
8
1,55
3,73
750
%
–
– 79
1,88
1 –
166
2,81
2
2,48
0,26
3 –
–
– 3,
275,
122
1,63
7,56
175
%
– –
– –
– 10
,217
,245
69
7,89
6 –
– –
10,9
15,1
41
8,18
6,35
610
0%
–
– –
4,48
8 10
,260
,158
44
,813
57
,266
–
435,
436
9,42
9
10,8
11,5
90
10,8
11,5
9015
0%
– –
– –
86,8
08
51,
166
– 12
,261
–
160,
513
310,
748
466,
122
Total
expo
sure
s 7,
210,
053
50,8
55
4,46
5,21
7 4,
488
11,3
53,5
85
10,3
16,0
36
7,67
4,67
3 12
,261
62
6,60
5 16
9,94
2 41
,883
,715
23
,601
,495
Risk
-weig
hted
asse
ts by
expo
sure
s –
10,1
71
1,13
0,60
7 4,
488
10,5
91,7
44
7,78
5,90
2 3,
374,
557
18,3
92
435,
436
250,
198
23,6
01,4
95
Aver
age r
isk-w
eight
–
20%
25
%
100%
93
%
75%
44
%
150%
69
%
147%
56
%
Dedu
ction
from
Cap
ital b
ase
– –
– –
– –
– –
– –
–
2013 ANNUAL REPORT 237

BASEL II pILLAr 3 dISCLoSUrE 31 March 2013
3.0 CrEdIT rISK (cont’d)
3.4 Assignment of risk-Weights for portfolio Under the Standardised Approach (cont’d)
For the purpose of determining counterparty risk-weights, the Group uses external credit assessments from Rating Agency Malaysia (“RAM”), Malaysian Rating Corporation (“MARC”), Standard and Poor (“S&P”), and Moody’s and Fitch. In the context of the Group’s portfolio, external credit assessments are mainly applicable to banks/financial institutions and rated corporations. The Group follows the process prescribed under BNM RWCAF-Basel II to map the ratings to the relevant risk-weights. The ratings are monitored and updated regularly to ensure that the latest and most appropriate risk-weights are applied in the capital computation.
The following tables show the rated exposures according to rating by Eligible Credit Assessment Institutions (“ECAIs”):
(a) Ratings of corporate by approved ECAIs
Bank2013
Exposure Class
ratings of Corporate by Approved ECAIs
Moody’s Aaa to Aa3 A1 to A3 Baa1 to Ba3 B1 to C Unrated
S&p AAA to AA- A+ to A- BBB+ to BB- B+ to d Unrated
Fitch AAA to AA- A+ to A- BBB+ to BB- B+ to d Unrated
rAM AAA to AA3 A+ to A3 BBB1 to BB3 B to d Unrated
MArC AAA to AA- A+ to A- BBB+ to BB- B+ to d Unrated
rM’000 rM’000 rM’000 rM’000 rM’000
on and off-Balance Sheet Exposures
Credit Exposures (using Corporate risk-Weights)
Public Sector Entities (applicable for entities risk-weighted based on their external ratings as corporates)
50,615 – – – –
Insurance Cos, Securities Firms & Fund Managers
– – – – 11,709
Corporates 1,850,747 226,297 – – 9,202,297
Total 1,901,262 226,297 – – 9,214,006
Group2013
Exposure Class
ratings of Corporate by Approved ECAIs
Moody’s Aaa to Aa3 A1 to A3 Baa1 to Ba3 B1 to C Unrated
S&p AAA to AA- A+ to A- BBB+ to BB- B+ to d Unrated
Fitch AAA to AA- A+ to A- BBB+ to BB- B+ to d Unrated
rAM AAA to AA3 A+ to A3 BBB1 to BB3 B to d Unrated
MArC AAA to AA- A+ to A- BBB+ to BB- B+ to d Unrated
rM’000 rM’000 rM’000 rM’000 rM’000
on and off-Balance Sheet Exposures
Credit Exposures (using Corporate risk-Weights)
Public Sector Entities (applicable for entities risk-weighted based on their external ratings as corporates)
50,615 – – – –
Insurance Cos, Securities Firms & Fund Managers
– – – – 11,730
Corporates 2,314,050 326,884 – – 10,813,585
Total 2,364,665 326,884 – – 10,825,315
ALLIANCE FINANCIAL GroUp BErHAd (6627-X)238

BASEL II pILLAr 3 dISCLoSUrE 31 March 2013
3.0 CrEdIT rISK (cont’d)
3.4 Assignment of risk-Weights for portfolio Under the Standardised Approach (cont’d)
The following tables show the rated exposures according to rating by ECAIs (cont’d):
(a) Ratings of corporate by approved ECAIs (cont’d)
Bank2012
Exposure Class
ratings of Corporate by Approved ECAIs
Moody’s Aaa to Aa3 A1 to A3 Baa1 to Ba3 B1 to C Unrated
S&p AAA to AA- A+ to A- BBB+ to BB- B+ to d Unrated
Fitch AAA to AA- A+ to A- BBB+ to BB- B+ to d Unrated
rAM AAA to AA3 A+ to A3 BBB1 to BB3 B to d Unrated
MArC AAA to AA- A+ to A- BBB+ to BB- B+ to d Unrated
rM’000 rM’000 rM’000 rM’000 rM’000
on and off-Balance Sheet Exposures
Credit Exposures (using Corporate risk-Weights)
Public Sector Entities (applicable for entities risk-weighted based on their external ratings as corporates)
50,885 – – – –
Insurance Cos, Securities Firms & Fund Managers
– – – – 4,459
Corporates 879,418 363,039 – – 8,676,650
Total 930,273 363,039 – – 8,681,109
Group2012
Exposure Class
ratings of Corporate by Approved ECAIs
Moody’s Aaa to Aa3 A1 to A3 Baa1 to Ba3 B1 to C Unrated
S&p AAA to AA- A+ to A- BBB+ to BB- B+ to d Unrated
Fitch AAA to AA- A+ to A- BBB+ to BB- B+ to d Unrated
rAM AAA to AA3 A+ to A3 BBB1 to BB3 B to d Unrated
MArC AAA to AA- A+ to A- BBB+ to BB- B+ to d Unrated
rM’000 rM’000 rM’000 rM’000 rM’000
on and off-Balance Sheet Exposures
Credit Exposures (using Corporate risk-Weights)
Public Sector Entities (applicable for entities risk-weighted based on their external ratings as corporates)
50,855 – – – –
Insurance Cos, Securities Firms & Fund Managers
– – – – 4,488
Corporates 1,180,590 567,198 – – 10,266,362
Total 1,231,445 567,198 – – 10,270,850
2013 ANNUAL REPORT 239

BASEL II pILLAr 3 dISCLoSUrE 31 March 2013
3.0 CrEdIT rISK (cont’d)
3.4 Assignment of risk-Weights for portfolio Under the Standardised Approach (cont’d)
The following tables show the rated exposures according to rating by ECAIs (cont’d):
(b) Short-term ratings of banking institutions and corporate by approved ECAIs
Bank2013
Exposure Class
Short-term ratings of Banking Institutions and Corporate by Approved ECAIs
Moody’s p-1 p-2 p-3 others Unrated
S&p A-1 A-2 A-3 others Unrated
Fitch F1+, F1 F2 F3 B to d Unrated
rAM p-1 p-2 p-3 Np Unrated
MArC MArC-1 MArC-2 MArC-3 MArC-4 Unrated
rM’000 rM’000 rM’000 rM’000 rM’000
on and off-Balance Sheet ExposuresBanks, MDBs and FDIs 2,952,937 – – – 594,124
rated Credit Exposures (using Corporate risk-Weights)
Public Sector Entities (applicable for entities risk-weighted based on their external ratings as corporates)
– – – – –
Insurance Cos, Securities Firms & Fund Managers
– – – – –
Corporates – – – – – Total 2,952,937 – – – 594,124
Group2013
Exposure Class
Short-term ratings of Banking Institutions and Corporate by Approved ECAIs
Moody’s p-1 p-2 p-3 others Unrated
S&p A-1 A-2 A-3 others Unrated
Fitch F1+, F1 F2 F3 B to d Unrated
rAM p-1 p-2 p-3 Np Unrated
MArC MArC-1 MArC-2 MArC-3 MArC-4 Unrated
rM’000 rM’000 rM’000 rM’000 rM’000
on and off-Balance Sheet ExposuresBanks, MDBs and FDIs 4,040,485 – – – 386,926
rated Credit Exposures (using Corporate risk-Weights)
Public Sector Entities (applicable for entities risk-weighted based on their external ratings as corporates)
– – – – –
Insurance Cos, Securities Firms & Fund Managers
– – – – –
Corporates – – – – – Total 4,040,485 – – – 386,926
ALLIANCE FINANCIAL GroUp BErHAd (6627-X)240

BASEL II pILLAr 3 dISCLoSUrE 31 March 2013
3.0 CrEdIT rISK (cont’d)
3.4 Assignment of risk-Weights for portfolio Under the Standardised Approach (cont’d)
The following tables show the rated exposures according to rating by ECAIs (cont’d):
(b) Short-term ratings of banking institutions and corporate by approved ECAIs (cont’d)
Bank2012
Exposure Class
Short-term ratings of Banking Institutions and Corporate by Approved ECAIs
Moody’s p-1 p-2 p-3 others Unrated
S&p A-1 A-2 A-3 others Unrated
Fitch F1+, F1 F2 F3 B to d Unrated
rAM p-1 p-2 p-3 Np Unrated
MArC MArC-1 MArC-2 MArC-3 MArC-4 Unrated
rM’000 rM’000 rM’000 rM’000 rM’000
on and off-Balance Sheet ExposuresBanks, MDBs and FDIs 2,566,211 – – – 483,814
rated Credit Exposures (using Corporate risk-Weights)
Public Sector Entities (applicable for entities risk-weighted based on their external ratings as corporates)
– – – – –
Insurance Cos, Securities Firms & Fund Managers
– – – – –
Corporates 20,137 – – – – Total 2,586,348 – – – 483,814
Group2012
Exposure Class
Short-term ratings of Banking Institutions and Corporate by Approved ECAIs
Moody’s p-1 p-2 p-3 others Unrated
S&p A-1 A-2 A-3 others Unrated
Fitch F1+, F1 F2 F3 B to d Unrated
rAM p-1 p-2 p-3 Np Unrated
MArC MArC-1 MArC-2 MArC-3 MArC-4 Unrated
rM’000 rM’000 rM’000 rM’000 rM’000
on and off-Balance Sheet ExposuresBanks, MDBs and FDIs 3,068,732 – – – 614,675
rated Credit Exposures (using Corporate risk-Weights)
Public Sector Entities (applicable for entities risk-weighted based on their external ratings as corporates)
– – – – –
Insurance Cos, Securities Firms & Fund Managers
– – – – –
Corporates 20,137 – – – – Total 3,088,869 – – – 614,675
2013 ANNUAL REPORT 241

BASEL II pILLAr 3 dISCLoSUrE 31 March 2013
3.0 CrEdIT rISK (cont’d)
3.4 Assignment of risk-Weights for portfolio Under the Standardised Approach (cont’d)
The following tables show the rated exposures according to rating by ECAIs (cont’d):
(c) Ratings of Sovereigns and Central banks by approved ECAIs
Bank2013
Exposure Class
ratings of Sovereigns and Central Banks by Approved ECAIs
Moody’s Aaa to Aa3 A1 to A3 Baa1 to Ba3 Ba1 to B3 Caa1 to C Unrated
S&p AAA to AA- A+ to A- BBB+ to BBB- BB+ to B- CCC+ to d Unrated
Fitch AAA to AA- A+ to A- BBB+ to BBB- BB+ to B- CCC+ to d Unrated
rM’000 rM’000 rM’000 rM’000 rM’000 rM’000
on and off-Balance Sheet Exposures
Sovereigns and Central Banks – 4,430,381 – – – –Total – 4,430,381 – – – –
Group2013
Exposure Class
ratings of Sovereigns and Central Banks by Approved ECAIs
Moody’s Aaa to Aa3 A1 to A3 Baa1 to Ba3 Ba1 to B3 Caa1 to C Unrated
S&p AAA to AA- A+ to A- BBB+ to BBB- BB+ to B- CCC+ to d Unrated
Fitch AAA to AA- A+ to A- BBB+ to BBB- BB+ to B- CCC+ to d Unrated
rM’000 rM’000 rM’000 rM’000 rM’000 rM’000
on and off-Balance Sheet Exposures
Sovereigns and Central Banks – 6,355,541 – – – –Total – 6,355,541 – – – –
ALLIANCE FINANCIAL GroUp BErHAd (6627-X)242

BASEL II pILLAr 3 dISCLoSUrE 31 March 2013
3.0 CrEdIT rISK (cont’d)
3.4 Assignment of risk-Weights for portfolio Under the Standardised Approach (cont’d)
The following tables show the rated exposures according to rating by ECAIs (cont’d):
(c) Ratings of Sovereigns and Central banks by approved ECAIs (cont’d)
Bank2012
Exposure Class
ratings of Sovereigns and Central Banks by Approved ECAIs
Moody’s Aaa to Aa3 A1 to A3 Baa1 to Ba3 Ba1 to B3 Caa1 to C Unrated
S&p AAA to AA- A+ to A- BBB+ to BBB- BB+ to B- CCC+ to d Unrated
Fitch AAA to AA- A+ to A- BBB+ to BBB- BB+ to B- CCC+ to d Unrated
rM’000 rM’000 rM’000 rM’000 rM’000 rM’000
on and off-Balance Sheet Exposures
Sovereigns and Central Banks – 5,028,387 – – – –Total – 5,028,387 – – – –
Group2012
Exposure Class
ratings of Sovereigns and Central Banks by Approved ECAIs
Moody’s Aaa to Aa3 A1 to A3 Baa1 to Ba3 Ba1 to B3 Caa1 to C Unrated
S&p AAA to AA- A+ to A- BBB+ to BBB- BB+ to B- CCC+ to d Unrated
Fitch AAA to AA- A+ to A- BBB+ to BBB- BB+ to B- CCC+ to d Unrated
rM’000 rM’000 rM’000 rM’000 rM’000 rM’000
on and off-Balance Sheet Exposures
Sovereigns and Central Banks – 7,210,053 – – – –Total – 7,210,053 – – – –
2013 ANNUAL REPORT 243

BASEL II pILLAr 3 dISCLoSUrE 31 March 2013
3.0 CrEdIT rISK (cont’d)
3.4 Assignment of risk-Weights for portfolio Under the Standardised Approach (cont’d)
The following tables show the rated exposures according to rating by ECAIs (cont’d):
(d) Ratings of banking institutions by approved ECAIs
Bank2013
Exposure Class
ratings of Banking Institutions by Approved ECAIs
Moody’s Aaa to Aa3 A1 to A3 Baa1 to Ba3 Ba1 to B3 Caa1 to C Unrated
S&p AAA to AA- A+ to A- BBB+ to BBB- BB+ to B- CCC+ to d Unrated
Fitch AAA to AA- A+ to A- BBB+ to BBB- BB+ to B- CCC+ to d Unrated
rAM AAA to AA3 A1 to A3 BBB1 to BBB3 BB1 to B3 C1 to d Unrated
MArC AAA to AA- A+ to A- BBB+ to BBB- BB+ to B- C+ to d Unrated
rM’000 rM’000 rM’000 rM’000 rM’000 rM’000
on and off-Balance Sheet Exposures
Banks, MDBs and FDIs 20,738 – – – – 749,403Total 20,738 – – – – 749,403
Group2013
Exposure Class
ratings of Banking Institutions by Approved ECAIs
Moody’s Aaa to Aa3 A1 to A3 Baa1 to Ba3 Ba1 to B3 Caa1 to C Unrated
S&p AAA to AA- A+ to A- BBB+ to BBB- BB+ to B- CCC+ to d Unrated
Fitch AAA to AA- A+ to A- BBB+ to BBB- BB+ to B- CCC+ to d Unrated
rAM AAA to AA3 A1 to A3 BBB1 to BBB3 BB1 to B3 C1 to d Unrated
MArC AAA to AA- A+ to A- BBB+ to BBB- BB+ to B- C+ to d Unrated
rM’000 rM’000 rM’000 rM’000 rM’000 rM’000
on and off-Balance Sheet Exposures
Banks, MDBs and FDIs 20,738 – – – – –Total 20,738 – – – – –
ALLIANCE FINANCIAL GroUp BErHAd (6627-X)244
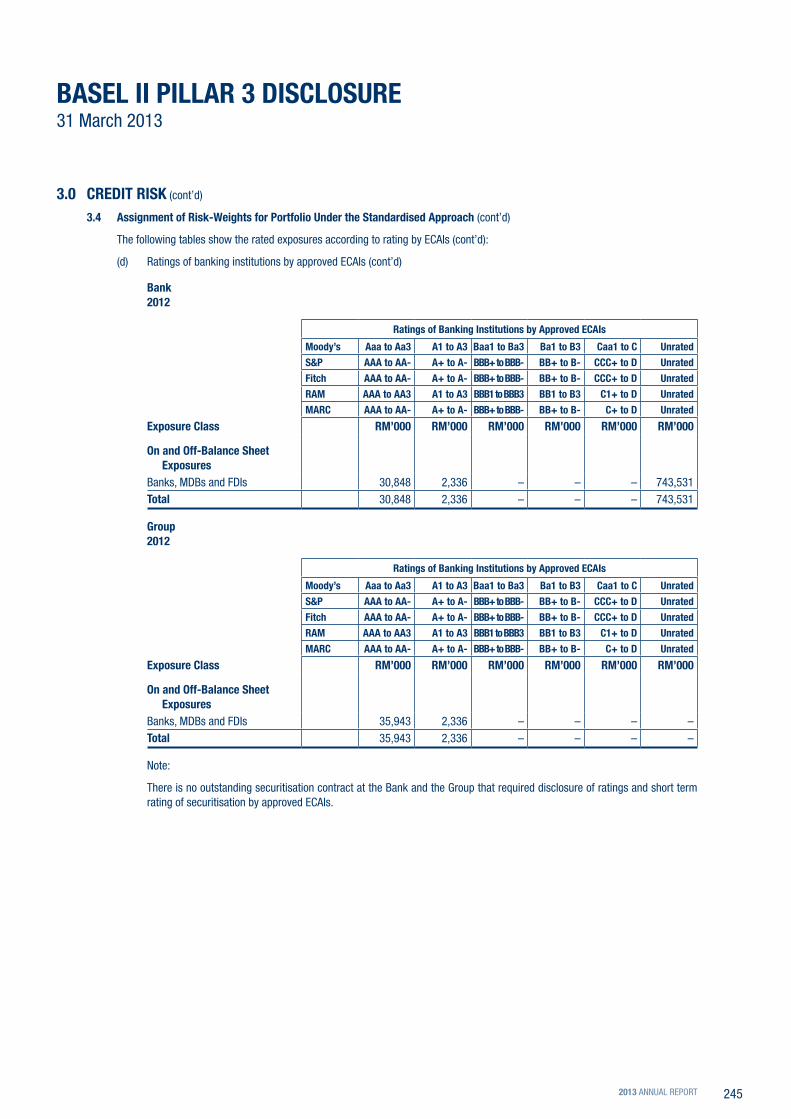
BASEL II pILLAr 3 dISCLoSUrE 31 March 2013
3.0 CrEdIT rISK (cont’d)
3.4 Assignment of risk-Weights for portfolio Under the Standardised Approach (cont’d)
The following tables show the rated exposures according to rating by ECAIs (cont’d):
(d) Ratings of banking institutions by approved ECAIs (cont’d)
Bank2012
Exposure Class
ratings of Banking Institutions by Approved ECAIs
Moody’s Aaa to Aa3 A1 to A3 Baa1 to Ba3 Ba1 to B3 Caa1 to C Unrated
S&p AAA to AA- A+ to A- BBB+ to BBB- BB+ to B- CCC+ to d Unrated
Fitch AAA to AA- A+ to A- BBB+ to BBB- BB+ to B- CCC+ to d Unrated
rAM AAA to AA3 A1 to A3 BBB1 to BBB3 BB1 to B3 C1+ to d Unrated
MArC AAA to AA- A+ to A- BBB+ to BBB- BB+ to B- C+ to d Unrated
rM’000 rM’000 rM’000 rM’000 rM’000 rM’000
on and off-Balance Sheet Exposures
Banks, MDBs and FDIs 30,848 2,336 – – – 743,531Total 30,848 2,336 – – – 743,531
Group2012
Exposure Class
ratings of Banking Institutions by Approved ECAIs
Moody’s Aaa to Aa3 A1 to A3 Baa1 to Ba3 Ba1 to B3 Caa1 to C Unrated
S&p AAA to AA- A+ to A- BBB+ to BBB- BB+ to B- CCC+ to d Unrated
Fitch AAA to AA- A+ to A- BBB+ to BBB- BB+ to B- CCC+ to d Unrated
rAM AAA to AA3 A1 to A3 BBB1 to BBB3 BB1 to B3 C1+ to d Unrated
MArC AAA to AA- A+ to A- BBB+ to BBB- BB+ to B- C+ to d Unrated
rM’000 rM’000 rM’000 rM’000 rM’000 rM’000
on and off-Balance Sheet Exposures
Banks, MDBs and FDIs 35,943 2,336 – – – –Total 35,943 2,336 – – – –
Note:
There is no outstanding securitisation contract at the Bank and the Group that required disclosure of ratings and short term rating of securitisation by approved ECAIs.
2013 ANNUAL REPORT 245
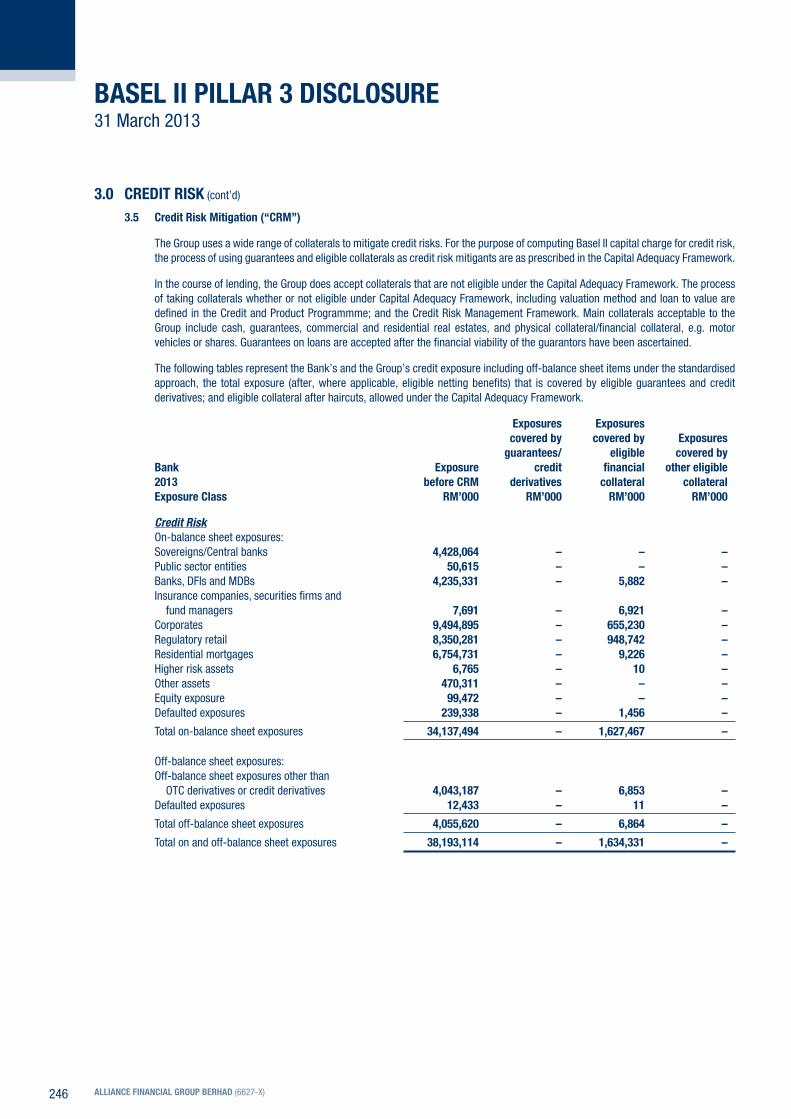
BASEL II pILLAr 3 dISCLoSUrE 31 March 2013
3.0 CrEdIT rISK (cont’d)
3.5 Credit risk Mitigation (“CrM”)
The Group uses a wide range of collaterals to mitigate credit risks. For the purpose of computing Basel II capital charge for credit risk, the process of using guarantees and eligible collaterals as credit risk mitigants are as prescribed in the Capital Adequacy Framework.
In the course of lending, the Group does accept collaterals that are not eligible under the Capital Adequacy Framework. The process of taking collaterals whether or not eligible under Capital Adequacy Framework, including valuation method and loan to value are defined in the Credit and Product Programmme; and the Credit Risk Management Framework. Main collaterals acceptable to the Group include cash, guarantees, commercial and residential real estates, and physical collateral/financial collateral, e.g. motor vehicles or shares. Guarantees on loans are accepted after the financial viability of the guarantors have been ascertained.
The following tables represent the Bank’s and the Group’s credit exposure including off-balance sheet items under the standardised approach, the total exposure (after, where applicable, eligible netting benefits) that is covered by eligible guarantees and credit derivatives; and eligible collateral after haircuts, allowed under the Capital Adequacy Framework.
Exposures Exposures covered by covered by Exposures guarantees/ eligible covered byBank Exposure credit financial other eligible2013 before CrM derivatives collateral collateralExposure Class rM’000 rM’000 rM’000 rM’000
Credit RiskOn-balance sheet exposures:Sovereigns/Central banks 4,428,064 – – –Public sector entities 50,615 – – –Banks, DFIs and MDBs 4,235,331 – 5,882 –Insurance companies, securities firms and
fund managers 7,691 – 6,921 –Corporates 9,494,895 – 655,230 –Regulatory retail 8,350,281 – 948,742 –Residential mortgages 6,754,731 – 9,226 –Higher risk assets 6,765 – 10 –Other assets 470,311 – – –Equity exposure 99,472 – – –Defaulted exposures 239,338 – 1,456 –
Total on-balance sheet exposures 34,137,494 – 1,627,467 –
Off-balance sheet exposures:Off-balance sheet exposures other than
OTC derivatives or credit derivatives 4,043,187 – 6,853 –Defaulted exposures 12,433 – 11 –
Total off-balance sheet exposures 4,055,620 – 6,864 –
Total on and off-balance sheet exposures 38,193,114 – 1,634,331 –
ALLIANCE FINANCIAL GroUp BErHAd (6627-X)246
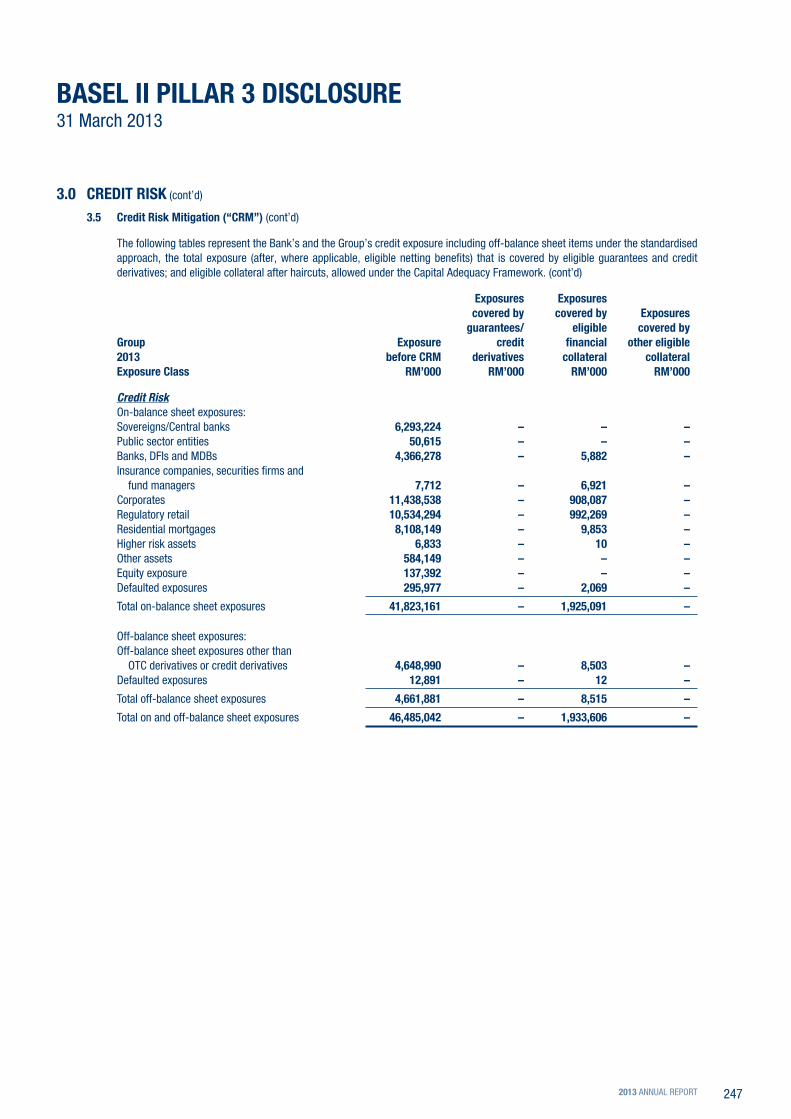
BASEL II pILLAr 3 dISCLoSUrE 31 March 2013
3.0 CrEdIT rISK (cont’d)
3.5 Credit risk Mitigation (“CrM”) (cont’d)
The following tables represent the Bank’s and the Group’s credit exposure including off-balance sheet items under the standardised approach, the total exposure (after, where applicable, eligible netting benefits) that is covered by eligible guarantees and credit derivatives; and eligible collateral after haircuts, allowed under the Capital Adequacy Framework. (cont’d)
Exposures Exposures covered by covered by Exposures guarantees/ eligible covered byGroup Exposure credit financial other eligible2013 before CrM derivatives collateral collateralExposure Class rM’000 rM’000 rM’000 rM’000
Credit RiskOn-balance sheet exposures:Sovereigns/Central banks 6,293,224 – – –Public sector entities 50,615 – – –Banks, DFIs and MDBs 4,366,278 – 5,882 –Insurance companies, securities firms and
fund managers 7,712 – 6,921 –Corporates 11,438,538 – 908,087 –Regulatory retail 10,534,294 – 992,269 –Residential mortgages 8,108,149 – 9,853 –Higher risk assets 6,833 – 10 –Other assets 584,149 – – –Equity exposure 137,392 – – –Defaulted exposures 295,977 – 2,069 –
Total on-balance sheet exposures 41,823,161 – 1,925,091 –
Off-balance sheet exposures:Off-balance sheet exposures other than
OTC derivatives or credit derivatives 4,648,990 – 8,503 –Defaulted exposures 12,891 – 12 –
Total off-balance sheet exposures 4,661,881 – 8,515 –
Total on and off-balance sheet exposures 46,485,042 – 1,933,606 –
2013 ANNUAL REPORT 247

BASEL II pILLAr 3 dISCLoSUrE 31 March 2013
3.0 CrEdIT rISK (cont’d)
3.5 Credit risk Mitigation (“CrM”) (cont’d)
The following tables represent the Bank’s and the Group’s credit exposure including off-balance sheet items under the standardised approach, the total exposure (after, where applicable, eligible netting benefits) that is covered by eligible guarantees and credit derivatives; and eligible collateral after haircuts, allowed under the Capital Adequacy Framework. (cont’d)
Exposures Exposures covered by covered by Exposures guarantees/ eligible covered byBank Exposure credit financial other eligible2012 before CrM derivatives collateral collateralExposure Class rM’000 rM’000 rM’000 rM’000
Credit RiskOn-balance sheet exposures:Sovereigns/Central banks 5,022,323 – – –Public sector entities 50,855 – – –Banks, DFIs and MDBs 3,754,235 – – –Insurance companies, securities firms and
fund managers 447 – – –Corporates 7,954,029 – 416,457 –Regulatory retail 6,386,726 – 656,183 –Residential mortgages 6,574,048 – 10,385 –Higher risk assets 7,065 – – –Other assets 479,264 – – –Equity exposure 125,138 – – –Defaulted exposures 142,744 – 7,637 –
Total on-balance sheet exposures 30,496,874 – 1,090,662 –
Off-balance sheet exposures:Off-balance sheet exposures other than
OTC derivatives or credit derivatives 3,927,358 – 5,211 –Defaulted exposures 5,856 – 2 –
Total off-balance sheet exposures 3,933,214 – 5,213 –
Total on and off-balance sheet exposures 34,430,088 – 1,095,875 –
ALLIANCE FINANCIAL GroUp BErHAd (6627-X)248

BASEL II pILLAr 3 dISCLoSUrE 31 March 2013
3.0 CrEdIT rISK (cont’d)
3.5 Credit risk Mitigation (“CrM”) (cont’d)
The following tables represent the Bank’s and the Group’s credit exposure including off-balance sheet items under the standardised approach, the total exposure (after, where applicable, eligible netting benefits) that is covered by eligible guarantees and credit derivatives; and eligible collateral after haircuts, allowed under the Capital Adequacy Framework. (cont’d)
Exposures Exposures covered by covered by Exposures guarantees/ eligible covered byGroup Exposure credit financial other eligible2012 before CrM derivatives collateral collateralExposure Class rM’000 rM’000 rM’000 rM’000
Credit RiskOn-balance sheet exposures:Sovereigns/Central banks 7,143,989 – – –Public sector entities 50,855 – – –Banks, DFIs and MDBs 4,392,711 – – –Insurance companies, securities firms and
fund managers 476 – – –Corporates 9,689,833 – 657,948 –Regulatory retail 8,759,219 – 700,271 –Residential mortgages 7,620,144 – 11,033 –Higher risk assets 7,159 – – –Other assets 626,605 – – –Equity exposure 169,942 – – –Defaulted exposures 225,479 – 8,193 –
Total on-balance sheet exposures 38,686,412 – 1,377,445 –
Off-balance sheet exposures:Off-balance sheet exposures other than
OTC derivatives or credit derivatives 4,581,288 – 19,316 –Defaulted exposures 12,777 – 2 –
Total off-balance sheet exposures 4,594,065 – 19,318 –
Total on and off-balance sheet exposures 43,280,477 – 1,396,763 –
2013 ANNUAL REPORT 249

BASEL II pILLAr 3 dISCLoSUrE 31 March 2013
3.0 CrEdIT rISK (cont’d)
3.6 off-Balance Sheet Exposures and Counterparty Credit risk
Counterparty Credit Risk (“CCR”) is the risk that the counterparty to a transaction involving financial instruments such as foreign exchange and derivatives, could default before the final settlement of the transaction’s cash flows. Unlike a loan where the credit risk is unilateral i.e. only the lending bank faces the risk of loss, CCR on derivatives creates bilateral risk of loss. This means either party of the transaction can incur losses depending on the market value of the derivative, which can vary over time with the movement of underlying market factors.
For derivatives, the Group is not exposed to credit risk for the full face value of the contracts. The CCR is limited to the potential cost of replacing the cash-flow if the counterparty defaults. As such, the credit equivalent amount will depend, inter alia, on the maturity of the contract and on the volatility of the rates underlying that type of instrument.
Derivatives are mainly utilised for hedging purposes with minimal trading exposures. CCR is managed via counterparty limits which is set based on the counterparty’s size and credit rating. These limits are monitored daily by Group Risk Management.
CCR is further mitigated via netting agreements, e.g. under the International Swaps and Derivatives Association (“ISDA”) master agreement. The ISDA agreement contractually binds both parties to apply close-out netting across all outstanding transactions covered by an agreement if either party defaults or other predetermined events occur.
CCR is measured via the current exposure method whereby the credit equivalent exposure for derivatives is the sum of the mark-to-market exposure plus the potential future exposure (add-on factor multiplied by the notional amount). The add-on factors are as stipulated by BNM.
ALLIANCE FINANCIAL GroUp BErHAd (6627-X)250

BASEL II pILLAr 3 dISCLoSUrE 31 March 2013
3.0 CrEdIT rISK (cont’d)
3.6 off-Balance Sheet Exposures and Counterparty Credit risk (cont’d)
The off-balance sheet exposures and their related counterparty credit risk of the Bank and the Group are as follows:
positive Fair Value Credit risk- principal of derivative Equivalent WeightedBank Amount Contracts Amount Assets2013 rM’000 rM’000 rM’000 rM’000
Credit-related exposuresDirect credit substitutes 338,044 – 338,044 338,044 Transaction-related contingent items 546,968 – 273,484 273,484 Short-term self-liquidating trade-related contingencies 114,653 – 22,931 22,931 Irrevocable commitments to extent credit:– maturity exceeding one year 4,334,151 – 2,167,075 1,739,319 – maturity not exceeding one year 4,370,367 – 874,073 792,789 Unutilised credit card lines 1,388,811 – 277,762 217,673
11,092,994 – 3,953,369 3,384,240
Derivative financial instrumentsForeign exchange related contracts:– less than one year 3,938,112 14,407 58,978 28,489 Interest rate related contracts:– one year or less 1,060,000 640 2,374 475 – over one year to three years 775,000 2,521 15,521 3,104 – over three years 421,608 1,933 20,560 9,719 Equity related contracts:– over one year to three years 54,032 291 4,817 2,697
6,248,752 19,792 102,250 44,484
17,341,746 19,792 4,055,619 3,428,724
GroUp2013
Credit-related exposuresDirect credit substitutes 387,122 – 387,122 387,122 Transaction-related contingent items 585,435 – 292,717 292,717 Short-term self-liquidating trade-related contingencies 140,311 – 28,062 28,062 Irrevocable commitments to extent credit:– maturity exceeding one year 5,027,371 – 2,513,685 2,010,313 – maturity not exceeding one year 5,301,405 – 1,060,281 909,385 Unutilised credit card lines 1,388,811 – 277,762 217,673
12,830,455 – 4,559,629 3,845,272
Derivative financial instrumentsForeign exchange related contracts:– less than one year 3,938,112 14,407 58,978 28,489 Interest rate related contracts:– one year or less 1,060,000 640 2,374 475 – over one year to three years 775,000 2,521 15,521 3,104 – over three years 421,608 1,933 20,560 9,719 Equity related contracts:– over one year to three years 54,032 291 4,817 2,697
6,248,752 19,792 102,250 44,484
19,079,207 19,792 4,661,879 3,889,756
2013 ANNUAL REPORT 251

BASEL II pILLAr 3 dISCLoSUrE 31 March 2013
3.0 CrEdIT rISK (cont’d)
3.6 off-Balance Sheet Exposures and Counterparty Credit risk (cont’d)
The off-balance sheet exposures and their related counterparty credit risk of the Bank and the Group are as follows (cont’d):
positive Fair Value Credit risk- principal of derivative Equivalent WeightedBank Amount Contracts Amount Assets2012 rM’000 rM’000 rM’000 rM’000
Credit-related exposuresDirect credit substitutes 354,758 – 354,758 354,758Transaction-related contingent items 515,510 – 257,755 257,755Short-term self-liquidating trade-related contingencies 126,778 – 25,356 25,356Irrevocable commitments to extent credit:– maturity exceeding one year 3,645,632 – 1,822,816 1,518,664– maturity not exceeding one year 4,675,582 – 935,116 858,102Unutilised credit card lines 2,188,661 – 437,732 340,525
11,506,921 – 3,833,533 3,355,160
Derivative financial instrumentsForeign exchange related contracts:– less than one year 3,147,488 17,730 64,522 38,478Interest rate related contracts:– one year or less 587,000 130 912 182– over one year to three years 1,110,000 2,592 14,192 2,838– over three years 423,896 3,260 20,055 6,467
5,268,384 23,712 99,681 47,965
16,775,305 23,712 3,933,214 3,403,125
Group2012
Credit-related exposuresDirect credit substitutes 397,029 – 397,029 397,029Transaction-related contingent items 549,766 – 274,883 274,883Short-term self-liquidating trade-related contingencies 153,561 – 30,712 30,712Obligation under on-going underwritting agreement 70,122 – 35,061 35,061Irrevocable commitments to extent credit:– maturity exceeding one year 4,320,657 – 2,160,328 1,786,192– maturity not exceeding one year 5,793,193 – 1,158,639 1,004,648Unutilised credit card lines 2,188,661 – 437,732 340,525
13,472,989 – 4,494,384 3,869,050
Derivative financial instrumentsForeign exchange related contracts:– less than one year 3,147,488 17,730 64,522 38,478Interest rate related contracts:– one year or less 587,000 130 912 182– over one year to three years 1,110,000 2,592 14,192 2,838– over three years 423,896 3,260 20,055 6,467
5,268,384 23,712 99,681 47,965
18,741,373 23,712 4,594,065 3,917,015
ALLIANCE FINANCIAL GroUp BErHAd (6627-X)252

BASEL II pILLAr 3 dISCLoSUrE 31 March 2013
4.0 MArKET rISK
Market Risk is the risk of loss of earnings arising from changes in interest rates, foreign exchange rates, equity prices, commodity prices and in their implied volatilities.
Market Risk Management
The governance structure for market risk management starts with the Board of Directors which has the overall oversight on market risk management and defines the risk philosophy, principles and core policies. The Board is in turn assisted by the Group Risk Management Committee (“GRMC”) which is principally responsible to oversee management activities in managing risks. Its responsibilities include reviewing and approving risk management policies, risk exposures and limits whilst ensuring the necessary infrastructure and resources are in place. At Senior Management level, the Group Assets and Liabilities Management Committee (“GALCO”) manages the Group’s market risk by reviewing and recommending market risk frameworks and policies; ensuring that market risk limits and parameters are within the approved thresholds; and aligning market risk management with business strategy and planning.
Organisationally, market risks are managed collectively via the Three Lines of Defence concept. Financial Markets as the risk taking unit assumes ownership of the risk and manages the risk within the approved policies, risk limits and parameters as set by the GRMC or GALCO. The risk control function is undertaken by Group Risk Management which provides independent monitoring, valuation and reporting of the market exposures. This is supplemented by periodic audit checking/sampling by Internal Audit.
For the Group, market risk is managed on an integrated approach which involves the following processes:
(i) identification of market risk in new products and changes in risk profiles of existing exposures.
(ii) assessment of the type and magnitude of market risks which takes into account the activity and market role undertaken.
(iii) adoption of various market risk measurement tools and techniques to quantify market risk exposures.
(iv) adoption of the Three Lines of Defence concept for monitoring of market risk; Business Units forming the 1st Line, Group Market Risk Management as the 2nd Line and Internal Audit functioning as the 3rd Line.
(v) scheduled and exception reporting on market risk exposures.
Market risk exists in the Group’s activities in bonds, foreign exchange and interest rate swaps, which are transacted primarily by Financial Markets (treasury) department. Trading positions are held intentionally for short-term resale and with the intent of benefiting from actual or expected short-term price movements while banking book positions are held until maturity or as available-for-sale. Hence, these positions are susceptible to market movements.
These exposures are governed by approved policies, risk limits and parameters which are set vis-a-vis the Group’s risk appetite and strategy. Besides that, treasury activities are monitored and reported independently by Group Market Risk on a daily basis. Any limit breaches or exceptions are reported to GALCO and GRMC.
Hedging Policies and Strategies
The Group had established a hedging policy which outlines the broad principles and policies governing hedging activities by the Group. Generally, the Group enters into hedges to manage or reduce risk exposures. All hedging strategies are approved by the GALCO and monitored independently by Group Market Risk. Further, all hedging strategies are designated upfront and recorded separately under the hedging portfolios. Hedging positions and effectiveness are monitored and reported monthly to management.
Market risk capital charge
For the Group, the market risk charge is computed on the standardised approach and the capital charges are mainly on the bonds, foreign exchange and equities portfolios.
2013 ANNUAL REPORT 253

BASEL II pILLAr 3 dISCLoSUrE 31 March 2013
4.0 MArKET rISK (cont’d)
Regulatory capital requirements
The risk-weighted assets and capital requirements for the various categories of risk under market risk are as follows:
Bank Group risk- risk- Weighted Capital Weighted Capital Assets requirements Assets requirements2013 rM’000 rM’000 rM’000 rM’000
Interest rate risk – General interest rate risk 9,874 790 11,865 949 – Specific interest rate risk 362 29 362 29 10,236 819 12,227 978
Foreign exchange risk 63,818 5,105 63,818 5,105
74,054 5,924 76,045 6,083
2012
Interest rate risk– General interest rate risk 135,911 10,873 138,404 11,072– Specific interest rate risk 477 38 477 38
136,388 10,911 138,881 11,110
Equity risk– General interest rate risk – – 3,419 273– Specific interest rate risk – – 5,983 479
– – 9,402 752
Foreign exchange risk 20,731 1,658 20,731 1,658Options risk – – 96,418 7,713
157,119 12,569 265,432 21,233
ALLIANCE FINANCIAL GroUp BErHAd (6627-X)254

BASEL II pILLAr 3 dISCLoSUrE 31 March 2013
5.0 opErATIoNAL rISK
Operational risk is the risk of direct or indirect loss resulting from inadequate or failed internal processes, people and systems or from external events.
Operational Risk Management
Management, escalation and reporting of operational risks are instituted through the Group Operational Risk Management Committee, Group Risk Management Committee as well as the Board. The responsibilities of the Committees and Board include the following:
(i) Oversight and implementation of the Operational Risk Management (“ORM”) Framework;
(ii) Establishment of risk appetite and the provision of strategic and specific directions;
(iii) Regular review of operational risks initiatives, reports and profiles;
(iv) Addressing operational risk issues; and
(v) Ensuring compliance with regulatory and internal requirements including disclosures.
The Group practices operational risk management as outlined in the ORM Framework, in accordance with Basel and regulatory guidelines. The Group applies operational risk tools and methodologies in the identification, assessment, measurement, control and monitoring of operational risks. Other efforts by the Group include the ORM awareness training which is given to all staff, and regular business continuity and disaster recovery plans.
The Group adopts the Basic Indicator Approach for computation of operational RWA.
6.0 EQUITY EXpoSUrES IN BANKING BooK
The Bank and the Group hold equity positions in banking books as a result of debt to equity conversion, for social-economic purposes, or to maintain strategic relationships. All equities are held at fair value. For quoted equity, fair value is estimated based on quoted or observable market price at the end of the reporting period; and for those unquoted equity, the fair value is estimated using certain valuation technique.
The return of the equity are credited to the statement of comprehensive income and any gain or loss arising from a change in fair value are recognised directly in other comprehensive income or in equity through the statement of changes in equity.
2013 ANNUAL REPORT 255
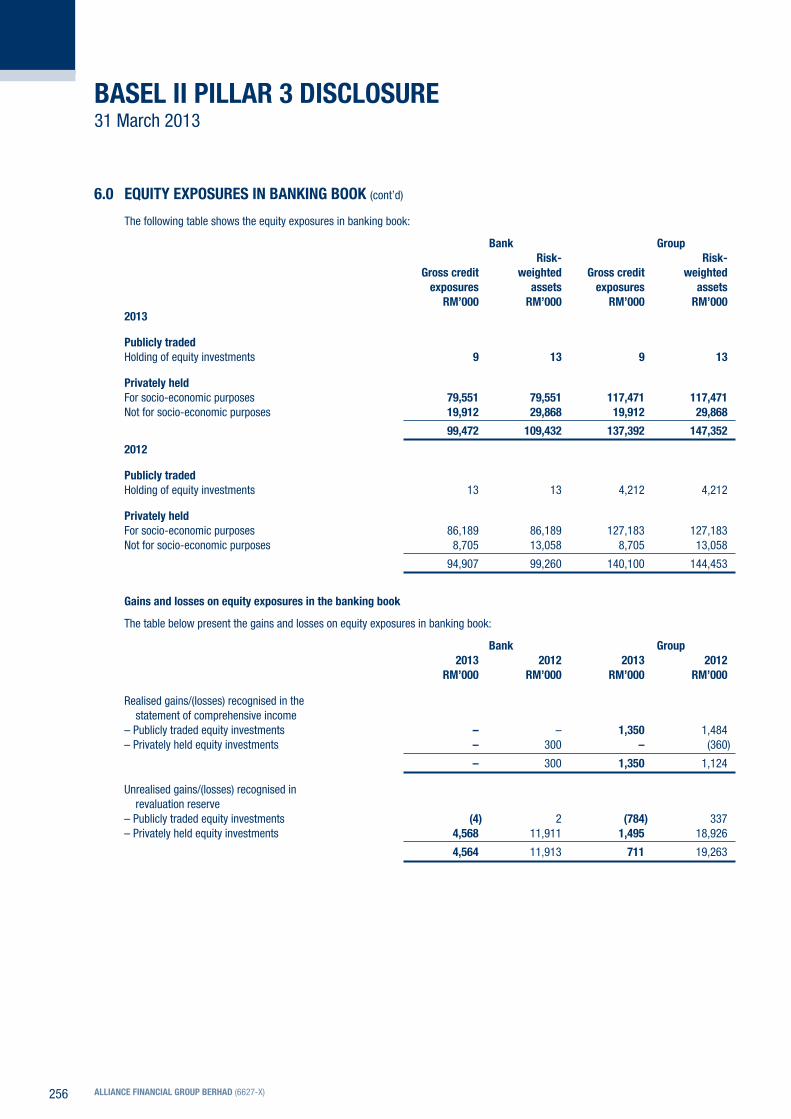
BASEL II pILLAr 3 dISCLoSUrE 31 March 2013
6.0 EQUITY EXpoSUrES IN BANKING BooK (cont’d)
The following table shows the equity exposures in banking book:
Bank Group risk- risk- Gross credit weighted Gross credit weighted exposures assets exposures assets rM’000 rM’000 rM’000 rM’0002013
publicly tradedHolding of equity investments 9 13 9 13
privately heldFor socio-economic purposes 79,551 79,551 117,471 117,471 Not for socio-economic purposes 19,912 29,868 19,912 29,868
99,472 109,432 137,392 147,352
2012
publicly tradedHolding of equity investments 13 13 4,212 4,212
privately heldFor socio-economic purposes 86,189 86,189 127,183 127,183Not for socio-economic purposes 8,705 13,058 8,705 13,058
94,907 99,260 140,100 144,453
Gains and losses on equity exposures in the banking book
The table below present the gains and losses on equity exposures in banking book:
Bank Group 2013 2012 2013 2012 rM’000 rM’000 rM’000 rM’000
Realised gains/(losses) recognised in the statement of comprehensive income
– Publicly traded equity investments – – 1,350 1,484– Privately held equity investments – 300 – (360)
– 300 1,350 1,124
Unrealised gains/(losses) recognised in revaluation reserve
– Publicly traded equity investments (4) 2 (784) 337– Privately held equity investments 4,568 11,911 1,495 18,926
4,564 11,913 711 19,263
ALLIANCE FINANCIAL GroUp BErHAd (6627-X)256

BASEL II pILLAr 3 dISCLoSUrE 31 March 2013
7.0 INTErEST rATE rISK/rATE oF rETUrN rISK IN THE BANKING BooK
Interest rate risk/rate of return risk in the banking book (“IRR/RORBB”) arises from exposure of banking book positions to interest rate/profit rate movements. Changes in interest rate/profit rate affects the Group’s earnings by changing its net interest/profit income and the level of other interest/profit rate sensitive income and expenses. It also affects the underlying value of banking assets, liabilities and off-balance sheet instruments as the present value of future cash flows change when interest rate/profit rate change.
Risk Governance
IRR/RORBB is managed collectively by GALCO, Financial Markets, Group Finance and Group Risk Management. Each of the above parties has clearly defined roles and responsibilities to provide oversight and manage IRR/RORBB within the defined framework and structure as approved by the Board of Directors/GRMC. GALCO assumes the overall responsibility in managing IRR/RORBB by setting the directions, strategy and risk limits/parameters for the Bank/Group. On the ground, Financial Markets is tasked to execute the approved strategy by managing the asset liabilities as well as the funding and liquidity needs of the Bank/Group. Group Finance and Group Risk Management provide support in respect of risk monitoring and reporting of the banking book exposures; and ensuring regulatory as well as accounting requirements are met.
IRR/RORBB Management
The guiding principles in managing IRR/RORBB include:
(i) prudent approach in management of IRR/RORBB that commensurate with the Group’s size and business activities. This is achieved via establishing robust IRR/RORBB policies, measures and strategies which is complemented by regular monitoring and reporting.
(ii) IRR/RORBB are accurately measured and any mismatches identified, reviewed and reported monthly to GALCO.
(iii) setting of proper gapping limits and the limits monitored closely.
(iv) comprehensive IRR/RORBB reporting and review process which provide aggregate information and sufficient supporting details to enable assessment of the Group’s sensitivity to changes in market conditions.
The Group uses a range of tools, including the following primary measures to quantify and monitor IRR/RORBB:
(i) Repricing gap analysis to measure interest rate/profit rate from the earnings perspective i.e. impact of interest rate/profit rate changes to earnings in the short-term.
(ii) Net interest income/profit income simulation to assess the impact of interest rate/profit rate changes on short term earnings volatility.
(iii) Economic value of equity (“EVE”) simulation which measures long term interest rate/profit rate exposure through deterioration in capital base based on adverse interest rate/profit rate movements.
Group Risk Management performs independent monitoring of the interest rate/profit rate benchmarks to ensure compliance. Any exceptions are reported and appropriate remedial actions are taken, where necessary. Schedule reporting via risk dashboards are provided to senior management and Board committees periodically. The risk dashboards provide a visual gauge (“dashboard view”) on the IRR/RORBB of the Group.
The Group is guided by BNM’s guidelines and Basel standards on management of IRR/RORBB.
2013 ANNUAL REPORT 257
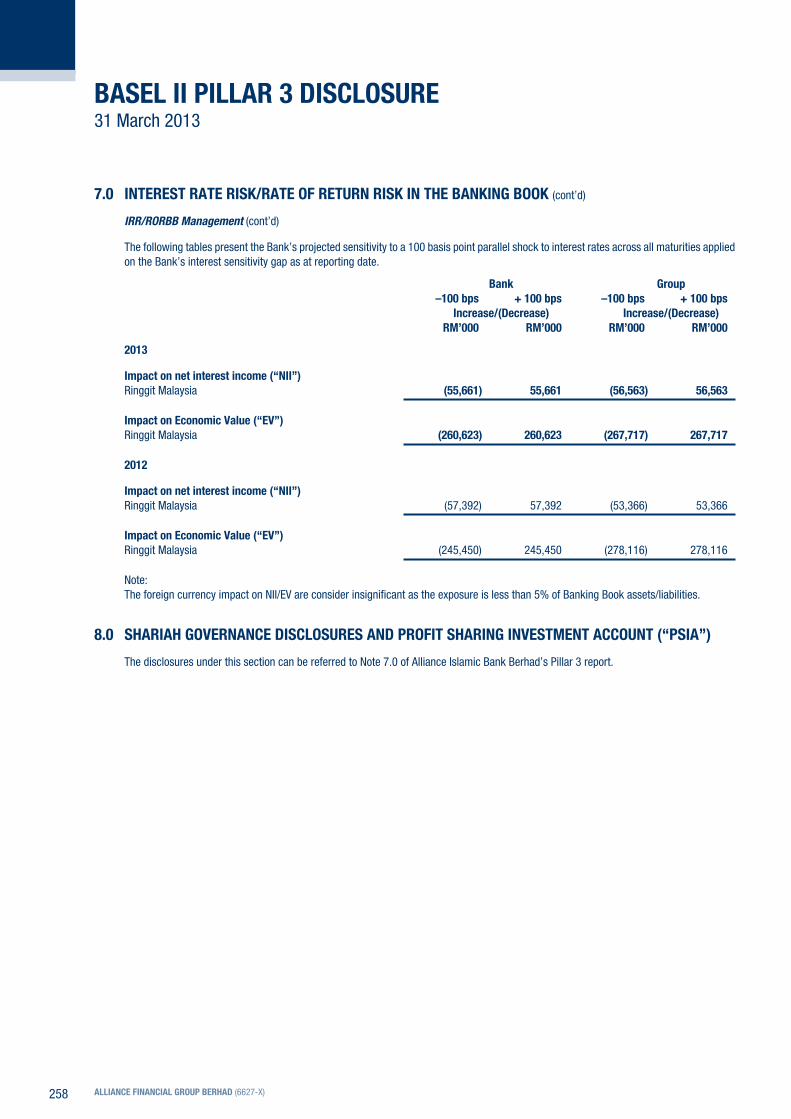
BASEL II pILLAr 3 dISCLoSUrE 31 March 2013
7.0 INTErEST rATE rISK/rATE oF rETUrN rISK IN THE BANKING BooK (cont’d)
IRR/RORBB Management (cont’d)
The following tables present the Bank’s projected sensitivity to a 100 basis point parallel shock to interest rates across all maturities applied on the Bank’s interest sensitivity gap as at reporting date.
Bank Group –100 bps + 100 bps –100 bps + 100 bps Increase/(decrease) Increase/(decrease) rM’000 rM’000 rM’000 rM’000
2013
Impact on net interest income (“NII”) Ringgit Malaysia (55,661) 55,661 (56,563) 56,563
Impact on Economic Value (“EV”) Ringgit Malaysia (260,623) 260,623 (267,717) 267,717
2012
Impact on net interest income (“NII”) Ringgit Malaysia (57,392) 57,392 (53,366) 53,366
Impact on Economic Value (“EV”) Ringgit Malaysia (245,450) 245,450 (278,116) 278,116
Note:The foreign currency impact on NII/EV are consider insignificant as the exposure is less than 5% of Banking Book assets/liabilities.
8.0 SHArIAH GoVErNANCE dISCLoSUrES ANd proFIT SHArING INVESTMENT ACCoUNT (“pSIA”)
The disclosures under this section can be referred to Note 7.0 of Alliance Islamic Bank Berhad’s Pillar 3 report.
ALLIANCE FINANCIAL GroUp BErHAd (6627-X)258