baseball: it’s all in the data iowa actuaries club february 23, 2007
TRANSCRIPT

Baseball: It’s All in the Data
Iowa Actuaries Club
February 23, 2007

Not one of these plays was ruled an error

It’s All in the Data
• How an actuary got into sports
• Case study: fielding – the holy grail of baseball statistics

Data is Everywhere
• Baseball data is like any other data
• Millions of statistics – bottomless pit of numbers
• Our job: mine the nuggets that– Are interesting– Are relevant– Reveal tendencies

Danny Cox – 1987 NLCS
• STATS, Inc. began pitch-by-pitch tracking
• Danny Cox regular season 1987– First 70 pitches: .268 opponent batting
average– Pitch 71+: .345 average
• Vin Scully mentions this at pitch 70

What Happened?• 73rd pitch: line-drive double
• 74th pitch: long home run to left field
• 78th pitch: sharp single to right
• 81st pitch: line single to center
• 82nd pitch: Vin Scully falls out of the booth

The Dream
• Strat-O-Matic Baseball
• “Bowie” Dewan
• Statistician for the Chicago White Sox
• Computerized baseball Information

The Michael Jordan Effect - 19931992: STATS tracks basketballFourth Quarter Comebacks (down 15+ points)• Bulls win NBA crown beating Portland after trailing by 15 entering 4th
quarter• How hard is this?
– 1992-93 league record: 1-259 (excluding Bulls)
• The Bulls?– Bulls record: 3-3
• Jordan leaves Bulls– Bulls record: 0-8
• Jump ahead to comeback season– League record 0-168 (excluding Bulls)– Bulls record 1-1

The First Career• Started as an actuary after college
• FSA in 1982
• Head of two Actuarial Departments
• I loved what I did!
• But sports numbers are more fun than insurance
numbers

The Decision
• Bill James Baseball Abstract
• The dream takes hold
• Two full-time jobs
• The risk

Bunting: A Lost Skill?
• In 2006, Juan Pierre attempted to bunt for a hit 38 times
• Was he successful? What’s your guess?– 9 hits (.237 average)– 12 hits (.316)– 16 hits (.421)– 19 hits (.500)
The answer is….

Bunting: A Lost Skill?
• 19 hits for an amazing .500 average!!
• The top bunters hit over .500
• Here is a list of some of the other top bunters from 2006:– Willy Taveras – 21 bunt hits– Corey Patterson – 17 bunt hits– Ryan Zimmerman – 10 bunt hits (10 tries!)

The Second Career
• Collect data
• Develop products we want ourselves
• Money is not the object
• Have fun!

The Second Career• Bedroom Office
• Key clients: AP, USA Today, ESPN
• Growing every year – new office every year
• David vs. Goliath – twice!
• 100+ Full-Time Employees
• Sale to FOX

From The Fielding Bible
• Best defensive outfielder in 2005?
• Aaron Rowand, Chicago White Sox
• Made 15 more plays than an average center fielder
• Basic plus/minus +15
• Saving 30 bases for the team
• Enhanced plus/minus +30

The Third CareerFive different jobs:
• Baseball Info Solutions – Stat of the Week (WSCR)– The Fielding Bible
• ACTA Sports (publishing)
• Camp Dewan
• Dewan Foundation & Mission Honduras
• Be Jolly, Inc.

Case Study:Enhanced Fielding Analysis
• Plus/Minus System (from The Fielding Bible)
• Defensive Misplays
• Good Fielding Plays
• Advanced Catcher Evaluation

Game Charting at BIS
• Video scouts review every MLB game
• Every play entered into a computer
• Sample game scoring screen:

BIS Scoring Software
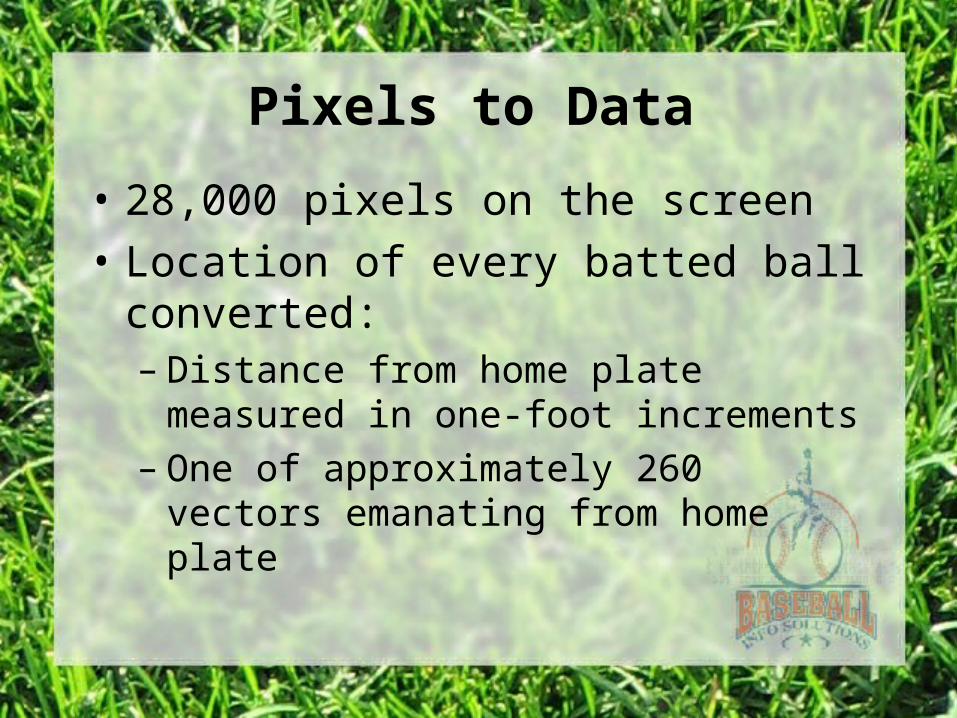
Pixels to Data
• 28,000 pixels on the screen
• Location of every batted ball converted:– Distance from home plate measured in
one-foot increments– One of approximately 260 vectors
emanating from home plate

Also Chart:
• Velocity of each batted ball (soft, medium, hard)
• Type of batted ball (ground ball, line drive, fly ball or popup, bunt)
• New for 2006: fliner

The Fielding Bible• Take a step forward in fielding stats• Batting stats
– What do you think of when I say a player had 40 HRs – do you get a visual image?
– How about 57 stolen bases?
• Pitching stats– 39 Saves – tells you something right away– 2.41 ERA – also tells you something
• Fielding – what does a .982 fielding percentage mean?

Plus/Minus System
• Vector 17 example for shortstops
• Softly hit grounders to vector 17 converted to outs by all shortstops 26% of the time
• Out made: +.74 (1-.26)
• Missed ball: -.26
• Sum every play made or missed by every shortstop
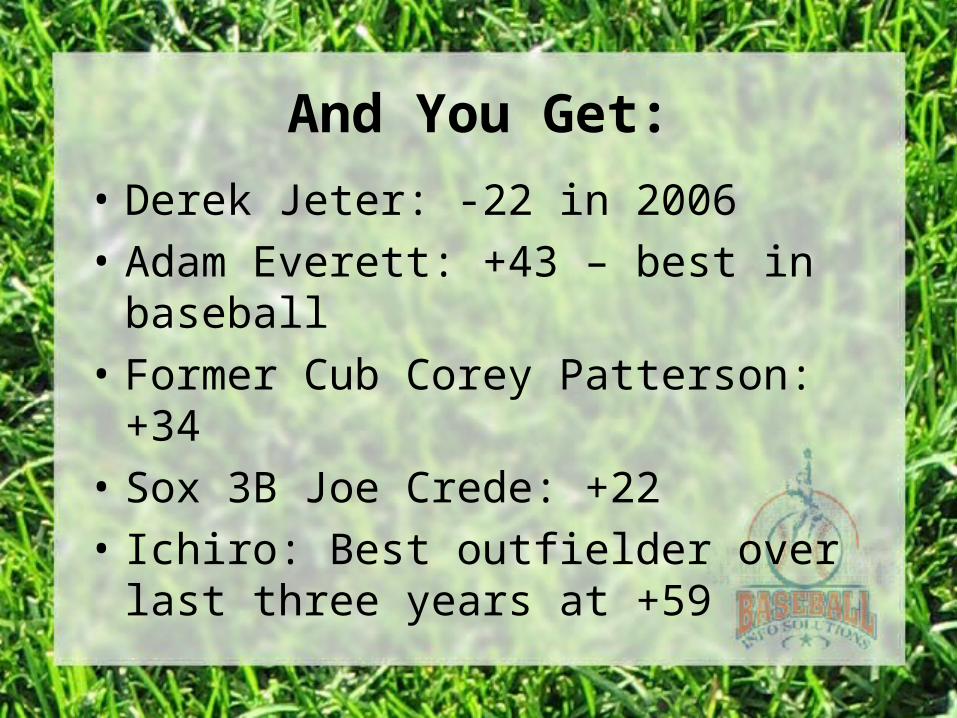
And You Get:
• Derek Jeter: -22 in 2006
• Adam Everett: +43 – best in baseball
• Former Cub Corey Patterson: +34
• Sox 3B Joe Crede: +22
• Ichiro: Best outfielder over last three years at +59

Overall
• Eight of ten best teams in Top Nine
• Only Yankees and Red Sox made playoffs without a top defense
• Yanks – worst in baseball in 2005 –minus 164 as a team!
• The first two subscribers to our newest defensive service?
• Yanks and Red Sox

Defensive Misplays
• Plays that are NOT recorded as errors or passed balls
• Loss of an opportunity to make an out…
• …OR an extra advancement by a runner
• 54 different types of Defensive Misplays

Defensive Misplays
• Slow to recover
• Failing to cover first
• Cutting off a better positioned fielder

Good Fielding Plays
• Fielder records an out when the play seemed more likely to be a hit…
• …OR a fielder prevents the opportunity for advancement of baserunners.
• 27 different types of GFPs

Good Fielding Plays
• Robs home run
• Ground ball out
• Holds to single

Alfonso Soriano
• Worst MLB second baseman in 2005– Most Defensive Misplays: 52– Worst NL Plus/Minus: -22
• Reluctantly moved to LF in 2006– Some struggles learning the new position –
third most Defensive Misplays: 26– But . . .– Most Good Fielding Plays: 24– Second best Plus/Minus: +15– Most baserunner kills in MLB: 15
