barriers to student achievement - scholar works
TRANSCRIPT

Masthead Logo Scholar WorksM.S.Ed. in Educational Leadership ResearchProjects Graduate Works
2017
Barriers to Student AchievementDewey HernandezUniversity of Maine at Farmington
Follow this and additional works at: https://scholarworks.umf.maine.edu/ed_leadership_projects
Part of the Educational Leadership Commons
This Research Project is brought to you for free and open access by the Graduate Works at Scholar Works. It has been accepted for inclusion in M.S.Ed.in Educational Leadership Research Projects by an authorized administrator of Scholar Works. For more information, please [email protected].
Recommended CitationHernandez, Dewey, "Barriers to Student Achievement" (2017). M.S.Ed. in Educational Leadership Research Projects. 18.https://scholarworks.umf.maine.edu/ed_leadership_projects/18
BARRIERS TO STUDENT ACHIEVEMENT �1
Barriers To Student Achievement
Dewey Hernandez
University of Maine at Farmington
Dewey Hernandez is a former graduate student at the University of Maine at Farmington.
He has been a special education teacher at Hall-Dale High School for eight years. Recently, he
completed his Masters Degree at the University of Maine at Farmington in the Educational
Leadership program, with a concentration in Special Education.

BARRIERS TO STUDENT ACHIEVEMENT �2
Table of Contents
Abstract……………………………………………………………………………………………3
Introduction………………………………………………………………………………………..4
Literature Review………………………………………………………………………………….4
Research Design………………………………………………………………………………….13
Research Methods………………………………………………………………………………..18
Research / Inquiry Narrative……………………………………………………………………..23
Data Analysis / Interpretations of Findings.……………………………………………………..29
Conclusions / Implications………………………………………………………………………52
Reflection………………………………………………………………………………………..59
References……………………………………………………………………………………….63
Appendix A - Administrator’s Consent Form……………………………………………………65
Appendix B - Participant Consent Form…………………………………………………………66
Appendix C - Survey / Questionnaire……………………………………………………………68
Appendix D - Interview Protocol………………………………………………………………..69
BARRIERS TO STUDENT ACHIEVEMENT �3
Abstract
Barriers to success are present in educational environments. With a major focus on
students with disabilities, this study examines the impact of barriers on student achievement and
includes paraprofessionals’ roles as well. Additionally, this study examines how promising
practices can overcome barriers and increase success. The research was conducted using a
mixed-methods approach. Results found that barriers impact success greatly, but promising
practices can help to overcome them, at least perceptually. And, with regard to paraprofessionals,
nothing conclusive surfaced other than what they need to be more effective. The biggest
revelations were about the proficiency-based educational model, uncontrollable circumstances,
and opportunities for students to provide evidence of learning in nontraditional ways.
Recommendations are for district leaders to balance philosophy and resources, such as increasing
paraprofessional training, bringing a bigger system of LCSW support, showing how to co-teach
and making sure it is happening, and finding ways for inclusion to be solidly effective.

BARRIERS TO STUDENT ACHIEVEMENT �4
Introduction
Educators are aware that barriers exist with respect to educating students with disabilities
in the school environment. Though educators are capable of utilizing promising practices, these
barriers can be difficult to overcome. What barriers exist, how do they impact achievement, and
what can be done about them? Collaboration is of utmost importance among all educators,
making sure not to exclude paraprofessionals. What is their role in this and how do they impact
achievement? The overall goal of this research study is to improve educational practice for
educators and improve the educational system for students.
Literature Review
The Individuals with Disabilities Act of 1990, an amendment (and name change) to the
original Education of the Handicapped Act of 1970, was “enacted to assist states in meeting the
educational needs of students with disabilities via federal funding of state efforts” (Katsivannis,
Yell, and Bradley, 2001, p. 327). However, when the Individuals with Disabilities Education Act
(IDEA) was passed in 1975, Congress was less focused on funding and more focused on
enforcing a right upon students with disabilities to receive a public education; funding was a part
of this amendment to EHA with the mandate that states comply with the specifics of the Act
(Katsivannis et al., 2001). IDEA, therefore, is a law that allows the the federal government to
provide funding to states and control how education will be carried out for students with
disabilities. All students have the right to a free and appropriate public education, and a FAPE is
part of the IDEA law. Under FAPE, the needs of students with disabilities [eligible for special
BARRIERS TO STUDENT ACHIEVEMENT �5
education services] must be met by schools in the form of providing specific instruction for each
individual.
Now the reality. Teachers and schools face these expectations from the federal
government, though with limited funding, and downsizing of special education services happens
due to this limited funding. Kaufhold (2006) states, “Federal funding through the IDEA law
provides financial support for local school districts for the education of children with special
needs. Much of the recent literature indicates, however, that either this funding is not sufficient
or it is not reaching the students for which it was intended” (p. 159).
Additionally, and aside from the reality of limited finances with high expectations, it is
important to note the differing special education models among schools. Effectiveness does not
always have to suffer when limitations are faced. A study in 2003 by Naomi Zigmund explored
the research of special education programs in different settings. Zigmund (2003) found that,
“effectiveness depends not only on the characteristics and needs of a particular student but also
on the quality of the program’s implementation” (p. 197). She goes on to state that, “Good
programs can be developed in any setting, as can bad ones. The setting itself is less important
than what is going on in the setting” (p. 198).
Speaking of settings, a problem that seems consistent throughout many schools is the fact
that there are barriers between special educators and regular educators, even including, at times,
building principals and special education administrators (Klingner, Ahwee, Pilonieta, &
Menendez, 2003; Enser, 2012; Harpell & Andrews, 2010; Cook, Semmel & Gerber, 1999). These
barriers can stem from ineffective communication, incompatible personalities, time constraints,
lack of understanding of one another, miseducation concerning roles, and a lack of

BARRIERS TO STUDENT ACHIEVEMENT �6
paraprofessional support in the mainstream setting. Regardless, these barriers can lead to
uninformed decisions and lack of team participation, causing educators to miss opportunities
regarding collaborative work with students, that would potentially increase the success of
students (Klingner, Ahwee, Pilonieta, & Menendez, 2003; Enser, 2012; Harpell & Andrews,
2010; Cook, Semmel & Gerber, 1999; Breton, 2010; Gerber, Finn, Achilles, & Boyd-Zaharias,
2001). Additionally, with respect to paraprofessionals, as of 2001, there were over 600,000
teacher aides in schools across the United States (Gerber et al, 2001). In 2014, the Bureau of
Labor Statistics reported that as of 2012, there were 1,223,400 teacher aides. With this number of
individuals employed in these positions, it is hard to believe that there is still so little research to
provide information about the impact of teacher aides on student achievement, let alone their
qualifications and classroom activities.
Prior research on educational barriers to student achievement has included looking at (a)
promising practices, (b) student achievement, and (c) paraprofessionals. First, while researching
promising practices, Klingner, Ahwee, Pilonieta, and Menendez (2003) wanted to better
understand the barriers and facilitators experienced by teachers considered high, moderate, and
low implementers of research-based practices. Enser (2012) also researched promising practices
and provided evidence that principals perceive benefits of special education services for students,
however do not have the skills or resources to support successful implementation. Harpell and
Andrews (2010) reported on promising practices which included administrators, and argued that
differentiating instruction and co-teaching requires strong leadership skills and access to
appropriate resources.

BARRIERS TO STUDENT ACHIEVEMENT �7
The second topic, student achievement, included research by Cook, Semmel, and Gerber
(1999). Cook et al. (1999) discovered that principals and special educators have different
opinions when it comes to the inclusion of students with disabilities in mainstream classrooms,
and how it impacts student achievement. The topic of student achievement also included a study
in 2000 by Goddard, Hoy, and Hoy. The researchers examined teacher efficacy, teachers
believing they can get results, and provided evidence that teacher efficacy is more connected to
student achievement than any other factor.
The third topic, paraprofessionals, includes similar concerns among researchers with
paraprofessionals perceiving themselves to be undertrained and poorly utilized, lessening their
effectiveness in the classroom when working with students with disabilities (Breton, 2010;
Gerber et al., 2001). Gerber, Finn, Achilles, and Boyd-Zaharias (2001) went one step further, and
found evidence of paraprofessionals having no impact on student achievement, in some
instances, the opposite.
While we do know researchers have studied promising practices, student achievement,
and paraprofessionals with respect to educational barriers, there is little research attention spent
on the impact these barriers have on student achievement, with many qualitative studies about
perceptions and ideas regarding what should be changed practice-wise and even the role of
collaboration with paraprofessionals.
Examining not only the barriers that exist, or are perceived to exist, but also their impact
on achievement, and further investigating connections with paraprofessionals and student
success will allow researchers to acquire important data. This data can be used by administrators,
teachers, and paraprofessionals in order to promote promising practices, automatically

BARRIERS TO STUDENT ACHIEVEMENT �8
overcoming barriers that exist between these professionals. Leaders can plan accordingly to
enhance the learning of all students. The purpose of this research study is to discover ways that
promising educational practices can overcome barriers to student success, including examining
how barriers already affect student achievement and the role of paraprofessionals with regard to
student achievement as well.
Using Promising Practices to Overcome Barriers
Researchers can help bring attention to educational barriers in many ways. In 2003,
Klingner et al. stated that “When faced with too many challenges and discord between new
knowledge and existing knowledge, it is sometimes easier for teachers to revert back to known
and familiar patterns” (p. 413). Because of this, it is important to understand what challenges
may arise and help educators move from existing knowledge to new knowledge without feeling
overwhelmed. Klingner et al. (2003) also found that teachers would implement more research-
based practices if they had received clear expectations from district leaders. This further
reinforces that barriers, in this case lack of leaders communicating well with teachers, can
prevent student achievement. Finally, Klingner et al. (2003) discovered that scaling up research-
based practices is not about doing more, but doing more on a larger scale. Because research-
based practices are at the core of special education, it is important for special and regular
educators to work together to implement or strengthen research-based practices for all students.
Regarding leaders and leadership, in his doctoral dissertation in 2012, Enser wanted to
find out how principals perceived implementation of special education services and the potential
barriers to implementation in the Wisconsin Evangelical Lutheran Synod. He found that

BARRIERS TO STUDENT ACHIEVEMENT �9
perceptions differed between the principals and special educators included as participants in this
study, with principals demonstrating perceived benefits of special education, but not fully
understanding all aspects of the field. A significant barrier exists if principals perceive that
special education services have benefits for students, but do not have the skills or resources to
implement it successfully. With proper resources and training, this can become a successful
practice, not a barrier, potentially increasing student achievement.
Two more promising practices that go hand-in-hand are differentiated instruction and co-
teaching. Both are at the heart of inclusive education. Inclusive education is when students with
and without disabilities learn together in the same classroom. Harpell and Andrews (2010)
argued that adopting both differentiated instruction and co-teaching requires strong leadership
that provides teacher empowerment and that these models are critical within inclusive education.
In summary, promising practices can lead to student achievement when barriers, such as
differing perceptions, are overcome. Why is it important to overcome barriers? Do barriers
impact student achievement?
The Impact of Barriers on Student Achievement
Researchers show that barriers exist between special and regular educators (Klingner et
al., 2003; Enser, 2012; Harpell & Andrews, 2010; Cook, et al., 1999). It is most concerning when
barriers impact student achievement. In a qualitative study, Cook, Semmel, and Gerber (1999)
found that principals believed to a high degree that achievement for students with disabilities was
great in the mainstream environment. Special education teachers in the same environment,
however, believed the exact opposite, and that supports were not in place, not well-maintained,

BARRIERS TO STUDENT ACHIEVEMENT �10
or both. With these differing beliefs, it could mean that students are not appropriately included in
the mainstream, which could lead to students missing out on opportunities to achieve more
highly. When inclusion does not net positive results or student achievement, special education
teachers develop negative attitudes toward inclusion, perpetuating the existence of barriers,
ultimately impacting student achievement (Cook et al., 1999).
Another barrier between special and regular educators that can affect student achievement
is when teacher efficacy is low. Teacher efficacy becomes even more challenging when students
with disabilities are involved due to the level of need of some students, especially those with
moderate to severe disabilities. Goddard, Hoy, and Hoy (2000) researched teacher efficacy and
its connection to student achievement. They found three important things: a) teacher efficacy is a
primary predictor of student achievement, b) teacher efficacy has a greater effect on student
achievement than socioeconomic status (SES) does, and c) teacher efficacy is positively
associated with student achievement. Because of this evidenced correlation, ongoing
opportunities to increase teacher efficacy should take place in school environments.
Paraprofessionals’ Impact on Student Achievement
A paraprofessional is someone who is delegated a specific, professional task but who is
not licensed to the full degree to be a professional in the field of which they work. With regard to
educators, paraprofessionals are sometimes referred to as teacher aides, teacher assistants, or in
Maine, educational technicians, the title given by the Maine Department of Education. Teacher
aides typically work with students with disabilities in both regular education and special
education environments. Without the proper training, supervision, and utilization, however,
BARRIERS TO STUDENT ACHIEVEMENT �11
teacher aides can also be barriers to student achievement. The remainder of this section includes
two studies regarding the impact of paraprofessionals on student achievement: first qualitative,
then quantitative.
First, Breton (2010) conducted a qualitative study on teacher aides, focusing on
educational technicians in Maine and their perceptions of
• the adequacy of their training;
• the effectiveness of their supervisors’ guidance; and
• their continuing training needs being met.
The researcher found that the majority of the educational technicians perceived their training as
inadequate, their supervision by teachers ineffective, and their continuing training needs not met
(Breton, 2010). Additionally, the number one topic that educational technicians felt they needed
the most training was working with students displaying social, emotional, and behavioral
challenges. This is most disturbing, considering these are arguably the most challenging groups
of students, needing the most highly-trained special educators. Just like any occupation, it is
imperative that educational technicians receive the proper training to perform their jobs
effectively, with the goal of student achievement.
Second, Gerber et al. (2001) conducted a quantitative study focusing on the impact of
teacher aides on student achievement. The researchers wanted to find out if the presence of a
teacher aide in the classroom had any impact on students’ learning. The researchers’ findings did
not support having teacher aides in classrooms. “Nevertheless, this study and others confirm that
paraprofessionals, by and large, are not effective as teachers” (Gerber et al., 2001, p.138). In fact,
in some instances it was actually detrimental, according to the achievement data. “Teacher aides

BARRIERS TO STUDENT ACHIEVEMENT �12
in high-minority schools may actually be detrimental to teachers’ perceptions with respect to
managing time and engaging students in learning” (Gerber et al., 2001, p.138).
In summary, teacher aides are in schools across the United States. Billions of dollars are
spent each year to employ these paraprofessionals though studies, especially the second one
above, provide little to no evidence of improvement in student achievement with teacher aides in
classrooms. If teacher aide positions are to remain, it is imperative that policymakers pay the
attention necessary to bring change, ensuring that paraprofessionals become real contributors to
the success of students.
Summary and Conclusion
All children, including those with disabilities, have the right to an appropriate public
education. However, barriers exist with respect to educating students with disabilities. These
barriers get in the way of promising practices among educators and hinder student achievement.
Building a strong partnership among special educators, regular educators, administrators, and
paraprofessionals would create a consistent team of supporters in which all parties understand
the needs for each shared student. Additionally, overcoming these barriers will give students the
most fair education possible, positively impacting success in the process. Because of this, it is
imperative to educate others or at least bring awareness to the importance of breaking down
these barriers, improving teaching practice and learning for all parties. In this study, student
achievement will be explored, specifically how can educators use promising practices to
overcome barriers and increase student success? Furthermore, what is the impact of barriers on

BARRIERS TO STUDENT ACHIEVEMENT �13
student achievement? Finally, what is the impact of appropriately-prepared teacher aides on
student achievement?
Research Design
Purpose of the Research
The purpose of this research study is to discover ways that promising educational
practices can overcome barriers to student success, including examining how barriers already
affect student achievement and the role of paraprofessionals with regards to student achievement
as well. One goal in mind is to advocate for the need to have paraprofessionals as the two
buildings included in this study have a severe shortage of ed techs. Providing evidence of the
necessity for ed techs could help to reorganize the distribution of funds, potentially even at other
organizations. If not, at the very least, this study could support the need for paraprofessionals to
be routinely and effectively trained, before and during their employment.
Another goal of this study is to make barriers among administrators, teachers, and special
educators transparent, especially if these barriers could be overcome at least to the extent that
communication changes, and attempts are made to break down these barriers. This could allow
for sharing of important knowledge and information between all stakeholders, with the intent to
improve the system itself, not just its parts.
Finally, the ultimate goal here is to improve the educational system for students. With
educators working together in a strong, supportive, transparent, and goal-oriented environment
with consistent, effective communication, anything is possible; barriers can be overcome,

BARRIERS TO STUDENT ACHIEVEMENT �14
students, both with and without disabilities, can be better supported, and all educators can
receive appropriate and new (conceptually) training.
Research Question(s)
Questions sought to be answered during this research include: How can educators use
promising practices to overcome barriers? What is the impact of barriers on student
achievement? What is the impact of appropriately-prepared teacher aides on student
achievement? These questions are important because they individually pinpoint current
challenges in education, and can collectively be used to make changes. The impact barriers have
on student achievement, both due to lack of ed techs and properly-trained ed techs and weak
practices and teams, are worth researching if changes can come of it.
The research for this study will describe a few existing challenges, explain why these
challenges are present, and even predict what could be if changes are made. Also, not entirely
different than some cited sources with regard to content, this study seeks to make connections
among the three research questions asked by looking at them together instead of separately.
With regard to data, I will gather information from educators in two schools on their
perceptions of promising practices (which ones are present, which ones are working, which ones
specifically include special educators and regular educators working together, which ones are
being supported by administrators, which ones are leading to student success in their school),
barriers (which ones are present, what is being done about them, how they are affecting student
learning and achievement), and student success through a survey. I will then interview a smaller
number of educators with open-ended questions. I will then gather achievement data on students

BARRIERS TO STUDENT ACHIEVEMENT �15
in special education with perceived strong and weak teams, and students with and without
teacher aides, differentiating between environments to pinpoint achievement “zones”; ed techs
are included as educators, so will be given surveys and interviewed as well. Achievement data
will include standardized tests and end-of-level assessments. Other data will include class size,
subject, number of students working at grade level, and number of students not working at grade
level.
Core Concepts
Going into this research, it is important to have a basic understanding of what current
school environments look like, especially at the 6-12 level for the sake of this study, and
common themes among schools with regard to challenges. As stated in my literature review,
prior research on educational barriers to student achievement has included promising practices,
student achievement, and paraprofessionals. Enser (2012) researched promising educational
practices and provided evidence that principals perceive benefits of special education services for
students, however do not have the skills or resources to support successful implementation. I
agree with this and see it in my own building as I have not been under a building administrator
with a special education background.
Harpell and Andrews (2010) argued that differentiating instruction and co-teaching
requires strong leadership skills and access to appropriate resources. Again, I agree with this
perspective, though I feel co-teaching can be worked out between regular and special educators,
not necessarily with administrative intervention or direction; time (as a resource) is the biggest
challenge here.

BARRIERS TO STUDENT ACHIEVEMENT �16
Cook, Semmel, and Gerber (1999) found that principals and special educators have
differing opinions with regard to including students with disabilities in the mainstream
classroom, and how this inclusion impacts the achievement of students. I have found this to be
true, though it is important to note that the differing opinions include thoughtfulness with what is
best for students. Continuing the topic of student achievement, a study in 2000 by Goddard, Hoy,
and Hoy examined teacher efficacy (teachers believing they can get results) and evidence
surfaced that teacher efficacy is the most interrelated factor of student achievement, above
anything else. I would argue that this may be the case at times, though I have seen things fall
apart even when experienced teachers believe they can get results, due to poor leadership and
barriers.
Revisiting the topic of paraprofessionals, concerns have appeared in studies among
researchers with regard to paraprofessionals considering themselves undertrained and poorly
utilized in the all settings, causing a decrease in potential effectiveness when working with
students with disabilities (Breton, 2010; Gerber et al., 2001). Gerber, Finn, Achilles, and Boyd-
Zaharias (2001) discussed evidence of paraprofessionals actually having no impact on the
achievement of students. Some data even showed a detriment to student achievement with ed
techs present. I agree, based on my experience, that ed techs feel as though they are not well-
trained or used effectively, especially in my building. Also, I feel the data that shows a detriment
to student achievement is due to the ed techs not being trained, not because there is not a need.
“Nevertheless, this study and others confirm that paraprofessionals, by and large, are not
effective as teachers” (Gerber et al., 2001, p.138). “Teacher aides in high-minority schools may
actually be detrimental to teachers’ perceptions with respect to managing time and engaging

BARRIERS TO STUDENT ACHIEVEMENT �17
students in learning” (Gerber et al., 2001, p.138). These two quotes are important to note because
I feel they represent a lack of training and direction, not the ed techs simply being present.
General Approach
I will go about investigating my topic with a mixed-methods approach. To better
understand potential answers to my survey and interview questions, I will need to make
observations in various settings; it would also help to do this before creating surveys and
interview questions to ensure I am asking the right questions initially. I will also need to contact
and get permission from the curriculum coordinator and superintendent to access necessary
achievement data. All information will be kept confidential.
The mixed-methods approach is appropriate for my research because I need both
qualitative and quantitative data in order to best answer my research questions. I feel that one
approach alone would provide inconclusive data and not respect the process of seeing a study
through to its best possible end.
Possible issues, like any research, could arise. Lack of survey responders, lack of access
to important achievement data, lack of interview participants, and even too much data are a few.
I will compensate for these potential challenges by making sure I ask focused questions that
connect immediately to the research questions. Additionally, data will have to be coded and
organized to achieve maximum efficiency, such as pinpointing exactly what data is needed with
regard to the research questions, and eliminating data that is not useful.

BARRIERS TO STUDENT ACHIEVEMENT �18
Research Methods
Setting
The research will take place in two, small Maine schools, a middle school and a high
school. The middle school has approximately 204 students and the high school has
approximately 318 students. With such a high population of students with disabilities (16%), the
chosen site will be appropriate to look at challenges present. Additionally, there are five special
education paraprofessionals in the two schools combined, and this research includes perception
data from paraprofessionals. There is also a high turnover of administrators and perceived low
morale among staff grades 6-12 with the high school facing this as a bigger challenge than the
middle school. Access will be gained to the site very easily as I am an employee in the high
school in which data will be collected, with the middle school also lending itself well to easy
access since the building is shared between the high school and middle school.
Sampling and Participants
Participants for my investigation include educators (both regular and special education)
willing to participate in surveys and interviews; paraprofessionals are included as well. I will
gather information from educators in two schools on their perceptions of promising practices
(which ones are present, which ones are working, which ones specifically include special
educators and regular educators working together, which ones are being supported by
administrators, which ones are leading to student success in their school), barriers (which ones
are present, what is being done about them, how they are affecting student learning and
achievement, and student success through a survey. I will then interview a smaller number of

BARRIERS TO STUDENT ACHIEVEMENT �19
educators with open-ended questions; ed techs are included as educators, so will be given
surveys and interviewed as well.
This sampling strategy is appropriate for my research design as I am looking to acquire
both perception data and quantitative data with regard to my research questions (above). I feel
this strategy will be effective, especially with perception data, because it includes all educators,
regular and special education, including paraprofessionals; perceptions can be better analyzed
from multiple perspectives.
There could potentially be a sampling bias as this particular study will take place in two
small schools that may include a shared culture that may not necessarily represent the entire
district or geographic region.
I will get participants to participate in my research using two methods. First, there will be
an explanation as to how this could benefit the learning environment for all parties, staff and
students alike including how the information will be shared once the study has been completed.
Second, a compensation for time in the form of a small (in value) gift certificate to a common
and frequented coffee shop near the school will be given to each participant.
Methodology
For this study, I have chosen a mixed-methods approach. I chose this method because the
questions I seek to answer involve both perception data and quantitative data. Benefits include
having two types of data to analyze and make connections with; drawbacks include time
consumption and weak support of theories if one data set is not strong or potentialized.

BARRIERS TO STUDENT ACHIEVEMENT �20
Operational Measures
Surveys and questionnaires for this study will be handled through Email. Interviews with
educators and other participants will take place in person. Signed consent forms will be obtained
when appropriate from participants. Barriers could include: low return rate from teachers, teacher
aides, administrators, etc., unwillingness by participants to be interviewed, and participants not
willing to be openly honest with all questions.
Data Collection
Surveys
Surveys will be sent to regular education and special education teachers, teacher aides,
and administrators. These surveys will collect qualitative data to see what barriers exist, what is
being done about them, what promising practices are present (perception), and how prepared,
supervised, utilized, and supported ed techs are (perception).
I will gather information from educators in two schools on their perceptions of promising
practices (which ones are present, which ones are working, which ones specifically include
special educators and regular educators working together, which ones are being supported by
administrators, which ones are leading to student success in their school), barriers (which ones
are present, what is being done about them, how they are affecting student learning and
achievement), and student success; ed techs are included as educators, so will be given surveys
and be interviewed as well.

BARRIERS TO STUDENT ACHIEVEMENT �21
Learning Data
For this study, I will seek to acquire achievement data that includes classroom
assessments and standardized testing, achievement data for students with teacher aide support
and data for students without support. Achievement data will be collected to see how barriers,
promising practices, and ed techs impact success and to analyze differences among
environments.
I will also gather achievement data on students in special education with perceived strong
and weak teams, and students with and without teacher aides, differentiating between
environments to pinpoint achievement “zones.”
Achievement data will include standardized tests and end-of-level assessments. Other
data will include class size, subject, number of students working at grade level, and number of
students not working at grade level.
Interviews
I will interview regular education teachers, special education teachers, and teacher aides;
interviews will include open-ended questions. Ed techs are included as educators, so will be
given surveys and interviewed as well.
Data Analysis
Information from surveys and interviews will be organized by question and position (role
in school) and coded. Learning data will be collected and compared among classrooms that

BARRIERS TO STUDENT ACHIEVEMENT �22
receive ed tech support, that use promising practices (or do not), and that have a strong team
foundation.
Expected Findings
I believe students with perceived stronger teams (more promising practices and fewer
barriers) and with teacher aide support will be higher achievers than students with perceived
weaker teams and a lack of teacher aide support.
Potential Weaknesses and Issues
One potential weakness of this study is the fact the the schools involved in this research
are small; there are approximately 40 teachers and only five special education paraprofessionals,
with two administrators leading both buildings. One other weakness could be the educational
model adopted by the district in this study; a proficiency-based system is currently in place.
Because proficiency-based schools are the minority, it could be difficult to argue comparisons to
other schools, especially if the comparisons are limited to only schools with proficiency models.
Also, the district being studied has poor data organization, so there could be gaps that will make
analysis less complete. Finally, the district has a high turnover of [some] teaching positions,
administrative positions, and paraprofessionals; perceptions could be from less-informed
individuals.
Issues I may encounter include, for one, lack of participation in surveys and interviews.
With such a small sampling population, it is important to ensure participation is as high as
possible. Additionally, with such a short timeframe to collect data, analyze it, and report findings,

BARRIERS TO STUDENT ACHIEVEMENT �23
there could be a potential hurdle with getting permission for data collection and finding time for
interviews. Finally, because I am a colleague to the individuals I will survey and/or interview,
there could be adverse effects with regard to people not wanting to be completely open with
answers to questions. This, coupled with individuals fearing repercussions from openness, could
be problematic.
Research / Inquiry Narrative
When I began thinking about topics for a masters thesis, I wanted to make sure that I was
doing something worthwhile as opposed to just for the sake of completing an assignment for a
higher degree. Daily frustrations are commonplace in my building, and presumably in
educational environments in general. With the ever-changing nature of educational models and
school leaders attempting to figure out what to adopt or when to adopt a particular type,
preexisting challenges do not disappear, it is the adverse effect, they are exacerbated.
The district I have worked in for the last 10 years has changed models three times, with
the current one being the longest focus. It is not uncommon to hear teachers in my building speak
about feelings of the educational environment changing every two years and express frustrations
about not being able to fully invest in a particular model while feeling this way. Additionally, it is
also common for a stockpiling of ideas and agendas that end up running alongside each other
simultaneously, increasing frustration and lowering morale even more. To be fair, it cannot be
easy for leaders to do what they think is right for students in their district(s) while pleasing the
school community, bigger community, and alleviating the political pressures of this “business.”

BARRIERS TO STUDENT ACHIEVEMENT �24
Let us be honest, a school is a business, and is not the goal of this business to educate students?
Perhaps, but not all would agree.
Currently, I work in what is considered a proficiency-based environment, or PBE. All
students work towards proficiency with the same standards and must complete these standards in
order to receive a diploma. With the Maine Department of Education having adopted this model
and pressuring schools to transition to it within specific timeframes, my school has taken it and
run with it, so to speak. We even have visitors from other states come into our schools to see how
it looks (the model in action) and we even travel to other schools across the country, not just in
Maine, to present our success. With that being said, it is hard to ignore that the challenges faced
before this system was in place are still present, perhaps even more so or to a greater extent.
I work in a high school in a small town with the middle school also being part of the
building, separated only by a hallway. There are approximately 318 students in the high school
and approximately 204 in the middle school. Both schools combined, there are five special
education teachers and around 40 regular education teachers. There are two building
administrators, a principal and a vice principal. With regard to special education, again there are
two administrators, a director and assistant director. Finally, as the PBE model has been
developing over the past few years, there has been high turnover, even at the superintendent
level; we are on our third superintendent in five years.
Returning to my intent of doing worthwhile research and challenges existing before and
now, I decided to focus my study on barriers to student achievement. I explored research on
overcoming barriers to student achievement, using promising practices to combat barriers, and I
even looked at the paraprofessionals (ed techs) with regard to achievement. With the prospect of

BARRIERS TO STUDENT ACHIEVEMENT �25
the PBE model remaining and presenting new challenges, I was also curious about promising
practices (best practice) potentially changing or disappearing with the landscape.
Surveys
To explore some basic questions about preparation, roles, collaboration, and
paraprofessionals, I created a survey for all educators, including a section of the survey
exclusively for ed techs. My original plan that went along with a timeline I had created was to
visit people individually and deliver consent forms and surveys, with the hope that other
conversations would ensue, giving personal and unplanned data. Sometimes, these exchanges
can lead to the most honest, engaging, and informative tidbits.
Now, what actually happened, is that I ran out of time and was challenged with
unforeseen obstacles such as snow days, teacher absences, and lack of interest on the parts of
some educators. The surveys that I could not get in person, I placed in teacher mailboxes and
sent out an email to let people know about the survey and that it would not take very long. It was
set up to be quick, taking the average person under two minutes. This method actually turned out
better than I had anticipated as I ended up getting back 30 surveys (about 60%) from both the
high school and middle school combined. Though I was not able to have the face-to-face
interactions that delivering these surveys in person would have invited, some individuals were
generous with notes and the open-ended question at the end of the survey (see Appendix C).
The consent form that participants signed before taking the interview also opened the door to an
interview, if people so chose, which brings me to my next section.

BARRIERS TO STUDENT ACHIEVEMENT �26
Interviews
The interview portion of my data was my most concerning. I knew from a previous
course how time-consuming transcribing even a single interview could be, though I also knew
how important interviews would be for my research. To be honest, I was not quite sure how
many interviews I wanted, just that I wanted to interview a variety of people, from administrators
to teachers to ed techs. Also, I wanted to make sure I had a somewhat even number of
interviewees in the middle and high school.
Similar to my challenges with the surveys, I was faced with the reality of time
constraints. I had to get creative with some of the interviews and luckily I had a large pool of
individuals seemingly interested in participating as they had in the survey. I conducted as many
sit-down, face-to-face interviews as possible, for a total of seven. The remaining interviews were
conducted via personal Google Docs. I created a private document for each remaining interested
individual that included the interview protocol, or questions. Participants were able to type their
answers and I was able to receive them in real time. This method allowed me to get an additional
five interviews completed, with more still coming in as I type this.
Content-wise, the interview questions were written with my three core questions in mind,
covering the concepts of: overcoming barriers to success by using promising practices, the
impact of barriers on student achievement, and the impact of ed techs on student achievement
(see Appendix D). Interviewees were asked questions ranging from their position in the school to
practices leading to student success in their building. Questions also included perceptions about
the usefulness of ed techs and even risqué questions such as if the individual was on a weak or
strong team. The interview protocol contained a total of 26 questions (which proved quite time-

BARRIERS TO STUDENT ACHIEVEMENT �27
consuming to transcribe and code). However, even with such a large number of questions and
accompanying survey data, I still wanted to dig deeper and look at quantitative learning data,
hence the mixed-methods approach to my entire research study.
Learning Data
Teacher Pace Data
At my school, we have a document that is accessible to all educators and emailed to
parents each Friday. This document, for educators, has each student listed, and each class they
attend. Teachers are able to write if a student is behind in a class and to what extent. The degree
to which student is behind is labeled as such in each class: BP = behind pace, SBP = seriously
behind pace, and DBP = dangerously behind pace. The latter means that a student will probably
not pass the semester or course. As an educator in the school, I had pre-existing access to this
data before my research project began, so there was no need to request permission for access.
The pace document is useful for my study because it allows me to view the current
success of each student, with and without an IEP. Since a significant portion of my research
involves student achievement, the pace document allows me to see current achievement by
teacher, subject, team, etc. It is very easy to pinpoint zones of success and lack thereof. This is
especially helpful for my ed tech research because I can easily spot classes with and without ed
tech support.

BARRIERS TO STUDENT ACHIEVEMENT �28
PSAT/SAT/NWEA Data
The final piece of the puzzle for my research is standardized testing, specifically SAT
scores. Just as the pace data, I am able to access SAT data at any time through district software.
For NWEA data, I was able to acquire three years of scores from the district curriculum
coordinator in order to look for overall trends. Though I can personally access SAT data, it is
only the most recent scores. For past scores, again three years’ worth, I had to email the
curriculum coordinator and was able to get a spreadsheet with data.
Standardized testing scores are investigated to aid in the overall picture of student
success. Achievement data also includes end-of-level assessments and number of students
working at grade level. The main point to gathering standardized testing and assessment data is
to see the impact barriers (the ones that surfaced during surveys and interviews) have on student
achievement.
Conclusion
With many options to consider when researching or investigating a phenomenon, it is
important to maintain the original focus of the research question(s). Since I set out to find
answers to and make connections with barriers to student achievement, I felt I needed both
qualitative and quantitative data, in the form of surveys, interviews, and achievement data, with
surveys and interviews used to have conversations about barriers, and achievement data to see
the actual impact of the same, perceived barriers.

BARRIERS TO STUDENT ACHIEVEMENT �29
Data Analysis / Interpretation of Findings
Surveys
For this mixed-methods study, surveys, interviews, and learning data were explored. The
survey (Appendix C) was meant to briefly gather initial perceptions of general topics that served
as a segue to the more in-depth questions included in the interview protocol, and ultimately tie to
learning data for final analysis. It was the hope that many or at least some participants of surveys
became interviewees. This was the case. Of the 30 surveys that were returned, 12 individuals
(40%) decided to participate in an interview.
With this study taking place in a grade 6-12 setting, educators from both levels
participated. Out of 30 surveys, 15 educators were high school staff members, nine were middle
school staff members, three were administrators, and the final three fell into the “other” category
(counselor, librarian, alternative education). Additionally, goals were to (a) make sure all content
areas were represented, (b) make sure both special education and building administration was
represented, and (c) make sure all ed techs were included; with only five special ed techs in the
6-12 setting, this seemed a reasonable expectation.
Surveys included six questions, two of which were specific to information about ed techs.
Teachers without ed techs in their classrooms were to not answer these two questions, unless
they felt strongly about observations they may had made in the environment with regard to ed
techs working in classrooms. A separate portion of the survey was created specifically for ed
techs to answer with perceptual topics ranging from preparedness to training needs. A final
question for ed techs was open-ended, a question about areas of training interest. This was the
BARRIERS TO STUDENT ACHIEVEMENT �30
only open-ended question included in the survey. All other questions were answered using a five
point rating system (see Appendix C).
Question 1 on the survey asked educators if they felt prepared when they first entered the
field. Of the 24 people that rated this question, the majority (37.5%) felt they were a fair amount,
and the remaining individuals were split among ratings 2, 4, and 5 (20.8%). No one felt they
were not at all (a rating of 1) prepared for their job(s).
Questions 2 and 3 asked about coworkers understanding the individual’s role and their
own role being understood by themselves, respectively. The majority of participants (37.5%) felt
their coworkers understood their roles a fair amount, and 50% of participants felt they
understood their own role quite a bit (a rating of 4).
Question 4 asked educators about the extent of collaboration with fellow colleagues. The
majority (29%) rated this question a 4, or quite a bit with only one person answering that this
does not happen at all.
Questions 5 and 6 were about ed techs being valuable in the classroom and increasing
student success. An overwhelming majority, 52.6% for question 5 and 52.9% for question 6,
answered both questions with a rating of absolutely. This provides evidence, at least perceptually,
that ed techs are valued in the classroom and do in fact increase student success.
With regard to the ed tech-exclusive section of the survey, six individuals participated.
Though this seemingly does not equal the amount of the above-mentioned special ed techs in this
6-12 setting, five of the surveyed ed techs are special ed techs and one is a library ed tech and
does have a different role than the other five.

BARRIERS TO STUDENT ACHIEVEMENT �31
The survey included eight questions directly related to ed techs. First, ed techs were
asked to rate their feelings about being well-trained. Ratings ranged dramatically even with only
a small number of individuals. 16.6% felt only somewhat well-trained, 33.3% felt they were
well-trained a fair amount, 16.6% felt they were well-trained quite a bit, and 33.3% felt they
were absolutely well-trained.
The next question, 2, revolved around feeling supported by leaders or immediate
supervisors. The ratings were perfectly split with 33.3% from ratings 2 to 4. Question 3 asked
about continuing development or opportunities for professional development. An overwhelming
amount of individuals (83.3%) rated this question with a 2 for only somewhat with only one
participant feeling that opportunities are offered a fair amount of the time.
Question 4 was meant to look at utilization, or the ed techs being used in a capacity that
caters to the role and to student success. Half of the participants (50%) felt they were well-
utilized quite a bit, giving a rating of 4 with the remaining two individuals giving ratings of 3 and
5.
Question 5 asked ed techs to give a rating about being [positively] impactful in the
learning environment. Just as with question 2, the ratings were evenly split with 33.3% of
individuals rating from 3 to 5. It is important to note here that the implication is that ed techs feel
they are impactful to a great extent, tying in with teachers’ perceptions from the first part of the
survey that, according to the majority, they are valuable and increase student success.
Question 6 was about ed techs feeling well-guided with regard to their roles and day-to-
day activities. This interestingly ranged significantly, with 50% feeling only somewhat guided,
but with 16.6% feeling a fair amount of guidance and a 33.3% feeling absolutely guided. The

BARRIERS TO STUDENT ACHIEVEMENT �32
final rating question, 7, asked about trained needs being met, a very similar question to
continuing development (question 3), though this question was meant to be more about being
trained for the job role preemptively. Perhaps not coincidentally, mirroring the results of question
3, the results of question 7 showed 83.3% of participants rating this question with a 2 for only
somewhat with one individual (16.6%) rating this question a 3 for a fair amount.
The final question, as stated earlier, was the only open-ended one on the survey. Ed techs
were asked what areas of interest they had with regard to training. The answers were all very
different and included: forming relationships, establishing boundaries, using technology, working
with students on transition-related activities, giving math support, working with students with
behavioral challenges, working with students with Autism Spectrum Disorders (ASD), and
learning about anything!
Interviews
As stated in the survey analysis (above), 12 individuals agreed to participate in an
interview. These 12 individuals also completed a survey, so were from the same pool. Among the
12 participants, there were four high school staff members, five middle school staff members,
and three administrators. Unfortunately, only math and science content areas were represented,
though most ed techs and both building and special education administrators were represented as
well. Just as with the surveys, there were goals to include as many content areas as possible,
administrators, and all ed techs, and even to make sure there was a somewhat even number of
participants in both the middle and high school. With time constraints, it was unreasonable to
expect a similar number as survey participants. Time constraints also limited the number of sit-

BARRIERS TO STUDENT ACHIEVEMENT �33
down interviews as a few had to be conducted through private Google Docs. Regardless, the data
gathered through the interview process was very informative and even included some new ideas
that expanded beyond the core focus of this research study.
The interview protocol (Appendix D) comprised of a hefty 26 questions. Some were only
meant to be short answers (a few even yes/no) as others were meant to lead to solid discussions
tying into the research questions. Question 1 simply asked about position, and question 2 asked
about length of time in stated position. Participating educators ranged in experience from five to
35 years. Two of the three administrators that were interviewed, however, spent most of their
educational careers elsewhere. The majority, though, have been at the schools used in this
research study for their entire career.
Next, interviewees were asked what they knew about special education services in their
respective buildings. Most individuals stated that they knew quite a bit, with consistent examples
such as knowing that each student has an IEP, knowledge of the special education referral
process, students receiving accommodations with school-related activities, and academic
assistance being offered by the special education staff. Aside from the few similar examples,
answers seemed to vary quite a bit. Not surprisingly, administrators had the most thorough
answers, though disappointingly, ed techs seemed limited in their knowledge of services. With
past research providing evidence of ed techs not being effective coupled with ed tech perceptions
strongly leaning towards a lack of pre-training, guidance and professional development, perhaps
there is a connection here that ed techs simply are not informed to the extent that they should be
with regard to knowledge about services, especially when it come to IEPs. Most ed techs
answered that they know to provide services to students with IEPs, but follow-up information

BARRIERS TO STUDENT ACHIEVEMENT �34
exposed lack of understanding of the actual IEP document. One ed tech even stated that they do
not read IEPs and will ask if they have questions. But, what if they simply do not know that a
question needs to be asked? Is it a good idea to have ed techs work with students blindly or at
face value without reading about or learning about the “whole child”? Vital information can be
easily missed. Finally, classroom teachers seemed to know the essentials, such as a student
having an IEP and that they are allowed accommodations via this legal document. Other bits of
information revolved around knowing the special education staff, what they do, and when to
collaborate.
Question 4 boldly asked interviewees if they felt they understood all aspects of the
special education field. Again, there were some consistent examples of understanding such as
knowing who to ask when there is a question and the paperwork side of things being an area of
weakness. However, answers also once again varied as well. Perhaps the most promising answer
was about it not being possible to understand all areas as the field of special education (and
education in general) as the “land” is constantly changing. On the flip side of things, the
difficulty of IEP language surfaced. This has most likely been a challenge for decades, especially
since special education teachers are the ones writing the IEPs and doing their best to ensure
follow-through with regard to services. Time constraints, technical wording, and IEP structure
are certainly barriers for non-special education teachers.
Question 5 asked participants to share what they felt were the benefits to special
education services. Most answers were very similar, and basically came down to students
receiving support to level the playing field when included with same-age, same-grade peers and
not letting disabilities become barriers to success. Ed techs came up in one discussion, with a

BARRIERS TO STUDENT ACHIEVEMENT �35
statement about ed techs being the only reason, in some instances, that students are successful in
the mainstream setting.
The next question was basically a two-in-one, asking individuals about skill level with
regard to successful, special education implementation and if they also had the resources to do
so. Many educators did answer with a yes to both parts, though some very informative data
surfaced as well. Resources seemed more of a barrier than skills with interviewees listing things
such as feeling unprepared, being short-staffed, regular education teachers being overloaded with
students with disabilities without enough support, and not having enough time, training, or
support. A big statement with huge implications that was made revolved around more
interventions taking place if more staff were had, perhaps eluding to a faulty or weak route to
intervention (RTI) process that, if addressed, could lessen the number of students entering the
IEP referral process. Finally, there was an interesting statement about strategies that work for
students with disabilities usually work well for students without, sometimes giving teachers
global tools when a skill is developed for working with students in special education.
Question 7 included two educational models: differentiation and co-teaching. The
question asked most importantly if there was effectiveness with these models in the participants’
respective buildings. First, looking at differentiation, several people answered that this model is
happening in some rooms and with some teachers and that it is being done well and does help
students. An example was even given by one participant, that proficiency is allowed to be shown
in different ways with some teachers. This ties directly to the current educational model of this
district, a district that is moving towards hands-on, applied learning with the students finding
success in ways other than what is considered traditional such as outside-the-school opportunities

BARRIERS TO STUDENT ACHIEVEMENT �36
and projects they create. Other interviewees offered views of barriers to differentiation, such as
no time to plan due to excessive workload and not enough differentiation happening in order for
it to be effective. Finally, the overall consensus with regard to differentiation was that no matter
the current level of effectiveness or existence, it has increased since the recent past.
The other model, co-teaching, generated similar answers with regard to this model being
present and being effective. Responses included: in some rooms, knowledge of it happening in
other schools, little to none, there are effective instances, the model is not system-wide, there is
limited implementation, do not know, and have witnessed it. One individual mentioned that the
extent of co-teaching they experienced was being given a goal by a teacher, then helping the
student to reach it. Yet another participant mentioned that two content areas in the middle school,
social studies and English, frequently have co-teaching in place to present cross-curriculum
opportunities. Overall, the perceived idea of the model being in place and effective was
inconsistent at best.
The next question asked educators about inclusion, or more specifically how they felt
about the inclusion of students in the mainstream classroom setting who have disabilities, with
regard to the impact this has on student achievement. This question generated some great ideas
and also ranged from answers about situational success (depending on classroom and teacher) to
great success globally. Some positive impacts included not only academic impacts, but also
esteem impacts. A few educators reported seeing students with disabilities feeling included,
experiencing fuller social development, building confidence, raising the bar for themselves, and
even exposing skills that would not otherwise surface if sheltered from the mainstream setting.

BARRIERS TO STUDENT ACHIEVEMENT �37
Some perceived challenges or barriers were reported during interviews as well. These
included things such as special education students not having sufficient background knowledge
to keep up with the rigor of the mainstream standards. Another barrier discussed involved
teachers lacking the skills to work with students with special needs. Some others believed a one-
to-one ratio is the best option for students with disabilities, at least at times, and especially if
distractions are an individual challenge for a particular student. One interviewee was concerned
that behavioral challenges could surface, creating a disruptive learning environment for all
students. Still another participant insisted that the mainstream setting for students with
disabilities can be detrimental by creating unrealistic expectations and can even be embarrassing.
This response was similar to another, with the interviewee stating that inclusion for students with
disabilities could cause academic hinderance and shutting down. A final perceived barrier was
that teachers could become complacent with high levels of inclusion.
Positive ideas, or suggestions for improvement if you will, generated from this question
included first the idea of success increasing if more inclusion or blended classrooms contained
additional adequate supports. Second, another individual suggested that if special education
teachers were to co-teach in a specific room with students he or she works with, then greater
success could be had by the student in a pull-out setting in addition to the mainstream setting.
Finally, to conclude these ideas, one participant stated that inclusion is always worth trying
without worrying about the impact on general education students because the effect can be
positive most of the time or, at worst, have no effect at all.
Next, when interviewees were asked if they believed they had the skills to get results with
regard to student success (teacher efficacy), “yes” was the resounding answer, though many with

BARRIERS TO STUDENT ACHIEVEMENT �38
a few stipulations. Some individuals felt they were able to utilize their skills more effectively if
students were not forced to achieve at higher levels than they were actively at while others listed
barriers such as time constraints, interruptions, student readiness, and lack of understanding of
subject matter, and failure to connect with particular students. Finally, participants made it clear
that experience is key when it comes to teacher efficacy, and getting results oftentimes depends
on making learning relevant.
Question 10 was of utmost importance as it tied directly to the large research questions.
When asked about present barriers to success, answers included the following:
• student motivation
• graduation requirements too great for some
• culture of poor work ethic & behavior
• electronic distractions/technology
• ineffective schedule structure
• teachers not seeing students as people who come from a variety of situations
• not all teachers following IEP accommodations
• philosophy of the system
• administrative blinders
• guaranteeing equal success
• skill level of instruction in the regular education setting
• teacher comfort with differentiation
• knowing how to work with students with emotional behavioral disorders
• lack of instruction around social/emotional development

BARRIERS TO STUDENT ACHIEVEMENT �39
• skills to work with students with autism
• family & home life
• students moving with peer population even if not successful (common with middle school
students)
• teachers not wanting to or capable of working with a student
• inflexibility by educators
• excessive amount of work to meet standards
• self-advocacy
• large socioeconomic diversity
• poor attendance
• hard to access learning with poverty, drugs, and mental health issues
• communication - need to move beyond electronic or find more effective ways with tech.
The first follow-up question to existing barriers asked how these barriers affect student
achievement. The theme, not surprisingly was that they hinder success greatly. More importantly,
however, were the explanations as to how. These explanations are what can lead to understanding
and change. Some participants were concerned with the amount of busy work the average a
student has, and how difficult this extra work is to complete for students with disabilities.
Additionally, it was expressed how low home expectations can mean low achievement. Further,
it was stated how success is becoming rarer, and how technology is more important than learning
for many kids. Also, many teachers were concerned that they have to focus more on poor work
ethic and behavior instead of instruction, and with the current educational model, teachers are

BARRIERS TO STUDENT ACHIEVEMENT �40
facilitators, with many teachers finding it difficult to find a balance between instruction and
facilitation, causing students to feel or be less supported.
The second and final follow-up question to existing barriers asked interviewees what was
being done about barriers. One participant stated that the school is starting to work on a system
of intervention, while another discussed incentives being in place, though this only happened at
the middle school level. A few educators perceived that nothing was being done about barriers,
that they were not sure if anything was being done, or that barriers were not recognized. Other
answers included adjustments to daily schedules and some social media being blocked in the
environment, such as Facebook. Some positives included increased communication and a district
goal of cultivating hope in students. Finally, some great ideas that came from this question as
well. One idea was to expand the Jobs for Maine Graduates (JMG) program to the middle school
level and another idea was to expand college career counseling broader than the guidance office.
The last idea was to find or create internship opportunities for nontraditional students, getting
them outside the building and in the presence of hands-on learning opportunities.
The next question asked educators to comment on their use of new knowledge versus old
knowledge with regard to which they used the most. Answers included such ideas as having to
seek new knowledge in order to not become stagnant, and how research and laws are constantly
changing in special education so there was no choice but to use new knowledge. Final answers
included: only if new knowledge was useful, time constraints interfered with gaining new
knowledge, new must be understandable, and some new knowledge was challenging to
implement so was a turn-off.
BARRIERS TO STUDENT ACHIEVEMENT �41
Another barrier that may be present in an educational environment is how well the staff
work together, or collaborate. Question 14 asked interviewees to comment on this in their
environments. Resoundingly, almost all participants stated that they work very well with one
another, both regular educators with special educators and vice versa. Many regular educators
felt very comfortable with the approachability of the special education staff and stated they could
go to them at any time with any question or concern. As a side note, administrators tended to lean
more towards risk-takers and innovators with regard to collaboration.
The next question looked a strong and weak teams. Individuals were asked how they felt
about their immediate teams with regard to strength, flexibility, skill, diversity, and leadership,
and why or why they did not feel their particular team was strong or weak. The majority felt their
teams were mostly strong, though a few did point out that weaknesses are present on some teams
and in certain instances, though not to a detrimental extent and not to such a degree that
weaknesses cannot be addressed in order to change and strengthen. The strongest teams seemed
to be the ones that met often, at least once a week. Additionally, data-focused teams were
perceived as the strongest. Characteristics of strong teams were consistently listed as: are diverse
with regard to skill, care and empathize, solidly communicate, listen openly, delegate and
compete tasks, and have a great sense of humor.
Question 16 asked interviewees how clear expectations were from district leaders with
regard to research-based practices. Many educators felt they had no direction in this area. Some
stated that there is contact in workshops, but minimal with regard to time, explanation, or clarity.
Still others stated that they were clear and that the current model (proficiency-based) is the focus,
as well as applied learning opportunities. A few felt that the model has changed too often in the

BARRIERS TO STUDENT ACHIEVEMENT �42
last few years, about every two to five years, though this one seemed to be staying. Also, since
this school is a frontrunner for the current educational model, it is creating the research as it goes
along, so some felt research-based practices were not necessarily mentioned. Finally, ed techs
felt left out and not clear on goals other than what they heard daily within the environment,
especially since they do not attend staff meetings.
The next question focused on evaluations and opportunities to increase skills via
professional development and other such activities. Most individuals, with the exception of ed
techs, felt they were given the necessary opportunities to increase skills, and also that with the
current model in place, evaluations have become more conversational than written. Getting back
to ed techs, most felt that they were not given adequate opportunities for development, especially
with regard to opportunities being tailored toward or suited for them, specifically.
Interviewees were then asked what promising practices were present in their building.
Though a few people listed typical promising practices such as scaffolding, interventions and
skill remediation (this one specifically with special educators), some commonalities were in
regard to the proficiency model with students being able to work at their own pace. Aligning
with this idea was the mention of applied learning opportunities which have allowed (in very few
instances thus far) and will allow for display of proficiency with specific learning targets and
measurement topics in creative or alternate ways other than traditional classroom expectations.
While this all sounded fantastic, some educators were concerned about effective promising
practices disappearing, such as direct instruction. Finally, as a side note, one of the goals of the
district was to increase connections with students and find ways to instill hope. The idea was for
this to become a common practice.

BARRIERS TO STUDENT ACHIEVEMENT �43
Participants were then asked if the previously-mentioned promising practices were
effective and why or why not. Many people stated that the practices were effective for some
students but not others. One individual mentioned a concern with kids falling behind and no plan
to bring forward (which ties into the learning data from the pace document that will be explored
later). Some participants saw direct instruction beginning to increase with more collaboration
between special and regular educators. Another interviewee stated that practices were effective
when implemented correctly and authentically, not just ticking boxes to get things done; bringing
more excitement into the classroom was also key in this instance. Finally, the proficiency model
was stated by some as being great for high achievers but not so much for low achievers. High
achievers were moving through the system quickly and even taking advanced placement (AP)
and college courses with low achievers or students with learning, executive, or processing
challenges still working on courses well below grade level. This led to a discussion about
diplomas and the possible necessity for two as opposed to one, proficiency diploma. This has
huge implications as there is much controversy looming over proficiency systems in this regard
especially with students with IEPs.
An important revelation that came from practices and effectiveness involved deep
learning versus surface learning. Some educators were concerned that teachers would become
facilitators more than instructors and that students would suffer by not receiving instruction that
leads to in-depth learning. Some pluses, however, were discussed as well with one being that
interventions of non-IEP students were showing movement or improvement (RTI?). Another plus
that surfaced was the proficiency system forced autonomy, which is a good life skill for college
and beyond. And, after administrators meeting with past graduates, it became clear that some

BARRIERS TO STUDENT ACHIEVEMENT �44
were not prepared for mid-terms and finals. However, even with that being the case, some
graduates stated that some college courses seemed like repeats of courses they took in this
school. Additionally, other graduates stated that by having taken dual-enrollment courses in high
school, some time was shaved off of college. Finally, some graduates stated that this school
taught them how to think.
The next question was designed to follow the previous set of questions and was very
important as it tied directly to my original research questions. It asked educators how they could
use promising practices to overcome barriers and increase student success. Some educators
stated that practice is key, and that trying different things with different students eventually nets
success; what works for one may not work for another. Others stated that the proficiency system
is designed to overcome barriers, though test scores have not reflected this yet. Also, one
administrator stressed the frustration of barriers being extenuating and not about the school,
including poverty and mental health challenges, and that perhaps having a bigger system
Licensed Clinical Social Worker (LCSW) support in place could begin a trend towards
improvement. Also, some stated how administrators were looking for creative ways to measure
success so that all students are not held to the same activities. And finally, a common answer was
that, with regard to students with special needs, pairing accommodations with best practice lead
to success.
Interviewees were then asked about the impact of appropriately-prepared teacher aides
(ed techs) on student achievement. Answers were extremely positive with many participants
stating how crucial the ed techs were in the school environment. Ed techs were labeled as being
the first line of intervention, doing the “trench work”, and knowing the students best. A few
BARRIERS TO STUDENT ACHIEVEMENT �45
teachers stated that more collaboration should be happening because the ed tech model was
highly successful if ed techs were connected to teachers and students as one, solid team. Some
other positives that were discussed included ed techs guiding the learning process and discussing
strategies with other educators. One statement was made that when students knew they had
someone to reach out to for support, they did. Ed techs themselves answered with statements
such as there being an understanding by other educators that there must be a period of time for
adjusting and learning in addition to having more opportunities for improving. Yet another
educator stated that kids simply would not make it without ed techs. The only negative that
surfaced from this question was about ed techs providing too much assistance, a concern that if
materialized as reality could be detrimental to student independence and autonomy. A great idea
that came from this interview question is that there should be something in place such as a six-
week course to help with preparing ed techs before working with students and other educators.
The overall feeling from interviewees was that it was time to stop treating ed techs as second
class citizens and more like equal team members, recognizing their crucial role in the school.
The final interview question opened the door for last comments, questions, or concerns.
Most participants chose to end the interview here, though one individual stated that there must be
a connection between resources, district philosophy, and tools used to implement said
philosophy. Final thoughts included how disheartening it was that standardized testing was still
in place and how students should be measured on other things. It is time to move on if education
is to evolve the way many believe it should.

BARRIERS TO STUDENT ACHIEVEMENT �46
Learning Data
Teacher Pace Data
The teacher pace data displayed some very disturbing trends, though also ones that carry
large implications. For this portion of the research, each data set was looked at first by grade,
then by school (middle and high), then finally overall. All populations discussed were students
with IEPs unless otherwise noted.
With regard to the three middle school grades, the sixth grade class included six students
with two out of six (33.3%) behind pace in English, science, and band. The remaining four
(66.6%) were on pace in all classes. The seventh grade class (made up of 10 students) was quite
different, with all 10 students (100%) behind pace in a variety of classes including: English,
math, science, social studies, world language, and physical education (mainly the written
component). Rounding out the middle school classes were the eighth graders, which comprised
of 12 students and, like the seventh graders, all (100%) were behind pace in classes such as
English, math, science and social studies. Overall, most of the middle school class of students
with IEPs were behind pace, 24 out of 28 (85.7%), and only four were working at teacher pace.
Making up the class of 2020, were 18 freshmen at the time of this research study, 11
males and seven females. 91% (10 out of 11) of the males were behind pace and 100% of the
females, with a combined behind pace percentage of 94% (17 out of 18 students). All were
behind pace in two or more classes with the majority dangerously behind pace in one or more
class(es). Three males were below grade level in English and one female and two males were
below grade level in math. Also, there were no perceived weak teams working with the freshman

BARRIERS TO STUDENT ACHIEVEMENT �47
class, though there were challenges mentioned with regard to teachers understanding
accommodations. Finally, most students had ed tech support in most of their classes.
The class of 2019 was made up of 15 sophomores, 11 males and four females. just as the
freshman class, 91% (10 out of 11) of the males were behind pace and all of the females (100%)
with a combined behind pace percentage of 93% (14 out of 15 students). Of the 15 sophomores,
two were not attending and one was in alternative education in a different building than the rest
of the student population. Finally, most were below grade level in at least one content area.
The juniors making up the class of 2018 was the first class to be held to the standards of a
proficiency-based diploma. This class was made up of 16 students, 11 males and five females. 10
of the 11 males (91%) were behind pace and all five females (100%) were behind pace,
combining to a 94% of students behind pace (15 out of 16). Of the juniors included, two were not
attending and another two showed extremely low attendance. A minority, however, of the junior
class were below grade level in content-area classes.
The final class for this research study was the senior class of 2017, made up of eight
students, six males and two females. Seven of the eight (88%) were behind pace, five of the six
males (83%) and both females (100%). Also, of the eight seniors, one was not attending and two
were in danger of not graduating. Overall, looking at the high school as a whole, there were 57
students with IEPs and, like the middle school class, only four on pace; 53 out of 57 (93%) were
behind pace. When combining the entire 6-12, there were a total of 85 students with IEPs and 77
of them were behind pace (90.5%).

BARRIERS TO STUDENT ACHIEVEMENT �48
PSAT/SAT Data
For PSAT and SAT data, only the classes of 2017 and 2018 were reviewed. In the high
school used for this research study, the sophomores typically take the PSATs and the juniors the
SATs. Of course, there are opportunities to take these tests at different times if a student or family
so decides. However, with regard to the PSATs, the current juniors (class of 2018) were looked at
as the SAT scores were not yet available for the juniors at the time of this study. This class had a
total of five students with IEPs that took the PSAT, including two males and three females. The
PSAT was separated into reading & writing and math, two sections that allowed a maximum of
800 points each, for a combined total possible points of 1600. The junior class had an average
reading & writing score of 498 and an average math score 424. The combined average score was
846. The class average that included both students in special education and regular education
showed scores of 500 in reading & writing and 464.5 in math with a combined average score of
964.5. When comparing the scores of students with IEPs to the entire class, all scores were lower
for students with IEPs, with the reading & writing average score being two points lower, the
math average score being 40.5 points lower, and the combined average score being 118.5 points
lower.
The class of 2017, the current seniors, were used to look at SAT scores. There were a
total of eight students with IEPs, but only seven who scores were available for, including two
females and five males; the eighth student with no scores was male as well. Additionally, and
perhaps not very useful for the sake of this research study, score breakdowns (reading/writing
and math) were available for only one female and two males. The remaining students only had
combined scores listed. Just as with the PSATs, the SAT was separated into reading & writing

BARRIERS TO STUDENT ACHIEVEMENT �49
and math, two sections that allowed a maximum of 800 points each, for a combined total
possible points of 1600. The average score for the reading & writing section was 506.66 and the
average score for the math section was 473.33, with a combined average score of 872.86. The
class average that included both students in special education and regular education showed
scores of 509.5 in reading & writing and 498 in math with a combined average score of 1009.
When compared to the entire class of students with and without an IEP, all scores were lower for
students with IEPs, with the reading & writing average score being 2.84 points lower, the math
average score being 24.67 points lower, and the combined average score being 136.14 points
lower.
As mentioned in the teacher pace section (above) this junior class is the first to be held to
the standards of a proficiency-based diploma. With that being said, it is important to note that the
SAT scores were stronger for the seniors than the PSAT scores for the juniors. For the students
with IEPS, the reading & writing section for the juniors showed a negative score difference of
8.66, a negative math score difference of 49.33, and a negative combined score difference of
26.86. Finally, with regard to all students, not just those with IEPs, the SAT scores were again
stronger for the seniors than the PSAT scores for the juniors. The reading & writing section for
the juniors showed a negative score difference of 9.5, a negative math score difference of 33.5,
and a negative combined score difference of 44.5.
NWEA Data
NWEA tests use Rausch Unit (RIT) scores. All scores are independent of grades levels,
so an increase in score is an increase in score. These scores also range from around 140 for

BARRIERS TO STUDENT ACHIEVEMENT �50
kindergarten to around 220 for grade nine. The norms associated with each grade level relates to
where a student should be with regard to instructional level. Therefore, if a student in grade four
has the same RIT in math as a student in grade seven, it simply means they have the same
instructional level in math. Also, NWEAs are usually given twice in a school year, though there
are a few gaps with the data for the group used in this school, specifically in grades 3, 4, and 5,
and with the exception of fall math scores, data was not yet accessible for the current ninth
graders when this study was underway; the school used for this research project ends NWEA
testing with ninth graders.
For NWEA data, only the high school was accessible and analyzed, covering (at the time
of this research study) freshmen (class of 2020), sophomores (class of 2019), juniors (class of
2018), and seniors (class of 2017). Each class had data all the way back to grade 3, so it was easy
to see trends and also compare scores to the norms. NWEA tests for this group were similar to
PSATs and SATs in that they contained two parts, reading and math. Additionally, NWEA data
for this study represents entire class groups as individual scores were not retrieved, therefore all
students, those with and without disabilities, were included.
With regard to the freshman class, no significant scores stood out over the span of grade 3
to grade 8. Scores did, however, remain between one to five points below the norm scores over
the years in both reading and math, and only scores during the eighth grade year did not show
improvement from fall to spring, scores actually fell. The eighth grade scores for the current
freshmen were as follows:
math - 224.6 fall, 222.82 spring
norms - 226.3 fall, 230.9 spring
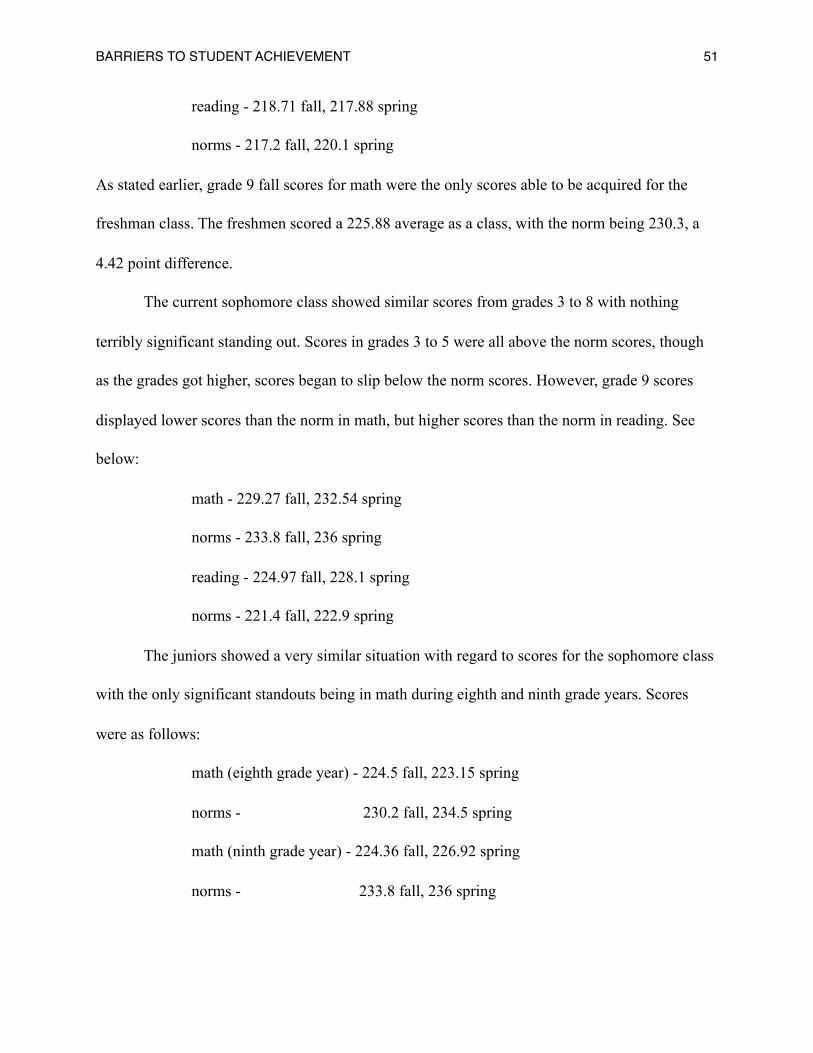
BARRIERS TO STUDENT ACHIEVEMENT �51
reading - 218.71 fall, 217.88 spring
norms - 217.2 fall, 220.1 spring
As stated earlier, grade 9 fall scores for math were the only scores able to be acquired for the
freshman class. The freshmen scored a 225.88 average as a class, with the norm being 230.3, a
4.42 point difference.
The current sophomore class showed similar scores from grades 3 to 8 with nothing
terribly significant standing out. Scores in grades 3 to 5 were all above the norm scores, though
as the grades got higher, scores began to slip below the norm scores. However, grade 9 scores
displayed lower scores than the norm in math, but higher scores than the norm in reading. See
below:
math - 229.27 fall, 232.54 spring
norms - 233.8 fall, 236 spring
reading - 224.97 fall, 228.1 spring
norms - 221.4 fall, 222.9 spring
The juniors showed a very similar situation with regard to scores for the sophomore class
with the only significant standouts being in math during eighth and ninth grade years. Scores
were as follows:
math (eighth grade year) - 224.5 fall, 223.15 spring
norms - 230.2 fall, 234.5 spring
math (ninth grade year) - 224.36 fall, 226.92 spring
norms - 233.8 fall, 236 spring
BARRIERS TO STUDENT ACHIEVEMENT �52
Not only did scores fall the eighth grade year from fall to spring, they also fell from fall of the
eighth grade year to fall of the ninth grade year. Also, scores were well below the norms for both
years in the fall and in the spring. With math scores for juniors being the most standout scores
thus far, it is hard to ignore the ties with being the first proficiency-based diploma class.
The current seniors rounded out the NWEA data for all groups. As the final class to
graduate with a traditional diploma, scores spanning from grades 3 to 8 were quite strong almost
every year and in almost every part of each year, both fall and spring. Additionally, growth was
shown, without exception, every year and every fall to spring. As an example, grade 9 scores for
seniors are on display below:
math - 235.1 fall, 235.43 spring
norms - 233.8 fall, 236 spring
reading - 223.4 fall, 225.21 spring
norms - 221.4 fall, 222.9 spring
What, then, are the implications for students following the current senior class? What surface
conclusions can be drawn from such specific learning data that tie with perceptual data?
Conclusions / Implications
So, what is the impact of barriers on student achievement? The obvious answer here is
that barriers impact achievement greatly. It is more important then to look for explanations as to
how barriers affect achievement. For starters, the school used for this study is working within a
proficiency-based environment. With this comes potential busy work. Too much of this,
especially if not needed or connected to learning targets or measurement topics, is needless. This
BARRIERS TO STUDENT ACHIEVEMENT �53
also ties to comments about staff concerns of direct instruction lessening or disappearing. Could
this be the culprit causing the busy work? Maybe, however there are bigger things at work here.
It surfaced during this research project that some teachers are having to focus on poor
work ethic, distracting behavior, and technological barriers (students on social media and playing
games) instead of instruction, which is especially concerning in an environment that already has
teachers facilitating learning, unlike traditional teaching models. Also, nontraditional students
that do not work well in classrooms appear to be increasing, adding to work ethic and behavior
challenges. It is more imperative than ever then, that alternative opportunities for learning exist
for all students, learning that goes beyond the surface and offers in-depth knowledge attainment.
Perhaps internships and hands-on learning opportunities outside the classroom should be sought,
not just spoken about. Would this not tie directly to a proficiency environment that prides itself
on the idea of creating applied learning opportunities for students?
Another impact of barriers on achievement came in the form of low test scores. One
administrator mentioned during an interview that though this current model was in place and
meant to overcome barriers, test scores have yet to support its existence. Looking at the 6-12
group as a whole and aside from a mention of challenges with regard to teachers understanding
IEP accommodations (only one instance and with the freshman class), PSAT and SAT scores
were all lower for students with IEPs. Additionally, SAT scores for seniors were stronger than
PSAT scores for juniors. This rang true of the entire respective class of each, not just students
with IEPs.
As discussed in the learning data analysis, it is important to keep in mind that the current
juniors are the first full proficiency class with the expectation of graduating with a proficiency

BARRIERS TO STUDENT ACHIEVEMENT �54
diploma while the current senior class will be the final traditional class. Continuing the trend of
stronger test scores with seniors over juniors, NWEA scores displayed similar evidence. The
juniors achieved much less over the years than the seniors. Finally, with regard to learning data,
most students in grades 6 through 12 with IEPs were behind pace in classes. With the exception
of students in the sixth grade (33% not on pace), grades 7 through 12 ranged from 88% to 100%
of students not on teacher pace. Moving forward, especially if this model is to remain, it will be
extremely important to closely monitor these trends.
Important to note before concluding the impact of barriers is the lessening of staff,
specifically with regard to ed techs. Positions have become fewer in the school used for this
study, though need has risen. The notion that interventions are necessary even before a referral to
special education becomes irrelevant when short-staffed. The response to intervention (RTI)
process can and oftentimes does include ed techs with regard to supporting all students, not just
those with disabilities, with the understanding that students with IEPs are the primary focus for
ed techs. There will be more about ed techs in the coming paragraphs.
So, how can educators use promising practices to overcome barriers and increase student
success? One way is to actually use strategies when working with students with IEPs. It is very
easy to take individuals at face value and make the assumption that what is being delivered
informationally is understood. It is important to note here as well that during interviews, it was
stated by more than one educator that strategies that work for students with disabilities can work
for all students, adding more global items to a metaphoric teacher toolbox. Some other things
come to mind here, such as increasing differentiation, collaborating more with ed techs as they
often know the students best, especially if they have relationships with them, and taking the

BARRIERS TO STUDENT ACHIEVEMENT �55
initiative to open the doors for co-teaching. With all educators in the school environment used in
this study seemingly open to collaboration, why is co-teaching not happening more?
Co-teaching is a model that is easier said than done, just like many things, which is in
itself a barrier. The actual idea of co-teaching causes a lack thereof. Very few people that were
surveyed, interviewed, or conversed with informally have ever co-taught with another educator.
Plenty goes into co-teaching, such as time, resources, commitment, and a willing, not forced,
partnership. Educators plan, teach, and overcome challenges together. Is there a class on how to
co-teach? A workshop? A recommendation would be to show educators how to co-teach. With
instructional coaches now common in many schools via grants and other means, let us add this to
their agenda. If educators know how to co-teach, maybe they will. A positive side effect, as
discovered (perceptually at least) during this study, is that if more special education teachers
were to co-teach in the mainstream setting, then working with the same students outside the
mainstream setting could be a more successful overall experience.
Another practice that can be used to overcome barriers and increase success is inclusion,
or better-stated, more quality inclusion. It has been stated by educators who participated in this
research study that quality inclusion can instill higher self-esteem and raise the bar for intrinsic
skill, to name only a couple of benefits. This is not to say, however, that it is not recognized that
there is a need for more resources, such as additional ed tech support in order to foster successful
inclusion.
The next practice worth discussing is connections with students. It became clear during
the course of this study that the school involved has the goal of instilling hope in students and
making connections with them with the intent to draw students toward learning if they feel

BARRIERS TO STUDENT ACHIEVEMENT �56
someone cares about their learning in the educational environment, even if they have connections
outside of school.
Another barrier worth mentioning that surfaced during this study involved IEP language.
It is important for special education teachers in any environment to have a large discussion
periodically with all staff, maybe asking for five to 10 minutes during a staff meeting once a
month to ask if there are questions and maybe go over new or difficult IEP language. If IEPs are
understood and accommodations are met and combined with best practice, success could
increase.
Technology is another barrier worth a brief discussion. Though only mentioned once or
twice by educators during the course of this research study, it is something I personally
experience to the extent of extreme frustration and at times, hopelessness. Not only do students
bring technology into the school environment, but schools also give (or loan) students
technology as well. How then, can we utilize this technology in ways that foster learning?
Technology must be integrated appropriately, not handed out with a sheet of rules to follow,
hoping for the best. This is an area in need of more exploration and improvement.
Next, a discussion about the Jobs for Maine Graduates (JMG) program is appropriate
with regard to barriers, and here is why. There are many nontraditional students in the school
used for this study, as mentioned in earlier parts of this paper. Many of these same students are
part of the JMG program and find success with building connections in the community and
finding worth, which is something that could be a struggle in mainstream classrooms. One
administrator mentioned that the JMG program should extend to the middle school to work with
students earlier than high school, students that may need what JMG offers, but at a younger age.

BARRIERS TO STUDENT ACHIEVEMENT �57
So, what is the impact of appropriately-prepared ed techs on student achievement?
Many participants of this research study asked what it meant for an ed tech to be appropriately-
prepared. After conducting research, I am not so sure I know the answer to this question
anymore, or maybe I have a different answer than what I have always believed. With regard to
the research question itself, there is no answer, or maybe there is no straightforward answer.
Perceptually speaking, the majority of educators surveyed and interviewed (over 52%)
found ed techs valuable and imperative to student success, which tied directly to the way ed
techs perceived themselves (as being impactful). Additionally, there was a range of feelings by
ed techs of being well-trained, and over 80% of the ed techs surveyed and interviewed for this
study felt there were few professional development opportunities even though the same ed techs
had great ideas for training. Let us be honest, ed techs know what they need after working with
students for only a short while. Should we not listen to their training ideas? Perhaps they do not
speak up unless there is a study (like this one).
Teachers who participated in this research study described ed techs in the following
ways: the only reason students succeed, crucial, first line of intervention, do the trench work,
kids would not make it, guide learning, discuss strategies, etc. However, the challenge now faced
in the context of this research study is that learning data does not support the presence of ed
techs, because students are behind pace and test scores are low. This, though, is not the
challenge, the challenge is that qualitative data directly conflicts with quantitative data. This
leads one to believe that the issue is elsewhere, perhaps with the system, perhaps with the
students. Do we need ed techs? Yes. What is their impact on student achievement? This is not a
fair question as it harkens back to being appropriately-prepared. If and when this happens will be

BARRIERS TO STUDENT ACHIEVEMENT �58
when the impact on learning can be assessed. This is all the more reason for ed techs to know
more. A mandatory preparatory course, perhaps six weeks or so in length, is not a bad idea for a
new ed tech before starting a new job.
Nevertheless, ed techs are a part of the educational environment, and will hopefully
remain as such. Their knowledge of special education services and the IEP document is limited at
best, so there is much to change in this regard. School budgets should also include ed techs being
a part of staff meetings. There should be a period understood by all parties of ed techs learning
with direction and support, but without criticism, careful not to do too much for students,
especially in a proficiency environment that intends to foster autonomy.
The educational environment used for this research study contained educators with a vast
range of experience, both in years, five to 35, and in knowledge. It became clear that resources,
not skill, were barriers to success and that experience was more essential for skill development.
Also, teachers were overloaded with students with and without disabilities without enough
support and with no time to plan. Further, the strongest (perceived) teams were ones that met
often and were data-focused.
The first of two final items to discuss is the proficiency-based educational model and its
inclusion in the school used for this research. This is a model that allows students different ways
to show proficiency, with ties to applied learning opportunities (ALOs), hands-on learning, and
internships. The proficiency model also allows students to work at their own pace and fosters
(forces?) autonomy.
Though some administrators believe that this model is set up to overcome some barriers,
it brings forth some with it. For one, how can this system work for low achievers? Perhaps the

BARRIERS TO STUDENT ACHIEVEMENT �59
the items mentioned above are the answer (ALOs, etc) for low achievers and nontraditional
students, and maybe even increased Accuplacer support for students not on a post-high school,
university path. Also, how will the diploma situation be resolved for students that cannot reach
proficiency with enough content to earn one. Should there be two, with one having a distinction?
This is a challenge the reaches all the way up to the federal Department of Education with
implications that will materialize for the school in this study with the graduating class of 2018.
Finally, will standardized testing remain with the proficiency model, especially since students
have opportunities to display knowledge without traditional tests? Though test scores and pace
data have been spoken about in length, other measures should be sought and made “standard.”
The final item to discuss is the implication that schools, especially the one used in this
study, are working against uncontrollable circumstances at times. These circumstances may just
be impossible to overcome, circumstances such as poverty, mental health challenges with
families and students of families, and even substances such as drugs and alcohol. One thing a
school can do is bring more Licensed Clinical Social Worker (LCSW) support, or have a bigger
system of, for all students, not just those with disabilities, with the hope of combatting some of
these challenges. In the end, schools must find a way to balance philosophy and resources if the
goal is for students to find success.
Reflection
Well, I must say, this was a life-changing experience. I really did not know what to expect
with regard to doing a research project. When I first started the journey to my masters degree, I
was unsure how it was all going to work. The first summer was very overwhelming, and I

BARRIERS TO STUDENT ACHIEVEMENT �60
remember thinking, “How am I going to learn everything I need to know in just one summer in
order to write a thesis and conduct a research study?” Looking back, though, that first summer,
loaded with information and a very long literature review on my part, was exactly the kind of
challenge I needed in order to know that the stakes were higher, and that I was in for a something
that could change me as an educator and as a person.
After 10 years in the classroom before entering a masters program, teaching had become
very frustrating for me. So many things were getting in the way of student learning, barriers if
you will. Additionally, I felt as if leaders were not considering all pieces of the puzzle when
trying to make changes; the word ‘piecemeal’ comes to mind. But, how could I tell them that?
Though I held a department leadership position for a while, I felt it was difficult for me to
make any real progress with respect to change. Agendas, I felt, were just something I had to write
in order to fill time during curriculum meetings. It was not until one of my courses in the masters
program covered agenda-writing (I think the topic simply came up one day) that I was able to see
things differently and completely overhaul the way I wrote agendas. They became meaningful,
though time-consuming, but the effort was worth the outcome.
About a year into the masters program, I also began communicating with leaders a little
differently. I now found myself wanting to communicate with leaders because of the information
I was learning about being a leader and about the educational field. Up to this point, I had
avoided leaders, thinking they would not hear my ideas or want meaningful conversation, based
purely on my own frustrations. I was wrong.
At one point, I remember reaching a confidence level that allowed me to discuss
challenges in the school with building leaders, and even wanting to share my ideas during staff
BARRIERS TO STUDENT ACHIEVEMENT �61
meetings and workshops, not keeping my conversations isolated to my small, special education
team. And, though I chose my topic and brainstormed research questions for my study during the
very first summer of my masters program, it was not until I started discussing barriers with
building leaders and other educators that my topic and questions started to become meaningful,
and I started becoming invested in and believe in what I was doing for a research project, topic
wise.
As I sit here typing this reflection and having completed my research study (mostly), I
cannot help but feel a sense of accomplishment, not from what I have completed, but what I have
learned and can apply moving forward. Throughout the course of doing my project, I became
increasingly invested, interested, and excited to discover new ideas relating to my topic and
research questions, ideas that I could use to make change in my classroom, my school and my
district.
Now, about the research process itself, let us reflect. I think I stressed about this project
for the entire two years of the masters program. After the first summer, I felt classes were not
connecting with doing a research study, or to my topic. Only last semester (and the current) did I
feel things were moving forward and I was finally working on completing my project. I realized
once I jumped back into my original literature review how everything was coming together and
how completed courses had contributed to the final step of the process.
For some reason, I had it in my head that there was some magical software out there that
would allow me to input acquired data and make analyzation simple, or at least more manageable
and less overwhelming. Nope, I was wrong. Once I let go of that idea, things did become more
manageable and less overwhelming, albeit extremely time-consuming. I must give credit to my

BARRIERS TO STUDENT ACHIEVEMENT �62
current professor as he helped me to let go of what I believed would make things simpler and
embrace the process.
After completing data collection and transcribing interviews, I started following my
instinct, and ended up with several poster boards spread throughout my living room and beyond.
I used markers to code and connect data. I had to throw methodical intentions out the window
and embrace visual chaos. After hours and hours of poster board mayhem, and after instructor
direction, I jumped back into my paper to write about all that I had discovered and connected.
After the paper was completed (draft?), the road ultimately narrowed to creating
presentation slides. For me, I will feel “done” with this project as an assignment after the masters
presentation day. However, the most important thing I learned is that the implications and
“conclusions” derived from this research project is only the beginning with regard to making
changes in the field of education. And, this process was imperative for my own development as
an educator and as a person.

BARRIERS TO STUDENT ACHIEVEMENT �63
References
Breton, W. (2010). Special education paraprofessionals: Perceptions of preservice preparation, supervision, and ongoing developmental training. International Journal of Special Education, 25(1), 34–45.
Brown, L., Farrington, K., & Knight, T. (1999). Fewer paraprofessionals and more teachers and therapists in educational programs for students with significant disabilities. Journal of the Association for Persons with Severe Handicaps, 24(4), 250–253.
Cook, B. G., Semmel, M. I., & Gerber, M. M. (1999). Attitudes of principals and special education teachers toward the inclusion of students with mild disabilities critical differences of opinion. Remedial & Special Education, 20(4), 199-207.
Creswell, J. (2015). Educational research: Planning, conducting, and evaluating quantitative and qualitative research. (5th ed.). Boston, MA: Pearson.
Enser, T. L. (2012). Principals’ perceptions and barriers to successful implementation of special education in the Wisconsin Evangelical Lutheran Synod (Doctoral dissertation). Available from ProQuest Dissertations and Theses database. (3571468)
Gerber, S. B., Finn, J. D., Achilles, C. M., & Boyd-Zaharias, J. (2001). Teacher aides and students’ academic achievement. Educational Evaluation and Policy Analysis, 23(2), 123–143.
Goddard, R. D., Hoy, W. K., & Hoy, A. W. (2000). Collective teacher efficacy: Its meaning, measure, and impact on student achievement. American Educational Research Journal, 37(2), 479–507. doi: 10.3102/00028312037002479
Harpell, J. V., & Andrews, J. J. W. (2010). Administrative leadership in the age of inclusion: Promoting best practices and teacher empowerment. Journal of Educational Thought, 44(2), 189–210.
Hunt, P., & And Others. (1994). Achievement by All Students within the Context of Cooperative Learning Groups. Journal of the Association for Persons with Severe Handicaps, 19(2), 290–301.
Idol, L. (2006). Toward Inclusion of Special Education Students in General Education: A Program Evaluation of Eight Schools. Remedial and Special Education, 27(2), 77–94.
Katsiyannis, A., Yell, M. L., & Bradley, R. (2001). Reflections on the 25th Anniversary of the Individuals with Disabilities Education Act. Remedial and Special Education, 22(6-), 324–34.

BARRIERS TO STUDENT ACHIEVEMENT �64
Kaufhold, J. A., Alverez, V. G., & Arnold, M. (2006). Lack of School Supplies, Materials and Resources as an Elementary Cause of Frustration and Burnout in South Texas Special Education Teachers. Journal of Instructional Psychology, 33(3), 159–161.
Klingner, J. K., Ahwee, S., Pilonieta, P., & Menendez, R. (2003). Barriers and facilitators in scaling up research-based practices. Exceptional Children, 69(4), 411–29. doi: 10.1177/001440290306900402
Madden, N. A., & Slavin, R. E. (1983). Effects of cooperative learning on the social acceptance of mainstreamed academically handicapped students. Journal of Special Education, 17(2), 171–82.
U.S. Bureau of Labor Statistics. (2014). Teacher assistants: Occupational outlook handbook. Retrieved from http://www.bls.gov/ooh/education-training-and-library/teacher- assistants.htm
Zigmond, N. (2003). Where Should Students with Disabilities Receive Special Education Services? Is One Place Better than Another? Journal of Special Education, 37(3), 193– 199.

BARRIERS TO STUDENT ACHIEVEMENT �65
Appendix A - Administrator’s Consent Form
Dear Superintendent Bill Zima, My name is Dewey Hernandez and I am a student at the University of Maine Farmington. I am interested in conducting a research study beginning in January, 2017. I am interested in exploring, understanding , and discovering ways that promising educational practices can overcome barriers to student success, including examining how barriers already affect student achievement and the role of paraprofessionals with regards to student achievement as well.
I would like to:● Qualitative
○ interview teachers, educational technicians, and administrators ○ potentially observe classrooms○ examine perception data ○ survey teachers, educational technicians, and administrators ○ get written consent and/or oral assent from participants ○ *participation is voluntary and participants can leave the study at any time
● Quantitative○ gather learning data from teachers, curriculum coordinator, and other individuals
with learning data ○ *data will be de-identified by removing names, institutions, and other identifying
markers I will not share identifiable data about specific students, parents or others involved in the study.If I have any questions about the research, you may contact the principal investigator, If you have any questions about this study, please contact me, Dewey Hernandez, by email at [email protected] or by phone at 207-213-9952. You may also reach the faculty advisor, Dr. Christopher Strople, on this study at [email protected] or at 207-778-7015.
Thank you for considering my request to conduct research,
Dewey Hernandez I have reviewed Dewey Hernandez’s research plan titled “Barriers to Student Achievement.” I give my consent to conduct this research in RSU 2 at Hall-Dale High & Hall-Dale Middle School. I am aware that I may also ask to view the report at the end of the study. ________ ________________________________ _________________________________Date Name Position in District/Site
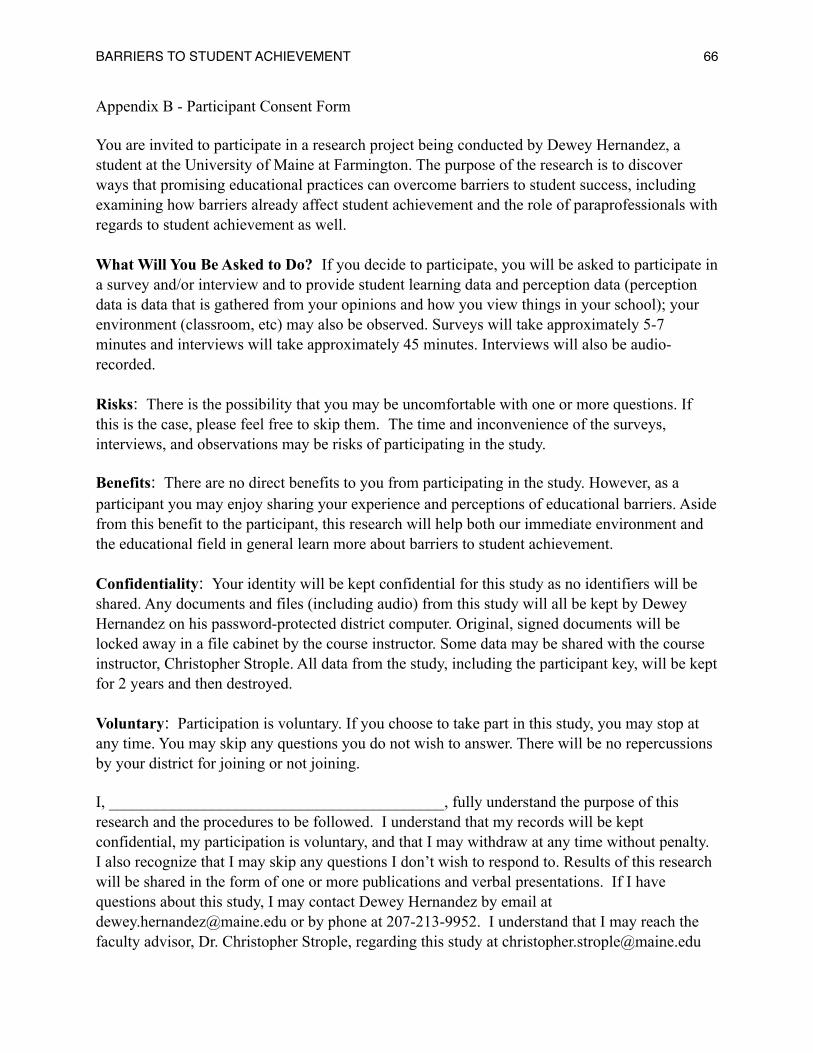
BARRIERS TO STUDENT ACHIEVEMENT �66
Appendix B - Participant Consent Form
You are invited to participate in a research project being conducted by Dewey Hernandez, a student at the University of Maine at Farmington. The purpose of the research is to discover ways that promising educational practices can overcome barriers to student success, including examining how barriers already affect student achievement and the role of paraprofessionals with regards to student achievement as well. What Will You Be Asked to Do? If you decide to participate, you will be asked to participate in a survey and/or interview and to provide student learning data and perception data (perception data is data that is gathered from your opinions and how you view things in your school); your environment (classroom, etc) may also be observed. Surveys will take approximately 5-7 minutes and interviews will take approximately 45 minutes. Interviews will also be audio-recorded. Risks: There is the possibility that you may be uncomfortable with one or more questions. If this is the case, please feel free to skip them. The time and inconvenience of the surveys, interviews, and observations may be risks of participating in the study.
Benefits: There are no direct benefits to you from participating in the study. However, as a participant you may enjoy sharing your experience and perceptions of educational barriers. Aside from this benefit to the participant, this research will help both our immediate environment and the educational field in general learn more about barriers to student achievement. Confidentiality: Your identity will be kept confidential for this study as no identifiers will be shared. Any documents and files (including audio) from this study will all be kept by Dewey Hernandez on his password-protected district computer. Original, signed documents will be locked away in a file cabinet by the course instructor. Some data may be shared with the course instructor, Christopher Strople. All data from the study, including the participant key, will be kept for 2 years and then destroyed. Voluntary: Participation is voluntary. If you choose to take part in this study, you may stop at any time. You may skip any questions you do not wish to answer. There will be no repercussions by your district for joining or not joining.
I, __________________________________________, fully understand the purpose of this research and the procedures to be followed. I understand that my records will be kept confidential, my participation is voluntary, and that I may withdraw at any time without penalty. I also recognize that I may skip any questions I don’t wish to respond to. Results of this research will be shared in the form of one or more publications and verbal presentations. If I have questions about this study, I may contact Dewey Hernandez by email at [email protected] or by phone at 207-213-9952. I understand that I may reach the faculty advisor, Dr. Christopher Strople, regarding this study at [email protected]

BARRIERS TO STUDENT ACHIEVEMENT �67
or at 207-778-7015. By signing below, I assert that I fully understand the above and give my consent to serve as a subject in this research by answering a survey, being interviewed, or having my environment observed. (If you would like a summary of the results, please make the request of the researcher at the contact given above). ________________ ___________________________________________ (Date) (Signature)

BARRIERS TO STUDENT ACHIEVEMENT �68
Appendix C - Survey/Questionnaire
All Educators: (all questions will contain the below 1 to 5 scale)1 - not at all 2 - somewhat 3 - a fair amount 4 - quite a bit 5 - absolutely
1. When you began your job as an educator here, did you feel prepared? 2. Do you feel your coworkers understand your role within the school? 3. Do you feel your role is clearly understood by you? 4. Do you feel you are able to collaborate well with colleagues in order to increase student success? 5. Do you feel paraprofessionals have a valuable role in your classroom? 6. Does having a paraprofessional in your classroom increase student success?
Paraprofessionals:
1. As a paraprofessional do you feel well-trained for your position? 2. Do you feel supported? 3. Do you feel there is adequate continuing professional development in order for you to be most effective in your role? 4. Do you feel you are well-utilized in your role? 5. How impactful do you feel with regard to the success of students with disabilities? 6. Do you feel well-guided by your supervisor? 7. Do you feel your continuing training needs are being met? 8. If you could pick one area of training, what would it be?

BARRIERS TO STUDENT ACHIEVEMENT �69
Appendix D - Interview Protocol
All Educators: (specific positions will include/not include appropriate questions/answers)
Hello, and thank you for agreeing to take part in this interview. As part of my master’s program at the University of Maine at Farmington, I am conducting a research project about barriers to student achievement. The goal of this interview is get your thoughts and ideas about various items regarding your school environment, that tie into my research questions. Do you have any questions for me or about this research before we begin?
1. What is your position in the school? 2. How long have you been doing this position? 3. What do you know about special education services in your building? 4. Do you feel you understand all aspects of the special education field? 5. What do you feel are the benefits to special education services? 6. Do you feel you have the skills and/or resources to support successful implementation? 7. Do you feel there is effective differentiation and co-teaching in your building? 8. How do you feel the inclusion of students with disabilities in mainstream classrooms impacts
student achievement? 9. Do you believe you have the skills to get results with regard to student success? 10. What barriers to student success are present in your building? 11. How do you feel these barriers affect student achievement? 12. What is being done about potential barriers? 13. Do you believe it’s easy for your to use new knowledge, or do you stay with the same
knowledge you already have? 14. How well do you feel you work with regular ed/special ed staff? 15. Do you feel your immediate team is strong or weak? Why or why not? 16. With regard to research-based practices, do you feel you have clear expectations from district
leaders? 17. Do you feel you are evaluated on your ability to get results and given opportunities to
increase your skills? 18. How can educators use promising practices to overcome barriers and increase student
success? 19. What is the impact of appropriately-prepared teacher aides on student achievement? 20. How effective do you feel is the communication in your building? 21. What are some promising practices present in your building? 22. Are they effective? Why or why not? 23. Which ones specifically include special educators and regular educators working together 24. Which ones are being supported by administrators? 25. Which ones are leading to student success in their school? 26. Are there any other comments or questions you would like to add before we wrap up this
interview?