barriers to shared belief: the role of strategic interest, managerial
TRANSCRIPT

Barriers to Shared Belief: The role of
strategic interest, managerial characteristics
and organisational factors
by
Lıvia Anna Markoczy
Dissertation
Submitted to The University of Cambridge
in Partial Fulfillment
of the Requirements
for the Degree of
Doctor of Philosophy
St Johns College
The University of Cambridge
December, 1994

Copyright
by
Lıvia Anna Markoczy
1994

Barriers to Shared Belief: The role ofstrategic interest, managerial characteristics
and organisational factors
AbstractLıvia Anna Markoczy
St Johns College, The University of Cambridge, 1994
Supervisor: John Child
Managerial beliefs have been a matter of interest in the managementfield since the importance of managers in organisational adaptation hasbeen recognised. Inquiries have been conducted in several directions tosee whether there are managerial and/or contextual characteristics whichmight account for the business related beliefs of managers, but these weremostly constrained to some singled-out factors. Empirical studies whichconsider the influence of multiple factors simultaneously are still missing.This thesis contributes to filling the gap.
For finding the relative importance of managerial characteristics andcontextual, situational factors international mixed management organi-sations (immos) where managers with different national/cultural back-grounds work together are investigated. Data were collected in Hungaryfrom 111 managers in five immos.
Causal maps (CMs) are used to compare managers’ beliefs. Causalmaps have been widely applied to asses managerial beliefs, but their sys-tematic and reliable comparison had not been fully resolved, thus requiringsome refinement CM techniques. Using this refined method, I measured andcompared managerial beliefs in each of the five investigated organisationsand measured the relative importance of the national backgrounds andother managerial characteristics which might account for the similaritiesand differences in managerial beliefs. Findings then were compared acrossorganisations to asses the effect of similarities and differences in contextualand situational factors of these organisations on the findings. Similaritiesand differences between organisations were extracted from interviews andarchival data.
Within each company the strongest factor influencing similarities inbeliefs was some functional area, while, if nationality showed up at all, itwas fairly far down the list of influential factors. Which functional areaplayed a role in which organisation appears to have depended on the na-ture and situation of the particular organisation, and particularly on theorganisation’s strategic interest.

Oh, East is East and West is West and never thetwain shall meet,
Till sky and earth stand presently at God’s greatJudgment Seat;
But there is neither East nor West, Border norBreed, nor Birth,
When two strong men stand face to face, thoughthey come from the ends of the earth!
The Ballad of East and West,Rudyard Kipling
Contents
Abstract iii
List of Tables xiii
List of Figures xv
Preface xvii
Chapter 1 Introduction 1
1.1 Organisation of the thesis . . . . . . . . . . . . . . . . . . . 3
Chapter 2 Previous work on the subject 5
2.1 National background . . . . . . . . . . . . . . . . . . . . . . 7
2.1.1 Levels of investigation . . . . . . . . . . . . . . . . . 8
2.1.1.1 National level studies . . . . . . . . . . . . . 9
2.1.1.2 Cultural studies at the national-level . . . . 11
2.1.1.3 National cultures and organisations . . . . . 13
2.1.1.4 National differences between groups and in-
dividuals . . . . . . . . . . . . . . . . . . . 16
2.1.2 Other perspectives . . . . . . . . . . . . . . . . . . . 23
2.1.2.1 System of industrial governance . . . . . . . 23
2.1.2.2 Level of industrialisation . . . . . . . . . . . 24
2.2 International Mixed Management Organisations . . . . . . . 25
2.2.1 Macro issues concerning immos . . . . . . . . . . . . 26
2.2.2 Issues within immos . . . . . . . . . . . . . . . . . . 33
v

2.2.2.1 Cultural differences in immos . . . . . . . . 33
2.2.2.2 Personnel issues in immos . . . . . . . . . . 36
2.2.2.3 Immos in transforming economies . . . . . . 37
2.2.2.4 Discussion on immos . . . . . . . . . . . . . 37
2.3 Managerial characteristics . . . . . . . . . . . . . . . . . . . 38
2.3.1 Age . . . . . . . . . . . . . . . . . . . . . . . . . . . 39
2.3.2 Organisational tenure . . . . . . . . . . . . . . . . . . 40
2.3.3 Education . . . . . . . . . . . . . . . . . . . . . . . . 41
2.3.4 Position . . . . . . . . . . . . . . . . . . . . . . . . . 41
2.3.4.1 Consensus in tmts . . . . . . . . . . . . . . 42
2.3.5 Functional area . . . . . . . . . . . . . . . . . . . . . 43
2.3.6 Profession . . . . . . . . . . . . . . . . . . . . . . . . 45
2.3.7 Gender . . . . . . . . . . . . . . . . . . . . . . . . . . 46
2.3.8 Discussion on managerial characteristics . . . . . . . 47
2.4 Literature on the effect of industry . . . . . . . . . . . . . . 48
2.4.1 Industry-group based on behaviour . . . . . . . . . . 49
2.4.2 Industry-groups as cognitive communities . . . . . . . 49
2.4.3 Discussion . . . . . . . . . . . . . . . . . . . . . . . . 52
2.5 Lines of inquiry suggested by the literature . . . . . . . . . . 52
2.5.1 Directional hypotheses . . . . . . . . . . . . . . . . . 53
2.5.2 Other factors . . . . . . . . . . . . . . . . . . . . . . 55
Chapter 3 Methods 56
3.1 Sample . . . . . . . . . . . . . . . . . . . . . . . . . . . . . . 56
3.1.1 Sample of organisations . . . . . . . . . . . . . . . . 57
3.1.2 The sample of managers . . . . . . . . . . . . . . . . 60
3.2 Two levels of the analysis . . . . . . . . . . . . . . . . . . . 62
3.3 Causal maps . . . . . . . . . . . . . . . . . . . . . . . . . . . 63
3.4 Steps of the method . . . . . . . . . . . . . . . . . . . . . . 68
3.4.1 Pool of constructs . . . . . . . . . . . . . . . . . . . . 68
3.4.2 Selection of constructs . . . . . . . . . . . . . . . . . 70
3.4.3 Establishing causal relations . . . . . . . . . . . . . . 71
vi

3.4.4 Comparison of CMs . . . . . . . . . . . . . . . . . . . 75
3.5 Analysis of the causal maps . . . . . . . . . . . . . . . . . . 76
3.6 Collecting additional information . . . . . . . . . . . . . . . 82
3.7 More on the two step analysis . . . . . . . . . . . . . . . . . 85
3.8 Cross-organisational comparison . . . . . . . . . . . . . . . . 85
3.8.1 Construct-selection . . . . . . . . . . . . . . . . . . . 86
Chapter 4 The context of organisations 88
4.1 Two reforms: 1957 and 1968 . . . . . . . . . . . . . . . . . . 89
4.2 Reform from the beginning of the eighties . . . . . . . . . . 92
4.3 Privatization in Hungary . . . . . . . . . . . . . . . . . . . . 94
4.4 Political change . . . . . . . . . . . . . . . . . . . . . . . . . 96
4.5 Changes in the economic conditions . . . . . . . . . . . . . . 100
4.6 Societal attitude towards the market economy . . . . . . . . 101
4.7 Work attitude of Hungarians and Anglo-Saxons . . . . . . . 104
Chapter 5 Company A: Incandescent 107
5.1 The acquired company . . . . . . . . . . . . . . . . . . . . . 107
5.2 The history of the company . . . . . . . . . . . . . . . . . . 108
5.3 External conditions . . . . . . . . . . . . . . . . . . . . . . . 109
5.4 The purpose of the partners . . . . . . . . . . . . . . . . . . 110
5.5 New techniques, changes . . . . . . . . . . . . . . . . . . . . 111
5.5.1 Restructuring . . . . . . . . . . . . . . . . . . . . . . 111
5.5.2 Cost control . . . . . . . . . . . . . . . . . . . . . . . 113
5.5.3 Production, technology . . . . . . . . . . . . . . . . . 114
5.5.4 Bookkeeping . . . . . . . . . . . . . . . . . . . . . . . 115
5.5.5 Employment policy . . . . . . . . . . . . . . . . . . . 116
5.5.6 Incentive system and training . . . . . . . . . . . . . 117
5.5.7 Marketing, sales . . . . . . . . . . . . . . . . . . . . . 118
5.6 Changes in the relative positions of areas . . . . . . . . . . . 119
5.7 Salient issues identified by the managers . . . . . . . . . . . 120
5.8 Analysis of cause maps . . . . . . . . . . . . . . . . . . . . . 122
vii

5.8.1 The results . . . . . . . . . . . . . . . . . . . . . . . 127
5.9 Evaluation of findings . . . . . . . . . . . . . . . . . . . . . . 129
5.9.1 National differences . . . . . . . . . . . . . . . . . . . 129
5.9.2 The effect of functional areas or education . . . . . . 130
5.9.3 The effect of language knowledge . . . . . . . . . . . 132
5.9.4 The effect of age . . . . . . . . . . . . . . . . . . . . 132
5.9.5 The lack of effect of the position . . . . . . . . . . . . 133
Chapter 6 Company B: The glass menage 134
6.1 The company . . . . . . . . . . . . . . . . . . . . . . . . . . 134
6.2 The purpose of the parent companies . . . . . . . . . . . . . 135
6.3 External conditions . . . . . . . . . . . . . . . . . . . . . . . 135
6.4 The internal structure and procedures of B . . . . . . . . . . 136
6.4.1 Organisational structure . . . . . . . . . . . . . . . . 137
6.4.2 Cost control . . . . . . . . . . . . . . . . . . . . . . . 139
6.4.3 Production, technology . . . . . . . . . . . . . . . . . 139
6.4.4 Bookkeeping . . . . . . . . . . . . . . . . . . . . . . . 140
6.4.5 Employment policy . . . . . . . . . . . . . . . . . . . 140
6.4.6 Incentive system . . . . . . . . . . . . . . . . . . . . 141
6.4.7 Marketing, sales . . . . . . . . . . . . . . . . . . . . . 141
6.4.8 Interaction between managers in different positions . 142
6.5 Salient issues identified by the managers . . . . . . . . . . . 143
6.6 Analysis of cause maps . . . . . . . . . . . . . . . . . . . . . 147
6.6.1 The results . . . . . . . . . . . . . . . . . . . . . . . 151
6.7 Evaluation of findings . . . . . . . . . . . . . . . . . . . . . . 153
6.7.1 The effect of functional areas or education . . . . . . 153
6.7.2 National differences . . . . . . . . . . . . . . . . . . . 154
6.7.3 Profit orientation . . . . . . . . . . . . . . . . . . . . 155
6.7.4 Functional diversity . . . . . . . . . . . . . . . . . . . 156
Chapter 7 Company C: Everybody doesn’t like something. . . 157
7.1 The acquired company . . . . . . . . . . . . . . . . . . . . . 157
viii

7.2 The history of the company . . . . . . . . . . . . . . . . . . 158
7.3 The purpose of the partners . . . . . . . . . . . . . . . . . . 159
7.4 External conditions . . . . . . . . . . . . . . . . . . . . . . . 160
7.5 New techniques, changes . . . . . . . . . . . . . . . . . . . . 162
7.5.1 Restructuring . . . . . . . . . . . . . . . . . . . . . . 162
7.5.2 Cost control . . . . . . . . . . . . . . . . . . . . . . . 164
7.5.3 Production, technology . . . . . . . . . . . . . . . . . 166
7.5.4 Bookkeeping . . . . . . . . . . . . . . . . . . . . . . . 166
7.5.5 Employment policy . . . . . . . . . . . . . . . . . . . 166
7.5.6 Incentive system and training . . . . . . . . . . . . . 166
7.5.7 Marketing, sales . . . . . . . . . . . . . . . . . . . . . 167
7.6 Changes in the relative positions of areas . . . . . . . . . . . 168
7.7 Salient issues identified by the managers . . . . . . . . . . . 168
7.8 Analysis of cause maps . . . . . . . . . . . . . . . . . . . . . 175
7.8.1 The results . . . . . . . . . . . . . . . . . . . . . . . 181
7.9 Evaluation of findings . . . . . . . . . . . . . . . . . . . . . . 182
7.9.1 The effect of gender . . . . . . . . . . . . . . . . . . . 182
7.9.2 The effect of language knowledge . . . . . . . . . . . 183
7.9.3 The effect of education specialisation . . . . . . . . . 185
7.9.4 The effect of functional area . . . . . . . . . . . . . . 186
7.9.5 The effect of position . . . . . . . . . . . . . . . . . . 186
7.9.6 The effect of age . . . . . . . . . . . . . . . . . . . . 187
7.9.7 National differences . . . . . . . . . . . . . . . . . . . 187
Chapter 8 Company D: Uncommonly good 189
8.1 The acquired company . . . . . . . . . . . . . . . . . . . . . 189
8.2 The history of the company . . . . . . . . . . . . . . . . . . 190
8.3 External conditions . . . . . . . . . . . . . . . . . . . . . . . 192
8.4 The purpose of the partners . . . . . . . . . . . . . . . . . . 193
8.5 Characteristics of the company . . . . . . . . . . . . . . . . 194
8.5.1 New techniques, changes . . . . . . . . . . . . . . . . 194
8.5.2 Restructuring . . . . . . . . . . . . . . . . . . . . . . 194
ix
8.5.3 Cost control . . . . . . . . . . . . . . . . . . . . . . . 197
8.5.4 Production, technology . . . . . . . . . . . . . . . . . 197
8.5.5 Bookkeeping . . . . . . . . . . . . . . . . . . . . . . . 198
8.5.6 Incentive system . . . . . . . . . . . . . . . . . . . . 198
8.5.7 Marketing, sales . . . . . . . . . . . . . . . . . . . . . 199
8.5.8 Introduction of the changes . . . . . . . . . . . . . . 200
8.5.9 Changes in the relative positions of areas . . . . . . . 201
8.6 Salient issues identified by the managers . . . . . . . . . . . 202
8.7 Analysis of the CMs . . . . . . . . . . . . . . . . . . . . . . 206
8.7.1 The results . . . . . . . . . . . . . . . . . . . . . . . 210
8.8 Evaluation of findings . . . . . . . . . . . . . . . . . . . . . . 211
8.8.1 National differences . . . . . . . . . . . . . . . . . . . 211
8.8.2 The effect of language knowledge . . . . . . . . . . . 212
8.8.3 The effect of functional areas . . . . . . . . . . . . . 213
8.8.4 The effect of age . . . . . . . . . . . . . . . . . . . . 213
Chapter 9 Company E: The surreal thing 214
9.1 The acquired company . . . . . . . . . . . . . . . . . . . . . 214
9.2 The history of the company . . . . . . . . . . . . . . . . . . 215
9.3 External conditions . . . . . . . . . . . . . . . . . . . . . . . 216
9.4 The purpose of the partners . . . . . . . . . . . . . . . . . . 217
9.5 New techniques, changes . . . . . . . . . . . . . . . . . . . . 218
9.5.1 Restructuring . . . . . . . . . . . . . . . . . . . . . . 218
9.5.2 Cost control . . . . . . . . . . . . . . . . . . . . . . . 220
9.5.3 Production, technology . . . . . . . . . . . . . . . . . 221
9.5.4 Bookkeeping . . . . . . . . . . . . . . . . . . . . . . . 222
9.5.5 Employment policy . . . . . . . . . . . . . . . . . . . 222
9.5.6 Incentive system and training . . . . . . . . . . . . . 223
9.6 Marketing, sales . . . . . . . . . . . . . . . . . . . . . . . . . 224
9.7 Changes in the relative positions of areas . . . . . . . . . . . 224
9.8 Salient issues identified by the managers . . . . . . . . . . . 225
9.9 Analysis of cause maps . . . . . . . . . . . . . . . . . . . . . 228
x

9.9.1 The results . . . . . . . . . . . . . . . . . . . . . . . 233
9.10 Evaluation of findings . . . . . . . . . . . . . . . . . . . . . . 234
9.10.1 The effect of functional areas . . . . . . . . . . . . . 234
9.10.2 The effect of age . . . . . . . . . . . . . . . . . . . . 234
9.10.3 National differences . . . . . . . . . . . . . . . . . . . 235
Chapter 10 Cross-organisational findings 236
10.1 Comparing companies . . . . . . . . . . . . . . . . . . . . . 237
10.1.1 Company characteristics . . . . . . . . . . . . . . . . 237
10.1.2 Changes which took place in immos . . . . . . . . . . 239
10.1.3 Salient issues within the companies . . . . . . . . . . 241
10.2 Comparing subgroup results . . . . . . . . . . . . . . . . . . 241
10.2.1 Organisational features and managerial characteristics 245
10.3 Construct-selection . . . . . . . . . . . . . . . . . . . . . . . 247
Chapter 11 Evaluation of the findings 249
11.1 The influence of national backgrounds . . . . . . . . . . . . 249
11.2 Role of organisational membership . . . . . . . . . . . . . . 256
11.3 Role of industry recipes . . . . . . . . . . . . . . . . . . . . . 257
11.4 Strategic interest . . . . . . . . . . . . . . . . . . . . . . . . 258
11.4.1 Outline of the Strategic Interest Model . . . . . . . . 260
11.4.2 Strategic Interest to belief differences . . . . . . . . . 264
11.4.2.1 Scenario 1 . . . . . . . . . . . . . . . . . . . 264
11.4.2.2 Scenario 2 . . . . . . . . . . . . . . . . . . . 265
11.4.2.3 Scenario 3 . . . . . . . . . . . . . . . . . . . 266
11.5 Other findings . . . . . . . . . . . . . . . . . . . . . . . . . . 268
11.6 Theoretical implications . . . . . . . . . . . . . . . . . . . . 271
11.7 Limitations and Suggestions . . . . . . . . . . . . . . . . . . 273
11.7.1 Limitations of the causal mapping technique . . . . . 273
11.7.2 Other limitations . . . . . . . . . . . . . . . . . . . . 275
11.8 Practical implications . . . . . . . . . . . . . . . . . . . . . . 277
11.8.1 Getting the ball rolling . . . . . . . . . . . . . . . . . 278
xi
11.8.2 Identifying the reasons of differences . . . . . . . . . 278
11.8.3 To clarify intra-organisation communication . . . . . 279
11.8.4 Contribution to theory . . . . . . . . . . . . . . . . . 279
Appendix A Aide Memoire Used for Interviews 281
A.1 Information collected in each immo . . . . . . . . . . . . . . 281
A.2 Questions asked of each manager . . . . . . . . . . . . . . . 282
Appendix B Biographical Questionnaire 283
Appendix C Construct List 286
Appendix D Distance Ratio Calculations 292
Appendix E Example of IO-degree Calculation 296
Appendix F Finding the Software 298
Bibliography 299
xii

List of Tables
2.1 Lines of inquiry suggested by the literature . . . . . . . . . . 53
3.1 Companies in the sample . . . . . . . . . . . . . . . . . . . . 60
3.2 Managers in the 5 organisations . . . . . . . . . . . . . . . . 61
4.1 Cumulative Foreign investment in Hungary . . . . . . . . . . 100
4.2 Attitude towards JVs . . . . . . . . . . . . . . . . . . . . . . 105
5.1 Differences in intersubgroup means for company A . . . . . . 123
5.2 Correlations for company A . . . . . . . . . . . . . . . . . . 125
6.1 Differences in intersubgroup means for company B . . . . . . 148
6.2 Correlations for company B . . . . . . . . . . . . . . . . . . 149
7.1 Differences in intersubgroup means for company C . . . . . . 176
7.2 Correlations for company C . . . . . . . . . . . . . . . . . . 178
8.1 Differences in intersubgroup means for company D . . . . . . 207
8.2 Correlations for company D . . . . . . . . . . . . . . . . . . 208
9.1 Differences in intersubgroup means for company E . . . . . . 230
9.2 Correlations for company E . . . . . . . . . . . . . . . . . . 231
10.1 Company Characteristics . . . . . . . . . . . . . . . . . . . . 237
10.2 Company Changes . . . . . . . . . . . . . . . . . . . . . . . 238
10.3 Salient issues mentioned in immo . . . . . . . . . . . . . . . 242
10.4 Which factors matter in which organisation . . . . . . . . . 243
xiii

10.5 Summary of difference and similarities . . . . . . . . . . . . 246
10.6 Who selected more of which construct . . . . . . . . . . . . 247
10.7 Who selected fewer of which construct . . . . . . . . . . . . 248
xiv

List of Figures
3.1 Diagrammatic presentation of causal map . . . . . . . . . . . 64
3.2 Association matrix presentation of causal map . . . . . . . . 65
3.3 Distance Ratio, based on Langfield-Smith & Wirth . . . . . 75
5.1 In and out degrees for map cluster-A in company A . . . . . 124
5.2 In and out degrees for map cluster-E in company A . . . . . 126
5.3 Frequently selected nodes in company A . . . . . . . . . . . 126
6.1 In and out degrees for map cluster-B in company B . . . . . 150
6.2 In and out degrees for map cluster-A in company B . . . . . 150
6.3 Frequently selected constructs in company B . . . . . . . . . 151
7.1 In and out degrees for map cluster-A in company C . . . . . 177
7.2 In and out degrees for map cluster-B in company C . . . . . 177
7.3 In and out degrees for map cluster-C in company C . . . . . 179
7.4 In and out degrees for map cluster-D in company C . . . . . 179
7.5 Frequently selected nodes in company C . . . . . . . . . . . 180
8.1 In and out degrees for map cluster-D in company D . . . . . 209
8.2 Frequently selected constructs in company D . . . . . . . . . 209
9.1 In and out degrees for map cluster-A in company E . . . . . 229
9.2 In and out degrees for map cluster-C in company E . . . . . 232
9.3 Frequently selected constructs in company E . . . . . . . . . 232
11.1 Strategic Interest Process . . . . . . . . . . . . . . . . . . . . 261
xv

B.1 First page of Biographical Questionnaire . . . . . . . . . . . 284
B.2 Second Page of Biographical Questionnaire . . . . . . . . . . 285
D.1 Example cause maps A and B . . . . . . . . . . . . . . . . . 292
D.2 Extended Association Matrix for Map A . . . . . . . . . . . 293
D.3 Extended Association Matrix for Map B . . . . . . . . . . . 293
E.1 Example cause map . . . . . . . . . . . . . . . . . . . . . . . 296
E.2 Traditional in- and out-degrees . . . . . . . . . . . . . . . . 297
E.3 Map showing in-degrees and out-degrees . . . . . . . . . . . 297
xvi

Preface
This thesis constitutes my major work over the past three years while a
student of the Judge Institute of Management University of Cambridge and
also a member of St John’s College. Both the data and the ideas presented
here are original for which I bear full responsibility. The work was not
carried out in a vacuum however, and where contributions or suggestions
by others have influenced the final result I acknowledge that contribution
through proper citation in the text referring to an entry in the bibliography
which begins on page 299. Where there is no particular work to cite, I in-
clude a textual note or footnote. Where contributions have been either too
numerous or general for specific mention (such as the comments on drafts
and discussions with my supervisors), a note is included in the acknowl-
edgement section below. All work herein which is not explicitly attributed
to others is strictly my own.
The title of the thesis ‘Barriers to shared beliefs: The role of strategic
interest, managerial characteristics and organisational factors’ differs from
the title of my 1991 thesis proposal ‘Measuring managerial beliefs about
business in international mixed management organisations (immos) located
in Hungary’. However the change in the title does not reflect a change in
method, sample, or basic research question. The new title reflects the re-
sults of the study which naturally were unknown when the research was first
proposed. The Management Studies Degree Committee has acknowledged
this change in the title as not constituting a change in subject matter.
The thesis is approximately 98,738 words long, including tables, fig-
ures, appendix, bibliography, footnotes, and this preface; but excluding
xvii

title page, copyright notice, abstract, epigram, table of contents, list of ta-
bles, list of figures, and page numbers. The Management Studies Degree
Committee has granted prior approval for the exceptional length of this
thesis.
The thesis contains 22 tables, a list of which begins on page xiii, and 28
figures, a list of which begins on page xv. The number of tables and figures
fall well within the limits set by the Management Studies Degree Committee
and the Board of Graduate Studies.
This thesis is the first to be completed by a student of the Judge
Institute of Management Studies. While it is my sincerest expectation
that future generations of students will produce theses which exceed the
level of quality that I could achieve, I also hope that they will look back
upon this and consider it a good start.
Acknowledgements
No work of this nature is produced in isolation, and my interactions with
a large number of people over the past three years have contributed to it.
I would like to thank and acknowledge their contributions.
First there is the contribution of hundreds of people, many of whom I
have never met, their names are listed in the bibliography and their contri-
butions are cited in the text. In addition to these, I benefited from seven
types of contributions during the past three years working on this thesis. I,
and I believe this thesis as well, have benefited from those who I discussed
various ideas with and argued with about many of the issues and claims
mentioned here; from those who took the time to read drafts of chapters
and provide me with comments on both substance and form; from those
who provided encouragement and “spiritual” support; from those people
and institutions which provided material support; from my examiners; and
from those people and organisations who participated as subjects; and from
the person who provided technical support for both the physical produc-
tion of the thesis and for the many computational tasks involved in in the
xviii

research reported here as well.
I have had useful discussions about many of the questions and is-
sues contained in here with John Child, Jeff Goldberg, Marton Gyombolai,
Matthew Jones, Erzsebet Kovacs, Mauri Laukkanen, and Kari Lilja.
I would like to give very special thanks to those who read and reread
drafts of chapters. These include my supervisors, John Child and Matthew
Jones, as well as my husband, Jeff Goldberg.
A number of people have provided me with encouragement and were
there to remind me that I can and should see the project through to com-
pletion exactly when I needed that reminder. These included John Child,
Betty Glasser, Jeff Goldberg, Gerry Johnson, Yuan Lu, Jone Pearce, and
Janet Spitz.
I was granted a World-Bank scholarship for two years of my study at
Cambridge, without which I would not have had to opportunity to pursue
a three year project with all the support provided by Cambridge Univer-
sity, St Johns College and the Judge Institute of Management Studies.
For the research conducted, I was provided with a grant from the Centre
for International Business in the Judge Institute of Management Studies
at Cambridge and a grant from the Hungarian National Science Research
Fund (OTKA). The Business Economics Department of the Budapest Uni-
versity of Economics provided me with office support both during the data
collection and the writing of the thesis. Cranfield University has allowed
and encouraged me to dedicate my first few weeks of employment there
to the completion of this thesis. During the course of the research I also
received travel grants from the Soros Foundation and from Cranfield Uni-
versity.
I am grateful to the five organisations and the 111 individuals who
took part. I am also grateful to Istvan Bartok, Jeff Goldberg, Peter Nagy,
Tibor Tamas and Ferenc Toth for their participation in various reliability
tests.
The thesis examiners, Peter Grinyer and Max Boisot, made a number
xix

of comments which necessitated minor modifications of the thesis. These
minor modifications have lead to major improvements. I offer many thanks
for the work you put into reading the thesis as thoroughly as you did.
Jeff Goldberg assisted with the typesetting of the thesis and also wrote
all of the specialised software used for the thesis work (see Appendix F).
Finally it should be said that while many individuals made suggestions
and in one way or another contributed, I did not always follow their advice,
and so all errors should be taken as my own; and I am sure that none of
the people listed above agree with all of the opinions and claims herein.
Lıvia Anna Markoczy
St Johns CollegeThe University of CambridgeDecember 1994
xx

Chapter 1
Introduction
One of the 111 managers interviewed in the course of my fieldwork ex-
pressed the following view about differences between managerial beliefs on
business.
The mentality was completely different [between host-country and
foreign managers] than what I experienced earlier. [Local] people are
less business minded, perhaps we [foreigners] are extremely business
minded. We want to have factual results as quick as possible. They
are more oriented to a lot of talking. I felt in the start and still feel
a lot of escaping behaviour which I can judge because of the history.
So it means that we have to check everything, have to follow up
everything, have to push everything.
Another expressed a somewhat different view.
It is obvious that where I sit determines what I see and think. So,
for example, I am in the production area as my organisational place
is concerned. This area has its special tasks, so it is obvious that I
will consider other organisational issues from this point of view.
A third had yet another opinion.
[Managers in the production and R&D areas think alike, be-
cause] these are the two areas which are based on clear disciplines.
These disciplines have developed not only for decades but for cen-
turies. . . The whole topic is covered if we notice that these are based
1

on the sciences or in other words on the natural sciences. These
areas do not deal with the human side, like finance, marketing or
other areas do. . . they are more objective than those. For example,
there have been lots of changes in financial systems during the last
decades and lots of different systems formed as a consequence. But
a mathematical formula, or a physical law, could not be changed
this way, since it is more objective.
A fourth stressed the similarities.
Our [the foreign and the Hungarian managers] way of thinking is
roughly 95% the same since we are all human, but that remaining
5% still means a lot.
Who is right? All of them? None of them? Not only do the man-
agers not know the answer, but researchers don’t know either (see chap-
ter 2), nevertheless there is no shortage of hypotheses about what sorts
of managerial characteristics may contribute to what they believe about
business and business success (again see chapter 2). I submit that just to
ask what managerial factors matter in this regard is the wrong question. It
is more important to ask which factors matter the most. After looking at
which factors matter the most in five organisations in Hungary with mixed
foreign–Hungarian management teams, I have come to the conclusion that
which factor or factors matter the most depends on the situation of the
organisation (see chapter 11), but in a clear and predictable way.
This research has its roots in studies which go back several years in
time. The first study in the series was conducted to identify existing cul-
tural differences between managers in five international mixed management
organisations (immos) in Hungary and is described in Markoczy (1993b).
That study was based on the assumption that the basic differences in the
business beliefs and knowledge state between managers must be along cul-
tural/national lines, therefore concentrated on those differences and on
learning to overcome them. This work was followed by a serendipitous
discovery by John Child and myself. John Child had conducted an in-
2

dependent study in Chinese immos and after comparing the findings in
Hungary and China we found striking similarities in the attitudes and way
of thinking between Hungarian and Chinese managers. After exploring sev-
eral alternative arguments we concluded that similarities in the past system
of industrial governance in Hungary and China might account for the sim-
ilarities (Child and Markoczy, 1993). The novelty of this study was that it
recognised similarities among managers with different cultural backgrounds
and did not start with the assumption of differences as many other studies
did before. Next, a new research project was launched by John Child and
myself which aimed to identify the major internal and external issues in im-
mos in Hungary and China. This work included 30 interviews in Hungary
which various colleagues and I conducted in 15 immos with one Hungarian
and one foreign senior managers in each company (Child, Markoczy and
Cheung, 1994; Markoczy, 1993b). During these interviews I was struck
both by the similarities and differences in the business beliefs of managers
which sometimes seemed to lie on cultural backgrounds, other times on
age, other times on education, and yet other times on organisational char-
acteristics. Furthermore, it often seemed to contradict what the managers
themselves said about where differences lie. These questions and paradoxes
led me to undertake a larger study aimed to find out where differences and
similarities really lie between managers in an organisation.
1.1 Organisation of the thesis
Chapters 2, 3, and 4 all provide the background which is needed to fully
appreciate the data presented in chapters 5 through 9. Chapter 2 surveys
what other researchers have suggested about where differences and similari-
ties might lie, why such differences might be important, and on what theory
and sorts of data their proposals have been based. Chapter 3 describes the
methods which were applied for data collection and also the techniques
which were used to analyse the data. Chapter 3 also describes the nature
of the sample and issues surrounding the applied level of analysis.
3

Chapter 4 provides an overview of the situation in Hungary at the time
of the study and a brief recent history. By doing so, it describes conditions
that are relevant to all of the companies in the sample.
Chapters 5 through 9 describe each company with a brief history, an
outline of its situation at the time of the fieldwork, changes which took
place after the formation of the immos and the salient issues which the
organisations needed to face. For the reader who is more interested in a
textual description of the organisations, it is possible to read chapter 4 and
then the first sections of each of the chapters 5 through 9. However, the
comparisons (chapter 10) and conclusions (chapter 11) use both the textual
descriptions and the analysis of the data gathered according to the method
described in chapter 3 looking at factors discussed in chapter 2.
Chapter 10 contains a comparison of the results from the five compa-
nies in order to detect a pattern. Chapter 11 discusses the pattern that
emerges from the data and its implications for organisation theory and
practice. These two chapters (10 and 11) are the the real “conclusion” to
the thesis. A reader who wants to get right to the results and is willing to
skip the data, discussion of where it comes from, and motivation for what
factors were looked at, can read those two chapters alone. However, only
by reading the entire work will the reader be in a position to truly evaluate
my conclusions.
The thesis is relatively long, and for that I apologise. But I was left
with little choice. There has been a great deal of work in the field which
is relevant to this study and that has made chapter 2 the longest chapter
here. Both the method used and the environment of the organisations may
be unfamiliar to most readers necessitating the length of chapters 3 and
4. Each of the five organisations studied have their own unique properties
and histories as well as results, thus making those chapters long as well. In
order to speed the reader on his/her way to the conclusions I will provide
no further introduction but allow the work to speak for itself.
4

Chapter 2
Previous work on the subject
A great deal of work has addressed the effect of various managerial, organi-
sational or environmental characteristics on managerial perceptions, beliefs,
values, attitudes, motivations and behaviours. The studies reviewed here
fall into four broad categories from the point of view of what they have
contributed in this respect: (1) works which look at the effect of national
differences on managerial beliefs (section 2.1); (2) investigations of manage-
rial beliefs in international strategic alliances (isas) (section 2.2); (3) those
which investigates the effect of demographic characteristics on managerial
cognition (section 2.3); and (4) those which concentrate on the influence
of industry and sector (section 2.4). The studies mostly focused on the
relationships of just one or two of these cognitive or behavioural categories
and individual, organisational or environmental characteristics which affect
these categories. Given that the goal of this review is to identify what fac-
tors might have potential influence on managerial cognition, studies which
focused on any cognitive or behavioural phenomena are reviewed here. For
example, in section 2.3 a study is discussed which has found relations be-
tween the age of managers and their level of risk aversion, while section 2.4
addresses how working in a certain industry influences strategy formation.
It is not important that one of these is looking at strategy formation and
the other at risk avoidance; what is important is that one raises age as a
potential factor and the other industry membership.
In addition to identifying factors which might influence managerial
5

beliefs studies on national cultural differences and on isas also address
relevant issues and potential conflict sources in international organisations.
These may be important to understand why similar or different beliefs were
formed within the investigated organisations so these are also addressed.
Although those works which are reviewed here followed different lines
of inquiry they all contained implicitly or explicitly the assumption that
managerial beliefs, values, and attitudes and the factors which affect these
should be studied because they influence the suitability of managers to
a given position, their decision making and other behaviours which have
consequences for the performance of organisations. In other words these
works have been closer to that end of a continuum of inquiries which
assume that managers are important mediators between contextual fac-
tors and organisational responses, so they exercise strategic choice (Child,
1972; Silverman, 1970), as opposed to those studies that assume an al-
most deterministic influence of contingency factors on the organisational
performance and survival (e.g., Hannan and Freeman, 1977; Hannan and
Freeman, 1989; Pugh, Hickson, Hinings and Turner, 1969; Pugh, 1981).
In the tradition of the strategic choice literature, managers matter because
they are the ones who identify those trends, developments and events which
might have a significant influence on the future development of their organ-
isations (Jackson, 1992; Dutton and Ottensmeyer, 1987; Dutton, Walton
and Abrahamson, 1989), who assign attribution to these issues (Dutton
and Jackson, 1987; Thomas, Clark and Gioia, 1993), who generate alterna-
tive solutions (March, 1988), who make decisions (Tversky and Kahneman,
1988), and who influence the implementation of those decisions. The issue
identification that Dutton et al. (1989) called “strategic issue diagnosis”
depends on what issues managers believe or perceive as relevant (Walsh,
1988; Markoczy, 1995), and how they see the relationship between these
issues (Markoczy, 1994). Problem sensing and attribution and choice of
action also depends on the values, and attitudes of managers.
In the following discussion, those characteristics of managers that have
6

been hypothesised to be related to any of these cognitive or behavioural
issues are listed. It is not required that the relationship has been demon-
strated, but merely suggested in the literature. However, for some selected
works, it is important to mention not only what was found, but what those
findings were based on. When some “result” is first published it is usually
read with a proper degree of scepticism; when it is cited, and then works
which cite it are cited, the first tenuous result becomes part of the canon
with no more consideration of the basis for the original claim. This point
is largely a reiteration of Weick (1979, p. 18):
Any discipline will rise or fall depending on the reliability and va-
lidity of the observations on which its theories are based. Few fields
have made so much of so little as has organisation theory. The large
number of theories, concepts, and prescriptions in this field far out-
distance the empirical findings on which they are supposed to be
grounded.
2.1 National background
The effect of national backgrounds on the similarities and differences in
the perceptions, values, beliefs, attitudes and behaviours of various groups
of people has been widely discussed (see for example the special issues
on national culture in the Journal of International Business Studies, Fall
1983 and Management Science January 1994) The dominant line of inves-
tigation has been concerned to reflect on the effect of national culture on
these factors (e.g., Hofstede, Bond and Luk, 1993; Hofstede, 1994b; Haire,
Ghiselli and Porter, 1966; Trompanaars, 1993; England, 1967; Schneider,
1989; Hambrick and Brandon, 1988), while others explained similarities
and differences based on the system of industrial governance (e.g., Child
and Markoczy, 1993; Whitley, 1993) and on the level of industrialisation
(e.g., Galbraith, 1967; Kerr, 1983; Harbison and Myers, 1959). There have
been no clear boundaries between these types of investigations. Studies of
national culture often equated national culture with a country or nation
7
including the system of industrial governance, level of industrialisation, in-
stitutions, or other historical or political factors in national culture. This
review concentrates on the studies of national culture and nations which
form the bulk of the literature. Works on the system of industrial gov-
ernance and on the level of industrialisation and institutions are also ad-
dressed because of the criticism they raised towards the national cultural
tradition.
2.1.1 Levels of investigation
Hofstede (1994a, p. 5) described culture as “a collective programming of the
mind which distinguishes the members of one group or category of people
from another”. This description of culture implies that culture is in fact
a relative and not absolute category and it is not a characteristic of any
single individual but it is a basis for comparison between individuals, groups
of individuals or societies. In his description of culture Hofstede (1994a)
took a simplified view because culture also includes social relationship and
practices between these individuals which differentiate them from others
(Kluckhohn, 1946).
National culture has been investigated at various levels and for various
purposes. Several studies were conducted on the national level to identify
universal value dimensions along which national cultures could be distin-
guished (e.g., Hofstede, 1980; Hofstede, 1994b; Trompanaars, 1993). Other
studies identified relationships between national culture and the preferred
types of organisational cultures (e.g., Trompanaars, 1993; Lachman, Nedd
and Hinings, 1994). Others investigated the relative importance of na-
tional culture to explain similarities and differences among subjects who be-
longed to different national cultural groups in strategy formulation (Schnei-
der, 1989), in attitudes and assumptions underlying management practices
(Haire et al., 1966), in values (Hambrick and Brandon, 1988; England,
1967), in business related thinking (Trompanaars, 1993), in ideals (Baird,
Lyles and Orris, 1993), in goals (Quinn and Holland, 1987) and in work
8

related behaviours (Hofstede et al., 1993; Jackofsky and Slocum, 1988).
National cultural studies which were conducted on different levels have dif-
ferent strengths and weaknesses and differential relevance to the main focus
of this study as discussed below.
2.1.1.1 National level studies
Cultural studies which were conducted on a national level could not be
directly applied to individual and group levels but they describe the context
with which these individuals and groups have to cope. As Hofstede (1994a,
pp. 253) wrote:
The usefulness of the country scores is not for describing individuals,
but for describing social systems these individuals are likely to have
built. Social systems are not made for the exceptional individual,
but they have to take account of the dominant values of the majority
[of] the people involved.
National cultural studies at a national level have been mostly con-
cerned to search for problems which various national, religious or ethnic
groups had to face but to which different national or ethnic groups pro-
duced different solutions. In other words, they searched for cultural value
dimensions which could be used to differentiate between various national
cultures. The methods of these studies extends from “story telling” to
rigorous investigations.
One of the major, survey types of studies in this respect was Hofstede’s
(1980) research which was conducted in IBM subsidiaries in various coun-
tries. His sample included 72 subsidiaries, 38 occupations, 20 languages
at two points in time 1968 and 1972. For identifying value dimensions on
the national level Hofstede (1980) first calculated the mean of the scores
of the respondents within each country and analysed these mean scores
as opposed to the scores of each individual. This means that he compared
what he called “central tendencies” between nations as opposed to the value
scores of individuals. For his analysis he used a simplified view of national
9

culture equating the mean scores with the national cultures, and this needs
to be kept in mind when one interprets the validity of his results. The
country level value dimensions which emerged were power distance (de-
pendence relationship between superiors and subordinates), collectivism
(power of groups above individuals), masculinity (gender roles), and un-
certainty avoidance (tolerance of uncertainty). Based on Michael Bond’s
research in China, a fifth dimension was later added to the list: long term
versus short term orientation (orientation towards the future vs. orienta-
tion towards the past and present) (Hofstede, 1994a). How various nations
score on these dimensions was used to provide the basis for predictions of
the kind of organisational cultures which these societies are likely to form
and about the values which are likely to be considered in these societies as
norms as discussed in section 2.1.1.3 below.
Another notable national level study of national culture was conducted
by Trompanaars (1993). He identified three categories and five dimensions
to differentiate among nations. The three categories were relationship with
people, passage of time, and relationship with the environment. Relation-
ship with people was divided into five dimensions: universalism vs. par-
ticularism; individualism vs. collectivism; neutral or emotional; specific vs.
diffuse; achievement vs. ascription. Given that his book was targeted at
practitioners, Trompanaars (1993) did not discuss his method in his book.
Instead he listed questions to which managers who participated in his con-
sulting sessions had to answer with “yes” or “no” and listed the percentage
of managers who answered either way for each country. The sample size
used to calculate these percentages in the countries and the composition of
the samples was not discussed. Given that the list of countries varied from
figure to figure it is reasonable to assume that in various countries and vari-
ous groups different sets of questions were asked which implies that system-
atic surveys were not conducted. Although a short chapter (Smith, 1993) in
the appendix of Trompanaars’s (1993) book was devoted to methodological
issues, these questions were not answered there either. Smith (1993) stated
10

that the findings were based on 14993 responses from 92 countries which
were collected during consulting work and training courses. It was not
made clear, but implied, that respondents did not fill out complete ques-
tionnaires but answered only various numbers of questions, given that the
14993 responses to individual questions included over 1000 responses from
two countries (Britain and The Netherlands), 35 countries with over 100
responses and ten countries with 50–100 response (Trompanaars, 1993).1
Although the lack of methodological discussion makes it difficult to draw
conclusions from the results, the work provides real life stories and anec-
dotes on national cultural differences and their consequences which serve
to illuminate the questions.
2.1.1.2 Cultural studies at the national-level
As the above works suggest, studies on national cultures at the national
level have focused on finding national level differences, and have therefore
not been concerned with individual variations within nations. They have
also neglected those issues which might reflect similarities as opposed to
differences among all nations from the cultural dimensions they addressed.
Subjects were categorised on the basis of their nationalities only and not in
terms of what other groups or categories these subjects were also members
of, such as gender, profession, generation etc. To control for individual,
or group variations (other than nationality) these inquiries either applied
matched samples across nations (Hofstede, 1994a) or used large enough
random samples such that individual variations within the sample would
not influence the results substantially (Trompanaars, 1993). They also used
for country level comparison means of scores or percentages as opposed to
data drawn from individuals. As these studies were looking for differences
they were not concerned with the effect of human nature which is likely to
produce universal characteristics. One can never conclude from these sorts
1By the same counting method the author of this thesis could claim, if she were soinclined, a pool of 15429 responses in the present study. However, such numbers whetherdescribing this sample or Trompanaars’s (1993) are of little use.
11

of studies that differences are more important than similarities between
human subjects who belong to different national cultural groups. These
studies also do not address the question of whether the major differences
and similarities between subjects are along the line of national differences –
although they tend to imply that they are (e.g., Trompanaars, 1993; Lach-
man et al., 1994; Baligh, 1994). What they do say is that national differ-
ences exist, but the question of whether these are large or small compared
to other differences remains not only unanswered but unasked.
It has been a surprisingly frequent mistake in the literature that na-
tional level differences have been directly treated as individual differences
between subjects who belong to different national groups. Attributing na-
tional cultural differences to individuals is a problem addressed by various
authors. Triandis (1989) found it necessary to explicitly distinguish the
societal and the individual level of analysis because he recognised that in-
dividual members of collectivist societies do not necessarily hold collectivis-
tic values. Hofstede et al. (1993) referred to the problem as the “ecological
fallacy”. According to Jackofsky and Slocum (1988, p. 69) the “ecologi-
cal fallacy occurs when the researcher does not stipulate whether the level
of analysis of variables is individual, group or organisational”. Hofstede
(1980, p. 253) warned researchers that national cultural research looks for
“central tendencies” which should not be interpreted as individual differ-
ences. He provided an example of why it is necessary to be careful about
the “ecological fallacy” (Hofstede, 1994a, p. 253):
American IBM respondents tended to score much more individualist
than Japanese respondents. However, some Japanese respondents
gave quite individualist answers: they scored more individualist than
the average for the Americans. Some Americans scored quite collec-
tivist, more collectivist than the average for the Japanese IBMers.
In his analysis, Earley (1994) found it necessary to separate the na-
tional cultural and individual level aspects of the cultural value dimensions
which he investigated (collectivism vs. individualism). Although in Earley’s
12

(1994) study the differences between the two levels did not turn out to be
strong, other studies should also consider that differences in this respect
might exist.
The above arguments explain why the results of national level stud-
ies could not be directly used at the organisational, group or individual
levels. They provide a good source to develop a theoretical basis for de-
signing studies at group and individual levels, for example, to see whether
these dimensions are also differentiating factors among certain groups (like
managers, students or workers) with different national backgrounds (e.g.,
Baird et al., 1993), or to see, by comparing individuals, what proportion
of individual differences could be explained by national cultural differences
(e.g., England, 1967; Haire et al., 1966).
2.1.1.3 National cultures and organisations
Studies concerned with the relationship between national and organisa-
tional culture provide indications of the types of organisational culture and
ways of organising that could be expected to be preferred by various na-
tional cultures.
Trompanaars (1993) argued that the national cultural preferences of
the participants of organisations shape the organisational culture they cre-
ate. He distinguished four types of organisational cultures along two dimen-
sions: equality vs. hierarchy and person vs. task orientation. The four types
of organisational cultures were the family (hierarchical, person oriented),
the Eiffel tower (hierarchical, task oriented), the guided missile (egalitar-
ian, task oriented), the incubator (egalitarian, person oriented). He argued
that subjects with different national backgrounds tended to prefer differ-
ent organisational cultures. For example, in the U.S.A., Canada and UK
organisations were more likely to have guided missile cultures, while the
Swedish organisations had more incubator cultures. In Germany, Denmark
and The Netherlands the Eiffel tower culture was preferred while France,
Belgium, India, Spain and Japan tended to develop organisations with
13

family cultures.
Hofstede, Neuyen, Ohayv and Sanders (1990) established the dimen-
sions of corporate (or unit), cultures based on an extensive study. They
looked at 20 units in ten organisations (five in Denmark and five in The
Netherlands). First they examined the unit’s cultures through in depth
interviews (9 people were interviewed per unit) then they constructed a
questionnaire based on these interviews to measure unit culture. They
based their analysis on the 1295 completed and returned questionnaires.
They found the following dimensions which could be used to distinguished
between corporate cultures: (1) process vs. results oriented (concern with
means vs. concern with goals); (2) employee oriented vs. job oriented (con-
cern for people vs. concern for completing the job); (3) parochial vs. pro-
fessional (identity largely from the organisation vs. identification with the
job); (4) open system vs. closed system (open vs. closed towards outsiders);
(5) loose vs. tight control (rules and codes should be strictly followed); (6)
normative vs. pragmatic (mission towards outside word vs. market ori-
entation). Among these 6 dimension three were found to resemble the
cross-national dimensions (1, 3 and 4) while 1, 3, 5, and 6 related to the
type of work the organisational unit does (the dimensions partially over-
lapped.) (Hofstede, 1994a, p. 192).2 The dimensions which were related
to the type of work of the unit “partially reflect the business or indus-
try culture” (Hofstede, 1994a, p. 192 [italics original]). This suggests that
the business and industry culture is at least as important a differentiating
factor among corporate cultures as national culture itself.
Hofstede (1994a) also argued that certain national cultures prefer cer-
tain organisational structures. He showed a connection between the five
types of organisational structure identified by Mintzberg (1983) and two
of the national culture value dimensions: uncertainty avoidance and power
distance. According to Mintzberg there are five types of organisational con-
figuration (adhocracy, simple structure, professional structure, full bureau-
2Dimension 2 was not put into any of these categories.
14

cracy and divisionalised form), which apply different coordination mecha-
nisms (mutual adjustment, direct supervision, standardisation of work pro-
cesses, standardisation of outputs, standardisation of skills) and key parts
(the operating core, the strategic apex, the middle line, the technostruc-
ture, the support staff) and these are likely to occur in five combinations.
Hofstede (1994a) argued that these five types of configurations correspond
to the uncertainty avoidance and power distance preferences of nations. He
argued that nations with low uncertainty avoidance and low power distance,
like Britain prefer to have adhocracy (where the coordinating mechanism is
mutual adjustment and the key part is the support staff), and nations with
high uncertainty avoidance and high power distance, like France prefer to
have full bureaucracy (standardisation of work process, technostructure).
Moreover, nations with low uncertainty avoidance and high power distance,
like China prefer simple structure (direct supervision and strategic apex),
while those with high uncertainty avoidance and low power distance, like
Germany prefer to have professional bureaucracy (standardisation of skills
and operating core). Those nations which scored relatively low in both
cultural dimensions, like the US prefer divisionalised form (standardisation
of outputs and middle line management).
Like the national level studies, studies investigating the relationship
between national cultures and organisations have mostly been concerned
with finding differences rather than similarities. As they were concerned
with differences they have not been interested in whether similar contin-
gency factors lead to similar organisational characteristics independent of
the national cultural backgrounds as is argued by the “culture free” ap-
proach of the contingency theory (Pugh et al., 1969). It might be the case
that differences and similarities between organisations and between nations
exist at the same time, and whether one finds similarities or differences de-
pends on the focus of the study and on the level of abstraction one applies.
The studies in question have also tended to attribute any national differ-
ences to cultural differences in the way of organising and not to consider
15

whether national level differences could be attributed to institutional differ-
ences (e.g., Maurice, Sorge and Warner, 1980) or differences in the system
of industrial governance (Child and Markoczy, 1993).
2.1.1.4 National differences between groups and individuals
A limited number of studies in the national cultural literature have inves-
tigated how much of the differences in the beliefs, assumptions, values and
norms of subjects could be attributed to national cultural differences. This
is closely related to the research this study addresses.
In an excellent study Haire et al. (1966) measured whether the atti-
tudes and assumptions behind management practices, beliefs about the role
of managers, and the needs and need satisfaction of managers were simi-
lar or different across nations. They used a multi-item questionnaire which
was limited to three areas: leadership, role of managers in their culture and
the motives of managers. They applied this questionnaire in 14 countries
to a sample of 3641 managers. Using their questionnaires they calculated
the means and standard deviation for the whole sample. Then they calcu-
lated the mean and standard deviation of the country means. Next they
calculated a ratio between the two standard deviations: standard deviation
of the whole sample and standard deviation of the country means. This
ratio could vary between 1 and 0, where 1 would mean that nationality
completely accounted for the found differences while 0 mean that nothing
was explained by country differences. The following ratios were shown to
be accountable by national differences (Haire et al., 1966, p. 8):
Attitudes and assumptions underlying management practices, .32;
cognitive descriptions of the managerial role, .26; needs and need
satisfaction, .27 – an average of .28. This means that of all the vari-
ation observed, about 28% was associated with national groupings;
the differences among individuals are about 2 1/2 times as great as
the differences among countries.
Unfortunately, these authors did not investigate the relative impor-
16

tance of the functional backgrounds, experience, education specialisation,
education level or the gender of the individuals in contributing to individual
differences which were found, and which may have answered to the ques-
tion whether the large variation between individuals could be attributed
to their affiliation to various groups (professional, gender etc) or if these
were truly individual differences. They made a limited investigation in this
respect by calculating the influence of age (they differentiated old (> 40),
and young managers), size of the company in which the managers worked
(large (> 500), and small) and position (higher (top third), and lower).
Interestingly, they did not find any of these factors to be influential to
the similarities and differences of the managerial attitudes, motivations or
perceptions. One of the strengths of this study was that the authors were
not only looking for differences but also similarities between the beliefs of
managers who belonged to different nations. They found, for example, that
in all investigated countries “to direct” had better connotations than “to
persuade” which suggest similarities in the values of managers with differ-
ent national backgrounds in this respect. ““To direct” has more “prestige”,
“activity” and “firmness”. It is close to “decide”. “To persuade”, on the
other hand, is closer to making a mistake and cheating.” (Haire et al.,
1966, p. 171).
In a series of studies (England, 1967; England and Lee, 1971; Whit-
ley and England, 1980) England and others also investigated the relative
influence of national culture on managerial cognition: in this case on the
personal values of managers. They applied a “Personal Value Question-
naire” (PVQ) to measure and compare the value system of managers from
different countries. The PVQ was originally developed to measure the per-
sonal value systems of American managers. England (1967, p. 54) viewed
a personal value system “as a relatively permanent perceptual framework
which shapes and influences the general nature of an individual behaviour”.
The PVQ consisted of 66 items in five categories: goals of business, personal
goals of individuals, groups, views on people and on general topics. Re-
17

spondents had to rate the 66 items on an importance scale (high, average,
low importance) and indicate why they saw these as important (either be-
cause they were associated with success, rightfulness or with pleasantness).
He found that American managers were more pragmatical than ethically
or affect oriented because they attached high importance to constructs
which they related to success. Using the PVQ questionnaire England and
Lee (1971) compared the value systems of American, Japanese and Ko-
rean managers. They chose these three countries because these differed
in national culture, economic development and applied technology. They
selected 1600 managers matched by organisational size, level of managers
in the organisation and the function of the managers. They found that
Korean and Japanese managers were more similar to each other in their
value system than to the American managers. They concluded that relative
similarities in the national cultural background influenced the similarities
in the personal value system of managers. They also implied that national
cultural background had relatively greater influence on the similarities of
value systems compared to economic development and to applied technol-
ogy. In another study England (1975) compared the personal values of 2000
managers from the U.S., Japan, Australia, Korea, and India. He found that
country differences explained 30 to 45 percent of the variation in manage-
rial values which was higher than was found by Haire et al. (1966), but
still left 70 to 55 percent of the variation unexplained. One of the crit-
icisms which could be raised against the PVQ was that it was originally
developed for American managers. Hofstede (1994a, p. 254) argued that
“cross-cultural research should only be done with cross-culturally designed
instruments for which the content was collected in a number of different
countries, culturally as different as possible”.
From the above studies it could be concluded that national cultural dif-
ferences were found to explain only some of the similarities and differences
between managers but at the same time left a large part of individual dif-
ferences unexplained. Unfortunately, studies such as the above have been
18

in the minority compared to studies which have investigated issues about
which managerial groups with different national backgrounds seem to think
differently. The literature has been dominated by studies which divide up
subjects by nationality (or some similar dimension) and then looked for
the nature of differences between these groups as opposed to the relative
importance of these differences in terms of what proportion of the similar-
ities and differences between the thinking or action of the subjects these
differences might explain.
One of the better of these types of studies was Schneider (1989). She
argued that national cultural differences between managers were likely to
influence the way these managers perceive, think, feel and evaluate alterna-
tives and she speculated that therefore national cultural differences would
influence the strategy formulation process. She looked at the dimensions
found by previous studies to differentiate between nations (e.g., Hofstede,
1980; Ronen and Shenkar, 1985) and made a large jump in assuming that
those who make strategic decisions and practice control within organisa-
tions were likely to be distinguishable along the same value dimensions as
their nations. She also assumed that these managers would select, inter-
pret and validate information, establish priorities, consider certainty and
urgencies influenced by these values.
The relationship between the values of managers and the value dimen-
sions of nations, however, is not as straightforward as she assumed. Hof-
stede et al. (1993), for example, showed that the value dimensions along
which individuals could be differentiated are different from the dimensions
along which corporate cultures could be distinguished and that only the
latter show resemblance to national level value dimensions. He reanalysed
the responses to the 1295 questionnaires which had been used to iden-
tify dimensions of corporate cultures (and which were partially similar to
the national level value dimensions as discussed in section 2.1.1.3) on the
level of individuals controlling for differences between organisations. He
identified 12 dimensions, along which individual values could be distin-
19

guished. Six of these reflected individual values while the other six were
the individual perceptions of practices. These former were personal need
for achievement, need for supportive relationships, machismo, workaholism,
alienation, authoritarianism, professionalism, distance from management,
trust in colleagues, orderliness, hostility, integration. It is notable that
the value dimensions along which individuals differed were clearly different
from those found at the corporate level. His study is a clear example of
why it is important to be careful not to assume that country or corporate
levels differences will be directly applicable at the individual level.
It must also be kept in mind that managers who make strategic deci-
sions are not representative of their nation in terms of their values. Man-
agers are a selected group of individuals with special types of education
and opportunities. Haire et al. (1966, p. 9) for example were struck by
the similarity of managerial responses to their questionnaire and suggested
that they offered some support for the universality of managerial philoso-
phy, although it must be noted that they did not check whether individuals
other than managers would also have given such similar answers or not.
Hambrick and Brandon (1988) realized that executive values should
be differentiated along a core set of values that need to be identified first.
They considered among the factors which might influence the value forma-
tion of managers the personality of the managers their socialisation and
cultural backgrounds. For identifying values of executives they crystallised
their core value dimensions from dimensions independent of whether they
were developed to differentiate between nations (Hofstede, 1980), between
managers with different national backgrounds (England, 1967), or between
personalities (Allport, Vernon and Lindzey, 1970; Rokeach, 1973) with-
out worrying about the problem of ecological fallacy. With this method
they identified six major executive values: collectivism, duty, rationality,
novelty, materialism, power. Given that these core executive values were
derived from value dimensions which were established with respect to var-
ious reference groups (nations, managers, different subjects) it is highly
20

questionable whether the authors were in fact able to identify true core
executive values. Although Hambrick and Brandon (1988) were referring
to studies in the national cultural tradition to establish their core executive
values, they were not concerned to establish a relationship between the core
values of executives and national cultural differences between executives.
Baird et al. (1993) conducted a study in this respect in which they
aimed to compare managerial perceptions of managers in Joint Ventures
(JVs) with different national cultural backgrounds. They used a “Joint
Ventures Survey” instrument which contained statements on the manage-
ment of JVs, and subjects had to state on a five-point scale how much
they agreed or disagreed with the statements. The survey was divided into
sections in which questions were asked on how managers saw the success of
a JV, how they conceived an ideal type of JV and what they thought were
the main issues in JVs. The sample of managers who filled out this ques-
tionnaire included a matched sample of 38 Chinese, 24 Hungarian, and 43
American middle-level managers. The authors found that Hungarian and
American managers were closer in their thinking about JVs than to the
Chinese managers. The validity of their findings however was questioned
by Markoczy (1993a) who pointed out that differences in the answers of the
Hungarian, American and Chinese managers might not refer to differences
in their thinking but differences in what they were thinking about. In a
Chinese context JV success, an ideal type JV and the main issues in JVs
might be different because the institutions, the political and economic sit-
uation, and the roles to which companies are assigned are different. These
differences could not therefore be directly tied to national cultural differ-
ences between managerial thinking. Baird et al. (1993) were also mainly
concerned with the nature of differences between national groups without
considering whether the investigated managers could be grouped in any
other way than by their nationality based on their beliefs or values.
Unlike the above studies, Earley (1993; 1994) did not divide up his
subjects automatically into groups based on their nationalities but divided
21

them up after measuring their values. In one of his studies, Earley (1993)
conducted an experiment with the participation of 45 Israelis, 60 Chinese
and 60 Americans to examine the implications of a cultural dimension: in-
dividualism vs. collectivism on the relationship between group membership
and individuals’ performance in group settings. In another study Earley
(1994) examined the theoretical and empirical relationship of training and
individualism–collectivism to self-efficacy (a person’s estimate of their abil-
ities to do a job) and performance in a laboratory experiment and a field
experiment. His laboratory experiment contained 67 Hong Kong Chinese,
96 Chinese and 87 American managers while in his field experiments he used
62 American and 46 Chinese managers. In neither of these studies did he
assume that managers with a certain nationality would automatically be
individualistic or collectivist, but he measured individualism–collectivism
on a scale first for each individual and divided up the subjects based on the
result of this measurement. To see the differences between individualism–
collectivism and national grouping he conducted a two-way ANOVA in
which country was crossed with group condition. “A main effect for coun-
try (F2,156 = 32.28, p < .01, x = 3.72, 3.65, 2.69, for Israel, China, and
the United States, respectively) demonstrated that collectivism was higher
among Israeli and Chinese subjects than among the US subjects” (Earley,
1993, p. 337). The strengths of Earley’s studies compared to other studies
was that he also considered situational factors which were not present in
the other studies we have reviewed. He found, for example, that subjects
behave differently if they work in an ingroup as opposed to an outgroup.
An ingroup is “an aggregate of people sharing similar trait and background
characteristics. Ingroup people may identify with each other via common
interest, values and beliefs, or heritage” (Earley, 1993, p. 321). It was
pointed out by Triandis (1975) that the effect of situational factors (differ-
ences in goals, interest, access to resources, group membership) are often
neglected in the national cultural literature or confused with the effect
of the real national cultural differences which are internal to the subjects
22

(which form the basis of misunderstandings, disconfirmed expectations etc).
Research on national cultural differences at individual and group levels
may be summarised as follows. Only a limited segment of the literature
makes an effort to try to establish the relative importance of national cul-
ture compared to other factors in influencing similarities and differences
in the beliefs, values, perceptions and decisions of individuals (e.g., Haire
et al., 1966; England, 1975). These studies found that individual variation
is in fact much higher than national cultural background is able to explain.
Unfortunately these studies did not go further to investigate what accounts
for this variation – the area where this work is intended to contribute to
our knowledge. Most of the studies were more interested in looking for
the nature of national cultural differences without considering its relative
importance (e.g., Schneider, 1989; Baird et al., 1993) or without separating
the effect of these from situational factors. These latter studies have often
been guilty of the ecological fallacy in assuming that the same dimensions
that were found to distinguish between nations will be relevant dimensions
to distinguish between individuals with a certain national background, or
that individuals from particular nations independent of whether they are
managers or not are likely to hold more similar values compared to those
who belong to other nations.
2.1.2 Other perspectives
2.1.2.1 System of industrial governance
Child and Markoczy (1993) found similarities in the behaviours of Hungar-
ian and Chinese host-country managers in international JVs. These sim-
ilarities could not be explained by similar national cultural backgrounds,
history or level of industrialisation. They argued that the similar system
of industrial governance might account for these similarities. This study
differed from the studies reviewed above in that it was looking for expla-
nations for similarities as opposed to differences in managerial behaviours
and was trying to find explanations for these similarities. Had they, how-
23
ever, been looking for differences they probably would have found them
as with the national cultural studies. Their argument therefore could not
be used to decide whether similarities or differences are what characterise
managerial behaviours across nations.
2.1.2.2 Level of industrialisation
Those who have investigated the effect of industrialisation argue that mod-
ernisation and technical development requires well-educated management
who share a technical rationality. As a consequence of their similar edu-
cation, managers, increasingly resemble each other in their way of think-
ing independent of which country there are from (Galbraith, 1967; Clark,
1968; Kerr, Dunlop, Harbison and Myers, 1960). This view was labelled by
the theorists as “managerial revolution”. From this perspective managers
in modern industrial societies should show more similarities in their busi-
ness thinking compared to other members of their nations independent of
their national backgrounds. This similarity of thinking should be especially
evident among managers educated in the technical area.
Studies on the system of industrial governance and industrialisation
mostly considered explanations for possible similarities in the thinking of
managers as opposed to differences. In this sense they provided alter-
native considerations of why certain similarities could be found in the be-
liefs, thinking or behaviour of subjects with different national backgrounds.
These studies however stayed at the level of prediction, or speculative ex-
planations, for certain phenomena as opposed to measuring whether these
connections between managerial beliefs, and system of industrialisation or
level of industrialisation exist or not. They also did not assess the relative
importance of these factors in influencing managerial beliefs compared to
the national cultural backgrounds of these managers.
24

2.2 International Mixed Management
Organisations
Another line of studies which investigated the effect of contextual and indi-
vidual factors on the beliefs of subjects were works on international hybrids
(Borys and Jemison, 1989). These include studies on international strate-
gic alliances (isas), mergers and acquisitions. International strategic
alliances were defined by Parkhe (1991, p. 579) as “relatively enduring
interfirm cooperative arrangements, involving cross-border flows and link-
ages that utilise resources and/or governance structures from autonomous
organisations headquartered in two or more countries, for the joint ac-
complishment of individual goals linked to the corporate mission of each
sponsoring firm”. They range from licence agreements to joint ventures
(JVs) (when a new organisation is formed by the partners). “Mergers are
the complete unification of two (or more) organisations into a single organ-
isation. Acquisitions involve the purchase of one organisation by another.”
(Borys and Jemison, 1989, p. 235 [italics original]).
Although there has been an increasing interest in investigating the
various types of international hybrids most of the studies have focused on
the negotiation process between the partners or on the relationship between
the partners and/or the venture (e.g., Contractor and Lorange, 1988; Gray
and Yan, 1992; Geringer, 1991; Killing, 1983; Harrigan, 1988) less attention
has been given to the management and personnel problems internal to
the hybrids themselves (e.g., Sales and Mirvis, 1985; Shenkar and Zeira,
1987) and even less to the role of individual, group and organisational
characteristics in explaining the sources of these problems (e.g., Buono and
Bowditch, 1989; Park, Lewis and Fandt, 1993). Studies on international
hybrids varied substantially in their research methods which extended from
surveys to case studies and scenarios (Parkhe (1993) and Shenkar and Zeira
(1987) discuss these methods in detail).
These studies are reviewed based on the following logic. First in sec-
tion 2.2.1 studies which addressed the macro-issues on hybrids are discussed
25

from the point of view of their influence on the types of organisations which
are formed and on the potential internal conflict within these organisations.
Studies which focused on the management and personnel problems are de-
scribed next (section 2.2.2), especially those which looked for explanations
in the managerial and organisational characteristics for these problems.
The studies in sections 2.2.2.1, and 2.2.2.2 address cultural issues and per-
sonnel problems, respectively. In addition, issues which are specific to
hybrids in transforming economies, like Eastern Europe will be described
in section 2.2.2.3. Only issues which pertain to organisations in which full
time international management team works together will be discussed here.
These are called international mixed management organisations (immos)
(Markoczy, 1993b). immos are the matter of interest because, as Killing
(1983) suggests, the cultural and personnel problems are often most salient
in these types of organisations.
2.2.1 Macro issues concerning immos
Studies which were concerned with macro issues mostly discussed the mo-
tives of the alliance formation (e.g., Contractor and Lorange, 1988), partner
selection (e.g., Geringer, 1991), negotiation (Gray and Yan, 1992), con-
trol/power position (Schaan, 1988; Oliver and Davies, 1990; Lyles and
Reger, 1993), learning between partners (Parkhe, 1991; Stopford, 1993;
Mody, 1993; Crossan and Inkpen, 1992), entry strategies to various coun-
tries (e.g., Hedlund and Kverneland, 1993) and the operational and per-
formance problems within the host country (e.g., Welfens, 1992; Csath,
1991; Newman, 1992).
These studies addressed the above issues from various theoretical per-
spectives, such as agency theory, transaction cost theory (Teece, 1982),
game theory (e.g., van den Honert and Stewart, 1992), strategic market the-
ory (e.g., Harrigan, 1988), the resource dependence approach (e.g., Pfeffer
and Nowak, 1976) and network analysis (Thorelli, 1986).
Several reasons were given in the literature as to why firms choose
26

to cooperate or why it is advantageous to them to enter into mergers or
acquire other firms. An extended list was put together on the rationale
for forming cooperative ventures, for example, by Contractor and Lorange
(1988). These included reducing risk, economies of scale, complementary
technology or technical knowledge of the partners, co-opting or blocking
competition, overcoming government-mandated investment and trade bar-
riers, international expansion and vertical quasi integration. This list, how-
ever, could be extended with additional motives for cooperation based on
other studies, like being able to learn organisation-specific knowledge which
is embedded in the organisations (Parkhe, 1991; Stopford, 1993; Mody,
1993; Crossan and Inkpen, 1992; Badaracco, 1991), or to transform or re-
new existing organisations, or to develop market positions (Haspeslagh and
Jemison, 1991).
The importance of selecting the “right” partners (Killing, 1983; Harri-
gan, 1985) to fulfill the objectives of hybrid formation was also recognised
in the literature, but studies remained vague on what selection criteria are
applied or should be applied for selecting the a partner. Even studies which
looked for selection criteria for partner selection showed high disagreement
in their results and did not address what weight was assigned to each se-
lection criterion (e.g., Tomlinson, 1970; Adler and Hlavacek, 1976). Given
that these studies concentrated on various samples of organisations (vari-
ous countries, industries and size) the question was raised whether gener-
ally applicable selection criteria could be found. For handling this problem
Geringer (1991) applied the concept of critical success factors (CSFs). He
found, after conducting a survey and interviewing 81 executive managers
in 81 JVs that the perceived importance of a potential success factor and
the perceived difficulty of the hybrids’ effort to reach a tenable competitive
position influenced the relative weighting of the selection criteria associated
with the given CSF.
In his work Geringer (1991) focused on the task-related selection crite-
ria of the partners as opposed to the partner-related selection criteria. The
27
task-related selection criteria are helpful in selecting partners with com-
plementary skills to best achieve the benefit which is sought by the firms
when they decide on forming hybrids. However, as Parkhe (1991) pointed
out in a speculative paper, hybrids that are formed to exploit differences
which relate to the complementarity of skills and resources also have to cope
with undesirable organisational and individual differences which affect the
longevity and performance of these organisations. These differences could
relate to differences in the national backgrounds of the partners, and in or-
ganisational cultures, in strategic directions, and in management practices.
A partner-based selection might therefore also be essential. Partners may
have different attitudes towards cooperation, different views on issues of
power and control, divergent strategic directions and different practices in
delegation of responsibility, decision making and reliance on formal plan-
ning and control. According to Parkhe (1991) these differences need to be
overcome by organisational learning which may be difficult given that the
differences themselves might curb the possibility of learning.
Based on their review of the literature Gray and Yan (1992) suggested
that which of the partner’s practices the alliance adopts at the end highly
depends on the power position of the partners. What power position each
partner has and how much control they are able to exert on the alliance is
shaped by their initial bargaining positions during the negotiation process
(which could be based on equity, expertise, strategic importance, availabil-
ity of alternatives), and by contingency factors (host country intervention,
industry characteristics). The resulting control and power structure of the
partners could be: that one partner dominates the hybrid; shared manage-
ment; split control independent; or rotating management.
Gray and Yan (1992), however, did not address whether any of these
control or power structures were preferable and under what conditions.
Killing (1983) discussed the issue of control in detail. He argued that al-
liances with a dominant parent were likely to be more successful than a
shared management because of the extra time and effort which the latter
28

requires. He based his analysis on reviewing existing studies and on in-
terviewing managers in 35 joint ventures and parent companies in North
America and Western Europe. In another study Killing (1988) developed a
model in which the division of control and the trust between partners was
tied to the issues of the complexity of the task of the hybrid and the com-
plexity of the organisation. By task complexity he understood the scope of
alliance activities, the environmental uncertainties and the resources and
skills of the relevant partner. Organisational complexity was dependent on
the frequency of the interactions and their routine or non-routine nature.
He argued that the required trust and division of control between partners
was a function of organisational and task complexity. Whether this model
is generally applicable still needs to be tested.
Whether one firm dominates the hybrid or whether partners apply a
shared management approach is likely to influence which integration ap-
proach the parents apply. Buono and Bowditch (1989) distinguished four
kinds of post-combination integration: (1) “pillage and plunder”, when
the acquiring organisation raids a target firm and replaces all operational,
strategic, and cultural systems with its own, (2) “one-night stand”, when
the company is acquired and broken up into different parts, and divested
or integrated according to need; (2) “courtship/just friendship”, when the
main goal is to achieve an effective working relationship but allowing oper-
ational and cultural differences to exist; and (4) “love and marriage”, when
the integration effort aims to blend and assimilate the two operations.
Haspeslagh and Jemison (1991) also distinguished four types of inte-
gration approaches, but they did it on the basis of the need for strategic
interdependence of the partners and the need for organisational autonomy.
They applied a “grounded theory approach” (Glaser and Strauss, 1967) and
claimed that the dimensions “tentatively emerged as the most significant
variables” (p:286) from their interviews with 300 managers in 10 countries
on 3 continents. Among the four types of integration approaches which
could be distinguished based on the above two dimensions they addressed
29

only three in detail, namely “preservation”, “absorption”, and “symbio-
sis”. Absorption (low organisational autonomy, high interdependence need)
means “a full consolidation, over time, of the operations, organisation, and
culture of both organisations” (p:147). The opposite to is preservation
(high organisational autonomy, low interdependence need) when “the pri-
mary task of the management is to keep the source of the acquired benefits
intact, because deterioration in the acquired company’s ways of manag-
ing, practices or even motivation would endanger success.” (p:149). “In
the symbiotic acquisitions (high interdependence, high need for organisa-
tional autonomy), the two organisations first coexist and then gradually
become increasingly interdependent” (p:149). The choice of different inte-
gration methods is likely to create different kinds of problems with respect
to management issues and resistance to change. Unfortunately these were
not addressed by the authors. Rather they discussed these issues from the
point of view of which form of integration is preferable for “value creation”
(Haspeslagh and Jemison, 1991).
Some authors argue that successful integration depends on the un-
certainty and turbulence of the environment. Newman (1992) for example
argued that in a highly uncertain and turbulent environment, such as China
and Eastern Europe, highly flexible, participative and democratic manage-
ment does not lead to success. Using examples from specific firms, he ar-
gued that “focused joint ventures” were preferable. These have: “(1) highly
prescribed operations, (2) narrow product line, (3) sustained commitment
of partners, (4) top-down motivation of the employees, (5) strict perfor-
mance standards for local suppliers” (Newman, 1992, p. 67). Although
this approach made rapid change, which Newman (1992) considered im-
portant for success, possible, he did not consider that foreign partners were
likely to know the local context less than host-country managers, and might
need their cooperation to succeed. In contrast, Lawrence and Vlachoutsicos
(1993) who examined 33 joint ventures in Russia found that the successful
JVs employed local managers at the top levels and encouraged them to
30

use their familiar management methods while Western practices were in-
troduced gradually. Given that both of these studies were mostly based on
anecdotal evidence as opposed to systematic investigations further studies
are needed to decide which approach is more effective.
Several studies which investigated partner relationship between inter-
national firms argued that the compatibility of the partners was highly
dependent on the national cultural distance between the countries of origin
and on the differences between organisational cultures (e.g., Child et al.,
1994).
The degree of national differences between partners was described by
some studies as “psychic distance” (e.g., Johanson and Wieldersheim-Paul,
1975; Johanson and Vahlne, 1977). “Psychic distance is defined as differ-
ences in language, level of education, business practice, industrial devel-
opment and culture” (Hedlund and Kverneland, 1993, p. 107). Authors
argued from case-studies (e.g., Johanson and Wieldersheim-Paul, 1975; Jo-
hanson and Vahlne, 1977) that these differences should be overcome gradu-
ally. They therefore suggested small steps for internationalisation of firms,
for example, by setting up an agent in the new country, then a sales com-
pany, then forming cooperation with a local company, etc. However, based
on a study of 51 Swedish companies in Japan, Hedlund and Kverneland
(1993) argued that it is not necessary to learn to overcome national–cultural
differences in each country. Firms which have experience in internation-
alisation can use this knowledge for doing business in other countries or
entering into cooperation with firms from other countries. This suggests
that general approaches of how to overcome national differences could be
learned, and so adjusting to a new national context does not have to start
from scratch.
International hybrids not only need to learn to overcome national dif-
ferences but also differences between the organisational cultures of the par-
ents. Harrigan (1988) for example argued that the success of hybrids is
highly dependent on the cultural homogeneity of the partners. Other re-
31

searchers did not call for homogeneity but for the cultural compatibility
between organisations (Haspeslagh and Jemison, 1991). Cultural compati-
bility was argued to be an important issue especially in immos where there
was a need to merge the different cultural approaches into one way of op-
erating. If the organisational cultures are compatible it is less problematic
to develop a shared approach to management, otherwise it is very likely
that the more powerful organisation will impose its culture on the hybrid
which the other members resist (Sales and Mirvis, 1985).
Parkhe (1991) argued that differences among parents, based on their
societal, national backgrounds and organisational cultures, were sources of
different tensions and needed to be handled in different ways. Differences
in societal cultures derive from differences in perception and interpretation
of phenomena by the partners and they need to be dealt with by promoting
training programs and informal contacts. Differences in national context
derive from different home government policies, national industries, and
institutions, which need to be dealt with by emphasising economic and
technological imperatives. Differences in corporate cultures relate to dif-
ferent guiding ideologies and values which need to be coped with by en-
couraging learning between members of the parents. Unfortunately, Parkhe
(1991) did not test these propositions nor address the interorganisational
consequences of the various coping mechanisms.
To summarise the above, studies which dealt with the macro-issues of
hybrids mostly concentrated on the relationships between the partners and
the potential conflict sources and coping mechanisms to create successful
hybrids. These conflicts and coping mechanisms are likely to have sub-
stantial interorganisational management and personnel consequences which
although suggested are not fully addressed in these studies. Despite the
criticism of Parkhe (1993) who argued that more theory building, qualita-
tive studies are needed in the area of hybrids most of the studies addressed
above were in fact speculative, anecdotal, or case study based, qualitative
studies whose claims were untested. These studies suggested that the main
32

differences between partners which are likely to have substantial conse-
quences on the integration process within the hybrid relate to the relative
power positions of the partners and to their compatibility in terms of their
purpose, national and organisational cultural backgrounds. The integra-
tion approaches are likely to influence the internal conflicts and problems
within the hybrids and through these the future success of the organisation.
2.2.2 Issues within immos
Compared to studies on macro-issues there have only been a limited amount
of studies which address the cultural, personnel and managerial issues
within immos. These studies are reviewed here, concentrating on the na-
ture of the issues and also on the individual, group, task or organisational
specific factors which were explicitly or implicitly stated to lie behind these
problems.
2.2.2.1 Cultural differences in immos
While some of the studies which concentrated on macro issues addressed
the rationale for preferring one mode of post-combination integration to an-
other in certain types of hybrids, these studies did not investigate the pos-
sible human consequences of the given integration approaches. Other stud-
ies, however, argued that not investigating the possible cultural and human
consequences of a merger or acquisition is missing the point given that the
integration process itself is primarily a culturally driven phenomenon (Sales
and Mirvis, 1985). These studies suggested that in the post-combination
integration process one of the main managerial challenges is to overcome
the differences which exist between organisational members with different
cultural values, attitudes and social norms brought together in the same
organisation (Shenkar and Zeira, 1987; Gray and Yan, 1992). If the man-
agement does not succeed in this process than as Brown, Rugman and
Verbeke (1989) pointed out the ijv could fail on a cultural basis. Some of
these authors attributed differences between values and norms of organi-
33

sational members mainly to differences in their national cultural or organ-
isational cultural backgrounds while others also emphasised differences in
such situational factors as differences in goals, interest and organisational
affiliations (Gray and Yan, 1992). These studies contained different ex-
plicit or implicit assumptions concerning which groups of organisational
members differ in their assumptions, values and norms from each other the
most. In the most simplified view, the major division was made between
host-country employees vs. the foreign employees (Child and Markoczy,
1993). Most studies on ijvs distinguished organisational members based
on their country of origin and their affiliation to the parent organisations
(e.g., Shenkar and Zeira, 1987). These studies usually did not even ask the
question whether similarities and differences between the beliefs, norms or
behaviours of managers could be stronger based on other factors. This lack
of interest in this question is surprising given the vast amount of studies
outside of the literature on immos which suggest the influence of different
managerial characteristics in this respect (see sections 2.3 and 2.4).
Park et al. (1993), for example, attributed many problems in ijvs to
the ethnocentric attitudes of the venture managers who come from different
national backgrounds and who had multiple loyalties to the parents and to
the ijv itself. They considered: “central to the concept of ethnocentrism
is the attitude or view that one’s own group is the standard by which all
other groups must be measured.” (Park et al., 1993, p. 275). The authors
suggested that ethnocentrism was likely to be present in multi-cultural
environment and enhance the already existing national cultural differences
between members of ijvs. Ethnocentrism was suggested to have a negative
effect on group cohesiveness, such as on agreement on goals, on the devel-
opment of organisational systems, and on the presence of effective group
leadership. The authors suggested that the way to overcome ethnocentrism
was to develop and use cultural training programs. Unfortunately the au-
thors did not investigate how well ethnocentrism explains disagreement in
goals, the development of organisational systems and the effectiveness of
34

the group leadership in a real organisational situation; so the consequences
of their argument remained unclear.
Datta and Rasheed (1993) also talked about the potential national
cultural differences in ijvs and came up with recommendations of how to
overcome these. They suggested that expatriates who work for ijvs should
be carefully selected based on their cultural sensitivity as well as techni-
cal competence. The authors suggested that when selecting these managers
their intercultural, diplomatic and interpersonal capabilities also have to be
taken into consideration. Ideally, they should also speak the local language
and know the business environment of the host-country. They also recom-
mended providing training programs to the managers of both sides which
encompass cross-cultural training. Although Datta and Rasheed (1993)
used the simplified distinction of host-country managers vs. expatriates it
was a strength of this study that the authors recognised that there could be
individual differences in the intercultural, interpersonal capabilities of the
managers which might affect their willingness and potential to adjust to the
new situation. Unfortunately the authors did not go further to investigate
whether these differences could be generally tied to personalities or to any
of the background characteristics of the managers and whether they pro-
vided explanations for similarities and differences in the managerial beliefs,
norms and behaviours.
Child and Markoczy (1993) assumed that the basic differences in be-
liefs and behaviours were between the foreign and the host-country man-
agers and suggested that different ways of learning could be applied in
practice to overcome these differences. They distinguished six types of
learning, based on whether learning occurred on the cognitive and/or on
the behavioural levels. These were non-learning, forced learning, imitation,
received learning, integrative learning, and segmentation. These types of
learning, however, could happen between other groups of managers not just
host-country managers and expatriates, for example between managers on
different levels.
35

To summarise the above, studies on international hybrids which were
mainly interested in the cultural compatibility of the members of the immos
failed to investigate whether cultural differences were the major differences
between members of the immos. Although some of them considered issues
like multiple loyalties towards partners, differences in goals and interest as
well as cultural differences, they failed to address whether other managerial
characteristics, different from the cultural backgrounds or affiliations of
the managers, might have a stronger explanatory power concerning the
similarities and differences of the beliefs, norms and behaviours of these
managers.
2.2.2.2 Personnel issues in immos
Several personnel problems specific to hybrids have been identified in the
literature. Shenkar and Zeira (1987) provided a good review of 19 studies
which addressed these problems in ijvs. Based on these studies 17 person-
nel issues were identified: (1) gap between the present and desired staffing
of the ijv; (2) blocked promotion in the ijv (i.e., places are reserved for
the expatriates, or host-country transferees); (3) blocked promotion in host
parent company (i.e., expatriates who spend times in the ijv are not pro-
moted in their parent company); (4) difficulties in returning to the parent
firm following service in the ijv; (5) conflict of loyalty to the ijv vs. par-
ents; (6) limited delegation of authority from parents to ijv; (7) screening
of information; (8) compensation gaps between employee groups; (9) un-
familiarity with environment of the host country; (10) unfamiliarity with
the organisational procedures of other parent; (11) difficulties in adapting
to host country; (12) exile syndrome of expatriates; (13) communication
blockages in ijv; (14) communication blockages within the parents and
between the parents themselves; (15) complexity of decision making pro-
cesses; (16) difficulties in performance evaluation of ijv staff; (17) lack
of training for functioning ijv structure. Although most of the problems
which were listed were internal to the ijvs there were also a few problems
36

which related to the relationship between the managers and the parent
companies. Despite the fact that the authors reviewed several articles the
list may still be extended. Child et al. (1994) and Child and Markoczy
(1993) discuss, for example, the problem that host-country managers were
often not included in the strategic decision making process, while Markoczy
and Child (1994) noted that at the early stage of hybrid formation there is
a great deal of change and uncertainty which may attract resistance from
many of the employees. These changes are often accompanied by feelings
of conflict, career uncertainty, stress and behavioural problems which need
to be resolved (Haspeslagh and Jemison, 1991). In their review Shenkar
and Zeira (1987) pointed out that most of the studies they reviewed did
not report their research methods and were based on studies of only a few
ijvs, so it was difficult to tell how generalisable these results were. In
addition, different problems are likely to derive from different managerial,
organisational, and contextual factors and the relationship between these
still remains to be established.
2.2.2.3 Immos in transforming economies
There are several problems in immos which are specific to those organ-
isations which have been established in transforming economies, such as
those in Eastern Europe or China. The management of these immos have
to work in a context where the market institutions are underdeveloped,
the environment is uncertain, and the infrastructure is quite weak. There
is also often a general level of mistrust towards foreigners on the societal
level (Welfens, 1992; Boisot, 1994). Managers also need to overcome certain
practices and behaviours (remnants of the previous system) which impede
improving efficiency (Pearce, 1991).
2.2.2.4 Discussion on immos
To summarise the above, studies which concentrated on managerial and
personnel problems of immos mostly tied these problems to the differences
37

in beliefs, attitudes, norms and behaviours of organisational members which
they tended to explain with differences in the cultural backgrounds, and
organisational affiliations. Only a few studies considered that there might
be individual differences on other basis as well, but not even these studies
pursued the matter. Studies which concentrated on managerial and per-
sonnel problems are still in the minority compared to those which deal with
macro-issues, and they are often based on small samples, and questionable
methods. Further investigations are needed to understand the relation-
ship between managerial characteristics, organisational and environmental
factors and similarities and differences between managers which help to
explain why certain conflicts are present in these organisations. This could
have substantial implication for learning, training and staffing in these or-
ganisations and consequently for the future performance and longevity of
the immos.
2.3 Managerial characteristics
Several studies have demonstrated the effect of various managerial charac-
teristics on managerial perception, beliefs, actions and performance. These
include age, educational level, educational specialisation, profession, posi-
tion, experience, functional area and gender. The effect of these character-
istics have been investigated on the individual level and on the group levels.
Group level studies mostly concentrated on top management teams by in-
vestigating the influence of averaged managerial characteristics, as well as
the effect of some group features (e.g., Hambrick and Mason, 1984; Michel
and Hambrick, 1992). In the next section these studies will be reviewed
from the point of view of the managerial characteristics which they linked
to various aspects of managerial knowledge states or action. Although,
only a few studies concentrated specifically on the relationship between
managerial characteristics and business related beliefs, given the generally
accepted interrelatedness of the various cognitive and behavioural factors
which are tied to managerial characteristics (e.g., Schwenk, 1984; Ham-
38

brick and Mason, 1984; Walsh, 1988) these studies are treated as having
implications for the possible relationship between beliefs about business
and managerial characteristics.
2.3.1 Age
Age of the manager has been found to negatively correlate with receptivity
to change (Carlson and Karlson, 1970; Wiersema and Bantel, 1992), with
innovativeness and innovation (Bantel and Jackson, 1989), with willingness
to take risk (Hambrick and Mason, 1984), and with organisational growth
(Ellis and Child, 1973). It was also found to have a moderating effect
between the criteria used for the selection of a cooperating partner and
the evaluation of target firms (Hitt and Tyler, 1991). These studies are
addressed below in greater detail.
Carlson and Karlson (1970) concluded, based on previous studies, that
intelligence and learning ability decline with age which influences the ability
to grasp new ideas and learn new behaviours. However, they found a large
variation in this respect, depending on the task which needed to be learned.
They also demonstrated that the attitudinal aversion towards change tends
to increase with age.
Wiersema and Bantel (1992) investigated the relationship between
changes in the corporate strategy and the demographic characteristics of
the top managerial teams in 87 firms. They looked at the demographic
characteristics of groups as opposed to individuals and found that 6 demo-
graphic variables which characterised the teams related to the likelihood
of strategic change in the firm. The demographic variables included young
age, as well as short organisational tenure, high team tenure, high educa-
tional level, academic training in sciences and heterogeneity in educational
specialisation.
Bantel and Jackson (1989) also collected data on the demography of
the top management teams (tmt) in 199 banks in 6 Midwestern states in
the U.S.A. and investigated the relationship between these and the inno-
39
vation adoption by these banks. They found that average age and average
tenure of the tmt negatively correlated with innovation while the level of
education showed a positive correlation with it.
In a theoretical study Hambrick and Mason (1984) argued that older
executives may be less able to grasp new ideas and are likely to have a
commitment towards status quo, so they are less likely to follow risky
strategies than younger managers.
In a survey of 787 managers in 78 companies Ellis and Child (1973)
investigated whether managers differ in terms of their working and social
context. As part of this study they found that the youth of managers
positively correlated with the faster growth of their organisation. They
concluded that this result could have two possible explanations. Either that
younger managers are able to devote more physical and mental energy to
growth or that growing companies are more likely to hire younger managers.
The authors however did not have enough information to be conclusive in
this respect. Also, it might be the case that the correlation between age
and growth is explainable by the influence of a third factor.
In another survey-based study, Hitt and Tyler (1991) tested the ratio-
nal normative, external control and strategic choice model through investi-
gating strategic decisions which managers make when selecting partners for
cooperation. They found evidence that managers use rational/normative
criteria for decision making which largely explains partner selection through
the moderating effect of such managerial characteristic as age, type of ed-
ucation and position.
2.3.2 Organisational tenure
Some of the studies which investigated the relationship between manage-
rial age and behaviour also found evidence for similar correlations between
managerial behaviour and organisational tenure (Wiersema and Bantel,
1992; Bantel and Jackson, 1989). Hambrick and Mason (1984) argued that
those managers who have spent a long time in one organisation are likely to
40

have limited perspectives and tend to avoid radical changes in their organ-
isations. Ellis and Child (1973) also found that longer tenure is associated
with a conservative and less risk-taking outlook. The effect of tenure in
this respect was found even to be stronger and more consistent than age.
After investigating the tmt of 32 airline companies using archive data
Cho, Hambrick and Chen (1994) concluded that tmts with longer than
average organisational tenure tended to show risk aversion and launched
competitive moves with smaller scope than tmts with shorter tenure.
2.3.3 Education
Education level was concluded to positively correlate with receptivity to
change, with propensity to take risk (Wiersema and Bantel, 1992) and
with innovation (Bantel and Jackson, 1989; Hambrick and Mason, 1984).
Hambrick and Mason (1984) suggested that in addition to the level of
education the type of education also might influence the cognitive models
of the managers. They argued that there is a difference in the cognitive
models of those managers who were trained in engineering compared to
those who were trained in liberal arts or business. Hitt and Tyler (1991),
in fact, found evidence for the influence of type of education on managerial
decision making.
2.3.4 Position
Ireland, Hitt, Bettis and de Porras (1987) and Stevenson (1976) found that
managers perceive the strengths and weaknesses of a company depending
on what hierarchical levels they occupy. Ireland et al. (1987) analysed
real decisions to measure the relationship between managerial perception
of organisational strengths and weaknesses and of uncertainty of the envi-
ronment. The method which they applied is called policy capturing (Slovic
and Lichtenstein, 1971). The authors collected data from 12 top, 24 middle
and 20 lower managers in three large companies in South America. They
found that managers, within each firm, varied by level in their perceptions
41

of strengths and weaknesses of their organisations and of the uncertainty
of their environment.
Stevenson (1976) asked 50 managers from six companies to evaluate the
strengths and weaknesses of their firms. He found that managerial level,
the perceived role of the managers and the type of their responsibilities
strongly influenced the assessment of the strengths and weaknesses of their
firms.
2.3.4.1 Consensus in tmts
There has been a distinct set of studies which have concentrated on top
managers but from the point of view whether there is consensus among
these managers in the goals and means of an organisation and whether
consensus in this respect has positive performance consequences. The re-
sults of these studies are highly controversial.
Grinyer and Norburn (1977-78), for example, investigated the relation-
ship between consensus in tmts on organisational goals and performance.
They interviewed 91 top level managers in 21 British companies in 13 dif-
ferent industries and found a relatively surprising level of disagreement in
the top managerial teams. Furthermore, they found negative correlation
between consensus on goals in tmts and organisational performance in
the highest performing firms. A similar result was reached by DeWoot,
Heyvaert and Martou (1977–78) who investigated the relationship between
consensus on means and performance in 168 Belgian firms. They found
that there was a negative correlation between consensus on means and
performance in the more successful firms.
Contrary to the result of these studies Hrebiniak and Snow (1982)
found a positive correlation between the agreement of the top-management
on the strengths and weaknesses of their organisations and organisational
performance even when they controlled for other variables which poten-
tially related to organisational performance. This finding was based on a
survey which included 247 top-level managers from 88 companies within
42

four industries.
Bourgeois (1980) found only partial support for positive correlation
between consensus in the tmt and performance. He conducted a survey
with the participation of 67 managers in 12 non-diversified public corpora-
tions. After analysing the data he reached the surprising result that while
the agreement on both goals and means associated positively with perfor-
mance agreeing on means was more important than agreeing on goals. In
fact the agreement on goals correlated negatively with performance without
agreement on means.
Bourgeois’s (1980) findings are also partially compatible with Dess’s
(1987) results. Dess applied a survey technique to collect information from
74 top-managers in 19 manufacturing firms concerning how they saw the
objectives and the competitive methods of their corporations. He found
that consensus either on goals or on methods associate positively with
performance but not consensus on both.
2.3.5 Functional area
Many studies have concentrated on investigating the relationship between
the functional background of managers and their perceptions and be-
haviours. These works are based on such classic works as Dearborn and
Simon (1958) and Lawrence and Lorsch (1967). According to Dearborn
and Simon (1958), managers who spend a long time in a particular func-
tion develop a viewpoint that is consistent with the activities and goals of
that functional position. The authors drew their results from a study of
23 managers, enrolled in an executive course. All of the managers were
from the same manufacturing company. The information they used when
solving a case-study was identified and was found to be consistent with
their functional backgrounds.
Lawrence and Lorsch (1967) concluded from a survey of 6 organisations
in 3 industries with 30 to 50 managers per organisation that managers who
work in different functional units show differences in their goal orientation,
43

time orientation and interpersonal orientation. The authors thought that
one of the main challenges for management is to simultaneously maintain
both differentiation and integration in the orientation of managers.
Since these classic studies there have been studies, which reinforced
the effect of functional backgrounds of managers on their orientation and
behaviour while other did not find this kind of connection.
Ellis and Child (1973), for example, found differences in the personal
orientation of design, personnel, marketing and workflow managers, com-
pared with other functional managers. The former group tended to show
more flexibility towards variety in work and risk taking than managers in
other functional areas.
Stewart and Latham (1980) also found evidence relating to functional
differences between managers by looking at their goal preferences. They
investigated 40 executives in 10 National Football League (NFL) teams in
the US by applying a preference mapping technique where they identified 21
possible goals of the NFL and asked managers to indicate their preferences
for each of the goals on a Likert-type scale. They found among other
things, that managers with different functional backgrounds tended to place
a different emphasis on the organisational objectives.
Contrary to the result of the above studies Walsh (1988) did not find
any evidence that managers viewed their organisations through the nar-
row lenses of their current functional areas or work experience in different
functional areas (functional diversity). He applied a card selecting tech-
nique with 121 managers enrolled in a part time executive course. Walsh
identified 50 success factors from the literature and asked managers to sort
these cards into two piles according whether they found these important
or unimportant to organisational success. Next, managers had to sort the
important factors into smaller piles of related factors. They also had to
solve a case-study, similarly to the method used by Dearborn and Simon
(1958). Analysing these data, Walsh (1988) concluded that managers ei-
ther do not have a firmly held dominant conception of success or if they
44

do, the success factors which they found relevant crossed functional lines.
Houghton and Neubaum (1994) argued that the inconsistency of the
findings concerning the relationship between functional backgrounds and
managerial perceptions might be the consequence of the issue being more
complex than originally assumed. The authors drew their field data by
using a similar card sorting technique to Walsh (1988) and questionnaire
responses from 504 top managers in 96 hospitals in the U.S.A. In the sur-
vey, managers were asked to recall the strategic issues which the tmt dis-
cussed in the last year. From the card selecting task the authors concluded
that managers do not have narrow belief structures tied to their functional
backgrounds. They also found that managerial beliefs on success could be
better tied to their previous functional experiences than to their current
functional backgrounds. However, when the questionnaires were analysed
it was found that managers tended to recall those strategic issues from the
tmt meetings which related to their functional backgrounds, demonstrat-
ing a selective perception of importance based on functional backgrounds.
Most of these studies investigating the effect of functional area on
managerial perception have concentrated on the current functional area
and functional diversity. Michel and Hambrick (1992), however, suggested
that the effect of dominant functional area also needs to be considered
which is the area in which managers have spent most of their time.
2.3.6 Profession
In a paper Child, Fores, Glover and Lawrence (1983) argued that in cer-
tain nations like Britain, strong evidence can be found for the existence
of a strong institutional and value system of professional groups. They
attributed this to be the consequence of the professional education system.
Hambrick and Brandon (1988), however, considered that there is a self-
selection procedure in terms of what kind of individuals enter into certain
types of professions. Allport et al. (1970), for example, found that the val-
ues of students in business administration were significantly different from
45

those of students in other fields. The former group tended to emphasise
more the economic and political values and deemphasise social and religious
values. This finding implies a two way interrelationship between the values
of people in certain professions and their professional education, similar to
the relationship implied by Haire et al. (1966) in section 2.1.
2.3.7 Gender
Sex-related differences were found to exist in job satisfaction (Hulin and
Smith, 1964), in organisational commitment (Graddick and Farr, 1983)
and values (Centers and Bugental, 1966). Among American managers,
women were considered as less tough-minded and more naıve yet more
suspicious and more likely to break rules. According to one view women
managers are competitive, insecure and over-controlling (e.g., Henning and
Jardim, 1977), and also more tense and less self-assured than men (Ottaway
and Bhatnagar, 1988). According to another view women managers are
actually more relationship oriented and do not mind sharing power (e.g.,
Helgesen, 1990). Others found that sex-differences on job-reaction and
dispositional variables could be explained away by differences in the jobs
and rewards which males and females receive (Lefkowitz, 1994) or by the
socio-cultural context in which managers work (Ely, 1994). These findings
suggest that gender differences exist in cognition, action and behaviour
although leave open the source of differences. These studies however do
not ask the question how important these gender differences are relative to
other managerial characteristics in influencing the beliefs of the subjects.
It should be noted that, unlike Lefkowitz (1994) and some other re-
searchers in the field, a distinction between “sex” and “gender”, in which
where the former is a biological category and the latter is a social and psy-
chological category, is not maintained here. Although the distinction may
be useful for some specialised studies, the biological category is a reasonable
substitute here.
46

2.3.8 Discussion on managerial characteristics
The above studies addressed various links in the long chain between man-
agerial mental state and action. More attention seems to be paid to estab-
lishing the link between managerial characteristics and action than between
the mental state of managers and managerial characteristics. This is likely
to be related to the fact that it is easier to operationalise and measure
managerial characteristics and behavioural factors than managerial cogni-
tion. That measurability was one of the major constraints on investigating
the effect of managerial cognition on action could be suspected from the
fact that while the importance of managerial cognition in decision mak-
ing and performance was reintroduced to the management literature ear-
lier (Child, 1972; Thompson, 1967), the number of studies in this respect
showed a clear jump after Hambrick and Mason (1984) composed the ar-
gument (which remains untested) that managerial characteristics were in
fact surface level, measurable representations of the underlying knowledge
structure of managers. In fact, Hambrick (1994) complained that from the
Hambrick and Mason’s (1984) article researchers mostly seemed to notice
the substitutability of managerial cognition with managerial characteris-
tics and ignored the main points of the article. He also stated that while
the link between managerial characteristics and action have been well re-
searched, sufficient attention has not been given to the question of whether
such characteristics are indeed related to the managers’ knowledge base
and whether these characteristics have the same relative importance in ex-
plaining the knowledge base of the managers. This reinforces the need for
studies such as this thesis to fill the gap.
Although many of these studies were highly rigorous they often failed
to consider the effect of organisational, industrial, and national differences
which might influence the relationship between managerial characteristics
and the other investigated variables. Wiersema and Bird (1993), for exam-
ple, were among the few who extended their study on managerial demogra-
phy to a non-U.S. setting and concluded that national cultural differences
47

are likely to moderate the relationship between tmt characteristics and or-
ganisational outcome. Further studies like this are needed which investigate
the effect of contextual variables on the relationship between managerial
cognition, action, performance and managerial characteristics.
2.4 Literature on the effect of industry
There has been an increasing amount of work which has recognised the po-
tential influence of industry (or sector) on the norms and culture of organ-
isations (e.g., Gordon, 1991; Chatman and Jehn, 1994), on their strategic
behaviour (e.g., McGee and Thomas, 1986; Johnson and Thomas, 1987)
and on the policy choice and strategy formation by their managers (e.g.,
Grinyer and Spender, 1979; Spender, 1989; Huff, 1982; Reger and Huff,
1993). Most of these works were less concerned with the broader notion of
industry and more interested in identifiable groups within industries which
are mostly called strategic-groups, but are also referred to as industry-
groups or industries. In the traditional sense the boundaries of industries
are drawn on the basis of markets and technologies. By the market crite-
rion firms are classified as being the same industry if they produce prod-
ucts that are close substitutes to each other (Porter, 1980), while by the
technological criterion similarity of processes matter (McGee and Thomas,
1986). Industry-groups are a finer grouping of companies than industries
and are based on the strategic behaviours of the companies (e.g., McGee
and Thomas, 1986) or on similarities in the mental models of their strategist
(e.g., Reger and Huff, 1993; Spender, 1989). Most of the studies reviewed
here use the notion of industry-groups when they write about industry. In
line with these studies, industry, industry-groups and strategic-groups are
used as synonyms unless stated otherwise. In section 2.4.1 studies which
concentrate on the relationship between industry and strategic behaviour
are briefly reviewed while, in accordance with the interest of this thesis,
more attention will be given to studies (section 2.4.2) which concentrate
on the influence of industries on the values and the beliefs of strategists
48

within industry-groups.
2.4.1 Industry-group based on behaviour
McGee and Thomas (1986) provided a good review of those works (up
till 1985) which categorised firms based on similarities in their strategic
behaviours and used these groups as their unit of analysis when linking
strategies to performance. Six out of 20 works reviewed by McGee and
Thomas (1986) were in the format of unpublished dissertations at the
time which suggested that grouping firms based on their strategies was
a new area of interest. Since then there has been an increasing amount
of work which has investigated strategic groups, mostly concentrating on
the relationship between their strategy, structure and performance (e.g.,
Johnson and Thomas, 1987; Lewis and Thomas, 1990), on the fit between
strategy and environment (e.g., Lawless and Finch, 1989) or on producing
better classification techniques for strategic groups (e.g., Hatten and Hat-
ten, 1987). As McGee and Thomas (1986) pointed out, most of these works
used some surrogates to measure strategic behaviour and structure (such as
size, vertical integration, product range) and were less concerned with the
strategy formation process. There were substantial steps made towards the
investigation of the strategy formation process by the key work of Spender
(1989), who argued that there is an “industry level knowledge base” which
influences the strategy formation process of the firms; by Porac, Thomas
and Baden-Fuller (1989), who talked about industry-groups as “cognitive
communities”; and by Child and Smith (1987), who argued that a sector
constitutes a “cognitive arena”.
2.4.2 Industry-groups as cognitive communities
In his book on industry recipes Spender (1989, p. 9) was among the first to
try to identify “the industry’s strategic knowledge base” from which man-
agers draw in dealing with uncertainties. The industry recipe which forms
this knowledge base was identified as “the business related world-view of a
49

definable “tribe” of industry experts, and is often visibly articulated into
its rituals, rites of professional passage, local jargon and dress.” (p:9). To
codify certain aspects of these industry recipes Spender (1989) conducted
unstructured interviews with one strategist per company in 34 companies
in 3 industries. From the interviews he identified 14 to 16 constructs in each
industry which formed the industry recipe. He speculated that these recipes
could provide support to managers in policy and strategy formation, but
that they constituted neither necessary nor sufficient information, leaving
space for individual choice. For eliciting what he called “unfamiliar mean-
ing structures” Spender (1989) applied an interpretive approach. Instead of
the standard validity measure he proposed that a method should be taken
as valid if one is ready to act on the result of the generated knowledge.
Unfortunately, there is no information on the practical application of the
results although there are some suggestions on how the notion of industry
recipes could be used in practice, thus it is not clear that his method ap-
proaches his own standard of validity. Grinyer and Spender’s (1979) work
which investigated in an organisational setting how change might require
abandoning one recipe in favour of another could be considered a kind of
validation, but Spender (1989) did not use the potential of this study for
validation. No reference was made either to Child and Smith (1987) who
provided a good example in their case study to the utilisation of the sector
based knowledge in Cadbury Ltd.
Building on Spender’s work on industry recipes, Huff (1982) argued
that industry-wide mistakes in environmental interpretation and strategic
response provide evidence for the existence of on industry-wide repertoires
of possible strategic frameworks. She speculated that there is a pool of
concepts for each industry-group from which managers can draw to build
up new strategies. She called for research which would concentrate on
identifying these pools of concepts and would investigate how these change
over time.
Analysing interviews conducted in 17 Scottish knit-wear manufactur-
50

ers, Porac et al. (1989) explored how the mental models of competing strate-
gists may become similar over time on an industry-wide basis. Porac et al.
(1989) thought that similarity in beliefs on the group level develop over
time as a result of direct and indirect imitation between strategists. Di-
rect imitation occurs because strategists face similar problems over time
which have a finite number of solutions. Direct imitation happens because
of the formal and informal communication between competing firms. The
authors concentrated on the consensus which managers develop over time
at the industry-group level about how to conceptualise their competitive
environment. They did not see consensus as requiring complete similarity
in beliefs, but as an agreement on a set of core beliefs, even if there is vari-
ation between individual strategists in other respects. Applying this weak
notion of consensus leaves open the question of what degree of agreement
and variation accounts as consensus as opposed to difference in beliefs.
In their study, Reger and Huff (1993) tried to prove that strategy
groups exist. This was questioned by Hatten and Hatten (1987) and by
Barney and Hoskisson (1990). These latter authors see strategy groups as
analytical concepts and warn against what they call “anthropomorphising”
these groups. Reger and Huff (1993) argued that strategic groups exist and
they demonstrated their point by showing that industry participants share
perceptions about the strategic commonalities across firms. For their study
the authors applied semi-structured interviews, which built on the reper-
tory grid technique, with 23 strategists in six large banks in the Chicago
area. They found that strategic group structure is widely shared by strate-
gists within an industry and assumed that these shared beliefs influence
their strategic decision making.
Chatman and Jehn (1994) took the broader notion of industry when
investigating the influence of industry on organisational cultures. They
investigated 15 firms in 4 industries in the service sector and found that
there was less variation in the values of organisational members within the
industry than between industries. Their study made it obvious that similar-
51

ity within industry is a relative category which could only be understood
in comparison with other industries or industry-groups. This argument
questions the validity of studies like Porac et al. (1989) who searched for
cognitive consensus within industry groups. That is one can only deter-
mine if there is relative similarity within a group if members of that group
are more similar to each other than they are to individuals outside of that
group. This point will come up again in chapter 3.
2.4.3 Discussion
Despite the inconsistency of the findings, the above studies suggest an in-
dustry influence on strategic behaviour of organisations, and the mental
models and values of their strategists. Studies which concentrate on mea-
suring the relationship between industry and strategic behaviour of the
firms were usually rigorous, quantitative studies, which, however, did not
pay attention to the strategy process. Studies which concentrated on the
relationship between industry and the mental models of managers aimed
to fill this gap. However, they introduced a circular definition of industry
by defining it with similarities in the perception of the participating man-
agers which as (Spender, 1989, p. 188) himself admits could be problematic.
This, however, becomes a lesser problem if we consider that similarity of
the mental models of the strategist within an industry group is treated as
a relative and not an absolute category.
2.5 Lines of inquiry suggested by the
literature
Table 2.1 lists those managerial characteristics which have been found to
influence any aspect of managerial cognition or behaviour in the literature
reviewed in this chapter. Given the interrelatedness between the cognitive,
behavioural factors and beliefs, which was discussed earlier in this chap-
ter, these factors could be predicted to also have influence on managerial
beliefs. While, the relevance of these factors could be predicted based on
52

Literature Nat.–Cult. immo tmt Indust.Characteristic §2.1 §2.2 §2.3 §2.4Nat. Background × ×Situation (changes) ×Age ×Tenure ×Education level ×Education type ×Position ×Function area ×Function diversity ×Dominant Func. div ×Profession ×Gender ×Industry ×
Table 2.1: Lines of inquiry suggested by the literature
previous works, which were reviewed above, no such prediction could be
drawn on their relative importance given that these studies did not address
that question. However, predictions could be made for the direction of the
relationship between individual managerial characteristics and similarities
and differences in managerial beliefs which carry implication on the inter-
pretation of the sign (positive or negative) of statistical associations. These
predictions are listed below in section 2.5.1.
2.5.1 Directional hypotheses
This subsection lists hypotheses about the expected direction of the influ-
ence for the factors listed in table 2.1. The reader should not be mislead by
this section: It is not the goal of this study to test the following hypotheses,
but instead to see which matter most and under what circumstances they
matter.
Hypothesis 2.1 Those with similar national-cultural background will
show larger similarities in their business beliefs than those of different
national-backgrounds.
53

Hypothesis 2.2 The smaller the distance between the age of the man-
agers the more similar their business beliefs are going to be.
Hypothesis 2.3 The smaller the distance between the organisational
tenure of the managers the more similar their business beliefs is going to
be.
Hypothesis 2.4 The closer the education level of managers to each other
is the more similar their business beliefs are going to be.
Hypothesis 2.5 Those with similar education type will show more simi-
larities in their business beliefs compared to those with different education
type.
Hypothesis 2.6 Managers in similar positions will have more similar
business beliefs compared to those with different positions.
Hypothesis 2.7 Those managers who occupy similar functional areas will
have more similar business beliefs to each other compared to managers in
other functional areas.
Hypothesis 2.8 Those managers who have their dominant experience in
similar functional area will show more similarities in their business beliefs
compared to those who have their dominant experiences in other functional
areas.
Hypothesis 2.9 The more diverse functional experience a managers have
the more similar their business beliefs are going to be.
Hypothesis 2.10 Managers of the same gender will be more similar in
their business beliefs compared to managers of different genders.
54

2.5.2 Other factors
The managerial characteristics whose relative importance is looked for in
this study are basically drawn from table 2.1 with a few exceptions,3 while
the directions of influence were interpreted based on the above hypotheses.
In addition to emphasising the relevance of managerial characteristics in
influencing their beliefs studies on national cultural differences and on im-
mos also called attention to the potential situational factors which might
influence managerial beliefs which were guiding tools in building up the
case-studies on the investigated organisations and in comparing these or-
ganisations (although important issues also were allowed to emerge during
the process of the fieldwork as discussed in chapter 3). These studies called
attention to the importance of such contextual and situational factors in
influencing managerial beliefs as the purpose of the hybrid formation, the
power balance between partners in the hybrid, the changes which took
place within the organisation, and the integration approach applied by the
partners (see sections 2.2.1 and 2.2.2.1). National cultural studies also in-
dicated that certain nations are likely to prefer certain ways of organising,
which implies that these nations are likely to have preference to a certain
type of integration approach in the hybrids which fits to their preferences
in organising (section 2.1.1.3). While, based on this literature, predictions
could have been drawn on the effect of contextual factors on similarities
and differences in managerial beliefs an exploratory study was chosen in-
stead to allow important situational and contextual factors to emerge from
the field which characterise the given macro-context. The literature was
utilised for putting together an “aide memoire” (see Appendix A) which
helped the qualitative data collection on the contextual and situation fac-
tors. The data collection and analysis techniques are described in details
in chapter 10.
3These exceptions, discussed more fully in chapter 3, are language knowledge (mono-lingualism vs. multilingualism), which was added after field experience; education level,which was dropped as there was virtually no variation in the sample; and profession,which was substituted with education type (science/engineering vs. other).
55
Chapter 3
Methods
Several methods were used for collecting and analysing information on the
effect of managerial characteristics and organisational factors on manage-
rial beliefs. In this chapter the sample selection, the methods used, the
problems of data collection and the different types of data analysis are de-
scribed. Data were collected at two levels: the organisational and individ-
ual. Information on the immos was collected by using interviews, informal
discussions, archival data and press reports. For measuring managerial
beliefs a causal mapping technique developed by Markoczy and Goldberg
(1995) was applied which allowed systematic comparison between causal
maps (CMs). For collecting information on managerial characteristics a
structured, closed-ended questionnaire was used. The results of the analy-
sis of CMs were presented to the participating managers through feedback
sessions which also served to collect further information. Both the feedback
sessions and the interviews were used for interpreting the statistical results.
3.1 Sample
The sample selection was decided based on the requirements at both the
managerial and organisational levels.
56

3.1.1 Sample of organisations
The aim was to select organisations where the effect of organisational and
managerial characteristics which might potentially influence the business
beliefs of managers could be measured and compared. International Mixed
Management Organisations (immos) were selected for this purpose because
these organisations are lead by international managerial teams so, in addi-
tion to other managerial characteristics the effect of national differences also
could be measured. The study was conducted in Hungary in Hungarian-
foreign immos for several reasons. One is that Hungary is a transforming
economy where basic differences in the business beliefs between local and
foreign managers could be expected. These differences are important at
a time of macro and and micro level changes which makes them easier to
capture. It also makes it easier to tie the findings to some of these changes.
The author is also Hungarian, with a detailed background knowledge of the
Hungarian economy and the privatization process, and a native Hungarian
speaker which made communication easier with local managers.
The number of immos investigated was limited to five because the
number of organisations which matched the selection criteria and were will-
ing to participate in the research was highly limited.
The selected immos had to be large in terms of number of employees so
the required managerial sample size could be reached. Large organisations
were also desirable given that these organisations constituted the core of the
state sector in Hungary before the system change. These were organisations
where the biggest changes and the largest initial differences were expected
among managers after the formation of the immos. Only four of the five
immos in the sample were large in terms of number of employees, the other
being large only in terms of capital.
In addition to size, the aim was to select organisations which existed
before the formation of the immos, so changes within the organisations
could be traced as a consequence of immo formation. The immos, however,
had to be relatively young, so the initial differences between Hungarian
57

and foreign managers, if they existed, could be captured. In the end four
of the organisations in the sample satisfied this criterion while one of the
organisations was newly established.
Although it would have been desirable to study differences between
organisations based on the differences in the cultural backgrounds of the
foreign partners, the potential sample size which met the above selection
criteria was so small that comparison between immos on the basis of na-
tionality of the foreign partners would be highly limited. Organisations
were therefore chosen where the foreign parent company came from a sin-
gle, relatively broadly defined region which Hofstede (1991) identified as
anglo-saxon. Using Hofstede’s dimensions (Hofstede, 1980) which were
detailed in section 2.1.1.1 anglo-saxon countries such as Australia, Canada,
The US, New Zealand, Ireland and Great Britain fell into the same clus-
ter by showing low to medium power distance, low to medium uncertainty
avoidance, high individualism and high masculinity (Jackofsky and Slocum,
1988). One of the reasons for selecting immos with anglo-saxon partners
was that English was the non-Hungarian language in which the research
could be most easily conducted. Anglo-saxon partners were also the largest
investors in Hungary in terms of capital (Heti Vilaggazdasag 1992) and they
tended to invest into large organisations. Another possible area, Hofstede’s
“germanic”, would also have been a possible choice, but while Austrian and
German investors were large in terms of number of investments, the organ-
isations in which they tended to invest were relatively small (Bossanyi,
1994a). In the end, four of the immos which were selected had Amer-
ican partners while one had a British partner. Despite selecting immos
with anglo-saxon partners, seen in table 3.1, this did not mean that the
foreign managers who were sent to Hungary necessarily had anglo-saxon
backgrounds. In two of the immos, which had American partners the for-
eign managers were sent from the European headquarters of the parent.
Given that managers were relatively homogeneous within each immo and
foreigners were only treated together in one type of analysis (which is dis-
58

cussed later) this variation in the nationality of the foreign partners did not
cause an insurmountable validity problem in the data analysis. It must be
noted however that, while the sample is restricted to anglo-saxon foreign
partners, the sample of foreign managers is not.
Originally, it was planned to select immos from the same industry
as the small sample size would provide results of limited generalizability
for the effect of industry. The limited number of potential organisations
however did not allow the selection of immos from the same industry. As a
compromise, three organisations were selected from the food industry while
two organisations were chosen from the manufacturing sector. This had the
fortunate side effect that predictions could be made about the effect of the
industry even if the generalizability of the findings was limited.
Obtaining permission from the management of immos who were in the
potential pool of organisations was a difficult task. To increase the chance
of agreement with the research, in addition to the formal procedures, infor-
mal contacts were also used. In particular, managers in the organisations
studied earlier, recommended participation to their acquaintances in other
organisations. As part of the formal procedure in all organisations the
executive director was first called on the phone and a letter was sent to
him (it was a man in all cases) describing the goal of the research, the
required number of participating managers and the requested time from
each manager and also the potential benefit to the organisation of partic-
ipating. Accompanying each letter was a letter of recommendation from
the University of Cambridge. Of the eight organisations which were ap-
proached, six agreed to have an initial discussion between the executive
director, the personnel (or in one case the public relations) manager and
myself. The executive directors of the five organisations decided in favour
of the research. After the executive director had approved the research,
managers who would be invited to participate were selected based on the
organisational chart. A letter was sent to each of them, endorsed by the
personnel or the public relations manager, requesting them to participate.
59

Characteristics A B C D EEmployees (before acquisition) 18500 — 1700 1500 1400Employees (current) 9000 276 1000 1500 1300Sector manuf. manuf. food food foodForeign parent US US US UK US
Table 3.1: Companies in the sample
In company C though despite the executive director agreeing that his sub-
ordinates should participate in the research he himself was not willing to
allow his causal map to be elicited but was only willing to be interviewed.
This was the only case where the executive director refused to participate
in the causal mapping process. It was very likely that he did so because
the method was not transparent to the subjects and therefore they could
not easily monitor the elicitation process. As a result managers were often
concerned that deep secrets of their beliefs could be revealed.
Characteristics of the investigated immos are summarised in table 3.1.
Organisations are identified by letters A–E.
3.1.2 The sample of managers
The number of managers to participate in the research within each organ-
isation had to be relatively large so the relative influence of managerial
characteristics on similarities and differences in managerial beliefs could
be established. It was decided to aim at a minimum number of twenty
managers for each organisation because this is the minimum number of
managers among which enough diversity could be expected in the factors
which could be identified from the relevant literature as having some in-
fluence on managerial beliefs. Twenty was also chosen based on pragmatic
considerations. Requiring twenty managers to participate in a time con-
suming exercise like this was thought to be a target number which could
be reached without jeopardising the chance of receiving permission to con-
duct the research in immos. Even with this modest sample size, of the
60

Characteristic A B C D EManagers 20 20 27 22 22Foreigners 8 8 8 5 8Nationality of 7 US 3 US 7 Dutch 4 UK 7 Austral.foreigners 1 Irish 5 Benelux. 1 Belgian 1 Finnish 1 US
Top managers 11 5 8 6 10Non-top man. 9 15 19 16 12
Table 3.2: Managers in the 5 organisations
eight organisations which were approached, three decided against partic-
ipating in the research because they were not willing to devote so much
managerial time for this purpose. In addition, in one immo where the
management decided to participate in the research, there were difficulties
in reaching the required sample size because they did not have that many
full time managers in the company. Originally a random sample selection
was planned but this was abandoned for two reasons. One was that the
number of foreign managers was limited in most of the immos, so all of the
available foreign managers had to be included in the sample. The second
was that the foreign managers were always placed at the top or only one
or two levels down from the top managerial levels; so Hungarian managers
also needed to be selected from the top down to match the sample of the
foreign managers. Selecting managers from the top (one level down from
the executive director) and from the second and third levels was also desir-
able given that these managers were assumed to be better informed about
the business situation of their companies compared to managers at lower
levels. These considerations made the sample selection non-random. In the
end, 111 managers were studied in the five immos. Their composition in
terms of nationality and position are given in Table 3.2 for each company.
61

3.2 Two levels of the analysis
The data collection and analysis were also conducted at two levels. First,
within each investigated immo the managerial beliefs were measured, com-
pared and the relative importance of managerial characteristics were es-
tablished. The results were analysed and interpreted within each organisa-
tional context. Next, the different immos were compared and similarities
and differences between organisations were matched with the similarities
and differences between the relative importance of managerial character-
istics in influencing managerial beliefs in the organisations. By doing the
analysis in two stages comparisons were made at the same levels (between
organisations vs. between managers) and only then was the relationship
between these different levels established. The importance of applying
the right level of analysis has been widely emphasised in the literature
(e.g., Klein, Dansereau and Hall, 1994; Bedeian, Kermery and Mossholder,
1989; James, 1982; Hofstede, 1994a). Klein et al. (1994) also suggested that
data analysis should be done at the same level, although this could not be
entirely followed here. Due to the peculiar nature of using distance based
data, one part of the data analysis is at the level of differences between in-
dividuals which is neither an individual level, nor a group level construct.
The results of these analyses within each organisations is then taken to be
information about organisations, providing for an organisational level of
analysis.
The description of the data collection and analysis follows these two
steps. In the first part causal maps are described as means to represent a
limited aspect of managerial beliefs and the stages of the causal mapping
technique used and the different analysis techniques which were used to
identify the relative importance of managerial characteristics in influencing
similarities and differences in managerial beliefs are discussed. Next the
techniques which were used to collect data on immos are presented and then
the methods for comparing the intra-organisational results with similarities
and differences in organisational features are described.
62

3.3 Causal maps
Causal maps (CMs)1 are special types of cognitive maps which are widely
used to capture managerial beliefs (e.g., Laukkanen, 1990; Huff, 1990; Eden,
1992). CMs are considered to contain two basic elements which makes them
suitable tools to represent managerial beliefs (Laukkanen, 1990). These
are the issues which subjects consider relevant in a given domain, and the
assessed influence relationship between these issues. Beliefs on what is im-
portant provides an important clue as to what hold the subjects’ attention
(Stewart and Latham, 1980; Lord and Maher, 1993), while causal relation-
ships provide information on how subjects might assign attributions (Fiske
and Taylor, 1991). They therefore seek to represent an important aspect
of the subject’s beliefs. CMs were chosen to represent managerial beliefs
because they present the above information in a concise and structured
way and may be subjected to different forms of analysis. It should be
noted, however, that although some relevant aspects of managerial beliefs
are represented by CMs, these are still only capable of capturing a limited,
although important, component of a manager’s beliefs. The use of the term
managerial beliefs in this dissertation therefore refers to only a limited as-
pect of managerial beliefs, namely the factors identified as relevant in a
given domain (according to criteria set by the researcher) and the causal
relationships between these factors.2
CMs can be displayed in different forms, such as diagrams, associa-
tion matrices, extended association matrices and in a set representation
format. These are equivalent (Markoczy and Goldberg, 1995), but some
are better suited to statistical analysis and others to visual analysis. All
comprise nodes corresponding to constructs, and arcs which mark the exis-
1Causal maps here also include influence diagrams which are similar in nature toCMs. As Seeger (1993) pointed out, however, those who do causal mapping often donot pay attention to the literature on influence diagrams (which are mainly used asdecision support tools) while those who use influence diagrams are not familiar with theresearch on causal mapping.
2Sometimes, as is apparent from the text, the term managerial beliefs are also usedas a short hand for similarities and differences in managerial beliefs.
63

Figure 3.1 Diagrammatic presentation of causal map
���
�
������
�
���
���
�� � � �
� �
�
� �
�
� � �
3 Vision and strategic direction 5 Market share20 Competition in market 30 Leadership in organisation33 Knowledge of market needs 35 Brand recognition43 Bank connections 47 Efficiency/productivity
64

Figure 3.2 Association matrix presentation of causal map
30 47 3 5 33 43 20 3530 0 2 3 0 0 0 0 047 0 0 0 0 0 0 0 03 0 0 0 0 0 0 0 05 0 0 3 0 0 0 0 0
33 0 0 2 0 0 0 −1 043 0 0 0 0 0 0 0 020 0 0 0 −2 1 0 0 −135 0 0 0 3 0 0 0 0
3 Vision and strategic direction 5 Market share20 Competition in market 30 Leadership in organisation33 Knowledge of market needs 35 Brand recognition43 Bank connections 47 Efficiency/productivity
tence and direction of influence (which node influences the other) between
nodes. Some CMs also contain information about the polarity of influence
(whether the influence is negative or positive) (e.g., Ackermann, Cropper,
Eden and Cook, 1991; Bougon, Weick and Binkhorst, 1977) and the weight
of influence (which could range, for example, from weak, moderate, or
strong) (e.g., Markoczy and Goldberg, 1995). Figures 3.1–3.2 contain ex-
amples of a causal map in a diagram and a matrix format while appendix D
contains examples of two association matrices and their corresponding ex-
tended association matrices.
Comparing figures 3.1–3.2 where a node in the diagram is a circle
with a number in it, the node in the matrix is a column and row, with
the column (row) headed by the node number. An arrow between two
circles corresponds to an arc in the diagram, while a matrix cell with a
non-zero value corresponds to an arc. In the the diagram the direction of
the influence follows the direction of the arrow. In the matrix the direction
of the influence is from row to column. For example, a cell in the matrix
such as m8,4 will contain the label of the arc in this example from n35 to
n5. In this example that is +3.
The extended association matrix is a variant of the association
matrix, which contains extra rows and columns as needed so that, for ex-
65
ample, row and column 5 will correspond to n5 and row and column 35
will correspond to n35. Note that the number of extra rows and columns
depends on the number of the field of those possible nodes which are not
included in the association matrix. Extended association matrices are not
very convenient display forms because they tend to be very large and also
difficult to follow visually. However, the comparison technique which is in-
troduced in section 3.4.4 could be best stated by using extended association
matrices , therefore two examples of very small extended matrices were con-
structed and presented (together with the association matrices were they
constructed from) in appendix D for the sake of stepping through the com-
parison technique in detail.
CMs may be elicited from archives, which could be textual (Barr, Stim-
pert and Huff, 1992; Narayanan and Fahey, 1990) or quantitative (Hall,
1984), from interviews (Eden, 1988; Ackermann et al., 1991) or by using
a predefined list (Ford and Hegarty, 1984; Markoczy and Goldberg, 1995).
CMs drawn from archives or interviews are often constructed for the pur-
pose of learning about a given problem domain rather than mapping dif-
ferent managerial beliefs. This property makes them useful decision aiding
tools (e.g., Diffenbach, 1983). Other CMs are drawn with the purpose of
investigating the beliefs of subjects. CMs which are drawn from interviews
or texts with this purpose are often constructed without placing a limit on
the size of the maps, or on the way that the expressions which the subject
or groups (in case of aggregated maps) use during the interviews or in the
text should be preserved. These CMs are well suited to intra-map analysis
concentrating on the structure of the maps or changes in the structure of
maps of the same subject over time. Investigating the structure includes
issues such as differentiation and integration between nodes (Goodman,
1968; Walsh and Fahey, 1986), or identifying focal vs. peripheral nodes
(Eden, 1988), or finding positive and negative loops (Diffenbach, 1983),
or investigating the complexity and density of the maps (Ginsberg, 1990).
Historical analysis of the structure of CMs could concentrate on what nodes
66

and influence relationships were eliminated in the CMs over time and what
new nodes and influence relationships were added (Barr et al., 1992). Maps
of this nature may also be subjected to linguistic analysis, such as what ex-
pressions were used by the subjects as opposed to others and why (Simons,
1993) or the structure of the maps could be used to assign meaning to a
complex phenomenon (Bougon, 1992a). These types of mapping techniques
are usually used for in depth analysis of individual or aggregate maps for a
small sample size. Comparison between these maps is difficult task which
raises serious reliability issues. When maps are compared, individual raters
are usually used (e.g., Daniels, Markoczy and de Chernotony, 1994). Tools
such as CMAP (Laukkanen, 1989) have been explicitly designed to assist
in this process. Tools such as COPE (Ackermann et al., 1991) may help
the raters to visualise the map.
For large samples, where the purpose is the comparison of managerial
beliefs mapping techniques which are elicited in a systematic way by ap-
plying a predefined pool of constructs are more applicable (e.g., Markoczy
and Goldberg, 1995; Ford and Hegarty, 1984). Although these techniques
sacrifice some of the “idiography” (Eden, 1993) of the CMs for the sake of
reaching comparability this problem may be decreased if the list is elicited
from the subjects themselves (e.g., Bougon et al., 1977), from similar sub-
jects (e.g., Markoczy, 1992a) or from experts (Diffenbach, 1983) consid-
ering the domain of interest. They may also be enhanced if subjects are
able to select from this pool of constructs during the elicitation of the CMs
(Markoczy and Goldberg, 1995). By applying a pool of constructs the re-
searcher can link the constructs with a definition and let subjects select
the most important constructs based not only on their labels but also on
their definitions. This will help to ensure that different subjects who se-
lect the same constructs are more likely to attribute the same meaning to
these constructs than subjects whose maps are elicited from interviews and
text. Comparability between CMs is therefore more reliable. By using a
predefined list researchers can also ask the subject to assess the influence
67

relationship between each pair of selected constructs which makes sure that
certain arcs are not left out simply because the subject forgot to mention
them. This also increases the probability that comparable maps are pro-
duced (Markoczy and Goldberg, 1995) and produces maps which are denser
than with other methods. This method has the advantage that after the
pool of constructs has been put together and defined, the researchers’ influ-
ence on the elicitation process is eliminated, unlike in the case of interviews,
which further enhance the validity of the maps (Markoczy and Goldberg,
1995). However, maps which are produced in this way are less suitable for
in-depth structural or linguistic analysis unlike maps elicited from inter-
views or text. Further limitation of the applied method are described in
section 11.7.1.
An alternative method to produce comparable maps was suggested by
Laukkanen (1992) who elicited CMs first from interviews and then trans-
lated them to comparable maps. He identified general labels and translated
the constructs used by the subjects into these general and comparable la-
bels after the CMs were elicited. This method has the advantage compared
to a predefined list that it does not constrain the space of construct selec-
tion by the subjects at the beginning of the elicitation process. However,
this is the cost that after the elicitation of the CMs the researcher has to re-
code the maps by putting the constructs which the subjects used into more
general labels. This recoding brings the subjectivity of the researcher into
the process at a stage after interaction with the subject is finished. This
technique is also labour intensive enough that it substantially reduces the
feasible sample size. The largest sample to which Laukkanen has applied
this technique so far is nine managers (Laukkanen, 1994).
3.4 Steps of the method
The steps of the causal mapping and analysis technique used here follow
the steps listed by Markoczy and Goldberg (1995):
1. The development of a “pool of constructs” from which the subject
68

can select the most important ones.
2. Selection of a fixed number of “constructs” by the subjects.
3. Constructing the CMs of each individual subject by having her/him
assess the influence of each of her/his “selected constructs” on her/his
other selected constructs.
4. Calculate “distance ratios” between “causal maps” using a modified
version of Langfield-Smith and Wirth’s (1992) formula.
5. Perform a variety of statistical tests on the distance ratios to iden-
tify what “characteristics” account for similarities in thinking. In
addition to the quantitative analysis the data are also subjected to
qualitative analysis.
3.4.1 Pool of constructs
Since managerial beliefs are too general to assess, even if it is narrowed
down to business related beliefs, this study considered only those beliefs
which were related to factors which might influence business success. Sim-
ilar considerations were applied by Walsh (1988) when he measured man-
agerial beliefs based on their views on what factors characterise successful
organisations. The pool of constructs which managers consider influential
or related to some notion of business success was derived, in part, from
30 interviews with Hungarian and foreign managers in immos as part of a
separate study (Markoczy, 1993b; Child and Markoczy, 1993). Initially, all
issues which were mentioned were listed without paying attention to repe-
tition or overlap in meaning. Issues which the researcher judged as similar
(in consultation with her supervisor) were collapsed into general constructs,
(an accepted technique in content analysis). A similar method was used, for
example, by Thomas et al. (1993). If a distinction between two similar con-
structs was emphasised by the managers themselves, however, then these
were left as separate constructs. For example, some Hungarian managers
69

complained that foreign managers had a short term profit orientation as
opposed to a long term one. Because they emphasised the distinctiveness
of these two orientations both yearly profit and long term profitability of the
company remained separate constructs. The above procedure yielded 60
constructs. To ensure that the pool of constructs covered a broad notion of
business success, these constructs were supplemented with four items from
the list of fifty success factors used by Walsh (1988), but not including those
which were closely connected to his particular interest in departmental bi-
ases. The pool of constructs were used in two pilot studies: one of which
included three full time MBA students at the University of Cambridge, and
another which included 49 executive MBA students from Cranfield Univer-
sity. Managers and students who participated in the pilot study were asked
to note constructs which they considered similar in their meaning, and also
to add new constructs if they saw that some, potentially relevant, con-
structs were missing. No new constructs were added to the pool as a result
of these pilot studies, but rather the original 64 constructs were reduced to
48 to which one additional construct was added, relationship with suppliers
(at the suggestion of Kari Lilja). The constructs along with clarifying defi-
nitions were translated from English to Hungarian by the author (a native
Hungarian speaker) and then independently translated back into English
by a professional Hungarian-English translator. The English translation
was compared to the original English text by a native English speaker and
the Hungarian text was modified by the author if a difference between the
two English texts could be attributed to problems of the translation from
English to Hungarian.
3.4.2 Selection of constructs
During the selection procedure the constructs were presented to managers
either in Hungarian or English dependent on their native language or in
some cases on which of the languages they spoke best. They were asked to
select from the pool of constructs those which they believed affected success
70

of their business. The selection was limited to the 10 most important
constructs yielding 90 pairs among which the influence relationship had
to be assessed as this proved to be the limit of managers’ patience and
attention in the pilot studies.
Each construct along with a one or two sentence definition was placed
on a card and subjects were asked to remove items which were important
(positively or negatively) to the success of their company. (The list of
cards and definitions are in Appendix C). This first pass at selection was
similar to that used by Walsh (1988). The selected cards were again sorted
according to their importance. This procedure continued until the subject
had a pile of 10 or fewer cards. On average it took four selections per
subject to reach this state. Managers were then asked, if necessary, to re-
select cards from among those most recently eliminated to make the total
up to 10.
This selection process has a number of advantages over asking subjects
to select from a written list Markoczy and Goldberg (1993, p. 8) identify
these as:
First, the ability to physically manipulate the cards means that the
subjects have to keep fewer things in mind when selecting. Second,
it avoids the tendency of some subjects to make sure to select items
from “every category” and avoid selecting non-independent items.
Third, by making the selection process more indirect it is more dif-
ficult for the subjects to be insincere.
During the fieldwork the cards were arranged in such a way that their
order seemed random to the managers in the experiment. The cards were
always rearranged before the next experiment however in the same order.
This was done to exclude the possibility that managers could infer from
the order of the cards what cards the previous manager had selected, as
well as providing the same stimulus to each individual.
71

3.4.3 Establishing causal relations
After the ten most important factors had been selected, managers were
asked to put the cards on display in front of them. Then they were told
that they would be asked how they saw the influence relationships between
pairs of the 10 chosen constructs.
In order to force subjects to consider each pair of constructs indepen-
dently of what they may have said about other pairs, they were presented
to the managers in a Ross ordering (Ross, 1934). Ross ordering is a
mathematical technique for ordering pairs of elements so that there is the
maximum distance between the repetition of elements. This makes it dif-
ficult for subjects to recall their previous answers about constructs being
considered. This ordering (when pairs are presented one at a time) will
also appear to be random to the subject.3
Before the pairwise comparison was started managers were told:
I will randomly choose two cards from the ten cards which you
selected. Lets call them card A and B for the sake of explanation.
You will hear the following questions which you need to answer.
(1) Do you think that the construct on card A influences B? (2) If
it does, is this influence positive or negative? (3) Is the influence
relationship weak, moderate or strong? I will not only ask questions
concerning the influence relationship between A and B but next
between B and A as well.
The meaning of the different questions was also made explicit because,
as Roberts (1976) notes, managers may be very concerned about getting
precise definitions. The following definitions were therefore given:
Influence means direct influence or in other words, that one factor
has a direct effect on the other without the need of a mediating se-
lected factor. Positive influence means, that if A is changing in
one direction than B is changing in the same direction as a conse-
quence. This change could be either an increase or decrease in both3I am grateful to Marton Gyombolai for bringing Ross’s work to my attention.
72

factors. Negative influence means that when A changes it causes
change in B into the opposite direction. Notice, that positive or
negative influence does not mean a value judgement. For example
an increase in inflation increases cost, so the influence relationship
is positive even if it did not produce any desirable effect for the
company. This experiment is not a logical test, therefore you do not
have to worry about logical flaws. The world itself is filled with con-
troversies, so listing these could be a sign of a good understanding
of reality as opposed to a problem. Since there are no good or bad
answers please, give me the first answer which immediately comes
to your mind instead of speculating too much about the answer.
Although it was often obvious that managers found this long explana-
tion boring and trivial it still took time for some of them to understand
the notion of positive and negative influence, but they quickly managed
to overcome this problem during the elicitation. Interestingly, some of the
managers did not realize that by selecting the constructs they created the
space themselves from which the pairs of constructs were drawn. One of
the managers for example asked, when a strange pair of constructs were
put together: “Did you put this causal question into the questions just to
check whether I fell asleep or not?”
The fieldwork suggested that it was easier, both for the researchers
and the managers, if the influence relationships between factors A and B
and between B and A were immediately after one another. This cut the
questioning time, because it seemed that managers were able to consider
the relationship in both directions in the same thought process. A com-
puter program, called askmap was used to ask pairs of constructs in both
directions.4
After the elicitation of the CMs a rough validity test was conducted on
them when obvious inconsistencies were identified. For example, one Hun-
garian manager obviously wanted to manipulate his answers by selecting
4As noted in the Preface, all of the specialised software used for this study was writtenby Jeff Goldberg. See Appendix F for details.
73

cards which contained the word “piac” (“market”) without understanding
the concept. This meant that he claimed that there was a strong positive
influence between everything including level of competition in the market
and the market share of the company. This suspicious map was dropped
from the sample.
After the elicitation of the CMs managers were asked to fill out a ques-
tionnaire concerning their personal characteristics. Questions were asked
on their nationality, age, gender, language knowledge, working experience
abroad and in other companies, highest education level, educational spe-
cialisation, number of years at the company, current functional area at the
company, position held in the company, and work experience in different
functional areas inside or outside of the company. Appendix B contains a
copy of the English language version of the questionnaire. Using these data
the following managerial characteristics were considered in accordance to
table 2.1 and section 2.5.
Nationality, which was determined by the following procedure as de-
scribed by Markoczy (1995):
(1) If country of birth and most recently acquired citizenship are the
same, then use that nationality. (2) Otherwise use country of first
post-secondary education or highest education if no post-secondary
education to decide between the two (3) If this fails make a subjec-
tive judgement considering facts of self-identification and language
knowledge.
Age was measured in years, and tenure (also called “being at com-
pany”) by the number of years spent at the immo and at its Hungarian
predecessor. Level of education was measured on a 1 to 4 scale, depend-
ing whether managers had high school (1), university (2), master degree
(3), or Ph.D (4) education. Level of education was not considered in the
study at the end because there was no real variation in this respect in
the sample given that most of the managers had either university or mas-
ter degrees. In terms of higher education type managers were divided
74

based on whether they were trained in natural sciences, mathematics or
engineering (1), or humanities and social sciences (0). The division by
education specialisation was also treated as professional division within
which functional area provides a finer grouping. Level of position was di-
vided into top (1) which included the executive director and those one
managerial level below him and non-top position (0) which included the
rest of the managers (1). Functional areas, as well as dominant functional
areas, included personal/HRM, finance/accounting, marketing/sales, gen-
eral management, computer/systems, research/development, production-
engineering, and others. Functional diversity was also calculated to mea-
sure the extent of managerial experience in different functional areas. This
measure was applied by Hirschman (1964) and Walsh (1988) which was cal-
culated as√∑
(Xi/X)2, where Xi is the number of years worked in a par-
ticular function and X is total number of years of work experience. Gender
was marked by a dummy variable (0 for male and 1 for female). Language
knowledge was divided into mono-linguals for those who only spoke a single
language (0), and multi-linguals who spoke several languages (1).
3.4.4 Comparison of CMs
The comparison method used was derived from Langfield-Smith and Wirth
(1992) and was further developed by Markoczy and Goldberg (1995). The
comparison formula is given in Figure 3.3.
The comparison technique resulted in a number between 0 and 1
where 0 means a complete similarity and 1 is a complete difference be-
tween two CMs. Appendix D contains an example of the comparison of
two association matrices with the application of the above formula. One
advantage of the comparison technique which is applied here is that it uses
all of the information which is present in the CMs.
By using an explicit formula the comparison technique provides to-
tal reliability of the comparison in that any two invocations of the formula
with the same parameter settings on the same two maps will yield the same
75
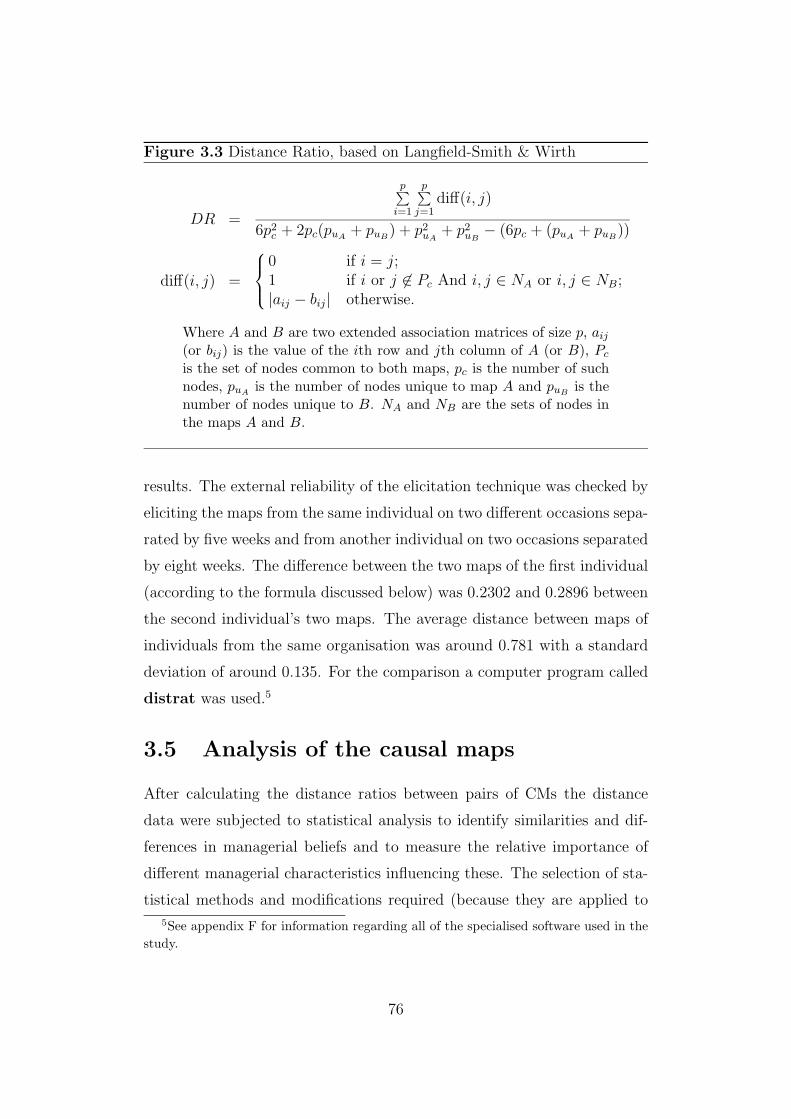
Figure 3.3 Distance Ratio, based on Langfield-Smith & Wirth
DR =
p∑i=1
p∑j=1
diff(i, j)
6p2c + 2pc(puA + puB) + p2
uA+ p2
uB− (6pc + (puA + puB))
diff(i, j) =
0 if i = j;1 if i or j 6∈ Pc And i, j ∈ NA or i, j ∈ NB;|aij − bij| otherwise.
Where A and B are two extended association matrices of size p, aij(or bij) is the value of the ith row and jth column of A (or B), Pcis the set of nodes common to both maps, pc is the number of suchnodes, puA is the number of nodes unique to map A and puB is thenumber of nodes unique to B. NA and NB are the sets of nodes inthe maps A and B.
results. The external reliability of the elicitation technique was checked by
eliciting the maps from the same individual on two different occasions sepa-
rated by five weeks and from another individual on two occasions separated
by eight weeks. The difference between the two maps of the first individual
(according to the formula discussed below) was 0.2302 and 0.2896 between
the second individual’s two maps. The average distance between maps of
individuals from the same organisation was around 0.781 with a standard
deviation of around 0.135. For the comparison a computer program called
distrat was used.5
3.5 Analysis of the causal maps
After calculating the distance ratios between pairs of CMs the distance
data were subjected to statistical analysis to identify similarities and dif-
ferences in managerial beliefs and to measure the relative importance of
different managerial characteristics influencing these. The selection of sta-
tistical methods and modifications required (because they are applied to
5See appendix F for information regarding all of the specialised software used in thestudy.
76

distance ratios rather than absolute data) mostly followed the suggestions
of Markoczy and Goldberg (1995).
First, to calculate whether certain subgroups of managers were closer
to each other than to other members in the sample, subgroups were formed
on the basis of the managerial characteristics listed earlier, except that age
and functional diversity were not included because they were subject to a
different kind of analysis. For the sake of brevity when “distance between
managers” is used in the text this refers to the distance between the causal
maps elicited from the managers in question.
As the same managers were grouped on the basis of different features
each manager was naturally a member of more than one subgroup. Only
those subgroups which contained at least four managers and at least four
managers not in the subgroup were considered for analysis because tak-
ing less than four managers would have allowed too much influence of a
single map on the means. For each of these subgroups the means and
standard deviation of all the distance ratios were calculated. Next, the av-
erage distances and standard deviations were calculated between members
of the subgroups and those managers who were outside the subgroups.
Thus what was compared was the average distance within a particular
subgroup with the average of the distances between members of that sub-
group and outsiders. If the mean of a particular subgroup was substantially
smaller than the average distance between the members of the subgroup
and the outsiders then members of the subgroup were considered to be
relatively similar to each other. (Markoczy and Goldberg (1995) discuss
the logic of this calculation in detail). The Student t-test was applied to
compare means of subgroups. . Because this requires that the distribution
be approximately normal or that the subgroups be sufficiently large, the
non-parametric Wilcoxon-Mann-Whitney test was also used as this does
not require the assumption of normality. Both the t-test and the Mann-
Whitney test require that the individual observations which are being com-
pared (in our case the distance ratios) be independent of each other. With
77

distance ratios this requirement could not be kept and no principled way
was found for modifying the tests to this condition. The significance levels
therefore do not reflect the true measure of likelihood. Similarly to McK-
eithen, Reitman, Rueter and Hirtle (1981), the results are listed without
significance measures. Even if it is not possible to assign a precise inter-
pretation to the t value (or Z value for Wilcoxon-Mann-Whitney test), it
is possible to compare them with each other. So, if in one subgroup the Z
value (the results are ranked by the Z value rather than the t value, because
the former does not require the assumption of normality) was larger than
in another subgroup it could be stated that the managerial characteristics
around which the subgroup of larger Z value was formed played a stronger
role in influencing managerial beliefs than the managerial characteristic in
the case of other subgroups. The results of the Wilcoxon-Mann-Whitney
(and also the t-test) were therefore used to show the relative importance of
certain managerial characteristics compared to others in influencing man-
agerial beliefs.
An alternative method for identifying similarities and differences be-
tween managers based on their beliefs and the characteristics which influ-
ence these similarities and differences is cluster analysis. With this method
managers could be grouped into clusters and then it could be seen what
characteristics were held in common by the managers in the same clus-
ter. As Markoczy and Goldberg (1995) discuss in detail, however cluster
analysis requires a number of subjective judgements on the part of the re-
searchers (see also Everitt (1990) for details) and there is therefore a sub-
stantial amount of arbitrariness in the selection and application of these
techniques. A great deal of information is also lost by using the notion
of cluster membership and non-membership and ignoring the difference in
the degree of cluster membership. Those members who are closer to the
centre of a given cluster are members of this cluster to a higher degree than
those who just inside the border of the cluster while those who are very dis-
tant from the cluster are more out of it then those just outside the border.
78
Simply using cluster membership looses this information. The solution to
the above problem recommended by Markoczy and Goldberg (1995) was to
measure the distance of each CM from the “centre” of every cluster. The
closer a map is to a cluster centre, the more it is “in” that cluster. Based on
this approach clusters were calculated based on Ward’s method (Everitt,
1990) which is biased towards small clusters without large distances within
them. These were used to create a central map for each cluster. The
nodes in the central map were those nodes which appeared in more than
half of the maps within the cluster. The cut-off point was decided in a
somewhat arbitrary manner based on the assumption that if at least half
of the managers whose CMs fell in the cluster selected a given node as
important than this node could be considered as a node which importance
is somewhat shared by these managers. The strengths of the influences
between arcs were calculated as the average of the influences from all maps
within the cluster that contain both nodes involved. By recovering this loss
of information small errors in the cluster analysis technique will have less
impact on the final result.
The distance ratio between each map in the sample and each central
map was calculated. Thus, for each map, there was an indication of how
far from (or near to) the “centre” of each cluster it was. Managerial char-
acteristics were then correlated not with the cluster membership, but with
distance from the central map of a cluster. The results of this calcula-
tion were included in the cross-correlation tables for each company. Since
distance data were correlated with managerial characteristics negative cor-
relations represent closeness to central maps. The cross-correlation tables
also included whether certain managerial characteristics correlated with
each other. Applying different central maps as well as the Student t-test
and the Wilcoxon-Mann-Whitney test to the same set of data could be con-
sidered as a form of triangulation in the sense used by Kotha, Dunbar
and Bird (1993) namely, that different types of statistical techniques bring
different types of errors into the results so the effect of these errors may be
79

reduced by applying several statistical techniques and accepting only those
results which are consistent with different techniques.
The correlation table also enables the calculation of partial correla-
tions in places where the distance from central maps correlated with two
managerial characteristics which may also correlate with each other. By
applying partial correlations the individual effect of each managerial char-
acteristic could be assessed while keeping the other one constant (Hays,
1988, chapter 15).
Although the applied elicitation technique of the CMs does not pro-
duce CMs (or any aggregate format of these) which are suitable for in-depth
analysis, it is still meaningful to subject the central maps to a limited qual-
itative analysis as well. This analysis considers the kind of nodes which the
majority of the managers selected in the cluster and also the generalised in-
degrees and outdegrees that could be calculated to each nodes. The notion
of generalised indegree and outdegree (or indegree and outdegree for short)
were taken from graph theory to cognitive mapping research by Bougon
et al. (1977) who wrote “The “indegree” is the number of paths leading
to the variable from other variables; the “outdegree” the number of paths
leading from it to other variables.” (p:612–613). In the modified version
of the indegree and outdegree not only the number of paths but the weight
of influence was also taken into consideration. This was not calculated by
Bougon et al. (1977) as the Appendix E contains an example on how the
indegrees and outdegrees were calculated. CMs which were elicited by them
did not contain this information. This qualitative analysis of the central
maps was limited to those clusters where managerial characteristics corre-
lated with distances of the CMs of managers with the given characteristics
from the central maps of the given cluster; the cluster contained at least
four managers (as was the requirement in the student t-test); and the given
managerial characteristics were found to be influential by other calculations
as well. During the qualitative analysis the constructs in the central maps
are often referred as constructs which were selected by managers in the
80

cluster. As is clear from the calculation of the central maps however, only
the overlapping constructs which were selected by more than half of the
managers in the cluster were actually considered.
To calculate the influence on managerial thinking of continuous char-
acteristics, such as age, a different technique was employed. Age could
be put into various bins or categories and treated as other data but this
would involve unnecessary loss of information. To utilise as much informa-
tion as possible a Pearson correlation was used to correlate the distance
ratio between the CMs of managers and the differences in age. To check
the influence of age for each pair of managers the distance between their
maps and the absolute difference in their ages were correlated. A positive
correlation indicated that the further apart people were in age, the further
apart were their measured belief structures. A negative correlation would
tell us nothing interpretable, and so, again, we just conduct a one-tailed
test. Age is also part of the cross-correlation table.
Given that the CMs contain two kinds of information (the nodes which
were selected and the influence relationship between them) it was also inter-
esting to look at what kind of nodes managers with certain characteristics
selected as most important. This type of analysis was done within each
organisation as well as for the whole sample. This latter calculation will
be discussed in this chapter in the section on cross-organisational analysis.
For within company analysis two kinds of calculations were used. One was
to see whether managers selected complementary constructs from the list.
For example the list contains a complementary pair of constructs: yearly
profit and long term profit given that some managers thought that there is a
basic difference between Hungarian and foreign managers in whether they
have a short term or a long term profit orientation. Fisher’s Exact Test
(Siegel, 1956) was used to see whether managers with different backgrounds
tended to select one or the other of the profit constructs. The other analysis
technique was a simple calculation of frequencies to see which nodes were
selected by more than half of the managers within a given immo. As with
81

the central maps the decision was made somewhat arbitrarily to include
only those nodes into the analysis which were selected by more than half of
the managers. It was based on the assumption that if a node is selected by
more than half of the managers in an immo than that node is considered
somewhat important in the given organisation.
For analysing nodes two independent raters were asked to categorise
the nodes according to 16 features. For each feature the raters had to sort
through the 49 cards and identify whether a particular construct had that
feature or not. The 16 dimensions, chosen by the author as potentially im-
portant, were: ends, means, internal factors, environmental issues, issues
relate to the interaction between organisations and environment, market is-
sues, production issues, human factors, management issues, financial issues,
managerial discretion issues, long term issues, short term issues, cultural,
cognitive issues, efficiency issues, effectiveness issues. Kornai (1993) pro-
vides an overview of the properties of this kind of representation system,
which he also points out has a history in linguistics going back to around
the 5th century BC.6
The interrater reliability was on a very good level (98%). In case of dis-
agreement between the raters, the author decided which features the given
construct had or did not have. During the feed back sessions managers
themselves also suggested common features to certain nodes which were
also taken into consideration in this decision. Twenty nodes were identified
as ends, 28 as means, 32 as internal factors, 13 as environmental issues, 16
as issues which related to the interaction between environment and organ-
isation, 12 as market issues, 7 as production issues, 10 as human resource
management issues, 18 as issues related to the quality of management, 11
as financial issues, 37 as issues which relate to managerial discretion, 24 as
long term issues, 36 as short term issues, 11 as cultural, cognitive issues, 13
as efficiency issues, and 17 as effectiveness issues. Although in the analysis
part of the thesis only a limited aspect of this feature system was used (for
6I am grateful to Jeff Goldberg for bringing distinctive feature categorising to myattention.
82

categorising the most often selected constructs and the selected nodes in
central maps), such a system could be a useful form of qualitative analysis
of data for similar methods which involve construct selection.
3.6 Collecting additional information
In addition to eliciting CMs of managers and collecting information on
managerial characteristics by using a short questionnaire managers were
also interviewed concerning any issues which they mentioned as important
during the elicitation of their CMs; issues which they found problematic
in the immos; and the changes which took place within, or in the context
of, their organisation after the acquisition of their company by the foreign
partner. The interviews, which were tape recorded, were unstructured and
open ended although an “aide memoire”, which was developed based on the
literature, was used by the researcher (see appendix A). This “aide mem-
oire” was handled in a flexible manner, so comparable information could be
collected on organisational change. During the investigation of the first im-
mo changes were grouped into a number of categories as recommended by
(Miles and Huberman, 1984). In the subsequent organisations, although
the interviews still remained open ended and unstructured, a check was
made whether similar changes had also occurred.7
The elicitation of CMs, the filling out the questionnaires and the in-
terviews lasted between 1.5–2 hours for each manager altogether. Press re-
ports and archival data on the history of the companies were also collected
and detailed field notes were kept concerning issues which were noticed in
the organisations, and other issues or observations which came up during
the elicitation of the CMs. In all of the companies informal contacts were
7When a new “category” seemed to emerge it was checked with archival data, pressreports, reanalysing the interviews and the minutes of the workshop and, if necessary, byasking the PR and/or HRM managers in each of the already investigated organisationswhether similar changes had occurred. To follow up changes which may have taken placeafter the fieldwork, regular (telephone, informal meetings) contact was maintained withthe PR and/or HRM managers in each of the investigated companies.
83
established with the personnel or PR managers with whom lunch or in-
formal meetings were organised. In the case of companies B and D, both
of which were located outside Budapest, the author often travelled from
or to Budapest in a company car with the managers. In company B the
author even stayed for a week in the same hotel as most of the foreign
managers and had breakfast and dinner with them and was invited to join
them at receptions. These informal discussions were very helpful in un-
derstanding the situation within the organisations or to request additional
information later on. After the data collection, one or two workshops were
held in each organisation to provide feedback and conduct a joint analysis
of the findings. The importance of these kinds of feedback sessions in data
analysis, in gaining additional information, and providing face validity of
the findings has been extensively discussed in the literature (e.g., Heller,
1969; Brown and Heller, 1981). Feedback sessions as validating techniques
have also been used to support the face validity of causal mapping (e.g.,
Ackermann et al., 1991).
Feedback sessions for the participating managers were held in two lan-
guages, both English and Hungarian, where possible. In companies B and
C workshops were held separately for the top and middle level managers
in English in the former case and in Hungarian in the latter case and in E
the workshop was held in English in line with the policy of this company.
During these workshops managers were asked to evaluate and discuss these
results. Managers in all five organisations considered the results as cor-
rectly describing the state of affairs in their organisations, even though
some of the results were initially surprising to them. That is, they saw the
results as not only correct but also revealing non-obvious facts. The discus-
sions during the workshops were tape-recorded, except in case of company
C where tape recording was not permitted by the executive director so rel-
evant information had to be recorded by hand by an informal contact of
the researcher and also by the researcher from memory immediately after
the feed back session. It must also be noted that after the workshop in C
84

for the top managers the executive director wanted to specify what could
and could not be discussed with the middle managers during the feedback
session. This censorship effort was resisted by the author and the middle
level managers received the same feed back as the top level managers. In
company C individual reports were also prepared for the participants which
contained the qualitative analysis of the central maps of the cluster into
which they fell into. Each manager was sent – in a sealed envelope – the
description of the cluster to which s/he belongs (the description was based
on the central maps and on the characteristics of the people who belonged
to the clusters); a two-dimensional graph which was the outcome of the
multi-dimensional scaling on which managers could see their own position
relative to the other managers (in each case all but the recipient were iden-
tified only by their nationalities); and a list on which it was marked which
factors managers selected themselves and how many managers all together
had selected that factor.8
3.7 More on the two step analysis
In light of the above, additional reasons may be identified why it was
necessary to have two stages to the data analysis. This helped to avoid
what Markoczy (1993a) called the cats and dogs problem: “that is,
someone looking at a dog will have different perceptions to someone look-
ing at a cat” (p. 318.). In this research managers were asked to reflect
on their organisations. The data were therefore organisation specific and
could not be merged as a consequence into one data set except in special
cases.
The following example highlights the reason why the company spe-
cific data could not be merged. One of the managers’ CM was elicited
twice in company B and also E because he switched from one company to
8Individual reports were only prepared in this company because it was overly timeconsuming considering the results it yielded to the researcher. This extra service waspromised in this company, however, in order to make the research attractive enough tothe top managerial team.
85

the other in the sample. In fact, he was the one who helped to arrange
the fieldwork in company E because he had found the research results in
company B useful for the management. His CM which was elicited in
company B was far from his CM in company D (the distance ratio was
0.8480) which he attributed to company differences. As discussed in sec-
tion 3.4.4 the method showed high external reliability in cases when CMs
of the same individuals were compared after 5 and 8 weeks. This suggests
that the large distance between the CMs of this manager was more a con-
sequence of the differences in the reference points than of the reliability of
the method.
3.8 Cross-organisational comparison
During the cross-organisational analysis it was investigated how immos
could be grouped together based on their similarities with respect to the
investigated features. Only those features with discriminatory power were
considered, which meant that they applied to only some of the organi-
sations. These groupings were then compared with the groups based on
certain organisational characteristics which also group together based on
the importance of certain managerial characteristic. For example, in a hy-
pothetical case, it might be found that in those organisations where foreign
managers had relatively similar business beliefs, foreign managers domi-
nated top positions while in those organisations where Hungarian man-
agers had similar beliefs Hungarian managers dominated these positions.
This finding would make it possible to conclude that there was a rela-
tionship between similarity of business beliefs based on nationality and
the dominance in top positions by managers with different national back-
grounds.
For calculating the effect of industry as opposed to organisational fea-
tures on similarities and differences in managerial beliefs a slightly modi-
fied version of the above analysis was used. Although organisations were
grouped based on their industry, similarities and differences in managerial
86

beliefs were calculated by considering all the managers in the food industry
and also in the manufacturing industry independent of which organisation
they belonged to within that industry. In this calculation organisational
specificity of the data is not a problem since, according to Spender’s ar-
gument, industrial recipes are held within an industry independent of or-
ganisational characteristics (Spender, 1989). The analysis of the industry
recipes was limited however by the fact that the causal mapping technique
did not preserve the industry language on which Spender (1989) focused
but rather concentrated on the distances between CMs. This could there-
fore only be used to see whether there was a larger agreement within an
industry on the relevant issues and the influence relationships between them
than across industries.
3.8.1 Construct-selection
A check was made on the whole sample to see whether managers with
certain characteristics tended to select certain issues as important (inde-
pendent on the organisational characteristics) to trace the effect of national
background or professional group on similarities and differences on man-
agerial thinking independent of the organisational context. The effects of
nationality and certain functional areas were singled out for reasons dis-
cussed in section 10.3. For this analysis the Fisher’s Exact Test was applied
(Siegel, 1956).
87

Chapter 4
The context of organisations
To investigate the effect of organisational factors and managerial charac-
teristics on the business beliefs of managers first the general context of the
investigated organisations and individuals should be highlighted as it is
done in this chapter. It has been observed by foreigners that “when you
ask a Hungarian a simple question you get a history lesson” (Markoczy,
1992b). To understand the existing issues in the Hungarian economic and
political environment and in the attitude of the Hungarian people towards
the market economy in fact requires some familiarity with the history in
which these issues are rooted. The Hungarian post-Stalinist area (after the
1956 uprising) could be best described as the history of economic reforms
interrupted by occasional fall backs. As a consequence of these reforms the
Hungarian economy moved away from the classically Stalinist model of a
centrally planned economy towards a quasi-market economy. This chapter
describes how these reforms contributed to the relatively smooth transfor-
mation process of the Hungarian economy towards the market economy.
In the light of this history, the privatization process and the changes are
analysed which have served to build up the institutions of the market econ-
omy. This chapter will concentrate on the general Hungarian environment
and history through which the more specific context of the investigated
organisations, which are described in the next five chapters, may be un-
derstood. In accordance with the focus of this thesis, the consequences of
these changes are addressed in terms of what kinds of managers were able
88
to achieve the top positions and what kinds of attitudes these managers
and other employees showed towards the market economy. The societal at-
titude towards privatization and changes will also be discussed as reflected
in the Hungarian media.
4.1 Two reforms: 1957 and 1968
The 1956 uprising was fought not only for the independence of Hungary but
also to put an end of the Stalinist socialist system. After the suppression
of the uprising and the punishment of the organisers the new leadership of
the Communist Party (Hungarian Socialist Workers Party), under Janos
Kadar, decided to follow a policy which was based on a compromise with
other political forces and devoted more attention to improving the living
standards of the Hungarian people. This policy made Hungary “the most
cheerful barrack” as both the Eastern Europeans and Westerners knew
it. Applying a policy of compromise the Communist Party even tolerated
those voices which called for a major reform in the Hungarian industry
(e.g., Kornai, 1957). These economists called for a larger independence of
the state-owned companies from the state. They wanted to restrict the
authority of the government to regulating the economy rather than assign-
ing the fulfilment of central plans to companies. The Communist Party
was also ready to accept the criticism that the previous policy of forced
collectivisation in the agriculture was one of the sources of tension within
Hungarian society, and to correct this mistake it started returning land to
the farmers. By the end of 1957, however, the forces which opposed these
so-called “revisionist policies” could be heard again. Instead of going ahead
with the reform, the state drew even more investment resources under its
control and merged companies of similar profiles to ensure a more effec-
tive state control over them. The newly merged companies were assigned
so-called supplier responsibility which meant that they were required
to satisfy the demands for their products in the domestic market (Peto
and Szakacs, 1985). The degree of these mergers could be best understood
89

through numbers: the number of companies in industry decreased from
1427 to 839 from 1950 to 1965 while the average number of employees per
companies increased from 336 to 1183 (Berend, 1983, p. 152). These merg-
ers created the basis of the industrial structure which characterised the
Hungarian economy till the beginning of the nineties: the dominance of
large, monopolistic, state-owned companies (Schweitzer, 1982). The anti-
reform forces also showed up in agriculture where re-collectivisation started
again at a high speed in 1958. Despite these policy reversals the new com-
munist leadership was aware that it had to go ahead with the reforms to
avoid a level of societal dissatisfaction which could lead to another uprising.
From the middle of the sixties the reform process strengthened again and
in 1968 a set reforms were introduced which substantially increased the
discretion of the management of companies as had been suggested by the
reformers in 1957. The party leaders and state officials were more willing
to increase the independence of the companies because the earlier mergers
of the companies had made their control easier through personal connec-
tions with their top managements. In fact this type of control was favoured
so much by the government that it initiated a second wave of mergers at
the end of the sixties and beginning of the seventies (Voszka, 1988). The
personal contacts between governmental officials and the managers meant
that the influence was not only in one direction. Through these contacts
the managers were also able to influence the state officials by threatening
them with shortages if their requests were not met. Personal bargaining be-
tween the top managers and the state officials became a commonplace form
of dealings between the companies and the state (Szalai, 1989; Markoczy,
1986). In addition to putting personal pressure on managers the state also
influenced companies through the means of introducing regulation, such as
import regulation, hard currency usage restrictions1, wage regulation, tax-
1The Hungarian forint was not a convertible currency at that time and even now itonly reached a partial convertibility. Before 1991 the government decided how muchhard currency a company could buy. Even those companies that earned their income inhard currencies could not use this income freely. They had to offer these currencies tobuy on the official exchange rate to the state and only could change a limited amount
90

ation, and by giving exemptions from these regulations. The state also had
the right to take a large part of the profit of the companies and redistribute
financial resources among the economic actors (Kornai and Matits, 1990).
As an owner, different ministries also practised the right of appointing
managers to the top positions of the organisations.
Just the large, state-owned companies dominated industry, agriculture
was dominated by large cooperatives by 1961 when the recollectivisation
process was completed. These cooperatives, similarly to the industrial com-
panies had personal connections with state officials and were regulated by
the state, but they also had some responsibility towards their own members.
These cooperatives delegated some of the labour intensive production to
their members and as a positive consequence of this delegation a network
of private business was able to develop even if it was closely tied to the
cooperatives. The cooperatives provided the private businesses with land,
seed, breeding stock and equipment and often bought their products. Pri-
vate business was first tolerated by the state officials, but it then became so
much part of the agricultural supply that it gained positive support later on
(e.g., tax benefits). Encouraged by the positive outcome in the agriculture
private business also started to gain legitimacy in the industry and services
as well. Although private business were often linked together by the state
and the public with the illegal black economy under the name of second
economy, it became an important part of the Hungarian economy by pro-
viding services, alternative career opportunities and supplementary income
for a large part of the population (Gabor and Galasi, 1981). Although
the second economy did not remain untouched by the first economy (for
example providing services to the first economy, leasing equipment from
employing companies or cooperatives for after work entrepreneurial work)
the rules of the game here were more similar to the rules in a competitive
market than to the rules in the first economy. This could be explained by
several reasons. The entrepreneurs could not rely on the bargaining process
of their HUF back to hard currencies (on a worse exchange rate) if they needed it.
91
as the large organisations could, so they were not in the position to change
the rules according to their interests. They were profit oriented because
their profit was the source of their survival and the reason for their exis-
tence. They could not expect, as companies in the first economy could, to
be rescued in case of bad economic decisions. To put it into the terminology
which Kornai (1980) introduced, their budget constraints were hard rather
than soft. Through the second economy a large part of the population
had contact with this quasi market economy, either as consumers and/or
as entrepreneurs which made Hungarians familiar with market conditions
(Revesz, 1990).
4.2 Reform from the beginning of the
eighties
The first signs of the current economic recession began to appear in the
late seventies. The state decided, with the support of the the Hungarian
Socialist Workers Party, to move the economy in the direction of establish-
ing a “socialist market” economy. The first major change in the beginning
of 1980 was the introduction of the two level bank system which separated
the commercial activities from the National Bank and established profit ori-
ented commercial banks. From 1981 to 1986 ten commercial banks were set
up which were still owned mainly by the state (Revesz, 1990). Previously
the National Bank was responsible for providing loans to the companies.
After the commercial banks were set up the National Bank allocated the
accounts of companies among them.
Another change in the beginning of the eighties was that the gov-
ernment not only tolerated small enterprises in industry but created a sup-
portive legal environment for establishing and running them. In 1984, there
was a major change in around 70% of the state owned companies in which
ownership rights were transferred from the ministries into the hands of an
elected body of managers and employees in the small companies (5% of
the companies) and into the hands of company councils in the majority of
92
large, state owned companies. In the company councils half of the members
were elected by the employees. One-third of the council were members as
a direct consequence of their positions in the company (e.g., the financial
director was automatically made a member of the council). The remaining
sixth were appointed by the CEO. The relationship between the CEOs and
the company councils was characterised by mutual dependence given that
the CEOs had the right to appoint managers on the company councils and
had the task of operationally managing the company while the company
councils appointed the CEOs, decided on strategic issues and determined
the financial compensation of the CEO (Sarkozi, 1993).
After these changes in 1984, the various ministries which had previ-
ously practised ownership rights only retained legal control over the com-
panies and their main task was seen as to regulate the economy. In 1984–85
the state made an effort to initiate a new cycle of growth in the economy.
This not only failed but even deepened the economic crisis. The Commu-
nist Party realized that it could only maintain its power if it changed the
composition of its government from politically reliable, aging communists
with younger, professional technocrats. Parallel to the changes in the gov-
ernment there was a major generational change in the top managerial po-
sitions of the companies. The old communist managers who did not have
sufficient education were replaced by middle aged, technocrat managers
many of whom had university education, and several of them spoke for-
eign languages and had some kind of Western education. Along with these
changes in the composition of top managers and government officials there
were other substantial changes which aimed to build up market-friendly in-
stitutions. One was the establishment of the capital market. In the middle
of the eighties Hungary already had a working bond market and by the
end of the eighties the stock market opened its doors. The stock market
was preceded by a Stock Exchange Board which was created by various
banks in 1988 to exchange shares on set days of the week. The other major
change was the introduction of the fair competition and anti-trust law in
93

1990 and the gradual liberalisation of imports.
4.3 Privatization in Hungary
Towards the end of the eighties it became obvious that even these sub-
stantial changes would not be enough to pull the country out of the crisis
which lead to a substantial decline in the domestic market. The Comecon
(Council of Mutual Economic Assistance, an economic block of the Soviet
Union and satellite socialist countries) might still have provided a large
enough market, but the financial problems in these countries made export
in this direction uneconomical and risky even before the final collapse of
Comecon in 1990. The changes in market conditions placed new demands
on the adaptation of companies; they either had to improve the quality
of their products and market these in the domestic market in a way that
would be able to compete with growing imports or had to be able to export
to Western markets. These new requirements placed high pressure espe-
cially on those companies which had been used to the previous shortage
economies in Hungary and the Comecon countries where almost everything
which was produced could be sold (Kornai, 1980). But there was also a
pressure on those companies which were already exporters to the Western
markets, given that these companies had to maintain their market posi-
tions among the conditions of recession and increasing competition in the
West. Adapting to the changing conditions required capital, technology
and expertise all of which the companies lacked in Hungary. It was an
obvious solution for the management of the companies to find investors
that could provide these. This effort of the management was supported by
the changes in the legal system: In 1988 laws were introduced which en-
couraged foreign investment, and in 1989 other laws were introduced which
made the transformation of companies into various forms (e.g., joint-stock
companies, limited liability partnerships) easier and made acquisitions and
formation of joint ventures less bureaucratic. The Hungarian tax system
was changed to allow repatriation of profit in the currency and in the per-
94

centage of the foreign investment. Foreigners also could remit freely the
liquidation proceeds. Foreign employees received the right to change as
much as 50% of their after tax renumeration to convertible currency. In-
troducing these laws were important for encouraging foreign investment
given that the HUF (107 HUF ≈ 1 USD in October 1994) is not freely
convertible.
Since the ownership rights were in the hands of the company councils
it did not require special permission from the state to privatize all or part
of the companies. This privatization process became known as sponta-
neous privatization because it occurred without the direct2 involvement
of the state, but the name also reflected a negative public attitude towards,
what some considered: “transferring public property into private hands”
without societal control (Bossanyi, 1994b). Contrary to the suggestion of
the name, spontaneous privatization was not a spontaneous process from
the point of view of the management of the companies. The top manage-
ments of the companies looked for professional, foreign investors to provide
capital and expertise or tried to change their commercial bank loans into
shares. It is true that the privatizing managers also tried to ensure high
positions for themselves in the newly privatized companies, and tried to
negotiate contracts which ensured either keeping the existing employees or
providing them high compensation in case they had to be laid off. In the
media, scandal followed scandal describing how the management abused
their powers and used public property to serve their own interest. This so-
cietal attitude tacitly gave support to some highly positioned government
officials from the National Bank, the National Planning Office and the Min-
istry of Finance who called for stronger state control of the privatization
process. These ministries (or ministry level institutions) wanted to control
the privatization process because they wanted to regain the power which
had been taken away from them in 1984 and also to enable the state to
2As Voszka (1992) pointed out the state still had some influence on the process ofspontaneous privatization through indirect means, such as regulations, and in case ofbankrupt companies even through direct influence.
95

get a bigger share from the privatization income. This, however, basically
meant “renationalizing” the companies which were run by company coun-
cils or by an elected body of the employees before they could be privatized.
The effort of the ministries in renationalization was successful in practice.
First they set up the State Property Agency (SPA) in 1990 which only
practised legal control over the spontaneous privatizations. From autumn
1991, however, the SPA gained rights which made it possible for it to act
as an owner rather than as a controlling organisation in the privatization
process.3
4.4 Political change
In 1990 the country went through a substantial political change. In May
1990 the first free election since 1949 was held which elected a conservative
party (Hungarian Democratic Forum) as the major party which formed
a government in coalition with two other conservative parties (Christian
Democratic Party and the Smallholders Party). The Hungarian Socialist
Workers party split into a reform wing party in 1989 (Hungarian Socialist
Party) and into a more orthodox communist party (Workers Party). The
latter could not even send any of its members to the parliament while the
former one was forced into opposition. The new government favoured the
more centrally run privatization to the spontaneous privatization because
it wanted a bigger share of the privatization income and also wanted con-
trol on the appointment of the CEOs. For example, in 1989–1990 many
of the CEOs had been reelected by their company councils, but the new
government were not satisfied with this because, as they saw it, those who
had risen to the top under the socialist system were accessories of that
system and should not be allowed to preserve their power in the new sys-
tem. The government therefore called for a reelection of the CEOs by the
3The renationalization and privatization happened in two steps. First the companieswere transferred into joint-stock companies and their shares were transferred to theState Property Agency which hired auditing firms to assess the value of the shares andthen the SPA privatized the companies by selling their shares.
96

company councils under stricter conditions (CEOs had to gain two-third
of the votes rather than a simple majority). Although this forced some old
communist managers who were still in power to retire, most company coun-
cils still kept their professional, technocrat CEOs. The government officials
could not accept this failure, however, so after the “renationalization” of
the previously-independent companies they repeated the same practice as
the communists did in the classical socialist period: They replaced techno-
crat, professional managers with non-professional, but politically-reliable
managers.
Parallel to the renationalization process, the state also declared certain
industries (transportation, telephone and postal surveys, newsprint, etc.)
strategic industries which should remain under the control of the govern-
ment. A new office was set up called State Property Managing Agency to
manage the companies which fell into these industries. As the state gained
more control over the state companies and their privatization, the privatiza-
tion process took a new turn. At this stage of privatization preference was
given to the highest bidder or to those who could satisfy the privatizers by
other means, as opposed to the professional investors which the company
councils were seeking. The more serious economic periodicals were filled
with reports of scandal and corruption from central authorities. One Hun-
garian economist, Laszlo Lengyel had criminal libel charges brought against
him in 1993 for stating that “it had reached the point where the price of
each government minister is an open secret”. Although he was convicted on
appeal, his statement reflects the general sense among economists in Hun-
gary that decentralised corruption of spontaneous privatization has been
bought under central control by the Hungarian government. The increas-
ing power of the state in the privatization also increased the bureaucracy.
However, despite the increasing bureaucracy and expense of dealing with
government officials, many multi-national investors preferred to negotiate
privatization deals with the government rather than with the management
because this meant they could also extract state guarantees in high risk
97

cases and protectionist policies for the industries they invested into. They
preferred to receive direct state guarantees despite the fact that during
the time of spontaneous privatizations the top managers of the companies
were also able to negotiate good conditions for their investors with state
officials. The privatization cases which were handled by the SPA created
different initial conditions between the management and employees of the
companies and their new owners than the spontaneous privatization deals
created. The new deals protected the management and the employees of
the privatized companies less and provided less or no guarantees that the
Hungarian management could influence the strategies of their companies
from the beginning of the privatization. Because of these differences in the
differences of initial conditions between Hungarians and foreigners, due to
differences in the privatization methods, it is expected that less drastic lay
offs occurred in those companies which were privatized under the sponta-
neous privatization; and there are more examples of shared, rather than
forced approach in introducing change (Child et al., 1994) among these
companies than in those organisations which were privatized by different
methods. Based on the above the following prediction could be made:
Hypothesis 4.1 Companies which were privatized under the process of
spontaneous privatization will experience less drastic lay-offs than those
which were privatized by other owners.
Hypothesis 4.2 In those companies which were privatized under the pro-
cess of spontaneous privatization foreign managers will be more likely to
apply a shared approach for introducing change than in those organisations
which were privatized by other owners.
Although the multi-nationals preferred to negotiate with the state, the
state officials themselves had mixed feelings towards the large, foreign in-
vestors. On the one hand they acknowledged that the multi-nationals were
the main source of capital and professionalism for the economy but on the
other hand there was an increased fear, expressed by highly ranked officials
98

in the leading party, of “selling out the country to foreigners”. This showed
up in the policy of the state towards the multi-national companies which
was inconsistent at best. For example, for a long time the the government
resisted devaluation of the HUF by the rate of the inflation which hurt the
large exporting companies, many of which were multi-nationals. The new
government, even at the cost of decreasing credibility, also refused in certain
cases to accept the continuity of responsibilities for agreements which had
been made between the previous government and multi-nationals which
had invested to Hungary. The state also lacked a coherent policy of when
to accept and when to refuse the demand of foreign investors for increas-
ing protectionism and other advantages. It often negotiated private deals
with companies while showing inflexibility with other companies. It should
also be noted, however, that the state was under very strong pressure from
foreign investors. Although countries around the world offer protectionism
and tax benefits to attract foreign investors the pressure exerted on the
governments of the transforming economies frequently raised doubts as to
whether Western investors were indeed here with the purpose of contribut-
ing to the building of a market economy. These companies often seemed to
be more comfortable with fitting into the bargaining process with the state
than facing fair competition in the market. In Hungary multi-national com-
panies even created an association to represent their interest towards the
state. The Hungarian Association of the International Investors (Magyar
Hırlap, 1992; Ban, 1992) was set up in September 1992 by 14 foreign multi-
nationals which became a powerful bargaining force towards the state. The
equivocal attitude of the Hungarian government and the leading party was
well represented in the 1994 election campaign, where leading members of
the party attacked the concept of “selling out the Hungarian economy to
foreigners” but also presented as one of the success of their past economic
policy the increased foreign investment to Hungary. Interestingly, many
of the companies listed had come to Hungary prior to the 1990 elections.
The second free election resulted in an overwhelming victory of the reform
99

1000 million HUFYear Companies Starting capital For. inv. Total For. inv
(new and existing)
1989 1350 124.4 30.0 501990 5693 274.1 93.2 1401991 9117 476.6 215.0 3101992 13218 546.0 257.9 48019931 15311 569.1 275.0 700
1 First half yearData from Cegvezetes (1994) and Hungarian Central Statistics office.
Table 4.1: Cumulative Foreign investment in Hungary
wing Hungarian Socialist Party largely because the Hungarian Democratic
Forum could not meet the expectations to improve the economic conditions
in the country. Also, the publicised corruption cases and the effort of the
government to control the media resulted in a decreasing trust in the gov-
ernment by the society. As noted below, this should be seen not as a move
away from reform, but switching from one group of “gradual” reformers to
another.
4.5 Changes in the economic conditions
As we will see in the following chapters which describe case studies of
five companies the foreign investors who came to Hungary were mostly
attracted by gaining market not just in Hungary, but Hungary as a gateway
to the Comecon market, and also wanted to benefit from the low input
material, energy and labour cost. Hungary also received the highest foreign
investment in the region for years because it proved to be more stable then
its neighbours. The amount of foreign investment in Hungary is presented
in Table 4.1.
The importance of foreign investment in Hungary is reflected in the
fact that by 1993 those companies which were partially or fully owned by
foreigners gave 9% of the Hungarian GDP (Bossanyi, 1994b). The benefits,
however, which attracted the foreign investors to Hungary have gradually
disappeared from the Hungarian economy. With the collapse of the Come-
100

con and the disintegration of the Soviet Union, Hungary no longer serves as
a safe gateway to these markets. The economic problems in Russia and the
Ukraine have also made the cheap energy and input material sources more
unreliable and has increased substantially of cost of the input materials and
energy. Labour costs in Hungary are also relatively higher than in neigh-
bouring ex-socialist countries (Martin, 1994). These worsening economic
conditions slowed down foreign investment in Hungary, to the advantage
of other Eastern European countries (e.g., Czech Republic).
4.6 Societal attitude towards the market
economy
Generally it could be said that the Hungarian people have mixed atti-
tudes and feelings towards the market economy and foreign investment.
As discussed above in Hungary entrepreneurs were an integrated part of
the economy and a large part of the population drew income from the sec-
ond economy prior to the Communist collapse in 1990. As a consequence
Hungarian people are more used to a functioning market and have a higher
tolerance towards income differentials then may be the case in other trans-
forming economies. Also, the second economy provided a learning ground
for a large portion of the Hungarian population in running business, even
if on a small scale. However, there were some associations also remained
between of the notion of market and the black economy, where cheating on
the tax office and on customers was a frequent event. Tolerance towards
income differentials also decreased as – as a joint consequence of economic
crises and changes towards a market economy – a small group of people
became conspicuously richer while the living standard of the majority de-
creased.
The institutional changes from the beginning of the eighties towards
a market economy gave enough time for the Hungarian people to accom-
modate to the changes and for professional technocrats to replace the old
communists in various parts of the economy. These changes prepared a
101

favourable condition for a peaceful political transformation during which
the reform communist government handed power to a conservative govern-
ment. However, despite these favourable changes in the institutional envi-
ronment and in the composition of the business management and among
the state officials, the new conservative government reversed some of the
tendencies which proved to be better than the newly introduced practices
(e.g., spontaneous privatization) instead of continuing them, and replaced
a few professional managers by politically reliable, non-professional ones
applying an anti-communist rhetoric. (For example, in late 1990 the head
of the National Bank was replaced for undeniably political reasons). Voting
for the new government expressed the preference of many Hungarians for a
slow rather than a fast change in the economy. The leading party won the
election with the campaign slogan of being the “calm force” against the
liberal parties who urged faster change towards a modern market economy.
The preference towards slow change also showed up in the 1994 election
result. Although the majority of people became dissatisfied by the per-
formance of the conservative government they did not vote for the liberal
parties but rather to the ex-reform communist who appeared as the other
“calm force” in its rhetoric.
Hungarians also have mixed feelings towards Western investment as
well as towards the market economy. Many Hungarians treat Western
investment as a necessary evil where the stress is on both of the words nec-
essary and evil. There is increasing xenophobia and bad feelings towards
Westerners in the sense that Hungarians feel that Westerners look down on
Hungarians and only come to Hungary to exploit the cheap labour, input
material, energy cost and services in the country. The Hungarian labour
force is well educated and there is a national pride concerning Hungarian
skills which is not always appreciated by Westerners. Western managers
coming to Hungary earn incomes several times higher than Hungarian man-
agers in the same positions which is a source of negative feelings.
At the same time Hungarians acknowledge that foreign investment is
102

necessary to pump enough capital and new technology into the country. We
have to remember that during the time of spontaneous privatization the
management and the representatives of the employees themselves decided
to privatize their companies to foreign professional investors which is a sub-
stantial decision even if made under certain economic pressures. We also
have to note that Hungary was always an open country (except for a short
period in the early fifties) with a well developed tourist industry. Since
Western tourists provided income for many of the Hungarians and since
Hungarians themselves often travelled to the West the Western investors
were not so “foreign” for many of the Hungarians. Hungarians also admire
Western living standards which they would like to reach. Also, from the
end of the eighties several foreign business and management schools opened
their doors to educate Hungarian managers. Funds, like the Soros Foun-
dation, helped Hungarian business teachers and students to travel and to
receive education in the West, international funds were set up to support
exchange of students and joint research or provided consulting to companies
at very favourable prices, and Western institutes were set up for educat-
ing managers from the transforming economies among them from Hungary.
Through these sources many Hungarian practising managers and business
students had access to Western managerial education and training which
made them familiar with the Western concepts of doing business.
Although with the appearance of Western investors many Hungarian
employees found the new requirements of the foreign investors overly de-
manding, there were also many talented managers in the companies who
were even more impatient to prove themselves and induce changes than the
foreign investors themselves. Also, in the last few years a new generation
have grown up who have had a larger share of the Western type of educa-
tion than previous generations, who speak foreign languages and want to
succeed in a competitive environment rather than in an environment were
political views and personal connections are what matter. This generation
is ready to replace those who are incapable and unwilling to adjust to the
103

changes which often draw anger from those who feel threatened by these
young people. This new generation also creates incentives to adjust, even
for those who oppose change, by acting as competition. There is also a
willingness to adjust because of the real threat of unemployment. In the
beginning of 1994 for example Hungary had a 13% unemployment rate
and in many of the newly privatized companies excess employees were laid
off who then had difficulty finding other employment. The above discus-
sion suggests that there might be some generational differences expected
in terms of willingness to change, so we might be able to find evidences
for old guards (those, older people who are likely to resist change) and
young technocrats (those, younger managers who are ready to adopt
modern business practices). But even if this tendency might be found it
is expected to be accompanied by large individual variation. Based on the
above we could put forth hypothesis4 4.3.
Hypothesis 4.3 Generational differences could be expected between the
younger and older managers in terms of their beliefs and in their readiness
to change.
4.7 Work attitude of Hungarians and
Anglo-Saxons
In addition to looking at the attitude of the Hungarian managers towards
the market economy and change it is also a matter of interest what kind
of work attitudes Hungarians show and how these differ from the work
attitudes of Anglo-Saxon managers. There have not been many studies
conducted to test the work attitude of the Hungarian managers, but there
was a study conducted which compared the work attitude of Hungarian
and American workers (Kalleberg, 1992). This study found that Hungar-
ian workers more regard their work as one of the most important activities,
4As with the directional hypotheses section 2.5.1, this thesis does not set out to testthis hypothesis.
104

Hungary United StatesMinimise power betweenmanagement/workers Power in managementLack of individualresponsibility for Decision making bydecisions individualsOpen to change Open to changeRespect for hierarchy respect for decentralisationImportance of reciprocalrelationships IndependenceLow tolerance of risk Creativity/innovationCompliance to rules Tolerance for rule breakingFormal, written communication Direct discussion
Table 4.2: Attitude towards JVs
but they also consider work as merely a money earning activity. They did
not find their job as interesting and or as a place for providing independent
decisions as the Americans did. This suggests that Hungarians identify less
with their work than the American workers do. Hungarians also appeared
to be more motivated by economic incentives than the American workers
who often stated that they do certain work for intrinsic rewards. Since Hun-
garians seemed to try to economise their income based on their effort this
makes it understandable why foreigners sometimes consider Hungarians
lazy despite of other evidence (Burawoy and Lukacs, 1985). Other studies
which concentrated on managers found that Hungarians avoid responsibil-
ity taking, they show a kind of servility towards authorities, they are ready
to hold back information since they consider it as a source of power, and
they like using bargaining and personal contacts as means to gain special
treatment (Markoczy, 1993b; Child and Markoczy, 1993; Pearce, Branyiczki
and Gyula Bakacsi, 1994). Baird et al. (1993, p. 303) summarised the atti-
tude of Hungarians and American managers based on the literature (which
partially relied on Child and Markoczy (1993)). Their summary is shown
in Table 4.2.
In their studies Child and Kieser (1979) and Child (1981) compared
British and German organisations and managers. The British managers
105

showed many similar characteristics to the American managers. They,
for example, also tended to delegate a high degree of authority and in-
fluence to the lower levels and supported decentralisation (Child, 1981).
They also tended to be open towards change and were ready to accept
new ideas irrespective of the positions of managers who these ideas came
from. British managers also showed a relatively low level of conformist
attitude (Child and Kieser, 1979) which is similar to the American atti-
tude. What might differentiate British managers from American managers
is that British managers tend to express a relatively great concern about
the well-being of their subordinates (Child, 1981) and in accordance they
might apply a more person oriented managerial style than the American
managers.
Attitude studies like those which are listed above have to be treated
with care. When considering these studies the reference groups always
should be kept in mind (e.g., workers or managers) as well the time of the
data collection. Given that Hungary is a rapidly changing economy where
a few years might mean substantial changes in people’s attitude, even those
studies which contain relatively recent data on Hungarian managers might
have limited validity now or in the near future.
106

Chapter 5
Company A: Incandescent
5.1 The acquired company
Company A is a leading light-bulb and electrical company not only in
Hungary, but in Europe as well. In 1990 it was acquired by an American
company (G) which first bought 50% of the shares plus one for $150 million.
In 1991 G bought a further 25% of the ownership for $40 million and
raised the basic capital of the company to 9.542 thousand million HUF
(63HUF ≈ $1 at the time of covered here). In 1993 G had bought an
additional 24.4% of the shares of the company from the other owner, which
was a bank, at a price which was kept secret from the public (this deal
will be discussed below) and this way it became the owner of 99.6% of
the shares. After gaining almost full ownership of the company, G raised
the basic capital of A with an additional 16 thousand million HUF to the
level of 25.5 thousand million HUF (B. Varga, 1993). From the time of the
acquisition G had invested up to $350 million in A.
Company A currently employees 9000 people, a substantial decrease
compared to 18000 at the time of acquisition. The company now oper-
ates in 9 locations at 11 plants one of which, along with the Hungarian
headquarters, is in Budapest. Others are in smaller towns in Hungary and
Turkey (Svantek, 1992). The company also had a plant in Vienna which
has been closed since the time of the acquisition. The total sales of the
company was 22.6 thousand million HUF in 1990 of which 80% was in
107

western markets, 11.5% in Hungary and only 9.5% in Comecon (Council
of Mutual Economic Assistance) countries. During the first two years with
the American partner A increased its sales by 18% and 16%. Its total sales
reached 31 thousand million HUF in 1992 (Nepszabadsag, 1993a).
5.2 The history of the company
The history of the company reaches back almost a hundred years, during
which it worked as a joint-stock company, under different names. Its cur-
rent name refers to the technology and the resulting product developed by
the company which was previously a trade mark of the company and was
registered as such in 1909. One of the strength’s of the company was its
research and innovations in lightings and electronics (Szentgyorgyi, 1992).
In 1921 this company was the only one in Europe which had an in-company
research center which produced several patented innovations. After World
War II the company suffered serious personal and material losses. 75% of its
production equipment was taken to the USSR. At the beginning of the so-
cialist regime the shares of the company were transferred to the state (The
shares were valued at 42 million HUF at that time). A only remained a
joint-stock company in name. In reality it was a large state owned company
which worked under the same conditions as other companies of this kind
as described in the previous chapter. What made this company different
from the other large state owned companies was that it always maintained
a western orientation in its sales. Even under the socialist system A al-
ways sold the majority of its products in western markets and as a result
it developed an extended network of distribution channels in the West.
Although the company was profitable for several years in the begin-
ning of the eighties, it started to have financial difficulties and by 1988 it
had accumulated debts of 5.5 thousand million HUF loans which it could
not pay back. In the beginning of the eighties when the two level bank
system was introduced, as described in section 4.2, one of the Hungarian
commercial bank “inherited” the bad loans of A (These loans were consid-
108

ered bad, because the company was not able to pay them back). The bank
decided, together with the state, to turn the loan into majority ownership
of the company. The bank must have had good lobbying capabilities be-
cause the Financial Ministry agreed to write off A’s debt of 2.6 thousand
million HUF. The debt write off made the company sellable, but in the
first few years the acquiring partner was not able to reverse the loss pro-
ducing tendency. Despite all the changes which are discussed below the
acquired company ended up producing even greater losses of: 1.5 thousand
million HUF in 1990, 1.1 thousand million HUF in 1991 and 11.5 thousand
million HUF in 1992. To compensate for the losses G announced a plan
to devalue the basic capital of the company by 9.5 thousand million HUF
and then raise it by $200 million to which the partners should contribute
according to their ownership. (The bank still owned 24.4% at that time.)
In press reports this move by G was interpreted as a means to force the
bank to sell the remaining 24.4% of its share to G. Since after expressing
some unwillingness to enter into this deal the management of the bank
gave in so the threat of devaluation remained unfulfilled (Nepszabadsag,
1993b; Nepszabadsag, 1993c).
5.3 External conditions
The current environment of company A is characterised by a recession in
the European market and by a decreasing demand of lighting and elec-
tronic products (G Company, 1991). According to the head of G Europe
(who became the head of A in December 1992) this recession by itself
caused 2 thousand million HUF loss to the company in 1992 (Nepszabad-
sag, 1993a).
Prominent members of A complained about the policy of the Hun-
garian government which in the last few years gave preference to an anti-
inflation policy which meant that the HUF was not devalued at the rate of
the inflation. The increasing overvaluation of the HUF caused substantial
losses to exporters such as company A. According to the former execu-
109

tive director of company A this governmental policy by itself cost A 4.8
thousand million HUF (Varga, 1992).
The company was also negatively affected by the increasing labour and
input material costs in Hungary and by the collapse of the Comecon which
stopped the favourable position of Hungary as a threshold country to such
markets as the ex-Soviet Union.
In response to the negative external conditions, the management of
company A took actions which attracted serious criticism in the media.
It shut down 10 out of its 11 plants for two weeks with the stated pur-
pose of getting rid of the accumulated unsold inventory. However, many
experts in the Hungarian media thought that the step was too drastic to
be merely explained by unsold inventory. Several authors accused A of
seeking to preassure the Hungarian government to change its policy, re-
calling bad memories of the previous system where the large, state owned
companies influenced the state to follow policies which were favourable to
them (e.g., Gyenis and Szalai, 1992; Heimer, 1992). Criticism was raised
that multinational companies, like G, were using their power to influence
governmental policies rather than concentrating on improving their inter-
nal operation and efficiency to overcome the negative external conditions
(Heimer, 1992). We have to note that G was founding member of the Hun-
garian Association of the International Investors, as discussed in section 4.4,
which was created with the special purpose of influencing the policy of the
Hungarian government.
5.4 The purpose of the partners
During the interviews three reasons were identified why the American part-
ner acquired company A: (1) G wanted to increase its share in the western
European market; (2) it planned to use A to open towards the Russian
market; (3) it wanted to benefit from the cheap labour and input costs
in Hungary. It is likely that G indeed wanted to increase its share in the
western European market since it also acquired another European light-
110

bulb company. The acquisition of A increased the share of G in western
Europe from 2% to 9% and the acquisition of the other company increased
this market share to 15%. It is not clear however whether G had any goal
concerning the Russian market. According to a manager who was respon-
sible for the Russian and Eastern European markets G never had and still
does not have a clear strategy about what to do with the Russian market.
Since the collapse of the Comecon it is now even harder to work out a strat-
egy for this market. That G wanted to benefit from the cheap labour and
energy cost could be deduced from the statements of the foreign managers
who attributed part of their losses to the increase in these costs (Varga,
1992).
The management of the acquired company stated that they expected
that the acquiring company (1) would invest capital into the company
and (2) also provide managerial know how on how to make the company
efficient. Although both expectations were met this happened at the cost
of A ceasing to be an independent company, being in the end completely
integrated into company G as discussed below.
5.5 New techniques, changes
After G acquired ownership in A the organisational structure and the or-
ganisational procedures went through a substantial restructuring.
5.5.1 Restructuring
The linear organisational structure was initially replaced with a matrix
form. At the top of the organisational chart was the repatriate executive
director and 11 vice presidents who were responsible for different func-
tional areas and also for different products. This organisational structure
was flatter than the previous one where, apart from the executive director,
there were only four vice presidents who were each responsible for more
levels than each of the 11 vice-presidents were. At the beginning of the
fieldwork (July 1992), among the 11 vice-presidents, 7 were Americans,
111

but by the end of September 1992 two American vice-president had been
replaced by Hungarian managers. One of the Hungarian managers who
replaced the American vice-president had recently returned from Amer-
ica where he had worked in one of the companies of G. The American
managers were selected by the executive director in a way so that they
had longer working experience (their average working experience was 18
years). The executive director deliberately passed up chosing aggressive,
young managers so hoping that the more experienced American managers
would be more sensitive when handling national differences. Although the
goal was to gradually replace the American managers with Hungarians at
the end of 1992 many of the key positions were still in the hands of Ameri-
can managers, such as finance, marketing, product management, machinery
production and lighting production. The two positions which the American
managers transferred to Hungarian managers were human resource man-
agement and information system management. The positions which were
held by Hungarian managers were sales, technology, external relations, le-
gal and customer service. The 11 vice presidents were superordinates of
directors of functional areas who were also responsible for the production
of certain products. According to the interviewed managers the matrix
structure was applied to decrease separation between functional areas and
encourage communication in a horizontal manner. It was also aimed at
making it easier to organise cross-functional teams on different projects
and processes. This kind of team work was already a practice during the
time of my interviews, but horizontal communication was still explicitly
mentioned as a problem area by 5 out of the 20 interviewed managers.
Although the new organisational structure reflected an effort to de-
centralise in the beginning of 1993 a re-centralisation took place. On 7
December 1992 G did not extended the expired contract of the executive
director, but appointed the head of the European Division to also fill the
executive director position in A. The new executive director was located in
London and he made clear in press interviews that he did not consider A as
112

a separate company but as part of the European division of G (e.g., Reti,
1992). As a consequence of this change a new, higher level of management
was introduced from the point of view of A. The top management now is
formed by the directors of G-Europe. Three of the Hungarian vice presi-
dents were appointed to fill a joint position (G-Europe director as well as
vice president) in G-Europe and A the rest of the G-Europe directors are
Americans, British or Irish. The three G-Europe director positions which
are filled by Hungarian managers are production and R&D, Eastern Eu-
ropean Region, and Procurement. According to one of the Hungarian PR
managers the two latter positions are mostly formal. The only significant
position filled by a Hungarian manager is the joint production–R&D func-
tion. The marketing, finance, information system, HRM top functions are
filled with foreign directors in G-Europe who are in London most of the
time. In A, the main managerial functions now are the product managerial
positions. With this move A basically was reduced to a production and
development plant of G. Even before this change happened the Hungar-
ian managers in A complained that the marketing and financial decisions
were made in London and that managers in A are not kept well informed
about why certain things were happening in these areas. The Hungarian
managers from A raised this problem in a 9 hour meeting held in Novem-
ber 1992 including 130 managers from A and some top managers from the
European division. Although the executive director of A (who was still
the Hungarian manager at that time) did not allow me to watch the video
which recorded the presentations and questions of this meeting (minutes
were not made) he agreed that I could interview the two public relation
managers who summarised the important issues which were raised in this
meeting.
5.5.2 Cost control
To compensate for the increasing cost, the management of A put much
emphasis on improving cost efficiency. At the initial stage 30 manufacturing
113

experts were sent from the foreign parent company to investigate ways to
decrease cost. One way of improving cost efficiency was to improve quality
in a cost effective way. This means to producing exactly the quality that
the costumer needs and is willing to pay for: no more, no less. The other
way of decreasing cost was to decrease waste, and rejects and reduce the
inventories of input materials by organising the procurement system in a
more efficient way. A major cost decrease was achieved by decreasing the
number of employees as described below.
5.5.3 Production, technology
After G acquired ownership in A a profile clearance was initiated by the
new management. This meant that two divisions were created partially
from the existing production activities and partially by establishing new,
related products; at the same time unrelated production was shut down.
The two reformed divisions were (1) the products of the lighting division,
which accounted for 80% of the consolidated turnover, and (2) the machine
and electrical division making up the remaining 20%. The profile clearance,
the related introduction of new technology and the upgrade of the existing
technology cost G $20 million in 1990, $35 million in 1991 and $30 million in
1992. After the appointment of the new executive director the London office
decided to concentrate on the first division and form a strategic alliance
with another company for the machine production. With the efficiency
steps and profile clearance G managed to increase the value of production
of A by 20%.
In connection with the profile clearance G made a substantial tech-
nological investment in A to upgrade the existing technology and bring in
new technology so the divisions could work on the technological standards
of G. One of the largest investments of this kind was the opening of a com-
pletely new compact-light production factory and a normal-light factory in
the town N which are equipped with the most modern technology in the
world.
114

The stated purpose of the profile clearance and technological improve-
ment was even at that time to prepare the ground of integrating A into the
G’s network. As one Hungarian managers stated in an interview in 1991:
. . . G is building on A for the long term, in which it will soon be
integrated into the G network and will produce to the standard
which is typical in G (Meixner, 1991).
This integration effort showed up in another “profile clearance” activ-
ity as well. In stopping parallel R&D activities in its lighting divisions G
identified 7 major directions in research and assigned them to its different
companies. Of these 7 topics A received 4 for which is now the sole research
site within G (Varga, 1992). In order to create good conditions for research,
G set up centres of excellence in its companies, consisting of research teams
with 10–15 people who are supplied with the necessary equipment for con-
ducting high quality research. Such centres of excellence, which one of the
research directors called “engineer kindergartens” are not unprecedented in
A, which had previously famous research laboratories (Szentgyorgyi, 1992).
5.5.4 Bookkeeping
Among changes in organisational procedures, a parallel bookkeeping sys-
tem was set up. In addition to calculating and recording information by
Hungarian accounting standards, A also had to follow the accounting re-
quirements of G. The difference between the results of the two accounting
standards was substantial during the first years. The losses which company
A produced in the first years of acquisition seemed much larger by the Hun-
garian accounting standards than by the American ones. The reason is that
the Hungarian accounting standards required that the restructuring cost
had to be written off in the year it occurred while according the American
accounting standards these costs could be depreciated over several years
(City Reports, 1992). The calculation of losses was also made difficult by
the internal trade within the units of G, as transfers within G were not
necessarily the same as market prices.
115

5.5.5 Employment policy
After G acquired ownership in A the number of employees was substantially
decreased. The company has laid off 9000 people so far and an additional
20% decrease is planned, mostly directed towards administrative employees
(The Wall Street Journal, 1992). There has also been an opposite trend in
this respect since A was integrated into G-Europe, such that A has been
hiring employees to the production area and managers to R&D positions.
The management of G-Europe has been closing down unprofitable plants
in western Europe (in England and Vienna) and moving the production
activities to Hungary. So far around 700 employees and managers have
been hired in 1993 and this process is continuing.
Initially, “soft methods” such as early retirement and not hiring new
people in place of ones who left were used to reduce numbers. The man-
agers of A also made an agreement with the trade unions that they could
provide help in retraining and finding new jobs to those who were laid
off. The media at first presented this method as a model for emulation but
then the co-operation broke down between A and the trade unions when ‘A
Employees’ Independent Trade Union’ (TDFSz) learned about the planned
further 20% decrease in the number of employees. The TDFSz published
a political pamphlet in one of the leading Hungarian newspapers accusing
the European division of G of intentionally dismantling A after acquiring
its markets. The pamphlet also blamed the European division for failing
to build on the marketing expertise of the Hungarian managers in the Eu-
ropean market and over-confidently applies the American techniques and
losing markets as a consequence. The TDFSz also claimed that by reducing
the labour costs the European division was seeking to cover its inefficiency
in decreasing cost in other areas. They stated that by covering their in-
competence with unethical and inhuman tools, managers in the European
division caused substantial damage to G itself (TDFSz, 1992). In response
to the pamphlet on 7 October 1992 the trade unions and the management
of A held a six and half hour meeting about the planned lay offs. The sum-
116

mary of this meeting was published in the internal journal of A. According
to this summary the management of A mostly blamed the changes on the
external conditions which raised stricter efficiency requirements, including
further lay-offs. Blaming external conditions in bad times while attributing
good performance to internal efforts is a well discussed managerial attitude
in the management literature (e.g., Huff and Schwenk, 1990; Bettman and
Weitz, 1983; Ford, 1985). It is therefore problematic to draw any reliable
conclusion from these statements. Only one problem was raised which was
internal in terms of the European division of G and which addressed the
problems of accumulated inventories. It was mentioned that the European
trade network was accustomed to deliveries which were infrequent and of-
ten far beyond the time of the orders. Therefore this network was used
to accumulate large inventories to satisfy the demands in time. Because
of this, the managers of this network only realised late, after accumulating
huge inventories, that the working style has changed by G acquiring A.
Although the representatives of the trade unions accepted the explanation
concerning the unfavourable external conditions they did not find the anal-
ysis of the internal problems satisfactory. They required the identification
of managers and decisions which could be held responsible for the situa-
tion. At the end however they accepted that further general lay offs were
necessary for the survival of A (Varga, 1992) together with hiring to areas
where extension was possible.
5.5.6 Incentive system and training
After the acquisition the pay system was simplified. The variable pay
system was eliminated, the previous performance bonuses were integrated
into the wages. The management bonuses were substantially reduced while
stock options were introduced to managers to increase their commitment to
the company. From the end of 1993 company A introduced an experimental
incentive program in the engineering area which tries to encourage engi-
neers and skilled workers to work together in international teams on certain
117

projects (G. Barta, 1993). The aim of this program is to decrease parallel
activities within G. On the top of this program is the international “Senior
Leadership Team” which is responsible for the success of the light-bulb and
electrical activities of the whole G. The second line leaders of this program
are the “Team project managers” who are responsible for implementing the
yearly 30–40 engineering projects drawing from the human and financial
resources which they have for these programs. This incentive system does
not reward individual achievements but rather encourages team work and
the pursuit of joint rather than individual goals. This program is only at
an experimental stage so it is not possible yet to predict its success.
Since gaining ownership in A the management of G put much emphasis
on the training of the Hungarian managers. Training takes several forms.
It ranges from training managers on site to organising common, part time
MBA courses in collaboration with management training schools, such as
the International Management Center in Hungary.
In addition to formal training A also adapted working techniques from
other plants of G. One of these is the “best-practice” method. This means
that if any of the plants within G, even in a different area, finds a new
managerial technique or practice which turns out to be successful, other
plants get to know about it and are encouraged to use it. Another is the
“work out” method. The essence of this is that managers work on projects
in teams where they try to find the best solutions together. After agreeing
on the solutions they divide up the tasks among themselves and in this
way make individual members of the team responsible for the fulfillment
of certain tasks.
5.5.7 Marketing, sales
After the foreign partner gained control of A the foreign partners tried to
use the distribution channels of A to sell brands of G beside the brands of
A. Hungarian managers who were responsible for sales before the acqui-
sitions claim that because of this company A lost markets. Press stories
118

also reported losses in markets where American products were not bought
for political reasons. Losing these market happened at a time of increas-
ing competition in the western market. The management of G tried to
overcome these problems by separating marketing and sales issues from
company A and moving these to the headquarters of G-Europe.
5.6 Changes in the relative positions of
areas
Due to G’s plan to turn A into an efficient production and development
company these became the areas which benefited from the new hiring,
financial investment and training policies compared to other areas. Even
in the early years after the acquisition the production and R&D areas
showed substantial improvements while the achievements in the financial
and marketing areas remained below expectations. As one of the Hungarian
managers described the situation:
Those who work in the production area are under a rational manage-
ment, the process of setting the goals and making people account for
their activities is very good. There is good feedback on our work.
The problem is that the advantages which we achieved or which
made us achieve do not show up in the company’s result because
of financial and marketing problems. So, I feel if we could cut the
company into pieces, like into marketing, production and financial
areas, then I think the production area works excellently, and let me
include the R&D here as well. But the financial and marketing areas
work very poorly. It is because production could be grasped very
easily, it could be arranged internally. But the other areas have to
adapt better to the Hungarian financial and political environment,
to the changes in the needs of the customers and to the recession
which has characterised the world recently. I do not think that this
is flexible enough.
119

5.7 Salient issues identified by the
managers
During the interviews which followed the elicitation of the CMs, managers
were asked to identify problems and salient issues which relate for example
to the internal and external changes or to the fact that an international
management team works together.
Twenty managers were interviewed as well as having their causal maps
elicited. Among the 20 managers seven were Americans, one Irish and
twelve Hungarians.
The problem areas identified related (1) to national differences and (2)
to the changes in the internal and external context.
Eleven of the 20 managers raised problems relating to national differ-
ences. Criticisms were made about both American and Hungarian man-
agers. The American managers were criticised for not building on the exper-
tise of the Hungarian managers and for overconfidently applying American
techniques to a European context. The Hungarian managers were criti-
cised for their unwillingness to take risk, for their lack of understanding of
what customer service, quality or cost efficiency mean, for lacking a sense
of urgency, for having a family rather than a career orientation, for re-
specting authority too much, for their lack of qualifications as leaders and
for their lack of loyalty. The lack of loyalty was mainly restricted to the
Hungarian middle-managers and was raised as a problem by a Hungarian
vice-executive director. He said:
I feel that there is one important issue here: we should be able
to get the absolute loyalty of the middle managers. I do not feel
that this is typical in Hungary. What is typical that the managers
criticise and scold the other ones behind their backs in front of their
subordinates or in front of other managers and the effect of this
behaviour is rather destructive.
Many of the mentioned cultural issues address concerns similar to
120

those found in other immos in previous studies (Child and Markoczy,
1993; Markoczy, 1993b).
Among the change-related problems managers emphasised that the
original horizontal and vertical information and communicational channels
broke down as a consequence of restructuring and the new ones either were
not built yet or were not functioning satisfactorily.
One of the major horizontal communicational problems which were
mentioned was between the production-R&D and sales areas.
As one of the R&D persons explained the issue:
I most often communicate with other R&D people but not enough
with the marketing and financial people. I do not really understand
what I should do to make things better for them, but this is clearly
a communicational problem since I do not know this because of
my position and they do not communicate with me because the
communication channels have not been established yet. So, in other
words, I think this is a serious management problem, that the needs
of the market do not show up in R&D.
In addition to the horizontal communication between the marketing
and production areas criticisms were raised concerning vertical communi-
cation. As one of the managers said:
The downward information is slow and well considered but the
upward information is whitewashed and only contains information
which would not cause problems for the information providers. The
processed information does not contain the whole but always just a
strictly defined area.
In terms of external changes similar issues were raised as were discussed
previously: Problems were mentioned concerning the financial policy of
the Hungarian government and the consequent overvaluation of the HUF,
concerning the general recession in Europe and the collapse of Comecon.
One of the managers also stated that previously they had known which
121

governmental office and within it which person they should turn to if the
company had a problem. Now the changes in governmental offices and in
the persons who fill these offices had made the situation more difficult for
the company.
5.8 Analysis of cause maps
The above provides the context in which managerial beliefs were mapped
and in which similarities and differences in managerial beliefs and the rel-
ative importance of managerial characteristics in influencing these could
be evaluated. The influence of the context could be judged best during
the cross-organisational comparisons which was done in chapter 11. In this
chapter, and in the following four chapters on each investigated organisation
the context is provided, so possible explanations for the findings may be
drawn within each immo. Based on the interviews the following managerial
characteristics were implicitly or explicitly suggested by the managers to
influence managerial beliefs: (1) functional area, especially as the produc-
tion and R&D areas concerned; (2) national background; (3) and positon as
differences between the top and middle managers are concerned. Whether
these are the most important factors which influence managerial beliefs
could be seen from the following analysis. For this analysis 20 managers
causal maps were elicited concerning the issues and the influence relation-
ship between these issue which might influence the success of company A.
As the first step of the analysis the distance ratios between pairs of CMs
were calculated as described in section 3.4.4. For 20 maps this yielded 190
distance ratios. For measuring the relative importance of managerial char-
acteristics in influencing similarities and differences in managerial beliefs
first the Student t-test was applied as well as the Wilcoxon-Mann-Whitney
test. The results are shown in Table 5.1 ranked according to the Z-value.
In addition to the above calculation a cross-correlation table was also
calculated (Table 5.2) which includes the correlation between managerial
characteristics and also between managerial characteristics and distances
122
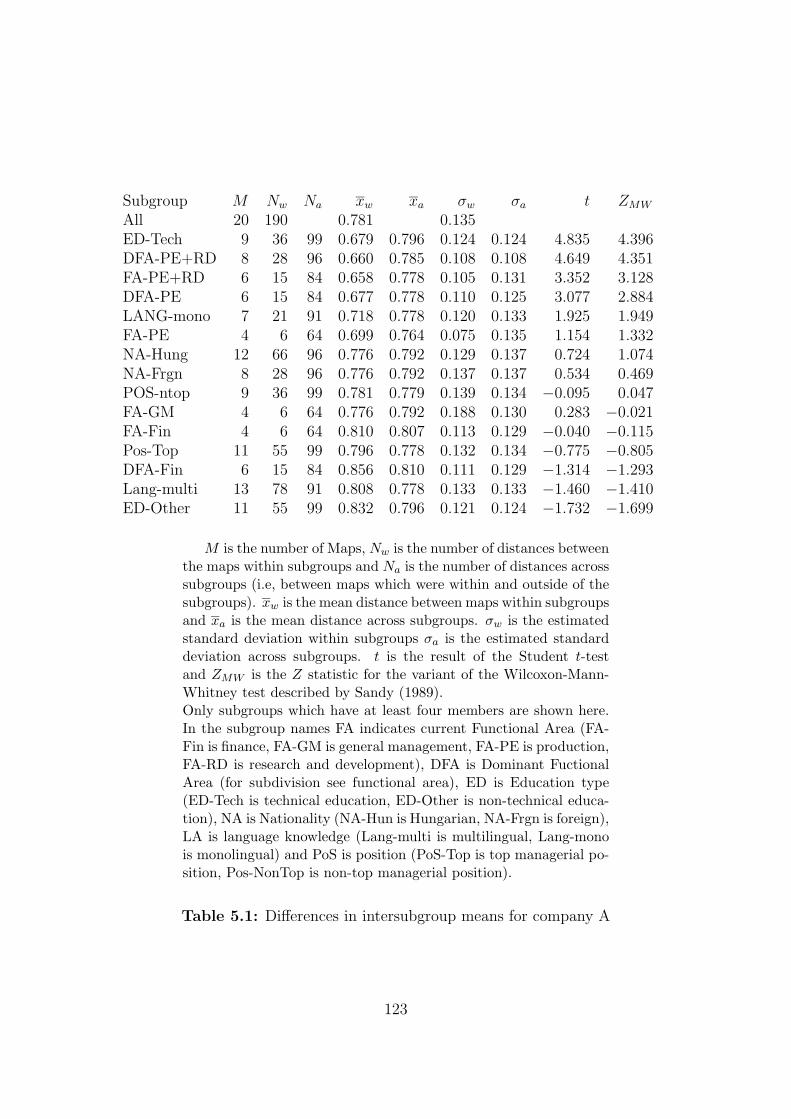
Subgroup M Nw Na xw xa σw σa t ZMW
All 20 190 0.781 0.135ED-Tech 9 36 99 0.679 0.796 0.124 0.124 4.835 4.396DFA-PE+RD 8 28 96 0.660 0.785 0.108 0.108 4.649 4.351FA-PE+RD 6 15 84 0.658 0.778 0.105 0.131 3.352 3.128DFA-PE 6 15 84 0.677 0.778 0.110 0.125 3.077 2.884LANG-mono 7 21 91 0.718 0.778 0.120 0.133 1.925 1.949FA-PE 4 6 64 0.699 0.764 0.075 0.135 1.154 1.332NA-Hung 12 66 96 0.776 0.792 0.129 0.137 0.724 1.074NA-Frgn 8 28 96 0.776 0.792 0.137 0.137 0.534 0.469POS-ntop 9 36 99 0.781 0.779 0.139 0.134 −0.095 0.047FA-GM 4 6 64 0.776 0.792 0.188 0.130 0.283 −0.021FA-Fin 4 6 64 0.810 0.807 0.113 0.129 −0.040 −0.115Pos-Top 11 55 99 0.796 0.778 0.132 0.134 −0.775 −0.805DFA-Fin 6 15 84 0.856 0.810 0.111 0.129 −1.314 −1.293Lang-multi 13 78 91 0.808 0.778 0.133 0.133 −1.460 −1.410ED-Other 11 55 99 0.832 0.796 0.121 0.124 −1.732 −1.699
M is the number of Maps, Nw is the number of distances betweenthe maps within subgroups and Na is the number of distances acrosssubgroups (i.e, between maps which were within and outside of thesubgroups). xw is the mean distance between maps within subgroupsand xa is the mean distance across subgroups. σw is the estimatedstandard deviation within subgroups σa is the estimated standarddeviation across subgroups. t is the result of the Student t-testand ZMW is the Z statistic for the variant of the Wilcoxon-Mann-Whitney test described by Sandy (1989).Only subgroups which have at least four members are shown here.In the subgroup names FA indicates current Functional Area (FA-Fin is finance, FA-GM is general management, FA-PE is production,FA-RD is research and development), DFA is Dominant FuctionalArea (for subdivision see functional area), ED is Education type(ED-Tech is technical education, ED-Other is non-technical educa-tion), NA is Nationality (NA-Hun is Hungarian, NA-Frgn is foreign),LA is language knowledge (Lang-multi is multilingual, Lang-monois monolingual) and PoS is position (PoS-Top is top managerial po-sition, Pos-NonTop is non-top managerial position).
Table 5.1: Differences in intersubgroup means for company A
123

Figure 5.1 In and out degrees for map cluster-A in company A
Nodes Arcs In Sum In Arcs Out Sum Out
6 Long term profitability 6 (17.75) 6 (12.67)14 Quality of technology 6 (12.83) 6 (14.00)30 Leadership 6 (10.33) 6 (15.67)36 Quality of products 6 (13.67) 6 (12.33)41 Cost control 6 (14.34) 6 (11.50)45 Employees contribution 6 (11.25) 6 (15.17)47 Efficiency 6 (17.25) 6 (16.08)
of the CMs of managers with the given characteristics from the central
maps.1 Applying Ward’s method (Everitt, 1990) six clusters of CMs (A–F)
were formed (which contained 5, 2, 4, 2, 5 and 2 CMs respectively) which
served as the basis for calculating the central maps as it was described in
section 3.5.
For clusters A and E the nodes of the central maps and the indegrees
and outdegrees are also listed in figures 5.1 and 5.2 given that these are
relatively large clusters (more than five managers) and the distances of
CMs of managers showed correlation with those managerial characteristics
which were found relevant by the student t-test as well.
In figure 5.1 production and R&D related issues seemed to dominate
(14, 36, 41, 47) while the constructs were also divided between financial
(41), profit (6), management (30), HRM (45) and market issues (36). The
production issues together seemed to account for the largest influence on the
selected success factors with 53.91 joint outdegrees while they themselves
also seemed to be highly influenced with 52.09 joint indegrees.
In figure 5.2 also the production constructs were the salient ones (23,
36, 41, 47), but managers in this cluster considered these factors more influ-
enced by the selected success factors than influencing (the joint indegree for
the production constructs was 52.32 while the joint outdegree was 39.07).
1In Table 5.2 the listed managerial characteristics are the same as in Table 5.1 exceptthat the cross-correlation table also contains how long managers had been workingat the company (At-Comp), and the length of working experience (W-exp), both ofwhich significantly correlate with age (Age). The cross-correlation table also containsfunctional diversity (FuncDiv).
124

FA
GM
−.2
5FA
PE
−.2
5−.2
5FA
PR
D−.3
3−.3
3.7
6∗∗∗
DFA
Fin
.49∗
.22−.3
3−.4
3†
DFA
PE−.3
3−.0
5.7
6∗∗∗
.76∗∗∗−.4
3†
DFA
PR
D−.4
1†−.1
5.6
1∗∗∗
.80∗∗∗−.5
3∗
.80∗∗∗
ED
Tech−.4
5∗
.05
.30
.50∗
−.5
9∗∗
.50∗
.70∗∗∗
NA
Hung−.3
6−.1
0.1
5.3
1−.1
3.3
1.2
5.1
2
Age
−.4
9∗
.38†
.17
.21
.04
.41†
.19
.11
.11
Wexp
−.4
1†
.37
.21
.20
−.0
6.3
8†
.14
.10
−.0
3.9
3∗∗∗
At
Com
p−.4
8∗−.0
2.2
0.3
0−.3
3.4
3†
.24
.02
.70∗∗∗
.46∗
.39†
Lang-M
u−.1
6.1
0−.1
6.0
2.0
2.0
2−.0
4−.1
8.6
8∗∗∗
.06
−.0
4.4
6∗
Top
−.3
0.2
0−.3
0−.2
9.1
5−.2
9−.2
9.0
1−.3
3.4
6∗
.46∗−.0
4−.2
4
FD
iv.2
4−.2
0.0
1.0
4.3
9†
−.1
0−.0
2−.2
4−.0
7.0
4−.0
3−.2
5−.3
1−.2
0
Dis
tA
.48∗−.1
7−.3
9†
−.5
3∗
.41†
−.6
1∗∗∗−.6
9∗∗∗−.5
7∗∗∗−.2
8−.4
9∗−.4
8∗−.4
2†
.15
.02−.0
4
Dis
tB
.13
.18−.0
2−.2
4.2
4.0
1−.0
6.0
2−.2
6.1
9.2
2.1
0−.4
0†
.32−.1
7−.3
8†
Dis
tC
−.2
8.3
0.0
1.0
9.2
6.2
2.0
6.0
7.1
0.1
8.0
4−.1
4.1
6.1
3.3
7−.0
0−.2
8D
ist
D.0
7−.2
0−.2
7−.4
9∗
.26
−.3
7−.4
1∗
−.4
1∗−.0
4.1
4.0
4−.0
1.0
3.2
3.2
4.3
7.0
2−.0
5D
ist
E.0
0.2
4.0
9−.0
4.1
7.1
5−.1
8−.3
6.1
2.0
8.0
6.1
4.4
5∗−.0
4−.1
2.1
3−.4
9∗
.34−.1
2
Dis
tF
−.3
8†−.1
2.2
3.3
7−.4
4†
.37
.28
.01
.38†
.15
.21
.44†
.34−.1
7−.0
4−.4
5∗−.3
1−.2
0−.3
9†
.19
Mean
.20
.20
.20
.30
.30
.30
.40
.45
.60
43.4
022.0
011.6
5.6
5.5
5.8
3.6
8.9
3.7
4.8
0.6
6.9
2σ
.41
.41
.41
.47
.47
.47
.50
.51
.50
9.0
59.2
310.7
5.4
9.5
1.1
7.2
1.1
3.1
9.2
0.2
1.1
3V
ars
FA
Fin
FA
GM
FA
PE
FA
PR
DD
FA
Fin
DFA
PE
DFA
PR
DE
DT
ech
NA
Hun
Age
Wexp
At
Co
Lang-M
uT
op
FD
ivD
ist
AD
ist
BD
ist
CD
ist
DD
ist
ED
ist
F
N=
20†p<
0.1
;∗p<.0
5;∗∗p<.0
1;∗∗∗p<.0
05
Onl
ysu
bgro
ups
whi
chha
veat
leas
tfo
urm
embe
rsar
esh
own
here
.In
the
subg
roup
nam
esFA
indi
cate
scu
rren
tFu
ncti
onal
Are
a(FA-GM
isge
nera
lman
agem
ent,FA-PE
ispr
oduc
tion
,FAPRD
ispr
oduc
tion
and
rese
arch
and
deve
lopm
ent,FA-Fin
isfin
ance
),DFA
isD
omin
ant
Fuct
iona
lA
rea
(for
subd
ivis
ion
see
func
tion
alar
ea),ED
isE
duca
tion
type
(ED-Tech
iste
chni
cal
educ
atio
n,ED-Other
isno
n-te
chni
cale
duca
tion
),NA
isN
atio
nalit
y(NA-Hung
isH
unga
rian
,NA-Frgn
isfo
reig
n),T
op
isbe
ing
inth
eto
pm
anag
eria
lpos
itio
nw
hileNon-Top
isth
eop
posi
te,A
ge
isag
e,W-exp
isw
orki
ngex
peri
ence
,AtComp
isth
eti
me
spen
tat
the
com
pany
,Lang-Mu
isbe
ing
mul
ti-l
ingu
al,FuncDiv
isfu
ncti
onal
dive
rsit
y,an
dDistA–DistF
are
the
dist
ance
sfr
omth
ece
ntra
lm
aps
incl
uste
rA
,B
,C
,D
,E
and
F.
Inth
eta
ble
thos
em
anag
eria
lch
arac
teri
stic
sw
hich
are
com
plem
enta
ryto
each
othe
r(H
unga
rian
vs.
fore
ign,
tech
nica
led
ucat
ion
vs.
non-
tech
nica
led
ucat
ion,
top
vs.
non-
top)
are
only
liste
dun
der
one
ofth
eir
poss
ibili
ties
.
Tab
le5.
2:C
orre
lati
ons
wit
hdis
tance
sfr
omce
ntr
alm
aps
inco
mpan
yA
125

Figure 5.2 In and out degrees for map cluster-E in company A
Nodes Arcs In Sum In Arcs Out Sum Out
1 Hiring/firing policy 6 (9.66) 6 (9.66)8 Inflation 1 (1.00) 8 (12.51)
23 Internal R&D 8 (15.34) 6 (12.34)27 Customer relations 7 (10.92) 5 (7.17)30 Leadership 6 (10.23) 7 (15.55)36 Quality of products 8 (10.67) 6 (8.65)40 Currency valuation 6 (9.00) 7 (7.33)41 Cost control 7 (10.67) 7 (9.16)47 Efficiency 8 (15.64) 7 (10.75)
Both central maps discussed here and the most often selected nodes
which were selected by more than half of the managers in the sample as
shown (in Figure 5.3) suggest a strong production orientation in this com-
pany.
Fisher’s Exact Test (Siegel, 1956) was also used to check whether sig-
nificantly more Hungarian or foreign managers selected the yearly profit
construct as oppose to the long term profitability one. Of the 20 managers,
eleven selected one of the two profitability cards, six of them were Amer-
ican, and five were Hungarian. Of these 11 managers, five selected yearly
profitability, and six selected long term profitability. Counter to the cul-
tural stereotypes, all of the Hungarians selected long term profit, while all
but one of the Americans selected yearly profit. The Fisher’s Exact Test
yields a one-tailed probability of .0130 for these data. This suggests that
within this company Hungarian managers are more likely then Americans
to consider long term profit very important.
Figure 5.3 Frequently selected nodes in company A
Construct Construct Frequency41 Cost control within the company 1547 Efficiency/productivity 1436 Quality of products and services 1430 Leadership within the organisation 11
126

5.8.1 The results
The first interesting result which could be seen from the Student t-test and
Wilcoxon-Mann-Whitney test is that national differences play a smaller
role in influencing managerial beliefs in company A than would be pre-
dicted based on the literature on national–cultural differences and on the
basis of sources of internal differentiation which was suggested by the man-
agers themselves. Only in selecting either the long term profitability or the
yearly profit do national–differences show up in this company. Some other
managerial characteristics rather than nationality seemed to have a larger
influence on similarities and differences in managerial beliefs (among which
some were also predicted by the managers). Being educated in technical
field, having the longest experience in the production and R&D areas,
working on the production and R&D areas, having the longest experience
in the production areas were found important by the student t-test and
also the CMs of these managers tended to be close to the central map in
cluster-A. It is consistent with these managerial characteristics that they
showed agreement in selecting mainly production related issues to the suc-
cess factors and also attributed at least as much influence to these issues
on the selected success factors than they thought that these factors were
influenced themselves. From this it could be speculated that production
and R&D managers perceived their areas as highly influental to the success
of company A.
Combining the production and R&D areas was decided before the sta-
tistical analysis was made. The interviewed managers themselves insisted
that these areas are strongly intertwined. This interconnectedness of the
two areas was reinforced by the managers when the findings were presented
to them in a two hour long workshop. As one of the managers said:
These two areas have been working with each other for long time.
They not only work but even mix with each other: who works today
in production will work in R&D tomorrow and who works in R&D
today will work in production tomorrow.
127

In addition to the above managerial characteristics being mono-lingual
was found to be influental on similarities of managerial beliefs both by the
student t-test and the cross-correlation table where CMs of mono-lingual
managers seemed to be close to the central map in cluster-E. Looking at the
central map in cluster-E we see that mono-lingual managers thought that
production factors were more influenced by the selected success factors than
influencing themselves. Also, compared to cluster A this group attributed
larger weight to environmental factors in influencing the immo’s success
(constructs 8, 27, 40).
Although working on the production area (without the R&D area)
and having Hungarian national background also yielded a Z-value larger
than 1 (with the former t is also larger than 1, while with the latter t is
smaller than 1) neither of these subgroups of managers have CMs which are
significantly closer to any of the typical maps than other managers CMs
are.
A Pearson correlation was calculated to measure the relationship be-
tween age and distance in beliefs. Although this correlation was relatively
small, age also showed some correlation with the distances from the central
map in cluster A. Working experience also yields similar correlation results,
but since age and working experience show a .93 correlation with each other
these two factors are basically substitutable with one other therefore only
age was included in the cross-correlation tables in chapters 5 through 9.
Interestingly, neither the top nor the middle managers seemed to have
more similar beliefs based on the statistical analysis although this was
suggested by the interviews.
The correlation table also shows correlation results between different
managerial characteristics considering the sample of the managers in com-
pany A.2
2Among the relevant correlations the following were mostly as expected but areworthy of note. Production and R&D people mainly have technical education (r = .50,p = .023), while financial managers mostly have non-technical education (r = −.59,p = .006). The financial managers are also substantially younger (r = −.56, p = .01),and spent less time in the company (r = −.45, p = .047) than other managers did.
128

In the cross-correlation table the substantial negative correlations be-
tween distances of central maps show that these maps are far from each
other as they should be if the clusters which were found are distinct from
each other.
5.9 Evaluation of findings
5.9.1 National differences
Although some of the managers thought that the main differences in beliefs
were along national lines, this difference was not supported by the data.
Differences in management style, attitude and behaviour may be seen as
expressions of differences in beliefs. American managers showed more self-
confidence, aggressive style, optimism and created a feeling of being more
busy than the Hungarian managers did. There were also differences in
the appearance of the managers in terms of hair-style or dressing style.3
The only substantial difference which was found between Hungarians and
Americans was whether they identified long term profitability or short term
profit as one of the major factors of business success. Although this dif-
ference between Hungarian and foreign managers could be attributed to
national differences other explanations are equally possible. It could be
Hungarian managers had tended to spend a longer time in company A than foreignmanagers (r = −.62, p = .003). Also, top managers seems to be older (r = .50,p = .026), and have longer work experience than non-top managers (r = .51, p = .020).Being mono-lingual correlates with being foreign manager (r = .68, p < .001).
3These surface level characteristics could even mislead researchers like author. Forexample, the author noticed that American managers, except one, did not offer hercoffee, while the Hungarian managers did. While wondering about the reason for this,and it was concluded that the American managers might be cost conscious, so they donot waste money on such an unimportant person, as the author and are more impolite.When this was told to an American, he asked when did the only American, who offeredthe coffee did this. It was in the morning. Other interviews usually took place in theafternoon. The explanation could be therefore, that since most Americans do not drinkcoffee in the afternoon they might forget to offer it to their guest as well. Hungarianshowever drink coffee throughout the day so they would not forget the coffee. Behaviouraldifferences like these could form strong impressions which could easily lead to far reachingconclusions if careful testing is not applied. But the above differences did not reflectdifferences in beliefs about business.
129
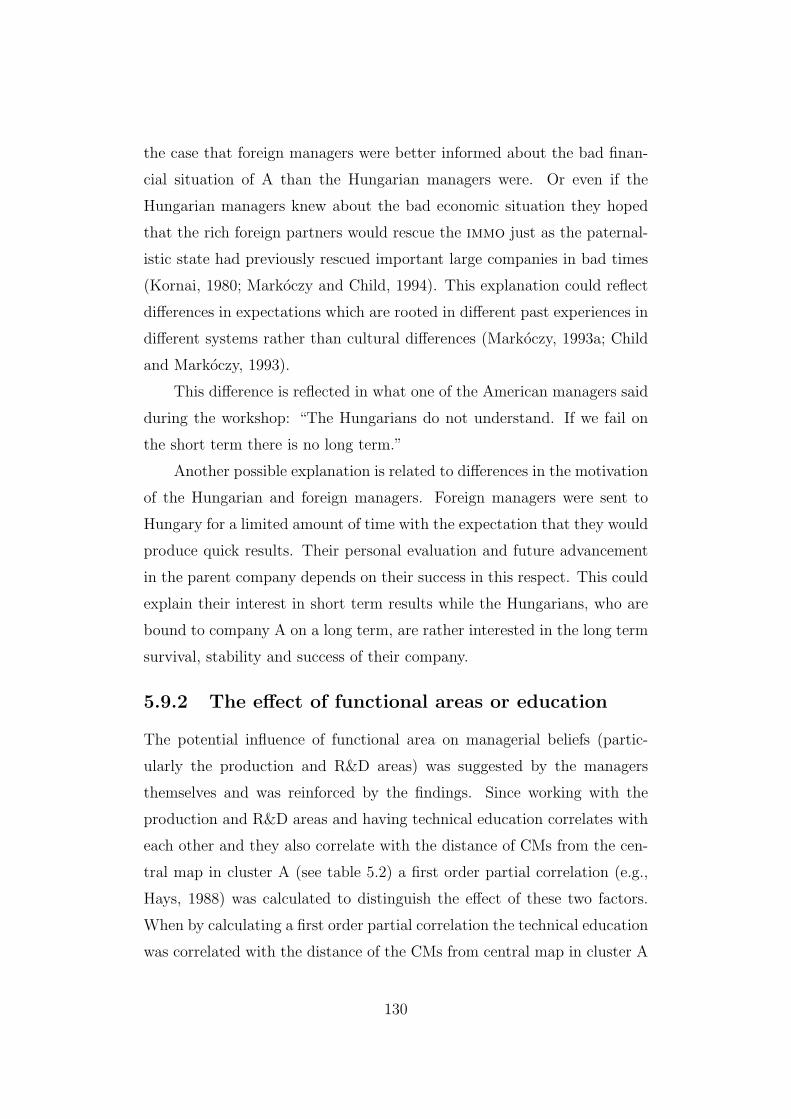
the case that foreign managers were better informed about the bad finan-
cial situation of A than the Hungarian managers were. Or even if the
Hungarian managers knew about the bad economic situation they hoped
that the rich foreign partners would rescue the immo just as the paternal-
istic state had previously rescued important large companies in bad times
(Kornai, 1980; Markoczy and Child, 1994). This explanation could reflect
differences in expectations which are rooted in different past experiences in
different systems rather than cultural differences (Markoczy, 1993a; Child
and Markoczy, 1993).
This difference is reflected in what one of the American managers said
during the workshop: “The Hungarians do not understand. If we fail on
the short term there is no long term.”
Another possible explanation is related to differences in the motivation
of the Hungarian and foreign managers. Foreign managers were sent to
Hungary for a limited amount of time with the expectation that they would
produce quick results. Their personal evaluation and future advancement
in the parent company depends on their success in this respect. This could
explain their interest in short term results while the Hungarians, who are
bound to company A on a long term, are rather interested in the long term
survival, stability and success of their company.
5.9.2 The effect of functional areas or education
The potential influence of functional area on managerial beliefs (partic-
ularly the production and R&D areas) was suggested by the managers
themselves and was reinforced by the findings. Since working with the
production and R&D areas and having technical education correlates with
each other and they also correlate with the distance of CMs from the cen-
tral map in cluster A (see table 5.2) a first order partial correlation (e.g.,
Hays, 1988) was calculated to distinguish the effect of these two factors.
When by calculating a first order partial correlation the technical education
was correlated with the distance of the CMs from central map in cluster A
130

and the working in production and R&D area was kept constant the orig-
inal correlation between the two former factors have decreased from −.62
to −.45. When education type was kept constant the correlation number
between the distance of the central map in cluster A and the CMs of those
managers who work in the production and R&D areas decreased from −.65
to −.50. This shows that both of the investigated managerial characteris-
tics were correlated with the distance from the central map in cluster A,
independent of the effect of the other.
One of the Hungarian R&D managers described the differences be-
tween production and development and other functional areas in the work-
shop which followed the analysis of the data, to provide explanation why
similarities were found in the former as opposed to the latter areas, as
follows:
I think that these are the two areas which are based on clear disci-
plines. These disciplines have been developed not only for decades
but for centuries. . . The whole topic is covered if we notice that these
are based on the sciences or in other words on the natural sciences.
These areas do not deal with the human side, like finance, marketing
or other areas do. . . they are more objective than those. For exam-
ple, there have been lots of changes in financial systems during the
last decades and lots of different systems formed as a consequence.
But a mathematical formula, or a physical law, could not be changed
this way, since it is more objective.
An alternative explanation could be that in the production and devel-
opment areas the American techniques could be fully implemented, there-
fore the American managers could act as “educators”. Johanson and
Vahlne (1993) for example argued that operation knowledge could be trans-
ferred from one country to another while market specific knowledge is not
transferrable, because it mainly comes from experience in the given mar-
ket. This explanation seems to be supported by the managerial perceptions
that the production issues were internal to the organisation and highly in-
131

fluencable by the managers so differences in the context in which they are
adopted were conceived as less problematic. The uncertainty which re-
lates to the “learning-by-doing” development of new procedures in other
areas which adequate to the new context could lead to frequent changes in
preferences and conflicts in beliefs about which issues are important.
It is also plausable to explain similarities in managerial beliefs in the
production and R&D areas by the production orientation. The production
orientation of the company reflected in the changes within the organisa-
tions, in the interviews and also in the construct selection by more than
half of the managers in the sample as it could be seen in figure 5.3. The
validity of this explantion was addressed in section 11.4.
5.9.3 The effect of language knowledge
The result that mono-linguals tend to be closer in their beliefs to each other
than to the rest of the managers could be explained by national differences,
namely that mono-lingualism and foreign nationality were correlated with
each other (r = .68 p < 0.01). To check this explanation first order partial
correlations were calculated between the central map of cluster E, the to
which mono-lingual managers are substantially close (p = .035 p < 0.5),
and being mono-lingual and being foreign. Since mono-linguals correlated
with their distances from the central map in cluster E (r = −.47 p < 0.5)
when being foreign was kept constant, while it was not the case when
language knowledge was kept constant the original prediction was not sup-
ported. This effect of mono-linguality on similarity of managerial beliefs
is surprising and likely to be the consequence of some underlying factor
which was not investigated.
5.9.4 The effect of age
Increasing differences in managerial beliefs as the difference in age increases
is a phenomenon which could be explained with generational effects. One
might expect that the effect of age would be more pronounced among the
132

Hungarians where changes have been most dramatic over the past decades.
However, a Pearson correlation showed that among the Hungarians the
correlation between the distance in age and the distance of CMs was less
(r = .13) than in case of the foreign managers (r = .45 p < 0.05). A
first order partial correlation between working in the production area, be-
ing older and being close to the central map in cluster A was therefore
calculated. This showed no correlation between age and working in the
production area after controlling for being close to central map in cluster
A, but both working in the production area and age showed a substatial
correlation with the distances from the central map in cluster A (r = .49
p < 0.05). This shows that the effect of age could not be explained by being
associated with the production functional area. Differentiation in manage-
rial beliefs by age considering foreing managers might relate to the fact
that the previous executive director hired experienced foreign managers
who showed substantial variations in their age.
5.9.5 The lack of effect of the position
Although the interviews suggested that middle managers were less loyal
to their companies, this did not seem to influence the business beliefs of
the managers in company A. This suggests that differences in the feeling
of loyality might not have an influence on how managers perceive success
factors, or it might also be the case that there is a large variation among
middle and also among the top level managers in terms of their loyalities
to the company but only the salient cases come up in the interviews.
133

Chapter 6
Company B: The glass menage
6.1 The company
Company B is a modern float glass company in a small town in Hungary
approximately 200 kilometres from the capital, Budapest. The company
was established as a joint venture (JV) in July 1988 by an American and a
Hungarian glass company GRD and GW respectively. The initial capital
of B was $120 million which was one of the largest foreign investments in
Hungary at that time (Nepszava, 1991). Initially GRD owned 80% of the
company and 20% were in the hands of GW. By the time of the fieldwork
(November 1992) the American partner had acquired the remaining 20%
from GW and became full owner of B.
The technology of B is very modern. B operates in a purpose-built
factory, the construction of which started in July 1989 and was completed
in September 1991. Glass production started in February 1991 before the
completion of the factory. The new factory was equiped with the most
modern technology in float glass production.
Since the technology is highly automated, production mainly requires
supervision which is assisted by computers. Because of this, the number of
employees in the company can be kept very low. B employs 276 employees
including those in the managerial and administrative grades (Csete, 1993).
Although 1991 was not a full year (since production started in Febru-
ary) B still reached 2 billion HUF income on sales in its first year of oper-
134

ation. In 1992 the income on sales increased to 4.2 billion HUF. The plan
was to reach 5 billion HUF income by the end of 1993. Despite the increas-
ing income on sales, B did not manage to become profitable in the first two
years. The Hungarian managing director explained this by the high inter-
est rates which they had to pay on loans that B took for investment. To
cover the loans in 1993, the management of the American partner decided
to increase the equity of B by an additional $25 million, and in 1993 the
expected operational profit was high enough that the company was slightly
profitable.
6.2 The purpose of the parent companies
Two reasons were identified for the decision to establish the JV by the
Hungarian parent: (1) to acquire capital, and (2) to have access to new
technology. For the American parent company the reasons were (1) to es-
tablish presence in Eastern Europe and acquire markets in the Soviet Union
and Eastern Europe (B is located in the south-eastern part of the country
near the borders of Romania, Croatia and Serbia); and (2) to benefit from
the cheap energy, input materials and the protectionist policy of the gov-
ernment which characterised Hungary at the time of the establishment of
the JV.
6.3 External conditions
The favourable external conditions which attracted the foreign partner to
Hungary did not last long after setting up the JV. As described in sec-
tion 4.3 with the collapse of the Soviet Union, the Comecon also disinte-
grated which meant that setting up a plant in Hungary did not provide
access to the Comecon market any more. The Yugoslav war also meant
the loss of another potential market, and closed the best transportation
routes to Italy and Greece as well. The cheap energy and input prices
also increased to the level of the world market prices. The previous pro-
135

tectionist policy of the communist government was gradually replaced by
different import liberalization laws, many of which were already introduced
by the communist government before the free elections in 1990 as discussed
in section 4.4. The import liberalization took place at a time of economic
recession when internal demand decreased substantially particularly in the
building industry which was badly affected by the recession. From 1990
the large investments of the state and state owned companies almost dis-
appeared which contributed to the fact that by 1992 the production of the
building industry was only 60% of that in 1980 (Szalai, 1992).
B was also severly affected by the changing policy of the new govern-
ment elected in April 1990. Since B was set up in the part of Hungary
where the infrastructure was more underdeveloped than in Budapest (in
terms of roads and telephone systems etc.) the previous government had
made a promise to improve this infrastructure just to attract the foreign
investor GRD. Among other things, it promised to build a new road which
was badly needed for glass shipping. However, after the election, the repre-
sentatives of the newly elected government openly stated that they did not
want to be held responsible for keeping promises which had been made by
the previous regime. The road therefore had to be built by the company in
the end, although the government agreed to provide discounted loans for
it.
6.4 The internal structure and procedures
of B
Since B was a newly established company it was not characterised by the
changes effecting the other investigated companies. We will therefore move
straight to a description of the company structure, procedures and salient
issues.
136

6.4.1 Organisational structure
Similar to the other plants of GRD, company B was set up with a flat and
highly decentralised organisational structure with only three managerial
levels. At the lowest level were those production managers and engineers
responsible for the operational management of production. The second
managerial level consisted of an accounting manager, an engineering man-
ager, a few sales and marketing managers, and the personel manager. The
top managerial team contained the managing director, the financial man-
ager, a production manager and two foreign managers from the European
headquarters of GRD, which was referred by the managers as “GRD Eu-
rope”. The positions of these two managers in GRD Europe were the
financial director of GRD Europe and the head of GRD Europe. These
two managers visited B every one or two months for a few days when they
reviewed the activity of B and made strategic decisions together with the
managing, financial and production managers. Which issues counted as
strategic were quite broad. At the time of the investigation, for example,
when these two managers were also present they took part in decisions on
the recurement of candidates for sales agent positions.
A few regional sales directors were also employeed by GRD Europe
and commuted to B. They were responsible for selling G’s products in
different regions of the world. They sold the products of B in the same
way that they sold the products of other plants in GRD. Like the other
managers from GRD Europe headquarters, they also spent some time in B
where they discussed issues with the management of B relevant to sales.
Among the foreign managers only four worked for B full time and
they were also employed by GRD Europe rather than B. These managers
were, at the time of interviewing (from November 1992 through February
1993), the financial manager a Hungarian repatriate American (he left the
company since then and went to company E), the accounting manager a
Norwegian, the assigned sales director and a sales coordinator both from
Luxemburg. The foreign managers were sent to Hungary to fill those posi-
137

tions for which it was difficult to find suitable local managers. The plan was
that the foreign managers would work in Hungary until the right Hungarian
managers were found and trained to replace them. The two top managers
of GRD Europe were already quite satisfied with the existing Hungarian
managers who worked at the first and second levels. Their satisfaction
showed up, for example, in the decreasing frequency of their visits.
These managers were particularly satisfied with the work of the Hun-
garian managing director. In fact, in informal discussions they stated that
they thought so highly of this manager that they were seriously consider-
ing creating an European level position for him just to be able to provide
him with a high enough status to keep him in B. They were afraid that
without this step he would leave them. He had already received offers from
other glass companies in Hungary. The managing director showed an en-
trepreneurial spirit which was quite needed for the task of setting up a new
company. But now that that job was done, the everyday running of the
company was not challenging enough for this talented manager anymore.
Despite their satisfaction with the senior Hungarian managers of B,
the two top managers from GRD Europe were often very critical of them.
The head of GRD Europe characterised meetings with the Hungarian top
managers the following way:
When one takes part in these meetings one might think that there
are a lot of problems with B and the company would go bankrupt
tomorrow. There is a lot of scolding and lots of problems are men-
tioned. But this does not mean that we would not be satisfied with
the top management in B.
Although the first and second level Hungarian managers worked closely
with the foreign managers, those Hungarian managers who were responsible
for the operational management of the production in the third level did not
have much contact with the foreigners, not even with those who worked
full time in B. These managers only worked together with foreigners when
the new company was built up and the new technology was implemented.
138

These managers seemed more occupied with the problems of production
and quality matters than with other more general issues of management.
6.4.2 Cost control
Company B managed to keep the production cost low by holding low input
and output inventory. It did so by creating a network of competing supply
and delivery companies which provided the input materials close to the time
when it was needed and delivered the final product to the customers upon
completion. Company B specialized in activities which strictly related to
the glass production and sales. Any other activities which could be done
through external contractors were done that way, so the cost could be kept
low.
6.4.3 Production, technology
When setting up B, GRD equipped the company with the most modern
automatic technology for producing float glass. This technology is used in
nine of the GRD plants of which four are in Europe. G is currently the
world’s fifth largest float glass producing company. The highly automatic,
and standardised production line also means that the production process
is very similar to other float glass companies of GRD which use this tech-
nology. With the new technology production is 450 metric tonnes of glass
per day which both in quantity and quality is according to the standards
of those GRD plants which have similar technological characteristics.
In addition to modern production technology a new computer system
was also introduced. To the satisfaction of the foreign managers, Hungarian
managers learned to operate and use the new computer technology very
quickly. One of the foreign managers expressed his surprise at how quickly
the Hungarian managers learned. He said:
We just introduced a new computer system and they [the Hungar-
ian managers] are doing a fantastic job with it. Far beyond my
imagination. Very few complaints.
139

6.4.4 Bookkeeping
As with the technological standards, the main bookkeeping system follows
the standards of GRD, although there is a parallel bookkeeping system
to satisfy the Hungarian regulations and the information needed by the
Hungarian tax agencies and other authorities. According to the foreign
accounting manager the introduction of GRD’s bookkeeping was necessary
because the Hungarian accounting system only served for statistical pur-
poses while the new accounting system had to satisfy the information needs
of the owner and the decision makers. Since the strategic decision makers
are often those managers who work in GRD Europe their information needs
could only be satisfied by using a standardized accounting system.
6.4.5 Employment policy
Since B was set up as a new company it could restrict the selection of its
employees to the requirements of the production and administrative plans.
B was in a good position to attract the most qualified glass workers from
the Hungarian parent which is placed next to the JV. After setting up
the JV, the Hungarian parent (GW) stopped producing plate-glass and
specialized in the production of jars and bottles so it would not have to
compete with B. The management of GW also accepted that some of its
skilled workers would be attracted by B.
B’s hiring procedure was highly selective. First, the first level Hungar-
ian managers were selected who then participated in the selection of other
managers and employees. Parallel to this planned selection procedure there
was also an informal self-selection procedure. Those who could not keep up
with the requirements left the company themselves before they had to be
fired. Despite the high requirements there were always plenty of candidates
for the production-related areas both at the worker and the managerial lev-
els. It was more problematic however to find qualified managers in areas
such as finance, sales or general management given the shortage of qualified
managers in these areas in Hungary.
140

The large pool of applicants in the production area made it easy for the
company to hire the best employees. Two Hungarian operation managers
thought that that the company’s advantage in this respect was even unfair.
One of them said:
The biggest problem was that this company was set up at a time
which is the most favourable for the foreign partner in terms of
getting good employees. In Hungary today the uncertainty is too
high, which increases the willingness to adjust quickly to the re-
quirements. This is true of everybody: of the managers and also
of the skilled workers. I hope that this situation will change in two
or three years, and then GRD will have to work very hard to gain
qualified people, the same way as it has to work anywhere else in
the world. Otherwise, this leads to the situation that they allow
much more to themselves than to the Hungarians. The standards
are different. When I say this I think about many different things.
Like what kind of behaviours they tolerate or who they allow to
have access to certain information.
6.4.6 Incentive system
To support team work in B, the management decided to give equal wages
to all shop floor employees. Also, although the tasks of the employees
are well defined, everybody is ultimately responsible for completion of the
whole work task. Employees are therefore interested to help each other out
after their tasks are completed. To improve the quality of the production a
complete quality management system was introduced. As part of this, em-
ployees were kept informed about the total production results and quality
and performance problems, and incentives were given to them to fix these.
6.4.7 Marketing, sales
The major issue which company B faces now relates to the marketing and
sales areas. The original purpose of the management of company GRD was
to sell the majority of B’s products in the Comecon markets, in Yugoslavia,
141

and in Hungary. The collapse of Comecon and the war in Yugoslavia made
it hard (if not impossible) to sell in these markets, and the company also
could not achieve its sales targets in the domestic market because of the
recession in Hungary and because of the import liberalization policy of the
Hungarian government. The original plan was to sell 50% of annual produc-
tion on the domestic market, but only 15–20% was sold there. Therefore
B had to redirect its sales to Western European markets. Currently 80%
of the company’s production is sold in Western Europe. This redirection
meant that B not only had to face a more competitive market, but also had
to deliver over a larger distance which substantially added to the delivery
cost. The lack of qualified sales persons in Hungary also showed up as a
problem for company B. Currently, most of the sales are done through
western managers who either work full time in company B or sell in var-
ious markets for GRD Europe including the products of company B. To
solve this problem the management of company B plans to hire trainees
for the sales positions. They badly need managers who will be able to sell
in Eastern Europe when the situation is normalized in these markets. To
find suitable personnel for these positions is one of the key issues which
occupied the management of B and also GRD Europe.
6.4.8 Interaction between managers in differentpositions
The administration in company B is placed in a two storey building which
is attached to the production area. The first and the second level managers
are placed on the ground floor. On the first floor are the personnel manager,
and those second and third level managers who deal with the production
and engineering tasks. It is only possible to walk between the two floors
using stairs which lead through the production area. Within each floor
the possibilities for informal communication are quite good. There are no
closed offices in the strict sense on either floor: desks are placed in large,
open office spaces, so people see each other and talk to each other. There are
142

a few semi-closed offices with large windows so everybody can see the person
who is working there. These offices can be used by everybody who needs
them for their work or for meetings. The conditions for communication
between floors, however, are less favourable. The two floors separate mostly
the third level operation managers (except the human resource manager
who is on the first floor as well) from the rest of the managers on the
ground floor.
6.5 Salient issues identified by the
managers
In the company twenty managers were interviewed as well as their CMs
elicited. Among the 20 managers 3 were American, 2 Luxemburger, 1
Norwegian, 1 Belgian, 1 French and 12 Hungarian. Four foreign managers
work full time in B (1 American, 1 Norwegian, 2 Luxemburger) while the
other four foreign managers spend most of their time in GRD Europe and
a fraction of their time in B (2 American, 1 Belgian and 1 French).
The salient issues which were identified by these managers during the
interviews and informal discussions fell into two categories: (1) issues which
derive from the differences in the national background and experiences of
the managers; and (2) issues which relate to the different situation of the
foreign and Hungarian employees.
Ten out of 20 managers raised problems which related to national,
cultural or system differences. Criticism were made both of the foreign
and Hungarian managers. The foreign managers were criticised for hav-
ing a prejudice against Hungarian managers and for not understanding
the Hungarian context. The Hungarian managers were criticized for not
thinking globally, for not having real loyality towards their company, for
lacking a sense of urgency, for working very much with an eye on the clock,
for not taking responsibility, for following the rules blindly, and for not
understanding that it is the interests of the owner which must be satisfied.
In more detail, 4 out of the 12 Hungarian managers complained that
143

the foreign managers had arrived with prejudices about Hungary which
they still retain despite the obvious results achieved by the Hungarian man-
agement. One of the Hungarian managers said:
It is almost impossible to stop western investors thinking that this is
Eastern Europe therefore it must be a run-down area. They might
even think that people here have horns.
Another Hungarian manager talked in a more differentiated way:
The foreigners came here with strong reservations. They thought
about us very much as easterners. This changed after half a year
or a year, but not with everybody. It still is the view that this is
Eastern Europe. The extent to which they think this way differs
from person to person.
Interestingly, however two of the foreign managers felt that the Hun-
garians are the ones who feel that the foreigners perceive Hungarians as
inferiors because they do not meet the production standards of the other
plants of GRD in Europe. As an example, the head of GRD Europe told
the author that they understand that producing good results in Hungary
under the existing conditions is more difficult than in any of the other
plants they have in Europe. But the Hungarians themselves are the ones
who put overly high targets in front of themselves and then they tend
to think that the foreigners are judgemental towards them if they cannot
meet these targets. This foreign manager admitted however that the for-
eign managers might also be responsible for this false attribution of the
Hungarian managers. He thought that Hungarian managers might draw
incorrect conclusions about how they are judged by the foreigners from
the critical approach which the managers of GRD Europe apply in every
plant of GRD in Europe including Hungary. He thought that given that
the Hungarian managers are so much more afraid of making mistakes and
being criticised than Western managers that they tend to overvalue the
weight of criticism.
144

Two Hungarian managers stated that the foreign partners did not
understand the pecularities of the Hungarian context. One of the man-
agers complained that they do not understand clearly the state regulations
concerning the usage of gas-safety systems and other safety issues. The
Hungarian managing director asserted that the foreign managers do not
understand that the Hungarian employees live from day to day on their
incomes. They do not understand that the company has to give support
for the employees in addition to their salaries, such as giving favourable
loans for buying or building their own flats or houses.
Two Hungarian managers’ opinions went against what the managing
director said in the sense that they felt that the foreigners knew that the
Hungarians were in an uncertain situation concerning the increasing unem-
ployment rate and the declining living conditions and because they knew
how bad the situation was they were able to abuse this inequality between
Hungarians and the foreigners.
The most often mentioned complaint against the Hungarian managers
by the foreigners was that they do not fully identify themselves with their
company. Four out of the 8 foreign managers said that it is difficult to
motivate the Hungarians. They fulfill their tasks, but beyond that they are
not happy if the company does well and they do not seem overly concerned
if it does not. As one of the foreigners said:
We tried to get it into their blood to love their job. It is to make
people [. . . ] interested in the result of their work. To be excited
if they reached a good result. Or to cry, to complain or just be
emotional about a bad result.
One foreign manager said that one clear manifestation of the lack of iden-
tification with one’s work from the side of the Hungarians was that they
work very much with an eye on the clock. He compared the values of the
Hungarians with the values in GRD in the following way:
It is four o’clock, so I [an imaginary Hungarian manager] should start
to take my coat and go home. GRD is not this kind of company.
145

You should stay until the work is done. This may be too drastic to
say, but you live for the company.
He attributed this difference between Hungarians and foreigners to their
different past experience. As he said:
If you want to be succesful in this company you have to be part of the
company. I do not think that was the case before. Before you had
to come to the job to sleep so you were relaxed enough to do your
second job. People just needed to have another job, because they
were earning so little money. So especially those who are looking
at it from outside cannot understand that a person is spending 10
hours in his fist workplace and will not have time or be just too tired
to take up a second job. I think that it takes a lot of work to make
them understand this.
Two foreign managers complained that the Hungarian managers do not
think globally, or rather in the interest of the whole GRD, but rather
locally in terms of B. Three foreign managers mentioned that Hungarian
managers tend to follow the rules blindly and do not think of alternatives.
Two complained that Hungarians did not want to take responsibility, and
were afraid to speak up if they had problems.
It has to be noted however that the foreign managers usually distin-
guished between the top and the majority of second level managers (except
one of the second level Hungarian managers who they were not satisfied
with because of his personal qualities) and the other employees in their
criticism. They thought that many of the first and second level Hungar-
ian managers were western-standard managers. It is interesting to note
that when considering criticism towards the foreign managers these mostly
came from the those Hungarians on the third level who did not have direct
contact with the foreigners. In fact one had the feeling that the less contact
foreigners and Hungarians had with each other the more stereotypical the
complaints they raised against each other. Possible explantions for this
phenomenon will be discussed later in section 6.7.2.
146

6.6 Analysis of cause maps
The above is the context within which similarities and differences in man-
agerial beliefs and factors which influence these similarities and differences
should be understood. Also, those factors which most of the managers
found relevant for the success of their business may be interpreted by know-
ing this context.
The interviews suggested that (1) functional area, especially market-
ing and sales areas (2) the national background and the (3) managerial
levels might influence managerial beliefs in company B. For finding out
the relative importance of managerial characteristics in influencing man-
agerial beliefs 20 managers CMs were elicited in this company. Given the
flat organisational structure almost all the managers down to the shift su-
perintendent level were included in the sample. First step of analysis of the
CMs first the distance ratios between the CMs were calculated and then
the Student t-test and the Wilcoxon-Mann-Whitney test were computed.
Calculating with 20 CMs 190 distance ratios were considered. The results
of these calculations can be seen in Table 6.1.
In addition to the above computations a cross-correlation table was
also calculated among managerial characteristics and between managerial
characteristics and central maps (Table 6.2).1 Applying Ward’s method
four clusters of CMs (A–D) were identified (with 3, 7, 6, 4 members re-
spectively) which served as a basis for calculating the central maps.
For cluster-B where the CMs of seven managers formed the cluster
and the distances of CMs of managers showed correlation with functional
diversity the nodes of the central map and the indegrees and outdegrees are
also listed in Figure 6.1. For cluster-A the nodes of the central map, the
indegrees and outdegrees are also listed in Figure 6.2 as distances from this
central map correlated with Hungarian nationality (although this finding
1The managerial characteristics in Table 6.2 are the same as in Table 6.1 exceptthat the cross-correlation table also contains how long managers have been working atthe company (At-Comp), their age (Age), and the diversity of managerial experience indifferent functional areas (FuncDiv).
147

Subgroup M Nw Na xw xa σw σa t ZMW
All 20 190 0.782 0.149FA-MA 7 21 91 0.735 0.766 0.136 0.144 0.902 0.921POS-Top 5 10 75 0.735 0.772 0.136 0.134 0.846 0.607ED-Tech 13 78 91 0.777 0.781 0.164 0.146 0.192 0.021NA-Frgn 8 28 96 0.787 0.779 0.114 0.147 −0.241 −0.057NA-Hung 12 66 96 0.784 0.779 0.166 0.147 −0.184 −0.331ED-Other 7 21 91 0.805 0.781 0.097 0.146 −0.718 −0.369FA-PE 8 28 96 0.778 0.774 0.203 0.151 −0.103 −0.619DFA-PE 7 21 91 0.837 0.799 0.143 0.147 −1.065 −0.910DFA-PE+RD 9 36 99 0.791 0.773 0.183 0.150 −0.569 −0.921POS-Ntop 15 105 75 0.794 0.772 0.160 0.134 −0.985 −1.450
M is the number of Maps, Nw is the number of distances betweenthe maps within subgroups and Na is the number of distances acrosssubgroups (i.e, between maps which were within and outside of thesubgroups). xw is the mean distance between maps within subgroupsand xa is the mean distance across subgroups. σw is the estimatedstandard deviation within subgroups σa is the estimated standarddeviation across subgroups. t is the result of the Student t-testand ZMW is the Z statistic for the variant of the Wilcoxon-Mann-Whitney test.Only subgroups which have at least four members are shown here. Inthe subgroup names FA indicates current Functional Area (FA-MAis marketing and sales, FA-PE is production, FA+RD is research anddevelopment), DFA is Dominant Fuctional Area (for subdivision seefunctional area), ED is Education type (ED-Tech is technical ed-ucation, ED-Other is non-technical education), NA is Nationality(NA-Hung is Hungarian, NA-Frgn is foreign), and POS is position(PoS-Top is top managerial position, Pos-NonTop is non-top man-agerial position).
Table 6.1: Differences in intersubgroup means for company B
148

FA-PE−.6
0∗∗∗
DFA-PE−.5
4∗.6
8∗∗∗
DFA-PRD−.6
6∗∗∗
.90∗∗∗
.81∗∗∗
ED-Tech−.1
2.6
0∗∗
.54∗
.66∗∗
NA-Hung−.4
7∗.6
7∗∗
.60∗∗
.74∗∗∗
.47∗
Age
−.2
4.2
7.2
3.3
5.3
7.5
4∗
AtComp−.1
4.0
2.0
9.0
7−.0
9−.0
2.0
2FuncDiv
.05
.18
.05
.24
.51∗
.10
−.0
8−.0
2TopMan−.1
8−.2
4.0
6−.0
6−.3
0−.2
4.1
7.3
8†−.2
5
DistA
.09
.03−.2
2−.2
2−.1
5−.4
4†−.3
1.1
9−.1
0−.2
1DistB−.0
9−.0
7.3
2−.0
3−.0
5−.0
7.0
1−.1
4−.5
4∗−.0
4.1
4DistC−.1
7.2
0.4
4.2
7.2
4.2
5.0
3−.2
2.0
0−.1
7−.4
5∗.5
5∗∗
DistD−.2
6.1
1−.0
1.0
9.0
3.0
9−.0
8.1
8.1
8−.2
2−.0
3.0
6.0
9
Mean
.35
.40
.35
.45
.65
.60
40.4
02.
60.2
0.2
5.6
6.5
0.5
7.6
5σ
.49
.50
.49
.51
.49
.50
5.68
.94
.15
.44
.15
.15
.15
.16
Vars.
FA-MA
FA-PE
DFA-PEDFA-PERED-TechNA-HungAge
AtCompFuncDivTopMan
DistADistBDistCDistD
N=
20† p<
0.1;∗ p<.0
5;∗∗p<.0
1;∗∗∗ p<.0
05
Onl
ysu
bgro
ups
whi
chha
veat
leas
tfo
urm
embe
rsar
esh
own
here
.In
the
subg
roup
nam
esFA
indi
cate
scu
rren
tFu
ncti
onal
Are
a(FA-MA
ism
arke
ting
and
sale
s,FA-PE
ispr
oduc
tion
,FA-PRD
ispr
oduc
tion
and
rese
arch
and
deve
lopm
ent)
,DFA
isD
omin
ant
Fuct
iona
lA
rea
(for
subd
ivis
ion
see
func
tion
alar
ea),
ED
isE
duca
tion
type
(ED-Tech
iste
chni
cal
educ
atio
n,ED-Other
isno
n-te
chni
cale
duca
tion
),NA
isN
atio
nalit
y(NA-Hung
isH
unga
rian
,NA-Frgn
isfo
reig
n),T
opMan
isbe
ing
inth
eto
pm
anag
eria
lpos
itio
nw
hile
Non-Top
isth
eop
posi
te,A
geis
age,
AtComp
isth
eti
me
spen
tat
the
com
pany
,FuncDiv
isfu
ncti
onal
dive
rsit
y,an
dDistA–
DistD
are
the
dist
ance
sfr
omth
ece
ntra
lm
aps
incl
uste
rA
,B
,C
,an
dD
.In
the
tabl
eth
ose
man
ager
ial
char
acte
rist
ics
whi
char
eco
mpl
emen
tary
toea
chot
her
(Hun
gari
anvs
.fo
reig
n,te
chni
cal
educ
atio
nvs
.no
n-te
chni
cal
educ
atio
n,to
pvs
.no
n-to
p)ar
eon
lylis
ted
unde
ron
eof
thei
rpo
ssib
iliti
es.
Tab
le6.
2:C
orre
lati
ons
wit
hdis
tance
sfr
omce
ntr
alm
aps
inco
mpan
yB
149
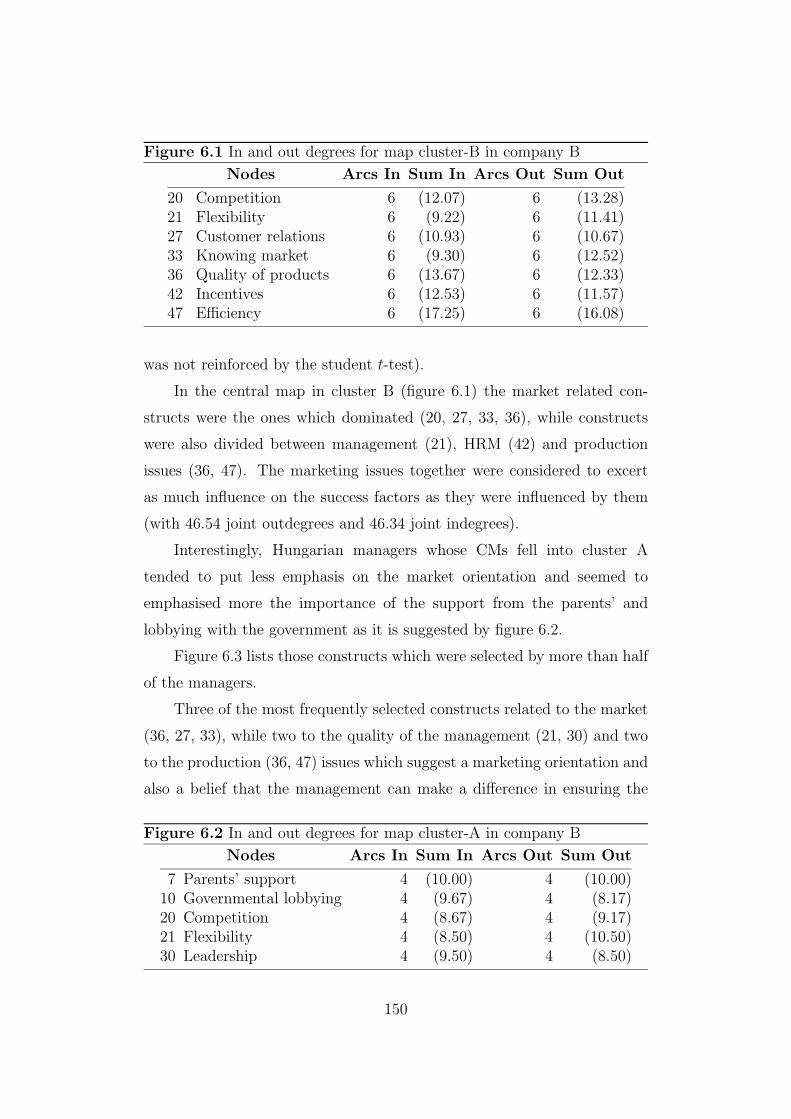
Figure 6.1 In and out degrees for map cluster-B in company B
Nodes Arcs In Sum In Arcs Out Sum Out
20 Competition 6 (12.07) 6 (13.28)21 Flexibility 6 (9.22) 6 (11.41)27 Customer relations 6 (10.93) 6 (10.67)33 Knowing market 6 (9.30) 6 (12.52)36 Quality of products 6 (13.67) 6 (12.33)42 Incentives 6 (12.53) 6 (11.57)47 Efficiency 6 (17.25) 6 (16.08)
was not reinforced by the student t-test).
In the central map in cluster B (figure 6.1) the market related con-
structs were the ones which dominated (20, 27, 33, 36), while constructs
were also divided between management (21), HRM (42) and production
issues (36, 47). The marketing issues together were considered to excert
as much influence on the success factors as they were influenced by them
(with 46.54 joint outdegrees and 46.34 joint indegrees).
Interestingly, Hungarian managers whose CMs fell into cluster A
tended to put less emphasis on the market orientation and seemed to
emphasised more the importance of the support from the parents’ and
lobbying with the government as it is suggested by figure 6.2.
Figure 6.3 lists those constructs which were selected by more than half
of the managers.
Three of the most frequently selected constructs related to the market
(36, 27, 33), while two to the quality of the management (21, 30) and two
to the production (36, 47) issues which suggest a marketing orientation and
also a belief that the management can make a difference in ensuring the
Figure 6.2 In and out degrees for map cluster-A in company B
Nodes Arcs In Sum In Arcs Out Sum Out
7 Parents’ support 4 (10.00) 4 (10.00)10 Governmental lobbying 4 (9.67) 4 (8.17)20 Competition 4 (8.67) 4 (9.17)21 Flexibility 4 (8.50) 4 (10.50)30 Leadership 4 (9.50) 4 (8.50)
150

Figure 6.3 Frequently selected constructs in company B
(Construct) Most freq. sel. construct Frequency
(36) Quality of products and services 17(21) Management flexibility 12(27) Customer relations 12(33) Knowledge of needs of company’s market 12(47) Efficiency/productivity 12(30) Leadership within the organisation 10
success of the organisation.
It was also tested whether there were substantial differences between
the Hungarian and foreign managers in relation to short versus long term
profit orientation as with company A. Ten managers chose one of the profit
cards into the ten most important cards, but significant differences were
not found in this respect between Hungarians and foreigners (3 Hungarian
and 1 foreign managers chose the yearly profit card and 4 Hungarian and 2
foreigners chose the long term profit orientation card).
6.6.1 The results
It is apparent from the results of the Student t-test (also Wilcoxon-Mann-
Whitney test) and from the cross-correlations that company B did not
yield convincing results concerning the managerial characteristics which
influence similarities and differences in the managerial beliefs. Looking at
the Student t-test it suggests that working in the marketing and sales areas
had the highest relative influence on the similarities in managerial beliefs
but even the highest t and Z value were relatively low. Also, the CMs of
those who work in the marketing and sales functional area did not seem to
be substantially closer to any of the central maps than the CMs of other
managers.
The cross-correlation table suggest a correlation between functional
diversity and distances from the central map in cluster-B. It is an interest-
ing to note that the more diverse experience in different functional areas a
manager had the closer the CM of that manager seemed to be to the above
central map (r = −.54, p = .015).
151

National differences did not seem to have a strong influence on similar-
ities and differences in managerial beliefs, although in the cross-correlation
table the CMs of Hungarian managers seemed to be relatively (p = .052)
close to the central map in cluster A.
A Pearson correlation was calculated to measure the relationship be-
tween age differences and distance in beliefs. No correlation was found in
this respect (r = .09) nor was any significant correlation found between
age and distances from the central maps.
The correlation table also shows correlation results between different
managerial characteristics considering the sample of the managers in com-
pany B.2
The conclusions which could be drawn from the cross-correlation table
itself are highly unreliable given that in this company managerial charac-
teristics and distances from central maps did not produce an unequivocal
result. In those investigated organisations where clearer results were found,
central maps tended to be far from each other, but in this company central
maps in clusters B and C correlated with each other so they could not
be treated as independent clusters. Merging these two clusters produced
further correlations between the new cluster and the existing ones which
suggest the lack of clear differences between clusters. All this indicates
that, based on the distances between managers’ causal maps, no robust
clusters were identifiable within the company. This is consistent with the
2Among the relevant correlations the following ones were worth of note. The market-ing managers in the sample were mostly foreigners (r = .47, p = .036) while managerson the production area were mostly Hungarian managers (r = .67, p = .001). Pro-duction managers not surprisingly also tended to have technical education (r = .60,p = .005). Given that among the Hungarian managers the production managers werehighly represented, it is not surprising that substantially more Hungarians than foreignmanagers tended to have technical education (r = .47, p = .036). This is reinforced bythe calculations of first order partial correlations. The Hungarian managers and workingon the production area show stronger correlation when technical education is controlledfor than otherwise (r = .54 p = 0.0195) while there is no significant correlation betweenHungarians and technical education when working in the production area is controlledfor (r = .12). Also, the Hungarian managers in the sample tended to be older than theforeign managers which may merely be a consequence of a higher willingness to relocateamong younger managers (r = .54, p = .014).
152

findings based on the differences between means in section 6.6.1
6.7 Evaluation of findings
The lack of unequivocal results in B showing links between managerial char-
acteristics and beliefs can be explained several ways. The organisational
structure is very flat and in each layer there are only a few managers. To
be able to have a sample as large as 20 managers shift superintendents also
needed to be included, who were more concerned about the everyday run-
ning of the production and have lesser understanding and interest in the
strategically relevant issues. Even if they understood that the organisation
needs to concentrate not only on the production but also to market related
issues their understanding of the connection between these factors might
not be as clear as those at higher levels (although there was variation in
this respect given that the predicted differences among managers in differ-
ent levels were not found). Another distorting factor which mostly affected
those managers on the higher levels is that four of the foreign managers in
the sample only worked part time in company B. Although these foreign
managers were specifically asked to consider company B in their answers
rather than GRD or GRD Europe, these managers still might have had a
different understanding of the success factors in B than other managers do.
6.7.1 The effect of functional areas or education
Even in the light of the unconvincing results it can be suggested, on the
basis of the Student t-test (and the Wilcoxon-Mann-Whitney test), that
in company B working on the marketing and sales area had the relatively
strongest influence on the similarities of managerial beliefs. This influ-
ence was also suggested by the managers themselves during the interviews.
This influence could be explained by the fact that marketing and sales issue
seems to be the major issues in the organisation. For example, it was a
major task of the management to build a sales force and to redirect sales
towards the Eastern European, Yugoslavian and domestic markets. The
153

perceived relevance of market-related issues also shows up in the construct
selection by the majority of managers. Concentrating attention on the
market-related issues was made easier by the relatively unproblematic na-
ture of production: There was an abundant supply of qualified production
people and the production results were mainly determined by the modern,
highly automized production technology.
6.7.2 National differences
Although national differences were raised as a salient issue by both the
Hungarian and foreign managers, these differences seemed to have a lesser
influence on similarities and differences in managerial beliefs than some
other managerial characteristics. This is not to say that differences could
not exist in other respects, like in terms of identity (e.g., loyalty to the
organisation) or in terms of attitude differences (e.g., working with an eye
on the clock), although the interviews imply that there were substantial
differences even in these respects between managers in different levels, in-
dependent of the their national backgrounds.
Although some correlation was found between the central map in
cluster-A and the CMs of Hungarian managers these findings were not
supported by the student t-test. Figure 6.2 suggests that Hungarian man-
agers tended to attribute high influence to the management on the success
of organisations and to factors which related to authorities external (par-
ent, government) and internal (leadership) to the immo. Those managers
whose CMs fell into cluster A were lower level managers who as the in-
terviews suggest took the view that higher level managers, and external
authorities might have an almost a deterministic effect on what direction
the organisation is going to go.
Hungarian managers on the lower levels also tended to raise national
differences, as salient issues, during the interviews especially those who did
not have direct contact with the foreigners, while the foreign managers
when asked about national differences mostly referred to the lower level
154

managers (who they worked less with) and treated the first and second
level managers as Western-type managers. These differences in attribu-
tions can be explained in several ways. One possible explanation is based
on the argument that people tend to fill information gaps with information
which exists in their knowledge structures and they also use this infor-
mation in their attributions (e.g., Fiske and Taylor, 1991). In this case,
managers applied stereotypical information to describe managers with dif-
ferent national backgrounds and interpreted their actions in the light of
these stereotypes given that other information was limited. An alternative
explanation could be the differences in willingness to adapt between man-
agers at the higher and lower levels. It could be the case that managers at
lower levels were more antagonistic to the new requirements than those at
higher levels. This resistance was expressed in the negative opinion about
the foreign managers who represent new requirements and change. The
foreign managers also might have recognized this resistance to change on
the lower level and have attributed this to national differences.
6.7.3 Profit orientation
A possible explanation for not finding differences in the profit orientation of
Hungarian and foreign managers is that the economic situation of company
B was such that here managers did not have to worry about the short term
survival of their organisation. Also, although the yearly profit is important,
both the Hungarian and the foreign managers considered the present mar-
kets temporary from which they plan to withdraw and orient towards the
Eastern European, Russian, Yugoslavian and local markets. Succeeding in
these markets and reaching profitability in the long run seemed to be as
(or even more) important to this organisation than reaching profit on the
short term.
155

6.7.4 Functional diversity
It is interesting that the more functional areas managers had experience in
the closer they seemed to be to the central map in cluster B. The qualitative
analysis of the central map in cluster B suggested a marketing orientation
of these managers as well as a broader coverage of other functional issues.
Although functional diversity correlated with technical education (r = .51,
p = .02) generally those educated in technical fields did not seem to be
close to the central map in cluster-B. This suggests that the experience
in diverse functional area was the one which lead to a somewhat shared
marketing oriented view among the managers who fell into this cluster.
156
Chapter 7
Company C: Everybodydoesn’t like something. . .
7.1 The acquired company
Company C specialises in coffee roasting and packaging, tea mixing, flavour-
ing and packaging, salt packaging and in the production of household and
personal care products. It was acquired by a foreign company DE in Febru-
ary 1991, when the foreign owner bought 95% of the shares. Company DE
is a Dutch company with a similar profile to company C. DE was acquired
by an American company SL in the eighties. Since this acquisition DE is an
immo where American and Western European (mostly Dutch and Belgian)
managers work together. When C was acquired by DE the number of em-
ployees was around 1700–1800 people. By the time of the fieldwork (March
and April 1993) the number of employees fell to 1000–1100 employees due
to the lay off and early retirement policy of the new owner. The foreign
management of the company still plans a further decrease in the number of
employees. Originally C operated in 7 plants but the foreign management
closed down two of the original plants. Information was not available on
the profitability of the company, but this was not a unique characteristic
of this immo. In Hungary there is a Fortune-like magazine called Figyelo
which lists statistical information on the top 200 companies and on foreign
owned companies each year. Those responsible for assembling and com-
menting on these statistics complained that the majority of large, foreign
157

owned companies did not provide the necessary information or give per-
mission to print their statistics from other sources (Inzelt, 1993). The only
information which the foreign executive director of C was ready to provide
was that the company was slightly profitable but that its profitability had
been steadily decreasing since the time of the acquisition. The company is
fully oriented towards selling its products on the domestic market.
7.2 The history of the company
Company C was one of the large, state owned, successful companies in
the socialist system. It enjoyed a state protected monopoly position in
Hungary both in the tea and coffee markets. These markets were divided up
between two companies C and ME by the state in the seventies and eighties.
Company C was given 60% of the Hungarian coffee market and 40% of the
tea market while ME was assigned 40% of the coffee and 60% of the tea
market. This division of the market was originally secured by the import
policy of the government. In the socialist system import rights were given to
foreign trade companies as opposed to production and service companies.
Hungarian companies could only receive import products through these
foreign trade companies. Since Hungary is not a coffee or tea producing
country the basic input materials had to be imported. Import rights were
divided up between the foreign trade companies by the state. One of these
companies had exclusive import rights for coffee and tea. This company
was responsible for providing the raw tea and coffee to C and ME, but
strictly according to their quotas and at a price set by the state. C and
ME then processed the tea and coffee and sold them at a price which
was also determined by the state. In 1984 the company received import
rights from the state within set quotas. Since the selling price and the
quotas were all set by state officials the success of the company depended
on how successfully it was able to lobby them. The previous CEO of C
(the president during the time of the fieldwork) managed to build good
connections with governmental officials which ensured favourable prices
158

and treatment for the company in the past.
The company started the privatization process under the period of
the so-called “spontaneous privatization” (described in section 4.3) which
meant that the top management team, with the agreement of the company’s
council itself selected the privatization partner to whom they wanted to
sell the company. The top management team also had the opportunity to
negotiate the conditions of privatization with the new partner. The State
Property Agency only practised legal controlling above this company. As
the first step 95% of the shares were sold to the foreign partner for 6 billion
HUF. Company DE also agreed to invest an additional 1.5 billion HUF
into C. The remaining 5% of the shares were offered to the employees at a
favourable price. The employees were required to pay 7.5% of the nominal
value of the shares while the managers paid 25%. The shares which were
offered to the employees were non-voting shares. Since then, DE has bought
back most of shares which were sold to the employees. This deal provided
roughly the equivalent of one year’s salary for each employee who bought
shares.
7.3 The purpose of the partners
During the interviews most of the managers agreed that DE bought C be-
cause it wanted to open up a market in Eastern Europe. They provided
different explanations why DE wanted to make this step however. Some
managers thought that DE did not have much choice about coming to
Eastern Europe after its competitors started acquiring and setting up com-
panies there. DEsimply had to make this move to stay competitive. Other
managers attributed this move to other factors, like to the good profit pos-
sibilities in the region, the desire of DE’s management to increase the size
of their company, and the imperialist motives of Westerners to colonise
the region. The interviewed managers also had some explanations for why
company DEchose Hungary and selected company C for the acquisition.
Some foreign managers said that DE selected Hungary because it proved
159
to be one of the most stable countries in this region with the most advanced
market related institutions. According to some Hungarian managers DE
chose C because it was a profitable, well run company which matched the
profile of DE. The foreign managers, however, emphasised that DE in fact
selected the country first and and the company after.
Why the Hungarian partner decided on the acquisition and also on
DE is a longer story which was told by the Hungarian managers. The
management of C was aware that the state might eventually privatize this
company. They decided to pre-empt this event so that they would be able
to select a professional investor and influence the conditions of the privati-
zation. Since they had already been approached by potential partners they
were in a good position to privatize the company themselves. They chose a
professional partner which did not want to close down the company, which
was willing to invest additional capital, and which promised a certain level
of employment and high compensation for those who might be laid off. The
previous Hungarian CEO described the criteria for partner selection:
In the contract we stipulated a certain level of employment for a
given time period. We stipulated the kinds of investments they
would make, so that they would not buy us to kill us. They met the
agreement except in the case of a few investments.
7.4 External conditions
In the last few years the market conditions of the company went through
substantial changes. C lost its monopoly position and had to face increas-
ing competition which consisted mostly of foreign owned companies which
acquired Hungarian companies or set up their own operations in Hungary.
There was an increasing “black market” in coffee which meant a new com-
petition for the coffee processors. Through this market a large amount of
cheap coffee was bought into the country on which the sellers did not pay
any import duty. The increasing competition meant that during the time
of the acquisition, the market share of the company dropped from 60%
160

to 39% in coffee and the company had to make major steps to stop and
reverse this tendency. Since then the company managed to increase and
stabilise its market share in coffee at 53%. One the means to achieve this
success was that the company managed to put pressure on the state to
forbid selling coffee without a special licence from the state, similarly to al-
cohol and tobacco. This law was enforced by using the police against black
marketeers. In addition to this new law, the state increased the import tax
to 40% on processed coffee. The president of C described the strong action
of the state against black marketeers as something which the state owed to
the foreign partner of C. He said in a press interview (Inzelt, 1993, p. 24):
Using strong hands towards black marketeers was a debt of the state
towards company DE which invested a lot of money in this country.
This victory of the coffee companies over the “black market” was not
unique, but it was probably the most dramatic representation of the pres-
sure (described in section 4.4) which international companies put on the
Hungarian government. While the fight for the domestic market intensi-
fied, the development of the distribution channels which C used had not
adjusted fast enough to the changes in the market conditions. Under the
socialist system, C sold its products through 10 wholesale companies which
then sold the products through the retailers to the consumers. This way the
products reached the consumers through several stages. During the time of
the fieldwork, 86% of the products were still sold through these wholesalers
in the countryside, while within Budapest this ratio was 50%. Among these
10 wholesalers, 8 were still not privatized which caused tremendous inef-
ficiency and uncertainty in these organisations. Although company C has
built a sales force to be able to reach its customers directly the inefficiencies
of the wholesalers still made it difficult to provided better service to a large
percentage of them.
161

7.5 New techniques, changes
In the first year and a half after the acquisition the new owner did not
initiate many changes. This lead to a lag in the company’s adaptation to the
changing market conditions which contributed to the declining profitability
and market share. The worsening performance results triggered action by
the new owners. They sent 8 Dutch managers and 1 Belgian executive
director to C with the task of reorganising the company and reversing the
declining performance.
7.5.1 Restructuring
The arrival of the foreign managers temporarily added extra layers to the
organisational hierarchy and also led to centralisation of authority. The
foreign managers were appointed as bosses above the Hungarian managers
or put into key positions in areas where their expertise was necessary. Four
of the 9 foreign managers were part of the top managerial team which also
contained two Hungarians. One of these Hungarian managers was the pre-
vious CEO of the company who became the president of C and “Director
of External Relations”. The formality of this position was open knowledge
in the company. The former CEO himself admitted, and other Hungarian
managers confirmed, that he was basically left without any authority. The
reasons that he was still kept in a high, symbolic position were (1) he ar-
ranged the privatization deal with DE and he was promised this position as
part of the deal; (2) his good connections with the state officials were still
important as the experience with the “black market” confirmed. In addi-
tion to the president, only the manufacturing director was Hungarian in the
top managerial team. The foreign managers in the top managerial team
had the following positions: executive director, financial director, market-
ing director, and human resource management director.1 The other foreign
managers who were not part of the top managerial team were mainly sent
1In addition to managers in the tmt the Hungarian plant manager was also consid-ered a top manager during the data analysis.
162
because of their expertise in marketing and finance. Two of these five for-
eign managers were product-market managers. They were responsible for
introducing to the market the household and personal care products on
the one hand and the so-called out of home business products on the other
hand. These two profiles were introduced by the new owner which con-
tained several new products (cosmetics and chemical products) which were
not previously produced by the company. Two of the three other foreign
managers worked in the marketing and sales area while the third dealt with
finance and planning. Although the arrival of the foreign managers meant
a temporary increase in the hierarchy the reorganisation effort of the new
management had already led to some flattening of the organisational struc-
ture (the number of layers however was still high, around 6–7). Production
was organised around certain products (like salt, household products, cof-
fee, tea, out of home business) and the supporting functional areas were
placed at the same level as the production areas rather than subordinate
to them.
The organisational restructuring is still incomplete and in fact it is
still closer to the beginning than to the end. Further decrease in the or-
ganisational hierarchies is expected, as the foreign management is trying
to create a similar organisational structure to that of DE. In the organ-
isational structure of DE there are fewer layers of administrative support
staff than in C. It was therefore clear to both Hungarians and foreigners
that those managers who worked in these areas would be mainly affected
by the new lay-offs. This situation created tremendous uncertainty and
bad feelings in the threatened managers at the time of the study.
Parallel with the restructuring activities there was an effort to redesign
the responsibility system. Managers were instructed to be responsible for
narrower areas than they were before but their responsibilities would go
“deeper” into these areas and would be better defined. This would change
the previous practice where everybody pretended to be an expert in some-
body’s else area when it was a matter of talking about issues, but nobody
163

was willing to take any responsibility if a bad decision was made.
The most substantial change which took place within C concerned
the development of a new sales force with travelling agents. Building a
successful sales force was a major concern of the organisation and it devoted
many resources (including high payment of the agents, usage of western cars
by these people, etc.) to this purpose.
The R&D area basically ceased to exist. The R&D is done in DE
which provides C with the necessary results.
7.5.2 Cost control
Before the Dutch managers arrived in company C there was basically no
effective cost control within the organisation. The company did not even
have a good system to calculate which products cost how much or how to
divide up the general cost among the products. The foreign managers have
still not managed to work out a system through which the cost of different
products could be realistically calculated.
To cut costs several efforts were made. One was to lay off the excess
staff. Under the socialist system the number of employees was often influ-
enced by non-economic considerations which resulted in large numbers of
excess employees in many of the ex-state owned companies, among them
C.
One of the Hungarian managers described the considerations which
laid behind the employment of people in a small town, called T, in the
following way:
The whole employment in T was the result of bargaining with the
state. We asked the state officials to set our prices in a way that our
profit would be guaranteed. In exchange we did something which
was the responsibility of the state: ensured full employment in T.
The new foreign management closed down uneconomical factories, like
the one in T. It was still more economical to lay off the excess people than
164
to keep them, despite the high compensation fee which C agreed to pay
them as part of the privatization contract.
Another way of cutting costs was to reduce the inventory. In the pre-
vious system C had a “supplier responsibility” (described in section 4.1)
which meant that it was responsible to the authorities to satisfy the domes-
tic demands with products, such as salt, coffee or tea. Since the import of
raw materials arrived irregularly the company could maintain production
and satisfy the market if it kept a high levels of raw material stocks. It
was more important to satisfy the “supplier responsibility” than to keep
costs low, because satisfying the state was an important bargaining tool,
and prices could be negotiated with the state on a cost-plus profit basis.
This meant that the prices under negotiation were calculated in a way that
the profit was calculated as a certain percentage of the cost, and was added
to the cost. Now that cost had become an important issue, the company
made an effort to keep inventory at an optimal level considering the cost
and the requirements of smooth production.
Another way to cut costs was to stop activities which did not fit the
profile of the company. Under the socialist system the inefficiency of the
market made it very unreliable to contract out certain activities to other
organisations. This led the management of C to follow a strategy of in-
corporating activities into C which did not belong to the profile of the
company, but which were necessary for efficient functioning. For example
business trips were not organised by an external travel agency but by a
travel group within the company. These kinds of activities are now con-
tracted out to other organisations.
The other new cost cutting method was a new budgeting system. DE
also tried to save money by providing capital for investment to C rather
than taking up loans. Loans were very expensive in Hungary due to high
interest rates.
165

7.5.3 Production, technology
Profile clearance occurred in the production area. This meant that the com-
pany ceased to produce certain products while new products and product
profiles were introduced. There were substantial changes even in those
products which were produced before. Two-thirds of the products went
through some changes within one year in terms of their form, quality, wrap-
ping, appearance etc.
There were also changes in technology. Several new machines were
bought or second-hand machines which were modern in Hungarian terms
were delivered from other plants of DE. Efforts were also made to introduce
a computerised information system into C. This process however just had
started and there were so far no spectacular changes in this respect.
7.5.4 Bookkeeping
Since the Hungarian accounting regulations are different from those which
are required by DE, parallel accounting systems were introduced into C.
One system was to satisfy the requirements of the parent company while
the other is to satisfy the Hungarian accounting regulations. A financial
controlling system was also introduced.
7.5.5 Employment policy
While the general tendency in the company was laying off production and
administrative employees there was also an opposite tendency in the mar-
keting and sales areas. Since the acquisition the company had hired 115
employees in these areas. This step was in line with the effort of the com-
pany to build up a marketing and sales force while streamlining production.
7.5.6 Incentive system and training
Although the acquired company gave wage increases to its employees which
were above inflation, according to some middle level Hungarian managers
there was still a negative change in the incentive system after the foreigners
166
bought the company. Previously C was a profitable company so it was able
to increase wages in a way to keep them above industry average and in
addition it always paid bonuses and premiums from its high profit. Now,
under the cost cutting effort, the wages did not increase as fast and basically
no additional incentives were given except in the marketing and sales areas.
7.5.7 Marketing, sales
The most substantial changes in the company occurred in the sales and mar-
keting area. The foreign management concentrated their effort on building
up a sales force and on turning C from a production and technology driven
company to a marketing and sales driven company.
The degree of change was characterised in the following ways by a
Hungarian procurement manager:
What is an unprecedented change in the company is that it turned
from a production oriented company into a market driven one. This
marketing orientation could be measured in the amount of resources
which is distributed to the marketing and sales area. There was a
substantial increase in the number of employees in the marketing
and sales areas and a network of sales agents was developed. So
the most substantial changes in terms of their structure, in their
approaches and in their methods were in these areas. In engineering
there were no substantial changes apart from the introduction of
some new technologies and machines. These are more efficient then
they were previously but I would not call them such a substantial
change.
The foreign management made a serious effort to utilise the previous
marketing achievements of C. C had a type of coffee in the old system
which was known by the people as high quality coffee and it was also very
popular. DE introduced its name and many of its new products to the
Hungarian market by using the brand name of this coffee. First, the DE
name was introduced by putting it in a central place on the packaging of the
167
coffee without changing anything else. Then DE introduced other coffee
and products which had similar packaging to this popular brand. After
becoming better known as a company, DE also introduced other products
but with strong reference to the high quality which was associated with the
original brand-name.
7.6 Changes in the relative positions of
areas
The increasing market orientation of the company had the effect that re-
sources were redistributed in favour of sales as opposed to production;
decisions were considered from the point of view of the market rather than
from a technological, production view; and the number of employees who
deal with the marketing and sales area increased while there was a serious
decrease in other areas. The switch in interest from the production and
technical areas towards the marketing and sales areas was characterised by
a Hungarian marketing manager the following way:
The most spectacular and substantial change happened in the sales
area. I know this because previously I worked in the sales area.
There were five or six people in this area who dealt with trade issues.
The amount of people who deal with this area has now increased
more than ten times. The whole approach had changed. Earlier the
production was the of interest and the main effort was to create the
technical base for production. This has changed now.
7.7 Salient issues identified by the
managers
Twenty-eight managers were interviewed in the company although from
them only 27 agreed to have their CMs elicited (the executive director only
agreed to be interviewed). Among the 28 managers, 1 was Belgian, 8 were
Dutch and 19 were Hungarian.
168
The problems which were identified by the managers related (1) to the
internal and external changes; (2) to differences in national background
and experiences; (3) and to differences in the interest of Hungarian and
foreign managers.
Twelve out of the twenty-eight managers saw problems in adjusting
to the internal and external changes. Among these managers nine were
Hungarian and three were foreign managers. Nine of these managers (six
Hungarians and three foreign) thought that the main problem was that C
now had to be turned into a market oriented organisation. The problems
only partially related to the issue of changing the mindset of the people and
more to the fact that the new orientation was changing power relationships.
As the Dutch director of sales said:
In every western company even if there is a hundred years of ex-
perience there is a tension between production and sales. You can
imagine that in a company where marketing and sales did not exist,
that when it is established it takes away power from somewhere else.
And if that is a new department and also it is run by a foreigner
then by its nature there should be tension.
Or one of the Hungarian middle level managers working in sales said:
Earlier in the company we had more emphasis on production than
anything else. Now production is limited to providing services to the
rest of the company while before they were the elite. They were on
the top and everybody else was in a less powerful position compared
to them.
Although the changes were treated as the source of problems, Hungarian
managers also stated that these kinds of changes would have happened
even without the foreign partner due to the changes in the environment.
As one of the middle level Hungarian managers said:
The causes of our problems do not relate to the fact that we work
together with foreign managers. The problems originate from the
169

changes which had been going on in this organisation even from
before the foreigners showed up.
Three out of twelve managers thought that the most problematic part
of the changes was laying off employees. Four out of the twelve managers
attributed the problems to the fact that the internal changes had confused
the information system within the organisation and a new effective infor-
mation system had yet to be developed. Middle level managers often felt
that they did not get the information which was crucial to their work and
they were not often sure about what was expected from them under the
restructured organisation. As one of the middle level Hungarian managers
in the accounting area said:
[The top management] do not ask our opinion and if you still stand
up and do not shut up they are not really interested in what you
say. They make decisions without informing us, we do not know
why these decisions were made and then they are the ones who are
surprised that nothing is happening in this respect. There are no
forums where we could be informed about these decisions, although
in our area I forced out that we should have meetings regularly.
They usually say that there is no time for this kind of thing or that
the time is not spent usefully at these meetings or they will say that
all of these were already discussed in the top management meeting.
But I have experienced in my day-to-day work such cases where they
knew about some decision but failed to communicate it to me and
they still expected me to act according to the decision. But how
could I implement decisions which I do not know anything about?
I actually think that this is the case in every area. They want
something but they do not find their subordinates worthy enough
to tell them what they want even if it would not necessarily mean
that they would have to listen to their opinion about the matter.
One of the sources of this problem could be that the organisational
changes had not been completed yet. It became obvious from the inter-
views that the middle managers did not know whether the top management
170

had an idea about what would happen with the several layers of middle
management which were not present in the organisational structure of the
parent. It was not clear whether there would be new tasks assigned to these
managers or whether their functions would eventually cease to exist. Since
the managers in these functions felt that their areas were endangered but
had no further information on what would happen or what was expected
from them this situation was the cause of lots of uncertainty.
One of the plant managers however already seemed to know the re-
structuring concept and he claimed that it would follow the organisational
and informational structure of foreign partner.
This process [the restructuring] has already been going on. The
framework of restructuring is already accepted. Now the basic task
is that we should be able to make the new structure work. The
new structure is formed on the basis of the Dutch model. The task
is to be able to build up an information system which establishes
the channels of communication within the new structure. Also we
need to assign responsibilities to different functions and find the
right people in the right places. The basis of effective functioning is
going to be the right people to the right places with well described
responsibilities.
Another middle manager found it problematic that the assignment of
new responsibilities to some managers and curtailment of responsibilities of
others did not happen in a well planned manner. She provided the following
example to support her claim:
The latest “hysteria” is that they changed who has the authority
to sign what. They changed the old remitting and bank accounting
systems, but they failed to inform those who previously had these
authorities and who were deprived of them.
Another source of the communication problem could be that the man-
agers at the top intentionally withhold information from their subordinates.
171

This was evident in the research where, despite permission from executive
director and the top managerial team and a letter from the personnel man-
ager asking managers to participate the foreign executive director refused
to have his CM elicited. While he was very eager to learn about other man-
agers’ beliefs it appears that he did not want to provide any information
which he could not control.
Eight of the twenty-eight managers raised problems which related to
national differences. Among these managers four were Hungarians and
four foreign. The foreign managers mostly criticised the unwillingness of
the Hungarian managers to change and act (3 managers); the fact that
Hungarian managers do not think in a business oriented way (1 manager);
that the Hungarians consider information as a source of power and there-
fore do not give it to other people who need it (1 manager) and that the
Hungarians are afraid to express their opinions (1 manager).
A Hungarian middle manager also said that Hungarians were afraid to
express their views, but she did give a situational rather than a national
reason for this. She said:
People are all under stress here. Everybody is worried about keeping
their jobs, so they are afraid to criticise the Dutch managers, even
those who are at their own levels. Because of this there have been
plenty of controversies within the company and if you asked the
foreign managers why did they do something this way they would
say with the truest sincerity that they did not mean to reach this
outcome. Those Hungarians who should have told them that they
were wrong were afraid to do so and the foreigners did not know the
rules and it did not occur to them that they made a stupid decision
here.
The four Hungarian managers who raised national problems mentioned
that the foreign managers arrived to Hungary with prejudices against Hun-
garians and their interaction with Hungarians had been based on these
prejudices. Two managers also mentioned the lack of trust which the for-
172

eign managers had in the Hungarians. Two managers also thought that the
foreign managers often made decisions without having exact information
or without making an effort to learn more about the context which should
be taken into consideration when a decision has to be made. For exam-
ple, one of the Hungarian middle level managers described how much effort
they had to make just to get the foreign managers to understand that the
Hungarian market is different from Western markets and therefore requires
different marketing and sales policies. She said:
There are plenty of good things which would be very nice to import
from them. They had the chance to develop these methods for years
so we do not have to reinvent these methods; we just have to think
about how to implement them in Hungary. But you cannot imple-
ment everything, especially not in trade, where we have a different
market here than they have there. We have problems making them
understood that what we are saying is not just something which we
bring up as an excuse but it is based in facts. The fact that they
know their market and how to work on that market does not mean
that you can follow the same strategy in all markets. They did not
accept at first that such and such will not work here. They pushed
it through and we got into a situation where we could have boasted
that we had told them so; but it was not what we wanted.
From the four Hungarian managers who mentioned national differences
two also argued that foreign managers did not understand the Hungarian
culture. One of the Hungarian top managers gave me the following exam-
ple:
As you know this year 15 March [national holiday] fell on Monday
so everybody was looking forward to spending a long weekend with
their families. The Dutch wanted to organise a working weekend
for managers to discuss issues. They wanted to put this working
weekend on the 12-13-14th which would have destroyed our holi-
days. They thought that this was the best arrangement for us since
173

we can then relax on Monday. This however shows that they do
not understand the Hungarian culture and mentality. This decision
caused such an outcry that the Dutch had to change their plans.
The above quote also shows an example of what kinds of issues the Hun-
garians consider to be part of Hungarian culture and are actually ready to
stand up for.
Two Hungarian and two foreign managers mentioned that the foreign
managers had different interests and responsibilities. While the Hungarian
managers had more interest in ensuring their position and in the long term
survival of C, the foreign managers were expected to produce short-term
results which would convince shareholders of the correctness of the invest-
ment decision. As one of the foreign managers who was responsible for
sales said:
We [the foreign managers] are a little bit squeezed in doing business
according to the expectations of the parent and also according to
the rules of business in Hungary.
The Hungarian ex-CEO summarised the problem of the foreigners not
knowing the context well and having a short term profit orientation the
following way:
So, just a quick example. We [the Hungarian managers] had to try
to keep persuading them for two years to go down to the cheap cof-
fee market which is half of the legal market in Hungary. We had to
prove to them that without this step we will be unable to succeed
even on the other market or to keep up with the competition. This
was a hard fight from the side of the Hungarian management and
shamefully we had to argue for it again and again. What is sur-
prising to me is that they have such a short term profit orientation.
This is very harmful since the other coffee companies around us are
thinking in the long term.
174

Interestingly, one Hungarian manager complained that being bought
by a multi-national company had increased rather than decreased the bu-
reaucracy within the company.
While thinking about national differences and differences in interest
one of the Hungarian managers thought that the only way to reconcile
these differences was to have mutual adaptation on both sides. He said:
I think that the adaptation has to be on both sides. The change was
unproblematic only in those areas where they managed to connect
to each other the old mentality with the new one. This meant that
not only the Hungarian managers had to adjust, but the foreign
managers as well. Any attempt which did not take into consideration
that the foreigners also have to adjust has failed. It failed at the
top because it could not be implemented, and failed at the bottom
because people wanted to turn the clock back.
7.8 Analysis of cause maps
The above is the context in which managerial beliefs were formed and in
which similarities and differences of these beliefs should be understood. As
mentioned above, 28 managers were interviewed in this organisation and 27
managers’ CMs were elicited. The interviews suggested that (1) functional
area (especially marketing and sales); (2) national–cultural backgrounds;
(3) and positions are the ones which are likely to influence managerial
beliefs in this organisation. For finding whether these relationships are
the most important or not the CMs were analysed. First the distance
ratios between the CMs were calculated and then the Student t-test and
the Wilcoxon-Mann-Whitney test were conducted. In the case of 27 maps
351 distance ratios were computed. The results of these computations are
presented in table 7.1.
In addition to the above a cross-correlation table among managerial
characteristics and between managerial characteristics and central maps
175

Subgroup M Nw Na xw xa σw σa t ZMW
All 27 351 0.729 0.145SEX-Male 20 190 140 0.706 0.751 0.143 0.139 2.855 2.897LANG-Multi 23 253 92 0.717 0.765 0.144 0.146 2.722 2.767ED-Tech 11 55 176 0.677 0.721 0.127 0.147 2.000 1.611POS-top 7 21 140 0.675 0.713 0.107 0.141 1.186 1.413DFA-MA 11 55 176 0.705 0.733 0.146 0.157 1.175 1.103FA-MA 9 36 162 0.701 0.727 0.134 0.157 0.940 1.055LANG-Mono 4 6 92 0.718 0.765 0.148 0.146 0.753 1.023NA-Frgn 8 28 152 0.719 0.737 0.129 0.147 0.605 0.444FA-GM 4 6 92 0.742 0.725 0.140 0.146 −0.270 −0.052FA-Fin 4 6 92 0.755 0.752 0.174 0.134 −0.060 −0.333DFA-PE 6 15 126 0.740 0.725 0.126 0.140 −0.392 −0.468NA-Hung 19 171 152 0.724 0.737 0.148 0.147 0.825 −0.515FA-PE 6 15 126 0.725 0.715 0.125 0.146 −0.251 −0.585SEX-Female 7 21 140 0.800 0.751 0.171 0.139 −1.467 −1.634DFA-RD 4 6 92 0.848 0.748 0.091 0.140 −1.733 −1.741POS-ntop 20 190 140 0.747 0.713 0.150 0.141 −2.067 −2.000ED-Soft 16 120 176 0.765 0.721 0.143 0.147 −2.572 −2.745
M is the number of Maps, Nw is the number of distances betweenthe maps within subgroups and Na is the number of distances acrosssubgroups (i.e, between maps which were within and outside of thesubgroups). xw is the mean distance between maps within subgroupsand xa is the mean distance across subgroups. σw is the estimatedstandard deviation within subgroups σa is the estimated standarddeviation across subgroups. t is the result of the Student t-testand ZMW is the Z statistic for the variant of the Wilcoxon-Mann-Whitney test.Only subgroups which have at least four members are shown here.In the subgroup names SEX indicates gender which could be Maleor Female, LANG-Multi marks those who speak more languagesthan their native language and LANG-Mono marks those who onlyspeak their native language. ED is Education type (ED-Tech is tech-nical education, ED-Other is non-technical education), FA indicatescurrent Functional Area (FA-MA is marketing and sales, FA-PE isproduction, FA-GM is general management, FA-Fin is finance andFA-RD is R&D), DFA is Dominant Functional Area (for subdivi-sion see functional area), POS is position (top is a top manageriallevel and ntop is others), NA is Nationality (NA-Hung is Hungarian,NA-Frgn is foreign), and PoS is position (PoS-Top is top managerialposition, Pos-nTop is other position).
Table 7.1: Differences in intersubgroup means for company C
176

Figure 7.1 In and out degrees for map cluster-A in company C
Nodes Arcs In Sum In Arcs Out Sum Out
21 Flexibility 5 (3.71) 6 (10.74)30 Leadership 6 (4.88) 6 (12.23)36 Quality of products 5 (8.17) 6 (3.49)41 Cost control 6 (8.15) 5 (5.29)47 Efficiency 6 (10.28) 6 (7.21)48 Distribution channels 6 (8.84) 5 (5.07)
was also computed (table 7.2).2
For four clusters of CMs were identified (with members 10, 6, 4, 7
respectively) which served as a basis for computing the central maps.
For four clusters A, B, C and D a limited qualitative analysis was also
conducted on the central maps considering the nodes which were selected
by the majority of managers and the indegrees and outdegrees which were
calculated to each nodes.
The constructs in the central map A (figure 7.1) were divided between
management (21, 30), production (36, 41, 47) and marketing issues (36,
48). Considering the joint indegrees and outdegrees it seemed to be the
case that the majority of managers in this cluster attributed the strongest
influence to management on the success factors (by 22.97 joint outdegrees).
Similarly to figure 7.1 two of the selected constructs in central map
B (figure 7.2) related to management (21, 3), two to the market (20, 33)
2The listed managerial characteristics in table 7.1 are the same as in table 7.2 exceptthat the cross-correlation table also contains how long managers have been working atthe company (At-Comp), their age (Age), and the diversity of managerial experience indifferent functional areas (FuncDiv).
Figure 7.2 In and out degrees for map cluster-B in company C
Nodes Arcs In Sum In Arcs Out Sum Out
3 Strategy 6 (14.38) 6 (8.19)20 Competition 6 (9.84) 6 (11.42)21 Flexibility 6 (10.05) 6 (10.17)28 External conditions 5 (3.92) 6 (9.92)33 Market knowledge 5 (7.07) 5 (9.23)47 Efficiency 6 (9.80) 5 (6.13)
177

HFAPE
−.3
8†
FAFI
−.2
9−.2
2FAGM
−.2
9−.2
2−.1
7DFAMA
.85∗∗∗ −.4
4∗−.3
5.0
8DFAPE
−.3
8†
.36†−.2
2.2
8−.4
4∗
DFARD
−.2
9.5
3∗∗
.12−.1
7−.3
5†−.2
2EDTech−.2
7.6
4∗∗∗ −.3
5†
.29−.2
3.4
6∗
.29
NAHung−.2
3.3
5†−.1
9.0
4−.2
9.3
5†
.27
.54∗∗
Age
−.1
5−.0
3.0
9−.0
3−.1
4.0
6−.0
6−.0
9.0
9AtComp−.2
1.1
9−.1
3.0
1−.3
1.2
7−.0
1.2
9.5
4∗∗−.0
1Gender
−.0
6.0
9−.0
1−.2
5−.1
5.0
9−.0
1−.1
5.3
8∗
.07
.56∗∗
FuncDiv
.29−.1
1−.1
9−.1
3.2
3.0
6−.3
9∗−.1
9−.3
0−.4
6∗−.2
6.0
0Topman
−.1
3−.0
3.0
7.0
7−.2
0−.0
3.0
7−.0
1−.3
2.2
5−.1
6−.2
8−.0
0Multling
.29
.22
.17−.1
2.3
5†−.2
8.1
7.1
3−.2
7−.1
2−.3
5†−.2
3.0
0.2
0
DistA
.03−.0
4−.0
7−.1
7−.1
9−.1
3.3
2−.0
6.1
0−.4
3∗
.31
.25
.24
.15−.2
0DistB
.23−.1
9.2
8−.1
4.2
5−.1
7−.0
1−.4
6∗−.3
4†−.1
1−.3
2−.0
9.2
8.1
5.3
0.0
6DistC
.18−.0
2.0
1−.0
8.3
4−.0
9−.2
1−.1
6−.1
7.1
9−.0
8.3
8†
.15−.1
8.1
5−.3
9.1
3DistD
−.4
6∗
.04
.12
.18−.3
7†
.27
.11
.04
.30
−.0
0.2
9.2
0−.4
5∗−.3
3†−.4
6∗
.08−.1
9−.1
7
Mean
.33
.22
.15
.15
.41
.22
.15
.41
.70
41.5
96.3
31.2
6.8
0.1
9.8
5.7
1.7
4.8
6.6
4σ
.48
.42
.36
.36
.50
.42
.36
.50
.47
7.6
45.3
1.4
5.1
6.4
0.3
6.2
0.2
1.1
3.1
9VariablesFAMA
FAPE
FAFI
FA-GM
DFAMA
DFAPE
DFARD
EDTechNAHun
Age
AtCo
Gend
FncDivTop
Multlin
DistADistB
DistC
DistD
N=
27† p<
0.1
;∗p<.0
5;∗∗p<.0
1;∗∗∗ p<.0
05
Onl
ysu
bgro
ups
whi
chha
veat
leas
tfo
urm
embe
rsar
esh
own
here
.In
the
subg
roup
nam
esFA
indi
cate
scu
rren
tFu
ncti
onal
Are
a(FA-MA
ism
arke
ting
,FA-PE
ispr
oduc
tion
,FA-Fi
isfin
ance
,FA-GM
isge
nera
lm
anag
emen
t),DFA
isD
omin
ant
Fuct
iona
lA
rea
(for
subd
ivis
ion
see
func
tion
alar
ea),
ED
isE
duca
tion
type
(ED-Tech
iste
chni
cal
educ
atio
n,ED-Other
isno
n-te
chni
cal
educ
atio
n),NA
isN
atio
nalit
y(NA-Hung
isH
unga
rian
,NA-Frgn
isfo
reig
n),TopMan
isbe
ing
inth
eto
pm
anag
eria
lpo
siti
onw
hile
Non-Top
isth
eop
posi
te,A
ge
isag
e,AtComp
isth
eti
me
spen
tat
the
com
pany
,Gender
isge
nder
(whi
chhe
rem
arks
fem
ales
)FuncDiv
isfu
ncti
onal
dive
rsit
y,an
dDistA–DistD
are
the
dist
ance
sfr
omth
ece
ntra
lm
aps
incl
uste
rA
,B
,C
,an
dD
.In
the
tabl
eth
ose
man
ager
ial
char
acte
rist
ics
whi
char
eco
mpl
emen
tary
toea
chot
her
(Hun
gari
anvs
.for
eign
,tec
hnic
aled
ucat
ion
vs.n
on-t
echn
ical
educ
atio
n,to
pvs
.no
n-to
p,m
ale
and
fem
ale)
are
only
liste
dun
der
one
ofth
eir
poss
ibili
ties
.
Tab
le7.
2:C
orre
lati
ons
wit
hdis
tance
sfr
omce
ntr
alm
aps
inco
mpan
yC
178

Figure 7.3 In and out degrees for map cluster-C in company C
Nodes Arcs In Sum In Arcs Out Sum Out
5 Market share 4 (7.50) 4 (7.67)6 Long term profit 4 (10.00) 4 (4.50)
21 Flexibility 4 (5.83) 4 (10.00)33 Market knowledge 4 (8..34) 4 (9.5)
and one to production (47). The majority of managers in this cluster also
found important the external conditions (28) in influencing organisational
success. Managers in this cluster attributed the highest joint influence to
market issues (with 20.65 joint outdegree) as opposed to the management.
In central map C (figure 7.3) constructs related to market (5, 33), one
to the management (21) and one to the profit (6) although it have to be
noted that the overlap of constructs was relatively limited.
The data in figure 7.4 suggest a strong agreement on the importance
of market and sales issues in cluster D. Six of the constructs which the
majority of managers selected in this cluster related to the market (5, 27,
33, 35, 36, 48), two to the production (36, 41), one to the management
(3) and one to short-term profit (31). It is not surprising that the joint
influence of the market related issues was found to be overwhelming (79.15
joint outdegree).
The constructs in the central maps were more or less in agreement
with the most frequently selected constructs on the company level (in Fig-
Figure 7.4 In and out degrees for map cluster-D in company C
Nodes Arcs In Sum In Arcs Out Sum Out
3 Strategy 9 (15.99) 8 (18.33)5 Market share 9 (20.18) 9 (11.33)
27 Customer relations 7 (14.66) 9 (16.66)31 Short-term profit 9 (17.30) 7 (5.78)33 Knowing market 5 (6.16) 9 (18.58)35 Brand recognition 9 (16.33) 7 (14.08)36 Quality of products 8 (12.83) 8 (18.50)41 Cost control 8 (10.04) 7 (9.25)48 Distribution channels 9 (11.98) 9 (11.00)
179

Figure 7.5 Frequently selected nodes in company C
(Construct) Most freq. sel. construct Frequency(21) Management flexibility 21(41) Cost control within the company 19(33) Knowledge of needs of company’s market 19(47) Efficiency/productivity 18(5) Market share of the company 15(3) Strategic direction. . . 15(48) Quality of the distribution channels 14
ure 7.5).
Among the most frequently selected constructs three (33, 5, 48) were
market related issues, two related to production (47, 41) and two to man-
agement (21, 3). These constructs seemed to be tied to ongoing issues
within the organisation. At the time of the fieldwork the management of
the company was working on forming the strategic plan of C. As part of
this plan they had to decide on the competitive strategy concerning the
coffee market. The decision was on whether they should specialise on high
quality, but expensive coffee (i.e., differentiation) or to sell also cheap, but
lower quality coffee (i.e., cost leadership strategy). Originally the foreign
managers wanted to apply the former strategy, but the declining market
share and the persuasion of the Hungarian managers who better under-
stood the Hungarian market pushed the company to apply both strategies
but in different market segments (Knowledge of needs of the company’s mar-
ket). Being a cost leader in coffee required costs to be kept low which was
one of the most often selected constructs. The quality of the distribution
channels was also a major consideration in the company given that the cur-
rent inefficiency of these made it difficult to improve service to consumers.
These concerns reflected the strong market orientation of the management
in C. The selection of constructs also reflected a strong concern about the
quality of management.
It was also tested whether there were substantial differences between
the Hungarian and foreign managers considering short versus long term
profit orientation given that the short term profit orientation of the for-
180
eign managers was mentioned as a salient issue by Hungarians managers.
Twelve managers selected one of the profit cards among the ten most impor-
tant cards, but after applying Fisher’s Exact Test no significant differences
were found between Hungarians and foreigners in this respect (4 Hungarian
and 3 foreign managers chose the yearly profit card and 4 Hungarian and 1
foreigners chose the long term profit orientation card).
7.8.1 The results
One surprising result, reflected in both Table 7.1 and Table 7.2, is that
male managers had more similar beliefs about business in C than female
managers. In the cross-correlation table the CMs of the male managers
are close to the central map in cluster C (r = −.38, p = .050). Both
tables also suggest that multilingual managers seemed to have more similar
business beliefs to each other than to the rest of the managers. The CMs
of the multilingual managers are close to the central map in cluster D
(r = −.46, p = .016). The business beliefs of those who received a technical
education was more similar to each other than to the rest of the managers.
Also managers in the top-position showed similarities in their beliefs. The
CMs of these managers tended to be close to the central map in cluster B
(r = −.46, p = .017). Both the Student t-test (together with the Wilcoxon-
Mann Whitney test) and the cross-correlation table suggest that working
in the marketing and sales functional areas seemed to have a substantial
influence on the similarities in managerial beliefs in this company as did
the effect of having most experience in the marketing and sales areas. Also,
those who worked in the top positions showed similarities in their beliefs
according to both types of analyses. The CMs of the managers who worked
in the marketing and sales areas, had their dominant experience in these
areas and occupied top positions were close to the central map in cluster
D (r = −.46, p = .015; r = −.37, p = .057, r = −.33, p = .1 respectively).
Not surprisingly those who work on the marketing and sales areas had their
dominant experience from these areas as well (r = .85, p < 10−7).
181

It is an interesting result that the more diverse the experience managers
have in different functional areas the more similar their beliefs seems to be.
This result was suggested by the cross-correlation table where functional
diversity seemed to show substantial correlation with the central map in
cluster D (r = −.45, p = .017).
A Pearson correlation was calculated to measure the relationship be-
tween age differences and distances in beliefs. The correlation found was
very small although the cross-correlation table suggested that distances of
CMs from the central maps in cluster A correlated with the differences of
age among the managers (r = −.44, p = .024).
Similar to the result of companies A and B, nationality did not seem
to be among the factors which had the largest influence on similarities
and differences in managerial beliefs, although the cross-correlation table
suggested some closeness of the Hungarians to the central map in cluster B,
being Hungarian did not come high in its influence on managerial beliefs in
the results of the student t-test (or the Wilcoxon-Mann-Whitney test). The
correlation table also shows correlation results between different managerial
characteristics considering the sample of the managers in company C.3
7.9 Evaluation of findings
7.9.1 The effect of gender
One of the striking results was that in C the male managers seemed to
have more similar business beliefs to each other than to the female man-
agers (although we have to note that central map in cluster C to which
the CMs of male managers seemed to be relatively close showed only a
limited agreement in the selected constructs). It would seem unlikely that
3Among the relevant correlations the following ones are worth noting. Hungarianmanagers, not surprisingly had longer company tenure than the foreign managers (r =.54, p = .004) and the female managers tended to be Hungarians (r = .38, p = .048).More Hungarian than foreign managers tended to have technical education (r = .54,p = .004) and older managers tended to have experience in more distinct functionalareas than younger managers do (r = .46, p = .016).
182

this finding had anything to do with gender differences, but more to the
fact that the women in the sample were highly represented in the mid-
dle level administrative areas threatened by future lay-offs (5 out of the
7 women could be put into this category while it does not seem to apply
to any of the 20 men in the sample).4 Because of their positions, they
were particularly affected by the communication problems discussed above
and was conceived by managers as differences in the access of information
based on position. The uncertain position of the female managers together
with the communication problems could be a plausible explanation for the
less degree of consensus in their beliefs compared to the male managers.
The cross-correlation table reflected another possible explanation. Women
seemed to have worked longer in the company than males did (r = .56,
p = .002), although it partially could be attributed to the fact that all for-
eigners were males (r = .38, p = .048) and foreigners had spent less time in
the company than Hungarians did (r = .54, p = .004). First order partial
correlations were calculated to see whether there was a correlation between
being female and working at the company after controlling for nationality.
The correlation still remained strong (r = .46 p = .0215). Based on this it
could be suggested that given that women in the sample spent longer time
in company C they might find it more difficult to adjust to the changes
and this might also be reflected in the lack of consensus in their beliefs.
7.9.2 The effect of language knowledge
Several explanations could be offered as to why multilingual managers have
more similar business beliefs to each other than to the rest of the managers’.
Given that the marketing and sales managers were also closer in their
beliefs to the central map in cluster D than the rest of the managers were,
it is plausible that the group of multi-lingual and marketing and sales
4A Fisher exact test was calculated for these difference between male and femalemanagers. This gave a significant difference p = .0003 between male and female man-agers in terms of who fell into the endangered positions. Admittedly, the determinationof endangered positions was a post-hoc subjective judgement. Nonetheless, the result isso strong that a few miscategorizations would not have changed the general result.
183

managers overlapped in the way that working in the marketing and sales
areas, also explains similarities in the beliefs of multi-lingual managers.
This hypothesis was checked by calculating first order partial correlations
between closeness to the central map in cluster D, being multi-lingual, and
working in the marketing and sales areas, although being multi-lingual
did not correlate with working in the marketing and sales areas in my
sample (r = .29, p = .13). The distance from the central map in cluster D
correlated with working in the marketing and sales areas and the distance
from the central map in cluster D correlated more with being multi-lingual
after controlling first for language knowledge and than for functional area
(r = .038 p = .059; r = .38 p = .058 respectively). These findings suggest
that working in the marketing and sales areas does not explain why multi-
lingual managers have more similar beliefs to each other than to others.
It also might be the case that speaking foreign languages could explain
similarity in managerial beliefs on its own merit. Communication between
those managers who do not speak each others languages but can find a
common foreign language to communicate might be easier and faster than
among those who have to use interpreters for communication. It also might
be the case that those who have learned fluently at least one foreign lan-
guage would have a more open outlook and understanding towards foreign
cultures than those who did not.
Another possible explanation is based on the cross-correlation table
where being multi-lingual negatively correlates with lengths of time at the
company (r = −.36, p = .067). Since the time spent at a company by
managers also correlated substantially with being female first order partial
correlations were calculated to see whether there is a relationship between
being at company, being female and being multi-lingual. No considerable
correlation was found between being female and being multi-lingual after
tenure was controlled for. Surprisingly however, after controlling for the
language knowledge, being female and being at company showed a sub-
stantial correlation (r = .59 p = .065) and also language knowledge and
184

being at the company showed a substantial negative correlation (r = −.41
p < .05). This finding implies that the multi-lingual managers were the
ones who were relatively new to the company and these new managers
seemed to develop more consensus in their beliefs compared to those man-
agers who had spent a longer time in the company. One could speculate
that the effect of gender, the length of the time spent in the company, and
language knowledge are the surface level appearance of the problems which
relate to the speed of adjusting to change. One might find more consensus
in the business beliefs of those managers who adjusted to the change more
quickly which is likely to be from those managers who were multi-lingual
and were relatively new at the company (which happens to correspond with
being male).
7.9.3 The effect of education specialisation
The general argument, discussed regarding company A (in section 5.9.2),
which explained the finding that technical people have similar beliefs in
terms of the nature of the field (scientific mindset, ease of transfer of
knowledge in this area), would predict the same finding in every company.
However, our failure to find this universally suggests that we should look
for an explanation which depends on particular facts about the particular
organisation. Given that in the company those with technical education
tend to be Hungarians first order partial correlations were calculated to see
the relationship between technical education, Hungarian nationality and
being close to the central map in cluster B. After controlling for the latter
substantial correlation was found between being Hungarians and having
technical education (r = .46, 0p = .004). No substantial correlation was
found between technical education and being close to the central map in
cluster B after controlling for being Hungarian. This suggests that techni-
cal education by itself did not explain similarities in managerial beliefs, but
rather this was a joint effect of being Hungarian and also having a tech-
nical education. When looking at the central map in cluster B to which
185

these managers seem to be close it is interesting to see that this central
map covers a range of issues beside technical and production issues which
suggests that these managers acknowledge the importance of a broader set
of issues in the success of their company.
7.9.4 The effect of functional area
In this company working in the marketing and sales areas had a relatively
strong influence on the similarities in managerial beliefs as was also sug-
gested by the managers themselves. It is not surprising that central map D
to which the CMs of these managers are close to reflect an overwhelming
marketing orientation which these managers seemed to share. The strong
marketing orientation of these managers is also likely to relate to the strong
effort in company C to shift the company from a production and technology
driven company to a marketing and sales driven one.
Given that those who were multi-lingual, those who had experience in
several functional areas, and managers who worked in top positions were
also close to the central map in cluster D, first order partial correlations
were calculated between these factors. These partial correlations showed
that these factors influenced how close the CMs of managers were to the
central map in cluster D largely independently of each other which sug-
gests that these overlapping groups of managers recognised the substantial
importance of market related issues to the success of the company.
7.9.5 The effect of position
As was also suggested by the managers during the interviews those who
occupied top positions showed similarities in their business beliefs. Because
strategic decisions were made on the top level but these often failed to be
communicated to the lower levels managers in the top were likely to have
a more clear picture about the goals and means of their organisation than
those on the lower levels. As one of the major strategic decisions was to
change the orientation of the company it is not surprising that the top
186

managers tended to agree on the importance of market related issues and
so their CMs tended to be close to the central map in cluster D.
7.9.6 The effect of age
Interestingly, in this company age did not show a substantial correlation
with time at company. This was because in company C those foreign
managers who were sent to restructure the company were not on average
younger than those Hungarians who worked at the company. The influence
of age on similarities in managerial beliefs therefore could not be attributed
to national differences. One surprising finding was that age showed a nega-
tive correlation with functional diversity (−.457, p = .016). This suggested
that younger managers worked in more diverse functional areas in their
career than the older managers who tended to work in a given functional
area. It is interesting that younger people tended to be close to central
map A within which management was attributed a relatively strong in-
fluence on the success of the company. This finding might suggest that
young managers tend to believe that the quality of management can make
a substantial difference in an organisation.
7.9.7 National differences
As with the other companies investigated so far, nationality did not seem
to have substantial influence on the similarities in managerial beliefs. The
main effect which nationality seemed to have was that those Hungarians
who also had technical education seemed to have more similar beliefs to
each other than to the rest of the managers. This did not mean however
that there were no obvious style differences between the Hungarian and
foreign managers which were salient enough that they may explain why
so many managers talked about national–cultural differences. One of the
Hungarian managers for example was very annoyed that the foreign man-
agers never knocked on his door before they entered his room. Several
suggestions could be made as to why these behavioural differences existed
187

between the Hungarians and foreigners, including different notions of pri-
vacy or that the foreigners were making an effort, by ignoring closed doors,
to make Hungarians understand that they have to follow an open door pol-
icy. The particular Hungarian manager agreed with the latter explanation,
but also said the following:
Some of the foreign colleagues thought that if they leave their doors
open they are open. But whether you are open depends on your
thinking and not on your door. I, for example, also leave my door
open except when I [write] but it is not my door which makes me
an open person.
188

Chapter 8
Company D: Uncommonlygood
8.1 The acquired company
D is a company in the food industry which specialises in biscuit, confec-
tionery, and wafer production. It is located in a large town in Hungary
which is approximately 150 km west of Budapest. The company was ac-
quired by a British company U in 1991 when the foreign partner bought
84% of its shares. According to the original privatization contract U had to
pay 8.1 million pounds for the 84% of the shares and it promised to invest
and additional 3.5 million pounds into the company. Four percent of the
shares were offered to the employees of D under very favourable conditions
and the regional authorities received 12% of the shares for the land on
which the company stood. In 1993 U managed to increase its ownership to
96% by buying the shares from the local authorities.
At the time of the study (May–June 1993) the number of employees in
the company D was 1500 and has not changed substantially since then. The
company was a profitable one and made around 470 million HUF in 1992.
Most of the products which D produces are sold in the Hungarian market
with only 6–7% of the return on sales originating from export (down from
8–10% at the time U acquired the company).
D operated in three plants. The biscuit, wafer and a large part of
the confectionery production was at the same location as the Hungarian
189

headquarters. In addition to this plant there was a newly-built crisp factory
in the same town as the headquarters and there was another plant in a
small village called J. In the latter plant various products were produced
or processed including coffee, confectionery, salted peanuts and powder
products (pudding powder etc.). The crisp factory is a modern building
which was the first large investment of U in D and the staff were selected
from the youngest employees of D (most of whom were in their twenties
or early thirties). Thirty-two employees worked in this factory of whom 17
worked directly on the line.
At the time of the fieldwork there were serious problems surrounding
the plant in J, because many of the products did not fit into the profile
of U. The management of D tried to solve this problem by forming joint
ventures (JVs) with other foreign companies to operate the machines and to
ensure the employment of those employees involved in these products. The
machines were handed over to the JVs, while the employees were contracted
out to the JVs but still remained employed by D. The management of D
found it problematic to deal with these employees and wanted to transfer
them directly to the JVs. However the employees insisted on staying in
D. They were afraid that the foreign partners in the JVs wanted only to
exploit the short term possibilities of these JVs and then close them down.
The employees were worried about losing their jobs especially because the
plant provided the only industrial employment in J.
8.2 The history of the company
Company D had been established in 1900 as a privately owned company.
It went public in 1931 and remained a share holder company until 1950.
After 1950 the company was nationalised under the name of D. In 1963
D merged with a large state owned conglomerate, as part of the state-
initiated mergers of companies with similar profiles (see section 4.1 for
details about these mergers), and it worked as part of this conglomerate
until 1981. As part of the large conglomerate D suffered from a shortage
190

of investment resources. State officials wanted to achieve full employment
all over the country and for this purpose required big conglomerates to re-
distribute their resources to plants which operated in the underdeveloped
Eastern part of Hungary. As D operated in the relatively developed North
Western part of Hungary where full employment had already been reached
by that time, resources were constantly taken away from the company to
be invested somewhere else. D only received resources which were abso-
lute necessary for the maintenance of its technology but not for further
development. D split from the conglomerate in 1981. Despite the insuffi-
cient investment which the company had received while it was part of the
conglomerate, D managed to reach profitability from the first year of inde-
pendence. Honouring this achievement the company was awarded the title
of “Company of Excellence” by the state in 1982, in recognition of which it
was also given a 440 million HUF state loan in 1982 under very favourable
conditions. The importance of such a loan is illustrated by the fact that
it required the signature from officials in 6 ministerial level governmental
organisations (Fazekas, 1992).
Since 1981 D has maintained an increasing level of profitability. From
1984 the company belonged to those ones where the main ownership rights
were transferred from the state into the hands of the company council as
described in section 4.2. The management and the other members of the
company council of D lived very much for the company and were highly
concerned with its development. They turned as much profit as possi-
ble into investment even at the cost of giving smaller wage increases and
bonuses to themselves and to the employees. One of the Hungarian man-
agers described the situation the following way:
The Hungarian management who had been working at the company
for 15–30 years has always been tied emotionally to this company.
We invested a lot of effort into it. We did not pay bonuses after the
profit for 10 years despite the fact that we were always profitable.
We put every forint into investment, never paid excess wages. We
191

did this just to save money for investment.
8.3 External conditions
After the ownership rights were handed to the company council the com-
pany maintained independence from the state and political organisations.
Also the company did not depend on the banks like many Hungarian or-
ganisations since it did not have any loans. It even had extra money for
financial investment.
What really affected D was the changing relationship with its cus-
tomers. In the previous system D sold its products through ten wholesale
companies so the company did not have direct contact with its customers.
The management of company D had good connections with the wholesalers
so it did not have to worry about non-payment. In the shortage economy
the company also did not have a problem with the low quality of customer
service which these wholesalers provided, given that the customers did not
have other options. The import liberalisation, however, increased competi-
tion which meant that this poor customer service could not continue. The
management of D realized that the changed situation required a new ap-
proach and decided to build up a marketing and sales force which would
deal directly with each retailer. The new marketing and sales force were
able to provide better services to the customers, but given that it had to
deal with 120 retailers non-payment became more frequent. Reacting in
time to the changing requirements of the market the company was able
to maintain a high market share (more than 50%) in its basic products
(biscuits, confectionery and wafers).
The management of the company also had to face a change on the
supplier side. Instead of having a few reliable suppliers now the company
had to deal with several suppliers which put extra requirements on those
who were engaged in procurement and logistics.
192

8.4 The purpose of the partners
Managers mentioned two major reasons why the foreign partner came to
Hungary: (1) it wanted to become the largest biscuit company in Europe;
(2) it wanted to gain markets in Eastern Europe, and Hungary proved to be
the most stable country to set up a company in this region. Several Hun-
garian managers thought that U bought D because D was a good company
in the profile of U. The expansion strategy of company U was described as
follows:
Part of their strategy is to expand. At the same time as they bought
us they also bought large companies in Holland, Denmark, and Fin-
land and this process has not ended yet.
The reasons why D went along with the privatization was because
the company council and the management knew that if they did not find
a partner for themselves the State Property Agency will do it for them
eventually. They therefore opted for spontaneous privatization (described
in section 4.3). The executive director of the company described how hard
it was to make this decision. He said:
I would start first with describing the difficulties in this decision.
We became independent in 1981. At that time we were in a very
difficult economic position, but we still worked very hard, so that
we were able to make a relatively large investment in every second
year, so we could improve our production technology, market share
and/or profitability. So, our management and our workers were able
to fully appreciate our independence. Despite all of this we agreed
to the acquisition because we all knew that if we did not select our
partner the government would do it for us. So we pre-empted this
process. . . But we also expected that by having a western partner
we would be able to have access to modern managerial knowledge,
production technology, and computers which would serve for our
further development even more than the few million forints which
we received from the privatization.
193

The company looked for a professional investor who wanted to develop
the company further within its profile. The criteria for selecting a partner
were described by one of the middle level Hungarian managers:
We said that we should look for a partner which did not want to
close down the company but rather wanted to develop it further.
We wanted to have a partner who wanted to produce biscuits. We
also considered when we selected U that it promised not to take out
the profit from the company for five years and that it would not lay
off people for two years. So far all the conditions have been met.
8.5 Characteristics of the company
8.5.1 New techniques, changes
U bought the company in April 1991 but it did not initiate changes un-
til November 1992. Although in this period U sent an adviser to D, his
authority only extended to giving advice. However by the end of 1992 it
became clear to the management of U that the speed of change was not
proceeding in line with the changes in the environment, so they decided
to initiate faster changes themselves. They approached this problem very
carefully. They sent five foreign managers and hired some western trained
young Hungarian managers who were made responsible for introducing the
changes. Since most of these people have worked in D only since November
1992, the changes they initiated were very recent and most of them were
still in progress.
8.5.2 Restructuring
Some of the apparent changes were in the organisational structure, making
the top of the hierarchical pyramid flatter. The size of the top manage-
rial team increased from two to six managers and included the executive
director, the engineering director, the commercial director, the economic
director and the production director. In addition to the five directors the
194

personnel manager also became part of the top managerial team, although
at first she was not granted a directorial position. Of the six, four were
Hungarian and two foreign. The Hungarian managers were the executive
director, the engineering director, the economic director and the personnel
manager. The personnel manager was one of the new recruits. She had
been educated in the United States and was completely bilingual in En-
glish and Hungarian. The economic director was also appointed by U but
she was selected from within the company. The foreign members were the
production and commercial directors.
Along with the extension of the top managerial team there was some
restructuring in certain functional areas. The head of the marketing and
sales department previously did not have directorial status, nor was he
part of the top managerial team. The engineering and production posi-
tions were also only recently separated into two directorial level positions.
Both areas had previously belonged to one director who had formed the
top managerial team together with the CEO. He was now the engineering
director. Although he admitted that being responsible for both engineering
and production was too much for one person to handle, he criticised the
way the production area was taken away from him:
I feel that first they should have asked the opinion of the Hungarian
managers about the planned changes and not just confronted them
with the new facts. There were decisions made which we only learnt
about at the moment when they got implemented. . . Nobody asked
my opinion, despite that they know that I have been a straightfor-
ward person all my life. I feel, that for ten years I had my heart in
this company even though I was not paid well for my work. Now,
I am paid well but my heart is not in the company any more. The
CEO and I ran this company for years and this company was a very
successful one. It never had any problems. . . Now six people run the
company and I might be the sixth one in the row. But I do not feel
that these six people had found the way to work together yet. The
engineering area was pushed aside. They took the production away
195

from me without discussing beforehand this issue with me. But one
of my eyes is crying while the other is laughing. One is laughing
since I agree that one director could not be responsible alone for
two such important areas. But one is crying because I think the
whole thing should had been done differently.
In addition to creating an extended top managerial team and restruc-
turing some of the functional areas there were other changes in the organ-
isational structure. Earlier, for example there were no product manager
positions. Product managers were responsible for the marketing and sales
of the products which were assigned to them. Two of the product man-
agers were British and one was Hungarian. The Hungarian one was in her
late twenties and had gained part of her training in Australia (in fact the
executive search firm who recruited her contacted her in Australia). The
two British managers were responsible for the crisp and biscuits marketing
and the Hungarian manager was responsible for the confectionery. In ad-
dition to these three product managers a sales team was created with 15
new recruits. The new recruits were expected to cover the domestic mar-
ket from September 1993 but at the time of the fieldwork they were only
responsible for marketing crisps. Under the new system the sales managers
were only responsible for selling in the internal market, whereas previously
domestic sales were conducted by the same department as exports. That
U did not concentrate on exports at the moment could be seen from the
fact that they moved the previous head of sales to be the head of export
sales. While the product managers all spoke several languages and were
well trained young people, the new head of the export department did not
speak any languages except Hungarian and had no working experience in
any foreign country.
Parallel with the restructuring process there was a need to define the
authority and responsibilities for the managers. U provided a great deal of
support for educating people in D. However, the education was very spe-
cialised. It only trained people to be able to work better in their strict areas
196

but did not give more universal education. This prepared the managers to
fit better to the new responsibility system which was being introduced.
The new system defined the authority and responsibilities more clearly
than they were before mostly narrowing the area, but often deepening it
as well.
8.5.3 Cost control
One unsolved area within the organisation was cost control. Although on
the top level there was an awareness that costs had to be cut this problem
had not been solved at the grass-roots level. Also, it was not clear yet how
the cost should be allocated which made it difficult to identify cuts. It
was also often not clear who spent what and whether the person spent the
money wisely. One of the foreign managers described this situation:
It was interesting looking at things like cost control. Nobody is
aware what we spent and who spent it and who signed for it. I
wonder sometimes how we make any money. People who spent the
money were not held to be accountable for it.
8.5.4 Production, technology
One of the investments which all the interviewed managers were proud of
was the opening of the new crisp factory. It cost 1 million pounds, but
this money made it possible to build the factory to the most modern tech-
nological standards. The production process incorporated a new “quality
assurance system” which the management of D planned to introduce into
the production of traditional products as well. This was based on a different
concept from the previous quality checking in that the workers themselves
became responsible for the quality of the products and not the quality in-
spection department. The workers were given the production parameters
which they were supposed to keep. They were responsible for comparing
the real parameters with the target and recording the differences and rea-
sons for them. The quality department’s task was to check once a week
197

whether the workers had recorded the same differences as they registered
on that day. In the new system the quality of input materials was also
checked more carefully than before.
In the privatization deal U offered access to its R&D results to D.
This offer made it unnecessary for D to conduct its own R&D activity. U
not only gave access to its R&D results but also provided production and
technology advice service to D through its so-called “Production Advice
Centre” to help D to make its production more efficient.
8.5.5 Bookkeeping
The first thing which changed after the acquisition was the information
requirements. The contract was signed in April 1991 and by July D already
had to send information to U according to the new accounting requirements.
Earlier the books were closed every half year, now they had to be closed
every 28 days. The information also had to be provided in the format
as U requested. A parallel accounting system was therefore introduced to
satisfy the requirements of U and also to meet the Hungarian accounting
standards.
8.5.6 Incentive system
After U bought D the employees received a wage increase as promised to
them in the acquisition deal. The wage increase was less than expected
however. Employees were promised a wage increase each year which at
least kept up with inflation, but only the wages before tax were increased
by the rate of inflation which meant that net wages increased less because
stoppages also increased during this period. This caused some bad feelings
among the employees. Another source of tension concerned the salaries
of the new product and sales managers and the foreign managers hired
by U which were several times more than the rest of the managers’ or the
workers’. In addition D provided western cars to these new managers which
counted as status symbols in Hungary. Although the salaries and wages
198

were kept secret there were several rumours about the amount of money
these people earned. People also saw the cars in the company car park.
One of the changes in the incentive system happened on the shop
floor. The norm system which was widely applied in the socialist system
was diminished. The norms previously described how much product the
employees had to produce and these were treated as a bare minimum. Em-
ployees were usually encouraged to produce beyond the norms and their
wages were tied (often progressively) to them (Haraszti, 1977). Companies
were also expected to increase their norms every year. According to the
new system it was not the norms but the technological conditions which
determined how much product could be produced in one shift. If the work-
ers produced less than the technical conditions made it possible to produce
than it must be because some problem had occurred. But employees could
not produce more than was requested otherwise the quality requirements
could not be kept. So, employees were not expected to compete with each
other to increase performance as was expected in the old system. Instead
of competition, team work was encouraged at all levels of the organisation.
8.5.7 Marketing, sales
One of the challenge which the management of D was facing was to turn
the previously production-driven organisation into a market-driven one.
The first steps in this direction were already made when the product man-
agers were appointed and the 15 member marketing and sales force was
established, but there was still more to do. Under the socialist system D
never had any problem selling its products on the domestic market. D and
another company had basically dominated the market in biscuits, confec-
tionery and wafers and the ten large wholesale companies took 92% of the
product (volume). The main consideration of the company was therefore
to produce enough to satisfy the demands of these customers. The 8–10%
export was not large enough to make the organisation market-oriented.
Introducing market orientation required new ways of thinking from those
199

managers who worked under the old system.
8.5.8 Introduction of the changes
One of the noticeable things in D was that the foreign managers included
the Hungarian managers in the strategy making and change process. The
executive of the company was Hungarian and so was the majority of the
top managerial team. Although U sent foreign managers to key areas (like
production and marketing) it also appointed foreign educated Hungarian
managers to places where it could (for example the personnel manager and
one of the product managers) and kept the forward looking managers, like
the executive director, in their place or appointed them to higher positions
(like the appointment of the economic director). U also seemed to apply
a relatively “gentle” approach towards the less forward looking Hungarian
managers. For example, it took away production from the production-
engineering manager but left his place in the top management team as an
engineering manager. Or the previous head of the sales department was
moved to another (similar rank) position rather than being laid off. U
relied on the top management of D to work out the organisational strategy
rather than imposing it from outside. This was developed with the help of
a western facilitating company. At the end of the data collection period
the top management team was completing the conceptualisation of the
strategy for D and travelled to a meeting in Amsterdam to present this to
the managers of U. By the time of the feedback session (September 1993)
the strategy had been accepted without major changes.
The inclusion of Hungarians did not necessarily mean that U did not
have the means to push forward changes according to their wishes. An
example for this was given by a Hungarian middle level personnel manager:
It is very interesting how they pressure you into the direction they
want you to go. They let you do what you want but then at the
end it will happen as they want. Let me tell you an example for
this. We were looking for a shop floor manager in the crisp factory.
200

We hired a head hunting firm to find the right candidates and then
we went through all the work included in the process of selection.
When we finished with this we introduced the new candidate to U.
But at the end it was not him who was appointed. They paid the
cost so we could play our little game here but in the meantime they
appointed the manager who they wanted to appoint. And I have
seen examples of this behaviour several times.
8.5.9 Changes in the relative positions of areas
The major task in company D was to turn the company from a production
oriented company to a market driven one. Changing the orientation of
the company was still at an early stage as described by one of the British
managers:
It has just started to happen now. The company had been totally
production driven in the past. With the development of the market-
ing department it will be more and more market driven. There will
be a certain learning process to go through though, so that the ex-
isting senior managers in the company will understand the business
mechanism by which market drives forward the business. . .
Although there were some changes in the production area, the mar-
keting and sales areas received most. One of the Hungarian managers
compared the changes in the sales and production sides:
Our production did not change much. . . You can not change the
production much. You can improve the efficiency, which we already
did. You can improve the quality, which we already did. These are
positive changes, but these do not require such a large step forward
as we have to take in the marketing and sales area.
201

8.6 Salient issues identified by the
managers
As in other companies managers were also asked to identify problems and
salient issues within the company. Twenty-two managers were interviewed
as well as having their CMs elicited. Among the 22 managers 5 were foreign
and 17 were Hungarian. Among the foreign managers 4 were British and
1 was Finnish.
The issues mentioned related to the internal changes (4 Hungarian
managers); to national differences (3 Hungarian managers and 1 foreign
manager); and to technical and contextual issues (4 Hungarian and 2 for-
eign managers).
The change-related problems were: the uncertainty of the employees
in plant J (1 Hungarian manager), the differences between the wages and
other fringe benefits of the the newly hired or appointed managers and
the rest of the managers and other employees (3 Hungarian managers) and
changes in the organisational culture (1 Hungarian manager).
The following quote illustrates the feelings of one of those Hungarian
managers who thought that differences in the wages and other benefits were
a source of tension.
. . . a new managerial group was formed here, and I refer now to the
sales managers, who get western cars and huge salaries and other
benefits. Can you imagine this? [This] is a small town and nothing
remains hidden. They have not sold a gramme of product yet, but
they already organised a party which lasted for two days. So, this
causes a lot of tension.
In terms of changes in the organisational culture, one of the Hungarian
managers described the previous organisational culture as one which had
many “family-like characteristics”. Generations of people worked in the
organisation and everybody knew everybody else. She thought that this
family-like environment also had a feudalistic feature. It meant that gen-
202

erations followed the same career path in D and there were no “outsiders”
(people not from the town) in the organisation. This Hungarian manager
also thought the U had a similar family-like atmosphere and it wanted
to maintain this in D as well, but still the feudalistic characteristics were
disappearing (there were many outsiders working at D at the moment).
Concerning the national differences one foreign manager found it frus-
trating that Hungarians insisted on having their own responsibilities defined
and were unwilling to work in teams; and one Hungarian manager criticised
fellow Hungarian managers for respecting more what foreign managers said
than what Hungarian managers said:
If [the foreign managers] said something it was seen by the Hungar-
ian colleagues as being said by those who represent the owners, or
even by those who are not Hungarians. It is true that you cannot
be a prophet in your own country. The shadowy side of all of this
that [the foreigners] are not always right.
One Hungarian manager criticised the foreign managers for not always
recognising that Hungary was a different context where methods which
work in the West might not apply:
They do not always recognise that this is Eastern Europe. U has
always worked in the developed West before. Here the purchasing
power is much lower than in the West. I think that we should apply
different methods here than among the developed market conditions
in the West.
It was striking to see how few managers thought about the problems
as national problems. This may relate to the soft approach applied by
the foreign management and also to the effort which both sides seemed
to make to overcome national differences. For example this was the only
organisation where the majority of the foreign managers made an effort to
learn Hungarian.1 The executive director characterised the effort of the
foreign managers as follows:1In the other organisations studied there was always one or two foreigners who made
203

I feel that they invest a lot of effort to overcome any national differ-
ences. I believe that their presence makes our [organisation] stronger
not only from the professional side but from the side of the organi-
sational culture as well.
Among the technical problems, language problems were mentioned by
three Hungarian and one foreign manager. Even if both the foreign and the
Hungarian managers made an effort to learn each others language it was
still a slow process and made communication difficult. Those Hungarian
managers who spoke English or other languages such as German or some-
times French were in a more advantageous situation to communicate with
the foreign managers than the others. Also, those foreigners who spoke
languages other than English (particularly German) could communicate
better within the organisation. Because of this situation one of the Hun-
garian managers suggested that instead of looking for national differences
in managerial belief, differences should be looked for in the beliefs between
those managers who spoke or did not speak second languages. Among the
Hungarian managers it was a source of tension that those Hungarians who
could not communicate directly with the foreign managers felt vulnerable
to those who could. It made matters worse that it was mostly the newly-
hired managers who spoke foreign languages while those who had worked
at the company for a long time did not. One of the Hungarian managers
who did not speak any foreign languages described the situation:
The managers who have been working at the company for a long
time are not bad professionally but they do not speak any foreign
languages. This situation exposes these professionals to those who
speak foreign languages. So, if a new manager [who speak languages]
wants to work against an old one, s/he could. This causes some
tension.
Another technical problem which was mentioned by one of the Hun-
an effort to learn the language but this usually remained an individual initiative ratherthan a typical approach from the foreign managers.
204

garian managers was that being acquired by an international company in-
creased rather than decreased the bureaucracy in D:
I think many managers feel that in the new organisation making
a decision is more problematic than in the old organisation. The
foreigners do not say that it would be nice to have new technology
or a new factory so let’s have it, but they really plan out everything
very carefully. Our traditional way of making these decision was
that we said: let’s change a production line, so we changed it. Now
it is a kind of step back that we go round and round each issue at
least six times before a decision is made and we have to really argue
for everything which we want. So, it is no wonder that people feel
that it was more difficult to reach a decision now than it was before.
One of the foreign managers was concerned at the limited availability
of services which were often taken for granted in the West. He said:
There are some frustrations. You lack services here which you take
for granted in the UK. If you want an agency to provide some service,
for example, if you just want a simple service, like a case design or
something like that nobody seems to have any contacts, or they may
have just one. You phone that one person up and if he does not turn
up when he says he will, you end up pulling your hair out because
there were very few alternatives.
Another foreign manager found it frustrating that information for de-
cision making was often not readily available:
The lack of readily available information on a regular basis makes
you wonder how people can plan this business successfully without
information. You hear about things such as marketing cost put
against production budgets and you just wonder sometimes what is
the reality.
205

8.7 Analysis of the CMs
The above was the context in which managerial beliefs were formed and in
which similarities and differences of these beliefs are interpreted. The inter-
views suggested that (1) functional area (especially the marketing and sales
areas); (2) language knowledge; (3) national cultural backgrounds; (4) and
age are those managerial characteristics which might influence managerial
beliefs in this organisation. To identify the relative importance of these
and other factors in influencing managerial beliefs the CMs of 22 managers
were elicited. As in the other companies the distance ratios between the
CMs were first calculated and then the Student t-test and the Wilcoxon-
Mann-Whitney test were conducted. In the case of 22 maps, 231 distance
ratios were computed. The results of these computations are presented in
Table 8.1.
A cross-correlation table was also computed among managerial char-
acteristics and between managerial characteristics and central maps (Ta-
ble 8.2).2 Four clusters of CMs were identified (with 7, 6, 3, 6 CMs respec-
tively) which served as a basis for computing the central maps.
In case of cluster-D the nodes which were selected by more than half of
the managers in the cluster and the indegrees and outdegrees which belong
to each nodes are listed in Figure 8.1.
In the central map in cluster D (figure 8.1) the market related issues
were the dominant ones (5, 33, 36, 49). The constructs in the central
map also related to management (21), finance (6), and production (36, 41,
47) issues. It is not surprising that the joint market related issues were
most influential to the success of the company with 51.60 joint outdegree
although these issues were also highly influenced with 51.76 joint indegree.
Figure 8.2 lists those constructs which were selected by more than half
of the managers.
2In Table 8.1 the listed managerial characteristics are the same as in Table 8.2 exceptthat the cross-correlation table also contains how long managers have been working atthe company (At-Comp), their age (Age), and the diversity of managerial experience indifferent functional areas (FuncDiv).
206

Subgroup M Nw Na xw xa σw σa t ZMW
All 22 231 0.742 0.142NA-Frgn 5 10 85 0.514 0.734 0.136 0.144 4.588 3.741DFA-MA 6 15 96 0.573 0.734 0.140 0.141 4.114 3.541Lang-Multi 10 45 120 0.663 0.756 0.134 0.140 3.856 3.516FA-MA 5 10 85 0.592 0.718 0.130 0.148 2.567 2.498ED-Other 16 120 96 0.732 0.750 0.146 0.139 0.935 0.898Pos-Top 6 15 96 0.699 0.727 0.126 0.143 0.694 0.384SEX-Male 14 91 112 0.741 0.733 0.157 0.140 −0.378 −0.700Lang-Mono 12 66 120 0.770 0.756 0.133 0.140 −0.651 −0.723DFA-PE 10 45 120 0.783 0.766 0.130 0.124 −0.760 −0.917ED-Tech 6 15 96 0.772 0.750 0.133 0.139 −0.569 −0.936NA-Hung 17 136 85 0.763 0.734 0.126 0.144 −1.602 −1.181Pos-NonTop 16 120 96 0.759 0.727 0.142 0.143 −1.667 −1.862SEX-Fem 8 28 112 0.780 0.733 0.084 0.140 −1.722 −1.928FA-PE 6 15 96 0.831 0.743 0.116 0.137 −2.342 −2.234
M is the number of Maps, Nw is the number of distances betweenthe maps within subgroups and Na is the number of distances acrosssubgroups (i.e, between maps which were within and outside of thesubgroups). xw is the mean distance between maps within subgroupsand xa is the mean distance across subgroups. σw is the estimatedstandard deviation within subgroups σa is the estimated standarddeviation across subgroups. t is the result of the Student t-testand ZMW is the Z statistic for the variant of the Wilcoxon-Mann-Whitney test.Only subgroups which have at least four members are shown here.In the subgroup names NA is Nationality (NA-Hung is Hungarian,NA-Frgn is foreign), ED is Education type (ED-Tech is technicaleducation, ED-Other is non-technical education), FA indicates cur-rent Functional Area (FA-MA is marketing and sales, FA-PE is pro-duction), DFA is Dominant Functional Area (for subdivision seefunctional area), POS is position (top is a top managerial level andntop is everything else), LA is language knowledge (Lang-multi ismultilingual, Lang-mono is monolingual) and PoS is position (PoS-Top is top managerial position, Pos-NonTop is non-top managerialposition) SEX is gender (which could be Male for male or Fem forfemale).
Table 8.1: Differences in intersubgroup means for company D
207

FAPE
−.3
3DFAMA
.89∗∗∗ −.1
5DFAPE−.5
0∗
.47∗−.5
6∗∗
EDTech−.3
3.3
1−.3
7†
.47∗
NAHung−.4
8∗−.1
5−.6
4∗∗∗.2
8.3
3Age
−.5
4∗∗
.17−.6
2∗∗∗.6
4∗∗∗
.59∗∗∗
.63∗∗∗
AtComp−.6
1∗∗∗.0
0−.6
9∗∗∗.6
0∗∗∗
.54∗∗
.61∗∗∗
.86∗∗∗
FuncDiv−.1
5.3
7†−.1
5.2
0.0
5−.1
9.1
2−.0
0Topman−.0
9.0
8.0
8−.1
5−.1
5−.1
5−.0
9−.3
1.1
1Multling
.59∗∗∗ −.1
5.6
7∗∗∗ −.4
7∗−.5
6∗∗−.5
9∗∗∗−.7
0∗∗∗−.7
5∗∗∗−.1
4.4
7∗
Gender−.1
8−.2
5−.2
5−.1
2.1
7.4
1†−.0
2.1
3−.0
8−.0
4−.1
2
DistA−.1
3.1
2.0
2−.1
1.2
0−.0
0.0
6.0
8.1
1−.1
8−.2
6−.0
1DistB−.3
3−.0
3−.3
2.2
0.1
5−.1
1.2
5.5
4∗∗
.06−.3
3−.2
7.0
9.0
4DistC
.20−.2
5.2
9−.4
2∗∗−.2
5−.3
0−.5
3∗−.5
2∗
.05
.28
.35
.05
−.0
1−.4
0†
DistD−.3
6†
.22−.5
4∗∗
.57∗∗
.10
.61∗∗∗
.45∗
.37†
.07−.1
8−.3
6†
.07
−.0
8−.1
5−.6
1∗∗∗
Mean
.23
.27
.27
.45
.27
.77
42.0
915.3
2.8
0.2
7.4
5.3
6.6
2.8
0.7
7.6
7σ
.43
.46
.46
.51
.46
.43
7.6
312.7
8.1
6.4
6.5
1.4
9.1
7.1
9.1
9.2
4Vars.
FAMA
FAPE
DFAMA
DFAPE
EDTechNAHungAge
AtCompFuncDivTopmanMultlinGender
DistADistB
DistC
DistD
N=
22,† p<
0.1
;∗p<.0
5;∗∗p<.0
1;∗∗∗ p<.0
05
Vari
ab
les
are
as
inta
ble
8.1
,w
ith
the
ad
dit
ion
ofAge
isage
inyea
rs,AtComp
isth
eti
me
spen
tat
the
com
pany,
Gender
isgen
der
(wh
ich
her
em
ark
sfe
male
s)FuncDiv
isfu
nct
ion
ald
iver
sity
,an
dDistA–DistD
are
the
dis
tan
ces
from
the
centr
alm
ap
sin
clu
ster
A,B
,C
,an
dD
.In
the
tab
leth
ose
man
ager
ial
chara
cter
isti
csw
hic
hare
com
ple
men
tary
toea
choth
er(H
un
gari
an
vs.
fore
ign
,te
chn
ical
edu
cati
on
vs.
non
-tec
hn
ical
edu
cati
on
,to
pvs.
non
-top
,m
ale
an
dfe
male
)are
on
lyli
sted
un
der
on
eof
thei
rp
oss
ibil
itie
s.
Tab
le8.
2:C
orre
lati
ons
wit
hdis
tance
sfr
omce
ntr
alm
aps
inco
mpan
yD
208

Figure 8.1 In and out degrees for map cluster-D in company D
Nodes In OutArcs Sum Arcs Sum
3 Strategy 8 (13.78) 8 (19.01)5 Market share 6 (13.75) 7 (10.83)6 Long term profitability 6 (17.75) 6 (12.67)
21 Flexibility 8 (11.99) 8 (21.67)33 Knowing market 7 (11.75) 8 (16.16)36 Quality of products 8 (12.51) 8 (11.86)41 Cost control 8 (12.41) 7 (9.40)47 Efficiency 8 (17.25) 8 (14.00)49 Suppliers 8 (13.75) 7 (12.75)
Among the most frequently selected constructs two related to the mar-
ket (36, 33), two to production (36, 41) and two to management issues (21,
3). Although the most frequently selected issues seemed to be equally di-
vided between production-and market-related issues both constructs which
were categorised as production issues were strongly tied to the marketing
strategy of D, that is that the management of the company planned to
maintain its cost-leader position, in terms of selling cheap products, but in
the meantime they also wanted to increase the quality of certain products
and to conduct a differentiating strategy for these.
A check was also made on how many Hungarian and foreign managers
selected one of the two profit cards to see whether there were national dif-
ferences in this respect. Thirteen managers selected one of the profit cards,
among whom 7 selected the long term profitability card (6 Hungarian and 1
foreign managers), and 6 managers chose the yearly profit card (4 Hungar-
ians and 2 foreigners). Using Fisher’s Exact test no significant differences
Figure 8.2 Frequently selected constructs in company D
(Construct) Most freq. sel. construct Frequency(36) Quality of products and services 17(3) Vision and strategic direction 16(33) Knowledge of needs of company’s market 15(41) Cost control within the company 13(21) Management flexibility 13
209

were found between Hungarians and foreigners in terms of selecting one of
the profit cards (p = .437).
8.7.1 The results
One of the interesting results which was reflected in both table 8.1 and in
table (table 8.2) and received some support from the interviews was that
in D, nationality seemed to be among the most important factors which
influenced managerial beliefs, at least as far as the foreign managers were
concerned. In the cross-correlation table the CMs of the foreign managers
were also close to the central map in cluster D (r = −.61, p = 0.003).
Both tables also suggested that managers who spoke at least one for-
eign language seemed to have more similar business beliefs to each other
than to the rest of the managers which was suggested by the managers as
well. The CMs of the multilingual managers were close to the central map
in cluster D (r = −.36, p = .098).
Both the Student t-test (together with the Wilcoxon-Mann Whitney
test) and the cross-correlation table suggested that working in the market-
ing and sales functional areas had a substantial influence on the similarities
in managerial beliefs in this company. The effect of having the dominant
experience in the marketing and sales areas was similar. The CMs of the
managers who worked in the marketing and sales areas and those who
had their major experience in these areas were close to the central map
in cluster D (r = −.36, p = .097; r = −.54, p = .009 respectively). Not
surprisingly those who worked in the marketing and sales areas had their
dominant experience from these areas as well (r = .89, p < 10−7).
A Pearson correlation was calculated to measure the relationship be-
tween age differences and distances in beliefs. The correlation which was
found was relatively small although the cross-correlation table suggested
that distances of CMs from the central maps in cluster C correlated with
the differences of age among the managers (r = −.53, p = .012). While
the older managers seemed to be close to the central map in cluster C the
210

younger managers were also close to the central map in cluster D (r = −.45,
p = .037). Time spent at the company showed a similar pattern which was
not surprising given that age strongly correlated with this managerial char-
acteristics (r = −.86, p < 10−7).
Although the cross-correlation table showed that those who had their
dominant experience in the production area were close to the central map
in cluster C and far from the central map in cluster D the student t-test and
the Wilcoxon-Mann-Whitney test results did not show a similar importance
of the dominant experience in production in this respect.
The correlation table also showed results between different managerial
characteristics relating to the sample of the managers in company C.3
8.8 Evaluation of findings
8.8.1 National differences
One surprising finding was that D was the only immo in the sample where
nationality played such and important role in influencing managerial be-
liefs while this was also the company where national differences were the
least problematic for the interviewed managers. The striking relative sim-
ilarity in the business beliefs of the foreign managers compared to other
managers could be simply attributed to the small number of foreign man-
agers (five) in D which made it easier for them to communicate frequently
and develop common business beliefs. Another possible explanation could
be tied to the age of these managers. They were very young in absolute
terms (the average age of 33.4 with a standard deviation 3.4) and com-
pared to the Hungarian managers in the company (the correlation between
being foreign and age was r = .63, p = .002). First order partial corre-
3Among the relevant correlations the following ones which were worth noting. Themarketing and sales managers in the sample tended to be foreign (r = .48, p = .023),younger (r = .54, p = .009), spent less time in the company (r = .61, p = .002) andtended to be multi-lingual (r = .59, p = .004). The Hungarian managers were older(r = .63, p = .002), spent more time in the company (r = .61, p = .002), tended to havetechnical education (r = .59, p = .004), and tended to speak mainly Hungarian.
211

lations were calculated to see the relationship between age, being foreign
and closeness to central map in cluster D. It was found that even after con-
trolling for age, the CMs of foreign managers remained close to the central
map which suggest that national background rather than age accounted
for the similarities in managerial beliefs. This however raises the question
of why Hungarian managers reported so few problems concerning national
differences? It could be because foreigners applied a “gentle pressure” and
a shared approach which did not create bad feelings and distrust towards
foreign managers and change. The lack of distrust probably also related to
the fact that there was no scheduled lay-offs in this company so people did
not feel threatened in this respect either.
8.8.2 The effect of language knowledge
Since the cross-correlation table reflects that multi-lingualism was cor-
related with several managerial characteristics, further calculations were
needed to see the effect of multi-lingualism and the related factors on the
relative similarity in the beliefs of managers. A first order partial corre-
lation was calculated to see the relationship between being multi-lingual,
Hungarian and older. There was no substantial negative correlation found
between being Hungarian and being multi-lingual after controlling for age
(r = −.27), but there was a strong negative correlation between age and
being multi-lingual (r = −.51, p = .0020) after controlling for nationality.
The relationship was also calculated between age, being multi-lingual and
working in the marketing area. Again a strong correlation was found be-
tween age and being multi-lingual after controlling for the functional area
(r = −.55, p = .004), but there was no strong correlation between working
in the marketing area and being multi-lingual (r = .35, p = .137). The
relationship between the distance from central map in cluster D, age and
being multi-lingual was also calculated. After controlling for age or multi-
linguality neither the younger people nor the multi-lingual people were
close to the central map in D any more. This suggested that those younger
212
people who were also multi-lingual were the ones who had relatively more
similar beliefs to each other than to other managers.
8.8.3 The effect of functional areas
Working in the marketing and sales area had a strong relative influence on
the business beliefs of the managers in D as it was predicted by the inter-
views as well. This marketing orientation could be best explained with the
emerging market orientation of the company. A first order partial corre-
lation was calculated between nationality, closeness to the central map in
cluster D and working in the marketing and functional area to see whether
marketing and sales managers still tended to stay close to the central map
after controlling for nationality which turned out to be the case. This sug-
gests that marketing managers, independent of their nationalities tended to
be close to the central map in cluster D which central map not surprisingly
suggests an agreement on the importance of the market related issues to
organisational success.
8.8.4 The effect of age
It was discussed above, that age was not very close to the central map in
cluster C after controlling for nationality. The correlation between age and
the central map in cluster C could therefore be attributed to the effect of
foreign managers being younger than the Hungarian managers.
213

Chapter 9
Company E: The surreal thing
9.1 The acquired company
Company E specialises in bottling one of the most famous and well known
soft drinks in the world and other soft drinks licensed by the same Amer-
ican company. Company E was established by company CA through the
acquisition of three large independent companies and three smaller bot-
tling companies and currently employees around 1300 employees. CA is an
Australian company, 51% owned by the American company who developed
and licensed these soft drinks. The first step for setting up E was in May
1991 when CA acquired 50% ownership in the company called BUL which
became the major plant and the headquarters of E. Three months later
CA became the exclusive owner of BUL. The management of the company
was not willing to give out information about the price of the acquisition,
but they stated that CA made large investments (each and every year)
into the company. In 1991 the investment was 28 million dollars, at the
end of 1992 it was 72 million dollars and at the end of 1993 it was more
than a hundred million dollars. Although the company was profitable, this
investment exceeded the profit. In 1991 the profit was 1.2 million dollars,
and 8.5 million dollars in 1992. The acquisition of BUL was followed by the
rapid expansion of the company. In November 1991 CA made an agreement
with company GVS about the transfer of GVS’s franchise territory to E.
This territory included the westernmost part of Hungary giving E control
214

of 63% of the Hungarian market in this particular soft drink. In March
1992 CA also acquired the assets of GVS. In early March 1992 the man-
agement of CA signed an agreement with company BMUV to acquire the
franchise rights in the south east part of the country increasing the market
share to 71%. In August 1992 CA also bought the assets of BMUV. In
the same month CA increased its franchise rights to a territory west from
Budapest. In February 1993 a company in town K joined the franchise
territory. In December 1993 E announced the building a new bottling and
selling plant in town D (Vilaggazdasag, 1993) where the new headquarters
of E is planned.
9.2 The history of the company
BUL, which became the headquarters of E was a large, state owned spirit
company in one of the industrial districts of Budapest. In the second
wave of state-induced mergers in 1971 (see section 4.1) BUL was merged
with a large conglomerate which was responsible for the supply of spirits
and soft drinks in Hungary. It separated from the conglomerate in 1983
and from 1985 it was directed by a company council. BUL had signed
an agreement in 1968 with the American company, who licensed the soft
drink, to produce, bottle and sell it in Hungary. According to this contract
the American company provided the concentrate for the drink, technology
for the production, money for the marketing and the right to use the brand
name. Given the import constraints at that time this was the only way
for the American company to have its soft drink produced and sold in
Hungary. BUL continued producing the drink while it was merged with
the conglomerate but when this was dissolved all of the other plants which
had been part of the conglomerate also started bottling the soft drink. In
1985 BUL conducted a profile clearance activity during which it sold its
spirit producing technology and specialised on soft drink production and
marketing. At the end of the eighties the management of BUL had to face
the problem that the contract with the American company would expire in
215

1990 and that the company would not have the capital to switch entirely
to other soft drinks or change its profile. The company council decided
to pre-empt the disaster by spontaneous privatization (see section 4.3). In
1989 the management of BUL started negotiating with the Austrian branch
of CA about the privatization conditions. At that time CA was already
in Austria and, encouraged by their success there had decided to acquire
the franchise right from the American licensing company to the Eastern
European market as well. The privatization deal was negotiated by the ex-
CEO and the Chief-Accountant of the company. Although the selling price
and the conditions were negotiated secretly some employees of the company
felt that these two managers sold BUL very cheaply for the sake of gaining
personal advantages from the deal. These complaints are consistent with
the stories which were published about spontaneous privatization in the
media (see section 4.3).
9.3 External conditions
The company was positively affected by the change in foreign currency
regulations in 1991. The previous restrictions basically determined BUL’s
production of the drink to the amount of concentrate it could buy with the
limited hard currency it could exchange. From 1991, when BUL signed the
contract with CA, there was no limit on the amount of hard currency that
the company could use.
A major change in the environment of the company was that the im-
port liberalisation and the introduction of laws which made foreign invest-
ment possible increased competition. The major competitors of the world
famous soft drink which were previously excluded from the Hungarian mar-
ket started an offensive marketing campaign for their products. This re-
quired a new approach from the company to maintain its market share by
improving its services to customers and changing it servicing policy. The
company switched from selling its products through wholesalers to direct
contact with the retailers, but this led to problems of non-payment.
216

Other changes occurred on the side of the suppliers. The main com-
ponent of soft drinks in addition to water and the concentrate is sugar.
The Hungarian sugar companies were privatized in a way that the ma-
jority of the sugar production became concentrated in the hands of a few
owners. The sugar companies formed a price cartel and kept sugar prices
so high that even the Hungarian Competition Agency initiated an inves-
tigation against these companies and the companies had to pay a fine in
the end. The high sugar price and the increasing energy prices added to
costs. Given that the customers of E were highly price sensitive, increased
costs could not be passed on to consumers so cutting costs became a major
consideration of the management.
Given that government decisions concerning import restrictions, pri-
vatization of suppliers, devaluation of the HUF and inflation had directly
influenced the company, many managers in E felt that the influence of the
government was still too high and it was still necessary to lobby and ne-
gotiate with governmental agencies. There was however some decrease in
the power of government in the sense that it could not collect the same
amount of information from companies as it did before. One of the Hun-
garian managers described the change in this respect:
It is an important change that when earlier one of the ministry asked
for any kind of data everybody rushed to satisfy the request. Today
the foreign owner does not give out data and treats most of the
information as confidential.
9.4 The purpose of the partners
During the interviews most of the managers agreed that company CA ac-
quired E because: (1) it wanted to be present at the Eastern European
market; (2) its domestic market had become saturated and could not grow
further; and (3) the American licensing company had given the franchise
right to CA for the Eastern European market. They also agreed that CA
acquired those companies which were already engaged in producing and
217

marketing the particular soft drink. One of the Hungarian managers ex-
plained the expansion of CA in the Eastern European markets as follows:
I think that their purpose was to expand in the Eastern European
market which is a new area for them. They managed to buy the
franchise right from [the American licensing company] to Hungary,
and given that they were already in Austria they saw that changes
in this region made it possible to enter, so they tried to expand into
the neighbouring countries. It is obvious that their goal was to gain
market and market share.
There was a relative consensus not only among the Hungarian but
also the Australian managers that the Hungarian companies agreed to be
acquired simply because they did not have much choice: (1) the franchise
right was due to expire; (2) they did not have enough capital to buy new
technology or for future development. As one of the Australian managers
put it:
It was a series of Hungarian companies [that were acquired]. A lot of
small bottlers in themselves. Some were shaky financially. They had
to do something. On the other hand I suspect that the [American
licensing company] held a loaded gun at their heads as well.
9.5 New techniques, changes
9.5.1 Restructuring
After CA acquired the company it sent a managerial team to introduce
the necessary changes in E. The previous management of the company
was mainly put aside and their places were occupied by foreign managers
or newly hired Hungarian managers. In the top managerial team among
the nine managers six were foreign managers (executive director, general
sales manager, country operational manager, MIS manager, general tech-
nical manager and chief finance officer), two were newly hired Hungarian
managers (HRM manager, business development manager) and only one
218

worked previously to BUL (public relations manager). The foreign man-
agers claimed that they came for Hungary just for a limited time. They
planned to restructure the company and train those Hungarian managers
who would replace them. The Hungarian managers, however, complained
that so far there was no sign of an emerging Hungarian management team
who would replace the foreigners. As one of the Hungarian managers said:
In this company it is a major concern that the foreign management
should be able to transfer at least part of the authority and respon-
sibility to a Hungarian management team who should by now wait
impatiently in front of the door. Peter Nagy [an imaginary Hun-
garian manager] should by now know that in three years he will be
appointed to such and such a position if he proves to be good and
he should already go through the proper training for his future task.
There is no sign of this at the moment.
One of the major issues which the management of E had to face was to
create a functioning organisation from several independent companies. At
the time of the fieldwork in the company (September and October 1993)
the company’s structure was still in a fluid form and it was constantly
changing. E did not have a set of by-laws, and the responsibilities were ill
defined. As one of the Hungarian managers said:
There are no by-laws, there is no collective agreement. There are no
internal regulations. . . the operational and functional activities are
not separated.
Another Hungarian regional manager also saw the problem of integrat-
ing the company as an unsolved task. He said:
A company was created with more than a thousand employees which
contains companies with different backgrounds, stage of develop-
ment and cultures. And in addition, the foreign partner also brought
in a new culture. Integrating these is the biggest task which we have
219

to solve. To create communication and information channels, to cre-
ate the organisation itself. . . We still have to look for the barriers of
the authorities. It is very difficult to place yourself as a manager in
the system or place the organisation you direct into the organisation
as a whole. There are daily problems when I have to think whether
I can or can not make a decision. And if I can not who should make
it?
Despite these problems of integrating the acquired companies there
were several major changes which had already taken place in the structure
of E. A network of 14 depots was created around the country organised
on a regional basis, each containing a regional centre and 3 or 4 depots.
There were five regions in the country, including one in Budapest. The
depots were basically storage houses with 17–20 employees. The employ-
ees were roughly divided equally between administrators, stockkeepers and
sales persons. The regional centres were often production sites as well.
Plants were specialised (like putting soft drink into cans or 2 litre bottles)
so there was delivery needed across regions as well.
One of the big developments in the company was the creation of a
new sales network. The company hired and trained around 220 sales rep-
resentatives all round the country who went directly to the retailers. Each
sales representatives visited around 40–60 shops a day to take orders. The
company was able to deliver within 48 hours of taking an order.
9.5.2 Cost control
The management of the company was in a time advantage compared to its
competitors. When the foreign managers arrived their major concern was
to use this time advantage to build up their market in the whole country.
They also wanted to create a competitive sales force before the competi-
tion appeared. It was such an urgent task that the management basically
neglected everything else. This changed with the arrival of the competitors
which redirected the attention of managers to maintaining market share.
220

This required attention to issues like cost control. The competitors initi-
ated priced based competition at the same time that the input materials
and the energy became more expensive. Previously the management of CA
had almost ignored costs, except of keeping down wages and salaries of the
Hungarian employees (compared to other foreign owned companies) which
they were able to do because of the high unemployment. No attempts had
been made to lay off of excess employees although all agreed that was over-
due. As cost control became a major issue, however, lay-offs could not be
postponed any more. As the Australian executive director put it:
For this company to prosper, for this country to prosper, there has
to be change. We employ a lot more people now than we need, and
we have done that because of acquisitions and we haven’t really gone
through the process of determining the exact numbers. We’re in the
process of doing that now. This company when you put it together
is like an old vine: it needs to be cut and trimmed so that it will
grow and flourish again, and that is pretty much what is happening
around the country.
9.5.3 Production, technology
Although the Australian owner invested in new technology and introduced
new production procedures the main investment sources were channelled
into developing a country level sales network. In order to improve direct
consumer service a large amount of investment was put into placing thou-
sands of refrigerated vending machines throughout the country. This was a
substantial cost, considering that each of these units cost more than 3000
Australian dollars. The company also put a few thousand post-mix ma-
chines on the market, which mix the concentrates and sparkling water. In
terms of new technology the company installed a new canned soft drinks
line in their plant in GY. The green field investment was also planned to
contain a modern bottling line.
In the production area there were not very striking changes. The
221

management of the company made efforts to improve the efficiency of pro-
duction and placed higher emphasis on quality. To improve the information
system within the company a computer network was set up in the head-
quarters and between the different plants. An Australian manager was
responsible for making this network effective in improving communication
and information circulation within the company.
9.5.4 Bookkeeping
As with the other investigated companies E also ran a parallel book keeping
system to satisfy the requirements of the parent company and the Hungar-
ian accounting standards. The management of the company only started
placing a higher emphasis on accounting when cost control was placed more
in the centre of attention. As one of the Australian managers said:
Now the focus is on trying to bring in uniform accounting procedures
so we get some ability to control cost as growth in the market places
starts flattening out. [This is] increasingly important to being able
to make profit.
Some of the Hungarian managers thought that the foreign management
did not always consider the Hungarian environment when they introduced
their accounting and finance systems. One of the Hungarian managers, for
example, complained that the Australians introduced an Australian billing
system which could not be used in Hungary. The Hungarian customers did
not want to pay using those bills because the Hungarian tax agency did
not accepted them as tax documents.
9.5.5 Employment policy
After CA gained ownership of E the company experienced relatively high
employee turnover. Several employees left mainly because they were not
satisfied with the wages and benefits. Due to the recruitment of young
managers mainly in the marketing and sales areas, the number of employees
222
did not decrease. Hiring these young people was an intentional policy of the
top management of the company because they thought that young people
would be more easily shaped to the policy of CA. One of the Hungarian
managers described this policy as follows:
I am talking now about sales, which has completely changed. We re-
cruited young people who do not have bad conditioning from a bad
distribution system. This policy has its advantages but also disad-
vantages. The disadvantage is that these people are inexperienced,
but the advantage is that they could be shaped more easily.
While there was hiring in the sales area, the management of the com-
pany had made it clear that there were going to be lay-offs in the future. At
the time of the study the rumour was that the number of employees would
be decreased to around 800 employees. Uncertainty around who would be
laid off created tension within the company.
9.5.6 Incentive system and training
There was some dissatisfaction among the employees with the incentive
system within the company. The wages and salaries were kept at the coun-
try average level which was low compared to other immos in Hungary. The
acquired companies also applied premiums for positive incentives before
the acquisition, and this system was stopped by the new owner. The only
area where there was a substantial improvement in the salaries and benefits
was the sales area. The company, for example, bought 120 western cars for
the use of sales representatives. One of the Hungarian managers described
the situation the following way:
I do not think that anybody would love the sales people here, be-
cause they were the ones who got everything good. They believed
that the sales people are handed everything on a silver platter, which
is true after all, because sales is very important for the company.
The foreign management put a high emphasis on training. The com-
pany supported language training and provided intensive training for sales
223

personnel. The latter was a half year course in the second half of 1993
on customer service which provided a weekly one and a half hour training
session.
9.6 Marketing, sales
The major change in the company occurred in the marketing and sales area.
The foreign managers had always represented a marketing orientation. As
described above, upon arrival their priority was to build up E’s market
and then later the maintenance of this market. Both required a market
oriented approach different from the previous production orientation of the
Hungarian managers. As one of the foreign managers said:
The major issue is the introduction of a market oriented thinking
which did not exist before. The most important change in the com-
pany is that we switch from the priority of the production to the
priority of marketing.
9.7 Changes in the relative positions of
areas
The changes in the priorities of the management improved the position of
those who were working in the marketing and sales areas, while the position
of those who worked in production and other areas were weakened. This
created a great deal of tension and bad feelings. One of the newly hired,
young Hungarian managers described the situation the following way:
I think that towards those who have worked here the requirements
have substantially changed. The importance of production fell back
and their importance fell back with it, given that this was a pro-
duction oriented company. They find it difficult to understand this.
Their anger is directed towards the new group which is rising rapidly.
They are full of complaints against them, like they do not sell any-
224

thing and so on and so on. So, I feel that there is a tension between
the sales and production people.
9.8 Salient issues identified by the
managers
During the interviews which followed the elicitation of the CMs, managers
were asked to identify problems and salient issues which relate for example
to the internal and external changes or to the fact that an international
management team works together.
Twenty-two managers were interviewed among which 8 were foreigners
(7 were Australian and 1 was American).
The problem areas identified related to (1) internal and external
changes; (2) differences in national backgrounds and experiences; and (3)
language problems. There were also managers who did not see major
problems within the organisation.
Eight managers talked about problems related to change. Three Hun-
garian managers thought that the source of problems was that a new or-
ganisation was created from different companies and the top management
had not succeed in integrating them. Two managers thought that the or-
ganisation grew so rapidly that the management was not able to handle the
speed of change properly which was the source of a lot of tension between
different groups. One of these managers said:
The source of the problem is the strategy of CA. It bought six, origi-
nally state owned, companies with existing organisational structures
and employees and it is obvious that when acquiring six companies
there is no time for consolidation, to form a unified organisational
strategy. There is a process of polarisation within the company as a
consequence, between all sorts of groups, such as between Hungari-
ans and foreigners, between Budapest and the countryside, between
top and middle management, between the sales and production ar-
eas, between younger and older employees.
225

Three Hungarian and one foreign managers thought that the incentive
system and the potential lay-offs were the source of tension within the
company. One of the Hungarian managers said:
When I came here the major source of tension was the change in
the incentives system which led to serious employment turnover in
the last few years. Today one of the major questions is the fate
of excess employees. This has caused less conflict so far than the
issues around the incentive system, but laying off the employees in
the future will definitely be difficult.
Fourteen managers mentioned some national related issue as problem-
atic issues. Four foreign and one Hungarian manager thought that Hun-
garians avoided conflict, that they were not ready to express their opinion
openly, and they did not tell the foreign managers if they did not under-
stand a task or instruction. As one of the foreign managers put it:
[One problem is] people’s willingness to always say “yes”, whether
what you say is right or wrong. They always say “yes”, whether they
agree to it or not, whether they understood what was said or not.
You say something very simple, you think it got through, do you
understand it, “yes” and you find out a week later or two months
later that people did not understand it, but they did not want to
say “no”.
The Hungarian manager who shared the above opinion of the foreign
managers explained that the issue was more complex than to attribute
it merely to national differences. He thought that the passivity of Hun-
garian managers had several explanations: mental, emotional, attitudinal
problems, lack of competence and also fear of being laid off.
Two of the foreign managers thought that Hungarians tended to follow
the rules blindly and they perceived their ways of doing things as if it were
the law itself. One of the Australian managers gave an example for this
behaviour:
226
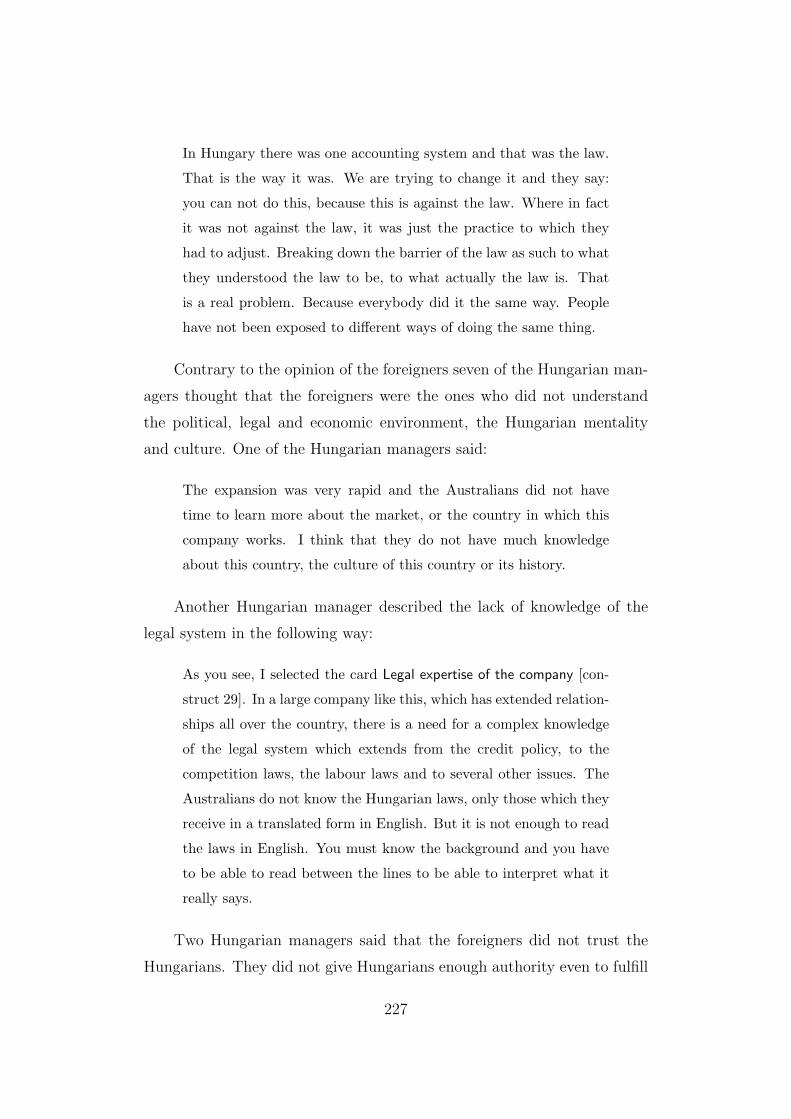
In Hungary there was one accounting system and that was the law.
That is the way it was. We are trying to change it and they say:
you can not do this, because this is against the law. Where in fact
it was not against the law, it was just the practice to which they
had to adjust. Breaking down the barrier of the law as such to what
they understood the law to be, to what actually the law is. That
is a real problem. Because everybody did it the same way. People
have not been exposed to different ways of doing the same thing.
Contrary to the opinion of the foreigners seven of the Hungarian man-
agers thought that the foreigners were the ones who did not understand
the political, legal and economic environment, the Hungarian mentality
and culture. One of the Hungarian managers said:
The expansion was very rapid and the Australians did not have
time to learn more about the market, or the country in which this
company works. I think that they do not have much knowledge
about this country, the culture of this country or its history.
Another Hungarian manager described the lack of knowledge of the
legal system in the following way:
As you see, I selected the card Legal expertise of the company [con-
struct 29]. In a large company like this, which has extended relation-
ships all over the country, there is a need for a complex knowledge
of the legal system which extends from the credit policy, to the
competition laws, the labour laws and to several other issues. The
Australians do not know the Hungarian laws, only those which they
receive in a translated form in English. But it is not enough to read
the laws in English. You must know the background and you have
to be able to read between the lines to be able to interpret what it
really says.
Two Hungarian managers said that the foreigners did not trust the
Hungarians. They did not give Hungarians enough authority even to fulfill
227

the tasks which was assigned to them. They often had prejudices against
the Hungarian managers.
Three Hungarian and three foreign managers saw the main problem
as not knowing each other’s language well. There was a Hungarian course
organised for the foreign managers but most of them gave up learning
Hungarian fairly soon because they claimed that they had no time for it.
They also thought that the Hungarians were not supportive of the language
learning efforts of the foreigners because they laughed at them when they
tried to speak Hungarian. At the same time the foreign managers expected
Hungarians to learn English rapidly which was supported by organised
language courses but sometimes was forced by more dramatic measures.
As an example, one of the regional managers described the meetings of the
regional managers the following way:
Two of the four regional managers did not speak a word of English
but the regional meetings were in English without an interpreter.
If the chap was lucky, he sat next to a Hungarian colleague who
translated for him, but then that Hungarian did not have time to
pay proper attention. It is impossible to follow a meeting when
you have to translate for somebody. There were times when these
colleagues sat through meetings without understanding a word of
what was going on and they did not have a chance to express their
opinions either. What could they do? It was told to them, that yes,
this is a drastic way to force somebody to learn a language. Can
you imagine the mental pressure on these people?
9.9 Analysis of cause maps
The above is the context in which managerial beliefs were formed and in
which similarities and differences of these beliefs should be understood.
During the interviews managers suggested the influence of the following
managerial characteristics on managerial thinking: (1) national–cultural
backgrounds; (2) functional area (especially the sales and marketing ar-
228

Figure 9.1 In and out degrees for map cluster-A in company E
Nodes Arcs In Sum In Arcs Out Sum Out
20 Competition 5 (3.83) 5 (9.33)21 Flexibility 3 (5.00) 5 (4.84)31 Short term profit 5 (8.00) 5 (7.67)41 Cost control 5 (6.64) 4 (5.93)47 Efficiency 5 (7.85) 5 (6.55)48 Distribution channels 5 (5.25) 4 (2.25)
eas); (3) position; (4) age. To see which managerial characteristics are
important in influencing managerial beliefs in this immo 22 managers CMs
were elicited. For analysis, first the distance ratios between the CMs were
calculated and then the Student t-test and the Wilcoxon-Mann-Whitney
test were conducted. In the case of 22 maps 231 distance ratios were com-
puted. The results of these computations are presented in Table 9.1.
In addition a cross-correlation table was also computed among man-
agerial characteristics and between managerial characteristics (Table 9.2).1
Five clusters of CMs were identified (with 5, 4, 5, 5, 3 CMs of managers)
which served as a basis for calculating the central maps.
For clusters A and C where the distances of CMs of managers showed
correlation with managerial characteristics which were found relevant by
the student t-test as well the nodes of the central map and the indegree and
outdegree which were calculated to each nodes are also listed in Figure 9.1
and in Figure 9.2.
In the central map in cluster A (figure 9.1) the constructs are almost
evenly divided between functional areas: two of the constructs relate to
the market (20, 48), two to production (41, 47), two to profit and finan-
cial issues (31, 41) and one to management (21). Considering the largest
joint outdegree the production issues seemed to be attributed the largest
influence.
1In Table 9.1 the listed managerial characteristics are the same as in Table 9.2 exceptthat the cross-correlation table also contains how long managers have been working atthe company (At-Comp), their age (Age), and the diversity of managerial experience indifferent functional areas (FuncDiv).
229

Subgroup M Nw Na xw xa σw σa t ZMW
All 22 231 0.805 0.129DFA-MA 9 36 117 0.751 0.813 0.137 0.130 2.475 2.239LANG-Mono 8 28 112 0.757 0.811 0.122 0.138 1.901 2.209SEX-Male 17 136 85 0.795 0.821 0.127 0.136 1.440 1.615FA-MA 4 6 72 0.707 0.776 0.154 0.133 1.211 1.088POS-Top 10 45 120 0.775 0.796 0.147 0.129 0.914 0.794SEX-Female 5 10 85 0.801 0.821 0.097 0.136 0.441 0.722NA-Oz 7 21 105 0.779 0.798 0.126 0.139 0.594 0.691NA-Frgn 8 28 112 0.790 0.804 0.126 0.136 0.496 0.649ED-Other 13 78 117 0.798 0.804 0.134 0.130 0.342 0.198DFA-PE+RD 8 28 112 0.817 0.811 0.119 0.129 −0.248 −0.076LANG-Multi 14 91 112 0.812 0.811 0.119 0.138 −0.040 −0.184NA-Hung 14 91 112 0.810 0.804 0.124 0.136 −0.371 −0.229ED-Tech 9 36 117 0.820 0.804 0.121 0.130 −0.662 −0.546FA-PE 4 6 72 0.837 0.809 0.135 0.124 −0.520 −0.553FA-GM 8 28 112 0.813 0.793 0.134 0.131 −0.713 −0.677POS-NonTop 12 66 120 0.840 0.796 0.111 0.129 −2.332 −2.165
M is the number of Maps, Nw is the number of distances betweenthe maps within subgroups and Na is the number of distances acrosssubgroups (i.e, between maps which were within and outside of thesubgroups). xw is the mean distance between maps within subgroupsand xa is the mean distance across subgroups. σw is the estimatedstandard deviation within subgroups σa is the estimated standarddeviation across subgroups. t is the result of the Student t-testand ZMW is the Z statistic for the variant of the Wilcoxon-Mann-Whitney test.Only subgroups which have at least four members are shown here. Inthe subgroup names NA is Nationality (NA-Hung is Hungarian, NA-Frgn, NA-OZ Australian is foreign), ED is Education type (ED-Techis technical education, ED-Other is non-technical education), FAindicates current Functional Area (FA-MA is marketing and sales,FA-PE is production, FA-GM General Management), DFA is Dom-inant Functional Area (for subdivision see functional area), POS isposition (top is a top managerial level and ntop is everything else),LA is language knowledge (Lang-multi is multilingual, Lang-monois monolingual) and PoS is position (PoS-Top is top managerial po-sition, Pos-NonTop is non-top managerial position).
Table 9.1: Differences in intersubgroup means for company E
230

FAPE
−.2
2FAGM
−.3
6†−.3
6†
DFAMA
.57∗∗−.3
9†
.14
DFAPE+RD−.3
6†
.62∗∗∗.2
1−.6
3∗∗∗
EDTech−.1
5.3
3.1
4−.5
0∗
.72∗∗∗
NAFrgn
.13
.13−.3
8†−.0
5−.1
8−.4
4∗
Gender
−.2
6.0
3.0
4−.0
1.0
4−.0
1−.4
1†
Age
−.3
0.1
2.5
5∗∗
.06
.32
.03
.05−.0
1AtComp−.1
2−.1
0.3
4.2
5−.1
2−.1
5−.1
6.3
2.3
2FuncDiv
.42†
.29−.2
2.3
2−.0
0−.1
9.1
0−.0
1.2
8.1
7Topman
.04
.04−.1
2.1
7−.3
1−.5
7∗∗
.64∗∗∗ −.0
6.1
4.2
1.2
9Multling−.1
3−.1
3.1
8.0
5−.0
2.2
4−.8
0∗∗∗.4
1−.1
2.0
7−.0
5−.4
5∗
DistA
−.1
3.0
4.3
9†
.10
.29
.23−.1
1.1
0.4
2∗
.20−.0
9−.2
2−.1
4DistB
.30−.2
3.0
4.2
7−.2
6−.4
2∗
.27−.2
4−.1
1.2
0.2
6.3
5−.2
7−.1
5DistC
−.3
9†
.34−.3
3−.6
6∗∗∗
.38†
.32
.04−.0
5−.3
5−.4
6∗−.1
8−.1
7.0
1−.2
8−.2
9DistD
−.1
9−.1
4−.0
3−.0
3−.1
6−.0
7.0
0.3
0.0
7.1
2−.1
4−.2
5.1
8.0
9−.2
4.0
5DistE
.14−.1
9−.1
1.2
4−.3
3−.2
9.0
7−.1
1.0
4.0
6.0
4.1
4−.0
3−.5
0∗−.1
6−.0
0−.1
1
Mean
.18
.18
.36
.41
.36
.41
.36
1.2
339.5
53.1
4.7
6.4
5.6
4.8
1.8
9.7
3.7
5.8
8σ
.39
.39
.49
.50
.49
.50
.49
.43
7.7
45.6
7.1
8.5
1.4
9.1
7.1
4.2
1.2
2.1
7VariablesFAMA
FAPE
FAGM
DFAMA
DFAPERDEDTechNAFr
Gend
Age
AtCompFncDivTop
Multlin
DistADistB
DistC
DistD
DistE
N=
22† p<
0.1
;∗p<.0
5;∗∗p<.0
1;∗∗∗ p<.0
05
Onl
ysu
bgro
ups
whi
chha
veat
leas
tfo
urm
embe
rsar
esh
own
here
.In
the
subg
roup
nam
esFA
indi
cate
scu
rren
tFu
ncti
onal
Are
a(FA-MA
ism
arke
ting
,FA-PE
ispr
oduc
tion
,FA-PE+RD
ispr
oduc
tion
and
R&
D,FA-GM
isge
nera
lm
anag
emen
t),DFA
isD
omin
ant
Fuct
iona
lA
rea
(for
subd
ivis
ion
see
func
tion
alar
ea),
ED
isE
duca
tion
type
(ED-Tech
iste
chni
cal
educ
atio
n,ED-Other
isno
n-te
chni
cale
duca
tion
),NA
isN
atio
nalit
y(NA-Hung
isH
unga
rian
,NA-Frgn
isfo
reig
n),T
opMan
isbe
ing
inth
eto
pm
anag
eria
lpos
itio
nw
hileNon-Top
isth
eop
posi
te,A
geis
age,AtComp
isth
eti
me
spen
tat
the
com
pany
,Gender
isge
nder
(whi
chhe
rem
arks
fem
ales
)FuncDiv
isfu
ncti
onal
dive
rsit
y,an
dDistA–DistE
are
the
dist
ance
sfr
omth
ece
ntra
lm
aps
incl
uste
rA
,B
,C
,D
and
E.
Inth
eta
ble
thos
em
anag
eria
lch
arac
teri
stic
sw
hich
are
com
plem
enta
ryto
each
othe
r(H
unga
rian
vs.
fore
ign,
tech
nica
led
ucat
ion
vs.
non-
tech
nica
led
ucat
ion,
top
vs.
non-
top,
mal
ean
dfe
mal
e)ar
eon
lylis
ted
unde
ron
eof
thei
rpo
ssib
iliti
es.
Tab
le9.
2:C
orre
lati
ons
wit
hdis
tance
sfr
omce
ntr
alm
aps
inco
mpan
yE
231
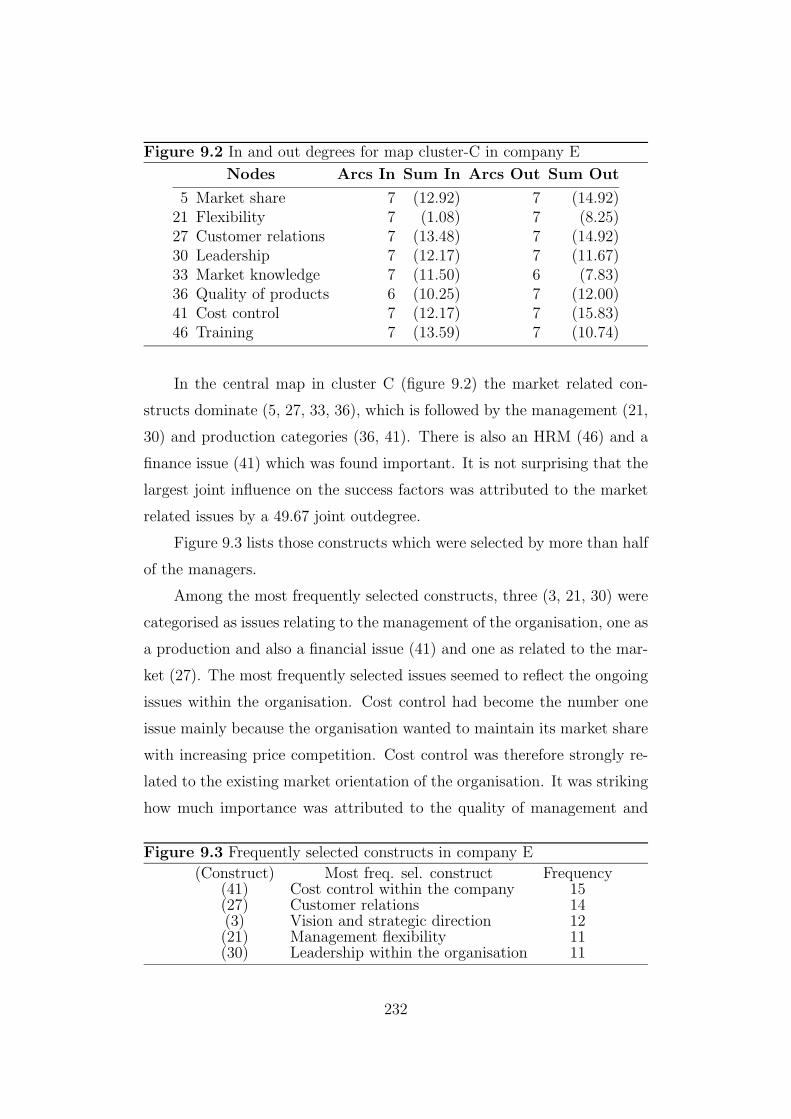
Figure 9.2 In and out degrees for map cluster-C in company E
Nodes Arcs In Sum In Arcs Out Sum Out
5 Market share 7 (12.92) 7 (14.92)21 Flexibility 7 (1.08) 7 (8.25)27 Customer relations 7 (13.48) 7 (14.92)30 Leadership 7 (12.17) 7 (11.67)33 Market knowledge 7 (11.50) 6 (7.83)36 Quality of products 6 (10.25) 7 (12.00)41 Cost control 7 (12.17) 7 (15.83)46 Training 7 (13.59) 7 (10.74)
In the central map in cluster C (figure 9.2) the market related con-
structs dominate (5, 27, 33, 36), which is followed by the management (21,
30) and production categories (36, 41). There is also an HRM (46) and a
finance issue (41) which was found important. It is not surprising that the
largest joint influence on the success factors was attributed to the market
related issues by a 49.67 joint outdegree.
Figure 9.3 lists those constructs which were selected by more than half
of the managers.
Among the most frequently selected constructs, three (3, 21, 30) were
categorised as issues relating to the management of the organisation, one as
a production and also a financial issue (41) and one as related to the mar-
ket (27). The most frequently selected issues seemed to reflect the ongoing
issues within the organisation. Cost control had become the number one
issue mainly because the organisation wanted to maintain its market share
with increasing price competition. Cost control was therefore strongly re-
lated to the existing market orientation of the organisation. It was striking
how much importance was attributed to the quality of management and
Figure 9.3 Frequently selected constructs in company E
(Construct) Most freq. sel. construct Frequency(41) Cost control within the company 15(27) Customer relations 14(3) Vision and strategic direction 12(21) Management flexibility 11(30) Leadership within the organisation 11
232

to the need for strategy within E. Managers during the feed back session
argued that managers had a high degree of discretion in this organisation
given the uncertain situation.
Differences between the Hungarian and foreign managers considering
short versus long term profit orientation were also tested. Nine managers
selected one of the profit cards as one of the ten most important cards, but
after applying Fisher’s Exact Test significant differences were not found in
this respect between Hungarians and foreigners (5 Hungarian and 2 foreign
managers chose the yearly profit card and 1 Hungarian and 1 foreigner chose
the long term profit orientation card).
9.9.1 The results
In company E the marketing and sales functional areas and dominant ex-
perience in the marketing and sales functional areas were the factors which
seemed to influence managerial beliefs the most which was also suggested
by some of the managers as well. These findings were reflected in both ta-
ble 9.1 and in table 9.2 where especially the effect of dominant marketing
area seemed to be strong. Managers who worked in the marketing and sales
areas or had their dominant experiences from these areas tended to be close
to the central map in cluster C. Being mono-lingual showed some influence
in table 9.1 on similarities in managerial beliefs, although this finding was
not reinforced by the cross-correlation table. Table 9.1 also suggested some
effect on managerial beliefs of top managerial position but the effect of this
also did not reach significance in the cross-correlation table, so its influence
is not as uncontroversial as it was suggested by some of the managers.
A Pearson correlation was calculated to measure the relationship be-
tween age differences and distances in beliefs. No correlation was found
in this respect although according to the cross-correlation table younger
managers were closer to the central map in cluster A than older managers.
Those managers who spent a longer time in company E seemed to be closer
to the central map in cluster C. The cross-correlation table also suggested
233

that those with technical education were close to the central map in cluster
B but this was not supported by the results in table 9.1.
The correlation table also showed correlations between different man-
agerial characteristics considering the sample of the managers in company
E.2
9.10 Evaluation of findings
9.10.1 The effect of functional areas
Similarities in the business beliefs between those worked in marketing and
sales areas and those who had their major experience in these areas could be
explained by the market orientation of company E. These managers seemed
to be close to central map in cluster C which reflects a clear agreement
between these managers concerning the importance of market related issues
to organisational success.
9.10.2 The effect of age
In E younger managers seemed to think more alike than older managers
did as it was also suggested by some of the managers in the sample. This
influence of age on the similarities in managerial beliefs could not be at-
tributed to either the effect of national differences (that foreigners were
younger) nor to the shorter time spent at the company which could have
increased the adaptability of managers, since neither nationality nor time
spent at the company showed correlation with age. It seems therefore that
the relative similarity in the business beliefs of younger managers could
be attributed to generational differences. Although less time spent in the
2Considering the correlations between managerial characteristics the following onesare worth noting. The foreign managers seemed to fill the top managerial positions(r = .64, p = .001), tended not to be multi-linguals (r = .80, p < .0001), while theHungarian managers tended to be educated in the technical field (r = .44, p = .042).Also, those managers who worked in the production and R&D areas tended to be, notsurprisingly, educated in the technical field. General managers tended to be Hungarianswhich was consistent with the findings that general managers were not top managers.As in all of the companies there were no foreign female managers.
234

company did not appear to have an influence on similarities in managerial
beliefs, the more time managers spent in the company the more similar
their beliefs became to each other. This could be attributed to growing
experience within the company.
9.10.3 National differences
As with other companies investigated so far, nationality did not seem to
have substantial influence on the similarities in managerial beliefs although
some influence of being Australian was found (table 9.1) which would also
largely explain the effect of being mono-lingual, given that none of the Aus-
tralians spoke any foreign languages. The unconvincing statistical results
concerning similarities and differences of managerial beliefs on the basis
of nationality did not oppose the claim that there are some very obvious
style differences between the Hungarian and foreign managers which might
explain why several managers talked about national–cultural differences as
problematic. These style differences could often cause bad feelings without
the other partner being aware of it. As one of the young Hungarian man-
agers, for example, found that the Australian managers were very impolite
compared to Hungarian managers. She said:
They could be terribly rude. They are here in large groups but they
never make any effort to introduce themselves. There are sometimes
ten or twenty guys wandering around and you do not know who they
are. Well, they must be Australians.
But another Hungarian manager who mostly worked in close daily
connection with the Australians thought that although the differences were
sometimes felt to be big, Hungarian and foreign managers were basically
similar. He said:
Our [the foreign and the Hungarian managers] way of thinking is
roughly 95% the same since we are all human, but that remaining
5% still means a lot.
235

Chapter 10
Cross-organisational findings
The previous five chapters investigated how different managerial character-
istics influenced managerial beliefs about organisational success within five
immos. The changes and the salient issues within each organisation were
also described as were the contexts within which similarities and differences
in managerial beliefs were formed. This part investigates whether the rel-
ative importance of managerial characteristics in influencing managerial
beliefs corresponds to particular similarities and differences in the context
of the five investigated immos. With this method it is possible to uncover
whether certain organisational characteristics entail a relatively high in-
fluence of certain managerial characteristics on managerial beliefs. It may
also be seen whether explanations for the relative importance of managerial
characteristics drawn in each organisation hold across other organisations
as well.
Traces of the existence of “industry recipes” (Spender, 1989) are also
looked for (section 2.4), namely whether in those circles of organisations
which belonged to the same industry managerial beliefs were more similar
to each other than to those of managers in different industries.
The question of whether there were substantial differences between
managers in the issues they selected as the ten most important ones for
the success of their organisations based on their national or functional
backgrounds is also discussed (section 2.1). Similarities and differences in
this respect might give support to the importance of national differences in
236

identifying main issues about business (e.g., Schneider and de Meyer, 1991)
and to the existence of similarities in beliefs among certain professional
groups as opposed to others (e.g., Child, 1982). Differences in construct
selection based on differences in the national backgrounds or functional
areas of the managers are also related to the descriptions which were given
about these managers during the interviews.
10.1 Comparing companies
As explained in section 3.2 the cross-company comparison comprised two
steps: first in each organisation the relative importance of managerial char-
acteristics was established; and then this was compared with the similarities
and differences between organisations.
To make this comparison first similarities and differences between or-
ganisations are identified based on their characteristics, the changes which
took place in them and the salient issues which were mentioned in them.
10.1.1 Company characteristics
Characteristics A B C D ESector manuf. manuf. food food foodSet-up acq. JV/acq. acq. acq. acq.Mkt. orientation exporter exporter internal internal internalMarket
before immo competitive — monop. monop. monop.Foreign parent US US US UK USPrivatization by bank - spont. spont. spont.Profit loss loss profit profit profitPurpose of market market market market market
frgn part. cheap input cheap inputPurpose of capital capital capital capital capital
Hungarian techn. techn. techn. techn. techn.partner expertise expertise expertise expertise licence
Table 10.1: Company Characteristics
Characteristics of the investigated immos based on the case studies
in the previous chapters are summarised in Table 10.1. Considering the
237

Changes A B C D EDominancea foreign Hung. foreign Hung. foreignCost control problem efficient problem problem problemProduction new factb new fact. prof. clear new fact. new fact.Technology part new new part new part new part newBookkeeping parallel parallel parallel parallel parallelEmployment laying off hiring laying off hiring laying offPref. in hiring prod. sales sales sales salesWages ab.avc ab.av. ab.av. ab.av. averageRel.Incentives prod. sales sales sales salesOrientation prod. sales sales sales salesTraining yes yes yes yes yesChanges forced shared forced shared forced
aDominance was calculated based on who has majority in the key positions (e.g.,executive director and those managers who are one level down to him/her). Keypositions are dominated by the foreign (Hungarian) partner if the majority ofthe top management team is foreign (Hungarian) or if the number of Hungarianand foreign managers are the same in this team, but the executive director isforeign (Hungarian). bNew fact = new factory. In company A there was also aprofile clearance. cAb.av. = above average.
Table 10.2: Company Changes
238

organisational characteristics with discriminatory power the following sim-
ilarities and differences were found across organisations:
1. A, C, D, and E were acquisitions of previously state owned large
organisations, while B was first formed as a joint venture between a
Hungarian and an American company and then it was acquired by
the foreign parent.
2. Three organisations were in the food industry (C, D and E) while
two organisations were in the manufacturing industry (A and B).
3. Three of the four organisations which existed before the formation
of the immos (C, D and E) had always been oriented to the internal
markets, while A had always been on a competitive international
market. Those investigated organisations which were oriented to the
internal market enjoyed a monopoly position in the previous system.
4. Companies C, D and E were privatized by spontaneous privatization
while company A was sold by the bank which held the shares of
the company. Company B is a special case, given that it first was
established as a joint venture and then the Hungarian partner sold
off its shares to the foreign partner.
5. Companies A and B were not profitable although the huge loss pro-
duced by company A in 1992 cannot be compared to the slight loss
of company B. Companies C, D, and E were profitable although the
management of C was fighting declining profitability at the time of
the fieldwork.
10.1.2 Changes which took place in immos
The changes which took place in the immos after the foreign partner ac-
quired them are listed in Table 10.2 on the page before. An exception is
B where the columns contains those measures which were taken after the
joint venture was established.
239

Key similarities and differences between immos in the sample in terms
of these changes were:
1. In three immos (A, C, E) the key positions (including the position
of the executive director) were dominated by foreign managers which
meant that they held the majority of top management positions, and
in two organisations (B, D) the top management was dominated by
Hungarian managers.
2. In four organisations improving cost control was still a major issue
(A, C, D, E) while in one organisation (company B) cost control was
already efficient.
3. In two of the companies the foreigners had profile clearance in pro-
duction (A, C), while in four companies (as there is some overlap
in these respect) the foreigners extended the production capacity by
opening new factories (A, B, D, E).
4. Three companies were involved in dismissing employees (A, C, E)
while two organisations were hiring employees (B, D) (in both cases
net laying off and net hiring were considered);
5. Four immos gave preferences to hiring in the marketing and sales
areas (B, C, D, E) (even those companies who were laying off overall)
while A gave preference to hiring employees in the production and
R&D areas.
6. Four companies (B, C, D, E) gave higher salaries and benefits to those
people who worked in marketing and sales while one organisation (A)
gave higher incentives in the production and R&D areas.
7. In three of the companies (A, C, E) changes were forced through by
the foreign partners while in two companies (B and D) Hungarian
managers were included in the changes and in the strategy making
process. D was even a special case because in this company the
240

foreigners applied a more gentle approach than in any of the other
investigated companies.
10.1.3 Salient issues within the companies
Managers were ask about the problems within their immos during the in-
terviews. A list of these problems was prepared for each company and
similar problems were placed under broader labels as is accepted practice
in content analysis (see for Miles and Huberman (1984)). If at least two
managers found it important to mention issues as problematic which fell
under the same general label then that label was considered as a salient
issue in the given immo. Although this crude method was not able to dif-
ferentiate among issues according to their relative importance it still could
provide a general picture about the types of problems which were raised in
the investigated immos. These issues are listed in Table 10.3.
As may be seen from Table 10.3, company D was the one where the
least types of problems were mentioned on the basis of national differences
between Hungarians and foreigners while in company B the least types of
general problems were raised. This question will be discussed in more detail
section 11.1.
10.2 Comparing subgroup results
Comparing the relative importance of managerial characteristics in influ-
encing managerial business beliefs across immos the following managerial
characteristics were found relevant as they are shown in table 10.4.
There are several issues which may be noted about Table 10.4. Func-
tional area seemed to be a significant managerial characteristic which in-
fluenced similarities in the business beliefs of managers in each immo. The
only difference in this respect between the companies was that while in A
the beliefs of the production and R&D managers seemed to be closer to
each other than to the rest of the managers, in the other four companies
the sales and marketing people had relatively similar beliefs. The influence
241
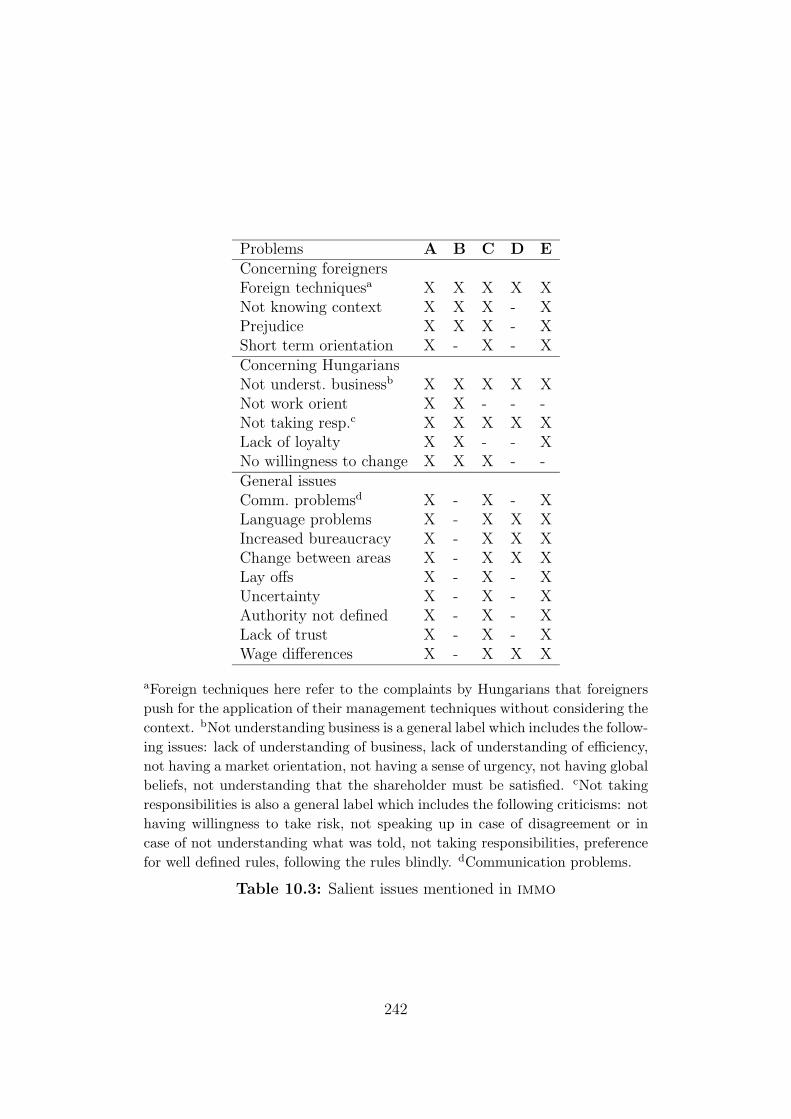
Problems A B C D EConcerning foreignersForeign techniquesa X X X X XNot knowing context X X X - XPrejudice X X X - XShort term orientation X - X - XConcerning HungariansNot underst. businessb X X X X XNot work orient X X - - -Not taking resp.c X X X X XLack of loyalty X X - - XNo willingness to change X X X - -General issuesComm. problemsd X - X - XLanguage problems X - X X XIncreased bureaucracy X - X X XChange between areas X - X X XLay offs X - X - XUncertainty X - X - XAuthority not defined X - X - XLack of trust X - X - XWage differences X - X X X
aForeign techniques here refer to the complaints by Hungarians that foreignerspush for the application of their management techniques without considering thecontext. bNot understanding business is a general label which includes the follow-ing issues: lack of understanding of business, lack of understanding of efficiency,not having a market orientation, not having a sense of urgency, not having globalbeliefs, not understanding that the shareholder must be satisfied. cNot takingresponsibilities is also a general label which includes the following criticisms: nothaving willingness to take risk, not speaking up in case of disagreement or incase of not understanding what was told, not taking responsibilities, preferencefor well defined rules, following the rules blindly. dCommunication problems.
Table 10.3: Salient issues mentioned in immo
242

A B C D ETechnical Education × ×Prod. and R&D DFA ×Prod. and R&D FA ×Prod. FA ×Prod. DFA ×Marketing FA × × × ×Marketing DFA × × ×Male × ×Language knowledge × × × ×Foreigner ×Pos-top ×Age × × × ×
Table 10.4: Which factors matter in which organisation
of dominant functional areas was clearly based on the same grounds as
the influence of functional area on similarities in managerial beliefs. The
latter showed a similar pattern as the functional areas except in company
B where the marketing and the sales area seemed to influence managerial
beliefs the most, although still weakly.
National background was only relevant in influencing similarities in
managerial beliefs in company D which suggests that, considering other
factors, national background was less important. However, when looking
at differences in section 10.3 we will see that there were some differences
in the factors which managers selected as important for the success of the
immos on the basis of national differences.
The remaining managerial characteristics which were found to influ-
ence similarities in managerial beliefs seemed to characterise at most three
companies, except for language knowledge which was influential in four of
the companies but in the opposite direction in two of the companies (in
two companies the multi-linguals had similar beliefs while in the other two
companies it was the mono-linguals) and age which will be addressed later
(in section 11.5).
243

In addition to comparing the relevance of managerial characteristics
across organisations based on their influence on managerial beliefs the in-
fluence of the organisational context was also investigated on the similar-
ities and differences in managerial beliefs across organisations. By using
a student t-test the organisational specificity of the CMs was investigated.
In four of the five organisations (A, B, C, D) the beliefs of managers within
each company were substantially more similar to each other than to man-
agers in other companies. The result of the t-test for companies, A, B,
C, D are 2.58, 1.58, 5.82, 3.87 respectively. Only in company E were the
managers’ business beliefs not more similar to each other than to managers
in other companies. It should be noted, however, that this was the only
company which was not an acquisition of a single company but an amal-
gam of companies which were acquired by the foreign partner over time.
The managers whose CMs were elicited were from these various companies
which could explain the diversity in their thinking.
Among the contextual factors the effect of industry was also calculated.
By using a student t-test (and also a Wilcoxon-Mann-Whitney test) it was
measured whether the CMs of the managers in the same industry were
closer to each other than to the CMs of managers in a different industry.
The result of the student t-test (and the Wilcoxon-Mann-Whitney test)
supported the effect of industry in case of the food industry where managers
showed striking similarity in their beliefs compared to managers in other
industries (t ≈ 10.8, z ≈ 10.59) while this effect of the industry could not
be found in the manufacturing industry (t ≈ 0.08, z ≈ 0.325).
Note, that differences between the business beliefs of managers who
belonged to the food industry compared to managers in the manufacturing
industry was larger than when differences in managerial beliefs was com-
pared across companies (see section 3.7). This suggests that the effect of
industry differences on managerial beliefs was larger, at least as the food
industry was concerned than the effect of organisational differences. A sim-
ilar conclusion was drawn for the effect of industry by Chatman and Jehn
244

(1994) who found less variation in organisational culture within industry
than across industries as discussed in in section 2.4.
10.2.1 Organisational features and managerialcharacteristics
Similarities and differences between organisational features and the effect of
managerial characteristics and industry on similarities in managerial beliefs
are summarised in Table 10.4 and in Table 10.5.1
The information in these tables suggest an interesting connection be-
tween organisational features and the relative importance of managerial
characteristics and industry in influencing similarities and differences in
managerial beliefs. In those organisations which were market oriented, the
beliefs of the marketing and sales managers seemed to be more similar,
while in the organisation with production and R&D orientation the pro-
duction and R&D managers beliefs were more closer. The orientation of
the organisation showed up in their hiring patterns and incentives as well.
The orientation of the companies was clearly evident in the interviews and
in the selection of constructs in each company.
Managers in the food industry seemed to have beliefs which were closer
to each other than to managers in other industry, but given that immos
in the food industry were also similar in other respects it is difficult to tell
which had the largest influence on the result. The three organisations in
the food industry (C, D, and E) were also those which concentrated on the
domestic market, were privatized in the form of spontaneous privatization
and were profitable.
The investigated immos could not be grouped on any other features in
the same way that they were grouped with respect to managerial charac-
teristics, except by age as discussed in section 11.5.
1Note that table 10.5 summarises the information from tables 10.1 and 10.2 alongwhich companies could be differentiated from each other (i.e., it does not contain infor-mation which characterises all companies in the sample).
245

A B C D EAcquisition × × × ×Joint venture ×Food industry × × ×Manufact. industry × ×Improving cost control × × × ×Efficient cost control ×Internal market × × ×External market × ×Monopoly market before – × × ×Competitive market before × –Spontaneous privatization × × ×Outsider’s privatized × ×Profitable × × ×Loss making × ×American partner × × × ×British partner ×Foreign dominance × × ×Hungarian dominance × ×Profile clearance × × × ×Expanded activity × ×Net lay-offs × × ×Net hiring × ×Hiring in sales × × × ×Hiring in production/R&D ×Incentives to sales × × × ×Incentives to production/R&D ×Market and Sales orientation × × × ×Production/R&D orientation ×Forced changes × × ×Shared approach × ×Above average wage × × × ×Average wage ×
Table 10.5: Summary of difference and similarities
246

Who Construct pHungarian 42 Incentives given to employees 0.0060
21 Management flexibility 0.0339Foreigner 48 Quality of the distribution channels 0.0020
38 Your understanding the mentality ofthe host country managers
0.0056
8 Inflation of host country currency 0.015240 Relative valuation of host country
currency0.0152
31 Yearly profit of the company 0.078837 Survival of the company 0.0898
Production 14 The quality of the productiontechnology
0.0027
42 Incentives given to employees 0.0298Marketing 27 Customer relations 0.0002
48 Quality of the distribution channels 0.01285 Market share of the company 0.0569
Table 10.6: Who selected more of which construct
10.3 Construct-selection
The effect of national differences was also investigated on the selection
of relevant constructs for the whole sample of managers (111 managers).
Given that marketing, sales and production areas showed up as important
factors in influencing managerial beliefs the effect of these was also checked
on the construct selection. Fisher’s Exact Test was applied to test differ-
ences between managers with different national backgrounds and between
managers with different functional backgrounds in terms of construct se-
lection. Those constructs which were found to be chosen by significantly
more (or less) members of one of the above subgroups compared to others
at p < 0.10 are listed in tables 10.6 and 10.7.
Table 10.6 suggests that Hungarian managers attribute greater impor-
tance to human issues than the foreign managers (by selecting constructs
42 and 21).
The foreign managers, surprisingly, tended to select constructs which
247
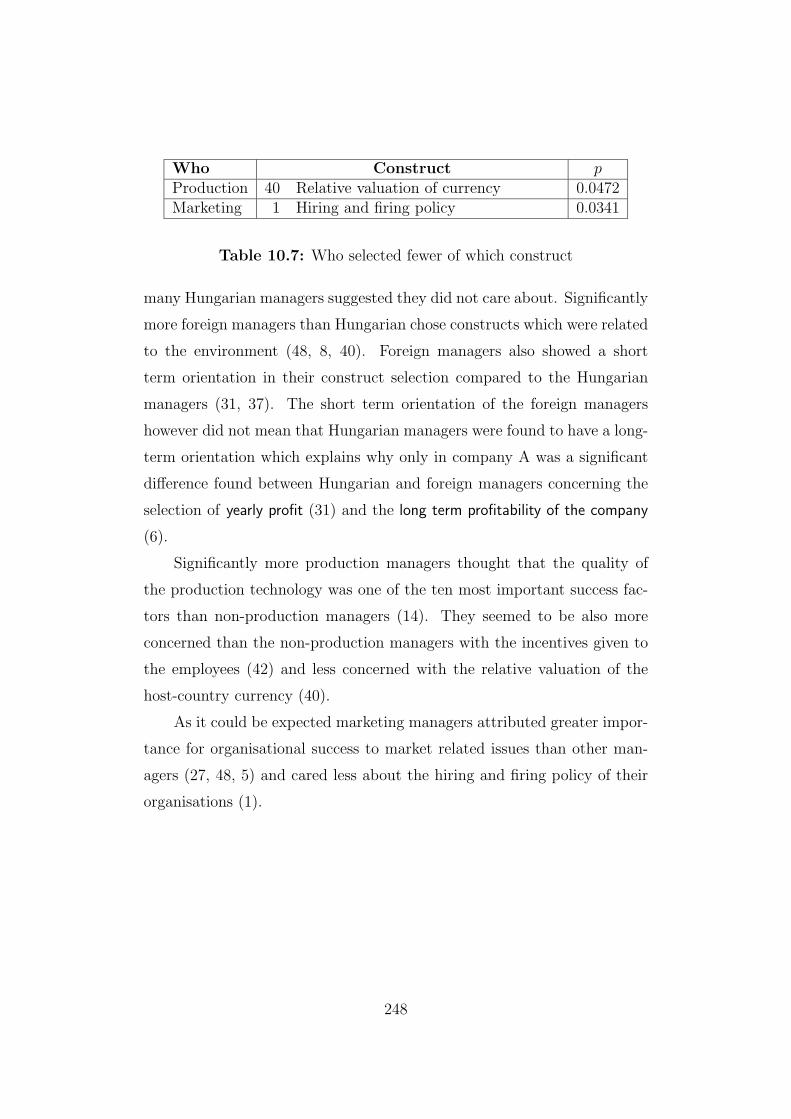
Who Construct pProduction 40 Relative valuation of currency 0.0472Marketing 1 Hiring and firing policy 0.0341
Table 10.7: Who selected fewer of which construct
many Hungarian managers suggested they did not care about. Significantly
more foreign managers than Hungarian chose constructs which were related
to the environment (48, 8, 40). Foreign managers also showed a short
term orientation in their construct selection compared to the Hungarian
managers (31, 37). The short term orientation of the foreign managers
however did not mean that Hungarian managers were found to have a long-
term orientation which explains why only in company A was a significant
difference found between Hungarian and foreign managers concerning the
selection of yearly profit (31) and the long term profitability of the company
(6).
Significantly more production managers thought that the quality of
the production technology was one of the ten most important success fac-
tors than non-production managers (14). They seemed to be also more
concerned than the non-production managers with the incentives given to
the employees (42) and less concerned with the relative valuation of the
host-country currency (40).
As it could be expected marketing managers attributed greater impor-
tance for organisational success to market related issues than other man-
agers (27, 48, 5) and cared less about the hiring and firing policy of their
organisations (1).
248

Chapter 11
Evaluation of the findings
The previous chapter explored whether the relative importance of manage-
rial characteristics corresponded to particular similarities and differences in
managerial beliefs in the investigated organisations. It also compared the
problems which managers mentioned in each immo and investigated dif-
ferences in construct selection between Hungarian and foreign managers.
This chapter evaluates the findings, addresses their theoretical and practi-
cal relevance as well as makes suggestion for future research in this area.
11.1 The influence of national backgrounds
One of the notable findings is that national differences seem to have less
influence on similarities and differences in managerial beliefs than other
managerial characteristics do which goes against the importance which has
been attributed to national cultural differences (e.g., Hofstede, 1991; Baird
et al., 1993) or to the effect of the differences in the system of industrial
governance (e.g., Child and Markoczy, 1993). Studies which concentrated
on national differences inevitably found these differences, but they did not
identify how important these differences were either because they have not
asked this question or because their applied methods controlled for factors
other than national differences. Studies like this one which considered not
only a broad range of managerial and organisational characteristics (in-
cluding national differences) on the business beliefs of managers but their
249
relative importance as well are in short supply. This work, however, does
not contradict the results which show national differences. It merely contra-
dicts the claim that national differences are the most important differences.
Finding national cultural differences less important in influencing man-
agerial beliefs also seems to conflict with the importance that managers
themselves assigned to national cultural differences when they talked about
the sources of problems in their organisations (see table 10.3 on page 242).
In fact, some of the problems mentioned by the managers were consistent
with those culturally related work attitudes which were found of Hungar-
ian managers (such as unwillingness to take responsibility, lack of work
orientation) and of Anglo-Saxon managers (forcing through changes, short-
term orientation, avoiding responsibility) in other studies described in sec-
tion 4.7. This suggests that the problems are culturally rooted. However,
many problems which were raised are also in line with those problems
which characterise all newly formed international joint ventures (see sec-
tion 2.2.2.2), such as conflict of loyalty, screening information, compensa-
tion gaps between employee groups, unfamiliarity with environment of the
host country, communication blockages. (Shenkar and Zeira, 1987). This
suggests that the problems are situationally rather than culturally rooted
even if they might appear differently on the surface.
Furthermore, the concrete company examples suggest a lack of corre-
spondence between the found national cultural differences in managerial
beliefs and the attribution of problems to national cultural differences by
the managers which suggests false attributions. For example, in the inves-
tigated companies, national differences were least mentioned as a problem
in company D where the beliefs of foreign managers were found to be closer
to each other than the rest of the managers. To solve this mystery it was
investigated how this organisation was different from the other investigated
organisations where introducing change was necessary.1 Company D was
different in a sense that the foreign managers applied a gentle, shared,
1These were companies A, C, D, and E which existed before the formation of the im-
mos and required change. Company B will be discussed separately from these companies.
250

“courtship/just friendship” integration approach (see section 2.2.1) for in-
troducing change as opposed to “pillage and plunder” technique (pushing
Western techniques through the organisation). In D the majority of the top
managerial positions were held by Hungarians as opposed to foreigners and
the Hungarian managers were included in the strategy making process. The
fact that in D managers mentioned fewer cultural problems suggests that
those problems which managers in other companies attributed to national
cultural differences might rather be the consequence of a forced approach
to change and foreign dominance as opposed to cultural differences.
The question still remains why D applied a different approach for
introducing change than other companies and why it allowed Hungarian
managers to dominate top positions. National differences still could be
a candidate for an explanation. D is different from the other companies
which introduced change in nationality. While other companies had Amer-
ican partners D had a British partner. As it was discussed in section 4.7,
British managers tend to be more person oriented and tend to care more
about the well-being of their subordinates than American managers do
which could explain why they would chose a shared approach in manage-
ment (e.g., Child and Kieser, 1979; Child, 1981). However, D also differed
from other companies which introduced change in several other aspects as
well which could serve as equally plausible explanations. These are (1) in
D there was no planned lay-offs as in the other companies; and (2) D was
in an earlier stage of introducing change than the other companies were.
Not being afraid of future lay-offs removed tension in D which Hungarian
managers experienced in other companies. But the gentle approach and
the practice of not laying off employees might be reversed if these methods
do not prove viable. As described in section 7.5 in the early stage company
C also left the Hungarian management to manage the adaptation process
of the company to the changing environment and only when this failed
were the Westerners sent to the company to force through more substan-
tial changes. Also, although in D the top managers stated that they did
251

not plan any lay-offs the foreign partners were only tied not to do so for two
years according to the privatization contract. Given that the management
of D has not yet addressed the issue of cost control seriously this situation
may change when cost becomes a major issue.
B was left out of the above comparison because it was a new company,
and its management therefore did not have the task of changing an existing
company to adapt it to the changing context and the needs of the foreign
partner. In this company national differences were mentioned as frequently
as in other companies despite the fact that the foreign managers applied
a shared approach and allowed the Hungarians to dominate key positions
(under the strategic control of the management of GRD Europe). It should
be noted, however, that members of the top management were selected by
the foreign partners and that much of the criticism came from lower levels
from those who did not even have contact with the foreign managers. Given
that the foreign partners were Americans, however, the shared approach
to strategy making and dominance of top positions by Hungarians in B
questions the effect of national difference between Americans and British
partners in choosing a forced vs. shared approach to change. The relative
newness of the company and the lack of pressure of laying off employees
may very likely account for B having the least number of general problems
identified by the managers.
The above suggests that differences between immos in respect to the
problems which were identified seemed to be tied more to the effect of
situational factors than culturally explainable issues. These situational
factors also seem to be interrelated. In those organisations where foreign
partners dominated they also tended to apply a forced approach and tended
to lay off employees. While in those immos were the Hungarian managers
were dominant in the top positions the western partner applied a shared
approach and no lay-offs were applied as can be seen in table 10.5 on
page 246. Finding the coexistence of certain situational factors was possible
when we looked beyond the national cultural explanation. This underlines
252

the validity of applying a “culture free approach” approach (in addition
to the national cultural explanation) for analysis as done by the structural
contingency theory (e.g., Pugh et al., 1969; Miller, 1987).
When national differences were looked for especially by analysing the
differences in the construct selection between Hungarians and foreigners
some notable national differences were identified as described in section 10.3
which seemed to support hypothesis 2.1 on page 53. Four alternative ex-
planations could be considered for why foreign managers tended to concen-
trate more on local and contextual issues than the Hungarians despite the
contrary view of the Hungarian managers in four companies:
1. The foreign managers were being insincere in their construct selection;
2. The problem of understanding and adapting was more salient to the
foreigners, so they were more likely to select such constructs even if
it was not really that important to them;
3. The Hungarian managers were misreporting the orientation of the
foreigners because they didn’t understand or know what the foreign-
ers found important, or they were using the accusation as an excuse
to resist various changes;
4. Everyone was (more or less) correct and sincere in that the foreigners
didn’t understand the local context but placed a high priority on com-
ing to understand it, while the Hungarians recognised the foreigners’
lack of understanding and complained about it.
Explanation 2 can be eliminated most easily by recalling how the con-
structs were selected. As described in section 3.4.2 managers did not know
that the target number in their construct selection was ten. During the
process they deselected the cards explicitly thereby saying that the card
which they eliminated was less important than the remaining cards. Being
confronted with such a task it seems very unlikely that explanation 2 was
applicable.
253
Explanation 1 can also be dismissed (to a very large extent) by the
nature of the selection task. Since managers did not know that they were
selecting a top ten, any insincerity would result in such constructs being
rated highly, but not necessarily in the top ten; while managers often found
the deselection of constructs in the later stages very difficult and did not
want to eliminate anything. Under such conditions it seems that a man-
ager might hold on to an insincerely ranked card until the later stages,
but probably not all the way to the top ten especially if that would have
eliminated a favoured card. Also, as described in section 3.4.3 measures
were adopted in the method to detect insincerity.
This leaves explanations 3 and 4. The interview results suggested that
some Hungarian managers believed that the foreign managers wanted to
understand the local context but were unable to (this is consistent with
both 3 and 4). However the majority of Hungarian managers did not think
that the foreigners cared about the local conditions (which is inconsistent
with 4).
Explanation 3 is supported by the short-term orientation of the for-
eign managers which suggests that they were more aware of the situation of
their organisation than the Hungarians. Although three of the companies
were profitable (C, D, E), in C the profitability was declining and in E the
management had to struggle to maintain the profitability. While foreign-
ers treated the declining profitability or the losses as a serious problem,
Hungarian managers who came from large, state owned companies did not
recognise the danger in this but, as could be expected based on chapter 4,
they hoped that the foreign partners would save the company in case of
bankruptcy as the state had done before.
The foreigners argued, again as suggested by explanation 3, that Hun-
garians took the stand that “Hungary is a different context” because they
did not want to do business in a new way. They preferred to say that this
was the law in Hungary rather than see whether anything could be done
differently. The foreign CEO in company E said that if he encountered this
254

excuse he would always say to the Hungarians that “if the context does not
allow us to do something then it is time to change that context”.
The constructs which the Hungarian managers actually selected indi-
cated that they were more concerned with the incentive system and the
management of the immos than with the context which they mentioned
so often in the interviews. Although the Hungarians expected to receive
Western wages and benefits in the formation of the immos (e.g., Heimer,
1992) their salaries were still far behind the foreigners who worked in the
immos. Also, since foreigners dominated key positions in three organisa-
tions Hungarians attributed more discretion to these foreigners than the
foreigners themselves thought they had.
It seems that differences between Hungarians and foreigners in the
selection of constructs could also be explained by several factors among
which only one is the effect of national differences. These are (1) national
differences (Hungarians did not understand the foreigners beliefs, as expla-
nation 3 suggests); (2) resistance to change (using the excuse of “different
context”, which also fits with explanation 3); and (3) situational differences
(dominance, differences in salaries, differences in goals).
The question still remains why so many managers tend to attribute
so many problems to national differences as opposed to situational factors
when situational factors appear at least as relevant as national cultural
differences. Fiske and Taylor (1991) suggest that the national cultural
background provides guidance for the expected behaviour in a given situa-
tion and also for how the behaviours of the others may be interpreted. This
guidance is applied unconsciously by those who use it and its importance
is only evident when it can not be applied in a different cultural context.
When people with different national cultural backgrounds meet they often
lack the necessary guiding tools for how to behave and how to interpret the
behaviours and gestures of the others and this may be the source of mis-
understanding. Because these problems are important and often sources of
some unpleasantness, people attribute great significance to these cultural
255
differences. Also, resistance towards change could be well justified with
reference to deeply rooted national cultural differences.
11.2 Role of organisational membership
One of the factors which was found relatively important in influencing sim-
ilarities and differences in managerial beliefs was the organisational itself.
Managers who worked in a given organisation seemed to have more shared
beliefs about the factors which influence the success of their organisation
compared to managers outside of the organisation. This shared beliefs
could be attributed to two things. In the one hand, as explained in sec-
tion 3.4.2, as a first step in eliciting the CMs managers were specifically
asked to select those constructs which they saw influential to the success of
their organisations. So, it is reasonable to assume that in different organi-
sations different factors are relevant to reach success. This explanation was
supported, for example, by the large distance of the CMs of the same man-
ager who switched from company B to company E during the fieldwork.
His CMs were elicited twice but in reference of to two different companies
as it was described in section 3.7 which would explain the large distance
between his CMs. Organisational specificity of the CMs also could be ex-
plained by the shared organisational culture in which these beliefs could
be rooted. That this explanation could also have some validity is sug-
gested by the findings that only in company E which was an amalgam of
organisations were managerial beliefs not relatively more similar to each
other. If organisational specificity of the findings were explainable only by
the construct selection procedure, managerial beliefs should be relatively
more similar within company E as occurred with the other organisations.
However, if shared beliefs are also rooted in organisational culture, that
would explain why in an organisation which was newly formed from an
amalgam of organisations managers would not have organisation specific
beliefs given that this organisation probably did not have time to develop
a shared culture yet.
256

11.3 Role of industry recipes
The other contextual factors which was found to be relatively important in
influencing similarities in managerial beliefs was the industry as far as the
food industry was concerned. This suggests the existence of shared indus-
try recipes (considering the limited meaning of industry recipes defined in
section 2.4) in the food industry. Given that these organisations grouped
together in other features as well, however, it is difficult to sort out how
much effect each of these had. It could also be argued that industry recipes
developed because companies in the food industry faced similar issues in
a large number of respects which distinguished them from the other com-
panies. Although one might take the Weickian view (Weick, 1979) that
managers enact their environment by identifying the relevant issues and
acting on their own perception of reality as opposed to acting on the ob-
jective reality – such a perception is likely to be based on the industry
recipes – this identification and interpretation of the main issues could not
be far from the real environmental conditions for long without serious con-
sequences on the organisation and industry performance (Abrahamson and
Fombrun, 1994).
However, if we take the view the managers in the food industry thought
relatively similarly because they faced with similar issues, than we also have
to consider that companies A and B which both belonged to the manufac-
turing industry were also similar in many respects and managers in them
still did not hold similar beliefs. Both of these companies were exporters,
loss makers and were privatized by their owners rather than their company
councils. But these similarities between company A and B covered substan-
tial differences between them: company A worked in the lighting industry
while company B was in the glass industry. Both companies exported to
different markets. B was a newly established company while A was an
existing company which was acquired by the foreign partner. A suffered
from serious losses while B was close to turning into a profitable company;
A had 9500 employees while B was large only in terms of capital not the
257

number of employees which was just 276. These differences between these
companies could explain why shared industry recipes were not found be-
tween their managers while they seemed to exist between managers in the
other three companies. Companies A and B in fact did not even belong to
the same industry considering the definition of industry of Spender (1989)
who categorised only those organisations which held similar recipes into
the same industry.
11.4 Strategic interest
One of the main findings of the research was that in each of the investigated
immos functional area was relatively important in influencing similarities
and differences in the business beliefs of managers.2 A relationship was
also indicated between the orientation of the given organisation and the
functional area which counted as relevant. It was not the orientation by
itself which seemed to matter, however, but rather a change in emphasis
between different functional area as was also implied by several managers
during the interviews. This change in emphasis, which happens through a
longer process, is called here the process of strategic interest. Strategic
interest is important at the time of organisational change when one or a
few areas are given preference in their expansion. The areas which are at
the centre of strategic interest are defined by the managers as the preferred
orientations of the company towards which the organisation is moving or
would like to move. These are the areas of strategic interest. These
areas receive relatively more resources than other areas in terms of finance
and the number of managerial positions. The expansion of these areas is
also likely to be accompanied by a relative increase in the number of em-
ployees and the relatively higher financial and other benefits which are given
to these areas compared to other ones. It what follows “strategic interest”
will be used to refer to the process or the areas depending on context.
2Although company B showed no strong result at all, functional area showed theleast weak effect.
258

Companies C, D, E and partially B show a strong strategic interest in
sales and marketing (see table 10.2). In organisations C, D and E, managers
pointed out that one of the main organisational goals was to change the
previous production orientation of the company to a market orientation.
Company B was different from the three companies in the sense that it
was a newly set up company which, in essence, had a market orientation
from the beginning. However there was a clear shift in the attention of
the management. First the main effort of the management turned towards
setting up the company, and building up the production facilities, which
included hiring people to this area. Only later did they put their main
emphasis on solving marketing and sales issues. Still, because there was
no such a shift in orientations in company B compared to the other three
companies, this could explain why in company B the marketing and sales
managers did not show such strong similarity in their business beliefs to
each other compared to other managers as they did in the other three
companies. The marketing orientation of the managers in the marketing
and sales areas also was clearly identifiable from the central maps to which
the CMs of these managers tended to be close to. In companies B, C, D
and E market issues dominated in these central maps and in three of these
immos (other than D) market issues were considered to have more influence
on other success factors than the other way round.
The management in company A placed its emphasis on functional areas
other than B, C, D and E. This company showed a strategic interest in
the production and R&D areas. Although company A was always more
production and R&D driven than marketing and sales driven – despite
its good results in sales in the Western markets – after the acquisition
production and R&D gained a strong preference compared to other areas.
While the marketing and sales areas were largely moved to the European
headquarters the production and R&D areas received investment resources.
For example, after the general lay-offs it even hired employees, and received
exclusive rights to certain R&D projects from the foreign parent. As a
259

recent development the foreign parents also closed down two of its foreign
plants and moved the production facilities from there to company A. In this
company the production and R&D managers were close to a central map
where the production issues dominated and attributed higher influence to
the production issues on other success factors than the other way around.
From tables 10.5 and 10.4 on page 243 it can be seen that in the four
companies where the strategic interest turned towards the marketing and
sales areas, managers in these areas had relatively more similar beliefs to
each other than to the rest of the managers. In company A where the
strategic interest was in the expansion of production and R&D activities
managers in these areas had relatively more similar beliefs. Although this
finding partially supports Dearborn and Simon (1958) that (some) func-
tional area influences managerial perceptions, this effect was moderated
by the strategic interest of a given organisation in a way that only those
functional areas had relevant influence on managerial beliefs which fell in
the area of strategic interest.
11.4.1 Outline of the Strategic Interest Model
This thesis proposes that what was found of the investigated organisations
is a general property of organisations undergoing changes in their strategic
orientation. The strategic interest process is a dynamic change process
which is realized over time and is often accompanied with conflicts and
power fights in which there are winners and losers. The general model of
strategic interest process is sketched in figure 11.1.
Before the change process starts it is assumed that there is a certain
equilibrium within the organisation between areas. This equilibrium not
only exists in reality, but also in the minds of the managers. All managers
know what the organisation treats as important even if they personally
disagree with that judgement. In the investigated immos, for example,
local managers implied that they once knew where all of the areas stood.
260

Figure 11.1 Strategic Interest Process
Stasis
����Change External fact.�Internal fact. -
Involvement
6
Preferred Area-
6
Recruitment Restructuring Reallocation
? ? ?
Winners/losers�
?-
�
Proposition 1 At the time of equilibrium managers will have a shared
view about what the organisation treats as important.
The change process can be triggered by changes in external or internal
conditions. Among the external conditions, changes in the market con-
ditions might put pressure on the organisation to change its orientation.
Among the internal factors, declining performance, changes in the owner-
ship, or changes in the top managers might trigger reorientation. Among
the investigated immos both the internal and external factors went through
substantial changes which started a reorientation process within the organ-
isations.
Proposition 2 The reorientation process is triggered by identifiable
changes within internal and/or external factors of an organisation.
During times of change managers will see the change as either a threat
261

to their area (which they will try to protect) and/or an opportunity to
promote their area. How much they succeed will be largely influenced by
the changes in the internal and external factors. For example, the increase
in competition is likely to favour the power position of those managers who
work in the marketing and sales areas.
Proposition 3 Changes in the internal and external factors will influence
the selection of the areas of strategic interest within the organisations.
In addition to the internal and external factors an internal political
struggle will also influence which areas end up being included into the
strategic interest of an organisation. This political struggle will end up in
a self-reinforcing loop. Those top managers who are the most influential
ones will be able to push their areas to be included in the strategic interest.
The more they achieve their goal the more power they going to gain. The
more these areas will be accepted as being in the preferred orientation of
the organisation the more likely that middle level managers from the areas
of strategic interest will be included in the decision process because top
managers need to rely for information and decision preparation on these
managers.
Proposition 4 Managers in the area of growing preference will be more
highly represented in the the strategic decision making process then man-
agers from other areas.
The more these managers are included into the strategic decision pro-
cess the more influence they will have on which areas should be included
in the areas of strategic interest and what should be the associated goals
and means.
Proposition 5 Those top and middle level managers who are higher rep-
resented in the the strategic decision making process will have more op-
portunity to include their areas in the strategic interest and influence the
formation of the associated goals and means.
262

The areas of strategic interest, the goals and means will influence the
degree of reallocation of resources, the restructuring of the organisation
and the hiring and firing policy which favour the areas of strategic interest.
Proposition 6 Which areas will be included in the strategic interest,
and the associated goals and means will influence which areas and to what
degree will be favoured in the reallocation of resources, restructuring and
the hiring policy of the organisation.
In the process of resource reallocation and restructuring there will be
winners and losers. This will further enhance or decrease certain groups’ ne-
gotiation positions concerning the inclusion of areas in the areas of strategic
interest, and defining the associated goals and means.
Proposition 7 The reallocation of resources and the restructuring will
favour those areas which are included among the areas of strategic interest.
Proposition 8 The reallocation of resources and restructuring of organi-
sation will increase the power position of those managers who work in these
areas which will improve their chance to influence the inclusion of areas in
the strategic interest and the associated goals and means.
Over time the suggested model will reach an equilibrium, because be-
yond a certain level the winners will not receive additional marginal benefit
to improve their conditions. Also, internal and external conditions will limit
what resources could be reallocated in favour of the areas in the strategic
interest. Beyond a certain degree of reallocation of resources the organi-
sation would not be able to function any more which would not be in the
interest of anybody including those who work in the area of strategic in-
terest. It is reasonable to propose that no-one in the organisation believes
that their area should be allocated all resources and authority.
Proposition 9 As managers in the area of strategic interest gain power
and control of resources beyond a certain point, they will reduce the extent
to which they push for more power and control of resources.
263

It is also possible that managers in areas which have seen a dramatic
decrease their areas importance to a certain level, may perceive their efforts
as more than just a fight for setting the agenda of the organisation as a
whole, but as a struggle for the survival of their area.
Proposition 10 There is a level of preference below which the managers
of the dispreferred area will increase their efforts to retain what little power
and control of resources they possess.
Without propositions 9 or 10, the system would not reach a new equi-
librium, but would feedback on itself until the new areas became the entire
organisation, quickly followed by a collapse of the organisation. In any
particular instance, both or only one the these breaking mechanisms may
apply, depending on whether the “level of preference below which” mention
in 10 is reached before the resources “beyond a certain point” of 9.
11.4.2 Strategic Interest to belief differences
Several potential scenarios could be suggested for the process through which
the strategic interest of an organisation exerts its influence on similarities
and differences in managerial beliefs which was the focus of this thesis.
11.4.2.1 Scenario 1
One possible scenario is based on the assumption that the higher level
involvement in the strategic decision process of those who work in the areas
of strategic interest (see proposition 4) will contribute to the development
of shared managerial beliefs among these managers. Higher involvement
of the decision making process is also likely to increase the understanding
and identification with the goals and means which are formulated in this
process. It also have to be noted that it is easier to identify with goals
and means which give preference to the functional areas in which the given
individual works as opposed to other functional areas.
264

Proposition 11 Those in the areas of strategic interest will develop a
more clear picture and understanding of the strategic goals and means of
their organisation and develop a higher level identification with these than
other managers.
This scenario would explain why managers in the areas of strategic
interest developed relatively more similar beliefs while managers from other
functional areas did not.
11.4.2.2 Scenario 2
Another possible scenario is based on the recruiting policy of the areas of
strategic interest. The expansion of the areas of strategic interest gives
a chance to the organisation to recruit managers whose personal motiva-
tions fit best to the strategic goals of the company. The better fit could
be reached between the personal motivations of managers and the organi-
sational goals the more likely that managers will develop an identification
with the goals and ready to put effort to implement these (Dutton, Duk-
erich and Harquail, 1994).
Proposition 12 Those top and middle level managers will be recruited
to the areas of strategic interest whose personal motivations fit to the new
requirements of the preferred orientation of the organisation.
In addition to external selection an internal selection procedure is pos-
sible. Given the increasing relevance of the areas of strategic interest dur-
ing the strategic interest process the organisation could not afford to leave
those in these areas who do not fit to the new requirements. Therefore,
it is likely that more emphasis will be given in the areas of strategic in-
terest compared to other areas to move those who do not fit to the new
requirements to other positions (as occurred in some of the investigated
immos).
Proposition 13 In the areas of strategic interest an internal selection
procedure will take place which favours those who fit to the requirements
265

of the strategic interest.
It is also expected that there will be relatively stronger pressure in these
areas on those who could not meet the new challenge to resign themselves
and leave the areas of strategic interest or the organisation itself. As the
consequence of the above selection procedures a selected group of top and
middle level managers will be formed in the areas of strategic interest whose
ambitions and beliefs will likely to be relatively similar.
Proposition 14 A selected group of managers will be formed in the ar-
eas of strategic interest whose personal motivations and beliefs will be rel-
atively similar and will have a good match with the organisational goals
and requirements.
11.4.2.3 Scenario 3
The influence of strategic interest also could be realized through a political
process. As proposition 8 suggested the preferred strategic orientation of
organisations increases the relative power positions of those who work in the
area of strategic interest. These managers receive relatively more resources,
are less endangered of being laid off, receive higher incentives and fringe
benefits, are more likely to be included into the strategic decision process
and have more chance to raise into top positions than managers from other
areas (see proposition 6). This higher level of involvement and privileges
is likely to contribute to the formation of an elite group which would draw
jealousy and resentment from those who are outside of the areas of strategic
interest. Those who are within the privileged group will likely to make an
effort to keep their privileges from others because privileges disappear as
soon as everybody have access to them. This attitude may hinder trust
between members of the elite group and those who are outside. The lack of
trust across groups will likely to influence the frequency of communication
and also will likely to constrain it to formal channels. The elite group might
even consider withholding information as a way to maintain its power.
266

Proposition 15 Managers who work in the area of strategic interest may
enjoy privileges which they will try to defend against the outsiders. This at-
titude will break down trust and effective communication between insiders
and outsiders and effectively will isolate the elite group.
Not only the attitude of the insiders, but also those of the outsiders
will isolate the elite group. The jealousy and the resentment of those who
are not part of the elite group can contribute to the breakdown of effective
communication between these two groups. This scenario similarly to the
others would also explain why managers in the areas of strategic interest
develop similarities in their beliefs or even a groupthink (Janis, 1972).
Proposition 16 Managers who work in the area of strategic interest will
likely to enjoy privileges which will meet the resentment of those who are
outside of the area of strategic interest. This resentment will break down
trust and effective communication between insiders and outsiders and ef-
fectively will isolate the elite group.
However, under this scenario it is difficult to explain why no contra sub-
groups were formed along other functional lines which would show similar
beliefs compared to other groups. Still, based on Propositions 15 and 16
we can propose 17.
Proposition 17 Managers in the areas of strategic interest will have more
frequent and effective within group than across group communication which
will lead to the development of relatively more similar beliefs within the
elite group compared to those who are outside of this elite group.
Which of the above propositions (if not all of them) explain the in-
fluence of the strategic interest process on similarities and differences in
managerial beliefs is needed to be tested by future research.
267

11.5 Other findings
Although the area of strategic interest were suggested to be an important
moderator between the influence of functional areas on managerial beliefs
the construct selection by the marketing and production managers also
suggested some direct influence of the functional areas (see tables 10.6
and 10.7 on page 247) which provides support to hypothesis 2.7. According
to tables 10.6 and 10.7 production managers tended to express more interest
in issues internal to the organisation, among them those which related to
the technology and incentives to the employees while cared less about such
external issues as the relative evaluation of the HUF. Not surprisingly,
the marketing managers tended to be more market oriented than the non-
marketing managers. They also worried less about the hiring and firing
policy, which however does not seem to be a specificity of a given function,
but rather relates to the fact that in four out of five investigated companies
hiring took place in the marketing and sales areas while managers in these
positions were not endangered by being laid off.
Among the managerial characteristics which appeared to influence
managerial beliefs, age was a salient factor. It would be very tempting
to attribute this effect to a resistance towards change by the older man-
agers and more flexibility to the younger managers. However, when the
effect of age was investigated in each organisation its influence was more
complex. In company A it was not the Hungarian, but the foreign managers
whose age difference seemed to have an influence on managerial beliefs. In
company C the younger managers showed similarity in their beliefs while
in D both the younger and older managers’ CMs were close to different
central maps. In E the older managers seemed to have more similar beliefs,
but not the younger managers. In most of the cases the calculated partial
correlations suggested that the effect of age could be explained away with
other managerial characteristics (like the national composition of managers
in company A, D, and E). Only in company C was there some suggestion
of the existence of an old guard (especially in the case of female managers)
268

as was suggested by hypothesis 4.3 on page 104. while in company E there
was some implication that older managers showed a technocratic way of
thinking despite spending longer time at the company. There was there-
fore no clear evidence that managerial business beliefs could be divided
along the line of old guards versus technocrats as suggested in section 4.6.
Other managerial characteristics which seemed to be important in in-
fluencing similarities and differences in managerial beliefs characterised at
most three organisations. This suggests that the degree of influence of
those managerial characteristics which were predicted to effect manage-
rial beliefs in hypotheses 2.5, 2.6, 2.9 and 2.10 (page 53 and following)
varies across organisations; and this implies that the relative influence of
the given managerial characteristics on managerial beliefs was tied more
to the specific organisational situation and/or to the personalities within
the organisations than to any generalisable issues. In analysing the results
in each of the case-studies certain explanations were given, some of these
however were not supported by the cross-organisational analysis.
The influence of technical education on the similarities in managerial
beliefs was explained by managers in company A as resulting from the fact
that those educated in a clear discipline could have a more clear cut way
of thinking about issues and this would influence the similarities in beliefs
which they held. Also, Trompanaars (1993, p. 6) argued that technologies
work by the same universal rules everywhere which does not apply to other
managerial methods. He differentiated the logic which was appropriate to
machines (analytic–rational) from a logic more appropriate to social re-
lations (synthetic–intuitive) and assumed more similarities in the former.
However, given that, in addition to A, only in company C was technical ed-
ucation found important in influencing managerial beliefs, this explanation
did not seem to hold generally.
One of the explanations which was made in company A was also that
managers in the production and R&D areas were found to have relatively
more similar beliefs because these were the areas where Western techniques
269

could be transferred with the least difficulty, given that these areas were less
tied to the context. Although it is very tempting to accept this argument
similarities in the beliefs of production and R&D managers were found to
be tied to the strategic interest of the organisation rather than to context
specificity of the given area. If either of these two explanations were correct
than we would expect similar results in all of the companies and not just
in A and C.
In company C similarities in the beliefs of multi-linguals was explained
partially by the more open minded approach towards foreign culture by
those who speak any foreign languages. This argument however was not
supported by the cross-organisational analysis which found that in two
organisations (company A and E) the mono-linguals had relatively more
similar beliefs to each other. But it is interesting to note that in both
companies A and E mono-linguality showed strong correlation with be-
ing foreign which suggests that the mono-lingual, foreign managers were
the ones who showed more similarity in their beliefs compared to other
managers which might be attributed to the difficulty of communication
between this group and the local managers. In those organisations where
multi-linguals had relatively more similar beliefs compared to each other
than to other managers (companies C and D) most of the foreigners were
also multi-linguals. In these companies multi-linguals coincided with the
newly hired young Hungarian managers and with the foreign managers who
had better access to information and more readiness to identify with the
new organisational goals than those senior Hungarian managers who had
spent a longer time in the company and were mono-lingual.
In chapter 4 which discussed the general context of organisations hypo-
theses 4.1 and 4.2 on page 98 suggested that spontaneous privatization
created a different initial relationship between the company and the for-
eign owner than a privatization initiated by the state or by an owner (see
section 4.3). Given that in those companies which were privatized spon-
taneously the Hungarian managers had an influence on the privatization
270

contract, it was predicted that a more shared approach would be applied
between Hungarians and foreigners in these organisations and less dras-
tic lay-offs could be expected than in companies which were privatized by
other methods. Among the three companies (C, D, and E) which were
privatized this way, however, only D applied a more shared approach and
only in this company did employees feel less threatened by being laid off.
No convincing evidence was found therefore for the existence of the pre-
dicted relationship between the modes of privatization and the approaches
of management.
11.6 Theoretical implications
This research made it possible to discover the central role of strategic inter-
est in influencing similarities and differences in managerial beliefs within
organisations. The importance of strategic interest seems to go beyond
the framework of this study. Dividing managers based on whether they
fell into the areas of strategic interest in a changing organisational setting
or not, especially in young immos, might be a better starting point to
understand the sources of differences in beliefs, attitudes, behaviours, the
sources of conflict, the changes in power positions than dividing managers
based on their nationalities and investigating the effect of nationality as the
majority of studies in multi-cultural organisations have done so far (e.g.,
Markoczy, 1993b; Child and Markoczy, 1993; Baird et al., 1993). Strategic
interest might also be a useful starting point in combination with national
differences. For example, it could be a good starting point to investigate
learning, trust, identification and loyalty issues within immos between those
local managers who fall into the strategic interest of the immo as opposed
to those local managers who are left out of the areas of strategic interest.
It could be predicted that those local managers who fall into the strategic
interest of an immo will learn new methods faster, will identify easier with
the organisation and its goals and will develop more loyalty towards the
organisation than those locals who are left out of the strategic interest of
271

an organisation. Shifts in the preferred functional areas might be a useful
category for historical analysis as well. Many changes within an organisa-
tions are likely to be the consequences of redirecting the strategic interest
of an organisation.
The strategic interest concept might be a more fruitful approach to in-
vestigate strategic leadership in countries which are transforming towards
a market economy than the top management team or “upper echelon” ap-
proach. As discussed in section 2.3, research on tmts assumes that major
decisions in an organisation are done by the top management team and not
by individuals. Managers within the tmt are assumed to have equal influ-
ence on the strategic decisions. However, in transforming economies, like
Hungary, some of the managers membership in the tmt is often symbolic
position and does not mean real influence on the strategic decisions. As
discussed in section 4.3 during the time of the spontaneous privatization it
was often part of the deal between the Hungarian top managers and the
potential buyers that some of these Hungarian managers would be kept in
top positions. These symbolic positions, however, were usually not in the
area of strategic interest. Also, managers one level below the tmt, but in
the area of strategic interest seemed to be more influential than those in the
tmt, but outside of the area of strategic interest. Therefore, tmt does not
cover the real strategists in an organisation and it is a more valid approach
to define this team by the area of strategic interest and by position (top
level and one level below) as opposed to merely by position (top level).
This study also highlights that in a multi-cultural organisational set-
ting there are several other factors apart from nationality which could in-
fluence managerial beliefs. Studies which do not investigate the relative in-
fluence of other factors but concentrate on national differences alone should
be treated with caution because they do not necessarily concentrate on the
most important factor which explain the basic differences. Studies which
concentrate on national differences should also make an effort to differen-
tiate the effect of situational differences from the effect of real national
272

cultural differences.
This study implies that the similarities and differences of business be-
liefs of the managers seem to be the outcome of several factors: managerial
characteristics with particular emphasis of the functional area in which
managers work in; the strategic interest of the given organisation which
moderates the influence of functional area on managerial beliefs; and in a
limited extent to organisational and industry characteristics.
11.7 Limitations and Suggestions for
further research
Some of the limitations of this thesis relate to the causal mapping technique
which was used while others relate to constraints of time and resources and
to the effort of focusing on the basic questions of the thesis as opposed to
addressing all potentially interesting topics. These limitations and sugges-
tions for future works are detailed below.
11.7.1 Limitations of the causal mapping technique
The causal mapping technique which was used here was developed with
the purpose of using causal maps for a survey type of analysis. To ensure
the systematic, reliable comparison of the causal maps these needed to be
elicited in a systematic manner. The systematic elicitation required the
application of a predefined list of constructs from which managers could
select those which they found relevant. Providing a predefined list of con-
structs eliminated the chance of selecting novel constructs from outside of
the list and this way reduced the idiosyncrasy of the maps. Both the list
of constructs and the selection procedure were limited to items which were
potentially relevant for the success of a given immo which constrained the
investigation on managerial beliefs to success factors. Other issues could
have been potentially as relevant to investigate similarities and differences
in managerial beliefs as those which related to organisational success but
273

including all of these into the list would have extended it to an unmanage-
able degree and would have confused the selection procedure.
During the selection procedure managers were constrained to select
ten constructs which they found important for influencing the success of
their organisation. Restricting their selection to ten constructs meant that
their CMs did not include all of those constructs which managers might
found relevant but only those which they selected among the ten most
important ones. Limiting the selection of constructs to ten potentially
increased the distances of the CMs of the managers because an increase in
the number of the selectable nodes increases the chance of overlap between
the selected nodes in the CMs of other managers. Constraining the selection
of constructs to ten also made these maps less suitable to in-depth analysis
(as it was discussed in section 3.3) and to analyse issues like complexity or
comprehensiveness of the CMs.
The CMs which were elicited here only contained information on the
nodes which subject selected to be among the ten most important ones
and various information on the influence relationship between these nodes.
They did not contain information on the relative importance of the nodes
compared to the other nodes in the map, nor information whether a node
could be treated as subordinate or superordinate to other nodes or whether
they stand for tight or loose constructs. As pointed out by Markoczy and
Goldberg (1995) the method treats all selected constructs the same way and
could not deal with the fact that some constructs might be more different
than others. For example, imagine three maps (A, B, and C) which are
identical except that where A has the node yearly profit of the company,
B has the node survival of the company, and C has node understanding the
mentality of host-country managers. Given the measure of the CMs these
maps will be treated equidistant from each other even if one would expect
that the latter node is more different than the other two ones.
As mentioned by many authors, including Markoczy and Goldberg
(1993), causal maps provide only a very limited model of belief systems.
274

For instance, the nodes of causal maps are atomic unanalysable entities
while the actual constructs in a belief system are extremely rich with a vast
amount of internal structure. In true belief structures relationships between
constructs will include more than the simple influence relations allowed for
in causal maps. It may even be the case that belief structures constitute
non-linear systems as suggested by Bettis and Prahalad (1995), while
the causal maps with their simple −3 to +3 influence relations are linear.
Nevertheless, it must be noted that researchers build models not to capture
every fact about the thing modelled, but to abstract away from many of
the complexities of the world in order to produce a model which is both
workable and good enough for the task at hand. Causal maps are a limited
model of a limited part of belief structures.
For comparing the CMs a mathematical formula was used which, al-
though took into consideration all information which were contained in the
CMs when it compared these, it presented the differences in one number
for each pair of CMs. Reducing the distances between CMs to one number
made it possible to subject these into statistical analysis but for this benefit
the complex information on which these distance data was based on was
not directly utilised in the analysis.
11.7.2 Other limitations and suggestions for futurework
Given that this research concentrated on similarities and differences in
managerial beliefs at a given time it could not measure change over time.
It is therefore only a first step to answer questions like whether learning
has occurred in the investigated immos. Investigating whether learning
occurs between managerial groups could be one possible development of
this study.
This work also concentrated on identifying the similarities and differ-
ences in managerial beliefs and the relative importance of organisational
and personal factors which influenced these rather than going into detailed
275

and deep analysis of the content of managerial beliefs and identifying na-
tional differences in this respect. For example, it was not investigated
whether different participants attach different meaning to the same con-
cepts (e.g., Bougon, 1992b) or whether these beliefs are embedded into
different values and different general belief systems. Further studies, us-
ing different methods, are needed if one is interested in what the different
beliefs actually are.
The managerial characteristics considered in this study were those
which were found relevant in the literature or thought to be potentially
relevant in immos or in an economy under transformation and also which
were expected to be accessible to investigation. The study therefore could
not include among the investigated managerial characteristics, personality
tests and could not collect data on social-networks and interaction of the
managers. Personality tests were not included because these tend to be
distrusted at a time of lay-offs and also because a large amount of data
already had to be collected on each occasion. It was initially hoped to
investigate the communication patterns of managers but this proved infea-
sible as managers were very suspicious and unwilling to answer questions
about who they regularly talk to. It should noted, for example, that the
first question of the first manager who was interviewed was: “who sent you
to me?”
This study was oriented towards investigating differences and similar-
ities in managerial beliefs but it did not go far enough to tie these to to
differences and similarities in managerial behaviour and organisational per-
formance. Studies which investigated the relationship between consensus,
decision making and performance have so far produced controversial results
as it was discussed in section 2.3 so further work is needed to sort out this
problem.
The sample of immos only contained those companies with Anglo-
Saxon partners. As Child et al. (1994) pointed out the cultural-gap be-
tween the local managers and the foreign partner might also influence the
276

problems and similarities and differences in managerial beliefs which could
be traced in organisations. It would be an interesting further development
of this study to compare its results to studies which are conducted in Hun-
garian immos with partners other than Anglo-Saxons. For example, in
Hungary it is likely that there is a smaller cultural-gap between Hungarian
and German or Austrian partners and larger differences between Hungar-
ian and Japanese partners than the difference between Hungarians and
Anglo-Saxons. It would also be a good further step to replicate this study
in other transforming economies to see whether differences in the national
cultures, and attitude towards the market economy among these countries
might change the results from country to country.
This work concentrated on the immos themselves as opposed to in-
vestigating the strategy, structure and philosophy of the foreign parent(s)
which might have a substantial influence on whether the foreign partner
chooses to use a forced versus a shared approach in introducing changes.
There are other studies which have investigated the parents and the immos
and the relationship between these from this respect (see section 2.2.1).
This study included a wide range of managerial and organisational
factors to establish the potential influence of these on similarities and dif-
ferences in managerial beliefs. Because it considered so many factors it
was not a powerful study to test and sort out the effect of a few particular
factors. The robustness of the study was consequently sacrificed for the
sake of discovering new relationships and underlying forces. This study
however could be a good starting point to design robust studies to test the
effect of strategic interest, or to separate the effect of cultural, system and
situational differences within the national differences.
11.8 Practical implications
Both the immediate findings of this research and future works which could
be based on this work have potential use to practising managers in ways
discussed below.
277

11.8.1 Getting the ball rolling
The causal mapping technique which was developed for this research was
found to be a good tool for providing initial material for dynamic and useful
feedback sessions for the participants for the following reasons:
1. The method asked previously unasked questions, thus it forced sub-
jects to explicitly think about things which they may have only known
implicitly. This led to novel introspection on the part of the subjects.
2. The participants expressed their view that the method and the re-
searcher brought specialised knowledge to the situation which they
could not have done themselves.
3. The results which were generated by the method were considered
credible by the managers.
4. The data elicitation part related to issues that the participants
thought mattered.
5. While some of the results were in line with the participant’s percep-
tions, others were surprising and generated useful discussion among
the participants.
These advantages are, of course, not particular to the causal mapping
technique which was used in this work. Methods with similar characteristics
could also be well used in feedback sessions.
11.8.2 Identifying the reasons of differences
There is a tendency among practising managers in immos to interpret ma-
jor problems within their organisations from the point of view of national
differences. This study suggests, and this was reinforced during feedback
sessions by managers, that it is worthwhile to go down to the roots of
the problems: to differentiate from national differences those issues which
are tied to the change in the strategic interest of the organisations, to the
278

changing interest and situation of the managers. The findings also im-
ply that Westerners would be advised to approach immos in transforming
economies with an open mind rather than with certain prejudices. Preju-
dices may lead to self-fulfilling prophecies (Snyder, 1984) where local man-
agers behave as is expected from them. It is a better approach to try to
overcome the initial differences which relate to styles, routines, and are
often sources for misunderstanding, and then to try to jointly clarify the
common goals on which the future success of an organisations might de-
pend. This study also implies that a shared approach in setting strategic
goals and a “gentle push” towards the new direction lead to less conflict
and less “cultural differences” than a forced approach. This goes against
the argument of Newman (1992) who suggested a “focussed approach” in
the former or existing socialist countries and supports a shared approach
recommended by Lawrence and Vlachoutsicos (1993) (see section 2.2.1).
11.8.3 To clarify intra-organisation communication
By identifying which groups of individuals have common beliefs in organi-
sations, works like this could be used to identify where information is not
flowing. If certain managerial groups show striking similarities in their
beliefs compared to the rest of the managers there are reasons to believe
that this managerial group became relatively isolated from the rest of the
organisation. This isolation might be the consequence of the unwillingness
of the group members to share information with the others, but also of the
resentment of others to communicate with the members of the given group.
Either way, the method applied here could be put to direct use to identify
communication blockages which could be the first step to discovering their
causes and taking steps to resolve them.
11.8.4 Contribution to theory
It should go without saying that research which contributes to manage-
ment theory should eventually lead to better prescriptions for managers.
279

Although the theoretical contribution of this work will not provide im-
mediate benefits to the participating managers it should in the long term
contribute to practice through its theoretical contribution.
280

Appendix A
Aide Memoire Used forInterviews
This appendix contains the “aide memoire” used as a guide to the re-
searcher during interviews.
A.1 Information collected in each immo
This following information was collected from various sources, but miss-
ing information was requested from the main contact person within the
organisations (either the HRM or PR managers).
1. Name of the immo:
2. Date of the foundation of the immo:
3. Location:
4. Name of the parent companies:
5. Amount of investment by each partner:
6. Products:
7. Annual profit since the formation of the immo:
8. Number of employees:
9. Number of foreigners in the company:
281

10. What is the nationality of the foreign managers:
11. What positions the foreigners fill in the company:
12. The structure of the organisation (organisational chart):
A.2 Questions asked of each manager
These questions were asked of each manager, after the elicitation of the
causal maps.
1. If a managers mentioned during the card selection that some of the
constructs are important in the company or some of the influence
relationships are important the following question should be asked:
You mentioned during the elicitation that the . . . constructs or . . .
influence relationships are important in your organisation. Could you
tell me more about these?
2. What do you think was the purpose of the Hungarian partner in
setting up the immo?
3. What do you think was the purpose of the foreign partner in setting
up the immo?
4. What kinds of changes took place within the company since the for-
mation of the immo?
5. What kinds of western managerial techniques were introduced?
6. What kinds of changes took place in the environment?
7. What kinds of problems do you see exist in the organisation?
282

Appendix B
Biographical Questionnaire
Figures B.1 and B.2 contain the replica of the English language version
of the biographical questionnaire which was completed by all individuals
in the sample. The “ID” in the upper right corner was provided by the
researcher and encoded the organisation and the date of interview as well
as a unique identifier. The Hungarian language version of the questionnaire
is available upon request.
283

Figure B.1 First page of Biographical Questionnaire
284

Figure B.2 Second Page of Biographical Questionnaire
285

Appendix C
Construct List
This appendix contains the English language list of constructs with their
descriptions as presented to the subjects. See chapter 3 for a discussion of
how these were developed and used. The Hungarian language version of
this list is available from the author upon request.
1 Quality and implementability of hiring and firing policy
The extent to which hiring and dismissal policy is able to ensure the selection of
qualified employees and the firing of those who are not qualified or laying off of
surplus employees.
2 Satisfied employees
The extent to which the employees of the company are satisfied with their con-
ditions within the company.
3 Vision and strategic direction of the company’s leadership
The extent to which the leadership of the company has a vision and a clear
picture of the strategic direction to follow and the extent to which this vision is
appropriate given the conditions of the company.
4 Host country national culture (values, society’s attitude towards busi-
ness)
The extent to which the host country culture is supportive and conducive towards
the company’s activities and towards business in general.
286

5 Market share of the company
The proportion of sales of the company to the total sales of all products (both
company’s and competitors’) in the relevant markets.
6 Long term profitability of the company
The return on investment over a long term (at least 5 years).
7 Parent company’s support
The extent to which the parent(s) provide(s) financial, technical or other support
(like expertise) when necessary.
8 Inflation of host country currency
The rate of inflation of the currency of the country in which the company operates.
9 Access to external R&D
The extent that the results of research and development which were produced by
other organisations are available to the company.
10 Lobbying capabilities with the government
The extent and quality of the company’s contacts with the authorities and its
ability to influence governmental policies which affect the company.
11 Satisfying shareholders or owners
The extent that shareholders (owners) are satisfied with how the company is
doing.
12 Employees attitude
The employees attitude towards the organisation, towards the company’s activity,
toward changes and towards each other.
13 Debt/Equity ratio
The degree that the company is indebted compared to its equity.
14 The quality of the production technology
The overall level of the production technology, and the extent to which it is
appropriate to the given production requirements.
287

15 Growth of the company
The growth of the company in terms of its value, assets and income.
16 Responsibility to the community
The extent that the company satisfies the interest of the community in which it
works. (e.g., social responsibility, including environmental issues).
17 Job security for the employees of the company
The degree to which employees can be sure that they will remain employed.
18 Investment intensity of the company
The relative portion of company income dedicated to investment purposes.
19 The degree of unionization of the employees within the company
The portion of the employees who belong to trade unions and the overall power
of these unions.
20 Competition in the market
The number and strength of competitors and potential competitors in the market,
their market share, and the intensity of the competition.
21 Management flexibility
The degree to which managers are able to recognize internal and external threats
and opportunities relatively quickly and are able to adjust their policies and
practices to new conditions.
22 Prices applied by the company
The level of prices of the company in comparison to the quality of their products
and to prices applied by the competitors.
23 Internal R&D capability/Product development
The relative strength the company’s research and development activities com-
pared to its competitors in terms of both new product development and produc-
tion techniques.
288

24 Shared organisational culture
The extent that members of the company have shared values and beliefs concern-
ing issues which relate to organisational practices.
25 Economy of scale of the production
The extent that the scale of production is adequate given the unit cost, the
technology applied and the size of the company’s market.
26 Size (number of employees)
The size of the company given the number of employees
27 Customer relations
The connections which the company has with its customers through which it col-
lects information of their requirements towards the products and through which
its provides services for supporting the usage and maintenance of the products.
28 Economic and political conditions (excluding inflation and currency
exchange-rate)
The political, economic and legal conditions of the host country which establish
the ‘rules of the game’ in the market (with suppliers, customers etc.) and which
defines the relationship between the company and governmental, public and legal
organisations. (This does not include currency valuation which is listed elsewhere)
29 Legal expertise of the company
The extent to which the company knows the legal system and able to use this
knowledge to its benefit.
30 Leadership within the organisation
The extent to which the leaders are able to influence people so that they strive
willingly and enthusiastically towards the accomplishment of group goals.
31 Yearly profit of the company (net income after tax)
The net income of the company after deducting costs and after paying tax.
289

32 Size of the company’s market
The size of the market in which the company operates. [note: this is not market
share, but size of the market including the competition].
33 Knowledge of needs of the company’s market
The company’s awareness of the needs of its customers (what the market wants).
34 Returns on sales
The absolute income generated by sales [exclusive of costs]
35 Brand recognition of the company’s products
The extent to which the customers are familiar with the brand name of the
company’s products and developed a trust towards these products with this brand
name.
36 Quality of products and services
The level of quality of the products and services the company produces.
37 Survival of the company
The ability of the company to survive.
38 Management’s understanding the mentality of the host country managers
The degree to which management (both foreign and host country) understand
the ways of thinking of host country managers.
39 Purpose of the parents in establishing the company
The extent to which the original purpose of the parents is ‘good’ for the daughter
company.
40 Relative valuation of host country currency
The price of the currency as a portion of purchasing power.
41 Cost control within the company
The extent that there is effective cost control within the company which is able
to reduce costs or keep them low.
290

42 Incentives given to employees (financial and fringe benefits)
Financial benefits (e.g., pay, bonuses) or fringe benefits (e.g., company car) given
to employees attached to personal or organisational achievements or positions.
43 Bank connections
The quality of the company’s connections with banks or financial institutions in
terms of getting advantageous loans, ensuring efficient financial transactions etc.
44 Familiarity with environmental conditions
The company’s managers’ knowledge of the political, economic, legal, cultural
conditions. [note: ‘environmental’ does not mean ‘green’ here]
45 Individual contribution of employees
The effort made by the individual employees to enhance organisational perfor-
mance.
46 In house training
The amount and quality of the training which is organized by the company for
its (usually new) employees.
47 Efficiency/productivity
The ratio of the company’s output to the resources it consumes. (the output-input
ratio)
48 Quality of the distribution channels
The effective functioning of the distribution channels which ensure good service
for the customers in a cost-effective way.
49 Relationships with suppliers
The extent that the organisations have suppliers which ensure that the necessary
input reaches the organisations in the required time, with the appropriate quality
and cost.
291

Appendix D
Distance Ratio Calculations:An Example
This appendix contains an example of the causal map comparison method
discussed in chapter 3 particularly in section 3.4.4. Many parts of this
appendix are taken from work produced by the author together with Jeff
Goldberg, and have been adapted to function as an appendix to this thesis.
In what follows, “the formula” will refer to the formula in figure 3.3 on
page 75.
The example here will consider two fabricated example maps. In order
to preserve space so that all of each example map can fit on a piece of paper,
it is best to limit each map to five nodes each and the field of possible nodes
to eight. (The actual maps elicited have ten nodes each out of a field of 49.)
The two maps A and B are shown in figure D.1.
In figures D.2 and D.3 we see each map as an extended association
Figure D.1 Example cause maps A and B
1 2 3 4 51 0 2 3 0 −22 0 0 1 1 33 −2 0 0 2 04 1 −2 3 0 −15 2 1 2 −1 0
Map A
1 2 3 6 81 0 2 2 1 32 −1 0 2 −1 −13 3 0 0 2 16 0 −1 3 0 28 1 1 1 −1 0
Map B
292

Figure D.2 Extended Association Matrix for Map A
1 2 3 4 5 6 7 81 0 2 3 0 −2 0 0 02 0 0 1 1 3 0 0 03 −2 0 0 2 0 0 0 04 1 −2 3 0 −1 0 0 05 2 1 2 −1 0 0 0 06 0 0 0 0 0 0 0 07 0 0 0 0 0 0 0 08 0 0 0 0 0 0 0 0
NA = {1, 2, 3, 4, 5}
matrix in which columns and rows exist for nodes which do not actually
occur in the maps. Each such matrix is also accompanied by a set of nodes
which actually do exist in the map.
Recall that the formula applies to extended association matrices.
Given the formula, we can initially calculate the terms pc, number of nodes
common to the pair of maps, as 3; puA , number of nodes unique to map
A, as 2; and puB is also 2. With these numbers we can first calculate the
denominator of the formula to be 64, which is the largest sum we could
get for the numerator given these values.
The numerator is the sum of the adding up the differences on a cell by
Figure D.3 Extended Association Matrix for Map B
1 2 3 4 5 6 7 81 0 2 2 0 0 1 0 32 −1 0 2 0 0 −1 0 −13 3 0 0 0 0 2 0 14 0 0 0 0 0 0 0 05 0 0 0 0 0 0 0 06 0 −1 3 0 0 0 0 27 0 0 0 0 0 0 0 08 1 1 1 0 0 −1 0 0
NB = {1, 2, 3, 6, 8}
293

cell basis for all 64 cells1, that is8∑i=1
8∑j=1
diff(i, j). When considering those
differences there are three possible cases.
1. The first is when the cell is on a diagonal (where i = j) in which case
the added difference is zero. These will be cells (1, 1), (2, 2), · · · (8, 8)
in this example. Each of these cells contribute nothing to the differ-
ence between the maps since diff(i, i) is always 0.
2. The second case is where exactly one map has both nodes i and j,
while the other map is missing at least one of them. In these maps
that will be (6, 1), (6, 2), (6, 3), (6, 8) and (1, 6), (2, 6), (3, 6), (8, 6)
and (8, 1), (8, 2), (8, 3) and (1, 8), (2, 8), (3, 8) as pairs of node in
map B which aren’t in map A; and (4, 1), (4, 2), (4, 3), (4, 5) and
(1, 4), (2, 4), (3, 4), (5, 4) and (5, 1), (5, 2), (5, 3) and (1, 5), (2, 5), (3, 5)
as pairs of node in map A and not in map B. According to the
second clause of the definition of the ‘diff’ function, each such cell
contributes a difference of one. Since there are 28 such cells the total
contribution is 28.
3. The third case actually covers two distinct cases (which can be cal-
culated the same way).
(a) Where both maps have both nodes. In the example that will
cover the six cells (1, 2), (2, 1), (1, 3), (3, 1), (2, 3), (3, 2) which is
0 + 1 + 1 + 5 + 1 + 0 = 8. For example, diff(3, 1) = 5 since
|a3,1 − b3,1| = |−2− 3|, while with diff(1, 2) = |2− 2| = 0.
(b) Where neither map has both nodes, This will cover all rows
and columns involving node 7 except for (7, 7) which was cov-
ered by clause 1, and the cells (4, 6), (4, 8), (8, 4), (6, 4) and
1It is a coincidence that with this example the number of cells in each associationmatrix (8×8) is the number calculated for the denominator. If, for example, there werenine possible nodes, but with the same maps, the extended association matrix wouldhave 81 cells, but the denominator would still be 64 and entire calculation would leadto the same result.
294
(5, 6), (5, 8), (8, 5), (6, 5). Since each such cell in both maps will
contain the same number, zero, the total difference difference
from these cells is zero.2
Summing the different contributions to distance we arrive at a numerator
of 36. This leads to a final result of 36/64 or 0.5625.
2Notice that it is not essential that zero be used in the association matrix to markcells for which there could be no arc since at least one of the nodes does not exist in themap: if the number 99 were used instead, all of these comparisons would be 99− 99 sothe result would be zero.
295

Appendix E
Example of IO-degreeCalculation
This appendix describes the calculation of what is called in-degree and
out-degree in this thesis. It should be noted that these terms are not used
here in the usual or traditional sense.
The traditional in-degree of a node is the number of arcs leading
to that node. The traditional out-degree of a node is the number arcs
leading from that node. In figure E.1 we have a small causal map. If we
consider n1, we see that it influences nodes n2, n3 and n5. This gives it a
traditional out-degree of 3. We also see that it is influenced by nodes n3
and n5. This gives it a traditional in-degree of 2. Figure E.2 lists the same
map with the traditional out-degrees shown at the right of each row and
the traditional in-degree shown at the bottom of each column. The number
in the lower right corner is the sum of the traditional out-degrees (or the
Figure E.1 Example cause map
1 2 3 4 51 0 2 3 0 −22 0 0 1 1 33 −2 0 0 2 04 0 −2 3 0 −15 2 1 2 −1 0
296
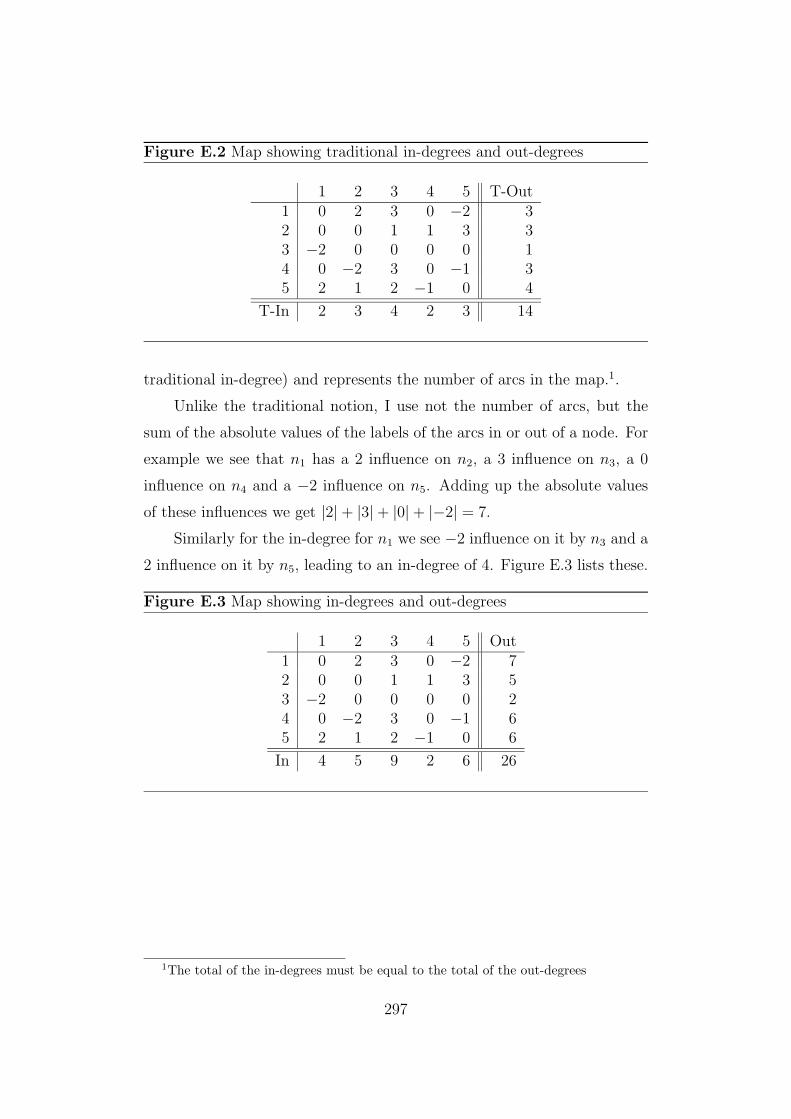
Figure E.2 Map showing traditional in-degrees and out-degrees
1 2 3 4 5 T-Out1 0 2 3 0 −2 32 0 0 1 1 3 33 −2 0 0 0 0 14 0 −2 3 0 −1 35 2 1 2 −1 0 4
T-In 2 3 4 2 3 14
traditional in-degree) and represents the number of arcs in the map.1.
Unlike the traditional notion, I use not the number of arcs, but the
sum of the absolute values of the labels of the arcs in or out of a node. For
example we see that n1 has a 2 influence on n2, a 3 influence on n3, a 0
influence on n4 and a −2 influence on n5. Adding up the absolute values
of these influences we get |2|+ |3|+ |0|+ |−2| = 7.
Similarly for the in-degree for n1 we see −2 influence on it by n3 and a
2 influence on it by n5, leading to an in-degree of 4. Figure E.3 lists these.
Figure E.3 Map showing in-degrees and out-degrees
1 2 3 4 5 Out1 0 2 3 0 −2 72 0 0 1 1 3 53 −2 0 0 0 0 24 0 −2 3 0 −1 65 2 1 2 −1 0 6
In 4 5 9 2 6 26
1The total of the in-degrees must be equal to the total of the out-degrees
297

Appendix F
Finding the Software
Several software tools were developed by Jeff Goldberg for the method used
here. A number of people have asked for those tools, and he has made many
of them available to the research community over the Internet. He provides
the following brief descriptions of the programs in the packages.
distrat Performs the distance ratio calculations. Can handle large num-
bers of maps efficiently.
askmap Interactive program for help in eliciting maps. Intended for use
by the researcher and not for self-administration.
avmap Calculates central maps.
iodeg Calculates in-degree and out-degree.
drsort Prepares output of distrat for use with third party statistical pack-
ages.
The software is available on the Internet Management Archive1 by ftp
or gopher. For more information contact either the author or Jeff Goldberg
1Internet address ursus.jun.alaska.edu.
298

Bibliography
Abrahamson, Eric and Charles Fombrun (1994). ‘Macrocultures:
Determinants and Consequences’, Academy of Management Review
19(4): 728–755.
Ackermann, Fran, Steve Cropper, Colin Eden and John Cook
(1991). ‘Cognitive Mapping for Policy Analysis in the Public Sector’,
Meeting of the Academy of Management, Miami.
Adler, Lee and John D. Hlavacek (1976). Joint Ventures for Product
Innovation, American Management Association, New York.
Allport, Gordon W., P. E. Vernon and G. Lindzey (1970). Study
of Values, Houghton Mifflin, New York.
Badaracco, Joseph L. (1991). The Knowledge Link: How Firms
Compete through Strategic Alliances, Harvard Business School Press,
Boston. Mass.
Baird, Inga S., Marjorie A. Lyles and J. B. Orris (1993). ‘A
Sino-Hungarian-U.S. Perspective on Joint Venture Success’, in Paul
Shrivastava, Anne S. Huff and Jane Dutton (eds), Advances in Stategic
Management, Vol. 9, Jai Press, Greenwich, Conn.
Baligh, Helmy H. (1994). ‘Components of Culture: Nature, Interconnec-
tions, and Relevance to the Decisions on the Organization Structure’,
Management Science 40(1): 14–27.
299

Bantel, Karen A. and Susan E. Jackson (1989). ‘Top Management
and Innovation in Banking: Does the Composition of the Top Team
Make a Difference?’, Strategic Management Journal 10: 107–124.
Ban, Zsuzsa (1992). ‘A Philips meg remenykedik (Philips Still Thinks
That There Is Hope)’, Nepszabadsag.
Barney, Jay B. and Robert E. Hoskisson (1990). ‘Strategic Groups:
Untested Assertions and Research Proposals’, Managerial and Deci-
sion Economics 11: 187–198.
Barr, Pamela S., J. L. Stimpert and Anne S. Huff (1992). ‘Cogni-
tive Change, Strategic Action, and Organizational Renewal’, Strategic
Management Journal 13: 15–36.
Bedeian, A. G., E. R. Kermery and K. W. Mossholder (1989).
‘Testing for Cross-Level Interactions: An Empirical Demonstration’,
Behavioral Science 34: 70–78.
Berend, T. Ivan (1983). ‘Gazdasagi utkereses 1956–1965 (Looking for a
New Path for the Economy between 1956–1965)’.
Bettis, Richard A. and C. K. Prahalad (1995). ‘The Dominant
Logic: Retrospective and Extension’, Strategic Management Journal
16(1): 5–14.
Bettman, James R. and Barton A. Weitz (1983). ‘Attributions in
the Board Room: Causal Reasoning in Corporate Annual Reports’,
Administrative Science Quarterly 28: 165–183.
Boisot, Max (1994). ‘The Lessons from China’, in Max Boisot (ed.),
East–West Business Collaboration: The Challenge of Governance in
Post-Socialist Enterprises, Routledge, London, pp. 24–50.
Borys, Bryan and David B. Jemison (1989). ‘Hybrid Arrangements
as Strategic Alliances: Theoretical Issues in Organizational Combina-
tions’, Academy of Management Review 14(2): 234–249.
300

Bossanyi, Katalin (1994a). ‘Egyseges allami vagyonkezelore lenne
szukseg (Unitary State Property Management Is Required)’, Nepsza-
badsag p. 11.
Bossanyi, Katalin (1994b). ‘A jo multi, a szamıto befekteto meg a
karvalytoke (The Good Multinational, the Reliable Investor, and the
Crual Capital)’, Nepszabadsag.
Bougon, Michel G. (1992a). ‘Congregate Cognitive Maps: A Unified
Dynamic Theory of Organization and Strategy’, Journal of Manage-
ment Studies 29(3): 369–389.
Bougon, Michel G. (1992b). ‘Congregate Cognitive Maps: A Unified
Dynamic Theory of Organizations and Strategy’, Journal of Manage-
ment Studies 29(3): 369–389.
Bougon, Michel G., Karl E. Weick and Din Binkhorst (1977).
‘Cognition in Organizations: An Analysis of the Utrecht Jazz Orches-
tra’, Academy of Management Review 22: 606–639.
Bourgeois, L. J. (1980). ‘Performance and Consensus’, Strategic Man-
agement Journal 1: 227–248.
Brown, Alan and Frank Heller (1981). ‘Usefulness of Group Feed-
back Analysis as a Research Method: Its Application to a Qestionnaire
Study’, Human Relations 34(2): 141–156.
Brown, L. T., A. M. Rugman and A. Verbeke (1989). ‘Japanese
Joint Ventures with Western Multi-Nationals: Synthesising the Eco-
nomic and Cultural Explanations of Failure’, Asia Pacific Journal of
Management 6(2): 225–242.
Buono, Anthony F. and James L. Bowditch (1989). The Human
Side of Mergers and Acquisitions: Managing Collisions between Peo-
ple, Cultures, and Organizations, Jossey-Bass, San Francisco, CA.
301

Burawoy, Michael and Janos Lukacs (1985). ‘Mythologies of Work:
A Comparison of Firm in State Socialism and Advanced Capitalism’,
American Sociological Review.
B. Varga, Judit (1993). ‘A G esete a A-val (The Case of G with A)’,
Figyelo: Top 200, 1993, Figyelo, Budapest, p. 50.
Carlson, Gosta and Katarina Karlson (1970). ‘Age, Cohort and
Generation of Generation’, American Sociological Review 35: 710–718.
Centers, R. and D. E. Bugental (1966). ‘Intrinsic and Extrinsic Job
Motivations among Different Segments of the Working Population’,
Journal of Applied Psychology 50: 193–197.
Chatman, Jennifer A. and Karen J. Jehn (1994). ‘Assessing the Re-
lationship between Industry Characteristics and Organizational Cul-
ture: How Different Can You Be?’, Academy of Management Journal
37(3): 522–553.
Child, John (1972). ‘Organizational Structure, Environment and Perfor-
mance: The Role of Strategic Choice’, Sociology 6: 2–22.
Child, John (1981). ‘Culture, Contingency and Capitalism in the Cross-
National Study of Organizations’, in Barry M. Stow and L. L. Cum-
mings (eds), Research in Organizational Behavior, Vol. 3, Jai, Green-
wich, CT.
Child, John (1982). ‘Professionals in the Corporate World: Values, Inter-
ests and Control’, in D. Dunkerley and G. Salaman (eds), The Interna-
tional Yearbook of Organization Studies, Routledge & Kegan, London.
Child, John and Arthur Kieser (1979). ‘Organization and Managerial
Roles in British and West German Companies: An Examination of
the Culture-free Thesis’, in C. Lammers and David Hickson (eds),
Organizations Alike and Unlike, Routledge, London.
302

Child, John and Christopher Smith (1987). ‘The Context and Process
of Organizational Transformation: Cadbury Limited in Its Sector’,
Journal of Management Studies.
Child, John and Lıvia Markoczy (1993). ‘Host-country Managerial
Behaviour and Learning in Chinese and Hungarian Joint Ventures’,
Journal of Management Studies 30(4): 611–631.
Child, John, Lıvia Markoczy and Tony Cheung (1994). ‘Managerial
Adaptation in Chinese and Hungarian Strategic Alliances with Cul-
turally Distinct Partners’, in Sally Stewart (ed.), Joint Ventures in the
People’s Republic of China, Vol. 4 of Advances in Chinese industrial
studies, Jai, Greenwich, CT. (forthcoming).
Child, John, Michael Fores, Ian Glover and Peter Lawrence
(1983). ‘A Price to Pay? Professionalism and Work Organization in
Britain and West Germany’, Sociology 17(1): 63–78.
Cho, Theresa S., Donalds C. Hambrick and Ming-Jer Chen
(1994). ‘Effect of Top Management Team Characteristics on Com-
petitive Behaviors of Firms’, in Dorothy P. Moore (ed.), Best Papers
Proceedings, 94, Academy of Management, Dallas, pp. 12–16.
City Reports (1992). ‘Outlook Dims on G’s Hungarian Investment’, City
Reports.
Clark, D. G. (1968). ‘The Industrial Manager’, in Denis Pym (ed.),
Industrial Society. Social Sciences in Management, Penguin, Har-
mondsworth, pp. 243–254.
G Company (1991). ‘Annual Report 1991’, Technical report, G Company,
Clevland Ohio.
Contractor, Farok J. and Peter Lorange (1988). ‘Why Should
Firms Cooperate?’, in Farok J. Contractor and Peter Lorange (eds),
303

Cooperative Strategies in International Business, Lexington Books,
New York, pp. 3–28.
Crossan, Mary M. and Andrew C. Inkpen (1992). ‘Believing Is See-
ing: An Exploration of the Organization Learning Concept and Evi-
dence from the Case of Joint Venture Learning’, Working Paper NC
92-009-K, National Centre for Management Research and Develop-
ment, The University of Western Ontario.
Csath, Magdolna (1991). ‘Strategic Alliances: Joint Ventures in Cen-
tral and Eastern Europe — Problems and Opportunities: The Case
of Hungary’, International Review of Strategic Management 2(2): 73–
107.
Csete, Ilona (1993). ‘Torzıtasmentes sikuveg Oroshazarol (Glass With-
out Distortion from Oroshaza)’, Nepszabadsag.
Daniels, Kevin, Livia Markoczy and Leslie de Chernotony
(1994). ‘Techniques to Compare Cognitive Maps’, in James R. Meindl,
Joseph F. Porac and Chuck Stubbart (eds), Advances in Manage-
rial Cognition and Organizational Information Processing, Vol. 5, Jai
Press, Greenwich, Conn, pp. 141–164.
Datta, Deepak K. and Abdul M. A. Rasheed (1993). ‘Planning Inter-
national Joint Ventures: The Role of Human Resource Management’,
in Refik Culpan (ed.), Multinational Strategic Alliances, International
Business Press, New York, pp. 251–271.
Dearborn, DeWitt C. and Herbert A. Simon (1958). ‘Selective
Perception: A Note on the Department Identification of Executives’,
Sociometry 21: 140–144.
Dess, Gregory G. (1987). ‘Consensus Formulation and Organizational
Performance: Competitors in a Fragmented Industry’, Strategic Man-
agement Journal 8: 259–277.
304

DeWoot, P., H. Heyvaert and F. Martou (1977–78). ‘Strategic Man-
agement: An Empirical Study of 168 Belgian Firms’, International
Studies of Management and Organization 7: 60–75.
Diffenbach, J. (1983). ‘Influence Diagrams for Complex Strategic Is-
sues’, Strategic Management Journal 3: 133–146.
Dutton, Jane E. and Edward Ottensmeyer (1987). ‘Strategic Issue
Management Systems: Forms, Functions, and Contexts’, Academy of
Management Review 12(2): 355–365.
Dutton, Jane E., Eric J. Walton and Eric Abrahamson (1989).
‘Important Dimensions of Strategic Issues: Separating the Wheat from
the Chaff’, Journal of Management Studies 26(4): 379–396.
Dutton, Jane E., Janet M. Dukerich and Celia V. Harquail
(1994). ‘Organizational Images and Member Identification’, Admin-
strative Science Quaterly 39(2): 239–263.
Dutton, Jane E. and Susan E. Jackson (1987). ‘Categorizing Strate-
gic Issues: Links to Organizational Action’, Academy of Management
Review 12(1): 76–90.
Earley, P. Christopher (1993). ‘East Meets West Meets Mideast: Fur-
ther Explorations of Collectivistic and Individualistic Work Groups’,
Academy of Management Journal 36(2): 319–348.
Earley, P. Christopher (1994). ‘Self or Group? Cultural Effects
of Training on Self-Efficacy and Performance’, Adminstrative Science
Quaterly 39(1): 89–117.
Eden, Colin (1988). ‘Cognitive Mapping’, European Journal of Opera-
tional Research 36: 1–13.
Eden, Colin (1992). ‘On the Nature of Cognitive Maps’, Journal of
Management Studies.
305

Eden, Colin (1993). ‘From the Playpen to the Bombsite: The Chang-
ing Nature of Management Science’, Omega International Journal of
Management Science 21(2): 139–154.
Ellis, Tony and John Child (1973). ‘Placing Stereotypes of the Man-
ager into Perspective’, Journal of Management Studies 10(3): 233–
255.
Ely, Robin J. (1994). ‘The Effects of Organizational Demographics and
Social Identity on Relationships among Professional Women’, Admin-
istrative Science Quarterly 39(2): 203–238.
England, George W. (1967). ‘Personal Value Systems of American
Managers’, Academy of Management Journal 10(1): 53–68.
England, George W. (1975). The Manager and His Values, Ballinger,
Cambridge, MA.
England, George W. and Raymond Lee (1971). ‘Organizational
Goals and Expected Behavior among American, Japanese and Korean
Managers: A Comparative Study’, Academy of Management Journal
14: 425–438.
Everitt, Brian (1990). Cluster Analysis (2nd Edition), Halsted Press,
Wiley, New York.
Fazekas, Ferenc (1992). ‘Gyartorteneti osszefoglalo (Summary of Plant
History)’, Internal document, D.
Fiske, Susan T. and Shelley E. Taylor (1991). Social Cognition,
McGraw-Hill Series in Social Psychology, second edn, McGraw-Hill,
New York.
Ford, Jeffrey D. (1985). ‘The Effects of Causal Attributions on Decision
Makers’ Responses to Performance Downturns’, Academy of Manage-
ment Review 10(4): 770–786.
306

Ford, Jeffrey D. and W. Harvey Hegarty (1984). ‘Decision Makers’
Beliefs about the Causes and Effects of Structure: An Exploratory
Study’, Academy of Management Journal 27: 271–291.
Gabor, R. Istvan and Peter Galasi (1981). A “masodik” gazdasag
(The Second Economy), Kozgazdasagi es Jogi Konyvkiado, Budapest.
Galbraith, J. K. (1967). The New Industrial State, Hamish Hamilton,
London.
G. Barta, Agnes (1993). ‘A teamek: A cel szentesıti. . . ? (A Teams: Do
the Goals Justify. . . ?)’, Figyelo p. 29.
Geringer, J. Michael (1991). ‘Strategic Determinants of Partner Selec-
tion Criteria in International Joint Ventures’, Journal of International
Business Studies 22(1): 41–62.
Ginsberg, Ari (1990). ‘Connecting Diversification to Performance: A So-
ciocognitive Approach’, Academy of Management Review 15(3): 514–
545.
Glaser, G. Barney and Anselm L. Strauss (1967). The Discovery
of Grounded Theory: Strategies for Qualitative Research, Weidenfield
and Nicolson, London.
Goodman, P. (1968). ‘The Measurement of Individual’s Cognitive Map’,
Administrative Science Quarterly 13: 246–265.
Gordon, George G. (1991). ‘Industry Determinants of Organizational
Culture’, Academy of Management Review 16(2): 396–415.
Graddick, M. and J. Farr (1983). ‘Professionals in Scientific Disci-
plines: Sex-related Differences in Working Life Commitments’, Jour-
nal of Applied Psychology 68: 641–645.
Gray, Barbara and Aimin Yan (1992). ‘A Negotioations Model of
Joint Venture Formation, Structure and Performance: Implications for
307

Global Management’, Advances in International Comparative Man-
agement, Vol. 7, Jai Press, Greenwich, CT, pp. 41–75.
Grinyer, Peter H. and David Norburn (1977-78). ‘Planning for Ex-
isting Markets: An Empirical Study’, International Studies of Man-
agement and Organization 7: 99–122.
Grinyer, Peter H. and J. C. Spender (1979). Turnaround: The Fall
and Rise of the Newton Chambers Group, Associated Business Press,
London.
Gyenis, Agnes and Tamas Szalai (1992). ‘A G Nyomasa alatt a ma-
gyar kormany? (Is the Hungarian Government under Pressure from
G?)’, Napi.
Haire, Mason, Edwin E. Ghiselli and Lyman W. Porter (1966).
Managerial Thinking: An International Study, Wiley, New York.
Hall, Roger I. (1984). ‘The Natural Logic of Management Policy Mak-
ing: Its Implications for the Survival of an Organization’, Management
Science 30(8): 905–927.
Hambrick, Donald C. (1994). ‘Upper Echelons Research: Demograph-
ics as Means, Not Ends’, Academy of Management, Dallas.
Hambrick, Donald C. and Gerald L. Brandon (1988). ‘Executive
Values’, in Donald C. Hambrick (ed.), The Executive Effect: Concepts
and Methods for Studying Top Managers, Vol. 2 of Strategic manage-
ment policy and planning series, Jai Press, Greenwich, Conn, pp. 3–34.
Hambrick, Donald C. and Phyllis A. Mason (1984). ‘Upper Eche-
lons: The Organization as a Reflection of Its Top Managers’, Academy
of Management Review 9: 193–206.
Hannan, Michael T. and John Freeman (1977). ‘The Population
Ecology of Organizations’, American Journal of Sociology 82: 929–
964.
308

Hannan, Michael T. and John Freeman (1989). Organizational Ecol-
ogy, Harvard University Press, Cambridge, MA.
Haraszti, Miklos (1977). A Worker in a Worker’s State, Penguin,
Harmondsworth.
Harbison, F. and C. A. Myers (1959). Management in the Industrial
World, McGraw-Hill, New York.
Harrigan, Kathryn Rudie (1985). Strategies for Joint Venture Success,
Lexington, Lexington, Mass.
Harrigan, Kathryn Rudie (1988). ‘Strategic Alliances and Partner
Assymetries’, in Farok J. Contractor and Peter Lorange (eds), Co-
operative Strategies in International Business, Lexington Books, New
York, pp. 205–226.
Haspeslagh, Philippe C. and David B. Jemison (1991). Managing
Acquisitions: Creating Value through Corporate Renewal, Free Press,
New York.
Hatten, Kenneth J. and Mary Louise Hatten (1987). ‘Strategic
Groups, Asymmetrical Mobility Barriers and Contestability’, Strategic
Management Journal 8: 329–342.
Hays, William L. (1988). Statistics, fourth edn, Holt, Rinehart & Win-
ston, New York.
Hedlund, Gunnar and Adne Kverneland (1993). ‘Are Entry Strate-
gies for Foreign Markets Changing? The Case of Swedish Investment
in Japan’, in Peter J. Buckley and Pervez Ghauri (eds), The Interna-
tionalization of the Firm, Academic Press, London, pp. 106–123.
Heimer, Gyorgy (1992). ‘Ego (Burning)’, Heti Vilaggazdasag.
Helgesen, Sally (1990). The Female Advantage: Women’s Ways of
Leadership, Doubleday, New York.
309
Heller, Frank A. (1969). ‘Group Feedback Analysis: A Method of Field
Research’, Psychological Bulletin 72(2): 108–117.
Henning, Margaret and Anne Jardim (1977). The Managerial
Woman, Pocket books, New York.
Hirschman, A. O. (1964). ‘The Paternity of an Index’, American Eco-
nomic Review 54: 761–762.
Hitt, Michael A. and Beverly B. Tyler (1991). ‘Strategic Deci-
sion Models: Integrating Different Perspectives’, Strategic Manage-
ment Journal 12: 327–351.
Hofstede, Geert (1980). Culture’s Consequences: International Differ-
ences in Work Related Values, Sage, Beverly Hills, CA.
Hofstede, Geert (1991). Culture and Organizations: Software of the
Mind, McGraw-Hill, New York.
Hofstede, Geert (1994a). Cultures and Organizations, HarperCollins,
London.
Hofstede, Geert (1994b). ‘Management Scientists Are Human’, Man-
agement Science 40(1): 4–13.
Hofstede, Geert, Bram Neuyen, Denise D. Ohayv and Geert
Sanders (1990). ‘Measuring Organizational Cultures: A Qualitative
and Quantitative Study across Twenty Cases’, Adminstrative Science
Quaterly 35: 286–316.
Hofstede, Geert, Micheal Harris Bond and Chung-leung Luk
(1993). ‘Individual Preceptions of Organizational Cultures: A
Methodological Treatise on Levels of Analysis’, Organization Studies
14(4): 483–504.
Houghton, Susan M. and Donalds O. Neubaum (1994). ‘Do Ex-
ecutives Really Have Selective Perceptions?’, in Dorothy P. Moore
310

(ed.), Best Papers Proceedings, 94, Academy of Management, Dallas,
pp. 372–376.
Hrebiniak, Lawrence G. and Charles C. Snow (1982). ‘Top-
Management Agreement and Organizational Performance’, Human
Relations 35(12): 1139–1158.
Huff, Anne S. and Charles R. Schwenk (1990). ‘Bias and Sensemak-
ing in Good Times and Bad’, in A. S. Huff (ed.), Mapping Strategic
Thought, Wiley, New York, pp. 89–108.
Huff, Anne S. (ed.) (1990). Mapping Strategic Thought, John Wiley &
Sons, New York.
Huff, Anne Sigismund (1982). ‘Industry Influences on Strategy Refor-
mulation’, Strategic Management Journal 3: 119–131.
Hulin, C. L. and P. C. Smith (1964). ‘Sex Differences in Job Satisfac-
tion’, Journal of Applied Psychology 48: 88–92.
Inzelt, Annamaria (1993). ‘Vajudas idejen (Birth Pains)’, Figyelo: Top
200, Figyelo, Budapest, p. 5.
Ireland, Duane R., Michael A. Hitt, Richard A. Bettis and
Deborah Auld de Porras (1987). ‘Strategy Formulation Pro-
cesses: Differences in Perceptions of Strengths and Weaknesses Indi-
cators and Environmental Uncertainty by Managerial Level’, Strategic
Management Journal 8: 469–485.
Jackofsky, Ellen F. and John W. Slocum (1988). ‘CEO Roles across
Cultures’, in Donald C. Hambrick (ed.), The Executive Effect: Con-
cepts and Methods for Studying Top Managers, Vol. 2 of Strategic
management policy and planning series, Jai Press, Greenwich, Conn,
pp. 67–99.
311

Jackson, Susan E. (1992). ‘Consequences of Group Composition for
the Interpersonal Dynamics of Strategic Issue Processing’, in Paul
Shrivastava, Anne Huff and Jane Dutton (eds), Advances in Strategic
Management, Vol. 8, Jai Press, Greenwich, CT, pp. 345–382.
James, L. R. (1982). ‘Aggregation Bias in Estimates of Perceptual Agree-
ment’, Journal of Applied Psychology 69: 85–98.
Janis, I. (1972). Victims of Groupthink, Houghton-Mifflin, Boston.
Johanson, Jan and Finn Wieldersheim-Paul (1975). ‘The Internal-
ization of the Firm: Four Swedish Cases’, Journal of Management
Studies 12(3): 305–322.
Johanson, Jan and Jan-Erik Vahlne (1977). ‘The Internationalization
Process of the Firm: A Model of Knowledge Development and Increas-
ing Foreign Market Commitment’, Journal of International Business
Studies.
Johanson, Jan and Jan-Erik Vahlne (1993). ‘The Internalization Pro-
cess of the Firm: A Model of Knowledge Development and Increas-
ing Foreign Market Commitment’, in J. Peter Buckley and Pervez
Ghauri (eds), The Internalization of the Firm, Academic Press, Lon-
don, pp. 32–44.
Johnson, Gerry and Howard Thomas (1987). ‘The Industry Group
Context of Strategy, Structure and Performance: The UK Brewing
Industry’, Strategic Management Journal 8: 343–361.
Kalleberg, Arne L. (1992). ‘Employment Relations and Work Atti-
tudes in Hungary and the United States’, in Gyorgy Lengyel, Offe
Claus and Tholen Jochen (eds), Economic Institutions, Actors and
Attitudes: East-Central Europe in Transition, Vol. 8 of Sociological
Working Papers, Budapest University of Economic Sciences. Depart-
ment of sociology, Budapest, pp. 193–210.
312

Kerr, C. (1983). The Future of Industrial Societies: Convergence or
Continued Diversity?, Harvard University Press, Cambridge, Mass.
Kerr, C., J. T. Dunlop, F. Harbison and C. A. Myers (1960).
Industrialism and Industrial Man, Penguin, Harmondsworth.
Killing, J. Peter (1983). Strategies for Joint Venture Success, Croom
Helm, London.
Killing, J. Peter (1988). ‘Understanding Alliances: The Role of Task
and Organizational Complexity’, in Farok J. Contractor and Peter
Lorange (eds), Cooperative Strategies in International Business, Lex-
ington, Lexington, MA, pp. 55–67.
Klein, Katherine J., Fred Dansereau and Rosalie J. Hall (1994).
‘Levels Issues in Theory Development, Data Collection and Analysis’,
Academy of Management Review 19(2): 195–229.
Kluckhohn, C. (1946). Culture and Behavior, Free Press, New York.
Kornai, Andras (1993). ‘The Generative Power of Feature Geometry’,
Annals of Mathematics and Artifical Intellingence 8: 37–46.
Kornai, Janos (1957). A gazdasagi vezetes tulzott kozpontosıtasa (The
Overcentralization of Economic Management), Kozgazdasagi es Jogi
Konyvkiado, Budapest.
Kornai, Janos (1980). The Economics of Shortage, North-Holland, Am-
sterdam.
Kornai, Janos and Agnes Matits (1990). ‘The Bureaucratic Redistri-
bution of the Firm’s Profit’, Vision and Reality, Market and State:
Contradictions and Dilemmas Revisited, Corvina, and Harvester-
Wheatsheaf and Routledge, Budapest and New York, pp. 54–98.
Kotha, Suresh, Roger L. M. Dunbar and Allan Bird (1993).
‘Strategic Action Generation: A Comparison of Emphasis Places
313

on Generic Competitive Methods by US and Japanese Managers’,
manuscript, NYU, New York. revised version 4.0 (November).
Lachman, Ran, Albert Nedd and Bob Hinings (1994). ‘Analyz-
ing Cross-National Management and Organizations: A Theoretical
Framework’, Management Science 40(1): 40–55.
Langfield-Smith, Kim M. and Andrew Wirth (1992). ‘Measuring
Differences between Cognitive Maps’, Journal of the Operational Re-
search Society 43(12): 1135–1150.
Laukkanen, Mauri (1989). ‘Understanding the Formation of Managers’
Cognitive Maps: A Comparative Case Study of Context Traces in Two
Business Firm Clusters’.
Laukkanen, Mauri (1990). ‘Describing Management Cognition: The
Cause Mapping Approach’, Scandinavian Journal of Management
6(3): 197–216.
Laukkanen, Mauri (1992). Comparative Cause Mapping of Manage-
ment Cognitions: A Computer Database Method for Natural Data,
Helsinki School of Economics and Business Administration Publica-
tions, Helsinki.
Laukkanen, Mauri (1994). ‘Maps of Success and Demise: Comparing
Enterpreneur-Managers’ Knowledge-bases’, Academy of Management
Meetings, Dallas.
Lawless, Michael W. and Linda K. Finch (1989). ‘Choice and De-
terminism: A Test of Hrebiniak and Joyce’s Framework on Strategy–
Environment Fit’, Strategic Management Journal 10: 351–365.
Lawrence, Paul and Charalambos Vlachoutsicos (1993). ‘Joint
Ventures in Russia: Put the Locals in Charge’, Harvard Business Re-
view (January-February): 44–54.
314

Lawrence, Paul R. and Jay W. Lorsch (1967). Organization and En-
vironment: Managing Differentiation and Integration, Harvard Uni-
versity Press, Cambridge, MA.
Lefkowitz, Joel (1994). ‘Sex-related Differences in Job Attitudes and
Dispositional Variables: Now You See Them. . . ’, Academy of Man-
agement Journal 37(2): 323–349.
Lewis, Pam and Howard Thomas (1990). ‘The Linkage between Strat-
egy, Strategic Groups, and Performance in the U.K. Retail Grocery
Industry’, Strategic Management Journal 11: 385–397.
Lord, Robert G. and Karen J. Maher (1993). Leadership and Infor-
mation Processing: Linking Perceptions and Performance, Routledge,
London.
Lyles, Marjorie A. and Rhonda K. Reger (1993). ‘Managing for
Autonomy in Joint Ventures: A Longitudinal Study of Upward Influ-
ence’, Journal of Management Studies 30(3): 383–404.
Magyar Hırlap (1992). ‘Tarsasagot alapıtottak a multik (The Multina-
tionals Set Up an Association)’, Magyar Hırlap.
March, James G. (1988). ‘Bounded Rationality, Ambiguity, and the
Engineering of Choice’, in David E. Bell, Howard Raiffa and Amos
Tversky (eds), Decision Making: Descriptive, Normative, and Pre-
scriptive Interactions, Cambridge University Press, Cambridge, Eng-
land, pp. 33–57.
Markoczy, Lıvia (1986). Berpreferencia-rendszerunk tortenete 1968-tol
napjainkig (The History of Governmental Wage Preferences from 1968
to the Present), ‘Doctori’ thesis, Budapest University of Economics.
Markoczy, Lıvia (1992a). ‘Measuring Managerial Beliefs about Business
in International Mixed Management Organizations (IMMOs) Located
315

in Hungary’, first year report, Judge Institute of Management Studies
University of Cambridge, Cambridge.
Markoczy, Lıvia (1992b). ‘Review of Gabor Revesz “Perestroika in
Eastern Europe: Hungary’s Economic Transformation 1945–1988”’,
Human Systems Management 10(2): 110–111.
Markoczy, Lıvia (1993a). ‘Commentary on “A Sino-Hungarian-U.S.
Perspective on Joint Venture Success”’, in Paul Shrivastava, Anne S.
Huff and Jane Dutton (eds), Advances in Stategic Management, Vol. 9,
Jai Press, Greenwich, Conn, pp. 317–322.
Markoczy, Lıvia (1993b). ‘Managerial and Organizational Learning in
Hungarian–Western Mixed Management Organizations’, International
Journal of Human Resource Management 4(2): 277–304.
Markoczy, Lıvia (1994). ‘Barriers to Shared Belief: The Role of Man-
agerial Characteristics, Environmental Factors, and Strategic Inter-
est’, Meeting of the Academy of Management, Dallas.
Markoczy, Lıvia (1995). ‘States and Belief States’, International Jour-
nal of Human Resource Management.
Markoczy, Lıvia and Jeff Goldberg (1993). ‘A Method for Eliciting
and Comparing Causal Maps’, Working Paper 93/5, Business Eco-
nomics Department, Budapest University of Economics, Budapest.
Markoczy, Lıvia and Jeff Goldberg (1995). ‘A Method for Eliciting
and Comparing Causal Maps’, Journal of Management 21(2): 305–
333.
Markoczy, Lıvia and John Child (1994). ‘International Mixed Man-
agement Organizations and Economic Liberalization in Hungary:
From State Bureaucracy to New Paternalism’, in Howerd Thomas
(ed.), Strategic Management Series, John Wiley & Sons, New York.
316

Martin, Godfrey (1994). ‘Valoban olyan magasak a magyarorszagi
munkaero koltsegek? (Is It Really the Case that the Hungarian Labour
Force Costs Are High?)’, Report 9, International Labour Organization.
Maurice, Marc, Arndt Sorge and Malcolm Warner (1980). ‘So-
cietal Differences in Organizing Manufacturing Units: A Comparison
of France, West Germany and Great Britain’, Organization Studies
1(1): 59–86.
McGee, John and Howard Thomas (1986). ‘Strategic Groups: Theory,
Research and Taxonomy’, Strategic Management Journal 4: 141–160.
McKeithen, Kathrine B., Judith S. Reitman, Henry H. Rueter
and Stephen C. Hirtle (1981). ‘Knowledge Organization and Skill
Differences in Computer Programmers’, Cognitive Psychology 13: 307–
325.
Meixner, Zoltan (1991). ‘Jokedv es fenyes jovo? A technikak (A Happy
and Bright Future? A Technology)’, Figyelo.
Michel, John G. and Donald C. Hambrick (1992). ‘Diversifica-
tion Posture and Top Management Team Characteristics’, Academy
of Management Journal 35(1): 9–37.
Miles, Matthew B. and A. Michael Huberman (1984). Qualitative
Data Analysis, Sage, London.
Miller, George A. (1987). ‘Meta-analysis and the Culture-free Hypo-
thesis’, Organization Studies 8(4): 309–325.
Mintzberg, Henry (1983). Power in and around Organizations, Pren-
tice-Hall, Englewood Cliffs, NJ.
Mody, Ashoka (1993). ‘Learning Through Alliances’, Journal of Eco-
nomic Behavior and Organization 20: 151–170.
317

Narayanan, V. K. and Liam Fahey (1990). ‘Evolution of Revealed
Causal Maps during Decline: A Case Study of Admiral’, in Sigis-
mund Anne Huff (ed.), Mapping Strategic Choice, John Wiley, New
York, pp. 109–133.
Nepszabadsag (1993a). ‘A a hatso udvarban (A in the Back Courtyard)’,
Nepszabadsag.
Nepszabadsag (1993b). ‘A G tulajdona lett a A (A Now Belongs to G)’,
Nepszabadsag.
Nepszabadsag (1993c). ‘Mar regen tulleptuk as orszaghatarokat (We’ve
Crossed the Borders Long Ago)’, Nepszabadsag.
Nepszava (1991). ‘Amerika legnagyobb befektetese hazankban (America’s
Largest Investment in Hungary)’, Nepszava.
Newman, William H. (1992). ‘Focused Joint Ventures in Transforming
Economies’, Academy of Management Executive 4(1): 67–75.
Oliver, Nick and Annatte Davies (1990). ‘Adopting Japanese-style
Manufacturing Methods: A Tale of Two (UK) Factories’, Journal of
Management Studies.
Ottaway, R. N. and D. Bhatnagar (1988). ‘Personality and Bi-
ographical Differences between Male and Female Managers in the
United States and India’, Applied Psychology: An international re-
view 37: 201–212.
Parkhe, Arvind (1991). ‘Interfirm Diversity, Organizational Learning,
and Longevity in Global Strategic Alliances’, Journal of International
Business Studies (Fourth Quarter): 579–601.
Parkhe, Arvind (1993). ‘Messy research: Methodological predispositions
and theory development in international joint ventures’, Academy of
Management Review 18(2): 227–268.
318

Park, Hoon, Pamela S. Lewis and Patricia M. Fandt (1993). ‘Eth-
nocentrism and Group Cohesiveness: Implications for International
Joint Ventures’, in Refik Culpan (ed.), Multinational Strategic Al-
liances, International Business Press, New York, pp. 273–291.
Pearce, Jone L. (1991). ‘From Socialism to Capitalism: The Effects
of Hungarian Human Resource Practices’, Academy of Management
Executive 5(4): 75–88.
Pearce, Jone L., Imre Branyiczki and Gyula Bakacsi (1994).
‘Person-Based Reward Systems: A Theory of Organizational Reward
Practices in Reform-Communist Organizations’, Journal of Organiza-
tional Behavior 15: 261–282.
Peto, Ivan and Sandor Szakacs (1985). A hazai gazdasag negy ev-
tizedenek tortenete: 1945–1985 (The Domestic Economic History of
Four Decades: 1945–1985), Kozgazdasagi es Jogi Konyvkiado, Bu-
dapest.
Pfeffer, Jeffrey and P. Nowak (1976). ‘Joint Ventures and Interorga-
nizational Interdependence’, Admistrative Science Quarterly 21: 398–
418.
Porac, Joseph F., Howard Thomas and Charles Baden-Fuller
(1989). ‘Competitive Groups as Cognitive Communities: The Case
of Scottish Knitwear Manufacturers’, Journal of Management Studies
26(4): 397–416.
Porter, Michael E. (1980). Competitive Strategy, Free Press, New York.
Pugh, Derek S. (1981). ‘The Aston Program of Research: Retrospect
and Prospect’, in A. H. Van de Ven and W.F. Joyce (eds), Perspectives
on Organization Design and Behavior, Wiley, New York, pp. 135–166.
Pugh, D[erek] S., D[avid] J. Hickson, C. R. Hinings and C.
319

Turner (1969). ‘The Context of Organization Structures’, Adminis-
trative Science Quarterly 14(1): 91–114.
Quinn, Naomi and Dorothy Holland (1987). ‘Culture and Cognition’,
in Dorothy Holland (ed.), Cultural Models in Language and Thought,
Cambridge University Press, Cambridge, pp. 3–40.
Reger, Rhonda K. and Anne Sigismund Huff (1993). ‘Strategic
Groups: A Cognitive Perspective’, Strategic Management Journal
14: 103–124.
Reti, Pal (1992). ‘Egybesult Izzo: Vezervaltas a A-nal (Incandescent
Fusing: Leadership Change at A)’, Heti Vilaggazdasag pp. 84–85.
Revesz, Gabor (1990). Perestroika in Eastern Europe: Hungary’s Eco-
nomic Transformation 1945–1988, Westview Press, Boulder, CO.
Roberts, Fred S. (1976). ‘The Questionnaire Method’, in Robert Ax-
elrod (ed.), Structure of Decision. The Cognitive Maps of Political
Elites, Princeton University Press, Princeton, NJ.
Rokeach, M. (1973). The Nature of Human Values, Free Press, New
York.
Ronen, S. and O. Shenkar (1985). ‘Clustering Countries on Attitudi-
nal Dimensions: A Review and Synthesis’, Academy of Management
Review 28: 435–454.
Ross, Robert T. (1934). ‘Optimum Orders for the Presentation of Pairs
in the Method of Paired Comparison’, Journal of Educational Psy-
chology 25: 375–382.
Sales, A. and P. H. Mirvis (1985). ‘When Cultures Collide: Issues in
Acquisitions’, in J. R. Kimberly and R. E. Quinn (eds), New Futures:
The Challenge of Managing Corporate Transitions, Dow Jones-Irwin,
Homewood, IL, pp. 107–133.
320

Sandy, Robert (1989). Statistics for Business and Economics, McGraw-
Hill, New York.
Sarkozi, Tamas (1993). A privatizacio joga Magyarorszagon (Privatiza-
tion Rights in Hungary), Akademiai Kiado, Budapest.
Schaan, Jean-Louis (1988). ‘How to Control a Joint Venture Even as a
Minority Partner’, Journal of General Management 14(1): 4–16.
Schneider, Susan C. (1989). ‘Stategy Formulation: The Impact of Na-
tional Culture’, Organization Studies 10(2): 149–168.
Schneider, Susan C. and Arnold de Meyer (1991). ‘Interpreting
and Responding to Strategic Issues: The Impact of National Culture’,
Strategic Management Journal 12: 307–320.
Schweitzer, Ivan (1982). ‘A vallalatnagysagrol (On the Size of Compa-
nies)’.
Schwenk, Charles R. (1984). ‘Cognitive Simplification Processes in
Strategic Decision-Making’, Strategic Management Journal 5: 11–128.
Seeger, John A. (1993). ‘Causal Maps and Causal Theory Models: Two
Views of Systems Theory’, Meeting of the Academy of Management,
Atlanta.
Shenkar, Oded and Yoram Zeira (1987). ‘Human Resource Manage-
ment in International Joint Ventures: Directions for Research’, Acad-
emy of Management Review 12(3): 546–557.
Siegel, Sidney (1956). Nonparametric Statistics: For the Behavioral
Sciences, Series in Psychology, McGraw-Hill, New York.
Silverman, David (1970). The Theory of Organizations, Heinemann,
London.
321

Simons, Tony (1993). ‘Speech Patterns and the Concept of Utility in
Cognitive Maps: The Case of Integrative Bargaining’, Academy of
Management Journal 36(1): 139–156.
Slovic, P. and S. Lichtenstein (1971). ‘Comparison of Bayesian
and Regression Approaches to the Study of Information Process-
ing in Judgement’, Organizational Behavior and Human Performance
6: 649–744.
Smith, Peter B. (1993). ‘Some Technical Aspects of the Trompenaars
Data Bank’, in Fons Trompanaars (ed.), Riding the Waves of Culture,
Economist Books, London, chapter Appendix 1.
Snyder, Mark (1984). ‘When Belief Creates Reality’, Advances in ex-
perimental social psychology 18: 248–305.
Spender, J. C. (1989). Industry Recipes: An Enquiry into the Nature
and Sources of Management Judgement, Basil Blackwell, Oxford.
Stevenson, Howard H. (1976). ‘Defining Corporate Strenghts and
Weaknesses’, Sloan Management Review 17(3): 51–68.
Stewart, David W. and Donald R. Latham (1980). ‘A Preference
Mapping of Organizational Objectives of Sports Franchise Executives’,
Journal of Applied Psychology 65(5): 610–615.
Stopford, John M. (1993). ‘Organizing the Multinational Firm: Can
the Americans Learn from Europeans?’, in Peter J. Buckley and Pervez
Ghauri (eds), The Internationalization of the Firm, Academic Press,
London, pp. 186–199.
Svantek, Janos (1992). ‘Kettos kotesben: Beszelgetes Vigh Karollyal, a
A kornyezetvedelmi igazgatojaval (In a Double Bind: Interview with
Karoly Vigh, Environment Protection Director of A)’, Munkavedelem.
322

Szalai, Erzsebet (1989). Gazdasagi mechanizmus reformtorekvesek es
nagyvallalati erdekek (Economic Mechanism Reform Efforts and In-
terests of Large-Scale Companies), Kozgazdasagi es Jogi Konyvkiado,
Budapest.
Szalai, Tamas (1992). ‘Latastol vakolasig: Konjunktura jelek az epıto-
iparban (From Dawn to Plastering: Signs for Prosperity in the Build-
ing Industry)’, Heti Vilaggazdasag.
Szentgyorgyi, Zsuzsa (1992). ‘A feltamasztott Brody-labor: Kivallo-
sagi kozpontok a A-nel (The Resurrected Brody Laboratory: Centers
of Excellence in A)’, Nepszabadsag.
TDFSz (1992). ‘A A Dolgozok Fuggetlen Szakszervezete allasfogalasa az
1992. evi negyedik negyedevi letszamleepitesekrol (The Position of the
A Employees Independent Trade Union about the Lay Offs Planned
for the Fourth Quarter of 1992)’. (Paid advertisement).
Teece, D. J. (1982). ‘Towards an Economic Theory of the Multiproduct
Firm’, Journal of Economic Behavior and Organization.
Thomas, James B., Shawn M. Clark and Dennis A. Gioia (1993).
‘Strategic Sensemaking and Organizational Performance: Linkages
among Scanning, Interpretation, Action, and Outcomes’, Academy of
Management Journal 36(2): 239–270.
Thompson, J. D. (1967). Organizations in Action, McGraw-Hill, New
York.
Thorelli, H. B. (1986). ‘Networks: Between Markets and Hierarchies’,
Strategic Management Journal.
Tomlinson, James W. C. (1970). The Joint Venture Process in Inter-
national Business: India and Pakistan, MIT Press, Cambridge, Mass.
323
Triandis, Harry C. (1975). ‘Culture Training, Cognitive Complexity
and Interpersonal Attitudes’, in Richard W. Brislin, Stephen Bochner
and Walter J. Lonner (eds), Cross-Cultural Perspectives on Learning,
Wiley, New York, pp. 39–77.
Triandis, Harry C. (1989). ‘The Self and Social Behavior in Differing
Cultural Contexts’, Psychological Review 96: 506–520.
Trompanaars, Fons (1993). Riding the Waves of Culture, Economist
Books, London.
Tversky, Amos and Daniel Kahneman (1988). ‘Rational Choice and
the Framing of Decisions’, in David E. Bell, Howard Raiffa and Amos
Tversky (eds), Decision Making: Descriptive, Normative, and Pre-
scriptive Interactions, Cambridge University Press, Cambridge, Eng-
land, pp. 167–192.
van den Honert, Robin C. and Theodor J. Stewart (1992). ‘A
Game-Theoretic Model for Mergers and Acquisitions’, European Jour-
nal of Operational Research 59: 275–287.
Varga, Gyorgy (1992). ‘Ez nem egyertelmuen egy uzletbarat kormany
(This Is Not Entirely a Business Friendly Government)’, Figyelo.
Vilaggazdasag (1993). ‘E-Bazis Dunaharasztiban (E Base in Dunaha-
raszti)’, Vilaggazdasag p. 1.
Voszka, Eva (1988). Reform es atszervezes a nyolcvanas evekben (Reform
and Reorganization in the 1980s), Kozgazdasagi es Jogi Konyvkiado,
Budapest.
Voszka, Eva (1992). ‘Spontaneous Privatization in Hungary: Predictions
and Real Issues’, in Gyorgy Lengyel, Offe Claus and Tholen Jochen
(eds), Economic Institutions, Actors and Attitudes: East-Central Eu-
rope in Transition, Vol. 8 of Sociological Working Papers, Budapest
324

University of Economic Sciences. Department of sociology, Budapest,
pp. 69–78.
The Wall Street Journal (1992). ‘G Slows Investment in Hungarian
Firm’, The Wall Street Journal.
Walsh, James P. (1988). ‘Selectivity and Selective Perception: An Inves-
tigation of Managers’ Belief Structures and Information Processing’,
Academy of Management Journal 31(4): 873–896.
Walsh, James P. and Liam Fahey (1986). ‘The Role of Negotiated Be-
lief Structures in Strategy Making’, Journal of Management 12: 325–
338.
Weick, Karl E. (1979). The Social Psychology of Organizing, second
edn, Addison Wesley, Reading, MA.
Welfens, Paul J. J. (1992). ‘Foreign Investment in the East European
Transition’, Management International Review 32(3): 199–218.
Whitley, Richard (ed.) (1993). European Business Systems, Sage, Lon-
don.
Whitley, W. and George W. England (1980). ‘Variability in Com-
mon Dimensions of Managerial Values Due to Value Orientation and
Country Differences’, Personal Psychology 33: 77–89.
Wiersema, Margarethe F. and Allan Bird (1993). ‘Organizational
Demography in Japanese Firms: Group Heterogeneity, Individual Dis-
similarity, and Top Management Team Turnover’, Academy of Man-
agement Journal 36(5): 996–1025.
Wiersema, Margarethe F. and Karen A. Bantel (1992). ‘Top
Management Team Demography and Corporate Strategic Change’,
Academy of Management Journal 35(1): 91–121.
325