barley–pea intercropping: effects on land productivity, carbon and nitrogen transformations
TRANSCRIPT

Field Crops Research xxx (2014) xxx–xxx
G ModelFIELD 6252 No. of Pages 8
Barley–pea intercropping: Effects on land productivity, carbon andnitrogen transformations
Tejendra Chapagain *, Andrew RisemanFaculty of Land and Food Systems, The University of British Columbia, 344-2357 Main Mall, Vancouver, BC V6T 1Z4, Canada
A R T I C L E I N F O
Article history:Received 25 April 2014Received in revised form 9 June 2014Accepted 10 June 2014Available online xxx
Keywords:IntercroppingN-transferNet ecosystem CO2 exchangeGross ecosystem photosynthesisNet ecosystem productivityCarbon sequestration
A B S T R A C T
Declining land productivity associated with decreasing soil organic carbon (SOC) and nitrogen (N) aresignificant issues in monoculture barley production. An intercropping system combining barley and peamay help increase land productivity as well as to maintain SOC and soil mineral N. We grew barley as amonoculture and intercropped with pea without fertilizers in rows of barley:pea 1:1 and 2:1 as well asbroadcast arrangements for two years to observe the effects of species ratios and spatial configuration onland productivity, biological nitrogen fixation and transfer, C and N accumulation in abovegroundbiomass, soil mineral N balance, gross ecosystem photosynthesis (GEP), and net ecosystem productivity(NEP). 15N natural abundance method was used to quantify N fixation and subsequent transfer. Field CO2
exchange measurements used a dynamic closed transparent chamber connected to a portable CO2
analyzer.Intercropping displayed higher land productivity (12–32%) compared to monoculture plots, with 2:1arrangement producing the highest total land outputs – TLO (5.9 t ha�1) and land equivalent ratio – LER(1.32) values. Intercropped barley showed higher biomass N, grain protein and sequestered higher C insoil compared to monocultured barley. Intercropped pea displayed increased nodulation (27–45%) andsymbiotic N2 fixation (9–17%) compared with monoculture pea resulting in the fixation of 60–78 kgN ha�1. The highest rate of N-transfer (11%), and increased N accumulation (i.e., 200% higher thanmonocultured barley) in shoot biomass was observed in 1:1 arrangement. However, 2:1 arrangementaccumulated higher C (196 g C m�2 year�1, i.e., 53% higher) in shoot biomass compared to themonoculture barley plots. The 2:1 arrangement also displayed the greatest NEP resulting in the highestsoil C sequestration at a seasonal daytime average rate of 229 mg C m�2 h�1 (i.e., 10% higher than barleymonoculture plots). This study demonstrated that intercropping barley and pea is an efficient strategy toincrease land productivity, grain and biomass quality, N and C yields, GEP and NEP, and that planting inrows of 2:1 was the most productive arrangement.
ã 2014 Elsevier B.V. All rights reserved.
Contents lists available at ScienceDirect
Field Crops Research
journa l homepage: www.elsevier .com/ locate / fcr
1. Introduction
The environmental challenges attributed to agriculture arerelated primarily to reduced soil, water and air quality often arisingfrom inappropriate nutrient management strategies. Farmerstypically use chemically intensive practices to maintain soilproductivity combined with other management practices thatdecrease soil organic matter (SOM) while increasing soil erosion,acidification and salinization (Dumanski et al., 1986). The soilorganic carbon (SOC) pools in agricultural systems are currently indisequilibrium with the environment as the losses attributed to
* Corresponding author. Tel.: +1 604 822 9607.E-mail addresses: [email protected] (T. Chapagain),
[email protected] (A. Riseman).
http://dx.doi.org/10.1016/j.fcr.2014.06.0140378-4290/ã 2014 Elsevier B.V. All rights reserved.
Please cite this article in press as: Chapagain, T., Riseman, A., Barley–petransformations, Field Crops Res. (2014), http://dx.doi.org/10.1016/j.fcr.2
decomposition exceed the gains associated with biomass addition(Jarecki and Lal, 2003). Atmospheric CO2 concentrations have risenfrom approximately 315 ppm in 1959 to the current average of401 ppm (UCSD, 2014), and are projected to reach as high as 500–1000 ppm by 2100 (IPCC, 2007). This suggests development ofagricultural systems that fix more CO2 (i.e., greater grossecosystem photosynthesis, GEP) with the release of less CO2
(i.e., ecosystem respiration – Re) which would help balance, andultimately move to positive CO2 movement between agriculturalecosystems and the atmosphere, a term referred to as netecosystem CO2 exchange (NEE). In addition, sustainable nitrogen(N) management is particularly challenging because of increasingcosts of mineral N fertilizers, coupled with N fertilizer’s emission ofnitrous oxide (N2O), and nitrate’s potential to contaminate bothground and surface water (Ferguson et al., 1999). The nature ofthese challenges suggests that more effort is needed to develop
a intercropping: Effects on land productivity, carbon and nitrogen014.06.014

2 T. Chapagain, A. Riseman / Field Crops Research xxx (2014) xxx–xxx
G ModelFIELD 6252 No. of Pages 8
sustainable and ecologically sound nutrient management practicesthat are scalable to large farms. For small grain production, onestrategy that addresses many of these concerns is the inclusion ofgrain legumes with cereal crops (i.e., intercropping) under organicproduction practices.
Intercropping, which is defined as growing two or morespecies simultaneously in the same field during a growingseason (Ofori and Stern, 1987), is considered one importantstrategy in developing sustainable production systems, particu-larly systems that aim to limit external inputs (Adesogan et al.,2002). Typical species or functional groups used in intercrop-ping include wheat, rye, oats, and barley (i.e., cereals), clover,beans, peas, and vetch (i.e., legumes), and buckwheat, flax, andchicory (i.e., non-leguminous forbs). When one species isnitrogen fixing, the range of ecological services provided bythe intercrop expands to include nutrient management. Overall,the range of benefits identified from intercropping two or morespecies include higher productivity and profitability per unitarea (Yildirim and Guvence, 2005), improved soil fertilitythrough nitrogen fixation (Hauggaard-Nielsen et al., 2001,2009), increased efficiency of resources (Knudsen et al.,2004), reduced damage caused by pests, diseases and weeds(Banik et al., 2006; Sekamatte et al., 2003), improved foragequality (Bingol et al., 2007; Lithourgidis et al., 2007; Ross et al.,2004) and improvements in carbon and nitrogen dynamics(Oelbermann and Echarte, 2011; Dyer et al., 2012).
Pea (Pisum sativum L., Fabaceae Lindl.) is one of the mostcommonly used grain legumes as an intercrop in wheat or barleycropping systems that may provide a new opportunity to develop aproduction system that fulfills both economic and environmentalinterests. Specifically, when pea has been intercropped with barley,results included increased yields (Hauggaard-Nielsen et al., 2009),increased land equivalent ratio (Chen et al., 2004; Sahota andMalhi, 2012), improved grain and forage quality (Carr et al., 2004;Lauk and Lauk, 2008), and greater N recovery (Hauggaard-Nielsenet al., 2009). While intercropping barley and pea is not a newconcept, the previous research primarily focused on assessinggeneral performance metrics, i.e., land productivity, N yield,disease and pest pressure, crop competition, and weed control(Hauggaard-Nielsen et al., 2001, 2009). The effects of speciesproportion and their spatial arrangement on N-use efficiency (i.e.,biological nitrogen fixation and possible transfer to the companionbarley within a season), NEE, GEP, net ecosystem productivity(NEP), and their association with crop performance within anorganic production system has not been previously considered.Therefore, a two-year experiment was conducted to assess adesigned pairing of barley and pea in spatially unique plantingarrangements to identify the spatial arrangements that maximizesynergies, as compared to monoculture plots, including biologicalN fixation and transfers, net ecosystem CO2 exchange andecosystem productivity metrics, and to recommend the bestcombination of practices that are both productive and environ-mentally sustainable. It was expected that the land productivity,C and N accumulation in aboveground biomass, and ecosystemservices are increased in intercrop plots compared to theirmonoculture counterparts.
2. Materials and methods
2.1. Study site, climate and soil description
This study was conducted at the Centre for Sustainable FoodSystems at UBC Farm in Vancouver, BC, during the 2011 and 2012cropping seasons (May–September). The experimental site waslocated at 49�150300N and 123�1402000W, at an altitude of 100 mabove sea level.
Please cite this article in press as: Chapagain, T., Riseman, A., Barley–ptransformations, Field Crops Res. (2014), http://dx.doi.org/10.1016/j.fcr.2
Mean air temperatures for the experimental site during theproduction seasons (May–September) of 2011 and 2012 was15.1 �C, with the warmest days in August (17.5–18.2 �C). The meansoil temperature at 20 cm depth ranged from 17.9 to 18.3 �C.Monthly average solar irradiance ranged from 389 to 404 W m�2,with the higher values from June to August. The average monthlyprecipitation ranged from 32.3 to 42.4 mm. 2012 was drycompared to 2011 with greater levels of solar irradiance associatedwith lower relative humidity and precipitation.
Four random soil samples from across the whole test site werecollected from 0 to 15 cm depth at the time of plot establishment tocharacterize soil fertility (i.e., pH, organic matter, total N, d15N, andavailable P, K, Ca, Mg, Cu, Zn, Fe, Mn and B). The soil was moderatelywell drained coarse textured sandy loam with low to moderatefertility. Soil was homogeneous with a pH value of 5.9, organicmatter content of 117 g kg�1, total N content of 3.5 g kg�1, d15N of3.02m, P of 144 mg kg�1, and K of 183 mg kg�1 based on dry soil.Additional soil samples were taken from two different areas withineach plot before planting (Spring-2011) and after final harvest(Fall-2012), and sent to an analytical laboratory (Pacific SoilAnalysis Inc., Richmond, Canada) to determine soil mineral N (NH4+ and NO3
�) content. The site had not been used for grainproduction in previous years but had been used for annualvegetable cultivation. The site had been managed under organicvegetable production guidelines for more than 10 years usinggreen manures and compost.
2.2. Experimental details
Barley cv. ‘Oxbridge’ and pea cv. ‘Reward’ were selected forintercropping trials based on agronomic performance (i.e.,synchronized maturity for combined harvest, yield, and nodulationpotential in pea) from cultivar evaluation trials (Chapagain andRiseman, 2012). Plants were grown on the same plots underorganic and rain-fed conditions over two years, and managedequally across combinations.
Research plots (4 m � 3 m) were arranged in a randomizedcomplete block design (RCBD) with five treatments and fourreplications. Treatments consisted of barley cv. ‘Oxbridge’ and peacv. ‘Reward’ grown as monocultures, and intercropped in rows ofbarley:pea 1:1, 2:1, and broadcast. In monocultures, barley and peawere planted in rows at the recommended plant density targeting400 and 60 viable plants m�2, respectively. Row and mixedintercropping consisted of planting barley and pea in proportionalreplacement design in which the combined density of thepopulation varied as the proportions of the species changed(Jolliffe, 2000). The 1:1 arrangement consisted of planting barleyand pea in alternate rows targeting 200 and 30 plants m�2,respectively, whereas, 2:1 arrangement targeted 300 barley and 20pea plants m�2. In broadcast arrangement, seeding densities ofbarley and pea were reduced by one half of monoculture densitiestargeting 200 and 30 plants m�2, respectively, and broadcasted andincorporated evenly into the soil. Barley grown as a monoculturewas considered the non-N2-fixing reference plant in analyses. Atleast 50 cm was kept between each plot to minimize treatmentinteractions, and 1 m between each block to facilitate plotmanagement.
Pea seeds were inoculated with commercial rhizobia (GardenInoculant for pea, EMD Crop Bioscience, WI, USA) and plantedimmediately after inoculation. Barley and pea were sown in mid-May in rows using a hand seeder (Jang Clean Hand Seeder, JangAutomation Co. Ltd., Cheongju-city, South Korea) with adjustablesprockets (Front: 11, Rear: 14), and seed plates (G-12 for barley andN-6 for pea). Sowing depth varied with seed size and ranged from3–4 cm for barley to 4–5 cm for pea. Research was conducted underrainfed condition without using fertilizers, pesticides or fungicides.
ea intercropping: Effects on land productivity, carbon and nitrogen014.06.014

T. Chapagain, A. Riseman / Field Crops Research xxx (2014) xxx–xxx 3
G ModelFIELD 6252 No. of Pages 8
2.3. Data collection and analysis
2.3.1. Plant-based parametersData were recorded for number of nodules (in pea), grain yield
(t ha�1), and total plant mass (grain yield + shoot biomass).Nodulation was assessed by counting and inspecting the nodulesof 3 randomly selected plants in both monoculture and intercropplots prior-to-flowering (i.e., 50 days after sowing) following aprocedure similar to Chapagain and Riseman (2012). Spike or podcolor was a determinant of maturity and considered ready forharvest when they were straw-colored and 80% of the grains of thespike were in the hard-dough stage.
Plants in the middle section of each plot, leaving two rows oneither side, were harvested at maturity for yield measurements. Sub-samples were collected from two different 1 m2 areas within eachplot and averaged. Shoots of pea and the non-fixing barley referenceplants were harvested by hand above soil level leaving 5 cm stubble,oven dried at 70 �C for 72 h, and threshed separately by a stationarythresher. Individual crop yield (grain and shoot biomass) wascalculated to permit comparison of yields, land equivalent ratios(LER) and N contents with those when they were grown alone.
2.3.2. Relative and total intercrop productivitySystem productivity was estimated using the land equivalent
ratio (LER) which compares the yield obtained by intercroppingtwo or more species together with yields obtained by growing thesame crops as monocultures. The LER for two intercrop species inproportional replacement design were calculated as follows (Meadand Willey, 1980):
LER ¼ intercrop yieldbarley
mono yieldbarleyþ intercrop yieldpea
mono yieldpea
The yields of mono and intercrop species were calculated as t ha�1.Intercropped plots with LER values greater than 1.0 produced a
yield advantage while plots with values less than 1.0 showed ayield disadvantage. Grain yield was expressed at 12.5% moisture.LER in terms of total plant mass (grain + shoot biomass) productionwas also determined. Intercrop productivity was also assessed interms of total land output, TLO (Jolliffe and Wanjau, 1999) asfollows:
TLO ¼ barley yield þ pea yield
Intercrop plots with greater TLO values compared to monocultureshowed a yield advantage.
2.3.3. Tissue N, C and 15N analysesPlant tissue samples for N and C analyses were prepared from
the shoots (i.e., leaves and stem) and grains separately of bothnodulated pea and non-fixing barley plants harvested at maturitywhile samples for 15N analysis were prepared from all above-ground biomass harvested at pod or grain filling stages in pea andbarley, respectively. Samples were dried at 70 �C for 72 h andsubsequently homogenized into fine powder (<6 mm) using a115 V Wig-L-Bug grinding mill (International Crystal Laboratories,Garfield, NJ, USA). The subsamples, 2–3 mg each, were thenweighed into tin capsules using a Mettler AT20 micro-balance(Toledo, OH), and analyzed for total N, C, and d15N by high-temperature flash combustion using an elemental analyzer (VarioEL Cube elemental analyzer, Elementar Analysensysteme GmbH,Hanau, Germany) coupled by continuous flow to an isotope ratiomass spectrometer (Isoprime isotope ratio mass spectrometer,Isoprime Ltd., Cheadle, UK).
The percentage of plant N derived from atmospheric N2
(%NDFA), based on the natural variation in the abundance of15N, was calculated according to Shearer and Kohl (1988):
Please cite this article in press as: Chapagain, T., Riseman, A., Barley–petransformations, Field Crops Res. (2014), http://dx.doi.org/10.1016/j.fcr.2
%NDFA ¼ d15Nref � d15Nleg
d15Nref � d15Nfix
� 100
where d15Nref is the d15N value for the non-fixing barley referenceplant grown alone and dependent on soil N, d15Nleg is the d15Nvalue for the nodulating and potentially N2-fixing pea grown inintercrop plots where fixed N and soil N are available as N sources,and d15Nfix is the d15N value for the nodulating pea plant when theyare totally dependent on biological nitrogen fixation as the Nsource.
In addition, the quantification of N transferred to thecompanion barley plant was determined by using the followingformula (He, 2002):
%Ntransfer ¼d15Nbarleymono � d15Nbarleyintercrop
d15Nbarleymono
� 100
where d15N barleymono is the d15N value for the barley when theyare grown alone and dependent on soil N, and d15N barleyintercrop isthe d15N value for the companion barley plants grown in intercropplots. The estimates of N transfer are performed using treatmentaverages.
In order to get the d15Nfix value for pea, it was grown in plantboxes filled with quartz sand, and supplied with N-free media andcommercial rhizobia (Garden Inoculant for pea, EMD CropBioscience, WI, USA) as inoculum. The medium was preparedfollowing the modified version of Mae and Ohira (1981) andcontained: 50 mM Fe-EDTA, 50 mM KCl, 0.5 M K2SO4, 1 M KH2PO4,0.5 M MgSO4� 7H2O, 1 M CaCl2 as macroelements, and 0.5 mMCuSO4� 5H2O, 25 mM H3BO3, 2 mM ZnSO4� 7H2O, 2 mM MnSO4
� H2O, and 0.5 mM Na2MoO4� 2H2O as microelements. The macroand microelement solutions were prepared separately withdistilled water, and then poured at 5–10 mL per day into plantboxes each containing 4 plants.
Grain nitrogen values were converted to crude protein levels as%N � 5.8 for barley (Jones, 1931). Total N and C yields were derivedby using grain and shoot biomass yield, and N and C content ingrain and shoot biomass in each crop component.
2.3.4. Gross ecosystem photosynthesis, ecosystem respiration and netecosystem productivity measurements
Field measurements of net ecosystem CO2 exchange (NEE) incropland (i.e., monoculture and intercrop plots) and ecosystemrespiration (Re) were conducted at the soil surface using a dynamicclosed automated chamber connected to a portable CO2 gasanalyzer by following a procedure similar to that of Jassal et al.(2010). The automated chamber consisted of a PVC cylinder thatwas equipped with a calibrated photosensor (RainWise QuantumSolar Sensor, RainWise Inc., Bar Harbor, ME, USA) for themeasurement of photosynthetically active radiation (PAR), anordinary axial fan to ensure uniform CO2 concentration in thechamber, and outlet vent tube of 15 cm long and 3 mm internaldiameter to prevent pressure differences between the chamberand the atmosphere. The cylinder dimensions were 19.5 cminternal diameter, 60.8 cm height, and 1 cm wall thickness. Thechamber effective volume when deployed was 20.34 dm3while thesurface area covered by the chamber was 0.0298 m2. The cylinderwas inserted to a depth of about 2 cm below the soil surface duringfield measurements.
The CO2 gas analyzer unit consisted of an infrared gas analyzer(IRGA) (model LI-820, LI-COR Inc., Lincoln, NE), a 21X data logger(model 21X, Campbell Scientific Inc. (CSI), Logan, UT, USA), an AClinear pump (model SPP-40GBLS-101, GAST Manufacturing Corp.,Benton Harbor, MI, USA), and a data storage module (SM192, CSI.).The IRGA was calibrated in the UBC Biometeorology and SoilPhysics Laboratory with cylinders of CO2 in dry air calibrated using
a intercropping: Effects on land productivity, carbon and nitrogen014.06.014

Table 1Soil mineral nitrogen (NH4
+ and NO3�) content before planting (Spring-2011) and after final harvest (Fall-2012) in monoculture and intercrop plots.
Treatments Before planting (BP) After final harvest (AH) Mean difference (AH–BP)
NH4+
(mg kg �1 dry soil)NO3
�
(mg kg �1 dry soil)NH4
+
(mg kg �1 dry soil)NO3
�
(mg kg �1 dry soil)NH4
+
(mg kg �1 dry soil)NO3
�
(mg kg �1 dry soil)
Pea monoculture 3.3 27.0 3.9 33.4 0.6 6.4Barley:pea (1:1) 3.2 25.7 3.3 26.4 0.1 0.7Barley:pea (2:1) 3.2 25.2 3.0 25.4 -0.2 0.2Barley–pea (mixed) 3.2 25.0 3.0 25.4 -0.2 0.4Barley monoculture 3.0 26.0 2.2 21.6 -0.8 -4.4SEM (�) 0.10 0.69 0.18 1.03 0.08 0.34LSD0.05 NS NS 0.51 2.93 0.23 0.97
SEM, standard error of the mean; LSD, least significant difference.
4 T. Chapagain, A. Riseman / Field Crops Research xxx (2014) xxx–xxx
G ModelFIELD 6252 No. of Pages 8
standards provided by the Canadian Greenhouse Gases Measure-ment Laboratory, Meteorological Service of Canada, Downsview,Ontario. The effective volume was assumed to be approximately12% higher than the geometric headspace volume, due to the near-surface soil porosity and the adsorption of CO2 on the soil surfaceand chamber walls (Jassal et al., 2010, 2012).
NEE in a cropland was measured from two different areaswithin each plot by placing the chamber on the soil surface threetimes a day (i.e., morning, afternoon and evening) at 25, 50 and 75days after sowing enclosing the plants. This was followed by themeasurement of Re by placing the chamber on bare soil plus plantroots after harvesting. When measuring NEE and Re the pump wasturned on 1 min before chamber placement on the soil surface andcontinued for 3 min. The IRGA and the axial fan in the cylinder werekept on between measurements. The time rate of change in the CO2
mole fraction in the chamber headspace (dC/dt, mmol mol�1 s�1)during a period of 90 s beginning 20 s after chamber closure, whichwas found to be linear, was used to calculate the flux,F (mmol m�2 s�1) as follows (Jassal et al., 2005):
F ¼ aPVART
dCdt
where P is the atmospheric pressure (Pa), R is the universal gasconstant (8.314 J mol�1 K�1), T is the temperature of the chamberair (K), V is the geometric volume of the chamber headspace(0.02034 m3), A is the surface area covered by the chamber(0.0298 m2), and a is the ratio of the effective volume to thegeometric volume of the chamber (i.e., 1.12). Since the rate ofincrease in relative humidity in the chamber was less than2% min�1 over the 90 s, the water vapour dilution effect wasestimated to be less than 1% of F, and was therefore neglected(Welles et al., 2001).
Gross ecosystem photosynthesis, GEP (i.e., Re minus NEE), oftenreferred to as gross primary productivity of the cropland, and net
Table 2Mean grain yields, land productivity, biomass C:N and grain protein from monoculture
Treatments Grain yield (t ha�1) LER
Pea Barley
Pea monoculture 5.3 – 1.00Barley:pea (1:1) 2.5 2.7 1.15Barley:pea (2:1) 2.6 3.3 1.32Barley–pea (mixed) 2.3 2.8 1.12Barley monoculture – 4.0 1.00SEM (�) 0.40 0.21 0.07LSD0.05 1.13 0.58 0.20
SEM, standard error of the mean; LSD, least significant difference.a Land equivalent ratio (Mead and Willey, 1980).b Total land output (Jolliffe and Wanjau, 1999).
Please cite this article in press as: Chapagain, T., Riseman, A., Barley–ptransformations, Field Crops Res. (2014), http://dx.doi.org/10.1016/j.fcr.2
ecosystem productivity, NEP (i.e., NEE with a negative sign, oftenreferred to as seasonal net carbon sequestration) were calculatedfor all planting arrangements. The micromole values of NEP wereconverted to mg C m�2 h�1 using a conversion factor of 43.2 (Jassalet al., 2005). When NEE is positive, the ecosystem is releasing C tothe atmosphere while when negative, the ecosystem is absorbing Cfrom the atmosphere.
2.4. Data analysis
Data were analyzed using MSTAT-C (MSU, 1993) and MATLAB(Mathworks- MATLAB and Simulink for Technical Computing,Natick, MA, USA). Analyses of variance were performed onindividual plot data for plant performance metrics, yields, C andN accumulation, GEP and NEP. Fisher’s least significant differenceswere calculated with 5% significance levels in MSTAT-C using theerror variance from the analysis. Simple correlation coefficientsand coefficients of determination were determined betweenselected parameters using Statistical Package for the SocialSciences (SPSS) software.
3. Results
3.1. Soil mineral nitrogen and d15N content
Soil mineral N (NH4+ and NO3
�) values from samples collectedbefore planting and after final harvest are presented (Table 1). Pre-plant plots were homogenous and deemed suitable for 15N naturalabundance studies as suggested by Shearer and Kohl (1988). Afterharvest, plots varied in their N content. Specifically, monoculturepea plots displayed the highest increase in mineral N (i.e., +0.6 mgNH4
+ and +6.4 mg NO3� kg�1 dry soil) whereas barley monoculture
plots displayed the greatest decrease (i.e., �0.8 mg NH4+ and
and intercrop plots during 2011–2012 at UBC Farm, Vancouver, Canada.
a TLOb Barley
Biomass C:N Grain protein (%)
5.3 5.2 105 9.2
5.9 121 8.1 5.1 114 8.2
4.0 125 7.2 0.22 2.58 0.29 0.62 7.34 0.81
ea intercropping: Effects on land productivity, carbon and nitrogen014.06.014

Table 3Mean nodule numbers, total N yield, biological nitrogen fixation and transfer from pea component in monoculture and intercrop plots during 2011–2012 at UBC FarmVancouver, Canada.
Treatments Nodules plant�1 Total N yield(kg ha�1)
BNFa
(%)Transfer(%)
BNFa
(kg ha�1)Transfer(kg ha�1)
Pea monoculture 5.5 246 55.1 – 135 –
Barley:pea (1:1) 8.0 108 72.8 11.1 78 5.8Barley:pea (2:1) 7.0 103 64.4 3.9 67 2.2Barley–pea (mixed) 8.0 91 66.7 1.9 61 0.9SEM (�) 0.71 8.61 2.93 – 5.6 –
LSD0.05 2.01 24.6 8.32 – 15.9 –
SEM, standard error of the mean; LSD, least significant difference.a Biological nitrogen fixation.
T. Chapagain, A. Riseman / Field Crops Research xxx (2014) xxx–xxx 5
G ModelFIELD 6252 No. of Pages 8
�4.4 mg NO3�kg�1 dry soil) (Table 1). Intercrop plots displayed
intermediate N values with the greatest net increase of about+0.1 mg NH4
+ and +0.7 mg NO3�kg�1 dry soil from the 1:1 plots.
The average d15N value of nodulating pea grown in N-free mediawas �1.08m while the non-fixing barley reference plants grown infield as monoculture had average d15N value of 2.38m (data notshown). There was sufficiently a large difference between soil d15N(3.02m) and atmospheric d15N (0m) in order to measure dilutioneffects as suggested by Shearer and Kohl (1988).
3.2. Plant performance, yield and land productivity
Grain yield, land equivalent ratio (LER), and total land output(TLO) from monoculture and intercrop arrangements are pre-sented (Table 2). In monoculture plots, pea yield increased from5.1 t ha�1 in 2011 to 5.4 t ha�1 in 2012 resulting in a two-yearaverage of 5.3 t ha�1. However, barley yield declined from 4.3 t ha�1
in 2011 to 3.6 t ha�1 in 2012 with an average of 4 t ha�1. Systemproductivity indices, TLO and LER, were generally higher inintercrop plots with productivity increasing between 12 and 32%compared to monoculture plots. The 2:1 arrangement producedthe greatest increase (32%) with the highest two-year average forLER (1.32) and TLO (5.9 t ha�1) (Table 2). The TLO and LER valuescalculated using total biomass production (i.e., all above groundtissue) displayed similar trends as when calculated with grainyield, with a 28% increase in land productivity from the 2:1arrangement (data not shown).
Barley in intercrop plots showed notable responses for biomassC:N ratio and grain protein compared to monoculture plots(Table 2). Barley displayed the highest biomass N (thus lowering C:N ratio) and grain protein percentage when planted in the 1:1arrangement.
3.3. Biological N2 fixation and transfer
Intercropping had a significant impact on nodulation, %Nderived from symbiotic fixation and N transfer to the companion
Table 4Mean N yield from grain and shoot biomass in monoculture and intercrop plots during
Treatments Grain N(kg ha�1)
Pea Barley Total
Pea monoculture 192 192
Barley:pea (1:1) 86 43 129
Barley:pea (2:1) 87 46 133
Barley–pea (mixed) 77 39 116
Barley monoculture 47 47
SEM (�) 6.5 3.0 6.3
LSD0.05 18.6 8.6 17.9
SEM, standard error of the mean; LSD, least significant difference.
Please cite this article in press as: Chapagain, T., Riseman, A., Barley–petransformations, Field Crops Res. (2014), http://dx.doi.org/10.1016/j.fcr.2
barley plants (Table 3). The number of nodules and the proportionof nitrogen fixed by pea were significantly higher in intercrop plotsas compared to monoculture pea plots. Pea in intercrop plotsdeveloped an average of 27–45% more nodules than in monocul-ture plots resulting in 9–17% more N derived from symbiotic N2
fixation. On average, the 1:1 arrangement generated the highestpercent of biologically fixed N2 (72%) and the highest amount ofN-transfer to barley (6 kg ha�1, i.e., 11% of N in barley) compared toN transfer in the 2:1 arrangement (4%) and the mixed plantingarrangement (2%).
Pea in 1:1 arrangement displayed the highest amount ofaboveground biomass N (108 kg ha�1) compared to other plantingarrangements of which 78 kg (72%) was derived from symbiotic N2
fixation. Nitrogen fixation and transfer occurred within a seasonand improved significantly in year 2 as compared with year 1 (datanot shown). Pea in the 1:1 arrangement fixed an average of 69% oftotal biomass N in year 1 to 76% in year 2, and transferred anaverage of 6% of N in barley biomass in year 1 to 16% in year 2 (datanot shown).
3.4. N and C accumulation in aboveground biomass
Monoculture pea accumulated the greatest N in biomassfollowed by all intercrop arrangements with the monoculturebarley accumulating the least. Pea monoculture accumulated anaverage of 54 kg N ha�1 (Table 4) in shoot biomass of which 30 kgwas derived from symbiotic N fixation. Pea in intercrop plotsdisplayed reduced biomass N and a decrease in total N accumula-tion due to reduced total biomass. However, this amount stillreduced the N requirement of the subsequent crop by14–22 kg ha�1 (Table 4).
Compared to monoculture barley, the total amount of shootbiomass N accumulated in intercrop plots was 122–202% higher(Table 4). Barley in intercrop plots displayed increased biomass Ncompared to barley monoculture. However, the total amount of Naccumulated by the barley component decreased slightly withincreasing pea density (Table 4). Barley:pea in 1:1 arrangement
2011–2012 at UBC Farm Vancouver, Canada.
Remaining shoot biomass N(kg ha�1)
Grand total N yield(kg ha�1)
Pea Barley Total
54 54 24622 9 31 16016 10 26 15914 9 23 139
10 10 575.45 0.70 4.15 12.3
15.5 NS 11.8 34.9
a intercropping: Effects on land productivity, carbon and nitrogen014.06.014
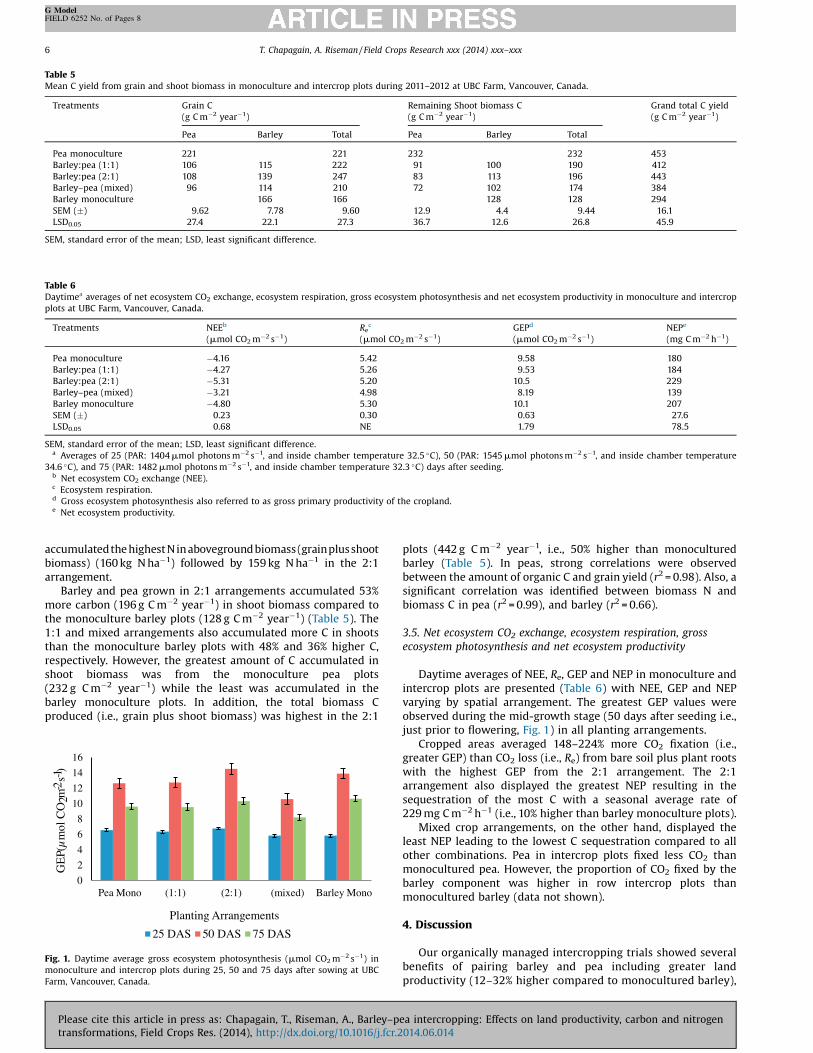
Table 5Mean C yield from grain and shoot biomass in monoculture and intercrop plots during 2011–2012 at UBC Farm, Vancouver, Canada.
Treatments Grain C(g C m�2 year�1)
Remaining Shoot biomass C(g C m�2 year�1)
Grand total C yield(g C m�2 year�1)
Pea Barley Total Pea Barley Total
Pea monoculture 221 221 232 232 453Barley:pea (1:1) 106 115 222 91 100 190 412Barley:pea (2:1) 108 139 247 83 113 196 443Barley–pea (mixed) 96 114 210 72 102 174 384Barley monoculture 166 166 128 128 294SEM (�) 9.62 7.78 9.60 12.9 4.4 9.44 16.1LSD0.05 27.4 22.1 27.3 36.7 12.6 26.8 45.9
SEM, standard error of the mean; LSD, least significant difference.
Table 6Daytimea averages of net ecosystem CO2 exchange, ecosystem respiration, gross ecosystem photosynthesis and net ecosystem productivity in monoculture and intercropplots at UBC Farm, Vancouver, Canada.
Treatments NEEb
(mmol CO2m�2 s�1)Re
c
(mmol CO2m�2 s�1)GEPd
(mmol CO2m�2 s�1)NEPe
(mg C m�2 h�1)
Pea monoculture �4.16 5.42 9.58 180Barley:pea (1:1) �4.27 5.26 9.53 184Barley:pea (2:1) �5.31 5.20 10.5 229Barley–pea (mixed) �3.21 4.98 8.19 139Barley monoculture �4.80 5.30 10.1 207SEM (�) 0.23 0.30 0.63 27.6LSD0.05 0.68 NE 1.79 78.5
SEM, standard error of the mean; LSD, least significant difference.a Averages of 25 (PAR: 1404 mmol photons m�2 s�1, and inside chamber temperature 32.5 �C), 50 (PAR: 1545 mmol photons m�2 s�1, and inside chamber temperature
34.6 �C), and 75 (PAR: 1482 mmol photons m�2 s�1, and inside chamber temperature 32.3 �C) days after seeding.b Net ecosystem CO2 exchange (NEE).c Ecosystem respiration.d Gross ecosystem photosynthesis also referred to as gross primary productivity of the cropland.e Net ecosystem productivity.
6 T. Chapagain, A. Riseman / Field Crops Research xxx (2014) xxx–xxx
G ModelFIELD 6252 No. of Pages 8
accumulatedthe highestNin aboveground biomass(grainplusshootbiomass) (160 kg N ha�1) followed by 159 kg N ha�1 in the 2:1arrangement.
Barley and pea grown in 2:1 arrangements accumulated 53%more carbon (196 g C m�2 year�1) in shoot biomass compared tothe monoculture barley plots (128 g C m�2 year�1) (Table 5). The1:1 and mixed arrangements also accumulated more C in shootsthan the monoculture barley plots with 48% and 36% higher C,respectively. However, the greatest amount of C accumulated inshoot biomass was from the monoculture pea plots(232 g C m�2 year�1) while the least was accumulated in thebarley monoculture plots. In addition, the total biomass Cproduced (i.e., grain plus shoot biomass) was highest in the 2:1
0
2
4
6
8
10
12
14
16
Pea Mono (1:1) (2:1) (mixed) Barley Mono
GE
P(µ
mol
CO
2m-2
s-1)
Planting Arrangements
25 DA S 50 DA S 75 DA S
Fig. 1. Daytime average gross ecosystem photosynthesis (mmol CO2m�2 s�1) inmonoculture and intercrop plots during 25, 50 and 75 days after sowing at UBCFarm, Vancouver, Canada.
Please cite this article in press as: Chapagain, T., Riseman, A., Barley–ptransformations, Field Crops Res. (2014), http://dx.doi.org/10.1016/j.fcr.2
plots (442 g C m�2 year�1, i.e., 50% higher than monoculturedbarley (Table 5). In peas, strong correlations were observedbetween the amount of organic C and grain yield (r2 = 0.98). Also, asignificant correlation was identified between biomass N andbiomass C in pea (r2 = 0.99), and barley (r2 = 0.66).
3.5. Net ecosystem CO2 exchange, ecosystem respiration, grossecosystem photosynthesis and net ecosystem productivity
Daytime averages of NEE, Re, GEP and NEP in monoculture andintercrop plots are presented (Table 6) with NEE, GEP and NEPvarying by spatial arrangement. The greatest GEP values wereobserved during the mid-growth stage (50 days after seeding i.e.,just prior to flowering, Fig. 1) in all planting arrangements.
Cropped areas averaged 148–224% more CO2 fixation (i.e.,greater GEP) than CO2 loss (i.e., Re) from bare soil plus plant rootswith the highest GEP from the 2:1 arrangement. The 2:1arrangement also displayed the greatest NEP resulting in thesequestration of the most C with a seasonal average rate of229 mg C m�2 h�1 (i.e., 10% higher than barley monoculture plots).
Mixed crop arrangements, on the other hand, displayed theleast NEP leading to the lowest C sequestration compared to allother combinations. Pea in intercrop plots fixed less CO2 thanmonocultured pea. However, the proportion of CO2 fixed by thebarley component was higher in row intercrop plots thanmonocultured barley (data not shown).
4. Discussion
Our organically managed intercropping trials showed severalbenefits of pairing barley and pea including greater landproductivity (12–32% higher compared to monocultured barley),
ea intercropping: Effects on land productivity, carbon and nitrogen014.06.014

T. Chapagain, A. Riseman / Field Crops Research xxx (2014) xxx–xxx 7
G ModelFIELD 6252 No. of Pages 8
higher biomass quality (increased N and protein content), higherC and N accumulation in aboveground biomass, and greater GEPand NEP. Higher yields and greater land productivity are reportedwhen barley is intercropped with pea. However, the degree ofsuccess varied greatly with the growing conditions and theproportion of species used in the field (Hauggaard-Nielsen et al.,2009; Jensen, 1996; Lauk and Lauk, 2008). Our experimentindicated that increasing barley density in intercrops (i.e., 2:1arrangement) yielded higher productivity (32%) than 1:1 orbroadcast arrangements. Barley:pea in 1:1 and broadcastarrangements performed poorly due to pea shading the barleyplants resulting in a higher proportion of unfilled grains. Lauk andLauk (2008) reported that increasing pea density in intercrops ledto smaller grains and lower yields. Chen et al. (2004) reportedthat intercropping barley and winter pea (P. sativum sp. arvense)yielded 5–24% higher LER values based on biomass, and indicatedthat separate row arrangements were more advantageous thangrowing each species in separate fields. Similarly, Hauggaard-Nielsen et al. (2009) found 25–30% more grain yield in barley–peaintercrops due to better use of plant resources including water,light, and nutrients. Sahota and Malhi (2012) also reported thatbarley–pea intercrops required 7–17% less land than monocultureproduction to produce the same yield.
The proportion of pea in the mixture affects the cereal’s yieldand quality. Barley in our experiment displayed increased biomassN and grain protein content with increasing pea density and isperhaps related to more N available from the pea componentand/or greater soil N uptake due to increased competition. Laukand Lauk (2008) also showed a positive association of pea densitywith increased protein content of the cereal grain. Intercroppingcereals with crops that increase the protein content of the foragehas both nutritional and financial value (Lithourgidis et al., 2011).This was true for our experiment and other barley–pea combina-tions (Carr et al., 2004).
Intercropping with a legume offers an opportunity for low inputorganic systems to better use N complementarity withoutcompromising yield. This study demonstrated that pea fixed9–18% more N in intercrop plots perhaps in response to theincreased competition with barley plants for soil N and promotingpea’s greater reliance on symbiotic N2-fixation. Hauggaard-Nielsenet al. (2009) reported that pea–barley intercrops used nitrogensources 17–31% more efficiently than by the monoculture plots.They further suggest that this could in part be due to the increasedacquisition of soil mineral N by the barley component whichpromoted pea to rely more on internal N2-fixation. Izaurralde et al.(1992) also reported increased N yield, greater N-fixationefficiency, and more shoot and root residue-N mineralization forsubsequent crops when field pea and barley were intercropped.
Biological nitrogen fixation by pea can supplement or replacethe nitrogen requirement of the subsequent crop. This is especiallytrue under low soil N conditions (Fujita et al., 1992; Lunnan, 1989).Our results showed that intercropping can increase soil N pools by22–30 kg ha�1 through shoot biomass, and be available for use bythe subsequent crop. Furthermore, the highest rate of N-transfer(up to 8.6 kg N ha�1, i.e., 16% N in barley) from pea to barley wasobserved in the 1:1 arrangement compared to the 2:1 or mixedplanting arrangement. This further shows that N transfer occurredwithin a season at a greater rate from higher pea density plots inrow arrangements (1:1), perhaps due to physical co-location of theroot systems that facilitate more direct N transfer between species.The benefits of legume-based intercrop have been shown throughdirect plant-to-plant N transfer but with significant variationreported in the amount of N transferred, i.e., �5–20% of the N in thereceiver plants (He et al., 2003, 2009; Johansen and Jensen, 1996).
Only limited information is available regarding NEE, GEP andNEP from temperate cereal–legume intercrop systems, with no
Please cite this article in press as: Chapagain, T., Riseman, A., Barley–petransformations, Field Crops Res. (2014), http://dx.doi.org/10.1016/j.fcr.2
reports specifically for barley and pea combinations. When alegume and non-legume species are planted together in anintercropping system, the legume might positively affect theperformance of the non-legume species through increased Navailability in the system (Hartwig et al., 2002; Zanetti et al., 1997),and therefore may support greater overall ecosystem productivity.Our 2:1 arrangement fixed the greatest amount of CO2 (i.e.,greatest GEP) and sequestered higher C in soil (i.e., greatest NEP)compared to the 1:1, mixed or barley monoculture plots.Ecosystem respiration rates across all treatments were not affectedby plot composition and were comparable with the values reportedby Jassal et al. (2005) for our geographic zone (i.e., Vancouver, BCregion). Dyer et al. (2012) also reported an increase in soil organiccarbon (SOC) concentration and a lowering of GHG emission ratescompared to when either crop was grown as a monoculture.
Overall, the specific intercrop combination of barley and peamay provide a new opportunity to better manage nutrients in asmall grain production system, one that fulfills both economic andenvironmental interests through higher land productivity, im-proved grain and biomass quality, increased GEP and NEP, andreduced reliance on mineral fertilizer inputs. The contribution oflegume genotypes, however, may differ with the soil type,topography, and growing environment. Therefore, it is importantto conduct multi-year experiments in different locations usingsimilar treatments to confirm these results across a wider range ofagro-climatic situations. In addition, effective dissemination andadoption of row intercropping to medium to large agriculturalproduction requires mechanization (i.e., multi-screened harvest-ers) and participatory trials to educate farmers on the advantagesof legume integration on land productivity and soil fertilitymanagement.
5. Conclusions
Our trials on barley–pea intercrop arrangements revealedsignificant and positive responses for higher total land outputs(TLO) and land equivalent ratios (LER), thereby increasing landproductivity compared to monoculture counterparts. Biomass andgrain nitrogen content of the barley component increasedsignificantly with a higher pea density (i.e., 1:1 arrangement)while the total amount of N accumulated by pea decreased withincreasing barley density (i.e., in 2:1 arrangement) due to areduction in pea biomass. Intercropping was associated withincreased nodulation, %N derived from symbiotic N2fixation, N andC accumulation in aboveground biomass, soil mineral N balanceand greater NEP thereby sequestering C with a seasonal daytimeaverage rate of 229 mg C m�2 h�1 (i.e., 10% higher than barleymonoculture plots). This study demonstrated that intercroppingbarley and pea is an efficient strategy to achieve higher landproductivity, N and C yields, and higher soil C sequestration thanwhen barley was grown as a monoculture.
Acknowledgements
The authors greatly acknowledge the entire team at the Centrefor Sustainable Food Systems at UBC Farm for providing organicallymanaged land for this research.
References
Adesogan, A.T., Salawu, M.B., Deaville, E.R., 2002. The effect on voluntary feedintake, in vivo digestibility and nitrogen balance in sheep of feeding grass silageor pea–wheat intercrops differing in pea to wheat ratio and maturity. Anim.Feed Sci. Tech. 96, 161–163.
Banik, P., Midya, A., Sarkar, B.K., Ghose, S.S., 2006. Wheat and chickpea intercroppingsystems in an additive series experiment: advantages and weed smothering.Eur. J. Argon. 24, 325–332.
a intercropping: Effects on land productivity, carbon and nitrogen014.06.014

8 T. Chapagain, A. Riseman / Field Crops Research xxx (2014) xxx–xxx
G ModelFIELD 6252 No. of Pages 8
Bingol, N.T., Karsli, M.A., Yilmaz, I.H., Bolat, D., 2007. The effects of planting time andcombination on the nutrient composition and digestible dry matter yield of fourmixtures of vetch varieties intercropped with barley. J. Vet. Anim. Sci. 31, 297–302.
Carr, P.M., Horsley, R.D., Poland, W.W., 2004. Barley, oat and cereal–pea mixtures asdryland forages in the northern Great Plains. Agron. J. 96, 677–684.
Chapagain, T., Riseman, A., 2012. Evaluation of heirloom and commercial cultivars ofsmall grains under low input organic systems. Am. J. Plant Sci. 3, 655–669.
Chen, C., Westcott, M., Neill, K., Wichman, D., Knox, M., 2004. Row configuration andnitrogen application for barley–pea intercropping in Montana. Agron. J. 96,1730–1738.
Dumanski, J., Coote, D., Lucerek, G., Lok, C., 1986. Soil conservation in Canada. J. SoilWater Conserv. 41, 204–210.
Dyer, L., Oelbermann, M., Echarte, L., 2012. Soil carbon dioxide and nitrous oxideemissions during the growing season from temperate maize–soybean intercrops.J. Plant Nutr. Soil Sci. 175, 394–400.
Ferguson, R.B., Hergert, G.W., Schepers, J.S., Ceaword, C.A., 1999. Site-specificnitrogen management of irrigated corn. In: Robert, P.C., Robert, P.C., Rust, R.H.,Rust, R.H., Larson, W.E., Larson, W.E. (Eds.), Proceedings of the FourthInternational Conference on Precision Agriculture. ASA-CSSA-SSSA, Madison,WI, pp. 133–139.
Fujita, K., Ofosu-Budu, K.G., Ogata, S., 1992. Biological nitrogen fixation in mixedlegume–cereal cropping systems. Plant Soil 141, 155–175.
Hartwig, U.A., Luscher, A., Nosberger, J., van Kessel, C., 2002. Nitrogen-15 budget inmodel ecosystems of white clover and perennial ryegrass exposed for four yearsat elevated atmospheric CO2. Glob. Change Biol. 8, 194–202.
Hauggaard-Nielsen, H., Ambus, P., Jensen, E.S., 2001. Interspecific competition, N useand interference with weeds in pea–barley intercropping. Field Crop Res. 70,101–109.
Hauggaard-Nielsen, H., Gooding, M., Ambus, P., Corre-Hellou, G., Crozat, Y.,Dahlmann, C., Dibet, A., von Fragstein, P., Pristeri, A., Monti, M., Jensen, E.S.,2009. Pea–barley intercropping for efficient symbiotic N2-fixation, soil Nacquisition and use of other nutrients in European organic cropping systems.Field Crop Res. 113, 64–71.
He, X., Critchley, C., Bledsoe, C., 2003. Nitrogen transfer within and between plantsthrough common mycorrhizal networks (CMNs). Crit. Rev. Plant Sci. 22, 531–567.
He, X.H., 2002. Nitrogen Exchange Between Plants Through Common MycorrhizalNetworks (Ph.D. thesis). University of Queensland, Brisbane, Australia.
He, X.H., Xu, M., Qiu, G.Y., Zhou, J., 2009. Use of 15N stable isotope to quantifynitrogen transfer between mycorrhizal plants. J. Plant Ecol. 2, 107–118.
Intergovernmental Panel on Climate Change-IPCC, 2007. The Physical Science Basis.Contribution of Working Group I to the Fourth Assessment Report of theIntergovernmental Panel on Climate Change. Cambridge University Press,Cambridge, UK.
Izaurralde, R.C., McGill, W.B., Juma, N.G., 1992. Nitrogen fixation efficiency,interspecies N transfer, and root growth in barley-field pea intercrop on aBlack Chernozemic soil. Biol. Fertil. Soils 13, 11–16.
Jarecki, M.K., Lal, R., 2003. Crop management for soil carbon sequestration. Crit. Rev.Plant Sci. 22, 471–502.
Jassal, R.S., Black, T.A., Novak, M., 2005. Relationship between soil CO2 concen-trations and forest-floor CO2 effluxes. Agric. Forest Meteorol. 130, 176–192.
Jassal, R.S., Black, T.A., Trofymow, J.A., Roy, R., Nesic, Z., 2010. Soil CO2 and N2O fluxdynamics in a nitrogen-fertilized Pacific northwest Douglas-fir stand. Geo-derma 157, 118–125.
Jassal, R.S., Black, T.A., Nesic, Z., Gaumont-Guay, D., 2012. Using automated non-steady-state chamber systems for making continuous long-term measurementsof soil CO2 efflux in forest ecosystems. Agric. Forest Meteorol. 161, 57–65.
Please cite this article in press as: Chapagain, T., Riseman, A., Barley–ptransformations, Field Crops Res. (2014), http://dx.doi.org/10.1016/j.fcr.2
Jensen, E.S., 1996. Grain yield, symbiotic N2 fixation and interspecific competitionfor inorganic N in pea–barley intercrops. Plant Soil 18, 25–38.
Johansen, A., Jensen, E.S., 1996. Transfer of N and P from intact or decomposing rootsof pea to barley interconnected by an arbuscular mycorrhizal fungus. Soil Biol.Biochem. 28, 73–81.
Jolliffe, P.A., 2000. The replacement series. J. Ecol. 88, 371–385.Jolliffe, P.A., Wanjau, F.M., 1999. Competition and productivity in crop mixtures:
some properties of productive intercrops. J. Agric. Sci. 132, 425–435.Jones, D.B., 1931. Factors for Converting Percentages of Nitrogen in Foods and Feeds
into Percentages of Proteins. US Department of Agriculture, Circular No. 183,Washington, D.C.
Knudsen, M.T., Hauggaard-Nielsen, H., Jensen, E.S., 2004. Cereal–Grain LegumeIntercropping in Organic Farming – A Danish Report. Riso National Laboratory,Plant Research Department, Roskilde, Denmark (retrieved: 26.02.14 from http://orgprints.org/9339/1).
Lauk, R., Lauk, E., 2008. Pea–oat intercrops are superior to pea–wheat and pea–barley intercrops. Acta Agric. Scand. B 58, 139–144.
Lithourgidis, A.S., Dordas, C.A., Damalas, C.A., Vlachostergios, D.N., 2011. Annualintercrops: an alternative pathway for sustainable agriculture. Aust. J. Crop Sci.5, 396–410.
Lithourgidis, A.S., Vasilakoglou, I.B., Dhima, K.V., Dordas, C.A., Yiakoulaki, M.D.,2007. Forage yield and quality of common vetch mixtures with oat and triticalein two seeding ratio. Field Crop Res. 99, 106–113.
Lunnan, T., 1989. Barley–pea mixtures for whole crop forage. Effect of differentcultural practices on yield and quality. Nor. J. Agric. Sci. 3, 57–71.
Mae, T., Ohira, K., 1981. The remobilization of nitrogen related to leaf growth andsenescence in rice plants (Oryza sativa L.). Plant Cell Physiol. 22, 1067–1074.
Mead, R., Willey, R.W., 1980. The concept of ‘land equivalent ratio’ and advantages inyields from intercropping. Exp. Agr. 16, 217–228.
Michigan State University-MSU, 1993. MSTAT-C, A Micro Computer Program for theDesign Management and Analysis of Agronomic Research Experiments. MSTATDevelopment Team, Michigan State University, USA.
Ofori, F., Stern, W.R.,1987. Cereal–legume intercropping system. Adv. Agron. 41, 41–90.Oelbermann, M., Echarte, L., 2011. Evaluating soil carbon and nitrogen dynamics in
recently established maize–soybean intercropping systems. Eur. J. Soil Sci. 62,35–41.
Ross, S.M., King, J.R., Donovan, J.T.O., Spaner, D., 2004. Intercropping berseem cloverwith barley and oat cultivars for forage. Agron. J. 96, 1719–1729.
Sahota, T., Malhi, S., 2012. Intercropping barley with pea for agronomic andeconomic considerations in northern Ontario. Agric. Sci. 3, 889–895.
Sekamatte, B.M., Latigo, M.O., Smith, M.R.A., 2003. Effects of maize–legumeintercrops on termite damage to maize, activity of predatory ants and maizeyields in Uganda. Crop Protect. 22, 87–93.
Shearer, G., Kohl, D.H., 1988. Natural 15N abundance as a method of estimating thecontribution of biologically fixed nitrogen to N2-fixing systems: potential fornon-legumes. Plant Soil 110, 317–327.
University of California San Diego-UCSD, 2014. The keeling curve: a daily record ofatmospheric carbon dioxide from SCRIPPS institution of oceanography at UCSan Diego. http://keelingcurve.ucsd.edu (accessed 21.04.14).
Welles, J.M., Demetriades-Shah, T.H., McDermitt, D.K., 2001. Considerations formeasuring ground CO2 effluxes with chambers. Chem. Geol. 177, 3–13.
Yildirim, E., Guvence, I., 2005. Intercropping based on cauliflower: moreproductivity, profitable and highly sustainable. Eur. J. Agron. 2, 11–18.
Zanetti, S., Hartwig, U.A., van Kessel, C., Luscher, A., Hebeisen, T., Frehner, M., Fischer,B.U., Hendrey, G.R., Blum, H., Nosberger, J., 1997. Does nitrogen nutrition restrictthe CO2 response of fertile grassland lacking legumes? Oecologia 112, 17–25.
ea intercropping: Effects on land productivity, carbon and nitrogen014.06.014