barcode enabled supply chain management for organized
TRANSCRIPT

www.theinternationaljournal.org > RJSSM: Volume: 03, Number: 02, June-2013 Page 70
Barcode Enabled Supply Chain Management for Organized Retail Stores- An
Empirical Case Study
Rajeev Gupta
Assistant Professor
Moradabad Institute of Technology
Moradabad, India
Ajay K. Garg
University Professor (Tenure-Track)
Fairleigh Dickinson University - Vancouver Campus
Vancouver V5X2R9 Canada
Abstract
The aim of this paper is to highlight the role of barcoding in Indian organized retail industry.
The major domain in which barcoding is helpful for smooth functioning of organized retail store is the
prime focus of this paper. The study includes the feedback given by the store managers of Shoppers
Stop, Pantaloon, Big Bazar, Globus and Vishal Mega-Mart on the issues related to protection from
theft, faster and improved service, reducing inventory errors, easy accessibility in showroom, time
saving, improved efficiency, reducing cost, fast inventory status in store, fast information
dissemination in store and tracking & tracing the material etc. This paper concludes that barcoding is
very much effective for the efficient store management. Major attention in this paper is paid towards
the role of barcoding in the organized retail stores.
Key Words: Barcode, supply chain, Inventory Management, Information Technology, Store
management.
Introduction
Global corporations like Lucent, Wal-Mart, Proctor and Gamble and Sun Microsystems have
confirmed that value can be produced through supply chain integration (Lee, 2000). The survival in the
competitive edge is possible only through utilizing the latest technologies for better customer service
in cost efficient manner. In Indian organized retail stores, the barcoding is most commonly used
technology for strengthening the supply chain. The results of the bar coding technology for smooth
conduction of organized retail stores operations are very much productive and encouraging. Bar coding
is a technology which identifies the objects and collects data without using key entries. Bar codes are
binary codes that are arranged in a parallel form using bars and gaps (Palmer, 1995). Maintaining and
managing inventory in the organized store for better customer service is the basic requirement and for
this barcodes are the better option. Wild (1997) examined that, through inventory control, products
made available to customers with the help of proper coordination among purchasing, manufacturing
and distribution functions.
This study focuses on the several benefits of barcoding in various dimensions such as
protection from theft, better customer service, inventory related issues, time saving, efficiency, cost
and tracking and tracing the products in the stores etc.
www.theinternationaljournal.org > RJSSM: Volume: 03, Number: 02, June-2013 Page 71
Objectives
1. To identify the contemporary supply chain techniques prevalent in the organized retail sector in
Indian market space.
2. To determine the impact of Barcoding on the overall business process effectiveness.
Literature Review
Barcodes has become the “ubiquitous standard for identifying and tracking products” (Wyld,
2006, p. 157). Barcodes are easy to use, inexpensive, and more reliable in terms of accuracy over
manual techniques (McCathie & Michael, 2005). Most of the research articles are focusing on the
elements of supply chain and some are on technological aspects. Inventory control practices are
important to all organizations, particularly for small and medium retail organizations that are more
vulnerable to inventory control issues (Gunasekaran, Forker, & Kobu, 2000; Zipkin, 2000). In Indian
organized retail stores, barcoding is commonly used but there are very few empirical researches are
available to justify the actual benefits of barcoding. Wyld (2006) analyses that barcoding is most
widely used technology on this planet with five billion barcodes scanned every day in the world. Retail
organizations are adopting supply chain practices not only for supply purposes but also for competitive
advantages. Zipkin (2000) analyses that technology advancements have major influence on inventory
decisions and these advancements have the potential to streamline entire industries. Jorge R. León-
Peña (2008) analyses the significance of e-business for improved control of demand and supply
aspects of the product assortment. E-business includes the concept of electronic data interchange
which means transferring the business data electronically for smooth functioning of business. Samuel
Fosso Wamba, Louis A. Lefebvre and Elisabeth Lefebvre (2007) focused on RFID technology and
Electronic Product Code (EPC) for improved retail supply chain. The Radio Frequency Identification
is the most popular technology based on the electronic product code which is used by the retail
organizations for tracking and tracing the goods. Brewer (2007) study points the benefits of tested
barcoding in comparision to casually adopted RFID and suggested about hybrid RFID-barcode system.
Reynolds (2007) also suggested the importance of barcoding as compared to RFID on the basis of
expert opinion. According to the survey conducted by Zebra Technologies (2006), 96% European
companies admitted that barcoding improves the overall efficiency. Operational improvements have
been monitored in the form of efficiency, consistency, data accuracy, and inventory and asset
management in the organizations with the barcode technology implementation (Zebra Technologies,
2007; Ellram, Londe, Weber, 1999). Almost all researches are directly related to the technological
aspects of retail supply chain like RFID (Radio Frequency Identification), EPC (Electronic Product
code), BARCODING, EDI (Electronic Data Interchange) and CIS (Corporate Information System) and
some are based on conceptual framework of JIT(Just-in-Time), Inventory management, warehousing
management etc. RFID technology is classified as a wireless automatic identification and data capture
(AIDC) technology (Swartz, 2000). Zhang et al. (2008) illustrate a smart Kanban system using RFID
technologies for shop-floor management. Hau L. Lee (2002) analyses that given the different nature of
demand and supply uncertainties of diverse products, different supply chain strategies are wanted for
different products. It is focused by the researchers that according to the product nature and market
scenario, different supply chain strategies like inventory decisions, warehousing management,
distribution channels etc. should be adopted by the organizations. Lambert and Stock (2001) define the
most important sources of data for the common database, which are the order processing system,
company records, industry data, and management data.
www.theinternationaljournal.org > RJSSM: Volume: 03, Number: 02, June-2013 Page 72
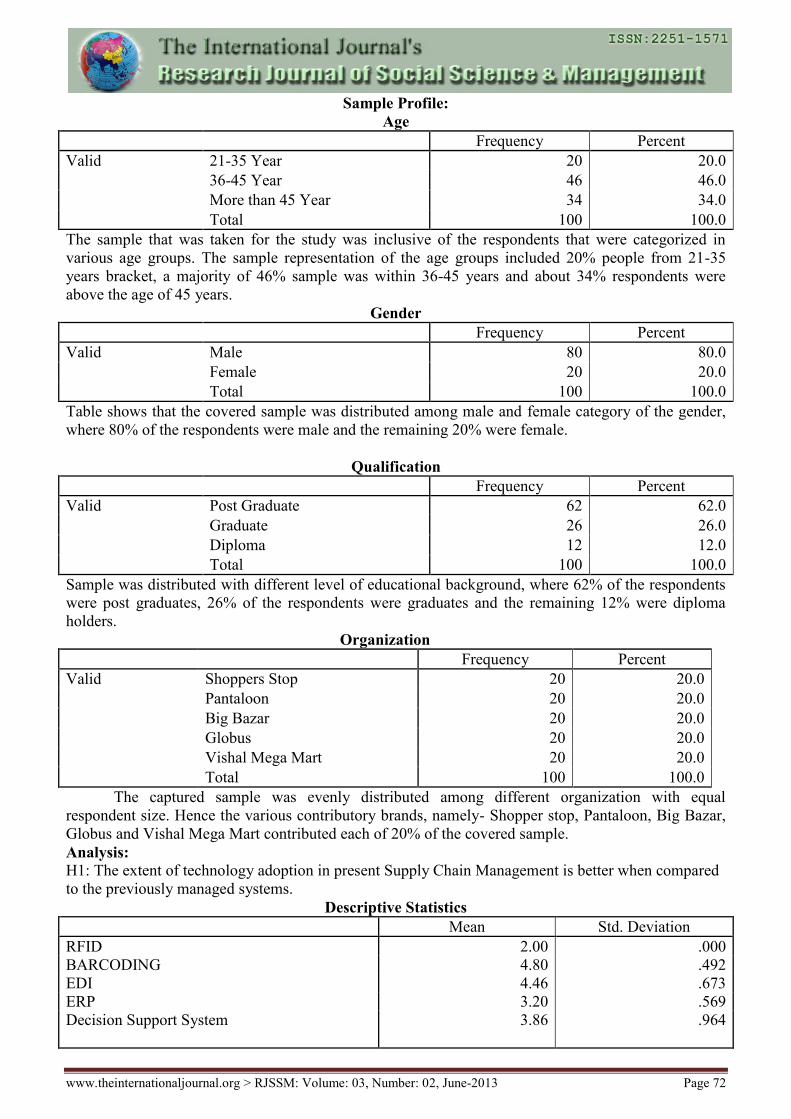
Sample Profile:
Age
Frequency Percent
Valid 21-35 Year 20 20.0
36-45 Year 46 46.0
More than 45 Year 34 34.0
Total 100 100.0
The sample that was taken for the study was inclusive of the respondents that were categorized in
various age groups. The sample representation of the age groups included 20% people from 21-35
years bracket, a majority of 46% sample was within 36-45 years and about 34% respondents were
above the age of 45 years.
Gender
Frequency Percent
Valid Male 80 80.0
Female 20 20.0
Total 100 100.0
Table shows that the covered sample was distributed among male and female category of the gender,
where 80% of the respondents were male and the remaining 20% were female.
Qualification
Frequency Percent
Valid Post Graduate 62 62.0
Graduate 26 26.0
Diploma 12 12.0
Total 100 100.0
Sample was distributed with different level of educational background, where 62% of the respondents
were post graduates, 26% of the respondents were graduates and the remaining 12% were diploma
holders.
Organization
Frequency Percent
Valid Shoppers Stop 20 20.0
Pantaloon 20 20.0
Big Bazar 20 20.0
Globus 20 20.0
Vishal Mega Mart 20 20.0
Total 100 100.0
The captured sample was evenly distributed among different organization with equal
respondent size. Hence the various contributory brands, namely- Shopper stop, Pantaloon, Big Bazar,
Globus and Vishal Mega Mart contributed each of 20% of the covered sample.
Analysis:
H1: The extent of technology adoption in present Supply Chain Management is better when compared
to the previously managed systems.
Descriptive Statistics
Mean Std. Deviation
RFID 2.00 .000
BARCODING 4.80 .492
EDI 4.46 .673
ERP 3.20 .569
Decision Support System 3.86 .964

www.theinternationaljournal.org > RJSSM: Volume: 03, Number: 02, June-2013 Page 73
Table shows that organizations were open to testing technologies like Bar coding, EDI, ERP and
Decision Support System for the supply chain management, only RFID is the technology that is not
being used by any organization(with st. dev.=0.000). Across organizations people were found to be
more acceptable to Bar Coding, which is also depicted by the minimum standard deviation as shown in
the table against the discussed category, thereby showing a consensus among the people using the
technology across organizations.
H2: The technology adoption techniques help in efficient Store Management.
Sub Hypothesis:
H2.1.0: Null Hypothesis: Barcoding do not help to protect from theft.
H2.1.1: Alternate hypothesis: Barcoding helps to protect from theft
Protection from theft * BARCODING Cross tabulation
BARCODING
Total 3 4 5
Protection from theft 2 Count 2 0 0 2
% within
BARCODING
50.0% .0% .0% 2.0%
3 Count 0 2 8 10
% within
BARCODING
.0% 16.7% 9.5% 10.0%
4 Count 0 4 42 46
% within
BARCODING
.0% 33.3% 50.0% 46.0%
5 Count 2 6 34 42
% within
BARCODING
50.0% 50.0% 40.5% 42.0%
Total Count 4 12 84 100
% within
BARCODING
100.0% 100.0% 100.0% 100.0%
Table shows that organizations that are using the bar-coding in their supply chain management are of
the view that protection from the theft will be on a better note. Overall 82% people are of the
perception that bar-coding helps to protect from theft.
Chi-Square Tests
Value df
Asymp. Sig. (2-
sided)
Pearson Chi-Square 51.793a 6 .000
Likelihood Ratio 18.842 6 .004
Linear-by-Linear Association 2.480 1 .115
N of Valid Cases 100
Here the table shows that significance value is less than 0.05, which implies that the null hypothesis
will be rejected and the alternate hypothesis will be accepted meaning the bar-coding helps to project
from theft.
H2.2.0: Null Hypothesis: Bar-coding do not help to faster and improved customer service
H2.2.1: Alternate hypothesis: Barcoding helps to faster and improved customer service
www.theinternationaljournal.org > RJSSM: Volume: 03, Number: 02, June-2013 Page 74
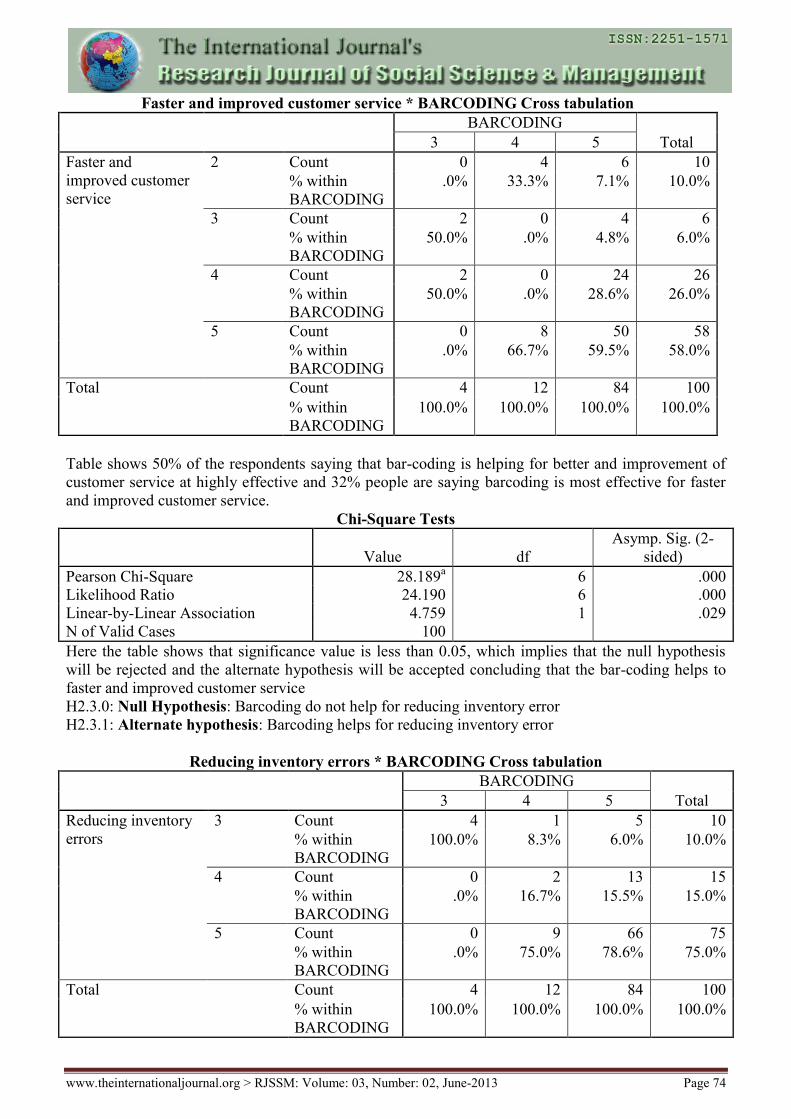
Faster and improved customer service * BARCODING Cross tabulation
BARCODING
Total 3 4 5
Faster and
improved customer
service
2 Count 0 4 6 10
% within
BARCODING
.0% 33.3% 7.1% 10.0%
3 Count 2 0 4 6
% within
BARCODING
50.0% .0% 4.8% 6.0%
4 Count 2 0 24 26
% within
BARCODING
50.0% .0% 28.6% 26.0%
5 Count 0 8 50 58
% within
BARCODING
.0% 66.7% 59.5% 58.0%
Total Count 4 12 84 100
% within
BARCODING
100.0% 100.0% 100.0% 100.0%
Table shows 50% of the respondents saying that bar-coding is helping for better and improvement of
customer service at highly effective and 32% people are saying barcoding is most effective for faster
and improved customer service.
Chi-Square Tests
Value df
Asymp. Sig. (2-
sided)
Pearson Chi-Square 28.189a 6 .000
Likelihood Ratio 24.190 6 .000
Linear-by-Linear Association 4.759 1 .029
N of Valid Cases 100
Here the table shows that significance value is less than 0.05, which implies that the null hypothesis
will be rejected and the alternate hypothesis will be accepted concluding that the bar-coding helps to
faster and improved customer service
H2.3.0: Null Hypothesis: Barcoding do not help for reducing inventory error
H2.3.1: Alternate hypothesis: Barcoding helps for reducing inventory error
Reducing inventory errors * BARCODING Cross tabulation
BARCODING
Total 3 4 5
Reducing inventory
errors
3 Count 4 1 5 10
% within
BARCODING
100.0% 8.3% 6.0% 10.0%
4 Count 0 2 13 15
% within
BARCODING
.0% 16.7% 15.5% 15.0%
5 Count 0 9 66 75
% within
BARCODING
.0% 75.0% 78.6% 75.0%
Total Count 4 12 84 100
% within
BARCODING
100.0% 100.0% 100.0% 100.0%

www.theinternationaljournal.org > RJSSM: Volume: 03, Number: 02, June-2013 Page 75
Table shows that 66% of the respondents were of the view that bar-coding is helping for reducing
inventory error at highly effective level and 22% people were saying bar-coding is most effective for
reducing inventory error.
Chi-Square Tests
Value df
Asymp. Sig. (2-
sided)
Pearson Chi-Square 37.587a 4 .000
Likelihood Ratio 20.243 4 .000
Linear-by-Linear Association 16.307 1 .000
N of Valid Cases 100
Here the table shows that significance value is less than 0.05, which implies that the null hypothesis
will be rejected and the alternate hypothesis will be accepted concluding the bar-coding helps for
reducing inventory error.
H2.4.0: Null Hypothesis: Barcoding do not help to easy accessibility in showroom
H2.4.1: Alternate hypothesis: Barcoding helps to easy accessibility in showroom
Easy accessibility in showroom * BARCODING Cross tabulation
BARCODING
Total 3 4 5
Easy accessibility in
showroom
1 Count 4 6 50 60
% within
BARCODING
100.0% 50.0% 59.5% 60.0%
2 Count 0 6 30 36
% within
BARCODING
.0% 50.0% 35.7% 36.0%
3 Count 0 0 4 4
% within
BARCODING
.0% .0% 4.8% 4.0%
Total Count 4 12 84 100
% within
BARCODING
100.0% 100.0% 100.0% 100.0%
Table shows that when the organizations use the barcoding technology then they do not feel
that barcoding help in easy accessibility in showroom which is backed by the response rate where 96%
of the respondent say that the bar-coding do not helps in to easy accessibility in showroom at highly
ineffective level and 4% people are saying barcoding is neutral for easy accessibility in showroom
means neither helpful nor creating extra burden.
Chi-Square Tests
Value df
Asymp. Sig. (2-
sided)
Pearson Chi-Square 4.127a 4 .389
Likelihood Ratio 5.961 4 .202
Linear-by-Linear Association .991 1 .320
N of Valid Cases 100
Table shows that significance value is more than 0.05 hence the null hypothesis will be accepted and
the alternate hypothesis will be rejected concluding that the bar-coding do not helps for easy
accessibility in showroom.
H2.5.0: Null Hypothesis: Barcoding do not help in time saving
H2.5.1: Alternate hypothesis: Barcoding helps in time saving

www.theinternationaljournal.org > RJSSM: Volume: 03, Number: 02, June-2013 Page 76
Time saving * BARCODING Cross tabulation
BARCODING
Total 3 4 5
Time saving 3 Count 4 0 4 8
% within
BARCODING
100.0% .0% 4.8% 8.0%
4 Count 0 2 38 40
% within
BARCODING
.0% 16.7% 45.2% 40.0%
5 Count 0 10 42 52
% within
BARCODING
.0% 83.3% 50.0% 52.0%
Total Count 4 12 84 100
% within
BARCODING
100.0% 100.0% 100.0% 100.0%
Table shows that when the organizations use the barcoding technology then they feel that
barcoding help in time saving in showroom which is very clearly delineated though the data where
92% of the respondent say that the bar-coding helps in time saving in showroom as highly effectively
and 8% people are saying barcoding is neutral for time saving in showroom where they meant to say
that it is neither helpful nor consuming extra time.
Chi-Square Tests
Value Df
Asymp. Sig. (2-
sided)
Pearson Chi-Square 52.601a 4 .000
Likelihood Ratio 28.044 4 .000
Linear-by-Linear Association 4.693 1 .030
N of Valid Cases 100
Table shows that significance value is less than 0.05 hence the null hypothesis will be rejected
and the alternate hypothesis will be accepted giving us a clear understanding that the bar-coding helps
in time saving to every retail outlets.
H2.6.0: Null Hypothesis: Barcoding do not help to improved efficiency
H2.6.1: Alternate hypothesis: Barcoding help to improved efficiency
Improved efficiency * BARCODING Cross tabulation
BARCODING
Total 3 4 5
Improved efficiency 3 Count 2 0 7 9
% within
BARCODING
50.0% .0% 8.3% 9.0%
4 Count 2 8 53 63
% within
BARCODING
50.0% 66.7% 63.1% 63.0%
5 Count 0 4 24 28
% within
BARCODING
.0% 33.3% 28.6% 28.0%
Total Count 4 12 84 100
% within
BARCODING
100.0% 100.0% 100.0% 100.0%
Table shows that when the organizations use the barcoding technology then they feel that barcoding
help to improve efficiency because the 91% of the respondent said that bar-coding helps in improving

www.theinternationaljournal.org > RJSSM: Volume: 03, Number: 02, June-2013 Page 77
efficiency and only 9% people are saying barcoding is neutral to improving efficiency means it was
neither helpful nor unsupportive to these 9%.
Chi-Square Tests
Value df
Asymp. Sig. (2-
sided)
Pearson Chi-Square 9.977a 4 .041
Likelihood Ratio 8.287 4 .082
Linear-by-Linear Association 1.784 1 .182
N of Valid Cases 100
Table shows that significance value is less than 0.05 hence the null hypothesis will be rejected and the
alternate hypothesis will be accepted giving us a view that bar-coding helps to improve efficiency of
retail outlets.
H2.7.0: Null Hypothesis: Barcoding do not help to reduce cost
H2.7.1: Alternate hypothesis: Barcoding help to reduce cost
Reduce Cost * BARCODING Cross tabulation
BARCODING
Total 3 4 5
Reduce Cost 2 Count 0 2 10 12
% within
BARCODING
.0% 16.7% 11.9% 12.0%
3 Count 4 6 52 62
% within
BARCODING
100.0% 50.0% 61.9% 62.0%
4 Count 0 4 20 24
% within
BARCODING
.0% 33.3% 23.8% 24.0%
5 Count 0 0 2 2
% within
BARCODING
.0% .0% 2.4% 2.0%
Total Count 4 12 84 100
% within
BARCODING
100.0% 100.0% 100.0% 100.0%
Table shows that when the organizations use the barcoding technology then they feel that barcoding
does not helps to reduce cost because the 74% of the respondent saying the barcoding do not help for
reducing cost and only 26% people are saying barcoding is helpful for reducing the cost.
Chi-Square Tests
Value Df
Asymp. Sig. (2-
sided)
Pearson Chi-Square 3.687a 6 .719
Likelihood Ratio 5.244 6 .513
Linear-by-Linear Association .143 1 .705
N of Valid Cases 100
Table shows that significance value is more than 0.05 hence the null hypothesis will be accepted and
the alternate hypothesis will be rejected means the barcoding do not helps to reduce the cost.
H2.8.0: Null Hypothesis: Barcoding do not help in fast inventory status in store
H2.8.1: Alternate hypothesis: Barcoding help in fast inventory status in store
www.theinternationaljournal.org > RJSSM: Volume: 03, Number: 02, June-2013 Page 78
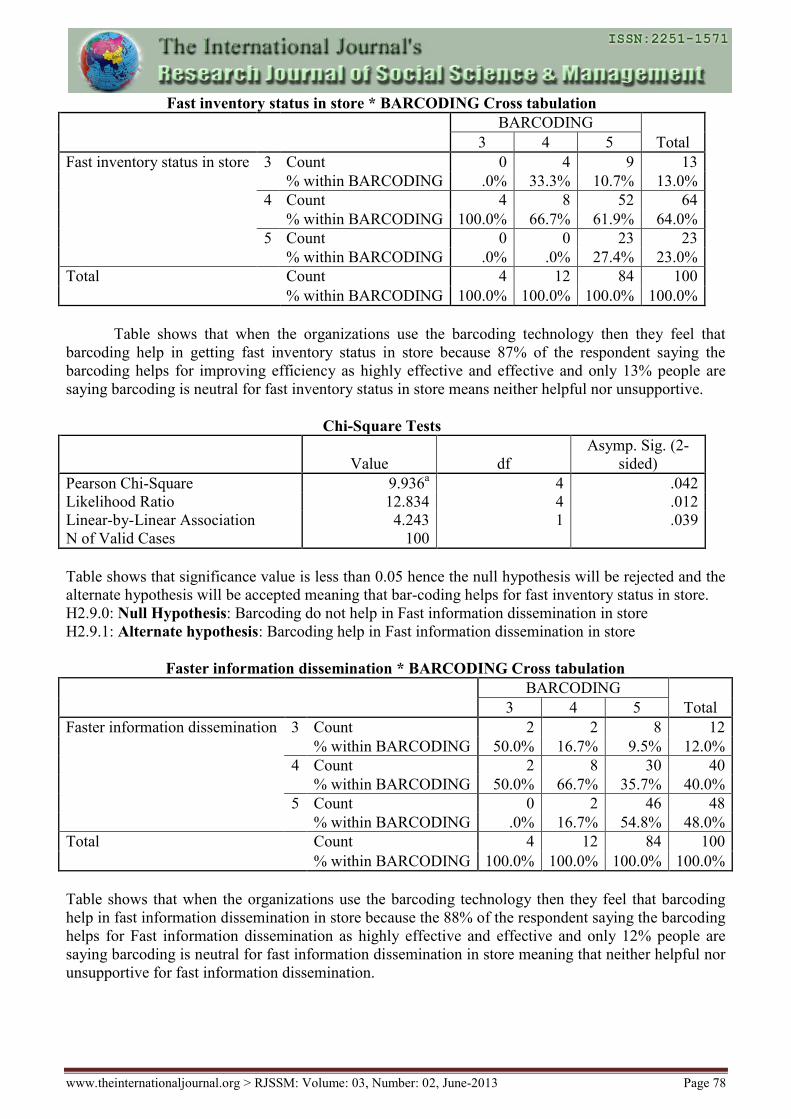
Fast inventory status in store * BARCODING Cross tabulation
BARCODING
Total 3 4 5
Fast inventory status in store 3 Count 0 4 9 13
% within BARCODING .0% 33.3% 10.7% 13.0%
4 Count 4 8 52 64
% within BARCODING 100.0% 66.7% 61.9% 64.0%
5 Count 0 0 23 23
% within BARCODING .0% .0% 27.4% 23.0%
Total Count 4 12 84 100
% within BARCODING 100.0% 100.0% 100.0% 100.0%
Table shows that when the organizations use the barcoding technology then they feel that
barcoding help in getting fast inventory status in store because 87% of the respondent saying the
barcoding helps for improving efficiency as highly effective and effective and only 13% people are
saying barcoding is neutral for fast inventory status in store means neither helpful nor unsupportive.
Chi-Square Tests
Value df
Asymp. Sig. (2-
sided)
Pearson Chi-Square 9.936a 4 .042
Likelihood Ratio 12.834 4 .012
Linear-by-Linear Association 4.243 1 .039
N of Valid Cases 100
Table shows that significance value is less than 0.05 hence the null hypothesis will be rejected and the
alternate hypothesis will be accepted meaning that bar-coding helps for fast inventory status in store.
H2.9.0: Null Hypothesis: Barcoding do not help in Fast information dissemination in store
H2.9.1: Alternate hypothesis: Barcoding help in Fast information dissemination in store
Faster information dissemination * BARCODING Cross tabulation
BARCODING
Total 3 4 5
Faster information dissemination 3 Count 2 2 8 12
% within BARCODING 50.0% 16.7% 9.5% 12.0%
4 Count 2 8 30 40
% within BARCODING 50.0% 66.7% 35.7% 40.0%
5 Count 0 2 46 48
% within BARCODING .0% 16.7% 54.8% 48.0%
Total Count 4 12 84 100
% within BARCODING 100.0% 100.0% 100.0% 100.0%
Table shows that when the organizations use the barcoding technology then they feel that barcoding
help in fast information dissemination in store because the 88% of the respondent saying the barcoding
helps for Fast information dissemination as highly effective and effective and only 12% people are
saying barcoding is neutral for fast information dissemination in store meaning that neither helpful nor
unsupportive for fast information dissemination.

www.theinternationaljournal.org > RJSSM: Volume: 03, Number: 02, June-2013 Page 79
Chi-Square Tests
Value Df
Asymp. Sig. (2-
sided)
Pearson Chi-Square 13.254a 4 .010
Likelihood Ratio 13.485 4 .009
Linear-by-Linear Association 11.000 1 .001
N of Valid Cases 100
Table shows that significance value is less than 0.05 hence the null hypothesis will be rejected and the
alternate hypothesis will be accepted which means that bar-coding helps for fast information
dissemination.
H2.10.0: Null Hypothesis: Barcoding do not help in Tracking and tracing the material
H2.10.1: Alternate hypothesis: Barcoding help in Tracking and tracing the material
Tracking and tracing the material * BARCODING Cross tabulation
BARCODING
Total 3 4 5
Tracking and tracing the
material
1 Count 0 2 0 2
% within
BARCODING
.0% 16.7% .0% 2.0%
2 Count 0 2 10 12
% within
BARCODING
.0% 16.7% 11.9% 12.0%
3 Count 4 8 58 70
% within
BARCODING
100.0% 66.7% 69.0% 70.0%
4 Count 0 0 16 16
% within
BARCODING
.0% .0% 19.0% 16.0%
Total Count 4 12 84 100
% within
BARCODING
100.0% 100.0% 100.0% 100.0%
Table shows that when the organizations use the barcoding technology then they feel that barcoding
help to Tracking and tracing the material in store is easier in comparison to non user of barcoding
because 16% of the respondent say that bar-coding helps for Tracking and tracing the material as
highly effective and 70% were neutral for response to tracking and tracing the material in store which
implied that it was neither helpful nor unsupportive for Tracking and tracing the material.
Chi-Square Tests
Value df
Asymp. Sig. (2-
sided)
Pearson Chi-Square 18.957a 6 .004
Likelihood Ratio 15.699 6 .015
Linear-by-Linear Association 4.125 1 .042
N of Valid Cases 100
Table shows that significance value is less than 0.05 hence the null hypothesis will be rejected and the
alternate hypothesis will be accepted indicating that bar-coding helps for tracking and tracing the
material.

www.theinternationaljournal.org > RJSSM: Volume: 03, Number: 02, June-2013 Page 80
It was also found that all the issues that were analyzed against bar-coding were found to be positively
correlated with the technology. That is to say those respondents believed that the various queries were
positively affected by the technology (bar-coding) intervention. Hence based on the above sub
Hypotheses (H2.1- H2.9) it can be clearly said that technology adoption techniques helped in efficient
Store Management.
H6: The efficient store Management is positively correlated with bar-coding
Correlations
BARCODING Protection from theft
BARCODING Pearson Correlation 1 .158
Sig. (2-tailed) .116
N 100 100
Protection from theft Pearson Correlation .158 1
Sig. (2-tailed) .116
N 100 100
Table shows when we use bar-coding then the protection from theft increased because the table shows
positive correlation 0.158 between the bar-coding and protection from theft means both are directly
related with each other if we start using of one independent variable as bar-coding then the dependent
variable protection from theft automatically increased.
Correlations
BARCODING
Faster and improved
customer service
BARCODING Pearson Correlation 1 .219*
Sig. (2-tailed) .028
N 100 100
Faster and improved
customer service
Pearson Correlation .219* 1
Sig. (2-tailed) .028
N 100 100
Table shows when we use bar-coding then faster and improved customer increased because the table
shows positive correlation 0.219 between the bar-coding and faster and improved customer means both
are directly related with each other if we start using of one independent variable as bar-coding then the
dependent variable faster and improved customer automatically increased.
Correlations
BARCODING
Reducing inventory
errors
BARCODING Pearson Correlation 1 .406**
Sig. (2-tailed) .000
N 100 100
Reducing inventory
errors
Pearson Correlation .406**
1
Sig. (2-tailed) .000
N 100 100
Table shows when we use bar-coding then reducing inventory errors increased because the table shows
positive correlation 0.406 between the bar-coding and reducing inventory errors means both are
directly related with each other if we start using of one independent variable as bar-coding then the
dependent variable reducing inventory errors automatically increased.
www.theinternationaljournal.org > RJSSM: Volume: 03, Number: 02, June-2013 Page 81
Correlations
BARCODING
Easy accessibility in
showroom
BARCODING Pearson Correlation 1 .100
Sig. (2-tailed) .322
N 100 100
Easy accessibility in
showroom
Pearson Correlation .100 1
Sig. (2-tailed) .322
N 100 100
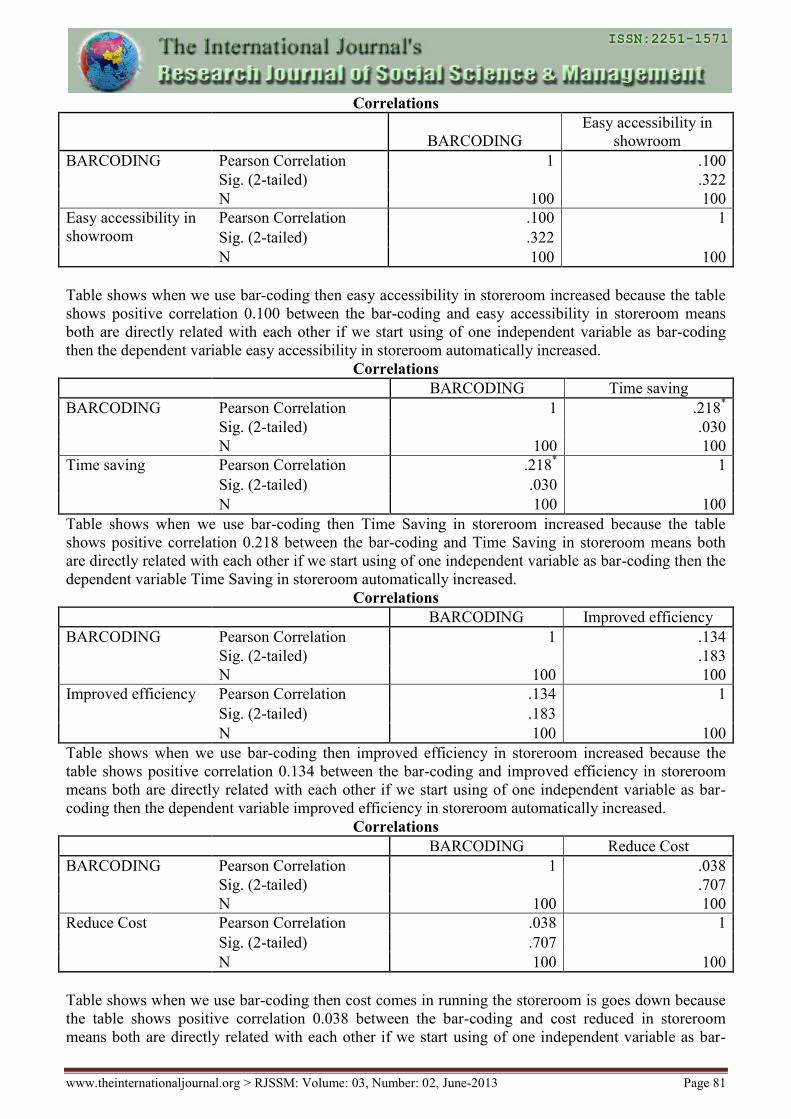
Table shows when we use bar-coding then easy accessibility in storeroom increased because the table
shows positive correlation 0.100 between the bar-coding and easy accessibility in storeroom means
both are directly related with each other if we start using of one independent variable as bar-coding
then the dependent variable easy accessibility in storeroom automatically increased.
Correlations
BARCODING Time saving
BARCODING Pearson Correlation 1 .218*
Sig. (2-tailed) .030
N 100 100
Time saving Pearson Correlation .218* 1
Sig. (2-tailed) .030
N 100 100
Table shows when we use bar-coding then Time Saving in storeroom increased because the table
shows positive correlation 0.218 between the bar-coding and Time Saving in storeroom means both
are directly related with each other if we start using of one independent variable as bar-coding then the
dependent variable Time Saving in storeroom automatically increased.
Correlations
BARCODING Improved efficiency
BARCODING Pearson Correlation 1 .134
Sig. (2-tailed) .183
N 100 100
Improved efficiency Pearson Correlation .134 1
Sig. (2-tailed) .183
N 100 100
Table shows when we use bar-coding then improved efficiency in storeroom increased because the
table shows positive correlation 0.134 between the bar-coding and improved efficiency in storeroom
means both are directly related with each other if we start using of one independent variable as bar-
coding then the dependent variable improved efficiency in storeroom automatically increased.
Correlations
BARCODING Reduce Cost
BARCODING Pearson Correlation 1 .038
Sig. (2-tailed) .707
N 100 100
Reduce Cost Pearson Correlation .038 1
Sig. (2-tailed) .707
N 100 100
Table shows when we use bar-coding then cost comes in running the storeroom is goes down because
the table shows positive correlation 0.038 between the bar-coding and cost reduced in storeroom
means both are directly related with each other if we start using of one independent variable as bar-
www.theinternationaljournal.org > RJSSM: Volume: 03, Number: 02, June-2013 Page 82
coding then the dependent variable reducing cost in storeroom automatically increased means the cost
becomes low.
Correlations
BARCODING
Fast inventory status in
store
BARCODING Pearson Correlation 1 .207*
Sig. (2-tailed) .039
N 100 100
Fast inventory status
in store
Pearson Correlation .207* 1
Sig. (2-tailed) .039
N 100 100
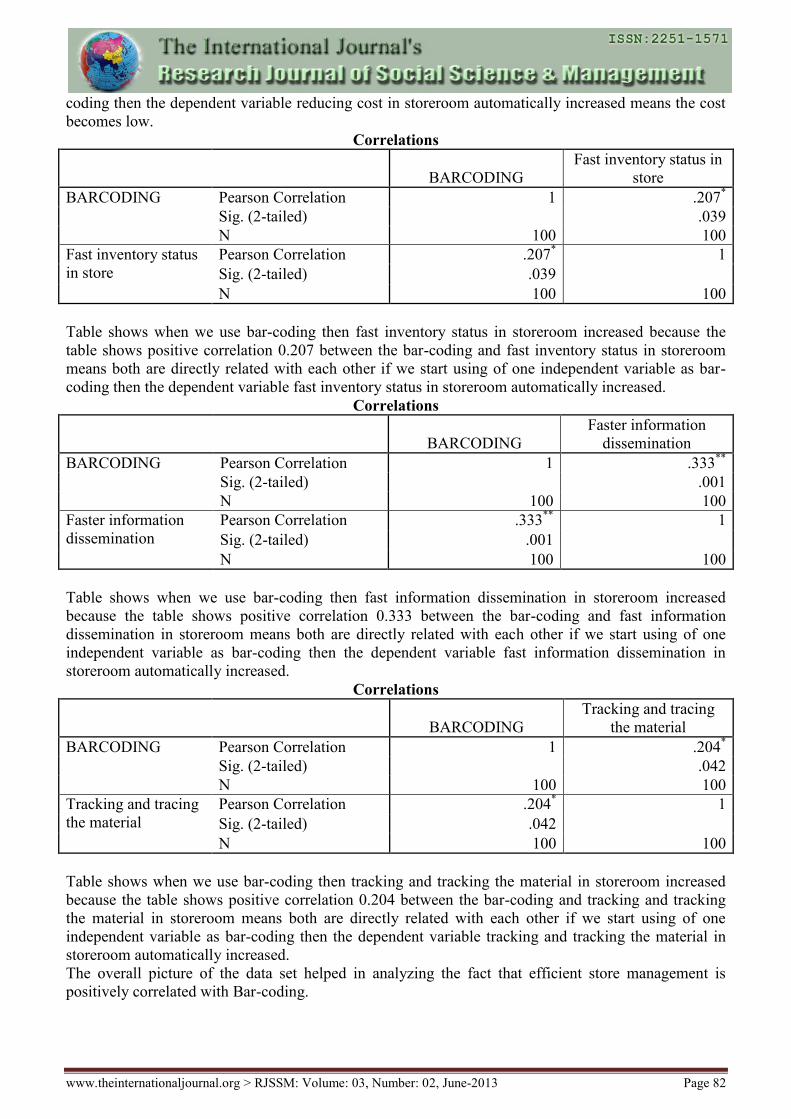
Table shows when we use bar-coding then fast inventory status in storeroom increased because the
table shows positive correlation 0.207 between the bar-coding and fast inventory status in storeroom
means both are directly related with each other if we start using of one independent variable as bar-
coding then the dependent variable fast inventory status in storeroom automatically increased.
Correlations
BARCODING
Faster information
dissemination
BARCODING Pearson Correlation 1 .333**
Sig. (2-tailed) .001
N 100 100
Faster information
dissemination
Pearson Correlation .333**
1
Sig. (2-tailed) .001
N 100 100
Table shows when we use bar-coding then fast information dissemination in storeroom increased
because the table shows positive correlation 0.333 between the bar-coding and fast information
dissemination in storeroom means both are directly related with each other if we start using of one
independent variable as bar-coding then the dependent variable fast information dissemination in
storeroom automatically increased.
Correlations
BARCODING
Tracking and tracing
the material
BARCODING Pearson Correlation 1 .204*
Sig. (2-tailed) .042
N 100 100
Tracking and tracing
the material
Pearson Correlation .204* 1
Sig. (2-tailed) .042
N 100 100
Table shows when we use bar-coding then tracking and tracking the material in storeroom increased
because the table shows positive correlation 0.204 between the bar-coding and tracking and tracking
the material in storeroom means both are directly related with each other if we start using of one
independent variable as bar-coding then the dependent variable tracking and tracking the material in
storeroom automatically increased.
The overall picture of the data set helped in analyzing the fact that efficient store management is
positively correlated with Bar-coding.

www.theinternationaljournal.org > RJSSM: Volume: 03, Number: 02, June-2013 Page 83
Conclusion
The research outcome clearly indicates that barcode is most commonly used technology in Indian
organized retail whereas RFID is still untouched by all the retail organizations. Apart from barcode,
EDI, ERP and DSS are some techniques which are contributing to the success of these retailers. The
present supply chain management is better when compared to previously managed systems because
now the management of retail stores is much better by using latest technologies. Various issues related
to efficient store management are checked with barcode and it is found that barcode helps the
managers of retail organizations in all dimensions which are responsible for efficient store
management.
References
1. Brewer, M. (2007). RFID adoption hurdles start to crumble. Wirelessdesignmag.com,
October, 3-4.
2. Ellram, L., Londe, B. L., & Weber, M. (1999). Retail logistics. International Journal of
Physical Distribution and Logistics Management, 29(7), 477-494.
3. Gunasekaran, A., Forker, L., & Kobu, B. (2000). Improving operations performance in a
small company: a case study. International Journal of Operations & Production Management,
20(3), 316-335.
4. Jorge R. León-Peña (2008), e-Business and the Supply Chain Management, Business
Intelligence Journal, 2008,p 1.
5. McCathie, L., & Michael, K. (2005). Is it the end of barcodes in supply chain management?
Paper presented at the Proceedings of the Collaborative Electronic Commerce Technology
and Research Conference LatAm, Talca, Chile.
6. Michael, K., & McCathie, L. (2005). The pros and cons of RFID in supply chain
management. Paper presented at the International Conference on Mobile Business, Sydney,
Australia.
7. Samuel Fosso Wamba, Louis A. Lefebvre and Elisabeth Lefebvre, 2007, Integrating RFID
Technology and EPC Network into a B2B Retail Supply Chain: A Step toward Intelligent
Business Processes, Journal of Technology Management and Innovation, 2007.
8. Swartz J. (2000), Changing retail trends, new technologies and supply chain. Technology in
Society, Vol.22, pp.123-132.
9. Zhang, Y.F., Jiang, P. Y., & Huang, G. Q.(2008). RFID-based smart kanbans for just-in-time
manufacturing. International Journal of Materials and Product Technology, 33(1-2), 170-184.
10. Hau L. Lee(2002), Aligning Supply Chain Strategies with Product Uncertainties, California
Management Review, Vol. 44, No. 3, P 10.
11. Lambert, D.M. and J. R. Stock, 2001. Strategic Logistics Management. 4th
Edn., Irwin
McGraw-Hill, New York.
12. Lee H (2000). Creating value through supply chain integration, Supply Chain Management
Review, September/October:30-36.
13. Palmer, R. C. (1995). The Bar Code Book: Revised and Expanded. New Hampshire: Helmers
Publishing, Inc.
14. Reynolds, M. (2007). RFID take-off will not kill the barcode, says expert, Electronics
Weekly, Issue 2297, 12.
15. Wyld, D. (2006). RFID101: The next big thing in management. Management Research News,
29(4), 154-173.
16. Wild, T. (1997). Best Practices in Inventory Management. New York: John Wiley & Sons.
17. Zipkin, P. (2000). Foundations of Inventory Management. Boston: McGraw-Hill.