barclays plc (holding company) - barclays | 325 … plc(holding company) barclays bank plc (lead...
TRANSCRIPT

Barclays PLC (Holding Company)
Barclays Bank PLC (Lead Bank)
Primary Credit Analyst:
Nigel Greenwood, London (44) 20-7176-1066; [email protected]
Secondary Contact:
Richard Barnes, London (44) 20-7176-7227; [email protected]
Table Of Contents
Major Rating Factors
Outlook
Rationale
Related Criteria And Research
WWW.STANDARDANDPOORS.COM/RATINGSDIRECT JUNE 7, 2017 1

Barclays PLC (Holding Company)
Barclays Bank PLC (Lead Bank)
SACP bbb+
Anchor bbb+
Business
PositionAdequate 0
Capital and
EarningsAdequate 0
Risk Position Adequate 0
Funding Average
0
Liquidity Adequate
+ Support +2
ALACSupport +2
GRE Support 0
GroupSupport 0
SovereignSupport 0
+AdditionalFactors -1
Issuer Credit Rating
A-/Negative/A-2
Bank Holding Company Rating
BBB/Negative/A-2
The bank holding company rating shown applies to Barclays PLC. The issuer credit rating applies to its principal core
subsidiary, Barclays Bank PLC. The stand-alone credit profile (SACP) reflects the unsupported group credit profile
(GCP).
Major Rating Factors
Strengths: Weaknesses:
• Good asset quality relative to U.K. peers over an
extended period.
• Leading market positions in U.K. banking and global
wholesale banking.
• Significant diversity of business lines and customer
segments.
• Lacks a medium-term track record of stable
management and consistent strategy.
• Level of attributable profit lacks predictability.
• Scope to improve relative efficiency.
WWW.STANDARDANDPOORS.COM/RATINGSDIRECT JUNE 7, 2017 2

Outlook: Negative
Barclays PLC
The negative outlook on Barclays reflects the risk of a weaker operating environment following the U.K.'s decision
to leave the EU. Specifically, we could revise down our risk position assessment in the event of increasing
economic risks associated with Brexit because, unlike its U.K. bank peers, Barclays' anchor is less likely to change
owing to its international diversification. With all other factors remaining the same, this would result in a one-notch
downward adjustment of the unsupported group credit profile (GCP) and our subsequent lowering of the long- and
short-term counterparty credit ratings, and hybrid ratings.
We could revise the outlook back to stable if we took a similar action on our assessment of U.K. economic risk, or
if we observed sufficient reasons in Barclays' case to offset any potential deterioration of the U.K. banking
environment. This might be due to the bank's capital and earnings strengthening more than expected or if we
observed further progress with strategy implementation. This would most likely arise if current constraints on a
stronger business position--in particular the current regulatory review of the CEO, outstanding high profile
litigation cases, the still-to-be consummated regulatory deconsolidation of Barclays Africa, and the implementation
of structural reform--demonstrably reduced in scale or potential impact.
Barclays Bank PLC
Our rationale for the negative outlook on Barclays Bank PLC (BB PLC), currently the primary operating company
of the Barclays group, mirrors that for the negative outlook on the NOHC. We could lower the long-term
counterparty credit and senior unsecured debt ratings on BB PLC, and its hybrid ratings, if we revised the
unsupported GCP downward.
Barclays has stated that in the first half of 2018, as part of its structural reform program to implement U.K.
ring-fencing requirements, BB PLC will become its non-ring-fenced bank. In the second half of 2017, or into 2018,
we currently expect to have a sufficient line of sight to finalize our view of BB PLC's status within the group as well
as its stand-alone creditworthiness, the counterparty credit rating, senior unsecured debt ratings, and the ratings on
its hybrid instruments.
Presently we believe that we are likely to assess BB PLC as highly strategic to the group, which would result in no
counterparty credit and senior unsecured debt ratings change, though the hybrid ratings would likely be lowered
by one notch. Absent a change in this view, we would need to revise upward the unsupported GCP to raise the
counterparty credit and senior unsecured debt ratings on BB PLC and maintain the existing hybrid ratings.
Rationale
Barclays' relatively low 'bbb+' unsupported GCP is indicative of the numerous difficulties that it has endured since the
2008 financial crisis. The 2012 LIBOR scandal was the most notable, and has proved to be a seminal event leading to
significant management, strategic, and cultural changes in the bank. These changes, as well as regulatory change, led
to the creation of a large non-core division. More recently, a new CEO launched a further significant strategic change
in March 2016, partly in response to structural reform requirements. We observe stronger evidence of delivery on key
objectives and signs of improving financial returns, albeit helped by a more favorable economic and trading
environment. For example, Barclays has announced that its non-core division will close on June 30, 2017.
We compare Barclays to the other major U.K. banks and a range of U.S. and European wholesale banks. Currently,
across our four stand-alone credit factors, we do not see any stand-out credit strengths or weaknesses. Similar to most
WWW.STANDARDANDPOORS.COM/RATINGSDIRECT JUNE 7, 2017 3
Barclays Bank PLC

peers, balance sheet metrics--specifically capitalization, funding and liquidity profiles, and asset quality--are solid
ratings factors. We observe some improvements in Barclays' business position and capital and earnings assessments
but not yet to the extent that we would consider raising the unsupported GCP.
Barclays has stated that, effective the first half of 2018, BB PLC will become the non-ring-fenced bank of the Barclays
Group. A new entity will be fully established (from an existing shell company that has recently received PRA regulatory
approval of its banking licence), which will become the ring-fenced bank. Presently, we believe that Barclays UK will
be core to the group and BB PLC will be highly strategic, as defined in our group rating methodology. We expect to
have sufficient line of sight to be in a position to confirm our ratings view of the reconstructed group most likely in the
latter half of 2017, or into 2018.
The long-term rating on BB PLC incorporates two notches of uplift based on the additional loss-absorbing capacity
(ALAC) arising from the group's subordinated debt and senior debt buffers. We then apply a negative adjustment to the
ICR to reflect our current expectation that BB PLC would be rated one notch lower than the 'a' supported GCP, given
our current expectation that we will reclassify its group status to highly strategic.
Anchor:'bbb+', the weighted-average economic risk for Barclays
The 'bbb+' anchor draws on our Banking Industry Country Risk Assessment (BICRA) methodology and our view of the
weighted-average economic risk in the countries in which Barclays operates. We base this on Barclays' geographic
distribution of exposure at default pre-credit risk mitigation (as reported in Barclays' Pillar 3 Report). This distribution,
at Dec. 31, 2016, is approximately 50% in the U.K., 20% in North America, 15% in the European Union, 10% in South
Africa, and 5% in Asia and the rest of the world. The weighted-average economic risk score for these territories is
around '4' on a scale of 1-10 (1 representing the lowest risk and 10 the highest), the same outcome as the economic
risk score for a bank operating solely in the U.K. If we had based this calculation upon net loans, an alternative
measure, the outcome would be very similar.
The pro forma impact of Barclays achieving regulatory deconsolidation of its African business (which is one of the key
remaining elements of the Barclays 2016 strategy update) and a possible increase in U.K. economic risk (leading us to
revise the U.K.'s economic risk score to '5' from '4'), which we currently view as being on a negative trend, would likely
keep the weighted average closer to '4' than '5'.
After the Brexit vote in June 2016, we assigned a negative trend for U.K. banking sector economic risk, indicating a
one-in-three possibility that we could revise down our view of economic risk over the following 24 months. We
maintain this view; the negative trend reflects the elevated level of economic uncertainty arising from the U.K.'s exit
from the EU. We could consider lowering the economic risk score if we saw a significantly increased risk of a
disorderly Brexit resulting in asset-price corrections becoming more likely, with expected credit losses jumping to
levels well above the long-term average of 69 basis points (bps), and closer to levels seen during the global financial
crisis; or significant outflows of foreign capital or substantially greater-than-expected declines in foreign direct
investment (FDI) inflows into the U.K. On the other hand, if we assess that uncertainty has declined and the extent of
economic deterioration (if any) is likely to be contained, with manageable expected credit losses, we could revise the
economic risk trend to stable.
We view the industry risk trend as stable. The domestic reform agenda is well advanced and banks are now clearer
WWW.STANDARDANDPOORS.COM/RATINGSDIRECT JUNE 7, 2017 4
Barclays Bank PLC
about the future regulatory environment. The ring-fencing of retail and SME deposits from January 2019 may create
operational risk in implementation, but we believe that banks are well placed to manage this risk and will meet the
2019 deadline. We assume that changes in regulatory structures will support market discipline, constrain risk appetites,
and, over time, yield adequate profitability. Banking regulation and supervision have substantially improved since the
financial crisis: we have seen an extensive reorganization of the regulatory infrastructure to better co-ordinate bank
supervision with macro-prudential risks, as well as a clear move away from the previous light-touch regulatory
philosophy. The U.K. has also made less use of transitional periods to introduce higher capital requirements and
greater use of Pillar 2 capital requirements to run ahead of expected changes in capital rules. We saw that the capital
and debt market volatility that followed the Brexit vote did not materially affect banks' access to, and cost of,
wholesale funding. Our base-case scenario is that banks will continue to be able to access such funding over time. We
see limited downside sensitivities to our industry risk assessment, though implicit in our assessment is our expectation
that the industry will demonstrate sustainable profitability and a return to earnings above the cost of capital.
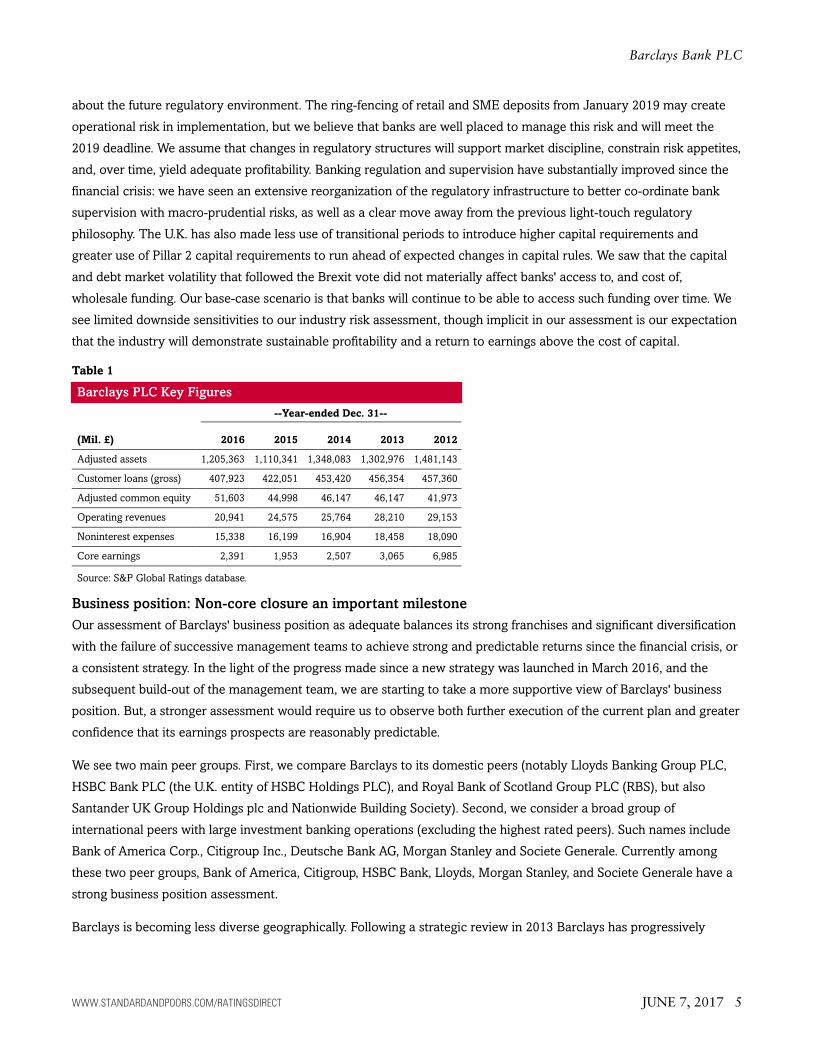
Table 1
Barclays PLC Key Figures
--Year-ended Dec. 31--
(Mil. £) 2016 2015 2014 2013 2012
Adjusted assets 1,205,363 1,110,341 1,348,083 1,302,976 1,481,143
Customer loans (gross) 407,923 422,051 453,420 456,354 457,360
Adjusted common equity 51,603 44,998 46,147 46,147 41,973
Operating revenues 20,941 24,575 25,764 28,210 29,153
Noninterest expenses 15,338 16,199 16,904 18,458 18,090
Core earnings 2,391 1,953 2,507 3,065 6,985
Source: S&P Global Ratings database.
Business position: Non-core closure an important milestone
Our assessment of Barclays' business position as adequate balances its strong franchises and significant diversification
with the failure of successive management teams to achieve strong and predictable returns since the financial crisis, or
a consistent strategy. In the light of the progress made since a new strategy was launched in March 2016, and the
subsequent build-out of the management team, we are starting to take a more supportive view of Barclays' business
position. But, a stronger assessment would require us to observe both further execution of the current plan and greater
confidence that its earnings prospects are reasonably predictable.
We see two main peer groups. First, we compare Barclays to its domestic peers (notably Lloyds Banking Group PLC,
HSBC Bank PLC (the U.K. entity of HSBC Holdings PLC), and Royal Bank of Scotland Group PLC (RBS), but also
Santander UK Group Holdings plc and Nationwide Building Society). Second, we consider a broad group of
international peers with large investment banking operations (excluding the highest rated peers). Such names include
Bank of America Corp., Citigroup Inc., Deutsche Bank AG, Morgan Stanley and Societe Generale. Currently among
these two peer groups, Bank of America, Citigroup, HSBC Bank, Lloyds, Morgan Stanley, and Societe Generale have a
strong business position assessment.
Barclays is becoming less diverse geographically. Following a strategic review in 2013 Barclays has progressively
WWW.STANDARDANDPOORS.COM/RATINGSDIRECT JUNE 7, 2017 5
Barclays Bank PLC

exited various European retail businesses, which rarely performed well in terms of margins. The 2016 strategic review
announced the effective exit from Barclays Africa, a longstanding division, including Barclays Africa Group Ltd
(BAGL). Barclays' stake in BAGL was reduced to 50% from 62% in 2016, and on June 1, 2017, Barclays announced the
results of a placing that has now reduced its stake to around the 15% mark. This achieves accounting deconsolidation,
but not regulatory deconsolidation, until such approval is received. Although the Africa sell-down is a significant
departure from the strategy of the past, and a reduction in group geographic diversity and long-term growth prospects,
we view it as broadly credit neutral from the standpoint of the group's overall business position, subject to its
consummation of regulatory deconsolidation.
The 2016 strategy was framed by the requirements to meet U.K. regulatory ring-fencing rules by Jan. 1, 2019, among
other factors. Notably, compared to the past, Barclays now has a much-simplified divisional structure, with Barclays
UK to become the future ring-fenced bank and Barclays International to become the future non-ring-fenced bank. A
non-core division and Barclays Africa are held outside of these two core divisions. Income diversity is greater than
U.K. peers (see chart 1).
Chart 1
Evidence of the progress made in recent quarters is that Barclays has announced it plans to close the non-core division
on June 30, 2017 (six months earlier than planned). This represents a key landmark, in our view, on Barclays' recovery
WWW.STANDARDANDPOORS.COM/RATINGSDIRECT JUNE 7, 2017 6
Barclays Bank PLC

journey. Originally created in May 2014, the non-core division originally held £110 billion in regulatory risk-weighted
assets (RWA), and subsequently expanded by £8 billion. This figure had reduced to a reported £27 billion by March 31,
2017. Once the non-core division has closed, the remaining assets will be folded back into the two core divisions
(which we don't believe will have a meaningful impact on their profiles). Barclays has stated that it expects non-core to
lose about £1 billion in 2017 (via the income and expenses lines) skewed toward the first half of the year. In 2016,
non-core reported a pretax loss of £2.8 billion (and a £241 million loss in the first quarter of 2017).
Barclays UK incorporates the group's personal banking businesses, U.K. wealth management, small business banking,
and the U.K. consumer credit card business (Barclaycard). We estimate that Barclays has a market share of 10%-15%
in most retail products and around 25% share of stock in U.K. credit cards. We understand that Barclays has been
focussing significant resources upon its digital capabilities, and that automation is a greater priority than fast credit
growth at this stage in the economic cycle, which makes sense to us. Notwithstanding growing competitive pressures
across U.K. banking, we expect the U.K. franchise to remain strong and stable, and sufficiently adaptable to
longer-term pressures from nontraditional banking providers.
Barclays International comprises two elements. First, corporate and investment banking: the corporate bank serving
midsize and large clients, global transaction banking, and investment banking. Second, consumer, cards, and
payments: Barclaycard outside the U.K., including U.S. cards, payments, and merchant acquiring, and international
wealth management.
In the investment bank, we understand that Barclays tends towards a less capital-intensive, origination-led business
model (with trading activity primarily supporting client activity and the origination business). Barclays typically ranks
in the top five-to-eight banks by share of global fee pools in advisory, debt and equity underwriting, and lending.
We observe strong growth in Barclays' U.S. retail banking franchise, though it is relatively small with about a 2.5%
market share of consumer credit card and unsecured lending, focusing on co-branded cards.
Our view of business stability is supported by the large and long-established retail, commercial, and investment
banking franchises. Notwithstanding the inherent volatility from investment banking, quarterly income performance
over the past nine quarters has been within a reasonably narrow range (see chart 2).
WWW.STANDARDANDPOORS.COM/RATINGSDIRECT JUNE 7, 2017 7
Barclays Bank PLC

Chart 2
Finally, a key factor in our relative analysis is our view of the management and their strategy. This is pertinent to
Barclays' ratings given the numerous changes that we have observed since the financial crisis.
Today, we take a more upbeat view, as we view the strategy as being more focussed and plausible. However, we note
the following constraints on our assessment today:
• On April 10, 2017, Barclays Board stated that it had reprimanded the group CEO, Jes Staley, relating to Barclays'
whistleblowing programme and an attempt by Mr. Staley in 2016 to identify the author of a letter that was treated
by the bank as a whistleblow. We note that the Board has unanimously backed the CEO, and that he has remained
in his post in the light of the May 2017 AGM. However, he remains subject to a regulatory investigation. We see two
possible outcomes from this development: Either he carries on his duties as normal, or the regulatory review leads
to a suspension or resignation, which in our view could derail the strategic progress made by the group.
• Like several other global banks, Barclays still faces a litany of litigation cases. There are two high profile outstanding
cases, in our view. First, a Serious Fraud Office (SFO) review into potential criminal activity in relation to the bank's
emergency fund raising from Qatar in 2008. We understand that the SFO intends to make a decision shortly.
Second, unlike some peers, Barclays has rejected claims made in a complaint filed by the U.S. Department of
Justice in respect of past U.S. RMBS activities. We do not have insight into the outcome, timing or financial impact
of these investigations but until they are resolved they partly weigh on our assessment.
• The still to be consummated regulatory deconsolidation of BAGL, though we note that the stake has now been sold
WWW.STANDARDANDPOORS.COM/RATINGSDIRECT JUNE 7, 2017 8
Barclays Bank PLC

down to a level that should permit regulatory deconsolidation.
• Barclays is working through its structural reform agenda in the U.K. The departure of the U.K. from the EU may add
an additional layer of complexity to structural reform. We understand that Barclays is making progress, and that the
group is well versed in structural reform having successfully established its U.S. holding company in 2016. However,
the program is a large and complex one for the organization.
Capital and earnings: At this time, we cannot be certain that the RAC ratio will remain comfortablyabove 10%
We view Barclays's capital and earnings as adequate. This is despite our current calculation and projection of Barclays'
risk-adjusted capital (RAC) ratio being above our 10% threshold for a stronger assessment. At this time, we cannot be
certain that RAC will consistently remain comfortably above our threshold.
We calculate Barclays' RAC ratio to be 10.5% as of Dec. 31, 2016. This ratio has increased significantly from 9.6% at
end-2015. This increase is broadly in line with the 100 basis points (bps) increase in Barclays' regulatory Common
Equity Tier 1 (CET1) ratio over the same period primarily due to organic profit generation.
Reflecting our updated view of the likely trends in Barclays' capitalization, we now expect Barclays' RAC ratio to be in
the 10%-11% range by end-2018 (our previous forecast was 9.5%-10.0% by end-2017). This range is wider than our
normal 50 bp range to reflect our lack of certainty over a number of matters, including the potential scale and timing of
conduct and litigation charges, the timing of the Africa exit, and the degree to which Barclays' shareholder distribution
policy will return to more typical levels toward the end of our projection period. Our forecast for Barclays' projected
RAC through to year-end 2018 includes the assumptions outlined below:
• Pre-provision operating income in 2018 to be 10%-15% higher than our calculation of £5.6 billion in 2016 as the
negative impact of non-core assets wanes, trading income improves, and good control of operating expenses
becomes more visible.
• The loan loss rate to rise gradually to around 65 bps in 2018 from our calculation of 57 bps in 2016. This
assumption does not factor in the potential impact of new accounting standard IFRS9. (Note: Africa was reported as
a discontinued operation in 2016 and does not impact these first two bullet point.)
• Approximately £4.5 billion of nonrecurring expenses spread across 2017 and 2018, including restructuring costs,
and our view of conduct- and litigation-related charges, though we acknowledge that the timing and scale of such
charges cannot be precisely estimated.
• Only a modest uptick in the dividend payout ratio in respect of 2017 and 2018 earnings.
• Finally, we have conservatively not assumed any net increase in total adjusted capital (TAC) eligible additional Tier
1 (AT1) instruments. To date this year, Barclays PLC has issued a £1.25 billion AT1 hybrid, partly offset by the
redemption of a legacy preference share issue which had a value of £657 million within TAC at Dec. 31, 2016. We
note the possibility over the projection period that Barclays may choose, in our view, to redeem another legacy
preference share issue which has a value of £1.3 billion within TAC.
We estimate that the effect of higher risk weights, if we lowered the U.K.'s economic risk assessment, would reduce the
RAC ratio by around 80 basis points.
We expect that S&P Global Ratings' RWAs will be broadly unchanged in 2017 as we assume that the decline in
non-core assets will broadly offset business growth. In 2018, we assume that the regulatory deconsolidation of BAGL
will occur and therefore assume a 6% year-on-year decline in RWA (that is, after taking into account our assumption of
WWW.STANDARDANDPOORS.COM/RATINGSDIRECT JUNE 7, 2017 9
Barclays Bank PLC

reasonably brisk business growth).
Barclays reported a regulatory fully loaded CET1 ratio of 12.5% on March 31, 2017. Barclays states that the preference
share redemption had a negative impact of 13 bps over the first quarter but that this redemption will benefit returns
over time. Barclays states that the recent BAGL placing is expected to result in a pro forma increase of approximately
27 bps to its CET1 ratio, with around 46 bps to follow upon regulatory deconsolidation.
The management has indicated that its end-state CET1 target is around the 13% mark, which is consistent with most
U.K. peers. We expect some headwinds to Barclays CET1 progression--for example, the impact of IFRS9, likely further
pension contributions, possible further PPI charges, other possible litigation charges and management may also
choose to undertake redemption of further preference shares. However, the management's clear statement of intent
and degree of confidence in its capital targets, and the reduced scale of potential headwinds compared to the recent
past, may help to support our RAC projections.
We consider the quality of capital to be satisfactory. ACE (adjusted common equity) represents 85% of TAC; we
expect the ratio to remain above 80%, which would be a level similar to peers (see table 2).
Table 2
Barclays PLC Reconciliation Of Total Adjusted Capital
(Mil. £) 2016 2015 2014
Common shareholders' equity (reported) 58,424 54,505 55,245
+ Minority Interest (equity) 3,779 2,388 2,733
- Dividends (not yet distributed) (388) (631) (615)
- Revaluation reserves (2,031) (1,578) (2,379)
- Nonservicing intangibles (7,726) (8,222) (8,180)
- Tax loss carryforwards (503) (902) (1,315)
- Postretirement benefit adjustments (38) (689) 0
- Cumulative effect of credit-spread related revaluation of liabilities (86) (127) (658)
- Other equity adjustments 0 0 0
Adjusted Common Equity 51,603 44,998 46,147
+ Admissible preferred and hybrids 9,162 8,971 7,980
Total Adjusted Capital 60,765 53,969 54,127
Source: S&P Global Ratings database.
Our assessment of capital and earnings also looks beyond the capital analysis and considers both the quality of
earnings and earnings capacity. We believe that the management's risk appetite is not aggressive compared to peers,
as measured by its return on tangible equity target. But, Barclays has still to achieve its returns target (it plans for
group returns to converge with core returns, which were a reported 9.4% in full-year 2016, excluding notable items)
and we believe that statutory performance lags some peers. We expect our calculation of Barclays' earnings buffer,
which measures the capacity for pre-provision income to cover our estimation of normalized credit losses through the
credit cycle, to be around 20 basis points over the next two years. This would be lower than some peers.
In addition, we believe that Barclays still has scope to improve its relative efficiency measures. The group targets a
cost-to-income ratio of below 60% over time. The completion of the structural reform agenda, and the related ability to
WWW.STANDARDANDPOORS.COM/RATINGSDIRECT JUNE 7, 2017 10
Barclays Bank PLC

apply a more granular focus on operating expenses, may facilitate this goal. Further, Barclays' long-term focus on its
digital agenda may enable the efficiency of Barclays UK to grow closer to U.K. retail banking peers (notwithstanding its
lower mortgage book weighting, which weighs on its relative metrics).
Table 3
Barclays PLC Capital And Earnings
--Year-ended Dec. 31--
(%)2016 2015 2014 2013 2012
Tier 1 capital ratio 15.6 14.7 13.0 15.7 13.3
S&P Global Ratings RAC ratio before diversification 10.5 9.6 8.2 8.3 7.3
S&P Global Ratings RAC ratio after diversification 12.7 11.8 10.1 10.6 8.8
Adjusted common equity/total adjusted capital 84.9 83.4 85.3 85.2 86.4
Net interest income/operating revenues 50.3 51.1 46.9 41.1 39.9
Fee income/operating revenues 32.3 32.1 31.7 31.0 29.4
Market-sensitive income/operating revenues 18.5 15.5 19.7 25.2 28.3
Noninterest expenses/operating revenues 73.2 65.9 65.6 65.4 62.1
Preprovision operating income/average assets 0.5 0.7 0.7 0.7 0.7
Core earnings/average managed assets 0.2 0.2 0.2 0.2 0.5
RAC--Risk-adjusted capital. Source: S&P Global Ratings database.
Table 4
Barclays PLC RACF [Risk-Adjusted Capital Framework] Data
(Mil. £)
Basel II
RWA
Average Basel
II RW (%)
S&P Global
Ratings RWA
Average S&P Global
Ratings RW (%)
Credit risk
Government and central banks 176,269 8,700 5 9,938 6
Institutions 33,170 8,950 27 7,964 24
Corporate 208,369 106,813 51 171,222 82
Retail 266,158 86,750 33 179,133 67
Of which mortgage 168,035 28,638 17 65,409 39
Securitization§ 30,302 3,938 13 9,441 31
Other assets 126,027 58,325 46 85,635 68
Total credit risk 840,295 273,475 33 463,332 55
Market risk
Equity in the banking book† 2,819 1,100 48 22,771 808
Trading book market risk -- 25,013 -- 36,208 --
Total market risk -- 26,113 -- 58,979 --
Insurance risk
Total insurance risk -- -- -- 0 --
Operational risk
Total operational risk -- 56,663 -- 56,829 --
WWW.STANDARDANDPOORS.COM/RATINGSDIRECT JUNE 7, 2017 11
Barclays Bank PLC

Table 4
Barclays PLC RACF [Risk-Adjusted Capital Framework] Data (cont.)
(Mil. £) Basel II RWA
S&P Global Ratings
RWA
% of S&P Global
Ratings RWA
Diversification adjustments
RWA before diversification 374,500 579,141 100
Total diversification/concentration
adjustments
-- (101,184) (17)
RWA after diversification 374,500 477,957 83
(Mil. £) Tier 1 capital Tier 1 ratio (%)
Total adjusted
capital
S&P Global
Ratings RAC ratio
(%)
Capital ratio
Capital ratio before adjustments 51,993 13.9 60,765 10.5
Capital ratio after adjustments‡ 51,993 14.2 60,765 12.7
*Exposure at default. §Securitization Exposure includes the securitization tranches deducted from capital in the regulatory framework. †Exposure
and S&P Global Ratings risk-weighted assets for equity in the banking book include minority equity holdings in financial institutions.
‡Adjustments to Tier 1 ratio are additional regulatory requirements (e.g. transitional floor or Pillar 2 add-ons). RWA--Risk-weighted assets.
RW--Risk weight. RAC--Risk-adjusted capital. Sources: Company data as of Dec. 31, 2016, S&P Global Ratings.
Risk position: Well-managed loan portfolios but substantial pockets of potential risk
We consider Barclays' risk position to be adequate, which is a better assessment than some global banks with large
investment banking operations (for example Deutsche Bank, Goldman Sachs Group Inc., and Morgan Stanley; RBS
also has a moderate assessment). This view is supported by our opinion that Barclays' risk management capabilities
have generally held up well against peers over many years (despite a fairly aggressive overall business strategy at
times in the past) and our belief that the credit quality of its large domestic loan book compares more favorably with
most U.K. peers (notwithstanding its higher consumer credit weighting). As indicated by our negative economic risk
trend, significantly weaker U.K. economic performance would inevitably impact Barclays' asset quality, most especially
its consumer credit book.
A key factor in our ongoing assessment will be the pace and quality of business expansion at Barclays International.
Our criteria limit the risk position assessment to moderate if investment banking activities are likely to contribute more
than 50% to revenues over the long-term. Historically, this metric has typically been in the 30%-40% range for
Barclays. In 2016 (and the first quarter of 2017), Barclays states that corporate and investment banking represented
47% of core income (that is, excluding non-core and the African business). However, we note that in 2016, for
example, over one-quarter of this income related to corporate lending and transactional banking (for example,
Barclays' large U.K. corporate franchise is booked within the corporate and investment bank, not Barclays UK).
We note that the bank engages heavily in the derivatives and trading markets and ultimately relies on the strengths of
its counterparties for this business and various other business segments. Barclays uses a range of risk and stress
measures to manage trading market risk. Measures of traded market risk increased slightly in 2016. For example, its
reported average one-day 95% value-at-risk (VaR) was £21 million, slightly up from £17 million in 2015 but down from
£22 million in 2014 and £29 million in 2013. The slight increase in 2016 was understandable given increased market
activity and periods of heightened volatility. Overall, we consider that Barclays' market risk is not an outlier relative to
WWW.STANDARDANDPOORS.COM/RATINGSDIRECT JUNE 7, 2017 12
Barclays Bank PLC

global peers. The RAC ratio does not capture the non-trading market risk of its large defined-benefit pension fund
exposure.
The 17% RAC diversification demonstrates the good spread of Barclays' activities by business line, geography, and risk
type. (U.K. peers range from around 3% to 17%.)
Like most large banks, Barclays has imposed tight controls around balance sheet growth in recent years over and
above its non-core business and asset disposals. For the purposes of our RAC projection, we now assume that loan
balances will grow more briskly, at circa 4% per annum, over the next two years. We take some comfort from the fact
that the U.K. loan book has been broadly static in size for the past couple of years (whereas some smaller U.K. peers
have been growing very fast) but will continue to monitor areas of growth within its international portfolio such as U.S.
cards.
We consider Barclays' large loan portfolios to be well controlled for the most part, but note that it has incurred outsize
losses outside the U.K. in the past. Geographic diversity can be both a strength and a weakness. For example, over the
2009-2013 period, international loans accounted for an average 52% of total impairment charges. The sell-down from
Africa does reduce some inherent volatility in Barclay's relative risk metrics.
Gross customer loans were a reported £397.4 billion at year-end 2016, down 1.7% on the prior year. (Note: the Africa
operations were reported as discontinued and do not affect these data.) By geography, the U.K. represented 64%,
followed by the Americas with 21%, while Europe represented most of the remainder. By sector, residential mortgages
represent around 37% of the total. Other notable segments include consumer credit (cards, unsecured loans, and other
personal lending), which represented 15% (see chart 3).
WWW.STANDARDANDPOORS.COM/RATINGSDIRECT JUNE 7, 2017 13
Barclays Bank PLC

Chart 3
We consider that the quality of the U.K. mortgage book (around £132 billion) compares well with peers. Within its
domestic book Barclays has a higher weighting of consumer credit than its peers (12% of domestic loans; peers are
typically in the 5%-8% range), though this business is higher margin, well-seasoned, and is typically franchise based
lending. In fact, at Dec. 31, 2016, Barclays states that its U.S. card book is larger than its U.K. cards book (though it did
sell a portfolio of U.S. card receivables in the first quarter of 2017). Current delinquency rates in both geographies
appear very low versus historic norms.
Barclays' C&I (corporate and industrial) portfolio is diverse by sector, geography, and single-name exposure. We take
some comfort from the fact that its gross commercial real estate loan book (£24.4 billion exposure to construction and
property) is only a relatively modest 6% of total customer loans, of which the vast majority relates to its main U.K.
market.
Barclays' nonperforming loans (NPL) ratio, by our measure (covering impaired loans plus 90 days past due loans and
renegotiated loans), was a low 2.1% at Dec. 31, 2016 and provision coverage of such loans was a solid 53%. Both
measures compare favorably to U.K. peers with diversified loan books.
Barclays' loan loss rates are usually higher than domestic peers, reflecting its higher consumer credit weighting and its
WWW.STANDARDANDPOORS.COM/RATINGSDIRECT JUNE 7, 2017 14
Barclays Bank PLC

international lending. For example, in 2016 around 83% of total loan impairment charges related to consumer credit
(equally split between U.K. and international portfolios).
In 2016, Barclays reported loss rate increased to 53 bps from 42 bps in 2015 (these metrics exclude Africa). The
increase mainly reflected a management review of impairment modelling for U.K. and U.S. cards portfolios and the
impairment of a number of single-name exposures (for example, in the oil and gas sectors) rather than an underlying
deterioration in credit quality. Since 2005 (i.e., the introduction of IFRS) Barclays' loss rate has averaged just over 75
bps.
As stated in our RAC projection, we expect loss rates to trend a little higher over the next two years with the rate of
change being broadly consistent with our assumptions for the U.K. banking system (see "U.K. Bank Credit Losses In
2017 Are Nothing To Be Afraid Of," published on March 23, 2017). That said, at these levels loan losses remain
relatively benign, reflecting very low interest rates and our view that there is generally a lag between macroeconomic
deterioration and banking system loan losses. In its U.K. domestic loan book, Barclays continues to perform relatively
well. For example, loss rates on its domestic mortgage book are consistently below peers (and its loan-to-value profile
is superior), as are commercial real estate and C&I portfolios. We calculate that reported U.K. commercial real estate
was a modest 18% of TAC at Dec. 31, 2016, a level well below most domestic peers.
Table 5
Barclays PLC Risk Position
--Year-ended Dec. 31--
(%)2016 2015 2014 2013 2012
Growth in customer loans (3.3) (6.9) (0.6) (0.2) (1.5)
Total diversification adjustment/S&P Global Ratings RWA before diversification (17.5) (18.2) (19.1) (21.3) (16.9)
Total managed assets/adjusted common equity (x) 23.5 24.9 29.4 28.4 35.5
New loan loss provisions/average customer loans 0.6 0.5 0.5 0.7 0.8
Net charge-offs/average customer loans 0.4 0.4 0.6 0.7 0.8
Gross nonperforming assets*/customer loans + other real estate owned 2.1 2.3 2.4 3.3 4.4
Loan loss reserves/gross nonperforming assets* 53.2 49.9 50.4 48.0 47.4
*Impaired loans plus 90 days past due loans and renegotiated loans. RWA--Risk-weighted assets. Source: S&P Global Ratings.
Funding and liquidity: Balanced profiles
We regard Barclays' funding as average, an assessment which we solely compare with the U.K. banking system. The
only U.K. bank with an above average assessment is HSBC Bank PLC. Barclays' funding profile benefits from its
diverse deposit base, including its granular U.K. franchise, and its proven ability to access a wide variety of wholesale
funding sources in varied market conditions (this was the case post the 2016 EU referendum, for example).
We view the bank's liquidity, which we compare globally, as adequate which takes into account its large absolute stock
of liquid assets and its solid liquidity metrics. We note that Barclays' current stock of wholesale funding is less than its
group liquidity pool, which is indicative of its current comfortable balance sheet position.
The fact that Barclays' investment bank is an active borrower in confidence-sensitive wholesale markets makes a
stronger funding and liquidity assessment unlikely. This is despite our expectation that group funding and liquidity
WWW.STANDARDANDPOORS.COM/RATINGSDIRECT JUNE 7, 2017 15
Barclays Bank PLC

metrics will not change materially.
The funding profile is underpinned by Barclays' strong deposit franchise. At year-end 2016, Barclays' loan-deposit
ratio, by our measures, stood at 95.3%, slightly lower than the year before. Indeed this metric has been on a consistent
downward trend for eight straight years. The median for the top-20 domestic U.K. banks, by revenues, was 104% at the
most recent financial year-end (HSBC Bank was 73%). Indicative of Barclays' comfortable funding profile is that
reported customer deposits exceeded customer loans in both its Barclays UK and Barclays International divisions at
March 31, 2017. We assume that the balance between deposits and loans will not change any time soon, especially as
Barclays works toward the completion of its structural reform agenda.
We consider our stable funding ratio to also be a relevant measure. We calculate that Barclays' stable funding ratio was
a solid 101.7% at year-end 2016. The U.K. median is 107%. This metric indicates a balanced use of deposit and
long-term wholesale funding to finance less-liquid assets. We note that Barclays' metric would more likely be around
the median if we had adjusted for the impact of Barclays Africa (which is reported as a separate line in the balance
sheet as a disposal group held for sale). We believe that Barclays' stable funding ratio will remain comfortably above
100% over the next two years.
The investment bank funds the majority of its inventory on a secured basis (repos and securities financing), and its
short-term unsecured borrowing primarily funds Barclays' liquidity portfolio. Barclays states that, as of March 31, 2017,
total group wholesale funding outstanding excluding repos was £166 billion.
Barclays' group liquidity pool (portfolios of unencumbered cash, central bank deposits, and government and
supranational bonds) totaled £185 billion as of March 31, 2017, that is it exceeds the total stock of wholesale funding.
The liquidity pool principally comprises cash and deposits with central banks and highly rated government bonds. Our
calculation of Barclays' broad liquid assets to short-term wholesale funding at year-end 2016 was a solid 1.5x and we
expect this metric to remain at a comfortable level. We also note that Barclays states its estimated Basel III liquidity
coverage ratio was a relatively high 140% as of March 31, 2017.
Table 6
Barclays PLC Funding And Liquidity
--Year-ended Dec. 31--
(%) 2016 2015 2014 2013 2012
Core deposits/funding base 58.7 59.3 52.3 47.3 40.8
Customer loans (net)/customer deposits 95.3 99.7 104.7 105.0 116.1
Long term funding ratio 74.5 75.7 68.3 61.5 58.6
Stable funding ratio 101.7 110.8 101.2 97.3 98.9
Short-term wholesale funding/funding base 27.8 26.3 34.0 40.9 43.8
Broad liquid assets/short-term wholesale funding (x) 1.5 1.5 1.2 1.0 1.0
Net broad liquid assets/short-term customer deposits 23.9 22.3 12.9 3.8 5.1
Short-term wholesale funding/total wholesale funding 65.2 62.6 69.8 76.3 73.2
Narrow liquid assets/three-month wholesale funding (x) 1.7 1.6 1.3 1.1 1.1
Source: S&P Global Ratings database.
WWW.STANDARDANDPOORS.COM/RATINGSDIRECT JUNE 7, 2017 16
Barclays Bank PLC

Support: Our ALAC measure continues to rise
In our view, Barclays has high systemic importance in the U.K. Since June 2015, we have regarded the prospect of
extraordinary government support for U.K. banks as uncertain in view of the country's well-advanced and effective
resolution regime. As a result, systemic banks are not eligible for notches of uplift for possible future U.K. government
support.
We now incorporate two notches of uplift (up from one notch) into the long-term rating on BB PLC (the main
operating subsidiary) because the group's ALAC ratio is both above our 8.5% threshold today and over a two-year
projection period. We view the U.K. resolution regime as effective under our ALAC criteria because, among other
factors, we believe it contains a well-defined bail-in process under which authorities would permit nonviable
systemically important banks to continue critical functions as going concerns following a bail-in of eligible liabilities.
We include the majority of the consolidated Barclays group's junior and NOHC instruments in our ALAC assessment
because, over our projection period, we believe they have capacity to absorb losses without triggering a default on
Barclays' senior obligations (see table 8). We exclude certain instruments issued in jurisdictions not yet deemed to
have an effective resolution regime and/or under foreign law (for example, instruments issued by BAGL). On this
basis, we calculate that ALAC was 9.8% of S&P Global Ratings' RWAs at year-end 2016, significantly higher than 7.3%
at end-2015. The improvement was mainly the result of material issuance of ALAC-eligible instruments over the
course of 2016.
Table 7
Summary Of ALAC Calculation As Of Dec. 31, 2016
(Bil. £) % Of S&P Global Ratings RWA
A Adjusted common equity 51,603
B Hybrids in TAC 9,162
C (A+B) Total adjusted common equity 60,765 10.5
D TAC in excess of our 7% threshold 20,225 3.5
E ALAC-eligible instruments 36,571 6.3
Of which NOHC senior 16,800
Of which dated subordinated 14,970
Of which minimal equity content hybrids 4,628
Of which other 173
F (=D+E) ALAC buffer 56,796 9.8
S&P Global Ratings RWA 579,141
TAC--Total adjusted capital. ALAC--Additional loss-absorbing capacity. RWA--Risk-weighted assets. Source: S&P Global Ratings database.
Consistent with our criteria, and our treatment of ALAC for many global banks, we raise the threshold for ALAC uplift
by 50 bps to 8.5% (from our typical 8.0% threshold) because the Barclays group operates through multiple regulated
legal entities worldwide and we think this might constrain the flexible deployment of ALAC in a stress scenario.
In the first five months of 2017, we have observed that Barclays has issued further material levels of ALAC-eligible
instruments. This issuance supports our assumption that our ALAC ratio will remain above our threshold (even if, for
example, S&P Global Ratings' RWA rose because we lowered our assessment of U.K. economic risk). Further, Barclays
WWW.STANDARDANDPOORS.COM/RATINGSDIRECT JUNE 7, 2017 17
Barclays Bank PLC

states that its NOHC MREL (minimum requirement for own funds and eligible liabilities) position was 21.6% at March
31, 2017. The Bank of England has now communicated to all relevant U.K. banks their non-binding indicative MREL
requirements through to 2022. Firms become subject to interim requirements for MREL on Jan. 1, 2020, and final
requirements will come into force in 2022. In the case of Barclays, these figures are 24.5% and 28.5% respectively, and
gross issuance required to achieve these targets appears to us to be both manageable and supportive of our ALAC
assessment.
Additional rating factors: An adjustment ahead of ring-fencing
We apply a negative adjustment to the ICR on BB PLC. This reflects our expectation, all else being equal, that we
currently expect to rate BB PLC (as the non-ring-fenced bank) at one notch below the 'a' supported GCP given our
current expectation of our reclassification of its group status to highly strategic.
Group structure, rated subsidiaries and hybrids
Barclays PLC is the ultimate holding company of the group that it heads, and is a NOHC.
Barclays PLC currently operates through one principal operating subsidiary: BB PLC. We currently view BB PLC as
core to Barclays PLC and expect that regulators would intervene at the point of nonviability, bailing in junior liabilities
and, if necessary, NOHC liabilities, to ensure that senior obligations are honored. Our ratings on BB PLC (and its core
subsidiaries) are therefore in line with the ALAC-supported 'a' GCP (less the negative adjustment to the ICR as
described above).
We do not include notches for ALAC support in the ratings on NOHCs because we do not believe that their senior
obligations would continue to receive full and timely payment in a resolution scenario. As a result of this, Barclays PLC
is rated one notch below the 'bbb+' unsupported GCP.
The hybrid capital instruments issued by the NOHC are notched down from the unsupported GCP, being notched
down in accordance with tables 1 and 2 of the bank hybrid criteria, depending on their features.
Ratings impact of U.K. ring-fencing regulation
Barclays outlined its path to meeting U.K. regulatory ring-fencing rules by Jan. 1, 2019, by establishing in 2016 a
simplified divisional structure with Barclays UK as the future U.K. ring-fenced bank and the existing BB PLC as
Barclays International or the future non-ring fenced bank.
In addition, a group service company (Barclays Services Ltd, formerly known as Barclays Capital Services Ltd), is
being ramped up in scale during 2017 in order to provide critical services to both Barclays UK and Barclays
International. Barclays Services Ltd will house the people, assets, and contracts that support the group's critical
services. Regulation requires the group to demonstrate and ensure operational continuity of its critical services to
facilitate recovery and resolution actions, if required. Barclays Services Ltd. is a direct subsidiary of Barclays PLC and
we rate it in line with the highest rated operating entity of the group.
While we view ring-fencing as presenting a significant operational challenge for Barclays with associated set-up and
ongoing friction costs, we do not expect ring-fencing in itself will weaken our view of the group's 'bbb+' unsupported
GCP. Many of the constraints to fungibility of group resources that ring-fencing will formalize are recognized in our
assessment today. Examples of this include the prudential requirements of the group's overseas subsidiaries,
WWW.STANDARDANDPOORS.COM/RATINGSDIRECT JUNE 7, 2017 18
Barclays Bank PLC

pre-positioning requirements for future TLAC/MREL, and the separate funding, liquidity, capital, large exposure and
governance structures of each legal entity relative to the rest of the group.
Although our view of the group's aggregate creditworthiness is unlikely to weaken under ring-fencing, we are likely to
assess BB PLC as highly strategic to the group given its higher risk profile relative to Barclays UK as the ring-fenced
bank (which we would expect to assess as core). We do not expect Barclays UK to be designated an insulated
subsidiary as defined in our criteria. Despite the non-ring-fenced bank's larger size, greater diversity, and its strategic
importance to the group, the potential one-notch difference between Barclays UK and Barclays International would
also reflect our view that the objective of ring-fencing are to protect critical banking functions in the U.K. and, in a
non-viability scenario, the likelihood of group support to the non-ring-fenced bank is, at the margins, lower than the
U.K. ring-fenced entity.
Barclays has stated that in the first half of 2018 it expects legal entity separation (i.e., ring-fencing) will "go live," and
we note that Barclays has already received conditional banking licence approval for the ring-fenced bank. In the
second half of 2017, or into 2018, we expect to have sufficient line of sight to finalize our view of the status of BB PLC
within the group as well as its stand-alone creditworthiness, the senior unsecured debt ratings and the ratings on its
hybrid instruments.
Finally, we rate a handful of subsidiaries and branches (see ratings list below). We currently assume that these will
remain within BB PLC.
Related Criteria And Research
Related Criteria
• Methodology For Linking Long-Term And Short-Term Ratings, April 7, 2017
• Guarantee Criteria, Oct. 21, 2016
• Bank Rating Methodology And Assumptions: Additional Loss-Absorbing Capacity, April 27, 2015
• Bank Hybrid Capital And Nondeferrable Subordinated Debt Methodology And Assumptions, Jan. 29, 2015
• Principles For Rating Debt Issues Based On Imputed Promises, Dec. 19, 2014
• National And Regional Scale Credit Ratings, Sept. 22, 2014
• Group Rating Methodology, Nov. 19, 2013
• Assessing Bank Branch Creditworthiness, Oct. 14, 2013
• Quantitative Metrics For Rating Banks Globally: Methodology And Assumptions, July 17, 2013
• Revised Market Risk Charges For Banks In Our Risk-Adjusted Capital Framework, June 22, 2012
• Banks: Rating Methodology And Assumptions, Nov. 9, 2011
• Banking Industry Country Risk Assessment Methodology And Assumptions, Nov. 9, 2011
• Bank Capital Methodology And Assumptions, Dec. 6, 2010
• Use Of CreditWatch And Outlooks, Sept. 14, 2009
• Commercial Paper I: Banks, March 23, 2004
Related Research
• Barclays PLC 'BBB/A-2' Ratings Affirmed; Outlook Remains Negative Despite Additional Loss-Absorbing Capacity
Build, May 31, 2017
• Various U.K. Banks' Ratings Affirmed; Outlooks Still Mainly Negative On Continued Economic Uncertainty Related
WWW.STANDARDANDPOORS.COM/RATINGSDIRECT JUNE 7, 2017 19
Barclays Bank PLC

To Brexit, May 31, 2017
• Banking Industry Country Risk Assessment: United Kingdom, May 31, 2017
• Ratings On The United Kingdom Affirmed At 'AA/A-1+'; Outlook Remains Negative, April 28, 2017
• U.K. Bank Credit Losses In 2017 Are Nothing To Be Afraid Of, March 23, 2017
• Major U.K. Banks Report Aggregate Year-On-Year Underlying Pre-Tax Profit Growth In 2016, March 1, 2017
• U.K. Banks: What's On The Cards For 2017, Jan. 17, 2017
• Barclays Capital Services Ltd. Assigned 'A-/A-2' Ratings; Outlook Negative, Dec. 7, 2016
• Stress Test Results Highlight U.K. Banks' Enhanced Resilience, Dec. 1, 2016
• Rating U.K. Banking Groups Affected By Ring-Fencing: Why One Size May Not Fit All Subsidiaries, Nov. 24, 2016
Anchor Matrix
Industry
Risk
Economic Risk
1 2 3 4 5 6 7 8 9 10
1 a a a- bbb+ bbb+ bbb - - - -
2 a a- a- bbb+ bbb bbb bbb- - - -
3 a- a- bbb+ bbb+ bbb bbb- bbb- bb+ - -
4 bbb+ bbb+ bbb+ bbb bbb bbb- bb+ bb bb -
5 bbb+ bbb bbb bbb bbb- bbb- bb+ bb bb- b+
6 bbb bbb bbb- bbb- bbb- bb+ bb bb bb- b+
7 - bbb- bbb- bb+ bb+ bb bb bb- b+ b+
8 - - bb+ bb bb bb bb- bb- b+ b
9 - - - bb bb- bb- b+ b+ b+ b
10 - - - - b+ b+ b+ b b b-
Ratings Detail (As Of June 7, 2017)
Barclays Bank PLC
Counterparty Credit Rating A-/Negative/A-2
Greater China Regional Scale cnAA-/--/--
Certificate Of Deposit
Foreign Currency A-/A-2/A-2
Commercial Paper
Foreign Currency A-2
Junior Subordinated BB
Junior Subordinated BB+
Junior Subordinated BBB-
Preference Stock BB
Senior UnsecuredGreater China Regional Scale cnAA-
Senior Unsecured A-
Senior Unsecured BBB
Short-Term Debt A-2
Subordinated BB+
Subordinated BBB-
WWW.STANDARDANDPOORS.COM/RATINGSDIRECT JUNE 7, 2017 20
Barclays Bank PLC

Ratings Detail (As Of June 7, 2017) (cont.)
Counterparty Credit Ratings History
07-Jul-2016 A-/Negative/A-2
09-Jun-2015 A-/Stable/A-2
03-Feb-2015 A/Watch Neg/A-1
29-Apr-2014 A/Negative/A-1
02-Jul-2013 A/Stable/A-1
05-Jul-2012 A+/Negative/A-1
07-Jul-2016 Greater China Regional Scale cnAA-/--/--
09-Jun-2015 cnAA/--/--
03-Feb-2015 cnAA+/Watch Neg/--
02-Jul-2013 cnAA+/--/--
31-May-2013 cnAAA/--/--
Sovereign Rating
United Kingdom AA/Negative/A-1+
Related Entities
Absa Bank Ltd.
Issuer Credit Rating
South Africa National Scale zaA/--/zaA-1
Barclays Africa Group Ltd.
Issuer Credit Rating
South Africa National Scale zaBB+/--/zaB
Barclays Bank Ireland PLC
Issuer Credit Rating A-/Negative/A-2
Barclays Bank Mexico S.A.
Issuer Credit Rating
CaVal (Mexico) National Scale mxAAA/Negative/mxA-1+
Barclays Bank PLC (Hong Kong Branch)
Commercial Paper
Foreign Currency A-2
Barclays Bank plc (Madrid Branch)
Issuer Credit Rating A-/Negative/A-2
Barclays Bank plc (Milan Branch)
Issuer Credit Rating A-/Negative/A-2
Barclays Bank PLC (New York Branch)
Commercial Paper
Foreign Currency A-2
Barclays Bank PLC (Singapore Branch)
Commercial Paper
Foreign Currency A-2
Barclays Bank PLC (Tokyo Branch)
Commercial Paper
Foreign Currency A-2
WWW.STANDARDANDPOORS.COM/RATINGSDIRECT JUNE 7, 2017 21
Barclays Bank PLC

Ratings Detail (As Of June 7, 2017) (cont.)
Barclays Capital Inc.
Issuer Credit Rating A-/Negative/A-2
Barclays PLC
Issuer Credit Rating BBB/Negative/A-2
Commercial Paper
Foreign Currency A-2
Junior Subordinated B+
Senior Unsecured BBB
Subordinated BB+
Barclays Services Ltd.
Issuer Credit Rating A-/Negative/A-2
Barclays US Funding LLC
Senior Unsecured A-
Short-Term Debt A-2
*Unless otherwise noted, all ratings in this report are global scale ratings. S&P Global Ratings’ credit ratings on the global scale are comparable
across countries. S&P Global Ratings’ credit ratings on a national scale are relative to obligors or obligations within that specific country. Issue and
debt ratings could include debt guaranteed by another entity, and rated debt that an entity guarantees.
Additional Contact:
Financial Institutions Ratings Europe; [email protected]
WWW.STANDARDANDPOORS.COM/RATINGSDIRECT JUNE 7, 2017 22
Barclays Bank PLC

WWW.STANDARDANDPOORS.COM/RATINGSDIRECT JUNE 7, 2017 23
STANDARD & POOR’S, S&P and RATINGSDIRECT are registered trademarks of Standard & Poor’s Financial Services LLC.
S&P may receive compensation for its ratings and certain analyses, normally from issuers or underwriters of securities or from obligors. S&P reserves the right to disseminateits opinions and analyses. S&P's public ratings and analyses are made available on its Web sites, www.standardandpoors.com (free of charge), and www.ratingsdirect.comand www.globalcreditportal.com (subscription), and may be distributed through other means, including via S&P publications and third-party redistributors. Additionalinformation about our ratings fees is available at www.standardandpoors.com/usratingsfees.
S&P keeps certain activities of its business units separate from each other in order to preserve the independence and objectivity of their respective activities. As a result,certain business units of S&P may have information that is not available to other S&P business units. S&P has established policies and procedures to maintain theconfidentiality of certain non-public information received in connection with each analytical process.
To the extent that regulatory authorities allow a rating agency to acknowledge in one jurisdiction a rating issued in another jurisdiction for certain regulatory purposes, S&Preserves the right to assign, withdraw or suspend such acknowledgment at any time and in its sole discretion. S&P Parties disclaim any duty whatsoever arising out of theassignment, withdrawal or suspension of an acknowledgment as well as any liability for any damage alleged to have been suffered on account thereof.
Credit-related and other analyses, including ratings, and statements in the Content are statements of opinion as of the date they are expressed and not statements of fact.S&P’s opinions, analyses and rating acknowledgment decisions (described below) are not recommendations to purchase, hold, or sell any securities or to make anyinvestment decisions, and do not address the suitability of any security. S&P assumes no obligation to update the Content following publication in any form or format. TheContent should not be relied on and is not a substitute for the skill, judgment and experience of the user, its management, employees, advisors and/or clients when makinginvestment and other business decisions. S&P does not act as a fiduciary or an investment advisor except where registered as such. While S&P has obtained information fromsources it believes to be reliable, S&P does not perform an audit and undertakes no duty of due diligence or independent verification of any information it receives.
No content (including ratings, credit-related analyses and data, valuations, model, software or other application or output therefrom) or any part thereof (Content) may bemodified, reverse engineered, reproduced or distributed in any form by any means, or stored in a database or retrieval system, without the prior written permission ofStandard & Poor’s Financial Services LLC or its affiliates (collectively, S&P). The Content shall not be used for any unlawful or unauthorized purposes. S&P and any third-partyproviders, as well as their directors, officers, shareholders, employees or agents (collectively S&P Parties) do not guarantee the accuracy, completeness, timeliness oravailability of the Content. S&P Parties are not responsible for any errors or omissions (negligent or otherwise), regardless of the cause, for the results obtained from the useof the Content, or for the security or maintenance of any data input by the user. The Content is provided on an “as is” basis. S&P PARTIES DISCLAIM ANY AND ALL EXPRESSOR IMPLIED WARRANTIES, INCLUDING, BUT NOT LIMITED TO, ANY WARRANTIES OF MERCHANTABILITY OR FITNESS FOR A PARTICULAR PURPOSE OR USE, FREEDOMFROM BUGS, SOFTWARE ERRORS OR DEFECTS, THAT THE CONTENT’S FUNCTIONING WILL BE UNINTERRUPTED OR THAT THE CONTENT WILL OPERATE WITH ANYSOFTWARE OR HARDWARE CONFIGURATION. In no event shall S&P Parties be liable to any party for any direct, indirect, incidental, exemplary, compensatory, punitive,special or consequential damages, costs, expenses, legal fees, or losses (including, without limitation, lost income or lost profits and opportunity costs or losses caused bynegligence) in connection with any use of the Content even if advised of the possibility of such damages.
Copyright © 2016 by Standard & Poor’s Financial Services LLC. All rights reserved.