barclays plc · pdf filenii for these businesses2 grew 4%, reflecting an increase in customer...
TRANSCRIPT
1 |
Barclays PLC 2014 Full Year Results 3 March 2015

2 |
Antony Jenkins Barclays Group Chief Executive

3 |
2016 Transform targets
Returns
Cost
Barclays Core
Adjusted RoE >12%
Adjusted operating expenses <£14.5bn
Leverage
Dividend
Capital
Group Leverage ratio >4.0%
Payout ratio 40-50%
CRD IV FL CET1 ratio >11.0%
Returns Barclays Non-Core Drag on adjusted RoE <(3%)
GROUP CORE NON-CORE CONCLUSION
10.9%2
£15.1bn2
3.8%1
38%
10.5%1
(4.1%)
2014
1 Including Spain disposal | 2 Excluding CTA. RoE 9.2% including CTA |
FI Big Pack
Barclays Full Year 2014 Results | 3 March 2015
2016 Target

4 |
Tushar Morzaria Barclays Group Finance Director

5 |
Year ended – December (£m) 2013 2014
Income 27,896 25,728
Impairment (3,071) (2,168)
Total operating expenses (19,893) (18,069)
– Costs to achieve Transform (CTA) (1,209) (1,165)
Adjusted profit before tax 4,908 5,502
Tax (1,963) (1,704)
NCI and other equity interests (757) (1,019)
Adjusted attributable profit 2,188 2,779
Ad
just
me
nts
– Provisions for PPI and IRH redress (2,000) (1,110)
– Gain on US Lehman acquisition assets 259 461
– Provision for ongoing investigations and litigation relating to Foreign Exchange
– (1,250)
– Loss on announced sale of the Spanish business
– (446)
– ESHLA valuation revision – (935)
– Own credit and goodwill impairment (299) 34
Statutory profit before tax 2,868 2,256
Statutory attributable profit/(loss) 540 (174)
Basic EPS1 15.3p 17.3p
Return on average equity1 4.1% 5.1%
Financial performance
• Adjusted profit before tax increased by 12% to £5.5bn as PCB and Barclaycard continued to grow profits. This was partly offset by reduced income in the Investment Bank, which made progress on its origination-led strategy whilst driving cost savings and RWA efficiencies
• Adjusted income decreased 8% while impairment reduced by 29% due to a £732m reduction in Non-Core to £168m and 8% reduction in the Core business
• Total adjusted operating expenses decreased 9% to £18.1bn driven by savings from Transform programmes and favourable currency movements. Operating expenses excluding CTA were £16.9bn, down from £18.7bn in 2013 and ahead of the £17bn 2014 target
• Adjusted attributable profit was £2.8bn, resulting in EPS of 17.3p
• Core RoE was 9.2% (or 10.9% excluding CTA) – Group RoE was 5.1%
• Barclays Non-Core attributable loss reduced by 43% to £1.1bn, and RoE drag fell to 4.1%
Summary Group financials: Adjusted profits up 12%
GROUP CORE NON-CORE CONCLUSION
1 EPS and RoE calculations are based on adjusted attributable profit, also taking into account tax credits on AT1 coupons |
FI Big Pack
Barclays Full Year 2014 Results | 3 March 2015

6 |
9.1% 9.5%
9.9% 10.2% 10.3%
Dec-13 Mar-14 Jun-14 Sep-14 Dec-14
Fully loaded CRD IV CET1 ratio1
283 285
Dec-13 Dec-14
3.0% 3.1% 3.4% 3.5% 3.7%
Dec-13 Mar-14 Jun-14 Sep-14 Dec-14
Leverage ratio3
531 660 733
859 1,057
FY10 FY11 FY12 FY13 FY14
Strengthening key financial metrics
TNAV (pence per share)
Dividends paid to shareholders (£m)
GROUP CORE NON-CORE CONCLUSION
1 Based on Barclays interpretation of the final CRD IV text and latest EBA technical standards | 2 Including sale of the Spanish business which was completed on 2 January 2015 | 3 Dec-13 and Mar-13 not comparable to the estimates as of Jun-14 onwards due to different basis of preparation. Dec-13 and Mar-13 estimated ratio and T1 capital based on PRA leverage ratio calculated as fully loaded CRD IV T1 capital adjusted for certain PRA defined deductions, and a PRA adjusted leverage exposure measure. From Jun-14 onwards, estimated ratios based on current understanding of the BCBS 270 standards and the requirements contained in the European Commission delegated act |
Spain2
10.5%
Barclays Full Year 2014 Results | 3 March 2015
Spain2
3.8%
3 3
• FY14 dividend per share – 6.5p

7 |
Highlights Financial performance
• PBT up 3% at £6.7bn:
− PCB and Barclaycard profits up 29% and 13% respectively
− Africa Banking profits down 6%, but up 13% on a constant currency basis
− Investment Bank profits down 32% in a year of transition
• Income fell 4% to £24.7bn
• Impairment improved by 8% to £2.0bn, reflecting the improving UK economic environment benefitting PCB and reduced impairment in Africa Banking South Africa mortgages portfolio
• Operating expenses down 6% to £16.1bn reflecting Transform savings across the businesses, partially offset by an increase in CTA spend, including restructuring of the branch network and technology improvements to increase automation in PCB
• Core attributable profit was £3.9bn with Core EPS of 24p
• Core RoE was 9.2% (10.9% excluding CTA) on average allocated equity of £42bn, up £6bn from 2013
Core business performing well
GROUP CORE NON-CORE CONCLUSION
Year ended – December (£m) 2013 2014
Income 25,603 24,678
Impairment (2,171) (2,000)
Total operating expenses (17,048) (16,058)
– Costs to achieve Transform (CTA) (671) (953)
Adjusted profit before tax 6,470 6,682
Tax (1,754) (1,976)
NCI and other equity interests (638) (842)
Adjusted attributable profit 4,078 3,864
Adjusted financial performance measures
Average allocated equity £36bn £42bn
Return on average tangible equity 14.4% 11.3%
Return on average equity 11.3% 9.2%
Cost: income ratio 67% 65%
Basic EPS contribution 28.5p 24.0p
Dec-13 Dec-14
CRD IV RWAs £333bn £327bn
Leverage exposure1 n/a £956bn
FI Big Pack
Barclays Full Year 2014 Results | 3 March 2015
1 BCBS 270 leverage exposure. All references to leverage exposure in this document is on this basis |

8 |
Core income – growth in NII • Improved performance in PCB and Barclaycard income
− PCB grew NII 7% driven by lending and deposit growth and margin improvement
− Barclaycard grew NII 8% driven by volume growth
• Africa Banking income was up 7% on a constant currency basis, with NII up 9% on the same basis
GROUP CORE NON-CORE CONCLUSION
1 Includes Head Office income | 2 For Personal and Corporate Banking, Barclaycard and Africa Banking |
Average customer assets and liabilities2 (£bn)
• NIM increased from 402bps to 408bps, measured across PCB, Barclaycard and Africa Banking
Net interest margin2 (bps)
• Average customer assets increased 2.7% to £280bn, with growth in PCB and Barclaycard, and in Africa Banking on a constant currency basis
Core income year ended – December (£m) 2013 2014
Personal and Corporate Banking 8,723 8,828
Barclaycard 4,103 4,356
Africa Banking 4,039 3,664
Investment Bank 8,596 7,588
Total Core1 25,603 24,678
402 408
380
385
390
395
400
405
410
FY13 FY14
273 280 317 334
0
50
100
150
200
250
300
350
400
FY13 FY14
Customer assets Customer liabilities
NII for these businesses2 grew 4%, reflecting an increase in customer assets and NIM
FI Big Pack
Barclays Full Year 2014 Results | 3 March 2015
9 |
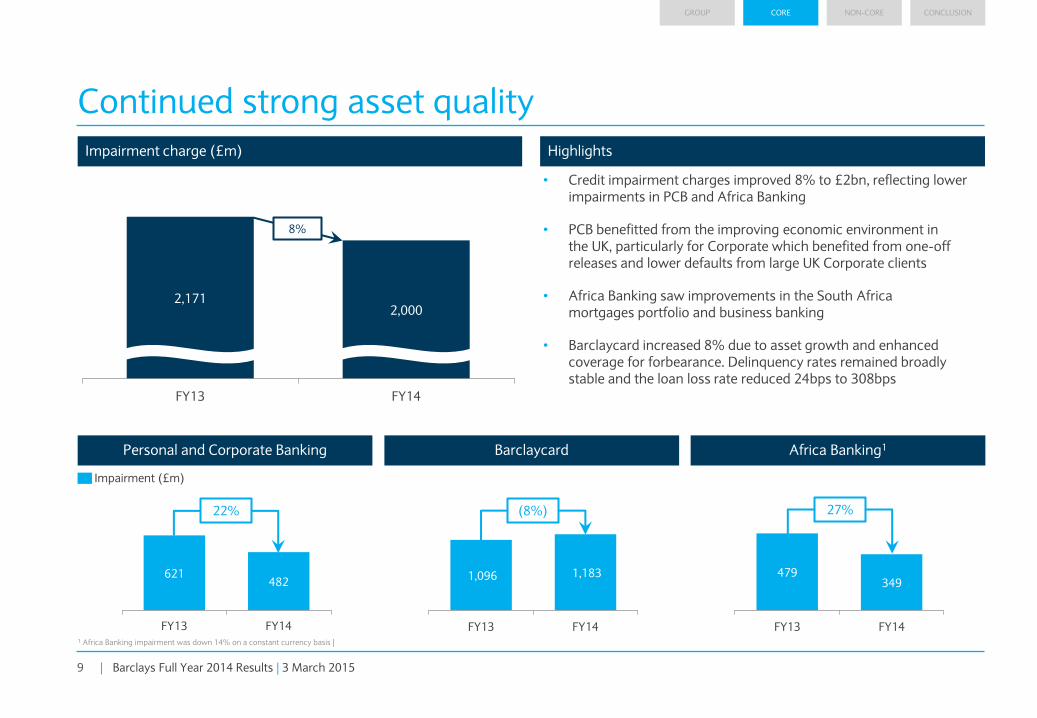
Impairment charge (£m)
Continued strong asset quality
GROUP CORE NON-CORE CONCLUSION
Highlights
621 482
FY13 FY14
1,096 1,183
FY13 FY14
479 349
FY13 FY14
Personal and Corporate Banking Barclaycard Africa Banking1
Impairment (£m)
1 Africa Banking impairment was down 14% on a constant currency basis |
22% (8%) 27%
• Credit impairment charges improved 8% to £2bn, reflecting lower impairments in PCB and Africa Banking
• PCB benefitted from the improving economic environment in the UK, particularly for Corporate which benefited from one-off releases and lower defaults from large UK Corporate clients
• Africa Banking saw improvements in the South Africa mortgages portfolio and business banking
• Barclaycard increased 8% due to asset growth and enhanced coverage for forbearance. Delinquency rates remained broadly stable and the loan loss rate reduced 24bps to 308bps
2,171 2,000
FY13 FY14
8%
FI Big Pack
Barclays Full Year 2014 Results | 3 March 2015

10 |
Year ended – December (£m) 2013 2014
Income 8,723 8,828
Impairment (621) (482)
Total operating expenses (5,910) (5,475)
– Costs to achieve Transform (384) (400)
Profit before tax 2,233 2,885
Financial performance measures
Average allocated equity £17.3bn £17.5bn
Return on average tangible equity 12.7% 15.8%
Return on average equity 9.7% 11.9%
Cost: income ratio1 68% 62%
Loan loss rate 28bps 21bps
Net interest margin 2.91% 3.00%
Dec-13 Dec-14
Loans and advances to customers £212.2bn £217.0bn
Customer deposits £295.9bn £299.2bn
CRD IV RWAs £118.3bn £120.2bn
Financial performance
• Total income increased 1% to £8.8bn due to balance growth and improved savings margins in Personal
• Net interest margin improved by 9bps to 300bps driven primarily by personal savings
• Credit impairment charges improved 22% due to the improving economic environment in the UK
− Corporate benefitted from one-off releases and lower defaults from large UK Corporate clients
• Costs fell 7% due to savings from Transform programme, including branch optimisation (net branch closure of 72) and increased automation from technology improvements
• Positive jaws contributed to an increased RoE of 11.9%, while RoTE improved to 15.8%
• Continue to lead the UK banking market in technology:
− 3.6 million customers of mobile banking
− 2.2 million customers of Pingit
− Payment volume through our Pingit app grew almost threefold in 2014
− The number of personal unsecured loans originating through digital channels increased by over 80% year-on-year, and this now accounts for c. 35% of all personal unsecured lending
• UK mortgage market stock share was 10.1%2
PCB: Profits up 29%
GROUP CORE NON-CORE CONCLUSION
1 2014 CIR excluding CTA was 57% | 2 Bank of England lending statistics (December 2014) |
Barclays Full Year 2014 Results | 3 March 2015
FI Big Pack

11 |
PCB: Positive jaws delivering reduction in cost: income ratio
1,376 1,378 1,318
1,388
1,298 1,256 1,232 1,219
Q1 13 Q2 13 Q3 13 Q4 13 Q1 14 Q2 14 Q3 14 Q4 14
Operating expenses (excluding CTA, BL) CTA Bank levy
65 63
59
64
60
57 55 55
Cost: income ratio (excluding CTA and bank levy)
GROUP CORE NON-CORE CONCLUSION
Barclays Full Year 2014 Results | 3 March 2015

12 |
Financial performance Financial performance
• Strong customer number and asset growth across all geographies
• Income increased 6%, reflecting growth in the UK consumer and merchant, Germany and US businesses, partially offset by depreciation of average USD against GBP
• NII increased 8% to £3bn driven by volume growth; NIM decreased to 8.75% from 8.99% due to a change in product mix and impact of promotional offers
• Impairment increased 8% due to asset growth and enhanced coverage for forbearance. Delinquency rates remained broadly stable and the loan loss rate reduced 24bps to 308bps
• Costs broadly flat despite continued investment in the business
• RoE increased to 16%
• Net L&A increased 16% reflecting growth across all geographies, including the impact of promotional offers and the acquisition of portfolios in the US
• 14% growth in customers and 9% increase in payments processed
Barclaycard: Profits up 13%
GROUP CORE NON-CORE CONCLUSION
Year ended – December (£m) 2013 2014
Income 4,103 4,356
Impairment (1,096) (1,183)
Total operating expenses (1,857) (1,874)
– Costs to achieve Transform (49) (118)
Profit before tax 1,183 1,339
Financial performance measures
Average allocated equity £5.3bn £5.9bn
Return on average tangible equity 19.9% 19.9%
Return on average equity 15.5% 16.0%
Cost: income ratio 45% 43%
Loan loss rate 332bps 308bps
Net interest margin 8.99% 8.75%
Dec-13 Dec-14
Loans and advances to customers £31.5bn £36.6bn
Customer deposits £5.1bn £7.3bn
CRD IV RWAs £35.7bn £39.9bn
Barclays Full Year 2014 Results | 3 March 2015
FI Big Pack

13 |
Financial performance
Constant currency basis
• PBT increased by 13%, driven by 7% income growth and a 14% reduction in credit impairment charges
− NII benefitted from increased NIM driven by higher deposit margins in RBB South Africa in addition to strong growth in Corporate and Investment Banking loans
• Impairment reduced 14% and the LLR improved by 35bps to 93bps driven by South Africa mortgages and business banking, partially offset by an increase in the card portfolio
• Costs were up 8% due to inflationary increases resulting in higher staff costs. There was also increased CTA and spend on other key initiatives
• RoE increased to 9.3% while RoTE was 12.9%
Africa Banking: Constant currency profits up 13%
GROUP CORE NON-CORE CONCLUSION
Year ended1 – December (£m) 2013 2013
Constant Currency
2014
Income 4,039 3,435 3,664
Impairment (479) (406) (349)
Total operating expenses (2,519) (2,163) (2,342)
– Costs to achieve Transform (26) (23) (51)
Profit before tax 1,049 873 984
Financial performance measures
Average allocated equity2 £4.4bn £3.9bn
Return on average tangible equity2 11.3% 12.9%
Return on average equity2 8.1% 9.3%
Cost: income ratio 62% 64%
Loan loss rate 128bps 93bps
Net interest margin 5.81% 5.95%
Dec-13 Dec-13
Constant Currency
Dec-14
Loans and advances to customers £34.9bn £33.6bn £35.2bn
Customer deposits £34.6bn £33.3bn £35.0bn
CRD IV RWAs £38.0bn £38.5bn
1 Africa Banking business unit performance based on BAGL results, including Egypt and Zimbabwe | 2 Barclays share of the statutory equity of the BAGL entity (together with that of the Barclays Egypt and Zimbabwe businesses which remain outside the BAGL corporate entity), as well as the Barclays‟ goodwill on acquisition of these businesses. The tangible equity for RoTE uses the same basis but excludes both the Barclays‟ goodwill on acquisition and the goodwill and intangibles held within the BAGL statutory equity |
Barclays Full Year 2014 Results | 3 March 2015
FI Big Pack

14 |
Year ended – December (£m) 2013 2014
– Banking 2,485 2,528
– Markets 6,134 5,040
– Other (23) 20
Income 8,596 7,588
Impairment release 22 14
Total operating expenses (6,598) (6,225)
– Costs to achieve Transform (190) (374)
Profit before tax 2,020 1,377
Financial performance measures
Average allocated equity £15.9bn £15.4bn
Return on average tangible equity 8.5% 2.8%
Return on average equity 8.2% 2.7%
Cost: income ratio 77% 82%
Dec-13 Dec-14
CRD IV RWAs £124.4bn £122.4bn
Q4 13 Q4 14 % Change
639 638 –
1,146 1,028 (10%)
(3) -
1,782 1,666 (7%)
Q4 14 vs. Q4 13
• Banking is in line with prior year at £638m. Decrease in Investment Banking fees was offset by an increase in Lending income
• Markets income decreased 10%
− Credit down 25% to £173m
− Equities up 2% to £431m
− Macro down 14% to £424m
FY14 vs. FY13
• Income decreased 12%
• Operating expenses decreased 6% reflecting a 9% reduction in compensation costs, as well as Transform savings
• FY14 highlights
− #2 in All International Bonds1
− Banking strength in dual home markets with #2 position in total UK fees and #6 in the US1
Investment Bank: New strategy underpinning Q4 performance
GROUP CORE NON-CORE CONCLUSION
Financial performance
1 Source: Dealogic |
Barclays Full Year 2014 Results | 3 March 2015
FI Big Pack

15 |
2,194 2,050
3,978
3,620
236
218
190
337
FY13 FY14
7% Other costs
6,225
Investment Bank – Compensation actions
• Headcount down by 2,100 net
• Incentive awards down 24%
• Role based pay introduced and charged in 2014
• Deferred bonus brought forward of £854m, but on downward trend
Investment Bank: Downward trend in compensation charge
GROUP CORE NON-CORE CONCLUSION
Investment Bank operating expenses (£m)
8% ex-
CTA
Role based pay
3,978
3,620 Down
c.£160m Deferred bonuses
brought forward
Other compensation
costs
6,598
CTA1 Bank levy
Compensation
Non-compensation2
Down
9%
1 Excludes compensation related CTA of £37m | 2 Excludes CTA and bank levy | 3 The actual amount charged depends upon whether conditions have been met and will vary compared with the above expectation |
Barclays Full Year 2014 Results | 3 March 2015
3,045 2,566
c.200
933
854 c.700
FY13 FY14 FY15E
3
1
FI Big Pack
16 |
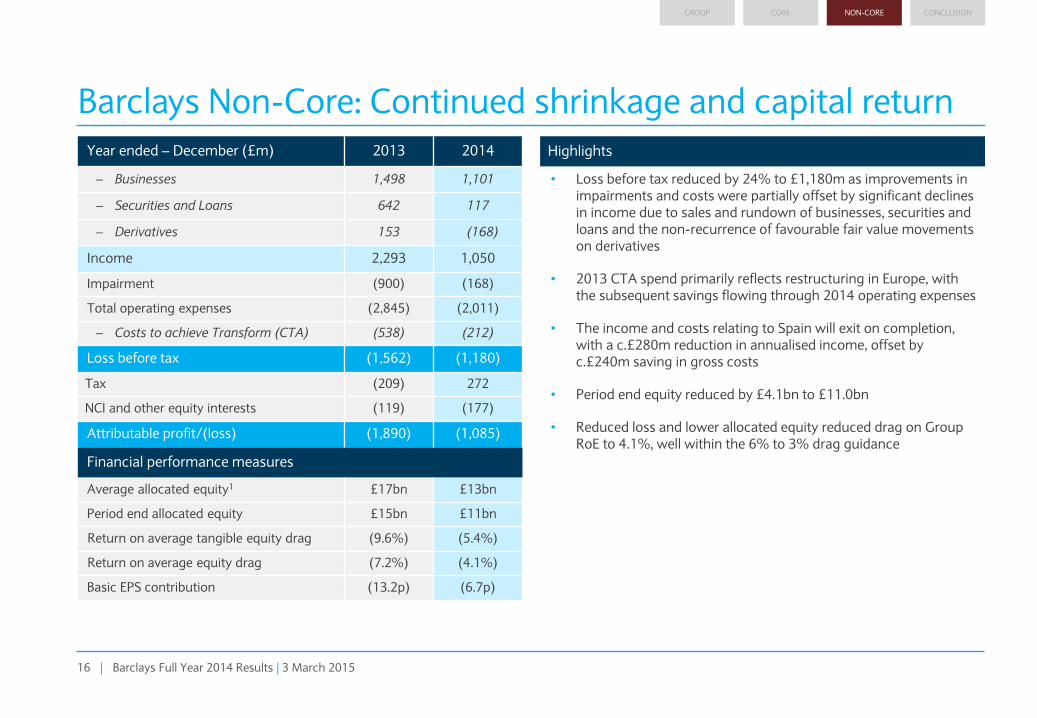
Year ended – December (£m) 2013 2014
– Businesses 1,498 1,101
– Securities and Loans 642 117
– Derivatives 153 (168)
Income 2,293 1,050
Impairment (900) (168)
Total operating expenses (2,845) (2,011)
– Costs to achieve Transform (CTA) (538) (212)
Loss before tax (1,562) (1,180)
Tax (209) 272
NCI and other equity interests (119) (177)
Attributable profit/(loss) (1,890) (1,085)
Financial performance measures
Average allocated equity1 £17bn £13bn
Period end allocated equity £15bn £11bn
Return on average tangible equity drag (9.6%) (5.4%)
Return on average equity drag (7.2%) (4.1%)
Basic EPS contribution (13.2p) (6.7p)
Highlights
• Loss before tax reduced by 24% to £1,180m as improvements in impairments and costs were partially offset by significant declines in income due to sales and rundown of businesses, securities and loans and the non-recurrence of favourable fair value movements on derivatives
• 2013 CTA spend primarily reflects restructuring in Europe, with the subsequent savings flowing through 2014 operating expenses
• The income and costs relating to Spain will exit on completion, with a c.£280m reduction in annualised income, offset by c.£240m saving in gross costs
• Period end equity reduced by £4.1bn to £11.0bn
• Reduced loss and lower allocated equity reduced drag on Group RoE to 4.1%, well within the 6% to 3% drag guidance
Barclays Non-Core: Continued shrinkage and capital return
GROUP CORE NON-CORE CONCLUSION
FI Big Pack
Barclays Full Year 2014 Results | 3 March 2015

17 |
529 481 464 456 419 441 321 329
Q1 13 Q2 13 Q3 13 Q4 13 Q1 14 Q2 14 Q3 14 Q4 14
911
564
368 450
373 285
22
Q1 13 Q2 13 Q3 13 Q4 13 Q1 14 Q2 14 Q3 14 Q4 14
Non-Core quarterly income (£m) Non-Core quarterly costs – excluding litigation, CTA and BL (£m)
Barclays Non-Core: Income and cost profile
RoE drag is expected to track between 6% and 3% between now and the 2016 target of <3%
GROUP CORE NON-CORE CONCLUSION
370
o/w UAE disposal £119m
Non-Core annual costs (£m)
2,293
1,050
FY13 FY14
1,930 1,510
FY13 FY14
CTA Bank levy Litigation and conduct
2,845
2,011
22%
38%
Split out
3 way
split of
income
Spain OpEx c.£240m p.a. run rate (excluding CTA)
Non-Core annual income (£m)
(54%)
Barclays Full Year 2014 Results | 3 March 2015
18 |
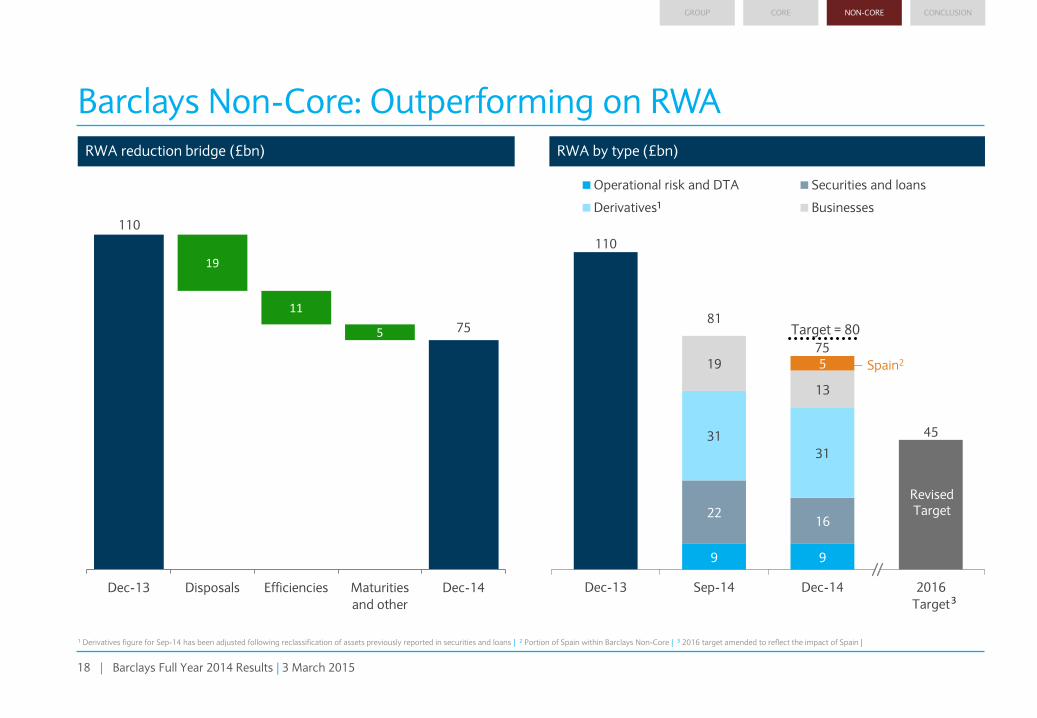
110
75
19
11
5
Dec-13 Disposals Efficiencies Maturities
and other
Dec-14
RWA reduction bridge (£bn) RWA by type (£bn)
Barclays Non-Core: Outperforming on RWA
GROUP CORE NON-CORE CONCLUSION
Spain2
1 Derivatives figure for Sep-14 has been adjusted following reclassification of assets previously reported in securities and loans | 2 Portion of Spain within Barclays Non-Core | 3 2016 target amended to reflect the impact of Spain |
1
3
110
45
9 9
22 16
31
31
19
13
5
Dec-13 Sep-14 Dec-14 2016
Target
Operational risk and DTA Securities and loans
Derivatives Businesses
Revised Target
75
81 Target = 80
FI Big Pack
Barclays Full Year 2014 Results | 3 March 2015

19 |
Operating expenses significantly reduced
GROUP CORE NON-CORE CONCLUSION
Operating expenses progress – excluding CTA (£bn)
• Transform saves:
− FTE reductions from Investment Bank front office restructuring, branch network transformation in UK and Africa and restructuring of the European business
− Optimisation of IT platforms, consolidation of middle office functions in the Investment Bank and process improvements
• Reduction of performance costs mainly in the Investment Bank and PCB
• Favourable currency moves from a cost perspective in Africa Banking, the Investment Bank and Barclaycard
The Transform programme contributed c. £1.1bn of year-on-year cost reductions and c9,800 of FTE exits across the following major categories of activity:
• FTE reductions was the biggest single contributor(c. £700m), and included:
• Restructuring of the Investment Bank Front Office – FTE c1,000 (2014 saves £0.3bn)
• Transformation of the branch network in the UK and Africa – FTE UK 2,900 (2014 saves £60m) and Africa 1,300 (2014 saves £36m)
• Restructuring of the European business
• Industrialisation (includes automation, simplification and rationalisation of processes and systems) and other innovation contributed c. 25% of saves (c. £300m) and included:
• Optimisation of the IT estate across the Bank (platform and application decommissioning, standardisation, network optimisation) and initiatives to consolidate 3rd party spend
• Consolidation of middle office functions in the Investment Bank
• Simplification of front office risk and analytics across the IB FICC business
• Business exits (c. £80m) mainly in Corporate, Wealth and the Investment Bank (including exit of the European corporate business and the UAE retail business – (background only, assume not disclosed externally)
• Building exits (c. 30m), mainly in the Investment Bank
Reduction of performance costs mainly in the Investment Bank and PCB
Favourable currency moves from a cost perspective in Africa Banking and the Investment Bank
Increased Legal fees associated with Conduct & Litigation settlements.
Other; primarily contributable to business growth across Africa and Barclaycard.
18.7
16.9
16.3
0.6
0.5
0.5
0.2 0.1
FY13 Investment
Bank
PCB Non-Core Africa
Banking
Barclaycard Head
Office
FY14 FY15
guidance
Highlights
FI Big Pack
Barclays Full Year 2014 Results | 3 March 2015

20 |
Financial highlights
Core business performed well with PBT of £6.7bn and RoE of 9.2% (10.9% ex-CTA)
Costs excluding CTA £16.9bn, ahead of £17bn guidance
Strong progress on shrinking Non-Core and releasing capital
Building capital: CET1 ratio 10.5% and BCBS leverage ratio 3.8%1
Increased adjusted pre-tax profits by 12% – Core up 3%, Non-Core losses down 24%
Barclays Full Year 2014 Results | 3 March 2015
1 Including Spain disposal |
FI Big Pack
GROUP CORE NON-CORE CONCLUSION

21 |
Antony Jenkins Barclays Group Chief Executive

22 |
The Barclays Balanced Scorecard Metric Actual 2013 Actual 2014 Target 2018
Customer & Client
PCB, Barclaycard and Africa Banking weighted average ranking of Relationship Net Promoters Score® (NPS) vs. peer sets
3rd1 4th 1st
Client Franchise Rank: Weighted average ranking of wallet share or customer satisfaction with priority clients in the Investment Bank
N/A 5th Top 3
Colleague
Sustained engagement of colleagues score 74% 72% 87-91%
% women in senior leadership 21% 22% 26%
Citizenship
Citizenship Plan – initiatives on track or ahead 10/11 11/11 Plan targets
Conduct
Conduct Reputation (YouGov survey) 5.2/10 5.3/10 6.5/10
Company
Adjusted Return on Equity 4.1%2 5.1% >Cost of equity
Fully loaded CRD IV CET1 ratio 9.1%3 10.3% > 11%4
1 Revised due to creation of PCB as part of the May 2014 Strategy Update. Corporate clients now contribute to the NPS metric, and no longer contribute to the Client Franchise Rank | 2 Revised from 4.5%, post the Q2 13 £259m gain relating to assets not yet received from the UK Lehman acquisition being treated as an adjusting item | 3 Revised from 9.3% post full implementation for CRD IV reporting in 2014 | 4 Revised from >10.5% following the May 2014 Strategy Update | NOTES: Net Promoter, Net Promoter Score, and NPS are trademarks of Satmetrix Systems, Inc., Bain & Company, Inc., and Fred Reichheld | See Balanced Scorecard Methodology and Data Sources for further information on http://group.barclays.com/about-barclays/about-us/transform/balanced-scorecard/metrics-targets |
GROUP CORE NON-CORE CONCLUSION
Barclays Full Year 2014 Results | 3 March 2015

23 |
Financial highlights
Core business performed well with PBT of £6.7bn and RoE of 9.2% (10.9% ex-CTA)
Costs excluding CTA £16.9bn, ahead of £17bn guidance
Strong progress on shrinking Non-Core and releasing capital
Building capital: CET1 ratio 10.5% and BCBS leverage ratio 3.8%1
Increased adjusted pre-tax profits by 12% – Core up 3%, Non-Core losses down 24%
Barclays Full Year 2014 Results | 3 March 2015
1 Including Spain disposal |
GROUP CORE NON-CORE CONCLUSION

24 |
Barclays PLC 2014 Full Year Results 3 March 2015

25 |
Legal Disclaimer Important Notice
The information, statements and opinions contained in this document do not constitute a public offer under any applicable legislation or an offer to sell or solicitation of any offer to buy any securities or financial instruments or any advice or recommendation with respect to such securities or other financial instruments.
Forward-looking Statements
This document contains certain forward-looking statements within the meaning of Section 21E of the US Securities Exchange Act of 1934, as amended, and Section 27A of the US Securities Act of 1933, as amended, with respect to certain of the Group‟s plans and its current goals and expectations relating to its future financial condition and performance. Barclays cautions readers that no forward-looking statement is a guarantee of future performance and that actual results could differ materially from those contained in the forward-looking statements. These forward-looking statements can be identified by the fact that they do not relate only to historical or current facts. Forward-looking statements sometimes use words such as „may‟, „will‟, „seek‟, „continue‟, „aim‟, „anticipate‟, „target‟, „projected‟, „expect‟, „estimate‟, „intend‟, „plan‟, „goal‟, „believe‟, „achieve‟ or other words of similar meaning. Examples of forward-looking statements include, among others, statements regarding the Group‟s future financial position, income growth, assets, impairment charges and provisions, business strategy, capital, leverage and other regulatory ratios, payment of dividends (including dividend pay-out ratios), projected levels of growth in the banking and financial markets, projected costs or savings, original and revised commitments and targets in connection with the Transform Programme and Group Strategy Update, run-down of assets and businesses within Barclays Non-Core, estimates of capital expenditures and plans and objectives for future operations, projected employee numbers and other statements that are not historical fact. By their nature, forward-looking statements involve risk and uncertainty because they relate to future events and circumstances. These may be affected by changes in legislation, the development of standards and interpretations under International Financial Reporting Standards (IFRS), evolving practices with regard to the interpretation and application of accounting and regulatory standards, the outcome of current and future legal proceedings and regulatory investigations, future levels of conduct provisions, the policies and actions of governmental and regulatory authorities, geopolitical risks and the impact of competition. In addition, factors including (but not limited to) the following may have an effect: capital, leverage and other regulatory rules (including with regard to the future structure of the Group) applicable to past, current and future periods; UK, US, Africa, Eurozone and global macroeconomic and business conditions; the effects of continued volatility in credit markets; market related risks such as changes in interest rates and foreign exchange rates; effects of changes in valuation of credit market exposures; changes in valuation of issued securities; volatility in capital markets; changes in credit ratings of the Group; the potential for one or more countries exiting the Eurozone; the impact of EU and US sanctions on Russia; the implementation of the Transform Programme; and the success of future acquisitions, disposals and other strategic transactions. A number of these influences and factors are beyond the Group‟s control. As a result, the Group‟s actual future results, dividend payments, and capital and leverage ratios may differ materially from the plans, goals, and expectations set forth in the Group‟s forward-looking statements. Additional risks and factors are identified in our filings with the SEC, including our Annual Report on Form 20-F for the fiscal year ended 31 December 2014 (“2014 20-F”), which are available on the SEC‟s website at http://www.sec.gov.
Any forward-looking statements made herein speak only as of the date they are made and it should not be assumed that they have been revised or updated in the light of new information or future events. Except as required by the Prudential Regulation Authority, the Financial Conduct Authority, the London Stock Exchange plc (the LSE) or applicable law, Barclays expressly disclaims any obligation or undertaking to release publicly any updates or revisions to any forward-looking statements contained herein to reflect any change in Barclays‟ expectations with regard thereto or any change in events, conditions or circumstances on which any such statement is based. The reader should, however, consult any additional disclosures that Barclays has made or may make in documents it has published or may publish via the Regulatory News Service of the LSE and/or has filed or may file with the SEC, including the 2014 20-F.
Barclays Full Year 2014 Results | 3 March 2015

26 |
Appendix

27 |
Simpler, focused and balanced structure
Barclays Non-Core
(BNC)
LBT £1,180m
RWAs £75.3bn
Barclaycard
PBT £1,339m
RWAs £39.9bn
Personal and Corporate Banking
PBT £2,885m
RWAs £120.2bn
Africa Banking
PBT £984m
RWAs £38.5bn
Investment Bank
PBT £1,377m
RWAs £122.4bn
Barclays Group
Adjusted results1
Income £24.7bn Risk weighted assets (RWA) £327bn
Impairment (£2.0bn) Average allocated equity £42bn
Operating expenses (£16.1bn) Return on average equity (RoE) 9.2%
Profit before tax £6.7bn Return on tangible equity (RoTE) 11.3%
RoE drag (4.1%)
1 Includes Head Office as part of Core, representing £5.6bn RWAs and £97m profit before tax |
All figures for year ended December 2014
FI Big Pack
Barclays Full Year 2014 Results | 3 March 2015

28 |
Retail and Corporate performance Profit before tax of Core business: FY141
Retail and Corporate
Profit before tax of Core business: FY131
Investment Bank
Barclaycard
Personal and Corporate Banking
Africa Banking
Investment Bank
Barclaycard
Personal and Corporate Banking
Africa Banking
2,233
1,183 1,049
2,020
2,885
1,339
984
1,377
1 Excluding Head Office | 2 Includes Head Office | 3 Costs exclude CTA and bank levy |
Year ended – December (£m)2 2013 2014
Income 17,007 17,090
Adjusted profit before tax 4,450 5,305
Cost: Income ratio3 58% 53%
+19%
PBT
CIR = 53%
69%
79%
Retail and Corporate
FI Big Pack
Barclays Full Year 2014 Results | 3 March 2015

29 |
Diverse and balanced business mix
Year ended – December (£m) Income Profit before tax
2013 2014 2013 2014
Personal and Corporate Banking 8,723 8,828 2,233 2,885
Barclaycard 4,103 4,356 1,183 1,339
Africa Banking 4,039 3,664 1,049 984
Investment Bank 8,596 7,588 2,020 1,377
Head Office 142 242 (15) 97
Total Core 25,603 24,678 6,470 6,682
Barclays Non-Core 2,293 1,050 (1,562) (1,180)
Group1 27,896 25,728 4,908 5,502
1 Group presented on an adjusted basis |
Barclays Full Year 2014 Results | 3 March 2015

30 |
4.8%
(9.6%)
14.4%
2.8%
8.5%
11.3%
19.9%
12.7%
4.1%
(7.2%)
11.3%
1.6%
8.2%
8.1%
15.5%
9.7%
Adjusted return on average equity (RoE)
RoE and RoTE – Year ended – December 2014 RoE and RoTE – Year ended – December 2013
Personal and Corporate Banking
Investment Bank
Africa Banking
Barclaycard
Head Office impact1
Barclays Non-Core drag1
Group
Core
5.9%
(5.4%)
11.3%
0.5%
2.8%
12.9%
19.9%
15.8%
5.1%
(4.1%)
9.2%
0.3%
2.7%
9.3%
16.0%
11.9%
1 Head Office impact represents the impact of the Head Office on Core results. Non-Core impact represents the impact of the Non-Core on Group results |
RoTE
RoE
Barclays Full Year 2014 Results | 3 March 2015
31 |
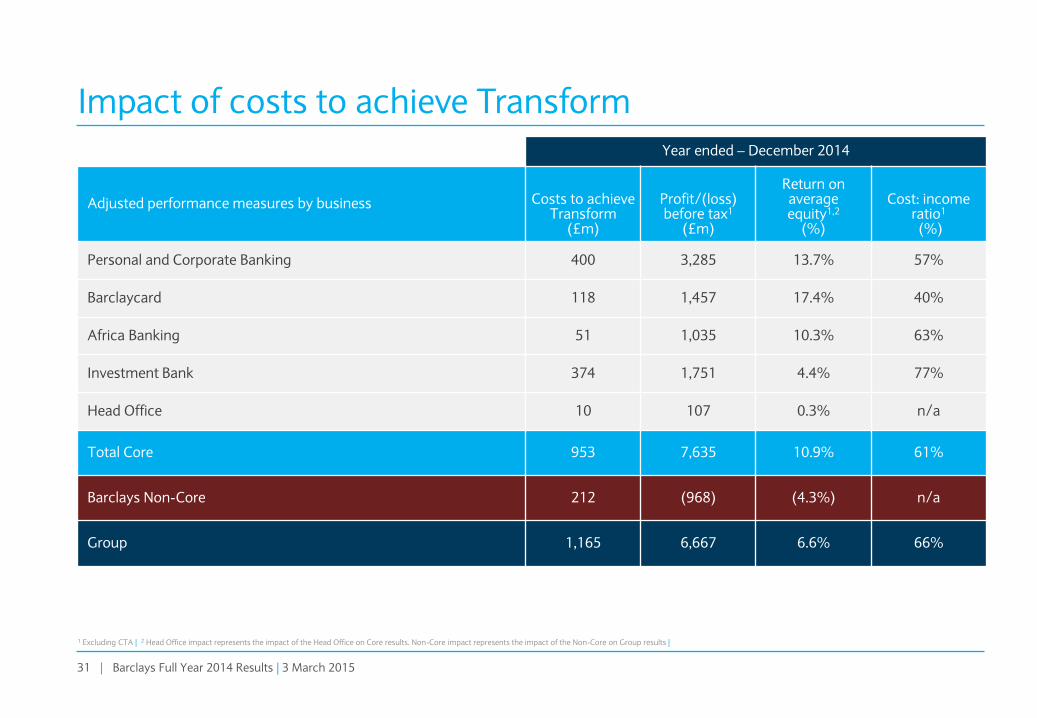
Impact of costs to achieve Transform Year ended – December 2014
Adjusted performance measures by business Costs to achieve Transform
(£m)
Profit/(loss) before tax1
(£m)
Return on average equity1,2
(%)
Cost: income ratio1 (%)
Personal and Corporate Banking 400 3,285 13.7% 57%
Barclaycard 118 1,457 17.4% 40%
Africa Banking 51 1,035 10.3% 63%
Investment Bank 374 1,751 4.4% 77%
Head Office 10 107 0.3% n/a
Total Core 953 7,635 10.9% 61%
Barclays Non-Core 212 (968) (4.3%) n/a
Group 1,165 6,667 6.6% 66%
1 Excluding CTA | 2 Head Office impact represents the impact of the Head Office on Core results. Non-Core impact represents the impact of the Non-Core on Group results |
Barclays Full Year 2014 Results | 3 March 2015

32 |
Net interest margins and balances1
Year ended – December 2013 Year ended – December 2014
Net interest income
(£m)
Average customer
assets (£m)
Net interest margin
(%)
Net interest income
(£m)
Average customer
assets (£m)
Net interest margin
(%)
Personal and Corporate Banking 5,893 202,497 2.91 6,298 210,026 3.00
Barclaycard 2,829 31,459 8.99 3,044 34,776 8.75
Africa Banking 2,245 38,640 5.81 2,093 35,153 5.95
Total Personal and Corporate Banking, Barclaycard and Africa Banking
10,967 272,596 4.02 11,435 279,955 4.08
Group 11,600 12,080
1 Margins are calculated as net interest income over average customer assets |
Barclays Full Year 2014 Results | 3 March 2015

33 |
Banking (£m)
Markets (£m)
Investment Bank: Quarterly progression
Q4 on Q4 change in income (£m)
Credit
231 Credit
173
Equities
421 Equities
431
Macro
494 Macro
424
Lending 68 Lending
111
Inv.
Banking
571 Inv.
Banking
527
Q4 13 Q4 14
Banking
£638m
Markets £1,028m
Q4 12 Q1 13 Q2 13 Q3 13 Q4 13 Q1 14 Q2 14 Q3 14 Q4 14
Credit Equities Macro
Q4 12 Q1 13 Q2 13 Q3 13 Q4 13 Q1 14 Q2 14 Q3 14 Q4 14
Lending Investment Banking fees
547 638 663 649 629
568 639 616
727
1,276
2,021
1,678
1,289 1,146
1,489 1,403
1,120
(0.2%)
(10%)
Barclays Full Year 2014 Results | 3 March 2015
1,028

34 |
287
285
7
4
2 5
5
2
3
30-Sep-14 Cash flow
hedging
reserve
Currency
translation
reserve
Adjusted
profit
Provisions
relating
to FX
ESHLA
valuation
revision
Other
adjusting
items
Other 31-Dec-14
Tangible net asset value (pence per share) Highlights
• TNAV decreased 2p over the past three months to 285p
• £1.2bn increase in the cash flow hedging reserve due to a decrease in the forward interest rate curve which resulted in mark to market gains
• The strengthening of USD against GBP led to a £0.7bn increase in the currency translation reserve and a 4p improvement in TNAV per share
• Adjusting items reduced TNAV per share by 12p, mainly driven by the FX provision and ESHLA valuation revision
• Dividend paid in the quarter reduced TNAV per share by 1p
TNAV
Barclays Full Year 2014 Results | 3 March 2015
1 Includes dividend |
1
35 |
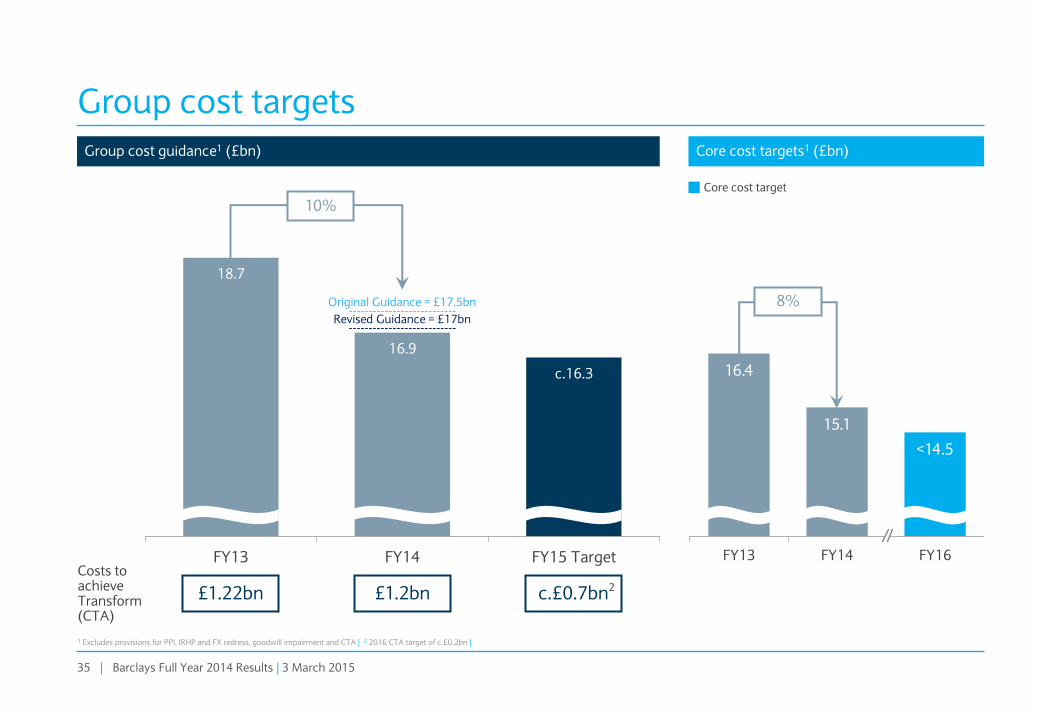
18.7
16.9
c.16.3
FY13 FY14 FY15 Target
Group cost targets
Group cost guidance1 (£bn) Core cost targets1 (£bn)
1 Excludes provisions for PPI, IRHP and FX redress, goodwill impairment and CTA | 2 2016 CTA target of c.£0.2bn |
16.4
15.1
<14.5
FY13 FY14 FY16Costs to achieve Transform (CTA)
£1.2bn c.£0.7bn £1.22bn
Revised Guidance = £17bn
Original Guidance = £17.5bn
10% Core cost target
2
FI Big Pack
Barclays Full Year 2014 Results | 3 March 2015
8%

36 |
Core operating expenses (£bn)
Core operating costs
Highlights
5.46 5.00
FY13 FY14
1.79 1.73
FY13 FY14
2.45 2.25
FY13 FY14
6.17 5.63
FY13 FY14
Personal and Corporate Banking Barclaycard Africa Banking1 Investment Bank
Operating costs (excluding CTA and bank levy) (£bn)
1 Africa Banking operating expenses were up 7% on a constant currency basis, due to local inflationary pressures and investment |
8%
• Core costs (excluding CTA) decreased by 8% year-on-year driven by Transform saves as well as currency movements
• Transform initiatives delivered significant and sustainable cost reductions across all businesses driven by restructuring, industrialisation and automation
• Saving were partially offset by increased costs of litigation and conduct charges and associated legal fees
• Net headcount reduced by 6,200 (5%) driven by voluntary redundancies through branch rationalisation and front office restructuring in the Investment Bank which was partially offset by in-sourcing in Barclaycard
• CTA increased by £300m year-on-year primarily reflecting further restructuring in the Investment Bank
10.4 9.6
6.0 5.5
0.7 1.0
FY13 FY14
Staff costs Other operating costs Costs to achieve Transform
17.0 16.1
8% excl. CTA
3% 8% 9%
Barclays Full Year 2014 Results | 3 March 2015
FI Big Pack

37 |
9.1% 10.2% 10.3%
>11%
Dec-13 Sep-14 Dec-14 2016
Target
Fully loaded (FL) CRD IV CET1 ratio progression1 RWA reduction (£bn)
442 413
402 c.400
Dec-13 Sep-13 Dec-14 2016
Guidance
Good progress on CET1 ratio towards 2016 Transform target
• FL CRD IV CET1 ratio up 120bps, or c.140bps if including the sale of the Spanish businesses, demonstrating good progress towards 2016 Transform target of greater than 11%
• Continued capital build as FL CRDIV CET1 capital grew by £1.1bn to £41.5bn, after absorbing £3.3bn of adjusting items
• Confident that our planned trajectory positions us well to meet future regulatory requirements
• RWAs reduced by £41bn, or £46bn including the sale of the Spanish businesses, reflecting excellent progress on the run-down of Non-Core to £75bn
• Increases due to model updates largely offset by methodology and policy driven decreases
Spain c.16bps2
+120bps
40 42 41 CET1 Capital
(9%)
o/w Spain
(£5bn)2
1 Based on Barclays interpretation of the final CRD IV text and latest EBA technical standards. Following the full implementation of CRD IV reporting in 2014, the previously reported 31 December 2013 RWAs were revised by £6.9bn to £442bn and fully loaded CET1 ratio by (0.2%) to 9.1% | 2 As announced on 2 January 2015 |
FY 2014 Fixed Income Call Slides FINAL (Slide 6)
FI Big Pack
Barclays Full Year 2014 Results | 3 March 2015

38 |
4.0% 4.5%
1.6%
4.5%
2014 2019
Mgmt. buffer ≤1.5%
Progressive implementation of CET1 requirements
Regulatory targets, excluding internal buffer Key assumptions in this illustration
• CET1 minimum requirements per PRA implementation of Capital Requirements Regulation (CRR)
• Pillar 2A met with CET1 capital for 2014 is 1.6% of RWAs; subject to at least annual review2, we hold it constant in 2019 for illustration purposes
• Combined buffer requirement (and associated rules for mandatory distribution restrictions), consisting of 2.5% capital conservation buffer and 2% G-SII buffer, transitions in from 1 January 2016 at 25% per annum
• In 2019, we have assumed that the PRA buffer will be less than 4.5% combined buffer requirement; however, this may not be the case
• Countercyclical (CCCB), other systemic and sectoral buffers are currently assumed to be zero3
• Internal management buffer, currently 1.5%, will be recalibrated over time and may be less than 1.5% by 2019
10.3% as at 31-Dec-2014
CRD IV minimum CET1 requirement
Pillar 2A met with CET1 capital (varies annually)
Fully loaded combined buffer requirement, excluding CCCB
Barclays fully loaded CRD IV CET1 ratio progression
7%
10.6%
Estimated 11.5-12%
PRA regulatory minimum1
1 Being the higher of 7% PRA expectation and CRD IV capital requirements | 2 Held constant for illustration | 3 These buffers could be applied at the Group level, or at a legal entity, sub-consolidated or portfolio level |
2 2
Barclays Full Year 2014 Results | 3 March 2015

39 |
3.0% 3.4%
3.7% >4%
Dec-13 Jun-14 Dec-14 2016Target
Leverage ratio progression1 Leverage exposure reduction (£trn)1
1.36 1.35 1.32 1.23
Dec-13 Jun-14 Sep-14 Dec-14
Leverage ratio progression ahead of plan
• Leverage ratio up significantly to 3.7%, or 3.8% if reflecting the sale of the Spanish businesses2, well on track to meet 2016 Transform target of in excess of 4%
• Improvement over the year driven by T1 capital growth, including £2.3bn of AT1 issuance, and leverage exposure reduction
• Leverage ratio already in line with expected minimum end-state requirement of 3.7% as outlined by the Financial Policy Committee
• Significant reduction in leverage exposure, driven principally by reductions in Non-Core and in the Core Investment Bank
• Leverage exposure decreased by £91bn in Q4 2014 driven mainly by a £35bn reduction in SFT exposure, £16bn reduction in PFE, and a seasonal £28bn reduction in settlement balances
+30bps
41 45 46 T1 Capital
1
(9%)
BCBS 270 impact
1 Dec-13 not comparable to the estimates as of Jun-14 onwards due to different basis of preparation. Dec-13 estimated ratio and T1 capital based on PRA leverage ratio calculated as fully loaded CRD IV T1 capital adjusted for certain PRA defined deductions, and a PRA adjusted leverage exposure measure. From Jun-14 onwards, estimated ratios based on current understanding of the BCBS 270 standards and the requirements contained in the European Commission delegated act. | 2 As announced on 2 January 2015
FY 2014 Fixed Income Call Slides FINAL (Slide 7)
FI Big Pack
Barclays Full Year 2014 Results | 3 March 2015

40 |
732 743 690
288 279 271
228 192 157
105 110 115
Jun-14 Sep-14 Dec-14
3.4% 3.5% 3.7%
BCBS leverage exposure1 (£bn) Highlights
• Leverage exposures during Q4 14 decreased by £91bn to £1,233bn
• Loans and advances and other assets decreased by £52bn to £713bn primarily due to a seasonal reduction in settlement balances of £28bn and a £13bn reduction in cash balances
• SFTs decreased £35bn to £157bn driven by a £26bn reduction in IFRS reverse repurchase agreements and £9bn in SFT adjustments, reflecting deleveraging in BNC and a seasonal reduction in trading volumes
• Total derivative exposures decreased £8bn due to a £16bn reduction in the potential future exposure (PFE), partially offset by an increase in IFRS derivatives and cash collateral
− PFE on derivatives decreased £16bn to £179bn mainly due to reductions in business activity and optimisations, including trade compressions and tear-ups. This was partially offset by an increase relating to sold options driven by a change to the basis of calculation
− Other derivatives exposures (excluding PFE) increased £8bn to £92bn driven by an increase in IFRS derivatives of £57bn to £440bn and cash collateral £13bn to £73bn. This was broadly offset by increases in allowable derivatives netting
Steady progression on leverage ratio
1,353 1,324
L&A and other assets2
SFTs Undrawn commitments
Derivatives
BCBS leverage ratio1
1 Current understanding of the BCBS 270 standards and the requirements contained in the European Commission delegated act | 2 Loans and advances and other assets net of regulatory deductions and other adjustments |
1,233
FI Big Pack
Barclays Full Year 2014 Results | 3 March 2015

41 |
• Proactive transition towards a HoldCo funding and capital model positions us well to meet potential future TLAC requirements
• While requirements remain to be set, Barclays current expectation is a multi-year conformance period
• Good portion of OpCo term senior unsecured debt maturing before 2019 which can be refinanced from HoldCo
• Based on Barclays current interpretation of TLAC requirements, proxy TLAC ratio at 24%4 on the assumption that Barclays Bank PLC term non-structured senior unsecured debt is refinanced from HoldCo and subordinated to OpCo excluded liabilities
• Currently do not intend to use HoldCo senior unsecured debt proceeds to subscribe for OpCo liabilities on a subordinated basis until required to do so
• The future TLAC-ratio will further benefit from CET1 capital growth and AT1 issuance towards end-state expectations
• As TLAC rules are finalised and as we approach implementation date, we will assess the appropriate composition and quantum of our future TLAC stack
Proxy Total Loss Absorbing Capacity (TLAC)1
(£bn) Dec-14
PRA transitional Common Equity Tier 1 capital 41
PRA transitional Additional Tier 1 regulatory capital 11
Barclays PLC (HoldCo) 4
Barclays Bank PLC (OpCo) 7
PRA transitional Tier 2 regulatory capital 14
Barclays PLC (HoldCo) 1
Barclays Bank PLC (OpCo) 13
PRA transitional total regulatory capital 66
HoldCo term non-structured senior unsecured debt2 2
OpCo term non-structured senior unsecured debt3 29
Total term non-structured senior unsecured debt 97
CRD IV RWAs 402
BCBS leverage exposure 1,233
Proxy risk-weighted TLAC ratio ~ 24%
Proxy leverage based TLAC ratio ~ 8%
1 For illustrative purposes only reflecting Barclays interpretation of the FSB Consultative Document on “Adequacy of loss-absorbing capacity of global systemically important banks in resolution”, including certain assumptions on the inclusion or exclusion of certain liabilities where further regulatory guidance is necessary. Evolving regulation, including the implementation of MREL beginning 1 Jan 2016 and any subsequent regulatory policy interpretations, may require a change to the current approach | 2 Barclays PLC issued senior unsecured term debt assumed to qualify for consolidated TLAC purposes I 3 Comprise all outstanding Barclays Bank PLC issued public and private term senior unsecured debt, regardless of residual maturity. This excludes £35bn of notes issued under the structured notes programmes | 4 Including the 4.5% combined buffer requirement which needs to be met in CET1. The combined buffer requirement comprises a 2% G-SII buffer and 2.5% capital conservation buffer a fully phased in basis.
Barclays Full Year 2014 Results | 3 March 2015

42 |
Barclays'
'target' end-state
capital structure
Barclays FY 14
capital structure
(PRA Transitional)
10.2%1 (£40.9bn)
CET1
1.1% (£4.3bn) AT1
Continued progress on the transition towards our „target‟ end-state capital structure
Evolution of capital structure Fully loaded CRD IV capital position
• Fully loaded CRD IV CET1 ratio at 10.3% (10.2% on PRA transitional basis) on track to meet our target of > 11% in 2016. The ratio was well in excess of the 7% PRA regulatory target2
• Robust buffers to contingent capital triggers3
− AT1 contingent capital: c.330bps or £13.3bn
− T2 contingent capital: c.530bps or £21.5bn4
• As we build CET1 capital over the transitional period, we expect to reach a range of 11.5-12% in end-state reflecting our intention to hold an internal management buffer of up to 150bps over future minimum requirements5
• Transitional total capital ratio increased to 16.5% (2013: 15.0%), and fully loaded total capital ratio increased to 15.4% (2013: 13.9%)
• Further clarity required on Total Loss Absorbing Capacity (TLAC) quantum and composition. In the interim, we continue to build towards our „target‟ end-state capital structure which assumes at least 17% of total capital; final requirements subject to PRA discretion
• Barclays 2015 Pillar 2A requirement as per the PRA‟s Individual Capital Guidance (ICG) is 2.8%. The ICG is subject to at least annual review
− CET1 of 1.6% (assuming 56%)
− AT1 of 0.5% (assuming 19%)
− T2 of 0.7% (assuming 25%)
• The PRA consultation on the Pillar 2 framework (CP1/15), and Basel Committee consultations and reviews of approaches to Pillar 1 and Pillar 2 risk might further impact the Pillar 2A requirement in the future
1.8% (£7.4bn) Legacy T1
3.5% (£14.3bn)
T2
≥17% Total capital ratio
CCCB/ Sectoral buffers
16.5% Total capital ratio
1.6% P2A
Pillar 2A requirement6
4.5% CET1
1.7% (£6.9bn) Legacy T1
1 Difference to fully loaded ratio of 10.3% arises from a regulatory adjustment relating to unrealised gains | 2 Being the higher of 7% PRA expectation and CRD IV capital requirements | 3 CRD IV rules on mandatory distribution restrictions apply from 1 January 2016 onwards based on transitional CET1 requirements | 4 Based on the CRD IV CET1 transitional (FSA October 2012 statement) the ratio was 12.3% as at 31 December 2014 | 5 Barclays current regulatory target is to meet a FL CRD IV CET1 ratio of 9% by 2019, plus a Pillar 2A add-on. Pillar 2A requirements for 2015 held constant out to end-state for illustrative purposes. The PRA buffer is assumed to be below the combined buffer requirement of 4.5% in end-state albeit this might not be the case. CCCB, other systemic and sectoral buffer assumed to be zero | 6 Point in time assessment made at least annually, by the PRA, to reflect idiosyncratic risks not fully captured under Pillar 1 |
2.5% Capital
Conservation buffer
Max 1.5% Internal buffer
2.0% AT1 (incl. P2A)
2.9% T2 (incl. P2A)
2.0% G-SII
FY 2014 Fixed Income Call Slides FINAL (Slide 8)
FI Big Pack
Barclays Full Year 2014 Results | 3 March 2015
43 |
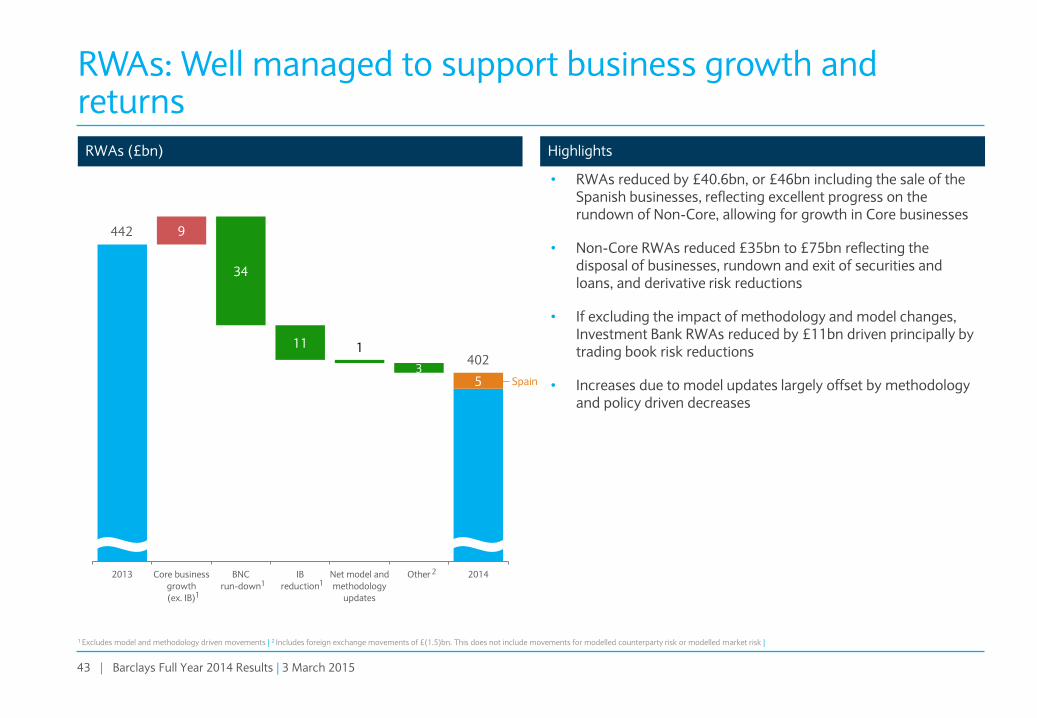
RWAs (£bn) Highlights
• RWAs reduced by £40.6bn, or £46bn including the sale of the Spanish businesses, reflecting excellent progress on the rundown of Non-Core, allowing for growth in Core businesses
• Non-Core RWAs reduced £35bn to £75bn reflecting the disposal of businesses, rundown and exit of securities and loans, and derivative risk reductions
• If excluding the impact of methodology and model changes, Investment Bank RWAs reduced by £11bn driven principally by trading book risk reductions
• Increases due to model updates largely offset by methodology and policy driven decreases
RWAs: Well managed to support business growth and returns
1 Excludes model and methodology driven movements | 2 Includes foreign exchange movements of £(1.5)bn. This does not include movements for modelled counterparty risk or modelled market risk |
9
5
34
11 1
3
2013 Core business
growth
(ex. IB)
BNC
run-down
IB
reduction
Net model and
methodology
updates
Other 2014
1
402
1
Spain
1
1
442
2
FI Big Pack
Barclays Full Year 2014 Results | 3 March 2015

44 |
Capital resources1
1 The Capital Requirements Regulation and Capital Requirements Directive implemented Basel 3 within the EU (collectively known as CRD IV) on 1 January 2014. The rules are supplemented by Regulatory Technical Standards and the PRA‟s rulebook, including the implementation of transitional rules | 2 The CRD IV CET1 ratio (FSA October 2012 transitional statement) as applicable to Barclays‟ Tier 2 Contingent Capital Notes was 12.3% based on £49.6bn of transitional CRD IV CET1 capital and £402bn RWAs |
Barclays Full Year 2014 Results | 3 March 2015
(£m) 30 September 2014 31 December 2014
Shareholders' equity (excluding non controlling interests) per the balance sheet 59,571 59,567
Less: other equity instruments (recognised as AT1 capital) (4,317) (4,322)
Adjustment to retained earnings for foreseeable dividends (787) (615)
Minority interests (amount allowed in consolidated CET1) 1,182 1,227
Other regulatory
adjustments and
deductions
Additional value adjustments (PVA) (2,641) (2,199)
Goodwill and intangible assets (7,953) (8,127)
Deferred tax assets that rely on future profitability excluding temporary differences (945) (1,080)
Fair value reserves related to gains or losses on cash flow hedges (617) (1,814)
Negative amounts resulting from the calculation of expected loss amounts (1,914) (1,772)
Gains or losses on liabilities at fair value resulting from own credit 581 658
Other regulatory adjustments (88) (45)
Direct and indirect holdings by an institution of own CET1 instruments (27) (25)
Fully loaded Common Equity Tier 1 capital 42,045 41,453
Regulatory adjustments relating to unrealised gains (604) (583)
PRA Transitional Common Equity Tier 1 capital 41,441 40,870
CRD IV RWAs 412,892 401,900
Fully Loaded Common Equity Tier 1 ratio 10.2% 10.3%
PRA Transitional Common Equity Tier 1 ratio2 10.0% 10.2%

45 |
Leverage exposure1
(£bn) BCBS 270 Leverage exposure
30 September 2014 31 December 2014
Derivative financial instruments 383 440
Cash collateral 60 73
Reverse repurchase agreements 158 132
Loans and advances and other assets 765 713
Total IFRS assets 1,366 1,358
Derivatives netting (345) (395)
Adjustments to cash collateral (42) (53)
Net written credit protection 28 27
Potential Future Exposure on derivatives 195 179
Total derivatives adjustments (164) (242)
Securities financing transactions adjustments 34 25
Regulatory deductions and other adjustments (14) (15)
Regulatory consolidation adjustments (8) (8)
Weighted off balance sheet commitments 110 115
Total fully loaded leverage exposure 1,324 1,233
CRD IV Common Equity Tier 1 capital 42.0 41.5
CRD IV Additional Tier 1 capital 4.6 4.6
CRD IV Tier 1 capital 46.6 46.0
Fully loaded leverage ratio 3.5% 3.7%
1 Estimates based on current understanding of the BCBS 270 standards and the requirements contained in the European Commission delegated act |
Barclays Full Year 2014 Results | 3 March 2015

46 |
High quality liquidity pool (£bn) Key messages
• Further strengthened liquidity position with the Group liquidity pool up by £22bn to £149bn, building a larger surplus to the internal Liquidity Risk Appetite
• Quality of the pool remains high: − 82% held in cash, deposits with central banks and high
quality government bonds
− Over 95% of government bonds are securities issued by UK, US, Japanese, French, German, Danish, Swiss and Dutch sovereigns
• Even though not a regulatory requirement, the size of our liquidity pool is almost double that of wholesale debt maturing in less than a year
• Additional significant sources of contingent funding in the form of high quality assets pre-positioned with central banks globally
• Continued strengthening of estimated CRD IV/Basel 3 liquidity ratios: − Estimated LCR increased to 124%, mainly due to the increase
in the size of the liquidity pool, resulting in a £30bn surplus above the future 100% requirement
− Estimated NSFR strengthened to 102%, primarily driven by the progress on run-down of Non-Core
Maintaining a robust liquidity position, with pool well in excess of internal and external minimum requirements
85 43 37
46
62 85
19
22 27
2012 2013 2014
Cash & Deposits at Central Banks Government Bonds Other Available Liquidity
149
Estimated CRD IV/Basel 3 liquidity ratios1
Metric 2013 2014 Expected 100%
requirement date
LCR2 96% 124% 1 January 2018
Surplus - £30bn
NSFR3 94% 102% 1 January 2018
Surplus to 30-day Barclays-specific LRA
2013 2014
LRA 104% 124%
Surplus £5bn £29bn
127
150
1 Barclays interpretation of current rules and guidance | 2 LCR estimated based on the EU delegated act | 3 Estimated based on the final BCBS rules published in October 2014 |
FY 2014 Fixed Income Call Slides FINAL (Slide 11)
FI Big Pack
Barclays Full Year 2014 Results | 3 March 2015

47 |
Broadly self-funded retail businesses1(£bn)
• Group Loan to Deposit Ratio (LDR) and the LDR for PCB, Barclaycard and Africa Banking broadly unchanged at 100% and 89% respectively1
• Excess customer deposits in PCB, Barclaycard and Africa Banking predominantly used to fund the liquidity buffer requirements for these businesses, making them broadly self funded
• The Group issued £15bn of term funding net of early redemptions during 2014 (excluding FLS) across senior unsecured, secured and subordinated debt, against £24bn of maturities
• Overall funding requirements for the Group reducing as Non-Core assets are run down
Total funding (excluding BAGL)
• Expect to issue a gross amount of £10-15bn in 2015 across public and private senior unsecured, secured and subordinated debt, materially below term maturities of £23bn for the year
• Most capital and non-structured senior unsecured debt expected to be issued out of Barclays PLC, the HoldCo, going forward
• Secured, short-term and structured notes expected to continue to be issued out of Barclays Bank PLC, the OpCo
• We intend to maintain access to diverse wholesale funding, through different products, currencies, maturities and channels
• We expect to be a regular issuer of AT1 securities over the next few years
We maintain access to stable and diverse sources of funding, across customer deposits and wholesale debt
Key messages
2015 Funding Plan
351 353 349 321 323 309
200
220
240
260
280
300
320
340
360
380
2013 H1 14 2014
Deposits from customers
91% 92% 89%
Retail LDR L&A to customers
62% 61% 62%
4% 4% 4% 7% 7% 8% 14% 14% 13% 14% 13% 13%
2013 H1 14 2014
£508bn £522bn £521bn
Customer deposits Sub. debt Secured term funding
Short-term debt and other deposits Unsecured term funding
1 LDR for PCB, Barclaycard and Africa Banking also includes the Non-Core (retail) deposits |
FY 2014 Fixed Income Call Slides FINAL (Slide 12)
FI Big Pack
Barclays Full Year 2014 Results | 3 March 2015
48 |
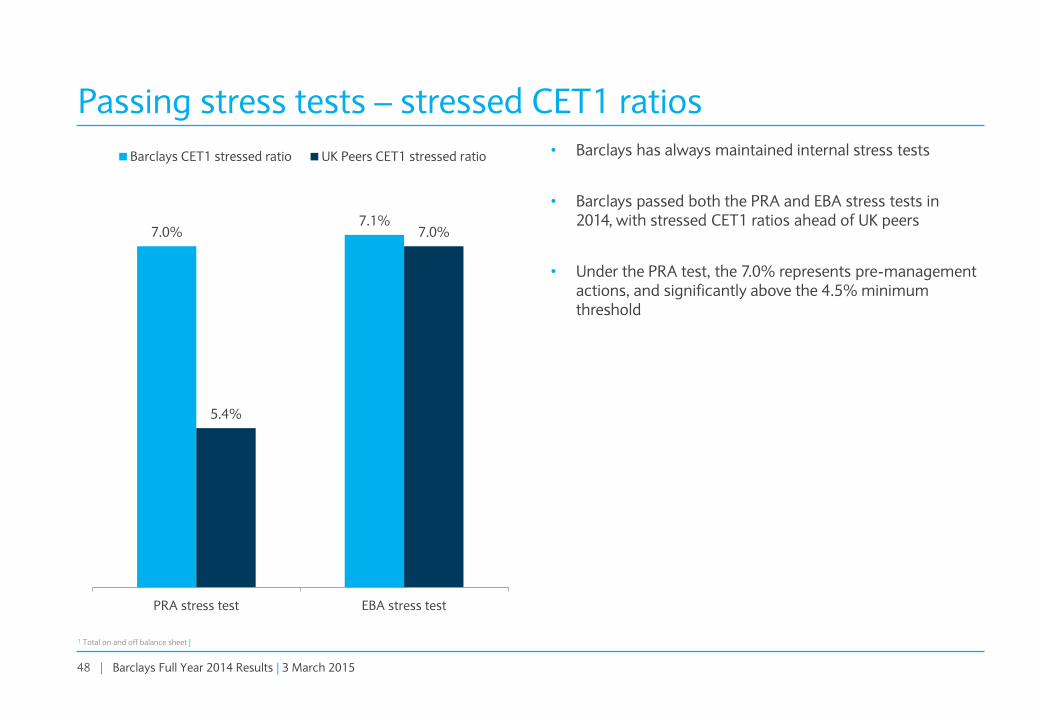
7.0% 7.1%
5.4%
7.0%
PRA stress test EBA stress test
Barclays CET1 stressed ratio UK Peers CET1 stressed ratio • Barclays has always maintained internal stress tests
• Barclays passed both the PRA and EBA stress tests in 2014, with stressed CET1 ratios ahead of UK peers
• Under the PRA test, the 7.0% represents pre-management actions, and significantly above the 4.5% minimum threshold
Passing stress tests – stressed CET1 ratios
Barclays Full Year 2014 Results | 3 March 2015
1 Total on and off balance sheet |

49 |
Spain now sold, and ESHLA re-marked (£bn)
Shrinking Level 3 assets
Spain
13.4
ESHLA
17.4
Other
17.0
6.3
2.5
4.7
1.3
2.2 Other
Available for sale investments
Derivative financial assets
Financial assets designated at fair value
Trading portfolio assets
Barclays Full Year 2014 Results | 3 March 2015
31 December 2014
£47.8bn