barclays ceo energy-power conference september 6 –7, … · 200,000 effective stacked acres (1)...
TRANSCRIPT

Barclays CEO Energy-Power ConferenceSeptember 6 – 7, 2016
2 www.riceenergy.com
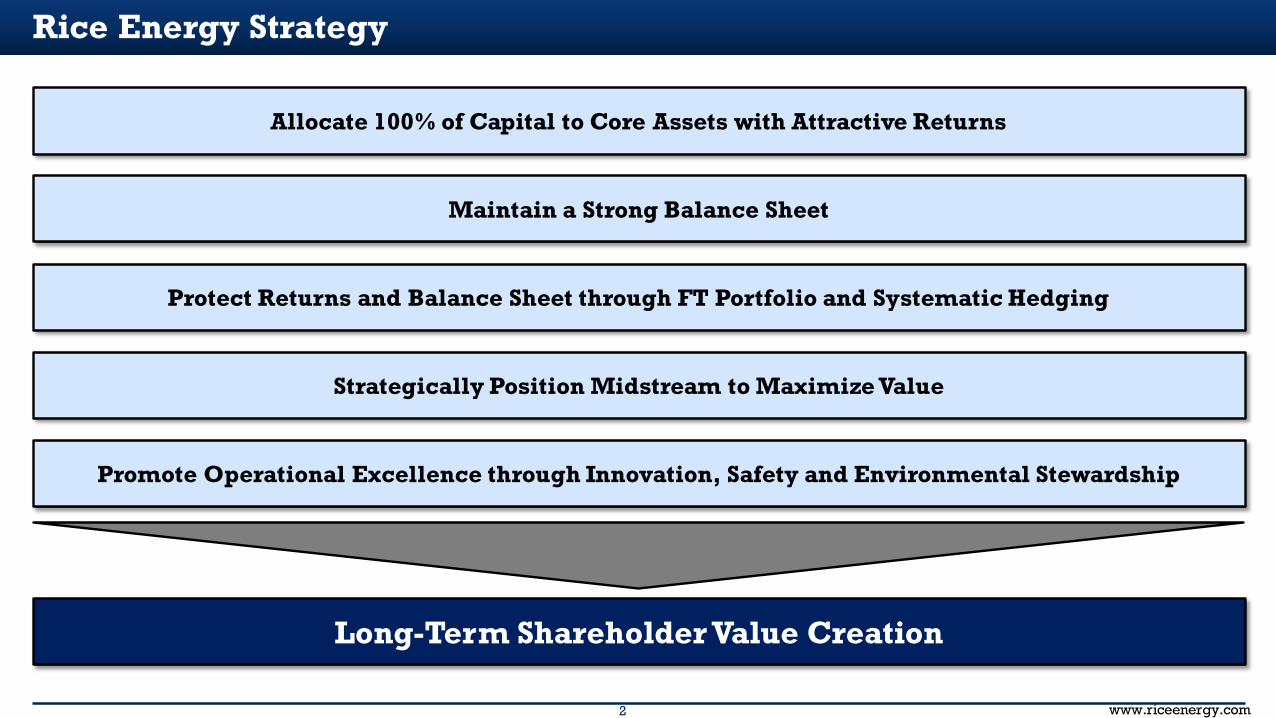
Rice Energy Strategy
Allocate 100% of Capital to Core Assets with Attractive Returns
Protect Returns and Balance Sheet through FT Portfolio and Systematic Hedging
Strategically Position Midstream to Maximize Value
Promote Operational Excellence through Innovation, Safety and Environmental Stewardship
Long-Term Shareholder Value Creation
Maintain a Strong Balance Sheet

3 www.riceenergy.com
RICE owns 91.75% of the common equity of GP Holdings
GP Holdings owns 35% of all outstanding RMP LP units and 100% of IDRs
Long-term, we believe GP Holdings value will be > $1B
Company Overview: More Than Just an E&P Company
UpstreamMarcellus + Utica Shale Development
Rice Midstream HoldingsOhio Gathering System
+ Strike Force JV
200,000 effective stacked acres (1) in the core of SW Appalachia
– 94,000 PA Marcellus– 49,000 PA Deep Utica– 57,000 OH Utica
758 MMcfe/d 2Q16 net production
80-110% single well returns at strip prices(2)
2016E Production Growth: ~30%
One of the largest gathering footprints in Ohio’s Dry Gas Utica Core
Ideal assets for future drop downs to RMP
147,000 dedicated acres, primarily from two of the most active dry gas operators (RICE/ GPOR)
658 MDth/d 2Q16 average throughput, 67% 3rd party
2016E Throughput Growth: ~160%
Rice Midstream PartnersPennsylvania Gathering System
+ PA and OH Water Services
119,000 dedicated Pennsylvania Marcellus acres from RICE and third parties
934 MDth/d 2Q16 average throughput, 27% 3rd party
2016E Distribution Growth: 20%
2016E Throughput Growth: ~40%
GP HoldingsRMP Units + IDRs
NYSE: RICE
35% of LP Units 100% IDRs
NYSE: RMP
__________________________1. Stacked acreage as of 6/30/16. Surface acreage of 151,000 net acres.2. Strip pricing as of 7/29/16, 2016 estimated well costs.
EIG Managed Funds
91.75% 8.25%
GP HoldingsStrike Force AMI
(GPOR Midstream JV)
4 www.riceenergy.com
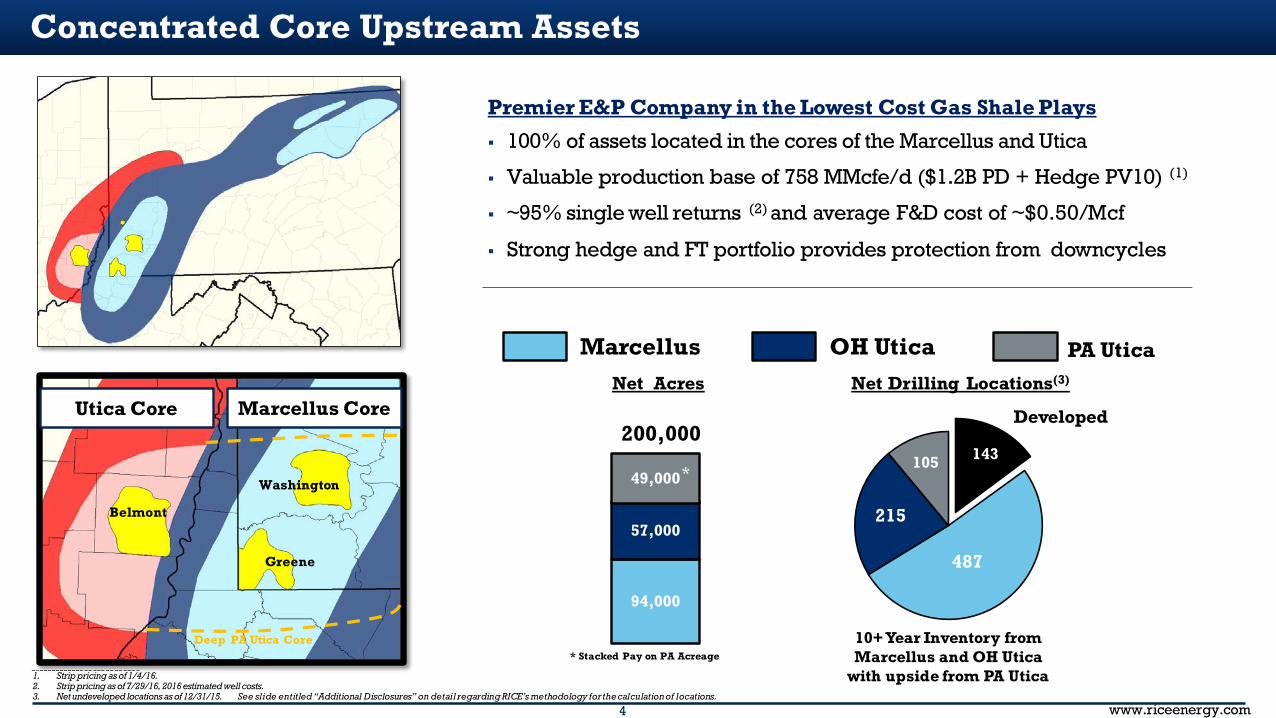
Premier E&P Company in the Lowest Cost Gas Shale Plays
100% of assets located in the cores of the Marcellus and Utica
Valuable production base of 758 MMcfe/d ($1.2B PD + Hedge PV10) (1)
~95% single well returns (2) and average F&D cost of ~$0.50/Mcf
Strong hedge and FT portfolio provides protection from downcycles
Concentrated Core Upstream Assets
__________________________1. Strip pricing as of 1/4/16.2. Strip pricing as of 7/29/16, 2016 estimated well costs.3. Net undeveloped locations as of 12/31/15. See slide entitled “Additional Disclosures” on detail regarding RICE’s methodology for the calculation of locations.
94,000
57,000
Net AcresUtica Core Marcellus Core
200,000
Washington
Greene
Belmont
Marcellus OH Utica PA Utica
Deep PA Utica Core
Net Drilling Locations(3)
10+ Year Inventory from Marcellus and OH Utica
with upside from PA Utica
487
215
105 143
Developed
* Stacked Pay on PA Acreage
49,000*
5 www.riceenergy.com
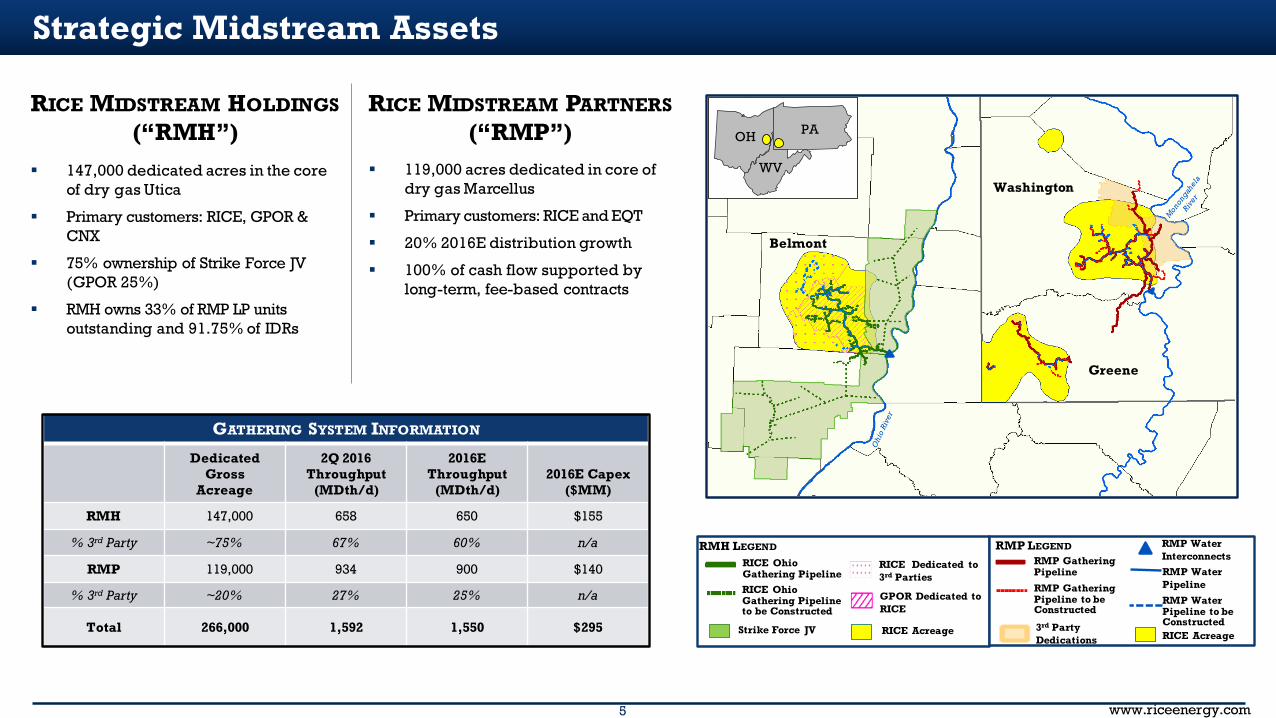
Strategic Midstream Assets
GATHERING SYSTEM INFORMATION
DedicatedGross
Acreage
2Q 2016 Throughput
(MDth/d)
2016E Throughput
(MDth/d)2016E Capex
($MM)
RMH 147,000 658 650 $155
% 3rd Party ~75% 67% 60% n/a
RMP 119,000 934 900 $140
% 3rd Party ~20% 27% 25% n/a
Total 266,000 1,592 1,550 $295
147,000 dedicated acres in the core of dry gas Utica
Primary customers: RICE, GPOR & CNX
75% ownership of Strike Force JV (GPOR 25%)
RMH owns 33% of RMP LP units outstanding and 91.75% of IDRs
119,000 acres dedicated in core of dry gas Marcellus
Primary customers: RICE and EQT
20% 2016E distribution growth
100% of cash flow supported by long-term, fee-based contracts
RICE Dedicated to 3rd Parties
GPOR Dedicated to RICE
RMH LEGEND
RICE Acreage
RICE Ohio Gathering Pipeline RICE Ohio Gathering Pipeline to be Constructed
Strike Force JV
RMP LEGEND
RMP Gathering Pipeline to be Constructed
RICE Acreage
RMP Gathering Pipeline
3rd PartyDedications
RMP Water Pipeline
RMP Water Pipeline to be Constructed
RICE MIDSTREAM HOLDINGS(“RMH”)
RICE MIDSTREAM PARTNERS(“RMP”)
Belmont
Washington
Greene
WEST VIRGINIA
OH PA
WV
RMP Water Interconnects
6 www.riceenergy.com
126 274
552 675
758 730
2013 2014 2015 1Q16 2Q16 2016E
647 835 934 900
247
454 658 650
175
401
894
1,289
1,592 1,550
2013 2014 2015 1Q16 2Q16 2016ERMP RMH
$0.43 $0.31 $0.26 $0.21 $0.17
$0.55
$0.38 $0.36 $0.39 $0.32
$0.38
$0.38 $0.38 $0.40 $0.42
$0.44
$0.43 $0.34 $0.23
$0.22
$1.80
$1.50 $1.34
$1.23 $1.13
2013 2014 2015 1Q16 2Q16LOE and Taxes FT Gathering G&A
21 37 39
9 9
34 –
7 12
7 8
26
21
44 51
16 17
60
2013 2014 2015 1Q16 2Q16 2016EPA OH
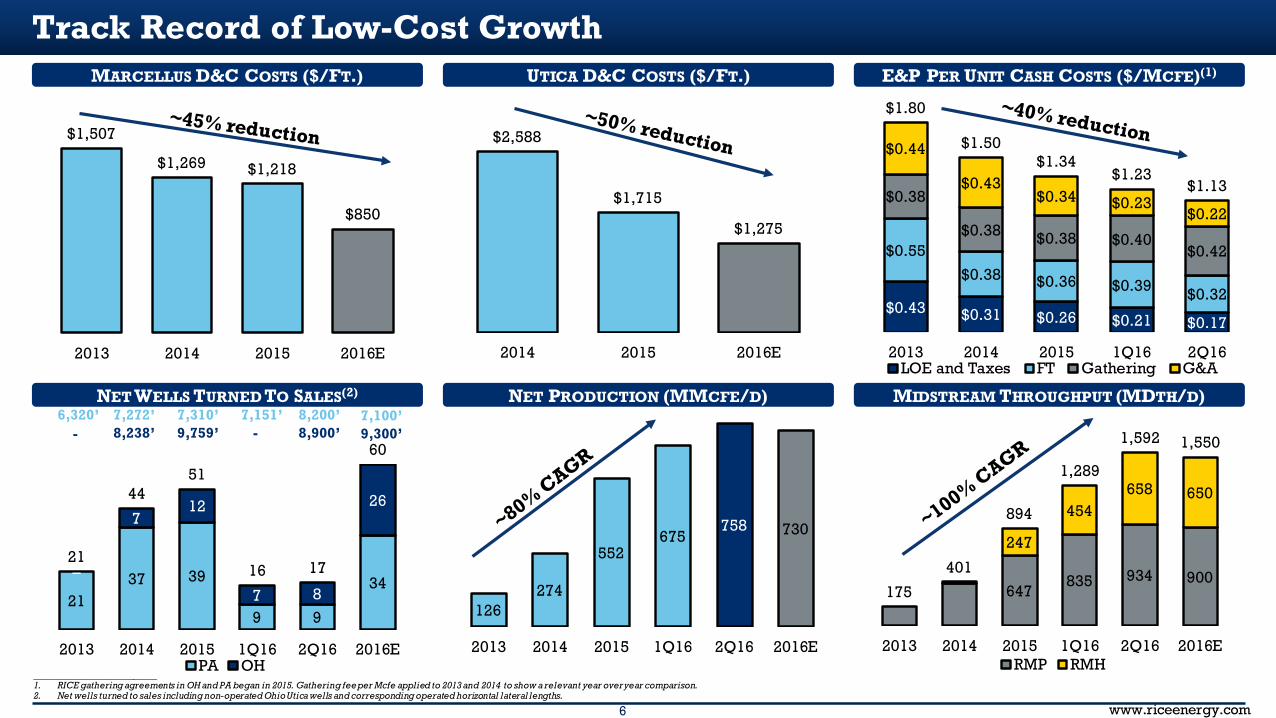
Track Record of Low-Cost GrowthE&P PER UNIT CASH COSTS ($/MCFE)(1)UTICA D&C COSTS ($/FT.)MARCELLUS D&C COSTS ($/FT.)
MIDSTREAM THROUGHPUT (MDTH/D)NET PRODUCTION (MMCFE/D)NET WELLS TURNED TO SALES(2)
__________________________1. RICE gathering agreements in OH and PA began in 2015. Gathering fee per Mcfe applied to 2013 and 2014 to show a relevant year over year comparison.2. Net wells turned to sales including non-operated Ohio Utica wells and corresponding operated horizontal lateral lengths.
6,320’ 7,272’ 7,310’ 7,151’ 8,200’8,238’ 9,759’ -- 8,900’
7,100’9,300’
$2,588
$1,715
$1,275
2014 2015 2016E
$1,507
$1,269 $1,218
$850
2013 2014 2015 2016E
7 www.riceenergy.com
25%
47%
77%
114%
23%
49%
83%
124%
–
25%
50%
75%
100%
125%
150%
$2.50 $3.00 $3.50 $4.00Marcellus Utica
YE 2015 Well Cost Assumption
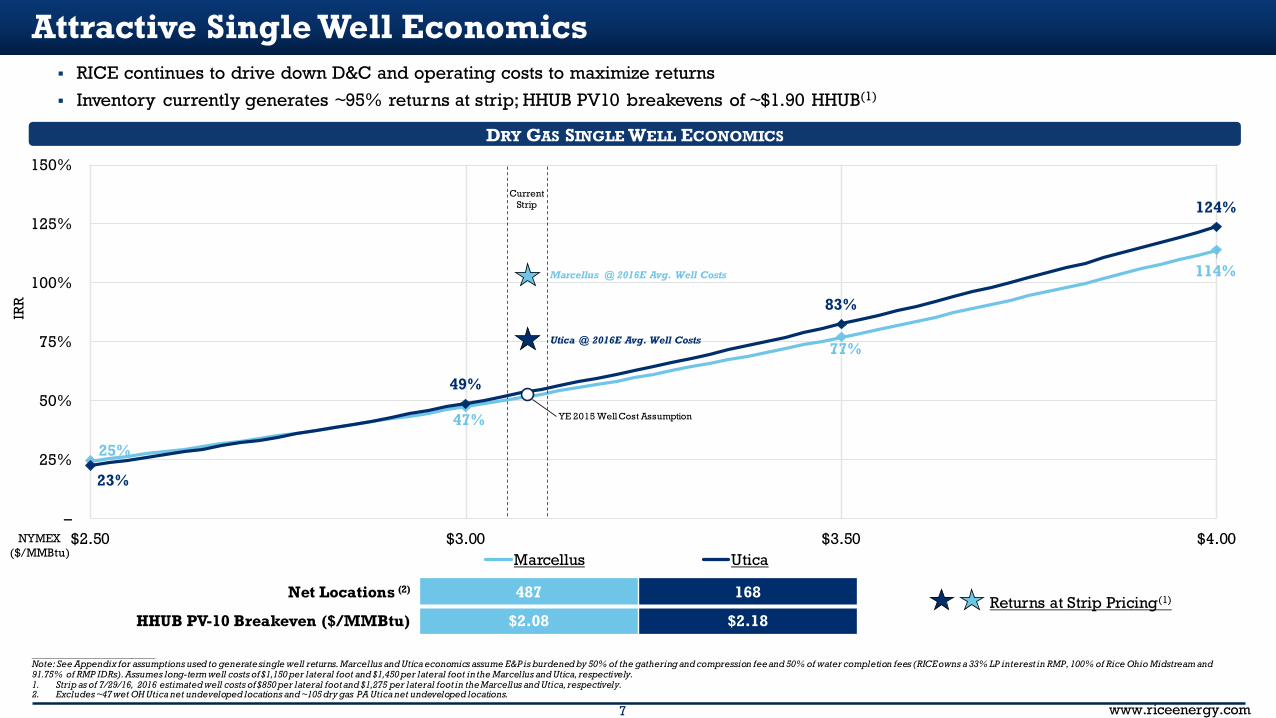
Attractive Single Well Economics
Net Locations (2) 487 168
HHUB PV-10 Breakeven ($/MMBtu) $2.08 $2.18
DRY GAS SINGLE WELL ECONOMICS
RICE continues to drive down D&C and operating costs to maximize returns Inventory currently generates ~95% returns at strip; HHUB PV10 breakevens of ~$1.90 HHUB(1)
__________________________Note: See Appendix for assumptions used to generate single well returns. Marcellus and Utica economics assume E&P is burdened by 50% of the gathering and compression fee and 50% of water completion fees (RICE owns a 33% LP interest in RMP, 100% of Rice Ohio Midstream and 91.75% of RMP IDRs). Assumes long-term well costs of $1,150 per lateral foot and $1,450 per lateral foot in the Marcellus and Utica, respectively.1. Strip as of 7/29/16, 2016 estimated well costs of $850 per lateral foot and $1,275 per lateral foot in the Marcellus and Utica, respectively.2. Excludes ~47 wet OH Utica net undeveloped locations and ~105 dry gas PA Utica net undeveloped locations.
NYMEX ($/MMBtu)
IRR
Returns at Strip Pricing(1)
Marcellus @ 2016E Avg. Well Costs
Utica @ 2016E Avg. Well Costs
CurrentStrip

8 www.riceenergy.com
$700
$60 $30
$540
$275 $450 $310
$105 $85
$1,240
$335 $480
–
$500
$1,000
$1,500Remaining 2016 CapEx
Available Credit Facility
2Q16 Cash & Rem. 2016E CFO
Healthy Balance Sheet Protected by Strong Hedge BookSUMMARY
2016 FUNDING & CAPITAL EXPENDITURES
Ample Liquidity: $1.4B of total liquidity(1) consisting of $1.1B of E&P liquidity and $300MM of RMH liquidity
– Increased borrowing base 17% to $875MM with commitment amounts of $750MM, underscoring asset base value
Strong Balance Sheet and Financing: E&P ~2.0x levered throughout 2016 with no dependence on drop downs
Attractive Hedge Book in 2016 and beyond– 89% hedged for rem. 2016 at wtd. avg. floor of $3.25/MMBtu
– 649 MMBtu/d hedged in 2017 at wtd. avg. floor of $3.12/MMBtu
__________________________1. Excluding Rice Midstream Partners LP.2. Please see “Adjusted EBITDA and DCF Reconciliation” for reconciliations to comparable GAAP financial measures.3. Does not assume future acquisitions or drop downs.4. Please see “Adjusted EBITDAX Reconciliation” for a description of Further Adjusted EBITDAX.
Rice E&P RMH RMP
HEDGE SUMMARY
BBtu/d $/MMBtu
1.8x
– –
1.3x
2.0x
1.25x
0.5x
1.75x
–
0.5x
1.0x
1.5x
2.0x
2.5x
Rice E&P RMH RMP Consolidated
2Q16 Net Debt / LTM EBITDAX 2016 Net Debt / LTM EBITDAX
LEVERAGE(2)(3)
(4)
732
649
470
318
$3.25 $3.12 $3.08
$2.99
$1.60
$1.80
$2.00
$2.20
$2.40
$2.60
$2.80
$3.00
$3.20
–
100
200
300
400
500
600
700
800
Rem. 2016 2017 2018 2019
Hedged Volume Avg. Wtd. Floor Price

9 www.riceenergy.com
$45$150 $170 $140
$150
$250
$155
$45 $50
$300
$420
$295
0
100
200
300
400
500
2012 2013 2014 2015 2016E
$MM
RMP RMH
$380 $340 $230
$200 $285 $330
$250 $115
$100
$225
$545
$830 $740
$660
0100200300400500600700800
2012 2013 2014 2015 2016E
$MM
PA D&C OH D&C Land
37 39 34 –
–
7 12 26
10
21
44 51
60
0
10
20
30
40
50
60
2012 2013 2014 2015 2016E
Wells
PA OH
2016 Updated E&P and Midstream Guidance
_______________________Note: 2014 Pro Forma for ASR transaction.1. As of August 3, 2016.2. Does not include wells from the Greene County Acquisition.3. Includes 2015 water services business EBITDA at RMH prior to the acquisition by RMP in November 2015.
47 126
274
552
730
–
–
0
100
200
300
400
500
600
700
800
2012 2013 2014 2015 2016E
MMcfe/d
Average Net ProductionNet Wells Turned to Sales(2)
Midstream Capital Expenditures Average Gathering Throughput Midstream Adjusted EBITDA
61 647
900
247
650
175
401
894
1,550
0
200
400
600
800
1,000
1,200
1,400
1,600
2012 2013 2014 2015 2016E
MDth/d
RMP RMH
$64
$135 $42
$43
$106
$178
020406080
100120140160180
2015 2016E
$MM
RMP RMH
Published Guidance
E&P Capital ExpendituresE&P (1)
MIDSTREAM (1)
(3)
10 www.riceenergy.com
Financial Strength – Healthy balance sheet, ample liquidity and robust hedges– 2016 budget focused on balance sheet and E&P returns while creating significant future midstream value
– Healthy Balance Sheet: Expect to exit 2016 at ~2.0x E&P leverage with no dependence on drop downs(1)
– Ample Liquidity: $1.4B of 2Q16 liquidity(2): $1.1B E&P and $300MM RMH
– Robust & Attractive Hedges : 89% of rem. 2016 production hedged at $3.25/MMBtu; majority of 2017 production hedged at $3.12/MMBtu
Highly concentrated acreage position in the most economic areas of the Marcellus and Utica Shale– Core Locations (3): 487 net undeveloped Marcellus wells + 215 net undeveloped OH Utica wells + 105 net undeveloped PA Utica wells
– Attractive Economics : Development and operating cost declines have driven avg. PV-10 breakeven to ~$1.90/MMBtu HHUB(4)
– Compelling Returns: ~95% Pre-Hedge IRRs at strip pricing(4)
– Continuous development through down cycle beneficiary of service price environment steady, best-in-class production growth
Midstream is a valuable and differentiated element of the RICE story– #1 Gatherer in the Dry Gas Core : ~266,000 acres(5) dedicated from 3 of the 5 most active operators in SW Appalachia
– Unique Financial Advantages: ~$1.0B of midstream monetizations and financings to date with ~$1.3B of estimated remaining drop down inventory and GP Holdings with expected future value of $1.0B+
– High Growth MLP: RMP expects 20% distribution growth with current asset base while maintaining 1.5x - 1.6x coverage in 2016
Firm Transportation (FT) Portfolio is right-sized for RICE’s production growth and basis outlook– Right-Sized: FT covers >80% of 2016 production and decreases to ~60% by 2020
– Right Exposure: Expect local basis to improve from ~$0.80 in 2016 (23% of production) to ~$0.50 in 2020 (~40% of production)
Well Positioned for Strong Continued Growth
__________________________1. Does not assume future acquisitions or drop downs.2. Excluding Rice Midstream Partners LP.3. Net undeveloped locations as of 12/31/15. See slide entitled “Additional Disclosures” on detail regarding RICE’s methodology for the calculation of locations.4. Strip pricing as of 7/29/16, 2016 estimated costs.5. Excludes ~49K net PA Utica acres dedicated to RMP from RICE and additional PA Utica acreage dedicated to RMP from EQT.

11 www.riceenergy.com
Asset Detail
12 www.riceenergy.com
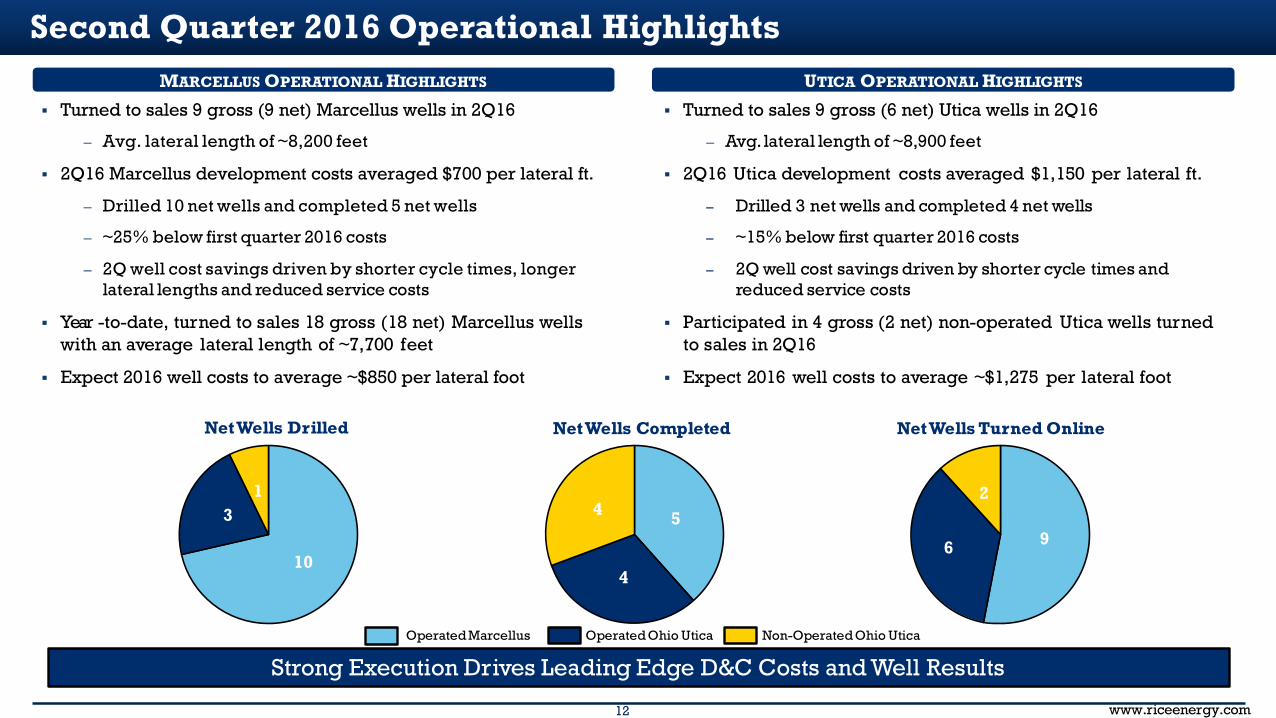
Turned to sales 9 gross (9 net) Marcellus wells in 2Q16
– Avg. lateral length of ~8,200 feet
2Q16 Marcellus development costs averaged $700 per lateral ft.
– Drilled 10 net wells and completed 5 net wells
– ~25% below first quarter 2016 costs
– 2Q well cost savings driven by shorter cycle times, longer lateral lengths and reduced service costs
Year -to-date, turned to sales 18 gross (18 net) Marcellus wells with an average lateral length of ~7,700 feet
Expect 2016 well costs to average ~$850 per lateral foot
5
4
4
Net Wells Completed
Second Quarter 2016 Operational Highlights
96
2
Net Wells Turned Online
Operated Marcellus Operated Ohio Utica Non-Operated Ohio Utica
MARCELLUS OPERATIONAL HIGHLIGHTS
10
31
Net Wells Drilled
UTICA OPERATIONAL HIGHLIGHTS
Turned to sales 9 gross (6 net) Utica wells in 2Q16
– Avg. lateral length of ~8,900 feet
2Q16 Utica development costs averaged $1,150 per lateral ft.
– Drilled 3 net wells and completed 4 net wells
– ~15% below first quarter 2016 costs
– 2Q well cost savings driven by shorter cycle times and reduced service costs
Participated in 4 gross (2 net) non-operated Utica wells turned to sales in 2Q16
Expect 2016 well costs to average ~$1,275 per lateral foot
Strong Execution Drives Leading Edge D&C Costs and Well Results

13 www.riceenergy.com
Differentiated Long-Term Production
__________________________1. Data for RICE based on actuals through 7/6/16, peer data based on Pennsylvania Department of Environmental Protection productionreports through 5/1/16.2. Data for RICE based on actuals through 7/6/16, peer data based on Ohio Department of Natural Resources report through 3/31/16.
RICE MarcellusRICE Utica
Differentiation of RICE wells is evident in 1-3 year cumulative production per well. 100% of RICE future activity is focused within our proven concentrated acreage positions in the Marcellus + Utica where we have consistently demonstrated industry leading results.
-
2,000,000
4,000,000
6,000,000
8,000,000
10,000,000
12,000,000
0 500 1,000 1,500 2,000 2,500
Cu
mu
lati
ve P
rod
uct
ion
(Mcf
e)
Days Online
RICE Utica RICE Marcellus Industry Marcellus + Utica
RICE Program180 Wells - 1 Bcf/d
Rest of Industry8,700 Wells - 20 Bcf/d
14 www.riceenergy.com
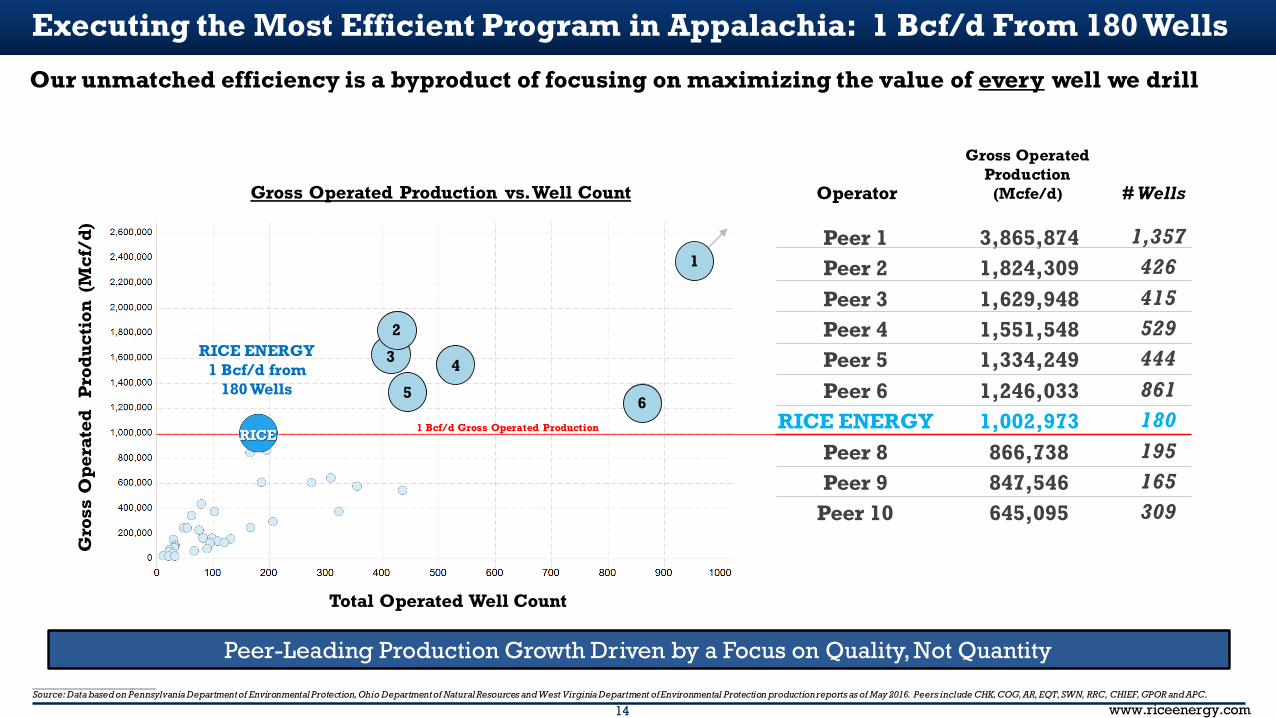
Executing the Most Efficient Program in Appalachia: 1 Bcf/d From 180 Wells
Peer-Leading Production Growth Driven by a Focus on Quality, Not Quantity__________________________Source: Data based on Pennsylvania Department of Environmental Protection, Ohio Department of Natural Resources and West Virginia Department of Environmental Protection production reports as of May 2016. Peers include CHK, COG, AR, EQT, SWN, RRC, CHIEF, GPOR and APC.
Gross Operated Production vs. Well Count
Gro
ss O
per
ated
P
rod
uct
ion
(M
cf/d
)
Total Operated Well Count
1
6
RICE
1 Bcf/d Gross Operated Production
2
3 4
5
RICE
RICE ENERGY1 Bcf/d from
180 Wells
Peer 1Peer 2Peer 3Peer 4Peer 5Peer 6
RICE ENERGYPeer 8Peer 9
Peer 10
Operator
Gross Operated Production
(Mcfe/d) # Wells
3,865,8741,824,3091,629,9481,551,5481,334,2491,246,0331,002,973866,738847,546645,095
1,357426415529444861180195165309
Our unmatched efficiency is a byproduct of focusing on maximizing the value of every well we drill

15 www.riceenergy.com
–
2.0
4.0
6.0
8.0
10.0
12.0
– 0.5 1.0 1.5 2.0 2.5 3.0 3.5 4.0 4.5
MM
cf/d
Years
Marcellus and Utica Single Well Type Curves
__________________________Note: See appendix for summary of assumptions used to generate single well IRRs.
Restricted Rate
MARCELLUS SINGLE WELL TYPE CURVE
Cumulative Production1 Year 3.4 2 Year 5.2 5 Year 8.1 10 Year 10.6 EUR 15.1
–
5.0
10.0
15.0
20.0
– 0.5 1.0 1.5 2.0 2.5 3.0 3.5 4.0 4.5
MM
cf/d
Years
Restricted Rate
OHIO UTICA SINGLE WELL TYPE CURVE
Cumulative Production1 Year 5.8 2 Year 9.0 5 Year 12.5 10 Year 15.2 EUR 21.0
EUR (Bcf / 1,000') 2.16Lateral Length 7,000EUR (Bcf) 15.1Interwell Spacing (ft) 750
Choke (MMcf/d per 1,000') 1.50Flat Time (days) 1801-Year Cum. (Bcf) 3.42-Year Cum. (Bcf) 5.2
5-Year Cum. (Bcf) 8.110-Year Cum. (Bcf) 10.6
IRR ($3.50 HHUB) 77%PV-10 ($ mm) ($3.50 HHUB) $10.1
Marcellus
Current EUR (Bcf / 1,000') 2.33Lateral Length 9,000EUR (Bcf) 21.0Interwell Spacing (ft) 1,000
Choke (MMcf/d per 1,000') 1.80Flat Time (days) 3651-Year Cum. (Bcf) 5.82-Year Cum. (Bcf) 9.0
5-Year Cum. (Bcf) 12.510-Year Cum. (Bcf) 15.2
IRR ($3.50 HHUB) 83%PV-10 ($ mm) ($3.50 HHUB) $13.7
OH Utica

16 www.riceenergy.com
0
5,000
10,000
15,000
20,000
25,000
3Q 2016 4Q 2016 1Q 2017 2Q 2017 3Q 2017 4Q 2017 1Q 2018 2Q 2018 3Q 2018 4Q 2018 1Q 2019 2Q 2019 3Q 2019 4Q 2019
MM
cf/d
Appalachia Basin Takeaway Capacity
YearCapacity (Bcf/d)
2016 2.8
2017 13.5
2018 4.0
2019 2.7
Total 23.0
2016
2017
2018
2019
0
500
1,000
1,500
2,000
2,500
3,000
3Q2016
4Q2016
1Q2017
2Q2017
3Q2017
4Q2017
1Q2018
2Q2018
3Q2018
4Q2018
1Q2019
2Q2019
3Q2019
4Q2019
MM
cf/d
Upgrade Projects Through 2019
0
5,000
10,000
15,000
20,000
3Q2016
4Q2016
1Q2017
2Q2017
3Q2017
4Q2017
1Q2018
2Q2018
3Q2018
4Q2018
1Q2019
2Q2019
3Q2019
4Q2019
MM
cf/d
New Build Projects Through 2019
~23 Bcf/d Incremental Appalachian Takeaway Capacity Projected By YE 2019 3 Bcf/d of proposed upgrade projects – reversals or expansions of existing projects with minimal risk of delays
20 Bcf/d of proposed new build projects – new construction projects with more project risk
Even with potential project delays, downsizing or cancellations, we expect there will be sufficient takeaway capacity to significantly improve local differentials by year end 2019
17 www.riceenergy.com
–
500
1,000
1,500
2,000
2,500
3,000
1/1/15 7/1/15 1/1/16 7/1/16 1/1/17 7/1/17 1/1/18 7/1/18 1/1/19 7/1/19 1/1/20 7/1/20 1/1/21
MDth/d
Illustrative Takeaway Volume Range Takeaway Capacity
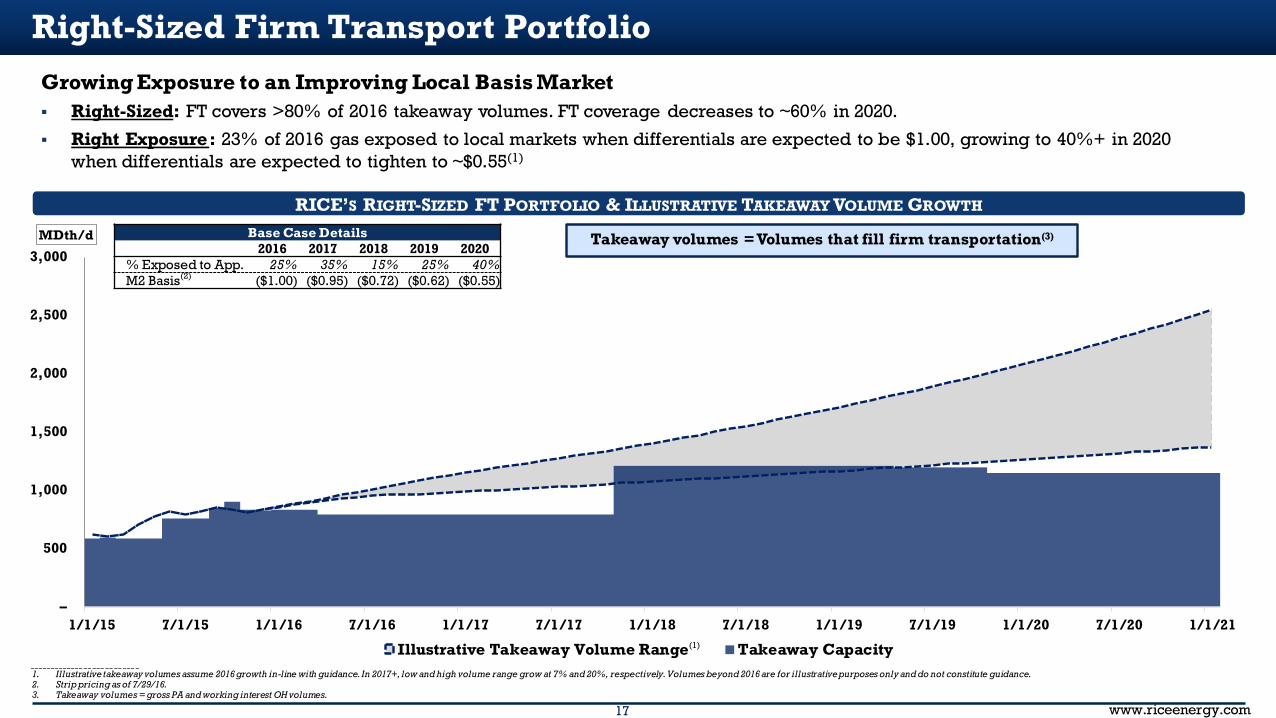
Right-Sized Firm Transport PortfolioGrowing Exposure to an Improving Local Basis Market Right-Sized: FT covers >80% of 2016 takeaway volumes. FT coverage decreases to ~60% in 2020.
Right Exposure: 23% of 2016 gas exposed to local markets when differentials are expected to be $1.00, growing to 40%+ in 2020 when differentials are expected to tighten to ~$0.55(1)
RICE’S RIGHT-SIZED FT PORTFOLIO & ILLUSTRATIVE TAKEAWAY VOLUME GROWTH
(1)
Base Case Details2016 2017 2018 2019 2020
% Exposed to App. 25% 35% 15% 25% 40% M2 Basis(2) ($1.00) ($0.95) ($0.72) ($0.62) ($0.55)
Takeaway volumes = Volumes that fill firm transportation(3)
__________________________1. Illustrative takeaway volumes assume 2016 growth in-line with guidance. In 2017+, low and high volume range grow at 7% and 20%, respectively. Volumes beyond 2016 are for illustrative purposes only and do not constitute guidance.2. Strip pricing as of 7/29/16.3. Takeaway volumes = gross PA and working interest OH volumes.

18 www.riceenergy.com
Why Invest in Rice?
100% of Leasehold in Core of Marcellus and Utica
Create Significant Midstream Value through RICE and 3rd Party Core Dedications
Firm Transportation Contracts De-risk Production Growth, Ensure Takeaway and Limit Appalachian Basis Exposure
Conservative Financial and Hedging Approach to Protect Downside andLock-In Attractive Returns
Top-Tier Growth With Attractive Risk-Adjusted Return Profile
Differentiated Technical Approach Has Led to Industry Leading Well Results
Nimble and Incentivized Management and Technical Teams

19 www.riceenergy.com
Appendix

20 www.riceenergy.com
RICE and RMP Organizational Structure
DE
PA Water
Rice Olympus Midstream
(OH Gathering)
65% LP interest
Rice Midstream Holdings LLC
Public Unitholders
Strike Force Midstream (GPOR JV)
ROFOAssets
OH WaterPA Gathering
$300MM Credit Facility +
$450MM Credit Facility
$875MM Borrowing Base(1)
$100MM Accordion Feature
EIG Managed Funds
GP Holdings(IDRs and LP Interest)
8.25% common
equity interest
100% Series B Preferred Equity
($375MM invested)
75% equity interest
100% Series A Common Equity
35% LP interest, 100% of IDRs
RMP GP(non-economic)
100% equity interest100% ownership91.75% common
equity interest
__________________________1. $750 million of elected commitments.

21 www.riceenergy.com
RICE and RMP Market Snapshot
__________________________1. As of 6/30/16, except share and unit price as of 9/1/16.
$ millions, except per share data
Management Ownership 25%
Shares Outstanding (MM) 157Price $26.60
Market Capitalization $4,165Cash 551 Preferred Equity 375
Revolving credit facilities 256.25% Senior notes due 2022 9007.25% Senior notes due 2023 397
Enterprise Value $5,311
52 Week Price RangeHigh $26.90Low $8.35
Website: www.riceenergy.comInvestor Contact: Julie Danvers
Rice Energy Inc. (1)
(NYSE: RICE)$ millions, except per unit data
Common Units 52 Subordinated Units 29
Total Units Outstanding (MM) 81 Price $22.13
Market Capitalization $1,796Cash 15Revolving credit facility -
Enterprise Value $1,781
Distribution/Unit $0.2235Yield 4.04%
52 Week Price RangeHigh $23.08Low $9.11
Website:Investor Contact:
www.ricemidstream.comJulie Danvers
Rice Midstream Partners LP (1)
(NYSE: RMP)

22 www.riceenergy.com
Strong Second Quarter Results– Net production of 758 MMcfe/d; 43% increase over prior year quarter
– Net loss of $139 million for the second quarter; 118% decrease relative to prior year quarter
– Adjusted EBITDAX(1) of $131MM; 34% increase over prior year quarter
– Lowered E&P costs by 12% over prior year quarter to $1.13/Mcfe, driven by a 43% reduction in LOE to $0.13/Mcfe
– Reduced well costs in the Marcellus and Utica by ~20% to $700 and $1,150 per lateral foot, respectively, for wells drilled and completed in 2Q16
– Updated single well returns of 80-110% at strip pricing(2) and average F&D cost of $0.51/Mcf
– Average NYMEX differential of ($0.15)/MMBtu, a ~$0.50/MMBtu premium over local markets with 82% of 2Q16 production priced outside Appalachia
– 78% of 2Q16 production hedged at $3.27/MMBtu with avg. post-hedge adjusted realized price of $2.77/Mcf
Prolific Midstream Growth– Achieved record quarterly RMH gathering throughput of 658 MDth/d; 184% increase over prior year quarter
– Assigned CNX gathering agreement to Strike Force to support CNX’s dry gas Utica development on ~13,000 core acres in Monroe County, OH
Strong Liquidity and Healthy Balance Sheet – Completed primary equity offering of 20MM shares providing $312MM net proceeds in April 2016
– Strong 2Q16 liquidity position of $1.4B (3) and low LTM consolidated leverage of 1.3x(1)
Updated 2016 Guidance– Accelerating development activity in 2H16 while reaffirming total D&C capital budget
– Reducing 2016 E&P cash operating cost guidance by 10% to $0.97 - $1.08/Mcfe, primarily driven by a ~30% reduction in LOE from prior guidance
Second Quarter 2016 RICE Highlights
__________________________1. Please see “Adjusted EBITDAX Reconciliation” for a description of Adjusted EBITDAX, Further Adjusted EBITDAX and related reconciliations of comparable GAAP financial measures.2. Strip pricing as of 7/29/16, 2016 estimated well costs.3. Excludes Rice Midstream Partners LP.

23 www.riceenergy.com
Three Months EndedJune 30, 2016
Total net production (MMcfe/d) 758 % Gas 100 % Operated 88 % Marcellus 68
Actual ($MM) $/McfeNYMEX Henry Hub price ($/MMBtu) $1.95
Average basis impact ($/MMBtu) ($0.15)Firm transportation fuel & variables ($/MMBtu) ($0.12)Btu uplift (MMBtu/Mcf) $0.09
Pre-hedge realized price ($/Mcf) $1.77Realized hedging gain ($/Mcf) $0.98
Post-hedge realized price ($/Mcf) $2.75Capacity optimization ($/Mcf) $0.02
Adjusted realized price ($/Mcf) $2.77
Operating revenues $156 $2.27Realized hedging gain $67 $0.98
Total operating revenues and realized gain $223 $3.25
Lease operating $9 $0.13Gathering, compression and transportation $27 $0.39Production taxes and impact fees $3 $0.04General and administrative $23 $0.34Depletion, depreciation and amortization $85 $1.23
Net income (loss) ($139)Adjusted EBITDAX(1) $131Further Adjusted EBITDAX(1) $159
Three Months Ended($ in millions) June 30, 2016
CashRice Energy $513Rice Midstream Holdings $38Rice Midstream Partners $15
Total consolidated cash $566
Mezzanine Equity $373
Long-term debtRice Energy
E&P credit facility -6.25% Senior notes due 2022 $9007.25% Senior notes due 2023 $397
Total Rice Energy debt $1,297Rice Midstream Holdings credit facility $25Rice Midstream Partners credit facility -
Total consolidated debt $1,322Net debt $757
Leverage2Q16 Net Debt / LTM EBITDAXRice Energy E&P 1.8xRice Midstream Holdings(2) 0.0xRice Midstream Partners(2) 0.0xConsolidated 1.3x
Capex IncurredD&C $114Land(3) $14RMH $20RMP $25
82% of 2Q16 production sold to premium, non-Appalachian markets LOE of $0.13/Mcfe; 43% reduction from prior year quarter Net debt to LTM further adjusted EBITDAX(1) of 1.3x
RICE Second Quarter 2016 Consolidated Financial Summary Solid second quarter results supported by well-capitalized balance sheet and ample liquidity
QUARTERLY HIGHLIGHTS
__________________________1. Please see “Adjusted EBITDAX Reconciliation” for a description of Adjusted EBITDAX, Further Adjusted EBITDAX and reconciliation to comparable GAAP financial measures.2. Please see “Adjusted EBITDA and DCF Reconciliation” for reconciliations to comparable GAAP financial measures.3. Land capex reflects cash spend.
CAPITALIZATION AT 6/30/2016
%%%
24 www.riceenergy.com
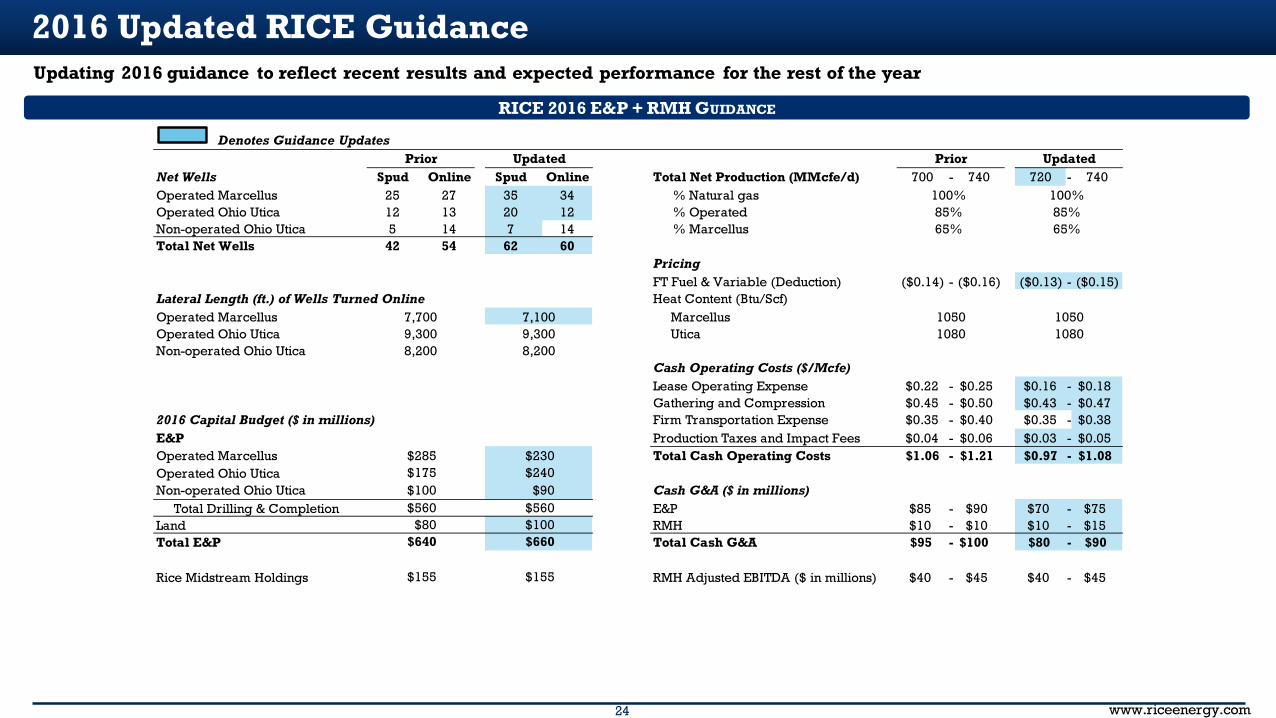
Denotes Guidance UpdatesPrior Updated Prior Updated
Net Wells Spud Online Spud Online Total Net Production (MMcfe/d) 700 - 740 720 - 740Operated Marcellus 25 27 35 34 % Natural gas 100% 100%Operated Ohio Utica 12 13 20 12 % Operated 85% 85%Non-operated Ohio Utica 5 14 7 14 % Marcellus 65% 65%Total Net Wells 42 54 62 60
Pricing FT Fuel & Variable (Deduction) ($0.14) - ($0.16) ($0.13) - ($0.15)
Lateral Length (ft.) of Wells Turned Online Heat Content (Btu/Scf)Operated Marcellus 7,700 7,100 Marcellus 1050 1050Operated Ohio Utica 9,300 9,300 Utica 1080 1080Non-operated Ohio Utica 8,200 8,200
Cash Operating Costs ($/Mcfe)Lease Operating Expense $0.22 - $0.25 $0.16 - $0.18Gathering and Compression $0.45 - $0.50 $0.43 - $0.47
2016 Capital Budget ($ in millions) Firm Transportation Expense $0.35 - $0.40 $0.35 - $0.38E&P Production Taxes and Impact Fees $0.04 - $0.06 $0.03 - $0.05Operated Marcellus Total Cash Operating Costs $1.06 - $1.21 $0.97 - $1.08Operated Ohio UticaNon-operated Ohio Utica Cash G&A ($ in millions)
Total Drilling & Completion E&P $85 - $90 $70 - $75Land RMH $10 - $10 $10 - $15Total E&P Total Cash G&A $95 - $100 $80 - $90
Rice Midstream Holdings RMH Adjusted EBITDA ($ in millions) $40 - $45 $40 - $45
$285$175$100$560
$80$640
$155
$230$240
$90$560$100$660
$155
2016 Updated RICE Guidance
RICE 2016 E&P + RMH GUIDANCE
Updating 2016 guidance to reflect recent results and expected performance for the rest of the year

25 www.riceenergy.com
Denotes Guidance UpdatesPrior Updated
2016 Capital Budget ($ in millions)Gas Gathering and CompressionWater ServicesTotal RMP
Estimated Maintenance Capital
Cash G&A ($ in millions) $15 - $18 $18 - $21
Adjusted EBITDA ($ in millions)Gas Gathering and Compression $85 - $90 $90 - $95Water Services $25 - $30 $40 - $45Total Adjusted EBITDA $110 - $120 $130 - $140
% Third Party 20% - 25% 20% - 25%
Distributable Cash Flow ($ in millions) $90 - $100 $110 - $120Average DCF Coverage Ratio 1.3x - 1.5x 1.5x - 1.6x% Distribution Growth 20% 20%
$10$140
$150
$125$15
$140
$11 $11
We are unable to provide a projection of full-year 2016 RMP net income and net cash provided by operating activities, the most comparable financial measures to Adjusted EBITDA and distributable cash flow, respectively, calculated in accordance with GAAP. We do not anticipate the changes in operating assets and liabilities to be material, but changes in depreciation expense, accounts receivable, accounts payable, accrued liabilities and deferred revenue could be significant, such that the amount of net cash provided by operating activities would vary substantially from the amount of projected Adjusted EBITDA and distributable cash flow. In addition, we are unable to project net income because this metric includes the impact of certain non-cash items that we are unable to project with any reasonable degree of accuracy without unreasonable effort.
2016 Updated RMP Guidance
RMP 2016 GUIDANCE

26 www.riceenergy.com
Hedging SummaryHEDGE SUMMARY
RICE’s gas will be marketed into 4 areas– (1) Gulf Coast (ELA, M1) – (2) TCO– (3) Midwest (Chicago, Dawn)– (4) Appalachia (M2, M3, & Dominion)
~75% of third quarter 2016 production transported out of Appalachian basin
Our Gulf Coast firm transportation contracts deliver to markets in the Gulf Coast (ELA, M1)
– We hedge our Gulf Coast basis exposure opportunistically, but believe our Henry Hub NYMEX derivatives serve as a hedge against these indices which have historically traded within a narrow band of $0.05-$0.15 below Henry Hub
~89% of rem. 2016 production hedged at weighted avg. fixed floor price of $3.25/MMBtu
3Q16 4Q16 2017 2018 2019 2020
Hedged M2 / Dominion Volumes (BBtu/d) 211 165 135 169 215 242Wtd Avg Floor Price ($/MMBtu) $2.29 $2.31 $2.17 $2.42 $2.39 $2.50% of Basis Hedged 100% 58% n.a. n.a. n.a. n.a.
Hedged TCO Volumes (BBtu/d) 65 82 56 19 10 –Wtd Avg Floor Price ($/MMBtu) $3.00 $3.03 $2.87 $2.69 $2.61 –% of Basis Hedged 43% 56% n.a. n.a. n.a. n.a.
Hedged Gulf Coast Volumes (BBtu/d) 352 422 422 247 102 42Wtd Avg Floor Price ($/MMBtu) $3.17 $3.19 $3.06 $3.00 $2.84 $2.92% of Basis Hedged 80% 75% n.a. n.a. n.a. n.a.
Hedged Chicago/Dawn Volumes (BBtu/d) 84 84 37 35 25 20Wtd Avg Floor Price ($/MMBtu) $3.26 $3.27 $3.07 $3.00 $2.87 $2.95% of Basis Hedged 77% 100% n.a. n.a. n.a. n.a.
Total Hedged Volumes (BBtu/d) 712 752 649 470 352 304Wtd Avg Floor Price ($/MMBtu) $2.91 $2.99 $2.86 $2.78 $2.56 $2.58Swap, Collar & Put Floor ($/MMbtu) $3.25 $3.24 $3.12 $3.08 $2.99 $3.07% Hedged 90% 86% n.a. n.a. n.a. n.a.
(1)
(2)
_______________________1. Includes the effect of basis hedges.2. Wtd. avg. fixed price floor.
27 www.riceenergy.com
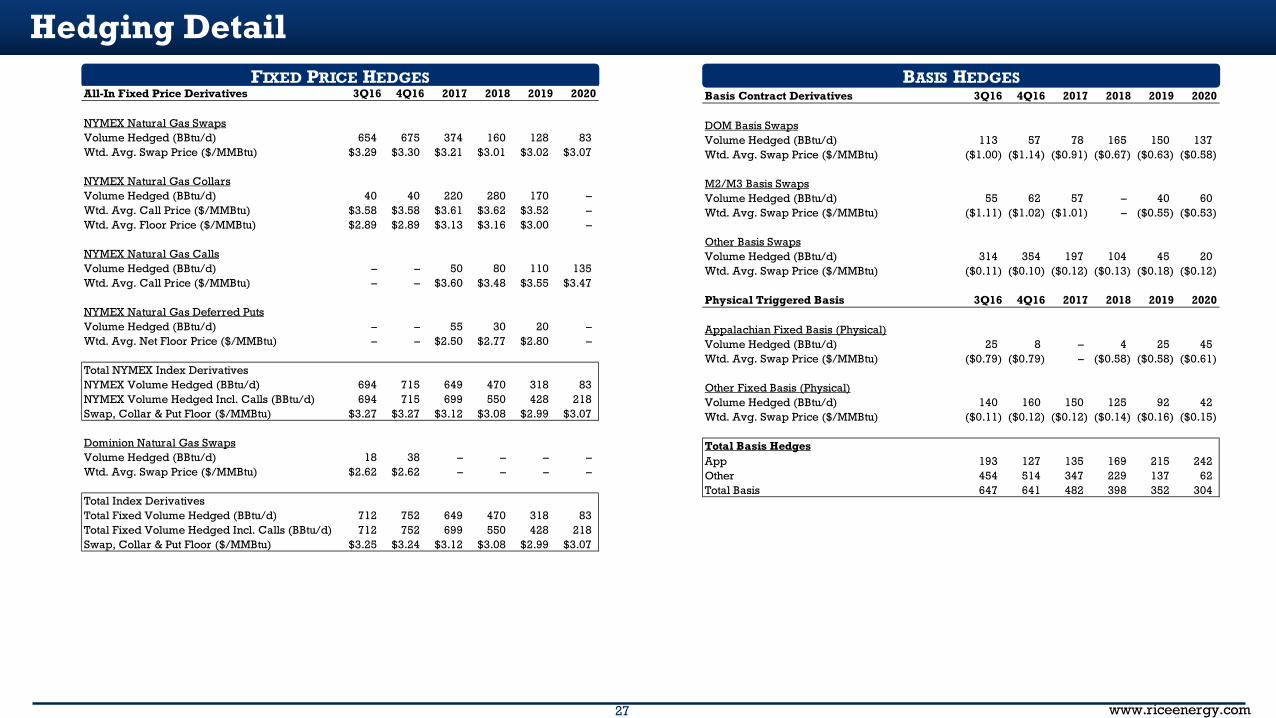
Hedging DetailBASIS HEDGESFIXED PRICE HEDGES
All-In Fixed Price Derivatives 3Q16 4Q16 2017 2018 2019 2020
NYMEX Natural Gas SwapsVolume Hedged (BBtu/d) 654 675 374 160 128 83Wtd. Avg. Swap Price ($/MMBtu) $3.29 $3.30 $3.21 $3.01 $3.02 $3.07
NYMEX Natural Gas CollarsVolume Hedged (BBtu/d) 40 40 220 280 170 –Wtd. Avg. Call Price ($/MMBtu) $3.58 $3.58 $3.61 $3.62 $3.52 –Wtd. Avg. Floor Price ($/MMBtu) $2.89 $2.89 $3.13 $3.16 $3.00 –
NYMEX Natural Gas CallsVolume Hedged (BBtu/d) – – 50 80 110 135Wtd. Avg. Call Price ($/MMBtu) – – $3.60 $3.48 $3.55 $3.47
NYMEX Natural Gas Deferred PutsVolume Hedged (BBtu/d) – – 55 30 20 –Wtd. Avg. Net Floor Price ($/MMBtu) – – $2.50 $2.77 $2.80 –
Total NYMEX Index DerivativesNYMEX Volume Hedged (BBtu/d) 694 715 649 470 318 83NYMEX Volume Hedged Incl. Calls (BBtu/d) 694 715 699 550 428 218Swap, Collar & Put Floor ($/MMBtu) $3.27 $3.27 $3.12 $3.08 $2.99 $3.07
Dominion Natural Gas SwapsVolume Hedged (BBtu/d) 18 38 – – – –Wtd. Avg. Swap Price ($/MMBtu) $2.62 $2.62 – – – –
Total Index DerivativesTotal Fixed Volume Hedged (BBtu/d) 712 752 649 470 318 83Total Fixed Volume Hedged Incl. Calls (BBtu/d) 712 752 699 550 428 218Swap, Collar & Put Floor ($/MMBtu) $3.25 $3.24 $3.12 $3.08 $2.99 $3.07
Basis Contract Derivatives 3Q16 4Q16 2017 2018 2019 2020
DOM Basis SwapsVolume Hedged (BBtu/d) 113 57 78 165 150 137Wtd. Avg. Swap Price ($/MMBtu) ($1.00) ($1.14) ($0.91) ($0.67) ($0.63) ($0.58)
M2/M3 Basis SwapsVolume Hedged (BBtu/d) 55 62 57 – 40 60Wtd. Avg. Swap Price ($/MMBtu) ($1.11) ($1.02) ($1.01) – ($0.55) ($0.53)
Other Basis SwapsVolume Hedged (BBtu/d) 314 354 197 104 45 20Wtd. Avg. Swap Price ($/MMBtu) ($0.11) ($0.10) ($0.12) ($0.13) ($0.18) ($0.12)
Physical Triggered Basis 3Q16 4Q16 2017 2018 2019 2020
Appalachian Fixed Basis (Physical)Volume Hedged (BBtu/d) 25 8 – 4 25 45Wtd. Avg. Swap Price ($/MMBtu) ($0.79) ($0.79) – ($0.58) ($0.58) ($0.61)
Other Fixed Basis (Physical)Volume Hedged (BBtu/d) 140 160 150 125 92 42Wtd. Avg. Swap Price ($/MMBtu) ($0.11) ($0.12) ($0.12) ($0.14) ($0.16) ($0.15)
Total Basis HedgesApp 193 127 135 169 215 242Other 454 514 347 229 137 62Total Basis 647 641 482 398 352 304

28 www.riceenergy.com
1Q16A 2Q16A 3Q16E 4Q16E 2016E 2017E
NYMEX Henry Hub Strip ($/MMBtu) $2.09 $1.95 $2.85 $3.10 $2.51 $3.19Plus/Less: Average Basis Impact (0.21) (0.15) (0.38) (0.44) (0.30) (0.37)Less: Firm Transportation Fuel & Variables (0.14) (0.12) (0.14) (0.13) (0.13) (0.13)Plus: BTU Uplift (MMBtu/Mcf) 0.09 0.09 0.15 0.17 0.13 0.18
Pre-Hedge Realized Price ($/Mcf) $1.83 $1.77 $2.48 $2.70 $2.21 $2.87Plus: Realized Hedging Gain/Loss ($/Mcf) 1.05 0.98 0.45 0.20 0.66 0.01
Post-Hedge Realized Price ($/Mcf) $2.88 $2.75 $2.93 $2.90 $2.87 $2.88Plus: Capacity Optimization ($/Mcf) – 0.02 – – 0.01 –
Adjusted Realized Price ($/Mcf) $2.88 $2.77 $2.93 $2.90 $2.88 $2.88FT Demand Expense ($0.39) ($0.32) ($0.35) ($0.33) ($0.35) ($0.34)
FT Expense (Fuel & Variables + Demand) ($0.53) ($0.44) ($0.49) ($0.46) ($0.48) ($0.47)FT Expense + Basis + BTU Uplift ($0.65) ($0.50) ($0.72) ($0.73) ($0.65) ($0.66)
Basis Exposure & Realized PricingPRICING COMMENTARY BASIS EXPOSURE
Attractive FT Portfolio
2/3 of volumes receive favorable out of basin pricing through 2018
Growing exposure to improving local basis differentials long-term
Appalachian basis has tightened
Opportunity to hedge at attractive levels ($0.50) – ($0.60) in 2019+ relative to green-field FT projects ($1.00)
_______________________1. Strip pricing as of 7/29/16.
(1)
Basi
s E
xpos
ure
Basis Differential ($/M
MBtu)
REALIZED PRICING

29 www.riceenergy.com
Diverse Market Exposure
_______________________1. Conversion of Dth to Mcf assumes 1,050 Btu factor.2. Source: Company Filings, TPH Estimates.
FT portfolio includes 1.2 MMDth/d (1.1 Bcf/d) of firm capacity to premium North American markets(1)
Canadian Markets
Gulf Coast Markets
MIDWEST (MDTH/D)2016 2017 2018107 57 57
GULF COAST (MDTH/D)2016 2017 2018464 603 870
Midwest Markets
TCO (MDTH/D)2016 2017 2018119 85 85
Appalachian Markets
RICE Acreage
RICE FIRM CAPACITY COMMITMENTS(MDTH/D)
Project Pipeline Start Date Volume MarketTEAM South TETCO Sept 2014 270 Gulf Coast
Westside Expansion CGT/TCO Nov 2014 125 TCO, Gulf Coast
Rockies Express REX Aug 2015 175 Midwest/Canada/Gulf Coast
Union Town to Gas City TETCO Sept 2015 87 Midwest/Gulf Coast
OPEN TETCO Sept 2015 50 Gulf Coast
ET Rover Rover Nov 2017 100 Canada
Access South TETCO Nov 2017 320 Gulf Coast
CANADA (MDTH/D)2016 2017 2018
25 42 125
NORTHEAST (MDTH/D)2016 2017 2018
71 50 50
Gulf Coast Demand/Exports by
2020: +12 to 15 Bcf/d(2)
Gulf Coast demand growth will be ~3x larger
than NE demand growth(2)
LNG+8.0
Mexico+2.0
Power+2.5
Industry+1.0

30 www.riceenergy.com
77%
83%
25%
$10.1
$13.7
$4.7
–
$2.0
$4.0
$6.0
$8.0
$10.0
$12.0
$14.0
$16.0
0%
10%
20%
30%
40%
50%
60%
70%
80%
90%
Marcellus OH Utica Dry OH Utica Wet
PV
10 (
$MM
)
IRR
Economics Adjusted for Gathering Ownership at $3.50 HHUB
IRR PV10
EconomicsECONOMIC ASSUMPTIONSPV10 & IRRS (1)
__________________________1. Economics assume E&P is burdened by 50% of the gathering and compression fee and 50% of water completion fees (RICE owns a 33% LP interest in RMP, 100% of RMH and 91.75% of RMP IDRs).2. D&C costs are fully burdened by water completion fees of ~$50 per lateral foot in the Marcellus and ~$65 per lateral foot in theUtica.
and $27/bbl NGLs
Marcellus Utica Dry Utica Wet
Type Well AssumptionsSpacing 750 1,000 1,000Lateral Length 7,000 9,000 9,000EUR (Bcf/1,000') 2.16 2.33 1.83NGL Yield (bbls/mmcf) – – 26Gas Shrink – – 11%Pre-Processed EUR (Bcfe) 15.1 21.0 16.5Post-Processed EUR (Bcfe) 15.1 21.0 17.2% Gas 100% 100% 85%Heat Content (Btu/Scf) 1,050 1,080 1,159Initial Choke (MMcf/d per 1,000') 1.50 1.80 1.41Flat Period (days) 180 365 180
D&C AssumptionsD&C ($MM) $8.0 $13.0 $13.0D&C per Lateral ($ per foot) $1,150 $1,450 $1,450
Operating Expenses (NRI Gas)Fixed Operating Expenses ($/well/month) $6,692 $6,692 $6,692Variable Operating Expenses ($/Mcf) $0.11 $0.11 $0.11
Other Costs/Expenses (NRI Gas)Well Impact Fee? Yes No NoSeverance Taxes ($/Mcf) – $0.04 $0.04Avg. Royalty 18% 20% 20%
Gathering, Processing and Compression (NRI Gas)Gathering, Compression, Processing Fees ($/Dth) $0.45 $0.46 $1.00NGL Fractionation and Transport ($/bbl) – – $5.80
Adjusted Gathering and Compression Fees ($/Dth) $0.23 $0.23 $1.00Midstream Adjustment 50% 50% –
Firm Transportation and Basis (NRI Gas)Basis + Fuel (Variable) % of Gas Price (9%)Wtd. Avg Reservation Fee + Commodity Fee (Fixed) $/Dth ($0.42)All-In Assuming $3.50 HHUB (NRI) ($0.75)
InventoryNet Undeveloped Locations 487 168 47NRI Undeveloped Horizontal Feet (MM ft) 2.8 1.2 0.3
Economics Summary (Adj. for Midstream Ownership In Each Area, $3.50 HHUB, $27/bbl NGLs)PV-10 Single Well $10.1 $13.7 $4.7IRR 77% 83% 25%Payback (Months) 16 14 35Breakeven Realized ($/Dth) $2.08 $2.18 $2.85
(2)

31 www.riceenergy.com
Meaningful Value Derived from Developed Drilling Locations156 net proved developed wells + hedge value are worth ~$9 / share at strip pricing(1), with ~800 net undeveloped Marcellus & Utica locations remaining to drive future growth in proved reserves and proved value.
PD + Hedge PV10: $1.2B2015 Reserves at Strip Pricing
Proved Reserves, Bcf~100% natural gas
Net Drilling Locations10% developed at 12/31/15
249
645
1,015 350
662
685
599
1,307
1,700
2013 2014 2015
$6.85
$8.80
$1.94
Proved Developed (Bcf)
Proved Undeveloped (Bcf)
PV10/Share @ Strip
Hedge Uplift
Total PDP PV10/Share
YE2015 Reserve ReportStrip @ 1/4/2016
Marcellus20% developed
Utica (OH)5% developed
Utica (PA)<1% developed
Total10% developed
Proved Developed Wells
Undeveloped Wells
139
127
807
105
215
487
0% 25% 50% 75% 100%__________________________1. Strip pricing as of 1/4/16.

32 www.riceenergy.com
0
20
40
60
80
100
120
140
160
180
200
2007 2008 2009 2010 2011 2012 2013 2014 2015 2016 2017
Appalachia Rig Count
4333333
211
1744
115
96
315
10
0 5 10 15 20 25 30 35
Peer 1Rice Energy
Peer 3Peer 4Peer 5Peer 6Peer 7Peer 8Peer 9
Peer 10
Asset Quality – Industry High Grading to Quality
Top Ten Active Operators
Laid Down From PeakActive
Aug 2016: 37 Rigs
Rig Count
PA Marcellus & PA Utica
Pennsylvania
West Virginia
Ohio
RICE Acreage
# o
f R
igs
__________________________1. RigData + Baker Hughes Rig Reports.
RICE’s footprint is located in the epicenter of remaining activity in Appalachia due to best in class economics
Early 2012 Peak of 175 Rigs
Aug 201637 Rigs
Current Rig
33 www.riceenergy.com
0
200,000
400,000
600,000
800,000
1,000,000
1,200,000
1,400,000
1,600,000
1,800,000
Cum
ulat
ive
Prod
uctio
n (M
cfe)
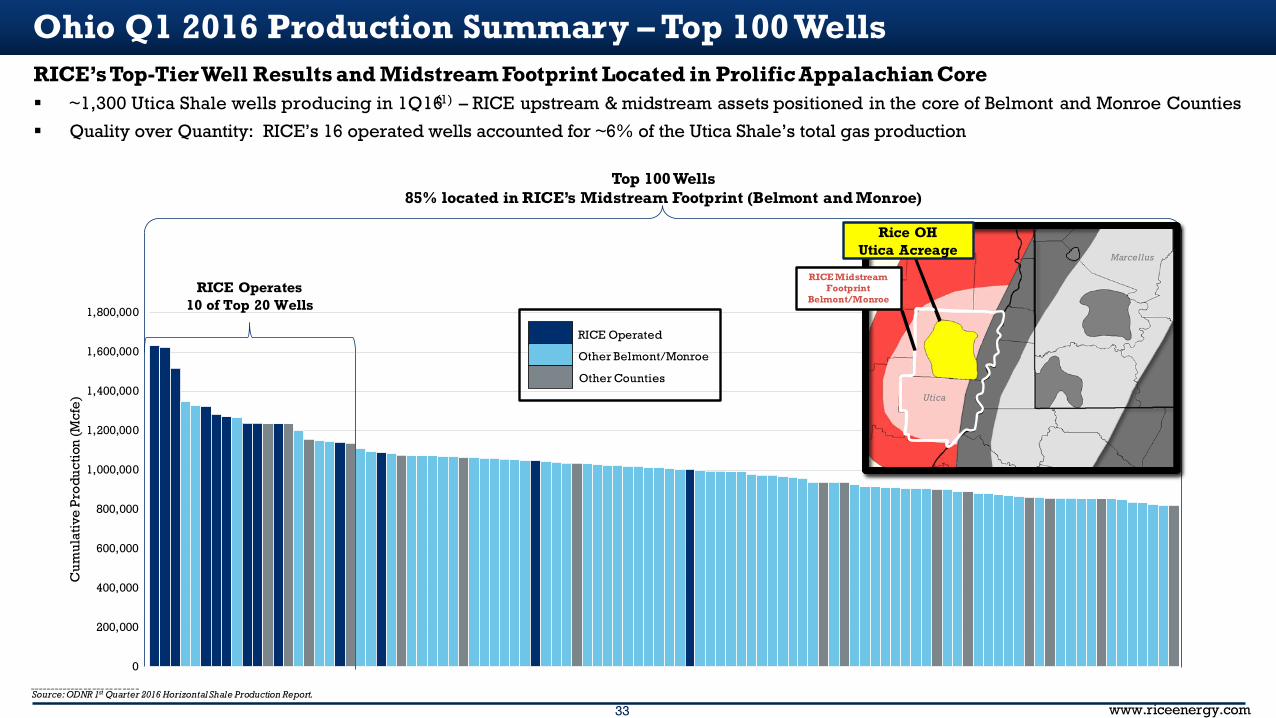
Ohio Q1 2016 Production Summary – Top 100 Wells
Top 100 Wells85% located in RICE’s Midstream Footprint (Belmont and Monroe)
RICE’s Top-Tier Well Results and Midstream Footprint Located in Prolific Appalachian Core ~1,300 Utica Shale wells producing in 1Q16(1) – RICE upstream & midstream assets positioned in the core of Belmont and Monroe Counties
Quality over Quantity: RICE’s 16 operated wells accounted for ~6% of the Utica Shale’s total gas production
RICE Operated
Other Belmont/Monroe
Other Counties
__________________________Source: ODNR 1st Quarter 2016 Horizontal Shale Production Report.
RICE Operates 10 of Top 20 Wells
Rice OH Utica Acreage
RICE Midstream Footprint
Belmont/Monroe
Marcellus
Utica
34 www.riceenergy.com
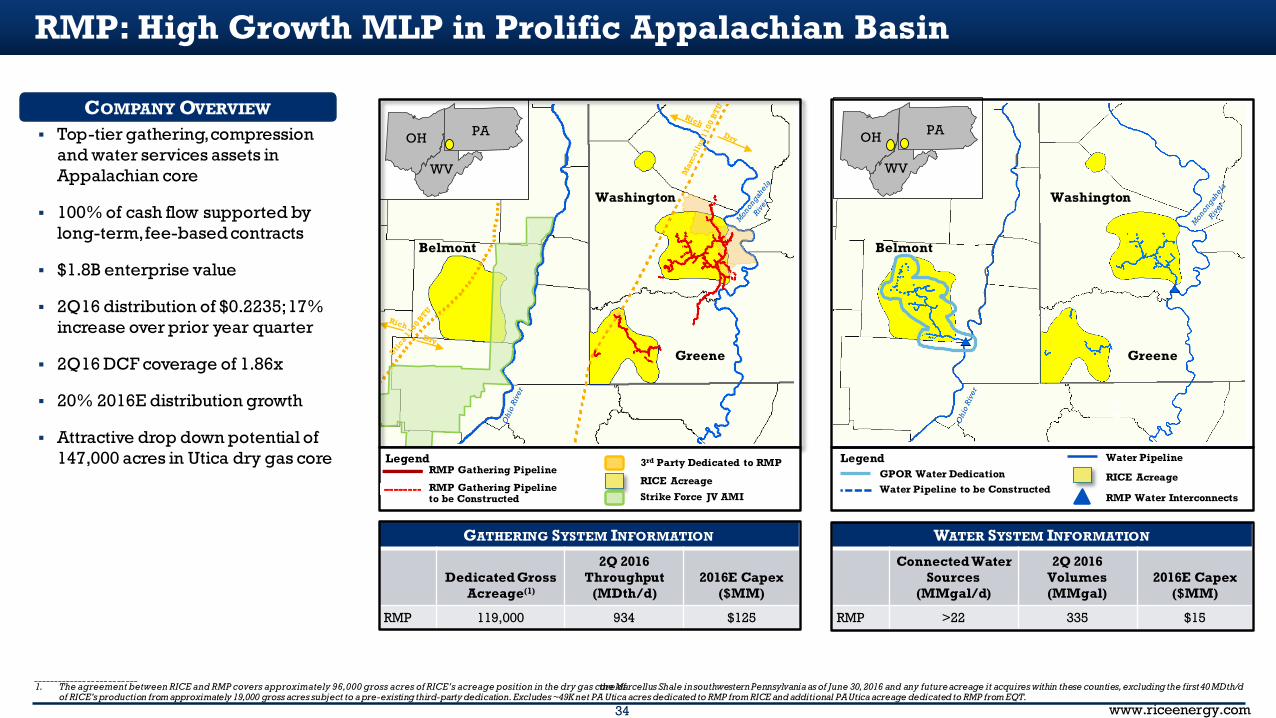
RMP: High Growth MLP in Prolific Appalachian Basin
GATHERING SYSTEM INFORMATION
Dedicated GrossAcreage(1)
2Q 2016 Throughput
(MDth/d)2016E Capex
($MM)
RMP 119,000 934 $125
_________________________1. The agreement between RICE and RMP covers approximately 96,000 gross acres of RICE’s acreage position in the dry gas core of the Marcellus Shale in southwestern Pennsylvania as of June 30, 2016 and any future acreage it acquires within these counties, excluding the first 40 MDth/d
of RICE’s production from approximately 19,000 gross acres subject to a pre-existing third-party dedication. Excludes ~49K net PA Utica acres dedicated to RMP from RICE and additional PA Utica acreage dedicated to RMP from EQT.
WATER SYSTEM INFORMATION
Connected Water Sources
(MMgal/d)
2Q 2016 Volumes (MMgal)
2016E Capex ($MM)
RMP >22 335 $15
COMPANY OVERVIEW
Top-tier gathering, compression and water services assets in Appalachian core
100% of cash flow supported by long-term, fee-based contracts
$1.8B enterprise value
2Q16 distribution of $0.2235; 17% increase over prior year quarter
2Q16 DCF coverage of 1.86x
20% 2016E distribution growth
Attractive drop down potential of 147,000 acres in Utica dry gas core
PA
OH
Greene
Washington
Belmont
WEST VIRGINIA
OH PA
WV
Belmont
Washington
Greene
WEST VIRGINIA
OH PA
WV
CarrollWater Pipeline to be Constructed
RICE AcreageGPOR Water Dedication
Water PipelineLegend
RMP Water InterconnectsBeaver
Legend
RMP Gathering Pipeline to be Constructed
RICE AcreageRMP Gathering Pipeline
3rd Party Dedicated to RMP
Strike Force JV AMI

35 www.riceenergy.com
Integrated Water Services Business
WATER SERVICES OVERVIEW
Delivery systems provide fresh water to support Marcellus and Utica completion operations
– Access to >22 MMgal/d of fresh water in PA and OH
Water services business is complementary to gas gathering and compression services with strong cash operating margins of ~75%
Provides a faster, more efficient and reliable method of water transportation versus trucking
– Reduced emissions, noise, road repairs and safety incidents
RMP also collects, recycles or disposes of flowback and produced water and charges 2% of cost
Volumetric fee structure provides revenue and cash flow stability
WATER SERVICES AGREEMENTS OVERVIEW
Assumptions Pennsylvania Ohio
Fresh Water Usage (MMGal/well)(1) 11 16
Weighted Average Fee(1) $0.059 $0.065
Operating Expense $0.015 $0.015
Cash Flow per Well $484,000 $800,000
17666
269
154
18
115
463
335
0
100
200
300
400
500
1Q16 2Q16
MM
gal
PA OH 3rd Party
__________________________1. Affiliate and third party weighted average based on 10% total third party water volumes.
36 www.riceenergy.com
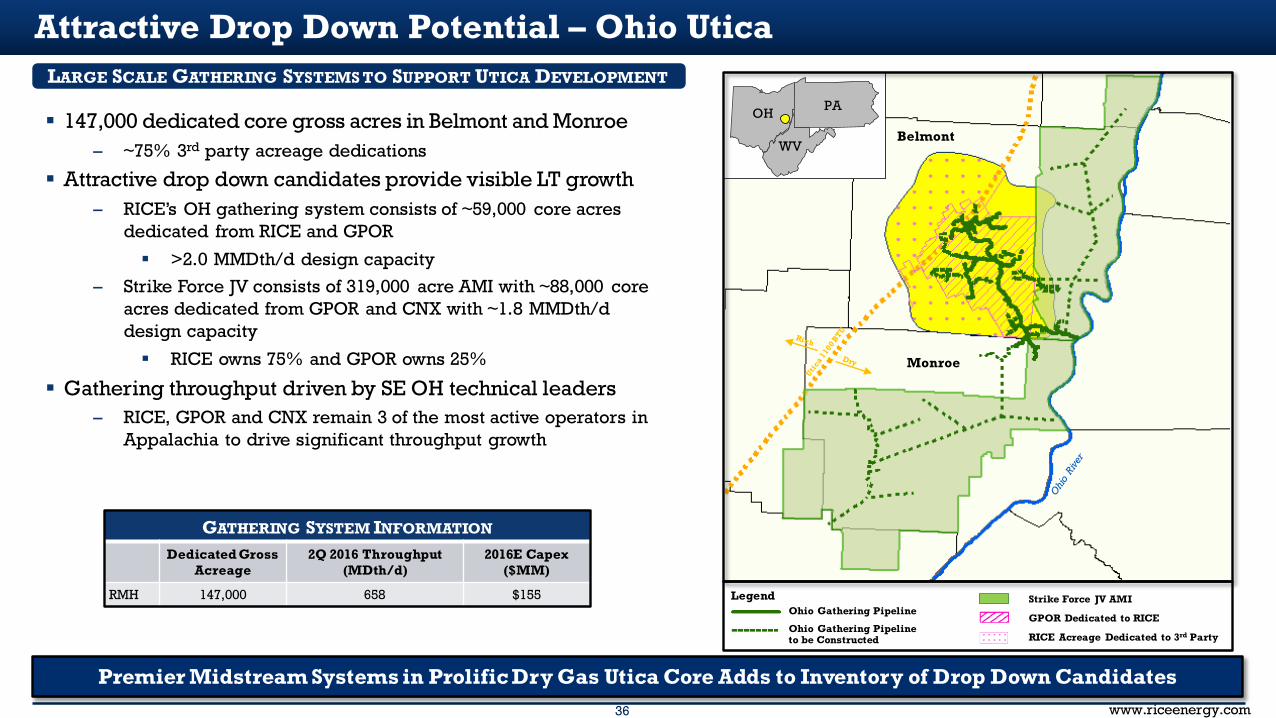
Attractive Drop Down Potential – Ohio Utica
Premier Midstream Systems in Prolific Dry Gas Utica Core Adds to Inventory of Drop Down Candidates
OH PA
WV
LegendOhio Gathering Pipeline
Ohio Gathering Pipeline to be Constructed
GPOR Dedicated to RICE
RICE Acreage Dedicated to 3rd Party
Strike Force JV AMI
147,000 dedicated core gross acres in Belmont and Monroe– ~75% 3rd party acreage dedications
Attractive drop down candidates provide visible LT growth– RICE’s OH gathering system consists of ~59,000 core acres
dedicated from RICE and GPOR
>2.0 MMDth/d design capacity– Strike Force JV consists of 319,000 acre AMI with ~88,000 core
acres dedicated from GPOR and CNX with ~1.8 MMDth/d design capacity
RICE owns 75% and GPOR owns 25%
Gathering throughput driven by SE OH technical leaders– RICE, GPOR and CNX remain 3 of the most active operators in
Appalachia to drive significant throughput growth
LARGE SCALE GATHERING SYSTEMS TO SUPPORT UTICA DEVELOPMENT
GATHERING SYSTEM INFORMATION
Dedicated GrossAcreage
2Q 2016 Throughput (MDth/d)
2016E Capex ($MM)
RMH 147,000 658 $155
Belmont
Monroe

37 www.riceenergy.com
$425
$1,260 $580
$950
–
$630
$1,005
$2,840
–
$500
$1,000
$1,500
$2,000
$2,500
$3,000
2016E 2018E
RMH Current and Future Value
OH Midstream LP Units IDRs
Significant Unrealized Midstream Value Embedded Within RICE
__________________________1. Includes ~$450 million RMP IPO, $200 million water services business drop down and $375 million preferred equity investment by EIG.2. Current unit price as of 9/1/16 close. Estimated 2018 unit price based on 2018 estimated distribution (assuming 20% distribut ion growth) assuming current yield held flat.3. RMH owns 33% of RMP LP units outstanding and 91.75% of IDRs
Track record of crystallizing midstream value Significant value creation on the horizon ~$1B of midstream monetizations and financings executed to date (1)
Growth in value driven by RICE and GPOR, two of the lowest cost gas
operators with clean balance sheets, hedges and FT to execute plan
$MM ($ in millions) 2016E 2018E
IDRsCash Flow – $23Multiple 30.0x 30.0xOwnership 91.75% 91.75%Value – $630
LP UnitsUnit Price(2) $22.13 $32.84Current Yield 4.0% 4.0%Units Held(3) 26.4 26.4Distributions thru 2018 – $80Value $580 $950
OH Midstream (Incl Strike Force JV)EBITDA $40-$45 $120-$160Hypothetical Multiple 8x-12x 8x-10xValue $425 $1,260
Total RMH Value $1,005 $2,840

38 www.riceenergy.com
$22 $24 $29 $35 $42 $50 – $1
$5
$20
$40
$65
$22 $25 $34
$55
$82
$115
$0
$25
$50
$75
$100
$125
2015 2016 2017 2018 2019 2020
LP Distributions IDR Distributions
RICE’s best-in-class E&P development plus a growing 3rd party midstream business positions RMP for top-tier distribution growth RMP’s low -risk growth begins to generate IDR cash flows to RICE in 2016, which could reach $65MM in the next 5 years
GP Holdings Value Driven through the Drill-Bit
Pennsylvania Dry Gas Gathering System Dedication from RICE, EQT and other producers for Marcellus development in Washington and Greene Counties, PA
Ohio Dry Gas Gathering System Dedication covering RICE and GPOR’s Utica acreage in central Belmont County, OH
Pennsylvania & Ohio Water Services Business Dedication from RICE and GPOR for Marcellus and Utica water services in PA and OH
Strike Force JV Dedication covering GPOR Utica acreage in eastern OH
RMP IPO Dec. 2014
Sold to RMP for $200 million
Drop Down Candidate
Drop Down Candidate
IDR and LP Distribution Potential ($MM)(1)
Highly Productive, Economically Resilient E&P Assets Support RMP’s 20% Annual Distribution Growth Target
__________________________1. Assumes 20% distribution growth and units outstanding remain flat. Amounts reflect distributions net to RICE.

39 www.riceenergy.com
Pennsylvania Ohio
Gathering and Compression Statistics Gathering and Compression Statistics
Design Gathering Capacity (MMDth/d) > 4.0 Design Gathering Capacity (MMDth/d) > 2.0
YE15 YE16 YE15 YE16Gas Gathering Pipeline Mileage (miles) 113 128 OH Gas Gathering Pipeline Mileage (miles) 54 65
Strike Force Gas Gathering Pipeline Mileage (miles) 7 29
Acreage Dedications Acreage DedicationsRICE(1) 96,000 RICE 39,0003rd Party 23,000 3rd Party 108,000
Total Acreage Dedications 119,000 Total Acreage Dedications 147,000
Strike Force AMI Acreage 319,000
Midstream Fees Paid by RICE to RMP ($/Dth) (2) Midstream Fees Paid by RICE to RMH ($/Dth) (2)
Gathering $0.30 Gathering $0.30Compression (per stage of compression) $0.07 Compression (per stage of compression) $0.07
3rd Party Midstream Fees ($/Dth) 3rd Party Midstream Fees ($/Dth)Gathering (3) $0.42 Gathering undisclosedCompression varies Compression undisclosed
Water Distribution System Statistics Water Distribution System StatisticsConnected Water Sources (MMGPD) >8.0 Connected Water Sources (MMGPD) >14.0Water Services Fee Paid by RICE ($/gallon)(4) $0.06 Water Services Fee Paid by RICE ($/gallon)(4) $0.07
Midstream System Statistics
__________________________1. The agreement between RICE and RMP covers approximately 96,000 gross acres of the RICE’s acreage position in the dry gas coreof the Marcellus Shale in southwestern Pennsylvania as of June 30, 2016 and any future acreage it acquires within these counties, excluding the first 40
MDth/d of RICE’s production from approximately 19,000 gross acres subject to a pre-existing third-party dedication.2. Fees will be annually escalated based upon changes in the Consumer Price Index. Compression fees are derived on a per stage basis.3. Certain of RMP’s third-party contracts provided for an increase in the gathering fee RMP will receive upon completion of construction of an 18-mile, 30 inch pipeline connecting its gathering system to TETCO, which was completed in November 2014. Represents weighted average
based on historical throughput.4. Assumes fee of $0.06 per gallon in Pennsylvania and 11,000,000 gallons of water per well that utilize the fresh water deliver y system based on a 7,000’ lateral. Assumes fee of $0.07 per gallon in Ohio and 16,900,000 gallons of water per well that utilize the fresh water delivery system
based on a 9,000’ lateral.
RMP Assets

40 www.riceenergy.com
Non-GAAP Financial Measures
Adjusted EBITDAX and Further Adjusted EBITDAXAdjusted EBITDAX and Further Adjusted EBITDAX are supplemental non-GAAP financial measures that are used by management and external users of RICE’s consolidated financial statements, such as industry analysts, investors, lenders and rating agencies. RICE defines Adjusted EBITDAX as net income (loss) before non-controlling interest; interest expense; income taxes; depreciation, depletion and amortization; amortization of deferred financing costs; amortization of intangible assets; derivative fair value (gain) loss, excluding net cash receipts on settled derivative instruments; non-cash stock compensation expense; non-cash incentive unit expense; exploration expenses; and other non-recurring items. RICE defines Further Adjusted EBIDAX as Adjusted EBIDAX after non-controlling interest and water revenue adjustment. Neither Adjusted EBITDAX nor Further Adjusted EBITDAX is a measure of net income as determined by United States generally accepted accounting principles, or GAAP.Management believes Adjusted EBITDAX is useful because it allows them to more effectively evaluate RICE’s operating performance and compare the results of RICE’s operations from period to period and against its peers without regard to its financing methods or capital structure. RICE excludes the items listed above from net income (loss) in arriving at Adjusted EBITDAX because these amounts can vary substantially from company to company within the industry depending upon accounting methods and book values of assets, capital structures and the method by which the assets were acquired. Management believes Further Adjusted EBITDAX is useful because it allows them to assess the level of consolidated leverage of the company and compare this level to peers. The adjustments made to Adjusted EBITDAX to calculate Further Adjusted EBITDAX address the intercompany eliminations of items impacting Adjusted EBITDAX as a result of the consolidation of RMP, the outstanding indebtedness of which is consolidated with that of the company without regard to non-controlling interest. These adjustments include the addition of non-controlling interest as well as a water revenue adjustment attributable to charges for fresh water delivery services and produced water hauling services provided by RMP to the company, a charge that generates revenue for RMP but does not have a corresponding expense at the company level, as such costs are capitalized. Adjusted EBITDAX and Further Adjusted EBITDAX should not be considered as alternatives to, or more meaningful than, net income as determined in accordance with GAAP or as indicators of RICE’s operating performance or liquidity. Certain items excluded from Adjusted EBITDAX and Further Adjusted EBITDAX are significant components in understanding and assessing a company’s financial performance, such as a company’s cost of capital and tax structure, as well as the historic costs of depreciable assets, none of which are components of Adjusted EBITDAX or Further Adjusted EBITDAX. RICE’s computations of Adjusted EBITDAX and Further Adjusted EBITDAX may not be comparable to other similarly titled measures of other companies. RICE believes that these measures are a widely followed measures of operating performance used by investors.
Adjusted EBITDA, Distributable Cash Flow and DCF Coverage RatioAdjusted EBITDA is a supplemental non-GAAP financial measure that is used by management and external users of our consolidated financial statements, such as securities analysts, investors and lenders. We define Adjusted EBITDA as net income (loss) before interest expense, depreciation expense, amortization expense, non-cash stock compensation expense, amortization of deferred financing costs and other non-recurring items. Adjusted EBITDA is not a measure of net income as determined by GAAP.Distributable cash flow and DCF coverage ratio are supplemental non-GAAP financial measures that are used by management and external users of our consolidated financial statements, such as securities analysts, investors and lenders. We define distributable cash flow as Adjusted EBITDA less cash interest expense, and estimated maintenance capital expenditures. We define DCF coverage ratio as distributable cash flow divided by total distributions declared. Distributable cash flow does not reflect changes in working capital balances and is not a presentation made in accordance with GAAP.Adjusted EBITDA, distributable cash flow and DCF coverage ratio are non-GAAP supplemental financial measures that management and external users of our consolidated financial statements, such as industry analysts, investors, lenders and rating agencies, may use to assess the financial performance of our assets, without regard to financing methods, capital structure or historical cost basis; our operating performance and return on capital as compared to other companies in the midstream energy sector, without regard to historical cost basis or, in the case of Adjusted EBITDA, financing or capital structure; our ability to incur and service debt and fund capital expenditures; the ability of our assets to generate sufficient cash flow to make distributions to our unitholders; and the viability of acquisitions and other capital expenditure projects and the returns on investment of various investment opportunities.We believe that the presentation of Adjusted EBITDA, distributable cash flow and DCF coverage ratio will provide useful information to investors in assessing our financial condition and results of operations. The GAAP measures most directly comparable to Adjusted EBITDA and distributable cash flow are net income and net cash provided by (used in) operating activities. Our non-GAAP financial measures of Adjusted EBITDA and distributable cash flow should not be considered as an alternative to GAAP net income or net cash provided by operating activities. Each of Adjusted EBITDA and distributable cash flow has important limitations as an analytical tool because it excludes some but not all items that affect net income and net cash provided by operating activities. You should not consider Adjusted EBITDA, distributable cash flow or DCF coverage ratio in isolation or as a substitute for analysis of our results as reported under GAAP. Because Adjusted EBITDA and distributable cash flow and DCF coverage ratio may be defined differently by other companies in our industry, our definitions of Adjusted EBITDA, distributable cash flow and DCF coverage ratio may not be comparable to similarly titled measures of other companies, thereby diminishing its utility.We have not provided projected net income or net cash provided by operating activities or reconciliations of its projected Adjusted EBITDA and projected distributable cash flow to projected net income and projected net cash provided by operating activities, respectively, the most comparable financial measures calculated in accordance with GAAP. We are unable to project net cash provided by operating activities because this metric includes the impact of changes in operating assets and liabilities related to the timing of cash receipts and disbursements that may not relate to the period in which the operating activities occurred. We are unable to project these timing differences with any reasonable degree of accuracy to a specific day, three or more months in advance. Therefore, we are unable to provide projected net cash provided by operating activities, or the related reconciliation of projected distributable cash flow to projected net cash provided by operating activities. In addition, we are unable to project net income because this metric includes the impact of certain non-cash items such as depreciation expense that we are unable to project with any reasonable degree of accuracy without unreasonable effort. Therefore, we are unable to provide projected net income, or the related reconciliation of projected Adjusted EBITDA to projected net income.Further, we do not provide guidance with respect to the intra-year timing of our capital spending, which impact debt and equity and equity earnings, among other items, that are reconciling items between Adjusted EBITDA and net income. The timing of capital expenditures is volatile as it depends on weather, regulatory approvals, contractor availability, system performance and various other items. We provide a range for the forecasts of Adjusted EBITDA and distributable cash flow to allow for the variability in the timing of spending and the impact on the related reconciling items, many of which interplay with each other. Therefore, the reconciliation of Adjusted EBITDA to projected net income is not available without unreasonable effort.

41 www.riceenergy.com
RICE 2Q 2016 Adjusted EBITDAX Reconciliation
__________________________Note: See slide 40 for important disclosures regarding non-GAAP financial measures.1. The adjustments for the derivative fair value (gains) losses and net cash receipts on settled commodity derivative instruments have the effect of adjusting net income (loss) for changes in the fair value of derivative instruments, which are recognized at the end of each accounting period
because we do not designate commodity derivative instruments as accounting hedges. This results in reflecting commodity derivative gains and losses within Adjusted EBITDAX on a cash basis during the period the derivatives settled.
Three Months Ended($ in thousands) June 30, 2016
Adjusted EBITDAX reconciliation to net income (loss):Net loss ($138,709)Interest expense 24,802Depreciation, depletion and amortization 84,752Amortization of deferred financing costs 1,618Amortization of intangible assets 403Acquisition expense 84
Loss on derivative instruments(1) 201,555Net cash receipts on settled derivative instruments(1)
67,393
Non-cash stock compensation expense 6,232
Non-cash incentive unit expense 14,840Income tax benefit (120,496)Exploration expense 5,548Acquisition break up fee (1,939)Other expense 2,593Non-controlling interest (17,977)
Adjusted EBITDAX $130,699
Non-controlling interest 17,977Water revenue adjustment 10,554
Further Adjusted EBITDAX $159,230

42 www.riceenergy.com
RMP 2Q 2016 Adjusted EBITDA and DCF Reconciliation
__________________________Note: See slide 40 for important disclosures regarding non-GAAP financial measures.
Three Months Ended($ in thousands) June 30, 2016Reconciliation of Net Income to Adjusted EBITDA and DCF:Net income $27,936
Interest expense 920Depreciation expense 6,855Amortization of intangible assets 403Non-cash equity compensation expense 1,134Amortization of deferred financing costs 144Other income 361
Adjusted EBITDA $37,753
Cash interest expense (920) Estimated maintenance capital expenditures (2,800)
Distributable cash flow $34,033
Total distributions declared $18,254DCF coverage ratio 1.86x
Reconciliation of Adjusted EBITDA to Cash:Adjusted EBITDA $37,753
Interest expense (920) Other income (361) Changes in operating assets and liabilities 1,757
Net cash provided by operating activities 38,229 Net cash used in investing activities (38,776)Net cash provided by financing activities 6,059Net increase in cash 5,512Cash at the beginning of the period 9,811Cash at the end of the period $15,323

43 www.riceenergy.com
Cautionary StatementsFORWARD-LOOKING STATEMENTS
This presentation and the oral statements made in connection therewith may contain “forward looking statements” within the meaning of Section 27A of the Securities Act of 1933, as amended, and Section 21E of the Securities Exchange Act of 1934, as amended. All statements, other than statements of historical fact, regarding Rice Energy’s strategy, future operations, financial position, estimated revenues and income/losses, projected costs, as amended, prospects, plans and objectives of management are forward-looking statements. These statements often include the words “could,” “believe,” “anticipate,” “may,” “assume,” “forecast,” “position,” “predict,” “strategy,” “expect,” “intend,” “plan,” “estimate,” “project,” “budget,” “potential,” or “continue” and similar expressions intended to identify forward-looking statements, although not all forward-looking statements contain such identifying words. Without limiting the generality of the foregoing, forward-looking statements contained in this presentation specifically include estimates of Rice Energy’s reserves, expectations of plans, strategies, objectives and anticipated financial and operating results of Rice Energy, including as to Rice Energy’s drilling program, production, hedging activities, capital expenditure levels and other guidance included in this presentation. These forward-looking statements are based on Rice Energy’s current expectations and assumptions about future events and are based on currently available information as to the outcome and timing of future events. Rice Energy assumes no obligation to and does not intend to update any forward looking statements included herein. You are cautioned not to place undue reliance on any forward-looking statements. Rice Energy cautions you that these forward-looking statements are subject to all of the risks and uncertainties, most of which are difficult to predict and many of which are beyond their control, incident to the exploration for and development, production, gathering and sale of natural gas, natural gas liquids and oil. These risks include, but are not limited to, commodity price volatility; inflation; lack of availability of drilling and production equipment and services; environmental risks; drilling and other operating risks; regulatory changes; the uncertainty inherent in estimating natural gas reserves and in projecting future rates of production, cash flow and access to capital; the timing of development expenditures; risks relating to joint venture operations; and the other risks described under “Risk Factors” in Rice Energy’s most recent Form 10-K, Form 10-Q and other filings with the Securities and Exchange Commission. Should one or more of these risks or uncertainties occur, or should underlying assumptions prove incorrect, Rice Energy’s actual results and plans could differ materially from those expressed in any forward-looking statements.
This presentation has been prepared by Rice Energy and includes market data and other statistical information from sources believed by Rice Energy to be reliable, including independent industry publications, government publications or other published independent sources. Some data are also based on Rice Energy’s good faith estimates, which are derived from its review of internal sources as well as the independent sources described above. Although Rice Energy believes these sources are reliable, it has not independently verified the information and cannot guarantee its accuracy and completeness.
NON-PROVEN OIL AND GAS RESERVES
The SEC permits oil and gas companies, in their filings with the SEC, to disclose proved reserves, which are reserve estimates that geological and engineering data demonstrate with reasonable certainty to be recoverable in future years from known reservoirs under existing economic and operating conditions and certain probable and possible reserves that meet the SEC’s definition for such terms. We may use certain broader terms such as EUR (estimated ultimate recovery of resources), and we may use other descriptions of volumes of potentially recoverable hydrocarbon resources throughout this presentation that the SEC does not permit to be included in SEC filings. These broader classifications do not constitute reserves as defined by the SEC, and we do not attempt to distinguish these classifications from probable or possible reserves as defined by SEC guidelines.
Our estimates of EURs have been prepared by our independent reserve engineers. These estimates are by their nature more speculative than estimates of proved, probable and possible reserves and accordingly are subject to substantially greater risk of being actually realized, particularly in areas or zones where there has been limited or no drilling history. We include these estimates to demonstrate what we believe to be the potential for future drilling and production by the company. Actual locations drilled and quantities that may be ultimately recovered from our properties will differ substantially. In addition, we have made no commitment to drill all of the drilling locations which have been attributed to these quantities. Ultimate recoveries will be dependent upon numerous factors including actual encountered geological conditions, the impact of future oil and gas pricing, exploration and development costs, and our future drilling decisions and budgets based upon our future evaluation of risk, returns and the availability of capital and, in many areas, the outcome of negotiation of drilling arrangements with holders of adjacent or fractional interest leases. Estimates of resource potential and other figures may change significantly as development of our properties provide additional data and therefore actual quantities that may ultimately be recovered will likely differ from these estimates.
Our forecast and expectations for future periods are dependent upon many assumptions, including estimates of production decline rates from existing wells, the undertaking and outcome of future drilling activity and activity that may be affected by significant commodity price declines or drilling cost increases.
Certain of Rice Energy's wells are named after superheroes and monster trucks, some of which may be trademarked. Despite their size and strength, Rice Energy's wells are in no manner affiliated with such superheroes or monster trucks.
Initial production rates are subject to decline over time and should not be regarded as reflective of sustained production levels. In particular, production from horizontal drilling in shale oil and natural gas resource plays and tight natural gas plays that are stimulated with extensive pressure fracturing are typically characterized by significant early declines in production rates.

44 www.riceenergy.com
Determination of Identified Drilling Locations as of December 31, 2015:
Net undeveloped locations are calculated by taking RICE’s total net acreage and multiplying such amount by a risking factor which is then divided by RICE’s expected well spacing. RICE then subtracts net producing wells to arrive at undeveloped net drilling locations.
Undeveloped Net Marcellus Locations – RICE assumes these locations have 7,000 foot laterals and 750 foot spacing between wells which yields approximately 121 acre spacing. In the Marcellus, RICE applies a 20% risking factor to its net acreage to account for inefficient unitization and the risk associated with its inability to force pool in Pennsylvania. As of December 31, 2015, RICE had approximately 92,000 net acres in the Marcellus which results in 487 undeveloped net locations.
Undeveloped Net Ohio Utica Locations – RICE assumes these locations have 9,000 foot laterals and 1,000 foot spacing between wells which yields approximately 207 acre spacing. In the Ohio Utica, RICE applies a 10% risking factor to its net acreage to account for inefficient unitization. As of December 31, 2015, RICE had approximately 56,000 net acres prospective for the Utica in Ohio which results in 215 undeveloped net locations. This excludes ~2,500 net acres in Guernsey and Harrison Counties in Ohio.
Undeveloped Net Pennsylvania Utica Locations – RICE assumes these locations have 8,000 foot laterals and 2,000 foot spacing between wells which yields approximately 367 acre spacing. In the Pennsylvania Utica, RICE applies a 20% risking factor to its net acreage to account for inefficient unitization. As of December 31, 2015, RICE had approximately 49,000 net acres prospective for the Utica in Pennsylvania which results in 105 undeveloped net locations.
Additional Disclosures