barclays capital 2016 ceo energy-power conference
TRANSCRIPT
Barclays Capital 2016
CEO Energy-Power Conference
September 2016
Forward-looking statement
This presentation includes forward-looking statements of Fortis Inc. (“Fortis” or the “Corporation”) and ITC Holdings Corp. (“ITC”) within the meaning ofapplicable securities laws, including the Private Securities Litigation Reform Act of 1995. Forward-looking statements included in this presentationreflect expectations of Fortis and/or ITC management regarding future growth, results of operations, performance, business prospects andopportunities. Wherever possible, words such as “anticipates”, “believes”, “budgets”, “could”, “estimates”, “expects”, “forecasts”, “intends”, “may”,“might”, “plans”, “projects”, “schedule”, “should”, “target”, “will”, “would” and the negative of these terms and other similar terminology or expressionshave been used to identify the forward-looking statements, which include, without limitation: statements related to the acquisition of ITC, the expectedtiming of the transaction and the conditions precedent to the closing of the acquisition, including regulatory approvals and other customary closingconditions; the expectation that Fortis will borrow funds to satisfy its obligation to pay the cash portion of the purchase price; the assumption of ITCdebt, expected maintenance of investment-grade credit ratings and consistent capital structure on closing of the transaction; the combined company’senterprise value, assets, earnings, 2017 forecast mid-year rate base, 2017 forecast capital expenditures, growth potential and future businessprospects and performance; the expectation that the Corporation will have its common shares listed on the New York Stock Exchange; the expectationthat the acquisition of ITC will be accretive to earnings per common share in the first full year following closing; targeted annual dividend growththrough 2020 and the expectation that the acquisition of ITC will support targeted annual dividend growth; the expectation that mid-year rate base willincrease from 2016 to 2020 and the associated compound annual growth rate; the Corporation’s forecast gross consolidated capital expendituresthrough 2020; the nature, timing and expected costs of certain capital projects including, without limitation, the Tilbury liquefied natural gas (“LNG”)facility expansion, Tilbury 1A, the Woodfibre LNG project, renewable programs at UNS Energy, and the Wataynikaneyap project; and the expectedtiming of filing of regulatory applications and receipt and outcome of regulatory decisions.
2
Forward-looking statements involve significant risk, uncertainties and assumptions. Certain material factors or assumptions have been applied indrawing the conclusions contained in the forward-looking statements. These factors or assumptions are subject to inherent risks and uncertaintiessurrounding future expectations generally, including those identified from time-to-time in the forward-looking statements. Such risk factors orassumptions include, but are not limited to, risks relating to the ability to obtain regulatory approvals in connection with the acquisition and the timingand terms thereof, risks relating to failure to complete the acquisition and the timing thereof and the risk that conditions to the acquisition may not besatisfied, uncertainty regarding the outcome of regulatory proceedings of the Corporation’s utilities, risk associated with the impact of less favorableeconomic conditions on the Corporation’s results of operations, currency exchange rates and resolution of pending litigation matters. Fortis and ITCcaution readers that a number of factors could cause actual results, performance or achievements to differ materially from the results discussed orimplied in the forward-looking statements. These factors should be considered carefully and undue reliance should not be placed on theforward-looking statements. For additional information with respect to certain of these risks or factors, reference should be made to the continuousdisclosure materials filed from time to time by Fortis or ITC with Canadian securities regulatory authorities and the Securities and ExchangeCommission as applicable. Fortis and ITC disclaim any intention or obligation to update or revise any forward-looking statements, whether as a resultof new information, future events or otherwise.
Unless otherwise specified, all information relating to Fortis does not give effect to the merger of ITC.
Unless otherwise specified, all financial information referenced is in Canadian dollars.

Regulated Gas Regulated Electric Non-Regulated Energy Infrastructure
ABBC
ON
NY
PEINL
AZ
Turks and Caicos
Islands
Grand CaymanBelize
Operations
Ticker Symbol FTS(TSX)
(1) Includes 100% of the Waneta Hydroelectric Expansion of which Fortis has a 51% controlling ownership interest. Midyear Rate Base converted at a USD/CAD exchange rate of 1.32.
A leader in North American utility operations
3
Based in St. John’s, NL
Utility
Operations
9
2.0 million 1.2 million
Total Assets
(June 30, 2016)
$28.6 billion
Revenue
(Fiscal 2015)
$6.7 billion2016 Forecast Midyear
Rate Base
$17.3 billion(1)
Market Cap
(as of August 31, 2016)
$11.7 billion
Gas Utility Customers
ElectricUtility Customers
Transmission and
Distribution Company

Our strategic focus delivers results
StrategyLeverage the operating model, footprint of our utilities, operating expertise,
reputation and financial strength to develop growth opportunities
4
Dividend Growth Target:
6% Average Annual
Growth Through 2020
Investment-Grade
Credit Ratings
Strategic Initiatives
Target
Additional
Energy
Infrastructure
Increase
Renewables
Enhance
Customer &
Regulatory
Relationships
Unlock LNG
Value
Utility
AcquisitionsExecute
Utility
CAPEX Plan
5
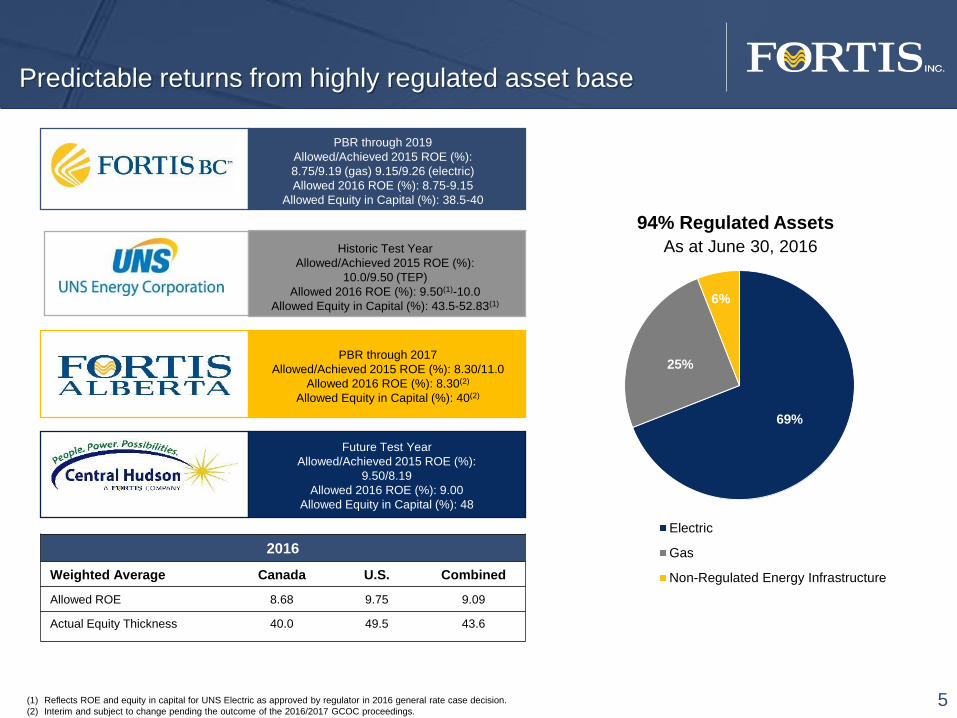
Predictable returns from highly regulated asset base
PBR through 2019
Allowed/Achieved 2015 ROE (%):
8.75/9.19 (gas) 9.15/9.26 (electric)
Allowed 2016 ROE (%): 8.75-9.15
Allowed Equity in Capital (%): 38.5-40
PBR through 2017
Allowed/Achieved 2015 ROE (%): 8.30/11.0
Allowed 2016 ROE (%): 8.30(2)
Allowed Equity in Capital (%): 40(2)
Future Test Year
Allowed/Achieved 2015 ROE (%): 8.80/8.98
Allowed 2016 ROE (%): 8.50
Equity in Capital (%): 45
Future Test Year
Allowed/Achieved 2015 ROE (%):
9.50/8.19
Allowed 2016 ROE (%): 9.00
Allowed Equity in Capital (%): 48
Historic Test Year
Allowed/Achieved 2015 ROE (%):
10.0/9.50 (TEP)
Allowed 2016 ROE (%): 9.50(1)-10.0
Allowed Equity in Capital (%): 43.5-52.83(1)
(1) Reflects ROE and equity in capital for UNS Electric as approved by regulator in 2016 general rate case decision.
(2) Interim and subject to change pending the outcome of the 2016/2017 GCOC proceedings.
69%
25%
6%
Electric
Gas
Non-Regulated Energy Infrastructure
As at June 30, 2016
94% Regulated Assets
2016
Weighted Average Canada U.S. Combined
Allowed ROE 8.68 9.75 9.09
Actual Equity Thickness 40.0 49.5 43.6
6
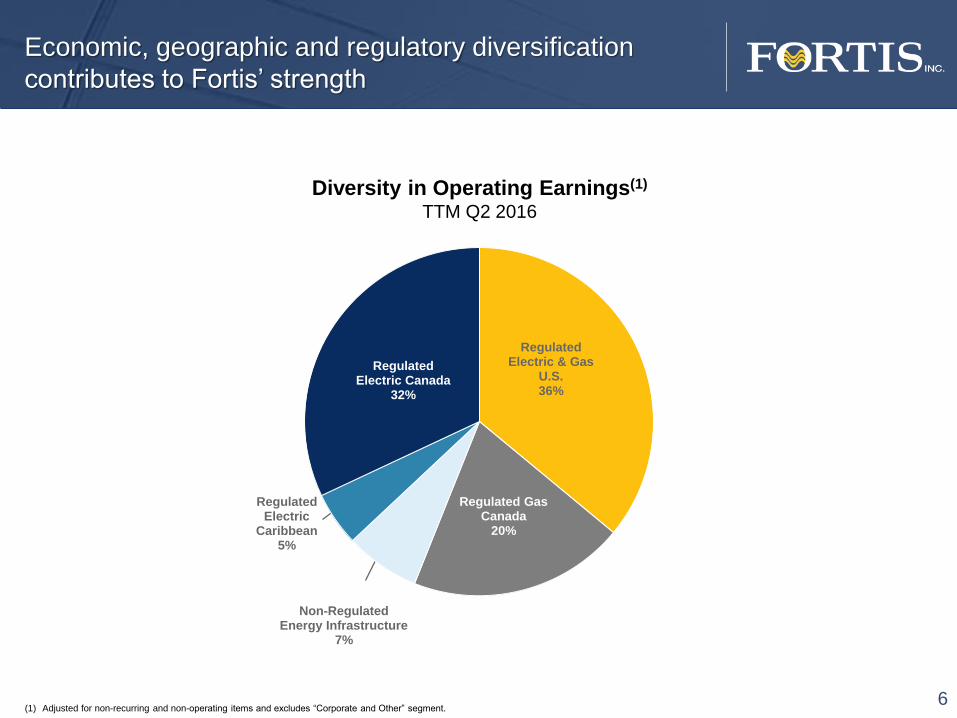
Regulated Electric & Gas
U.S.36%
Regulated Gas Canada
20%
Non-Regulated Energy Infrastructure
7%
Regulated Electric
Caribbean5%
Regulated Electric Canada
32%
(1) Adjusted for non-recurring and non-operating items and excludes “Corporate and Other” segment.
Diversity in Operating Earnings(1)
TTM Q2 2016
Economic, geographic and regulatory diversification
contributes to Fortis’ strength

7
$2.11Adjusted EPS(2)
21%
$589M 50% Adjusted earnings(1)
• Focus on core utility business with sale of
non-core assets
• Successful integration of UNS Energy
• Introduction of dividend guidance and two
dividend increases
• Successful execution of $2.2 billion capital
plan; largest annual plan to date and
completion of Waneta Hydroelectric
Expansion project
• Continued pursuit of opportunities in
existing franchise areas, including LNG
and Aitken Creek
2015: Transformative year
$1.7BCFFO(3)
70%
(1) Earnings adjusted for non-recurring and non-operating items.
(2) Basic earnings per common share adjusted for non-recurring and non-operating items.
(3) Cash flow from operations.
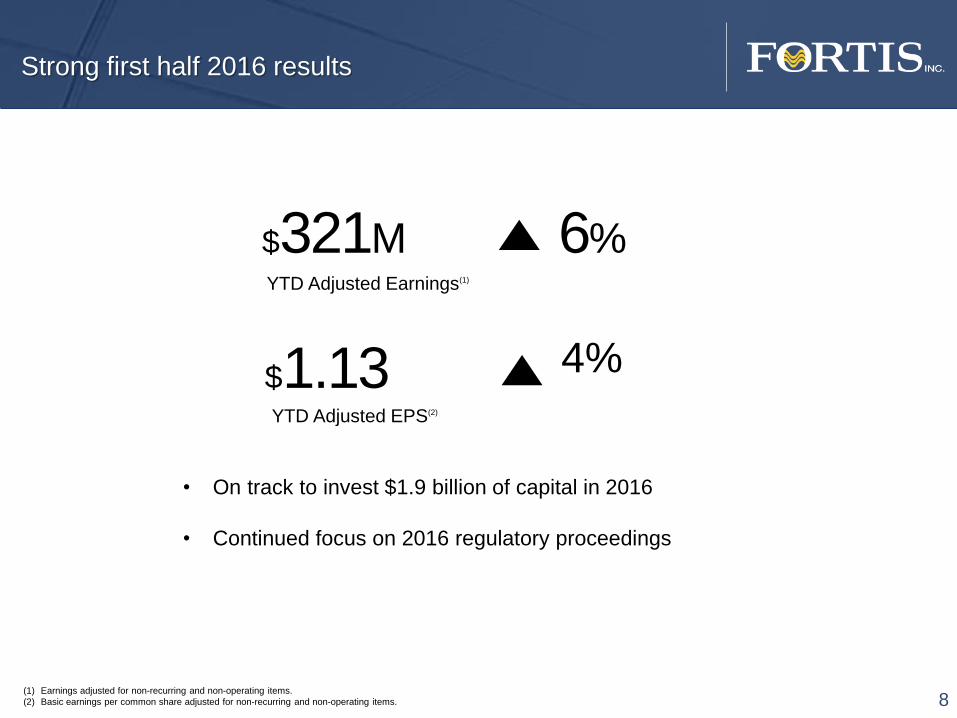
Strong first half 2016 results
8
$1.13YTD Adjusted EPS(2)
4%
$321M 6% YTD Adjusted Earnings(1)
• On track to invest $1.9 billion of capital in 2016
• Continued focus on 2016 regulatory proceedings
(1) Earnings adjusted for non-recurring and non-operating items.
(2) Basic earnings per common share adjusted for non-recurring and non-operating items.
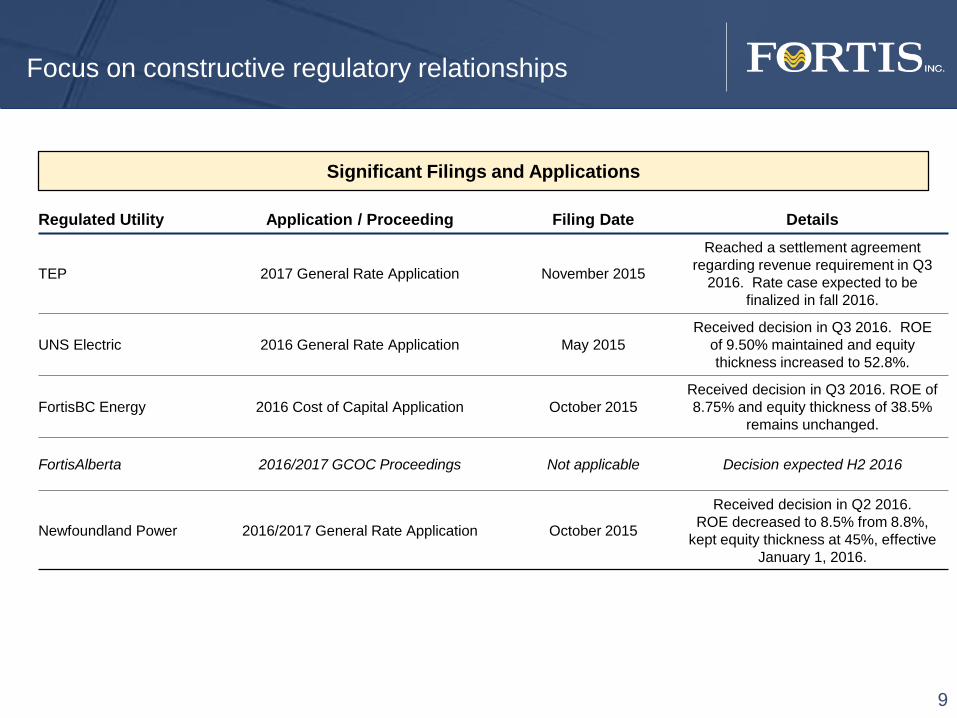
Focus on constructive regulatory relationships
9
Regulated Utility Application / Proceeding Filing Date Details
TEP 2017 General Rate Application November 2015
Reached a settlement agreement
regarding revenue requirement in Q3
2016. Rate case expected to be
finalized in fall 2016.
UNS Electric 2016 General Rate Application May 2015
Received decision in Q3 2016. ROE
of 9.50% maintained and equity
thickness increased to 52.8%.
FortisBC Energy 2016 Cost of Capital Application October 2015
Received decision in Q3 2016. ROE of
8.75% and equity thickness of 38.5%
remains unchanged.
FortisAlberta 2016/2017 GCOC Proceedings Not applicable Decision expected H2 2016
Newfoundland Power 2016/2017 General Rate Application October 2015
Received decision in Q2 2016.
ROE decreased to 8.5% from 8.8%,
kept equity thickness at 45%, effective
January 1, 2016.
Significant Filings and Applications
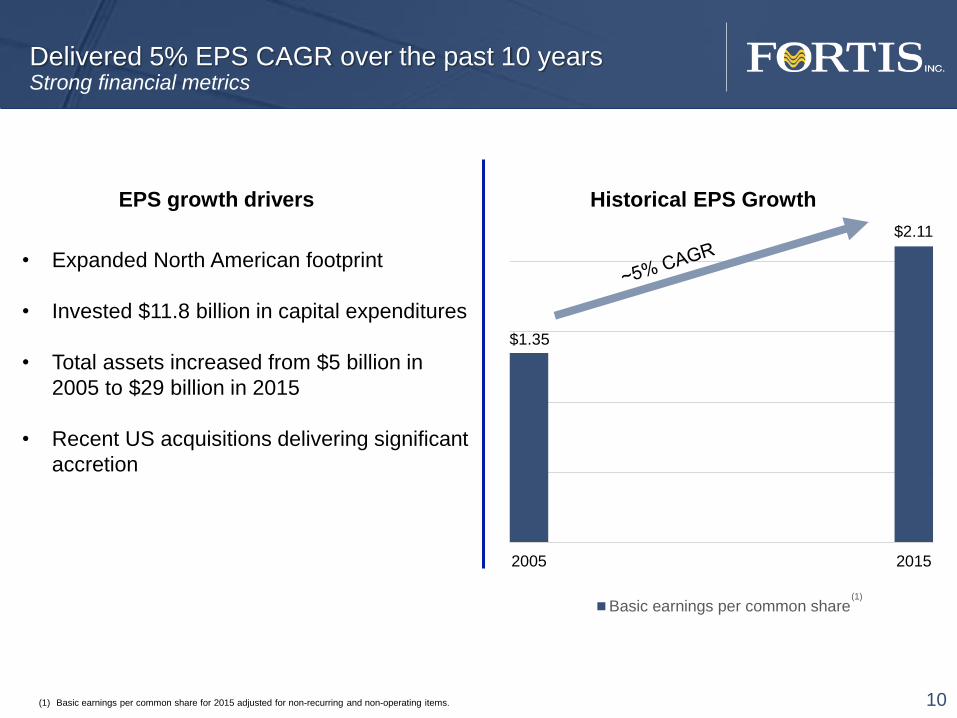
Delivered 5% EPS CAGR over the past 10 yearsStrong financial metrics
10
2005 2015
Basic earnings per common share(1)
$1.35
$2.11
• Expanded North American footprint
• Invested $11.8 billion in capital expenditures
• Total assets increased from $5 billion in
2005 to $29 billion in 2015
• Recent US acquisitions delivering significant
accretion
EPS growth drivers
(1) Basic earnings per common share for 2015 adjusted for non-recurring and non-operating items.
Historical EPS Growth
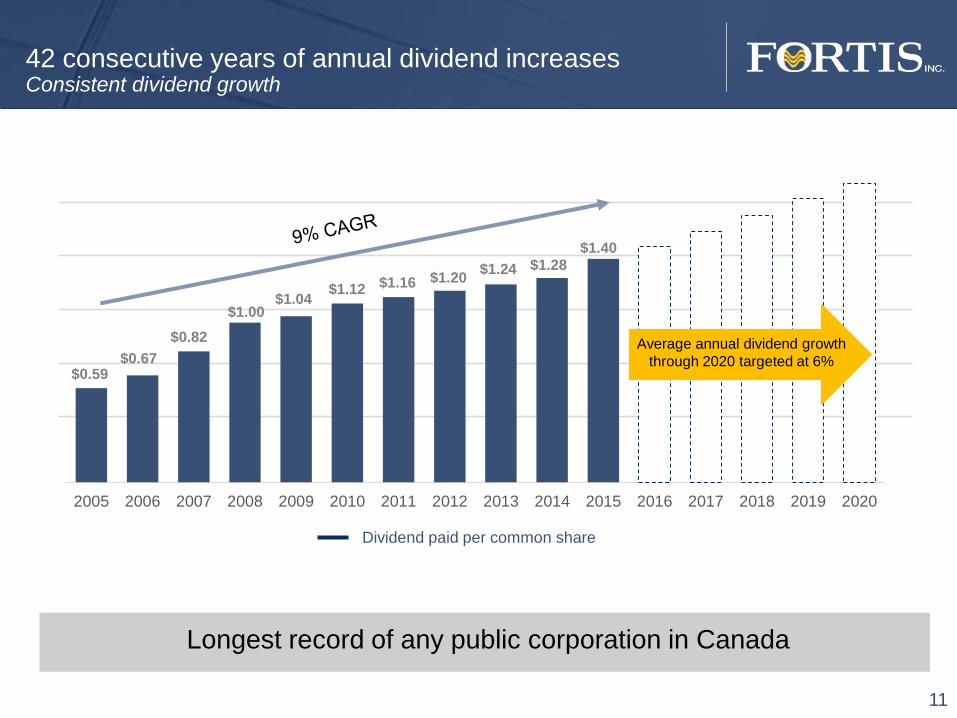
42 consecutive years of annual dividend increasesConsistent dividend growth
11
2005 2006 2007 2008 2009 2010 2011 2012 2013 2014 2015 2016 2017 2018 2019 2020
$0.59$0.67
$0.82
$1.00$1.04
$1.12 $1.16 $1.20$1.24 $1.28
$1.40
Dividend paid per common share
Average annual dividend growth
through 2020 targeted at 6%
Longest record of any public corporation in Canada
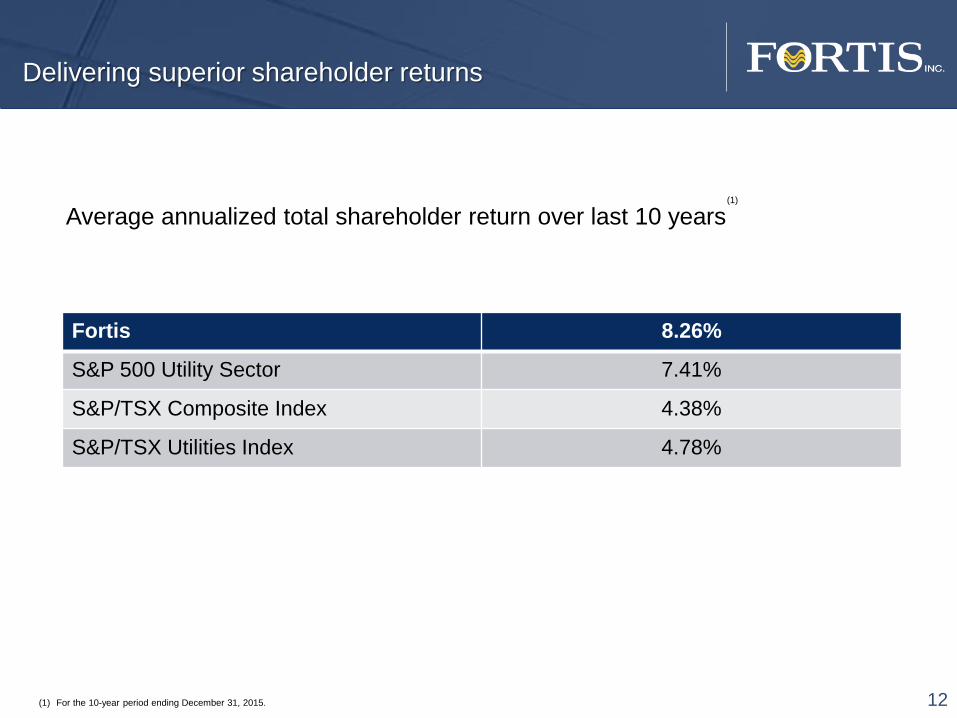
Delivering superior shareholder returns
12
Average annualized total shareholder return over last 10 years
Fortis 8.26%
S&P 500 Utility Sector 7.41%
S&P/TSX Composite Index 4.38%
S&P/TSX Utilities Index 4.78%
(1)
(1) For the 10-year period ending December 31, 2015.
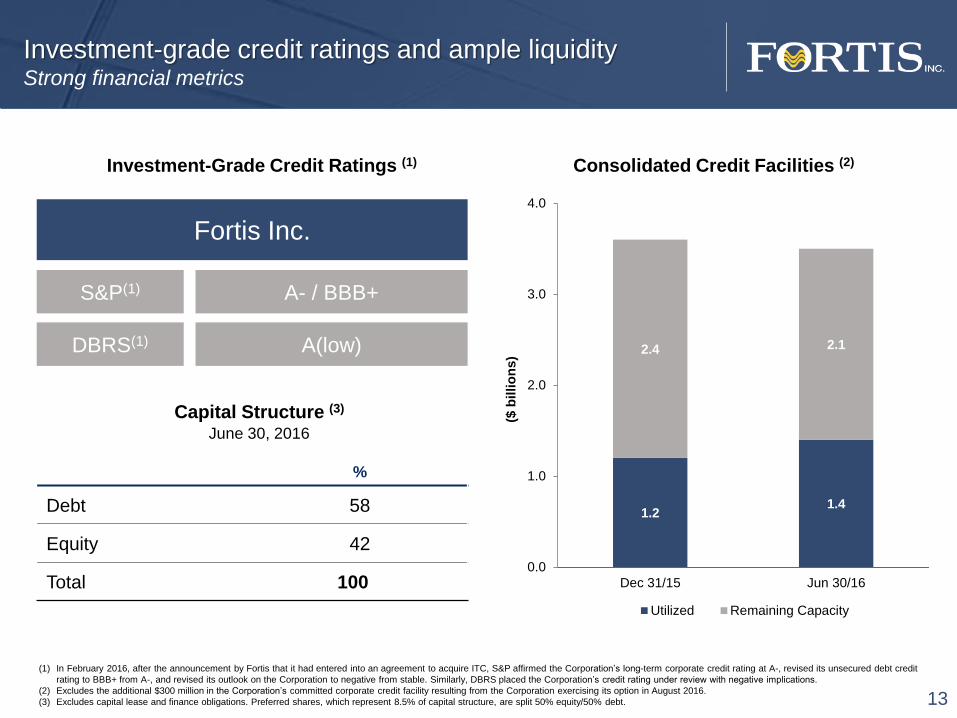
Investment-grade credit ratings and ample liquidityStrong financial metrics
Investment-Grade Credit Ratings (1)
Fortis Inc.
DBRS(1) A(low)
S&P(1) A- / BBB+
Consolidated Credit Facilities (2)
%
Debt 58
Equity 42
Total 100
Capital Structure (3)
June 30, 2016
1.21.4
2.4 2.1
0.0
1.0
2.0
3.0
4.0
Dec 31/15 Jun 30/16
($ b
illio
ns)
Utilized Remaining Capacity
(1) In February 2016, after the announcement by Fortis that it had entered into an agreement to acquire ITC, S&P affirmed the Corporation’s long-term corporate credit rating at A-, revised its unsecured debt credit
rating to BBB+ from A-, and revised its outlook on the Corporation to negative from stable. Similarly, DBRS placed the Corporation’s credit rating under review with negative implications.
(2) Excludes the additional $300 million in the Corporation’s committed corporate credit facility resulting from the Corporation exercising its option in August 2016.
(3) Excludes capital lease and finance obligations. Preferred shares, which represent 8.5% of capital structure, are split 50% equity/50% debt. 13
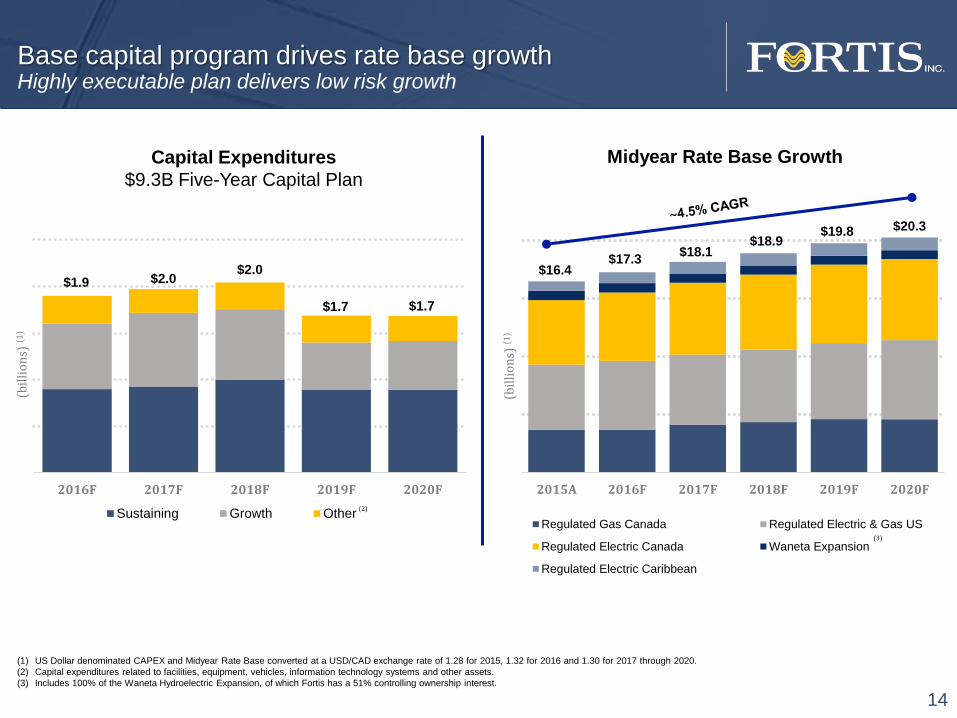
$1.9 $2.0$2.0
$1.7 $1.7
2016F 2017F 2018F 2019F 2020F
Sustaining Growth Other
(bil
lio
ns)
(1)
2015A 2016F 2017F 2018F 2019F 2020F
Regulated Gas Canada Regulated Electric & Gas US
Regulated Electric Canada Waneta Expansion
Regulated Electric Caribbean
(2)
$16.4$17.3
$18.1$18.9
$19.8 $20.3
(1) US Dollar denominated CAPEX and Midyear Rate Base converted at a USD/CAD exchange rate of 1.28 for 2015, 1.32 for 2016 and 1.30 for 2017 through 2020.
(2) Capital expenditures related to facilities, equipment, vehicles, information technology systems and other assets.
(3) Includes 100% of the Waneta Hydroelectric Expansion, of which Fortis has a 51% controlling ownership interest.
Capital Expenditures
$9.3B Five-Year Capital Plan
Midyear Rate Base Growth
(bil
lio
ns)
(1)
(3)
14
Base capital program drives rate base growthHighly executable plan delivers low risk growth
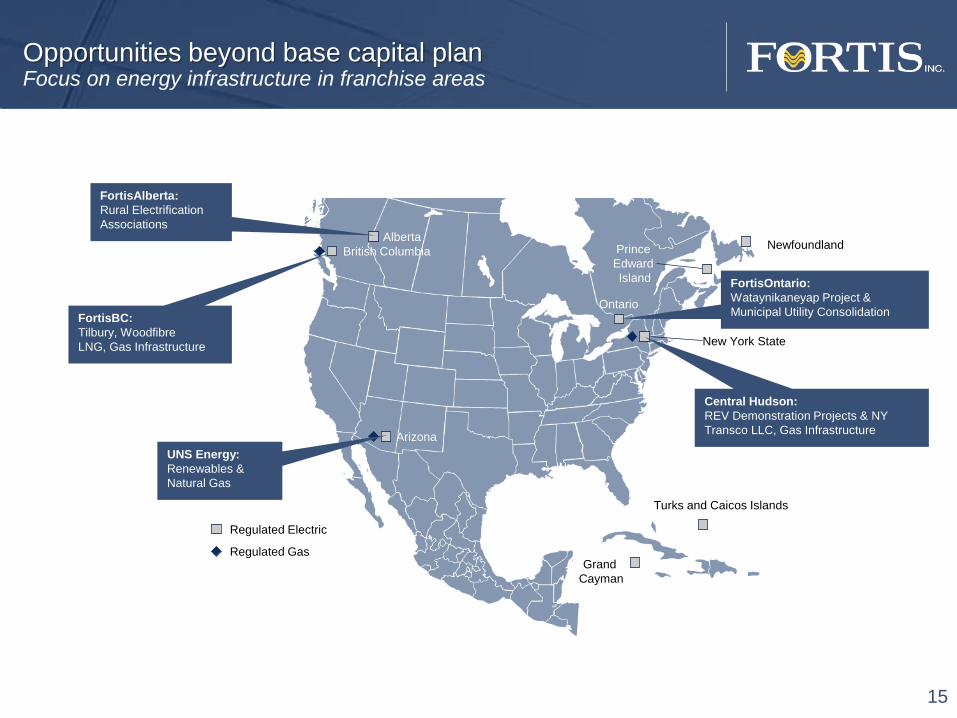
Opportunities beyond base capital plan Focus on energy infrastructure in franchise areas
NewfoundlandPrince
Edward
Island
New York State
Ontario
Arizona
British Columbia
Alberta
Regulated Electric
Regulated Gas
Turks and Caicos Islands
Central Hudson:
REV Demonstration Projects & NY
Transco LLC, Gas Infrastructure
Grand
Cayman
FortisOntario:
Wataynikaneyap Project &
Municipal Utility Consolidation
FortisAlberta:
Rural Electrification
Associations
FortisBC:
Tilbury, Woodfibre
LNG, Gas Infrastructure
UNS Energy:
Renewables &
Natural Gas
15

• Acquisition completed April 1, 2016
• Purchased for US$266 million
• Only underground gas storage facility in British Columbia and is an integral part of Western Canada’s natural gas transmission network
• FortisBC leases one-third of the facility
• Allows opportunities to further expand our gas infrastructure
• Asset is the right fit, operationally and strategically
• Q2 2016 adjusted earnings contribution of $4 million
Aitken Creek an example of our strategy in actionPremier gas storage asset
16
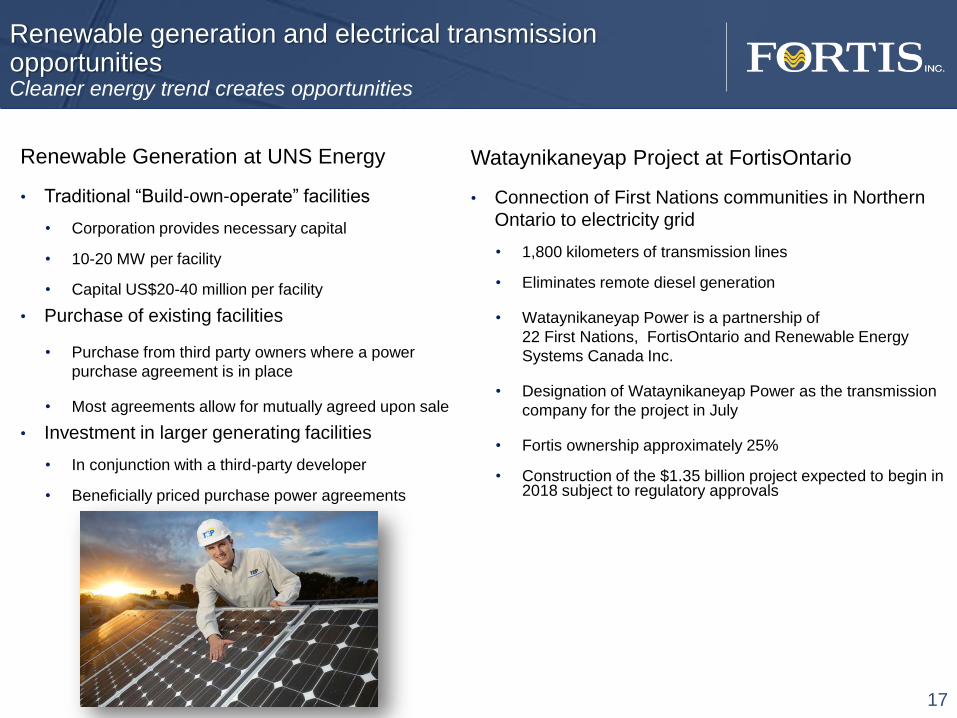
Renewable generation and electrical transmission opportunities Cleaner energy trend creates opportunities
17
Renewable Generation at UNS Energy
• Traditional “Build-own-operate” facilities
• Corporation provides necessary capital
• 10-20 MW per facility
• Capital US$20-40 million per facility
• Purchase of existing facilities
• Purchase from third party owners where a power
purchase agreement is in place
• Most agreements allow for mutually agreed upon sale
• Investment in larger generating facilities
• In conjunction with a third-party developer
• Beneficially priced purchase power agreements
Wataynikaneyap Project at FortisOntario
• Connection of First Nations communities in Northern
Ontario to electricity grid
• 1,800 kilometers of transmission lines
• Eliminates remote diesel generation
• Wataynikaneyap Power is a partnership of
22 First Nations, FortisOntario and Renewable Energy
Systems Canada Inc.
• Designation of Wataynikaneyap Power as the transmission
company for the project in July
• Fortis ownership approximately 25%
• Construction of the $1.35 billion project expected to begin in 2018 subject to regulatory approvals
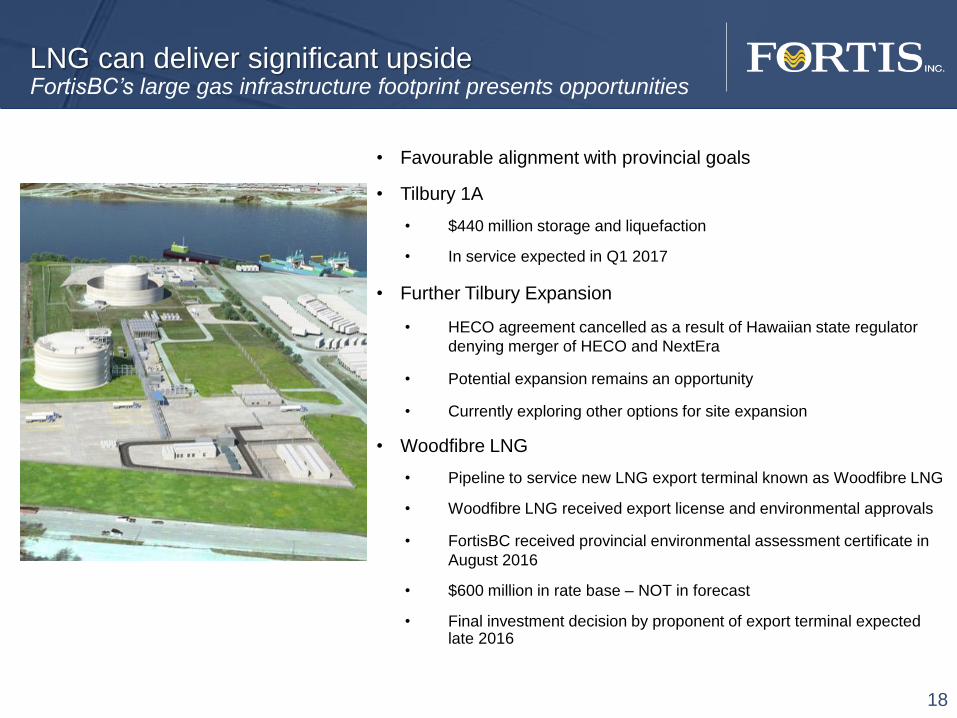
LNG can deliver significant upsideFortisBC’s large gas infrastructure footprint presents opportunities
18
• Favourable alignment with provincial goals
• Tilbury 1A
• $440 million storage and liquefaction
• In service expected in Q1 2017
• Further Tilbury Expansion
• HECO agreement cancelled as a result of Hawaiian state regulator
denying merger of HECO and NextEra
• Potential expansion remains an opportunity
• Currently exploring other options for site expansion
• Woodfibre LNG
• Pipeline to service new LNG export terminal known as Woodfibre LNG
• Woodfibre LNG received export license and environmental approvals
• FortisBC received provincial environmental assessment certificate in
August 2016
• $600 million in rate base – NOT in forecast
• Final investment decision by proponent of export terminal expected late 2016
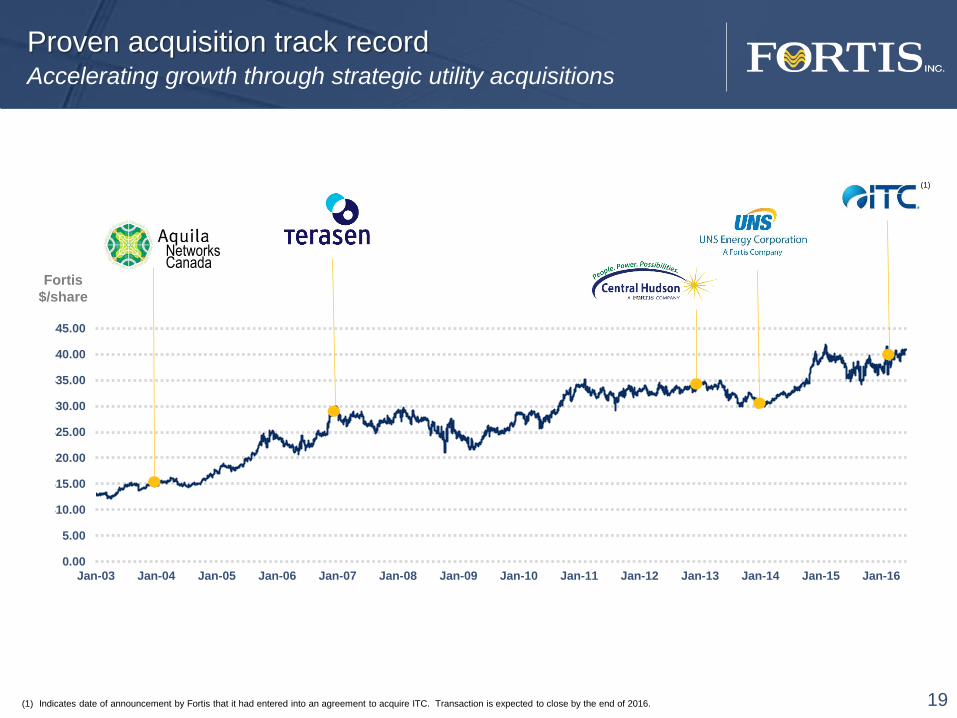
Proven acquisition track recordAccelerating growth through strategic utility acquisitions
2619
$0.00
$5.00
$10.00
$15.00
$20.00
$25.00
$30.00
$35.00
$40.00
$45.00
Jan-03 Jan-04 Jan-05 Jan-06 Jan-07 Jan-08 Jan-09 Jan-10 Jan-11 Jan-12 Jan-13 Jan-14 Jan-15 Jan-16
Fortis
$/share
(1)
(1) Indicates date of announcement by Fortis that it had entered into an agreement to acquire ITC. Transaction is expected to close by the end of 2016.
Networks Canada
20
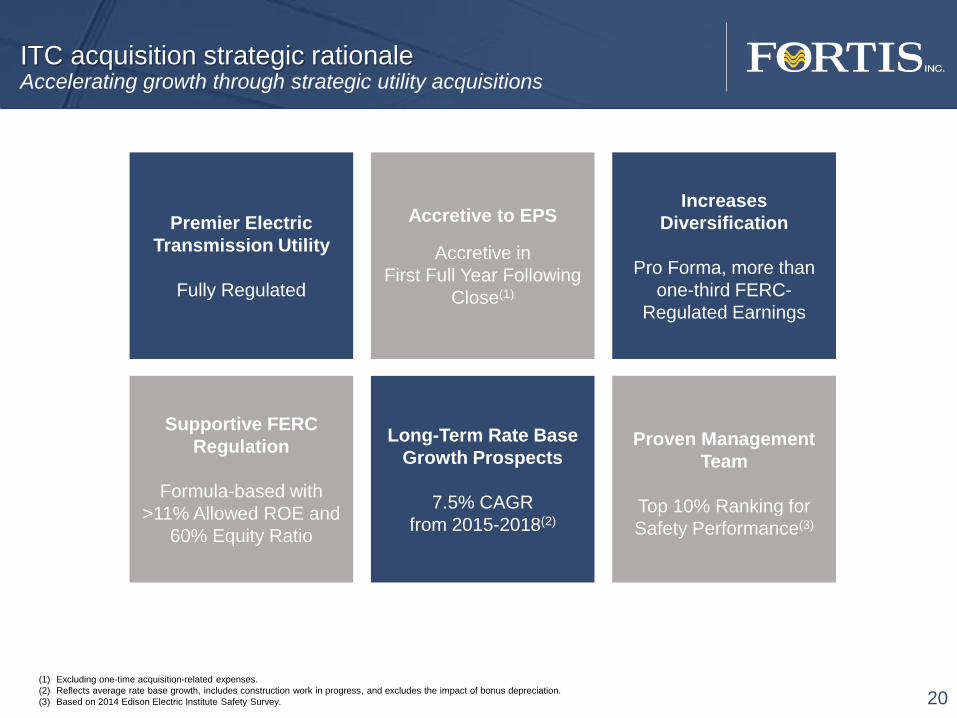
Premier Electric
Transmission Utility
Fully Regulated
Accretive to EPS
Accretive in
First Full Year Following
Close(1)
Increases
Diversification
Pro Forma, more than
one-third FERC-
Regulated Earnings
Supportive FERC
Regulation
Formula-based with
>11% Allowed ROE and
60% Equity Ratio
Long-Term Rate Base
Growth Prospects
7.5% CAGR
from 2015-2018(2)
Proven Management
Team
Top 10% Ranking for
Safety Performance(3)
(1) Excluding one-time acquisition-related expenses.
(2) Reflects average rate base growth, includes construction work in progress, and excludes the impact of bonus depreciation.
(3) Based on 2014 Edison Electric Institute Safety Survey.
ITC acquisition strategic rationaleAccelerating growth through strategic utility acquisitions
21
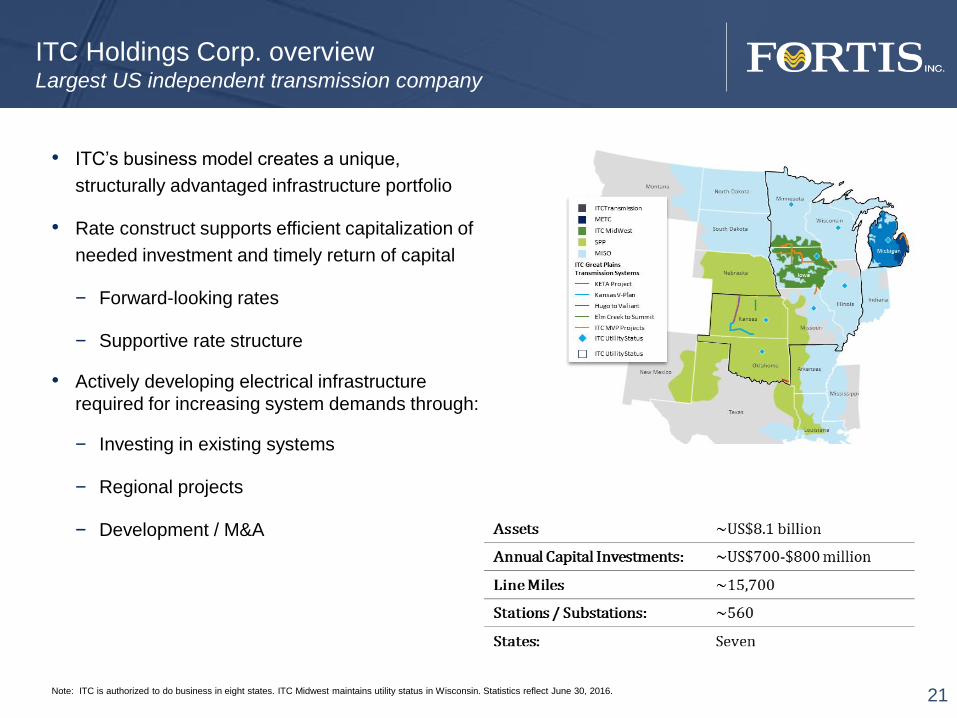
• ITC’s business model creates a unique,
structurally advantaged infrastructure portfolio
• Rate construct supports efficient capitalization of
needed investment and timely return of capital
− Forward-looking rates
− Supportive rate structure
• Actively developing electrical infrastructure
required for increasing system demands through:
− Investing in existing systems
− Regional projects
− Development / M&A
Note: ITC is authorized to do business in eight states. ITC Midwest maintains utility status in Wisconsin. Statistics reflect June 30, 2016.
ITC Holdings Corp. overviewLargest US independent transmission company
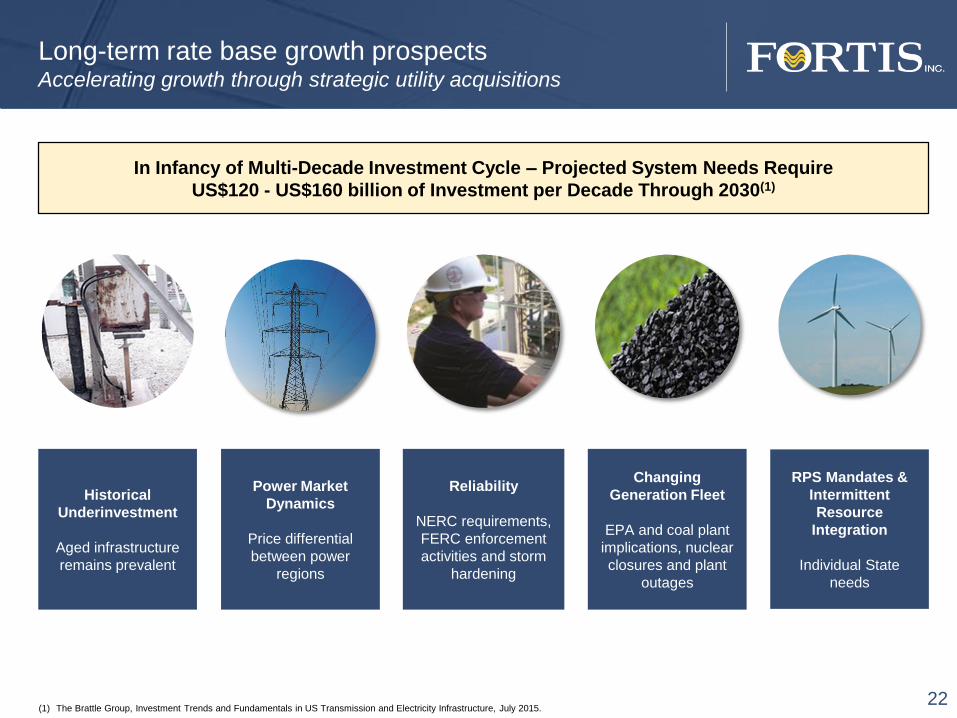
Long-term rate base growth prospectsAccelerating growth through strategic utility acquisitions
Reliability
NERC requirements,
FERC enforcement
activities and storm
hardening
RPS Mandates &
Intermittent
Resource
Integration
Individual State
needs
Changing
Generation Fleet
EPA and coal plant
implications, nuclear
closures and plant
outages
Power Market
Dynamics
Price differential
between power
regions
Historical
Underinvestment
Aged infrastructure
remains prevalent
(1) The Brattle Group, Investment Trends and Fundamentals in US Transmission and Electricity Infrastructure, July 2015. 22
In Infancy of Multi-Decade Investment Cycle – Projected System Needs Require
US$120 - US$160 billion of Investment per Decade Through 2030(1)

Electric
Canada
24%
Gas Canada
14%
Gas & Electric
US
25%
FERC
Transmission -
ITC
34%
Electric
Caribbean
3%
Singular opportunity for Fortis to increase its economic,
geographic and regulatory diversification
(1) Excluding one-time acquisition-related expenses, Fortis’ “Non-Regulated Energy Infrastructure”, “Non-Utility” and “Corporate and Other” segments, ITC’s “ITC Holdings and other”
segment and intercompany eliminations.
(2) Includes 100% of the Waneta Hydroelectric Expansion of which Fortis has a 51% controlling ownership interest.
Pro Forma Regulated Operating
Earnings (1)
U.S.
59%
23
Acquisition delivers increased US presence and FERC regulated returnsAccelerating growth through strategic utility acquisitions
Canada
32%
For the Twelve Months
Ended December 31, 2015
Fortis Pro Forma 2017 Midyear Rate Base
Electric Canada(2)
27%
Gas Canada
16%Electric & Gas US
23%
Electric Caribbean
4%
FERC Transmission -
ITC30%
$26 Billion
Positions Fortis as a leading Transmission and Distribution business
24
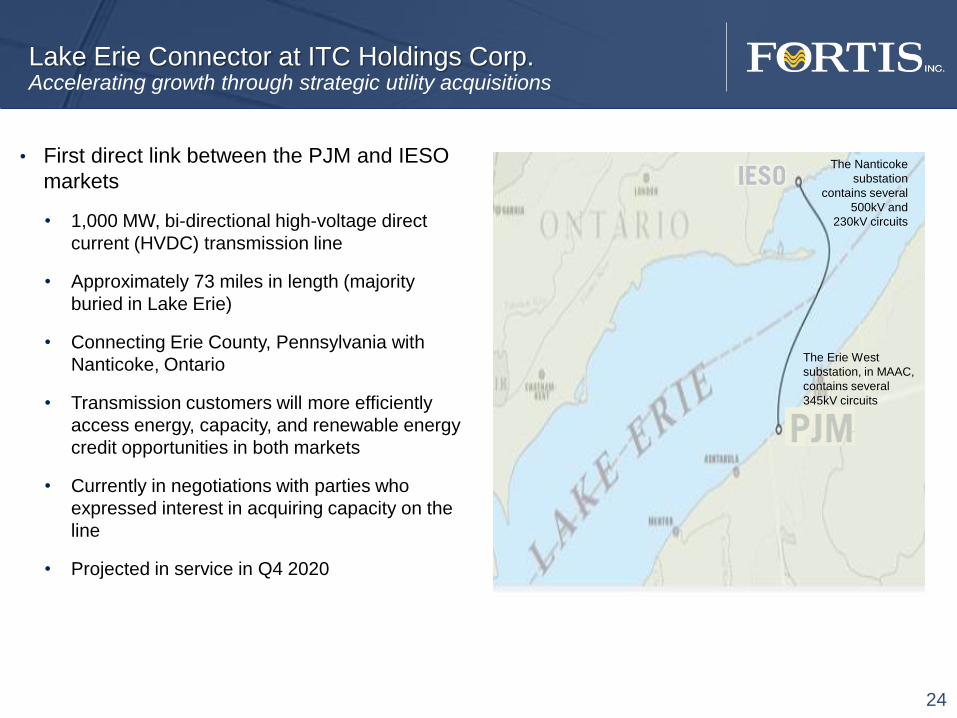
• First direct link between the PJM and IESO
markets
• 1,000 MW, bi-directional high-voltage direct
current (HVDC) transmission line
• Approximately 73 miles in length (majority
buried in Lake Erie)
• Connecting Erie County, Pennsylvania with
Nanticoke, Ontario
• Transmission customers will more efficiently
access energy, capacity, and renewable energy
credit opportunities in both markets
• Currently in negotiations with parties who
expressed interest in acquiring capacity on the
line
• Projected in service in Q4 2020
Lake Erie Connector at ITC Holdings Corp.Accelerating growth through strategic utility acquisitions
The Nanticoke
substation
contains several
500kV and
230kV circuits
The Erie West
substation, in MAAC,
contains several
345kV circuits
25
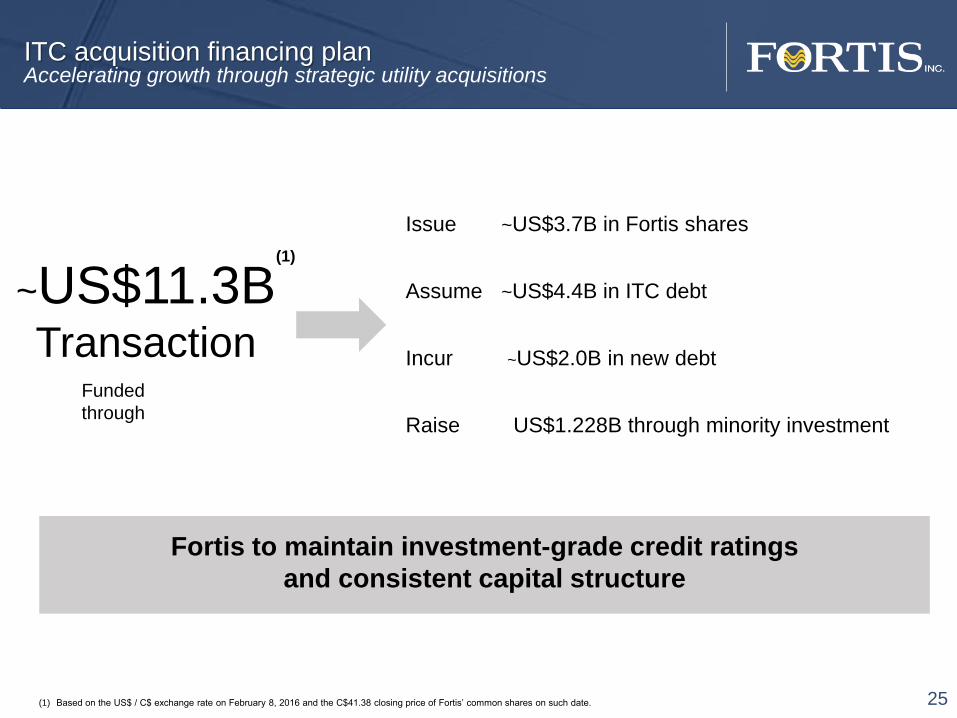
~US$11.3BTransaction
Funded
through
Issue ~US$3.7B in Fortis shares
Assume ~US$4.4B in ITC debt
Incur ~US$2.0B in new debt
Raise US$1.228B through minority investment
Accelerating Growth through Acquisitions
(1)
(1) Based on the US$ / C$ exchange rate on February 8, 2016 and the C$41.38 closing price of Fortis’ common shares on such date.
ITC acquisition financing planAccelerating growth through strategic utility acquisitions
Fortis to maintain investment-grade credit ratings
and consistent capital structure
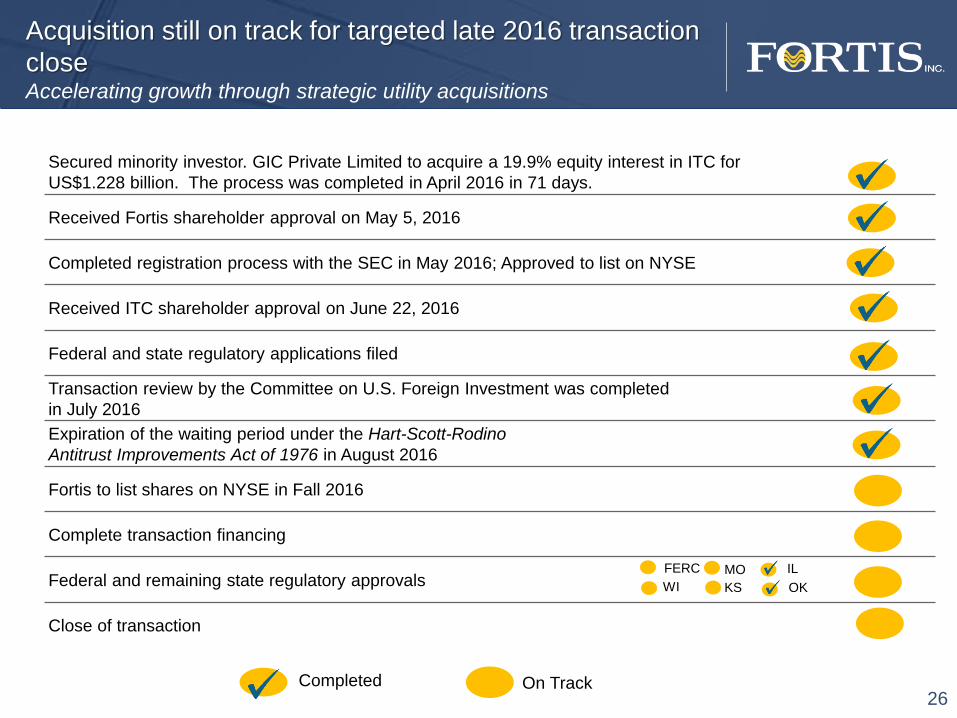
Secured minority investor. GIC Private Limited to acquire a 19.9% equity interest in ITC for
US$1.228 billion. The process was completed in April 2016 in 71 days.
Received Fortis shareholder approval on May 5, 2016
Completed registration process with the SEC in May 2016; Approved to list on NYSE
Received ITC shareholder approval on June 22, 2016
Federal and state regulatory applications filed
Transaction review by the Committee on U.S. Foreign Investment was completed
in July 2016
Expiration of the waiting period under the Hart-Scott-Rodino
Antitrust Improvements Act of 1976 in August 2016
Fortis to list shares on NYSE in Fall 2016
Complete transaction financing
Federal and remaining state regulatory approvals
Close of transaction
Completed On Track
Acquisition still on track for targeted late 2016 transaction
close Accelerating growth through strategic utility acquisitions
26
FERC
WI
MO
KS
IL
OK

Following the acquisition, Fortis will be among the top 15 North Americaninvestor-owned utilities ranked by enterprise value(1)
Achieves scale and EPS accretionAccelerating growth through strategic utility acquisitions
27
$134
$122 $120
$102
$91
$72 $66
$58 $57 $52 $50 $48 $47
$44 $41 $40 $38 $38 $36 $29 $27 $27 $26 $25 $24
$0
$20
$40
$60
$80
$100
$120
$140
$160
1 2 3 4 5 6 7 8 9 10 11 12 13 14 PFFTS
16 17 18 19 20 21 FTS 23 24 25
(C$ B
illi
on
s)
(2)
Pro Forma Fortis Standlone Fortis
Source: Management projections, company filings
(1) Includes integrated electric utilities and gas distribution utilities per CapitalIQ. Enterprise values based on market close as of August 1, 2016. Pro forma Fortis adjusted for US$11.3bn ITC acquisition value
as of February 9, 2016.
(2) Based on US$/C$ foreign exchange rate of 1.31 as of August 31, 2016.
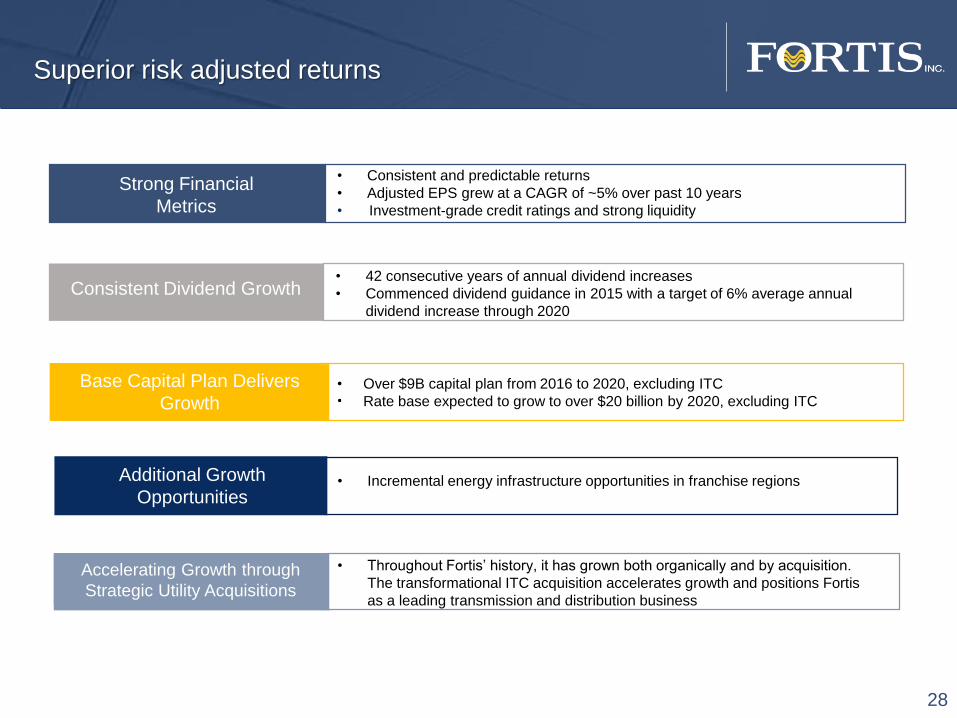
Superior risk adjusted returns
28
Strong Financial
Metrics
Consistent Dividend Growth
Base Capital Plan Delivers
Growth
• Consistent and predictable returns
• Adjusted EPS grew at a CAGR of ~5% over past 10 years
• Investment-grade credit ratings and strong liquidity
• 42 consecutive years of annual dividend increases
• Commenced dividend guidance in 2015 with a target of 6% average annual
dividend increase through 2020
• Over $9B capital plan from 2016 to 2020, excluding ITC
• Rate base expected to grow to over $20 billion by 2020, excluding ITC
• Incremental energy infrastructure opportunities in franchise regions Additional Growth
Opportunities
• Throughout Fortis’ history, it has grown both organically and by acquisition.
The transformational ITC acquisition accelerates growth and positions Fortis
as a leading transmission and distribution business
Accelerating Growth through
Strategic Utility Acquisitions

Barclays Capital 2016
CEO Energy-Power Conference
September 2016