barclays americas select franchise conference 2013 - sallie mae
TRANSCRIPT

Barclays Americas Select Franchise Conference May 22, 2013

2
Forward-Looking Statements; Non-GAAP Financial Measures
The following information is current as of May 13, 2013 (unless otherwise noted) and should be read in connection with SLM Corporation’s Annual Report on Form 10-K for the year ended December 31, 2012
(the “2012 Form 10-K”), and subsequent reports filed with the Securities and Exchange Commission (the “SEC”). Definitions for capitalized terms in this presentation not defined herein can be found in the 2012
Form 10-K (filed with the SEC on February 26, 2013).
This Presentation contains forward-looking statements and information based on management’s current expectations as of the date of this presentation. Statements that are not historical facts, including
statements about our opinions, beliefs or expectations and statements that assume or are dependent upon future events, are forward-looking statements. Forward-looking statements are subject to risks,
uncertainties, assumptions and other factors that may cause actual results to be materially different from those reflected in such forward-looking statements. These factors include, among others, the risks and
uncertainties set forth in Item 1A “Risk Factors” and elsewhere in the 2012 Form 10-K, the Company’s first quarter Form 10-Q and subsequent filings with the SEC; increases in financing costs; limits on liquidity;
increases in costs associated with compliance with laws and regulations; changes in accounting standards and the impact of related changes in significant accounting estimates; any adverse outcomes in any
significant litigation to which we are a party; credit risk associated with our exposure to third parties, including counterparties to our derivative transactions; and changes in the terms of student loans and the
educational credit marketplace (including changes resulting from new laws and the implementation of existing laws). We could also be affected by, among other things: changes in our funding costs and
availability; reductions to our credit ratings or the credit ratings of the United States of America; failures of our operating systems or infrastructure, including those of third-party vendors; damage to our reputation;
failures to successfully implement cost-cutting and restructuring initiatives and adverse effects of such initiatives on our business; changes in the demand for educational financing or in financing preferences of
lenders, educational institutions, students and their families; changes in law and regulations with respect to the student lending business and financial institutions generally; increased competition from banks and
other consumer lenders; the creditworthiness of our customers; changes in the general interest rate environment, including the rate relationships among relevant money-market instruments and those of our
earning assets versus our funding arrangements; changes in general economic conditions; our ability to successfully effectuate any acquisitions and other strategic initiatives; and changes in the demand for debt
management services. The preparation of our consolidated financial statements also requires management to make certain estimates and assumptions including estimates and assumptions about future events.
These estimates or assumptions may prove to be incorrect. All forward-looking statements contained in this Presentation are qualified by these cautionary statements and are made only as of the date of this
Presentation. We do not undertake any obligation to update or revise these forward-looking statements to conform the statement to actual results or changes in our expectations.
The Company reports financial results on a GAAP basis and also provides certain core earnings performance measures. The difference between the Company’s core earnings and GAAP results for the periods
presented were the unrealized, mark-to-market gains/losses on derivative contracts and the goodwill and acquired intangible asset amortization and impairment. These items are recognized in GAAP but not in
core earnings results. The Company provides core earnings measures because this is what management uses when making management decisions regarding the Company’s performance and the allocation of
corporate resources. The Company’s core earnings are not defined terms within GAAP and may not be comparable to similarly titled measures reported by other companies. For additional information, see
“Core Earnings — Definition and Limitations” in the Company’s first quarter Form 10-Q for a further discussion and a complete reconciliation between GAAP net income and core earnings.

3
SLM Corporation Overview
4
► #1 saving, planning and paying for education
company with 40-years of leadership in the
education lending market
► #1 servicer and collector of student loans in the
U.S. for FFELP 1 and Private Education Loans
► Serving 25 million unique customers
► $157 billion student loan portfolio, 76% of which
is insured or guaranteed
► Fully independent private sector company with
scale and a broad franchise, traded on the
NASDAQ (ticker: SLM)
SLM Corporation
1 Federal Family Education Loan Program (“FFELP”).

5
Two Businesses
Legacy Business (as of 12/31/12)
FFELP Loans $124
Private Loans 31
Total $155
Intrinsic value: $22++ per share
$ in billions, except per share amounts (1) 2013 pro forma loan balance based on 2013 loan originations in excess of $4 billion (2) EPS Contribution based on approximately 450 million shares outstanding
Private Credit Growth Business (2013 Pro Forma)(1)
Estimated Average Balance of
Smart Option Loans
$10 Billion
ROA 2.4%
Capital 12 – 15%
ROE 16 – 20%
Growth 20%++
Est. 2013 EPS Contribution (2) $0.55
6
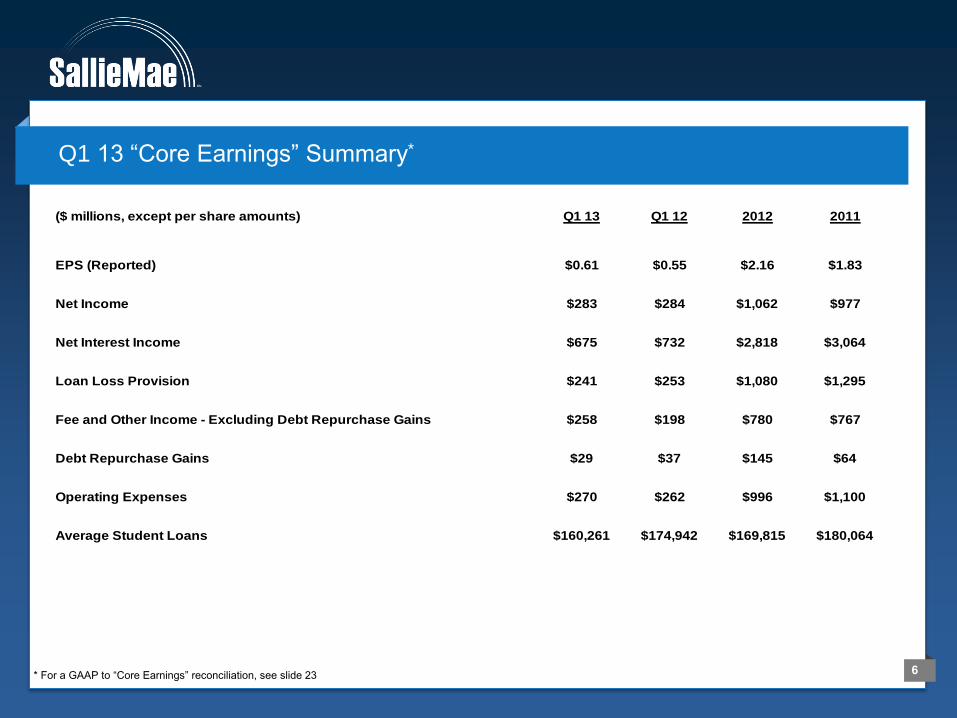
Q1 13 “Core Earnings” Summary*
* For a GAAP to “Core Earnings” reconciliation, see slide 23
($ millions, except per share amounts) Q1 13 Q1 12 2012 2011
EPS (Reported) $0.61 $0.55 $2.16 $1.83
Net Income $283 $284 $1,062 $977
Net Interest Income $675 $732 $2,818 $3,064
Loan Loss Provision $241 $253 $1,080 $1,295
Fee and Other Income - Excluding Debt Repurchase Gains $258 $198 $780 $767
Debt Repurchase Gains $29 $37 $145 $64
Operating Expenses $270 $262 $996 $1,100
Average Student Loans $160,261 $174,942 $169,815 $180,064

7
► Estimates for academic year 2011-12 project that 21 million students will enroll in higher education and incur costs of over $436 billion; $7 billion of which is funded by private education loans
► Private Education Loan products bridge the funding gap between the cost of a college education and funds available through U.S. Department of Education (ED) programs, grants, and other sources
Role of Private Education Loans
Source: Trends in College Pricing.© 2012 The College Board,. www.collegeboard.org,
U.S. Department of Education 2012
Cost of College (Based on a Four-Year Term) Total Cost of Education (in billions)
2011/2012 Academic Year
$113
$116
$200
$7
Federal
Family Contributions
Grants
Private Education
Loans
Source: U.S. Department of Education, President’s 2013 Budget & Company analysis
$17,125 $17,125 $27,000 $27,000
$78,299
$19,003
$124,884
$41,544
Full-TimePrivate School
Full-TimePublic School
Full-TimePrivate School
Full-TimePublic School
ED Lending Limit Cost of attendance gap
Cost of
attendance
gap
Cost of
attendance
gap
AY 2001-2002 AY 2011-2012
$95,424
$36,128
$151,884
$68,544

8
► 2011-12 academic year market share approximately 47%
Private Education Loan Industry Originations
Source: Trends in Student Aid.© 2012 The College Board,. www.collegeboard.org, industry data is preliminary. Based on current dollars. Data reported by academic year, SLM quarterly data converted to academic year basis.
► Private Education Loan originations declined from their peak as a result of an increase in federal student loan limits, an overall increase in the use of federal student loans, an increase in federal grants, and tighter underwriting standards.
$3.8 $4.8
$7.1 $7.7 $7.7
$4.8
$2.3 $2.5 $3.0
$11.6
$15.5
$18.5
$21.1 $22.9
$10.6
$7.1 $6.2 $6.4
03-04 04-05 05-06 06-07 07-08 08-09 09-10 10-11 11-12
SLM vs. Industry Originations (billions)
SLM Total Market

9
Low Risk = Smart Option, Legacy Traditional Cosigned, and Law/MBA/MED/CT/Other
Moderate Risk = Legacy Traditional Non-Cosigned
Elevated Risk = Non-Traditional
Consumer Lending Segment – High Quality Portfolio
10
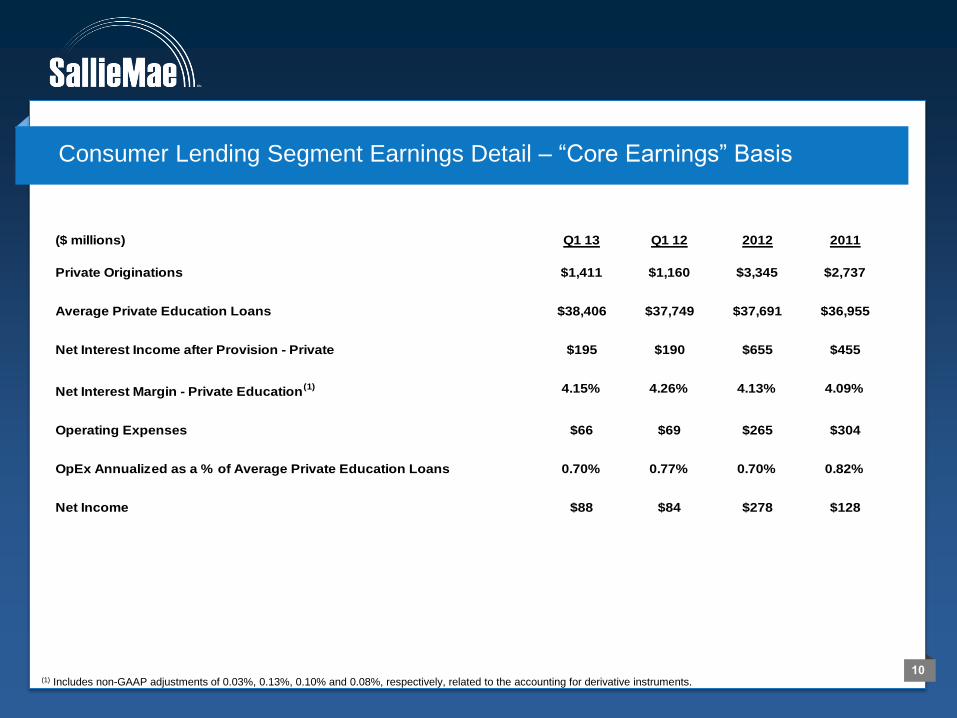
Consumer Lending Segment Earnings Detail – “Core Earnings” Basis
($ millions) Q1 13 Q1 12 2012 2011
Private Originations $1,411 $1,160 $3,345 $2,737
Average Private Education Loans $38,406 $37,749 $37,691 $36,955
Net Interest Income after Provision - Private $195 $190 $655 $455
Net Interest Margin - Private Education(1) 4.15% 4.26% 4.13% 4.09%
Operating Expenses $66 $69 $265 $304
OpEx Annualized as a % of Average Private Education Loans 0.70% 0.77% 0.70% 0.82%
Net Income $88 $84 $278 $128
(1) Includes non-GAAP adjustments of 0.03%, 0.13%, 0.10% and 0.08%, respectively, related to the accounting for derivative instruments.

11
FFELP Loan Segment Earnings Detail – “Core Earnings” Basis
($ millions) Q1 13 Q1 12 2012 2011
Average FFELP Loans $121,855 $137,193 $132,124 $143,109
Net Interest Income after Provision - FFELP $245 $286 $1,092 $1,361
Net Interest Margin - FFELP(1) 0.83% 0.85% 0.84% 0.98%
Operating Expenses $157 $185 $702 $760
OpEx Annualized as a % of Average FFELP Loans 0.52% 0.53% 0.53% 0.53%
Net Income $104 $80 $307 $434
(1)Includes non-GAAP adjustments of (0.40%), (0.27%), (0.31%) and (0.34%), respectively, related to the accounting for derivative instruments.

12
Business Services Segment – “Core Earnings” Basis
(in millions) Q1 13 Q4 12 Q1 12
Net Income $124 $134 $137
Servicing Revenue $212 $218 $236
Contingency Revenue $99 $95 $90
Department of Education Accounts Serviced 4.8 4.3 3.7
13
Funding Diversity and Liquidity

14
FFELP
► Issued $2.5 billion of FFELP ABS
► Sold residual interest in two FFELP securitization trusts totaling $5.8 billion of assets
► Refinanced $787 million of FFELP reset rate notes to term
Private Credit
► Issued $2.5 billion of Private ABS
Unsecured Debt
► Issued $1.5 billion of long term unsecured debt
► Repurchased $800 million of outstanding debt through tender offers
Capital Management
► Returned nearly $200 million to shareholders through share repurchases(1)
► Maintained excess capital at Bank and SLM Corporation
2013 Capital Markets Summary
(1) As of March 31, 2013.

15
Non-Consolidation FFELP Non-Consolidation FFELP Consolidation FFELP
Issue $1,246M SLM Trust 2013-2 $1,249M SLM Trust 2013-1 $1,527M SLM Trust 2012-8
Pricing Date April 3, 2013 February 5, 2013 December 13, 2012
Collateral US Govt. Guaranteed or Insured
FFELP Stafford and Plus Loans
US Govt. Guaranteed or Insured
FFELP Stafford and Plus Loans
US Govt. Guaranteed or Insured
FFELP Consolidation Loans
Prepayment
Speed (1) 6% Constant Prepayment Rate 6% Constant Prepayment Rate 4% Constant Prepayment Rate
Tranching
Moody’s Amt WAL(1) Pricing(2)
A Aaa $1,211 4.4 L+45
B Aa1 $35 8.8 L+210
Moody’s Amt WAL(1) Pricing(2)
A-1 Aaa $280 1.0 L+17
A-2 Aaa $396 3.3 L+25
A-3 Aaa $538 6.8 L+55
B A1 $35 8.6 L+225
Moody’s Amt WAL(1) Pricing(2)
A Aaa $1,485 7.8 L+90
B A1 $43 17.4 L+360
Recent SLM FFELP ABS Transactions
(1) Estimated based on a variety of assumptions concerning loan repayment behavior, as more fully described in the related prospectus, which may be obtained at
http://www2.salliemae.com/investors/debtasset/slmsltrusts/. Actual average life may vary significantly from estimates.
(2) Pricing represents the yield to expected call.

16
Projected Cash Flows From FFELP Portfolio*
Assumptions
No Floor Income, CPR/CDR = Stafford & Plus (4.0%), Consolidation (3.0%)
Excludes assets and excess spread associated with FFELP Trust 2006-2
* These projections are based on internal estimates and assumptions and are subject to ongoing review and modification. These projections may prove to be incorrect.
($ in Millions)
► Total Cash Flows from Projected Excess Spread = $8.8 Billion
► Total Cash Flows from Projected Servicing Revenues = $4.7 Billion
as of 3/31/13 2013 2014 2015 2016 2017 2018 2019 2020
Projected FFELP Average Balance $111,462 $103,233 $93,609 $84,153 $75,164 $66,443 $58,342 $50,786
Projected Excess Spread $701 $866 $793 $727 $807 $733 $661 $586
Projected Servicing Revenue $466 $579 $527 $477 $426 $374 $325 $279
Projected Total Revenue $1,167 $1,445 $1,320 $1,204 $1,232 $1,107 $985 $865
2021 2022 2023 2024 2025 2026 2027 2028 - 2033
Projected FFELP Average Balance $43,800 $37,404 $31,931 $27,454 $23,245 $19,234 $15,441 $6,246
Projected Excess Spread $517 $449 $364 $306 $275 $238 $202 $536
Projected Servicing Revenue $237 $198 $165 $141 $120 $100 $82 $206
Projected Total Revenue $754 $647 $528 $447 $396 $338 $284 $742

17
High Percentage of Student Loans Funded to Term
$157 Billion Student Loan Portfolio* as of March 31, 2013
* Gross loans, Numbers may not add due to rounding.
Funded to Term, $118 Bn
► FFELP Consolidation Term ABS, $70 Bn
► FFELP Non-Consolidation Term ABS, $28 Bn
► Private Term ABS, $20 Bn
Fixed Spread Liabilities, $25 Bn
Conduits, $14 Bn
► Straight A Conduit, $7 Bn
► FFELP ABCP Conduit & FHLB, $7 Bn
► Private ABCP Conduit, $0.4 Bn

18
$1.6
$2.5
$1.5 $2.3
$1.8
$2.8
$0.2
$1.6
$3.7
$0
$5
$10
As of March 31, 2013 (par value, $ in billions)
Note: Does not include Sallie Mae Bank or Subsidiary funding
► Total unsecured debt outstanding of $18.1 billion
Unsecured Debt Maturities

19
► Bank charter
– Utah based ILC regulated by FDIC and Utah Department of Financial Institutions (UDFI)
– Charter granted October 2005
► Current bank activity
– Total assets of $9.4 billion at March 31, 2013
– Originates Sallie Mae’s Private Education Loans
– Funded through affiliate, brokered and direct retail deposits
– 14.8% Total Risk-based Capital at March 31, 2013
– Dividends of $120 million paid 2013 YTD
► Deposit taking activities
– Deposits totaled $8.0 billion at March 31, 2013
• $5.1 billion Brokered Deposits
• $2.9 billion Direct Retail and other affiliate and non-affiliate Deposits
– Brokered Deposit term portfolio has a weighted average maturity of 21.1 months
– Total deposits increased by 29% over Q112 and 3% over Q412
Sallie Mae Bank
20
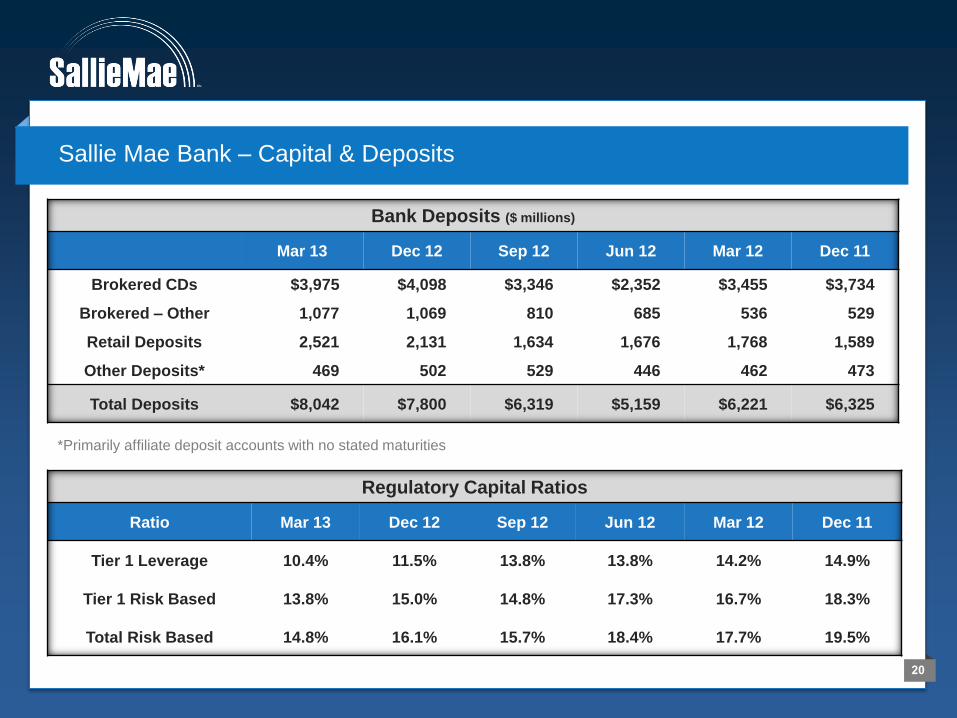
Sallie Mae Bank – Capital & Deposits
*Primarily affiliate deposit accounts with no stated maturities
Bank Deposits ($ millions)
Mar 13 Dec 12 Sep 12 Jun 12 Mar 12 Dec 11
Brokered CDs $3,975 $4,098 $3,346 $2,352 $3,455 $3,734
Brokered – Other 1,077 1,069 810 685 536 529
Retail Deposits 2,521 2,131 1,634 1,676 1,768 1,589
Other Deposits* 469 502 529 446 462 473
Total Deposits $8,042 $7,800 $6,319 $5,159 $6,221 $6,325
Regulatory Capital Ratios
Ratio Mar 13 Dec 12 Sep 12 Jun 12 Mar 12 Dec 11
Tier 1 Leverage 10.4% 11.5% 13.8% 13.8% 14.2% 14.9%
Tier 1 Risk Based 13.8% 15.0% 14.8% 17.3% 16.7% 18.3%
Total Risk Based 14.8% 16.1% 15.7% 18.4% 17.7% 19.5%

21
Q & A

22
Appendix

23
GAAP to “Core Earnings” Reconciliation
($ in millions, except per share amounts) Quarters Ended
March 31, 2013 December 31, 2012 March 31, 2012
Dollars Diluted EPS Dollars Diluted EPS Dollars Diluted EPS
GAAP net income 346$ $0.74 348$ $0.74 112$ $0.21
Adjustment from GAAP to "Core Earnings"
Net impact of derivative accounting (110) (128) 264
Net impact of goodwill and acquired intangible assets 4 14 5
Total "Core Earnings" Adjustments before net tax effect (106) (114) 269
Net tax effect 43 23 (97)
Total "Core Earnings" Adjustments (63) (91) 172
"Core Earnings" $283 $0.61 $257 $0.55 $284 $0.55