barcelona data sheet 2012 -...
TRANSCRIPT

Barcelona DaTa SHeeT2012

Barcelona Datasheet 2012Data 2011Population (Barcelona city) 1,615,448
Population (Barcelona Metropolitan Region) 4,777,042
Annual rates of variation in GPD at constant prices (% of Catalonia) 0.7
Barcelona’s GDP mp (million euros) (2008) 64,521.3
Barcelona’s per capita GDP mp (thousands of euros) (2008) 39.9
Businesses
Creation of trading businesses in the city of Barcelona 6,416
Entrepreneurship rate (GEM) 7.0%
Number of companies in the province of Barcelona (DIRCE) 453,485
Workers affiliated to social security 992.231
Workers affiliated to social security (provincial data) 2,274,116
Workers affiliated by area of activity: services/industry/construction (% of total) 87.7/8.8/3.5
Employment rate 16-64 years 65.9%
Unemployment rate 16-64 years 17.2%
University students in Catalonia (2010/2011 academic year) 247,571
Knowledge sectors
Knowledge-intensive companies (% of total) 28.7
Knowledge-intensive workers (% of total) 52.9
Patents
Patent applications (% of Spain) 14.8
Utility-model applications (% of Spain) 19.5
Employment in Creative Industries (2010) 88,808
Total stock office space 5,953,995 m2
Office prices
Prime (Pg. Gràcia-Diagonal) € 14.75-18.50 m²/month
Business district (consolidated centre) € 10-16 m²/month
Exports (million of euros) 42,036.2
Percentage of exports in Barcelona province / Spain (%) 19.6%
Foreign investment in Catalonia (million of euros) 2,993.1
Catalan investment abroad (million of euros) 2,533.1
Port of Barcelona traffic (million of tons) 43.1
Barcelona airport passengers 34,399,180
Tourists 7,390,777
Total international meetings/delegates 2,283 / 647,693
Number of companies (IV quarter 2011) 16,379
Jobs (IV quarter 2011) 146,676
Municipal markets: food/others (2010) 39/4
Sustainable intracity mobility in Barcelona (% of total) 82.4%
Indicators of culture, leisure and education
Public libraries (number and users) 37 / 6,178,297
Museums, collections and exhibition centres (number and users) 40/18,604,402
CUShMAN & WAKEFIELD. “European Cities Monitor“
Best European city for business 6th
Best European city in worker’s quality of life 1st
01.Population
02.economicand businessactivity
03.Human capital
04.city ofknowledge andcreativity
05.competitivebusiness realestate
06.an economyopen to theworld
07.Benchmark intourism and city of fairs and congresses
08.retail
09.Quality of life
10.Internationalpositioning ofBarcelona
Summaryof indicatorsData 2011

Barcelona Airport is the third largest in Europe in terms of direct passenger numbers

Index executive summary ......................................................04
01. one of europe’s main metropolitan areas ................08
02. economic engine with a diversified structure .........10
03. Qualified human capital ..............................................12
04. city of knowledge and creativity ................................14
05. competitive supply of real estate for businesses .....17
06. an economy that is open to the world .......................18
07. Benchmark in tourism and city of trade fairs and congresses ..............................................................21
08. retail ..............................................................................23
09. Quality of life .................................................................23
10. International positioning of Barcelona ....................26
October 2012Editor: Economy, Business and Employment Area. Barcelona City Council

4
executive SummaryBarcelona, the centre of a mega-region with 25 million inhabitants
•Barcelona, capital of Catalonia, has more than 1,600,000 inha-bitants and is at the heart of a metropolitan area with almost 5,000,000 inhabitants, representing 63.4% and 10.1% of the total population of Catalonia and Spain, respectively.
•The development of a metropolitan region goes beyond its geo-graphical area to create mega-regions1 or polycentric agglome-rations of cities that are a unit of natural economic influence in any given geographic area. In southern Europe, one that stands out is along the Barcelona –Lyon corridor, encompas– sing 25 million people with an output of nearly 1 billion Euros of production, ranking number 16 and 11 in the world in terms of population and wealth, respectively.
• In terms of consolidated metropolitan agglomerations, the me-tropolitan area’s population is approximately a quarter of New York’s, yet greater than those of Boston, Montreal or Milan.
•Barcelona’s cosmopolitan spirit –diverse and intercultural– is shown by in the fact that nearly 18% of city residents are foreigners.
Barcelona is a dynamic economic engine of growth, with a diversified structure and international recognition
•Barcelona has maintained its strong position internationally, in addition to boasting a recognized city brand. As such, in 2011 Barcelona was among the six best European cities for business, according to the European Cities Monitor by Cushman & Wakefield, and it has maintained a position in the top six during the decade 2001-2011. It also holds the top spot as the city with the best quality of life for workers, and is placed second in terms of best European city to promote itself as a business centre, and third best-known by European executives. Moreover, according to the report Hot Spots: Global City Com-petitiveness Benchmarking by the Economist Intelligence Unit, the city is the ninth most-attractive in the world, standing out because of its social and cultural character, and its infrastruc-ture (sharing 5th and 9th places with other cities, respectively).
•Barcelona’s gross domestic product (GDP) stood at 64,521.3 million Euros in 2008, with a GDP per capita of 39.9 thousand Euros. In terms of the distribution of gross va-lue added by sector, what stands out is the importance of ser-vices for businesses and real estate, representing more than a quarter of the total (25.6%), followed by collective services (21.5%), industry (11.2%), commerce and trade and repairs
(10.9%), and transport (9.6%). Furthermore, Barcelona’s metro-politan area boasts the highest degree of diversity in terms of production in Spain.
•Barcelona has a significant industrial sector employing 8.8% of all workers, and its metropolitan area accounts for around two thirds of manufacturing jobs in Catalonia (65.9%), which inclu-des strong car production clusters –one of Europe’s largest–, pharmaceuticals and chemicals, foodstuffs, electrical materials and equipment, paper and printing, and waste treatment.
•Barcelona encourages and promotes economic activity and areas related to logistics and access to markets in Southern Europe, the Mediterranean, Asia and Latin America.
•After GSMA chose Barcelona for its Mobile World Capital for the period 2012-2018, the city has launched a four-pronged project: the Mobile World Congress, Mobile World Hub –focused on the industrial and business areas–, Mobile World Center, and the Mobile World Festival, which has a wider social and ci-vic role. The city is implementing various measures to promote this sector, among them, the promotion of a free trade zone for companies in the Smart City Campus-22@ area for companies with development projects related to these activities, with the final goal being the development of a permanent economic and industrial ecosystem in Barcelona and Catalonia focused on mobile technology that can become an international and national benchmark cluster.
•The city also supports the development of other high value-added sectors such as healthcare and biomedicine, ICT, environmental sectors, energy sectors and research in the food industry, while strengthening traditional and consolidated sec-tors such as trade, logistics, tourism and social sectors.
• In 2011, Catalonia’s GDP was 210,150 million Euros, repre-senting 20% of the Spanish total. Its per capita GDP is 17.2% higher than the European Union´s average.
Barcelona’s business activities are dynamic and flexible
•Greater Barcelona is home to 453,485 businesses, in other words, 14% of Spain’s total. These are mostly SMEs (98%), with their greater flexibility and adaptability to complex environments.
• In 2011, the rate of entrepreneurial activity (TEA) of the resident population (18-64) in the province of Barcelona stood at 7%, and this marked a turning point for this indi-cator which showed growth for the first time in five years. Barcelona’s TEA is higher than Catalonia’s (6.8%) and Spain’s (5.8%) and in the European context, higher than countries such as Finland (6.3%), Sweden (5.8%) France and Belgium (5.7% each) and Germany (5.6%), although slightly lower than the EU average (7.6%).
1 R. FLORIDA (2007), The Rise of the Megaregion, Richard Florida, The Martin Pros-perity Institute at The Joseph L. Rotman School of Management, University of Toronto.

Barcelona Datasheet 2012 5
• In 2011, 6,416 companies were created in Barcelona, repre-senting a rate of 4 per 1,000 inhabitants, which was up by 5.3% compared to 2010. The province of Barcelona saw 8.3 firms created for every one that was wound up, a ratio that places it at the head of major urban areas in Spain in this indicator.
•One of the objectives of the city hall’s so-called Barcelona Growth project is to generate a business-friendly environ-ment via the creation of a support office for businesses, streamlining the process for setting up businesses, and with the administration paying suppliers within 30 days. It also envisages the creation of a virtual platform called Barcelona Connecta, which will promote networking between entrepre-neurs, associations and stakeholders, and a platform for facilitating public sector procurement from local SMEs and entrepreneurs, and other instruments that contribute to achieving this goal.
Barcelona has a strong and large labour market with well qualified workers
•The city has almost a million jobs and nearly 2.3 million in the provincial area. Barcelona’s activity and employment rates (79.6% and 65.9%, respectively) are higher than the Catalan, Spanish and European averages.
•Barcelona now has one of the largest labour markets in Eu-rope in high added value sectors: Catalonia is the fourth top region in Europe in terms of the number of people employed in high and mid-range technology-intensive manufacturing sectors, and fifth in terms of workers in science and techno-logy, while reaching seventh place in the case of knowledge-intensive and high-end technology services.
•Catalonia has 12 universities and 247,571 students, and the metropolitan area’s 8 public and private universi-ties account for 81.2% of students. These offer a total of 436 official masters courses with 16,944 enrolled students, plus 12,107 doctoral students. Moreover, there were 14,732 foreigners studying at Catalan universities in the 2010-2011 academic year.
• In 2010, the percentage of workers with a university education in Catalonia stood at 36.9%, higher than the European Union (30.7%) and slightly lower than the Spanish average (37.8%).
•Two of the city’s business schools, IESE and ESADE, are ranked 4th and 12th respectively in Europe´s top 100 full-time MBA programmes, according to the 2012 ranking by the pres-tigious Financial Times. Moreover, according to the ranking Which MBA?, developed annually by the Economist Intelli-gence Unit, IESE was in second place in Europe and tenth in the world, while ESADE occupied the fifth spot in Europe and seventeenth in the world in 2011.
Barcelona leads Spain in the development of the knowledge economy
•28.7% of businesses and 52.9% of city employees work in knowledge-intensive industries.
•The province of Barcelona generates 15% of patent applica-tions and 19.5% of utility models in Spain.
•Catalonia has more innovative companies than any other au-tonomous region in Spain (21.6%) and 22.5% of national total expenditure on innovative activities.
•The promotion of research in Catalonia in recent years meant that R&D expenditure in 2010 stood at 1.6% of GDP, and the number of workers engaged in research and development reached 46,336.
•Barcelona improved its international ranking in terms of research in 2011 reaching 5th best city in Europe and 12th in the world in terms of scientific production. In addition, the ratio of projects funded by the European Research Council per million inhabitants in Catalonia in the last four years exceeds that of countries like Austria, Finland and Belgium.
•Three of Barcelona’s universities (Pompeu Fabra University (UPF), University of Barcelona (UB) and the Autonomous University of Barcelona (UAB) are among the top 225 in the world, according to the Times Higher Education University Ranking, while the UB and UAB are also among the top 200, according to the QS Top University Ranking 2011/2012, which makes Barcelona the eleventh best city in the world for college students.
•Creative activities account for more than 10% of workers in Barcelona-based companies, with about 90,000 jobs and 7,800 businesses. Barcelona accounts for 45% of Catalonia´s creative businesses and 52% of its jobs in creative sectors. Worth noting is that, according to the latest research, a higher percentage of workers in creative industries is strongly correla-ted to higher outputs per capita.
•Catalonia is the driver of medical technology and biomedi-cal research in Spain with 23% of new biotech firms created in 2010. Moreover, Catalan companies represent 21% of all Spanish firms, turning over more than 15,000 million Euros in 2010, which is 29.4% of all Spanish revenues in this ac-tivity. In Catalonia, half of those employed and life sciences work in R&D.
•The European Tech Cities Index by Buck Consultants, which measures factors related to technology and know-how, talent, market size, connectivity and international business climate in European cities, places Barcelona in tenth place along with Amsterdam in the 2012 ranking, headed by Paris, London and Oxford.

•Barcelona is aiming to lead the transformation to smarter and sustainable cities by creating a City protocol or world standard for measuring the sustainability and capacity of urban areas to generate quality of life. This initiative has been awarded the Areté Award for Urban Innovation 2012, in the framework of the Turin Città Visibili (Italy).
Barcelona offers a wide range of competitive premises for businessesThe so-called Barcelona-Catalonia initiative, led by the Govern-ment of Catalonia -via the public company Incasòl-, and Barce-lona City Council, aims to promote a joint regional intelligent land development for new economic activity projects across all major sectors of the knowledge economy around powerful knowledge and mobility intensive infrastructure and facilities, with nearly 7 million square meters of surface area and a capa-city to generate over 200,000 highly skilled jobs:
• In Barcelona, areas like the Smart City Campus-22@, la Marina del Prat Vermell, Glòries, Barcelona-La Sagrera, Can Batlló, areas around Via Augusta (Pla Empenta) and Rambla de Sants are especially noteworthy.
• In the area around Barcelona, there are projects like Parc de l’Alba, Ripollet Park, Can Sant Joan, Mas Blau and Ca n’Alemany.
Barcelona has an open economy that is connected to the world
•Catalonia is home to more than 5,000 foreign companies, with the main countries of origin being Germany (18.4%), France (15.1%) and the Netherlands (13.4%). On the other hand, Cata-lonia boasts most companies in Spain from Japan (85.9%), Italy (67.1%), the U.S. (63%), France (61.9%), Austria (56.4 %) and Switzerland (50.1%).
•KMPG’s Global Cities Investment Monitor shows that from 2007 to 2011 Barcelona was one of the world’s top ten urban areas receiving most foreign investment. Also, the city ranks third in Europe in terms of receiving most foreign investment projects, according to the European Attractiveness Survey 2012 by Ernst and Young.
•Exports from the province of Barcelona rose to 42,036.2 million Euros in 2011, the highest ever recorded after growing 10.4% on 2010. The area of Barcelona consolidated its leadership in the ranking of Spanish exports, generating approximately one fifth (19.6%) of all sales overseas.
•On the other hand, exports of high and medium-high tech from Barcelona reached a value of 24,511.9 million Euros in 2011, representing 58.3% of total sales abroad. The province itself generates around a quarter of the Spanish exports and clearly leads the national ranking.
• In 2011 Barcelona Airport stood in ninth place in the ranking of Europe’s busiest airports with over 34 million passengers, a city record that meant Barcelona climbed one place in the Airport Council International’s ranking. The same year, Barcelona Airport recorded the largest inter-annual increase (6.5%) among the major European airports. The first half of 2012 intensified the year-on-year rate with increases in the number of passengers (+20.7%).
•Port activity in 2011 stood at 43.1 million tonnes transported, showing growth of 4.4% and 0.2% in TEUS and tonnes of cargo, respectively and an increase of 11.8% in passengers. As well, the port of Barcelona came 12th among European ports in terms of container traffic rankings.
•Over the coming years, the Port of Barcelona wants to consoli-date its position as the main logistics hub in Southern Europe by expanding its infrastructure with a new Hutchison terminal, and new road and rail connections to extend its hinterland. The inclusion of the Mediterranean corridor in the trans-European railway network will provide a direct connection from Mediterra-nean ports to Europe and thus increase the port of Barcelona’s market share in cargo traffic from Asia.
• In 2011 the cost of living in Barcelona got cheaper in relation to other benchmark cities in Europe and the world, and the prices of areas devoted to economic activity followed the same trend.
Barcelona is an international leader in tourism and the organization of trade fairs and conferences
•The city ended 2011 with a positive performance across all tou-rism indicators, achieving four new highs: surpassing the 15.5 million hotel overnights mark, 2.6 million cruise passengers, 7.3 million tourists and 1,900 million Euros tourist expenditure on credit cards.
• In 2011, Barcelona stood in third position in the world ranking of organizers of exhibitions and congresses behind Vienna and Paris, and in fourth place regarding European destinations with most overnight hotel stays by international tourism, only beaten by London, Paris and Rome, but with the highest growth on this indicator. Moreover, according to the MasterCard Index of Global Destination Cities 2012, Barcelona is among the top 20 cities in the world in terms of number of visitors and spending by interna-tional tourists.
6

Barcelona Datasheet 2012 7
•Barcelona remains the top destination amongst Mediterranean cruise ports, with more than 2.6 million passengers. The port of Barcelona is ready for renewed growth given the internatio-nalization of the cruise passenger segment: the city has an airport with direct flights to major cities in North America, a significant fact considering that this nationality represents the majority of cruise passengers which visit the city.
The city is committed to a retail model base on quality, diversity and proximity
•With 16,379 companies and 146,676 employees, commerce is one of the most important areas of the economic structure of Barcelona. Indeed, despite the impact of the recession on activi-ty and levels of employment, this sector accounted for 22.7% of all social security contribution centres and 15.2% of employees in the city at the end of 2011.
•Municipal markets, with a total surface area of over 200,000 m2 and generating an economic impact of 1,000 million Euros, are one of the bedrocks of Barcelona’s model of retail because of their economic and social impact on the city’s neighbourhoods. They represent the largest fresh food market network in Europe.
•The rankings showing the attractiveness of commerce in 2011 regarding the preferences of international distribution companies, published by Jones Lang Lasalle, and international destinations rated by shoppers, according to the Globe Shoppers Cities Index 2011 by The Economist Intelligence Unit, both place Barcelona among the top ten most attractive European cities in terms of retail.
Barcelona, top city in europe for quality of life for the fourteenth consecutive year
•Barcelona has been voted Europe’s top city in terms of quality of life for workers for the fourteenth consecutive year, according to European Cities Monitor. The quality of life in the city is also implicitly recognized in The Economist´s Intelligence Unit’s report Hot Spots: Global City Competitive-ness in which Barcelona was placed fifth and ninth in terms of being a social and cultural capital and in terms of its global appeal respectively, among the 120 most competitive cities in the world.
•The city hopes to lead the transformation towards creating smarter and sustainable cities by creating a global standard or protocol for measuring the sustainability and capacity of urban areas to generate quality of life. The protocol involves a partnership between universities, cities and companies to define the parameters of change in a city based on envi-ronmental, cultural, social and economic factors guided by efficiency in the use of resources and excellence in design.
• In the environmental field, Barcelona’s compact Medite-rranean city model promotes sustainable mobility, which represents 81% of inner city trips by people, and this is emphasized in prestigious rankings like Scorecard on Pros-perity 2011 by the Toronto Board of Trade, which highlighted the moderate time taken to get from home to work. Also, Barcelona came in sixth position among the best European cities in terms of internal transportation, according to the European Cities Monitor. The city continues to work on de-veloping electric-powered mobility through the public-private platform LIVE (Logistics for the Implementation of the Electric Vehicle) and plan MOVELE, and in 2013 it will host the most important International Symposium on electric-powered technology and mobility for specialists in this sec-tor: the Electric Vehicle Symposium and Exhibition (EVS27).
•Also worth noting is that Barcelona is now a benchmark in Europe in terms of water saving. The consumption of water per capita was 109.5 litres/day in 2011 -23.4 litres less than in 1999- representing a reduction of almost 18%, significantly lower than those recorded in London (166.5 l/person/day), Paris (120 l/person/day), Rome (234 l/person/day 2011), Vancouver (320 l/person/day), Sao Paulo (177.8 l/ person/day) or New York (473.8 l/person/day). Also, Barcelona has been chosen to host the “Secretariat of the Global Alliance for Water Operators”, (Global Water Opera-tors Partnerships Alliance-GWOPA), a UN-Habitat agency and permanent secretariat of the world body for the management of water policy, for the next five years.
•The cultural and educational offer is wide and of great quality. In 2011, there were 35 international schools in the Barcelo-na area. In addition, there are 37 public libraries in the city.

POPULATION AND AREA DATA
POPULATION JANUARy 2011
(inhabitants)
% TOTAL SPANISh
POPULATION
AREA (km2)
DENSITy (inhab./
km2)
Barcelona 1,615,448 3.4 102.2 15,813
Metropolitan Region
4,777,042 10.1 3,242 1,473
Catalonia 7,539,618 16.0 32,108 235
Spain 47,190,493 100.0 505,986 93
one of europe’s main metropolitan areas01.
8
1.1. Population, area and climateBarcelona, heart of a mega-region with 25 million inhabitants
(*) Regions of the Barcelonès, Baix Llobregat, Maresme, Vallès Oriental and Vallès OccidentalSource: Barcelona City Council, Catalan Institute of Statistics (IDESCAT), National Statistics Institute (INE)
CLIMATE INDICATORS FOR BARCELONA, 2011
Average annual temperature 18.3 ºC
Highest temperature 33.0 ºC
Lowest temperature 1.4 ºC
Hours of sunshine per year 2,781.7
Source: Department of Statistics. Barcelona City Council. Statistical Yearbook 2012
1.2. Demographics of Barcelona
Age structure (%)
0-14 12.2
15-64 67.0
65 and over 20.8
Life expectancy (2010) 82.8 years
Men 79.3 years
Women 85.9 years
Birth rate 8.6‰
Mortality rate 8.9‰
Fertility rate 36.7‰Births per 1,000 womenbetween the ages of 15 and 49
Source: Department of Statistics. Barcelona City Council and the Barcelona Public Health Agency
DEMOGRAPhIC INDICATORS FOR BARCELONA, 2011WORLD’S METROPOLITAN AGGLOMERATIONS POPULATION
RANKING METROPOLITANAREA
POPULATION
1 Tokyo 34,670,000
2 New York 19,069,796
3 Shanghai 18,572,800
4 Los Angeles 12,874,797
5 London 12,300,000
6 Paris 12,000,000
7 Chicago 9,580,567
8 Hong Kong 7,033,500
9 Madrid 6,200,000
10 Toronto 5,623,450
11 Berlin 5,000,000
12 Barcelona 4,777,042
13 Boston 4,588,680
14 Sydney 4,504,500
15 San Francisco 4,317,853
Source: Toronto Board of Trade 2011. Department of Statistics. Barcelona City Council

Barcelona Datasheet 2012 9
39.4%
30.9%
22.2%
7.3%0.1%
1.3. Foreign populationcosmopolitan, diverse and multicultural city
FOREIGNERS AS A PERCENTAGE OF ThE GENERAL POPULATION,January 2012
20
18
16
14
12
10
8
6
4
2
0
2000 2001 2002 2003 2004 2005 2006 2007 2008 2009 2010 2011 2012
1.9%
6.3%
7.6%
10.7%
12.8%
14.2%
15.9%15.6%
17.3%18.1%
17.6%17.3%
Note: data as of 1 January each yearSource: Department of Statistics. Barcelona City Council
FOREIGNERS IN BARCELONA By CONTINENT OF ORIGIN, January 2012
America
OceaniaAfrica
Asia
Europe
Source: Department of Statistics. Barcelona City Council
Pakistan 23,281
Italy 22,909
China 15,875
Ecuador 15,511
Bolivia 14,154
Morocc 13,674
Peru 13,464
Colombia 12,328
France 11,922
Philippines 8,482
Dominican Republic 7,614
Argentina 7,469
Romania 6,906
Brazil 6,802
Germany 6,582
United Kingdom 5,753
India 5,538
Honduras 4,955
Chile 4,723
Paraguay 4,506
Mexico 4,481
Other countries 65,249
Total foreign population 282,178
FOREIGNERS IN BARCELONA By COUNTRy, January 2012
Source: Department of Statistics. Barcelona City Council
17.4%

02.
10
economic engine with a diversified structure
2.1. Economic activity and growthcatalonia generates one fifth of Spain’s GDP
BARCELONA AND ThE BARCELONA METROPOLITAN REGION. GROSS DOMESTIC PRODUCT AT MARKET PRICES (GDP) (1), 2008
GDP MP(Millions of euros)
GDP per inhabitant(Thousands of euros)
Index Catalonia=100
Barcelona 64,521 39.9 137.4
Metropolitan Region* 144,964 - -
(1) GDP 2008. Base 2000. Valued at market price(*) Regions of the Barcelonès, Baix Llobregat, Maresme, Vallès Oriental and Vallès OccidentalSource: IDESCAT
GROSS DOMESTIC PRODUCT AT MARKET PRICES (Current prices) In millions of €
CATALONIA SPAIN % OF SPAIN
2009 204,129 1,047,831 19.5
2010 205,555 1,051,342 19.6
2011 210,150 1,073,383 19.6
Source: IDESCAT, INE
GDP PER CAPITA Adjusted for purchasing power parity*. 2011 Index (EU-27=100)
Catalonia 117.2
Spain 99.0
Euro Zone 108.0
European Union 100.0
*Harmonized GDPSource: Eurostat, INE and IDESCAT
ANNUAL RATES OF VARIATION IN GDP AT CONSTANT PRICES (%)
2009 2010 2011
Barcelonès -2.6 0.2 n/d
Metropolitan Region -4.4 0.2 n/d
Catalonia -4.0 0.4 0.7
Spain -3.7 -0.3 0.4
European Union -4.3 2.1 1.5
Source: Eurostat, INE, IDESCAT and CatalunyaCaixa County Economic Yearbook 2011
2.2. Production specialisationDiversified structure with a predominance of services and significant industrial-based clusters
PRODUCTION STRUCTURE.SALARIED WORKERS By ECONOMIC SECTOR (%), IV Quarter 2011
BARCELONA BMR CATALONIA SPAIN
Agriculture 0.0 0.1 0.3 0.4
Industry 8.8 16.1 17.8 15.0
Construction 3.5 4.8 5.5 6.3
Services 87.7 79.1 76.4 78.3
Total 100.0 100.0 100.0 100.0
Source: Department of Statistics. Barcelona City Council and the National Institute of Social Security (INSS)
BARCELONA. GROSS VALUE ADDED (GVA) (1), 2008. FOR 11 AREAS OF ACTIVITy % OF TOTAL
Agriculture, cattle, forestry and fishing 0.1
Energy, chemicals, rubber and metalwork 3.9
Food, textile, wood, paper and publishing 3.6
Machinery, electronics and transport 3.7
Construction 6.2
Retail and repairs 10.9
Hotels 7.2
Transport, storage and communication 9.6
Financial advisory 7.7
Business services and real estate activity 25.6
Other services 21.5
Total sectors 100.0
(1) GVA 2008. Base 2000. Value at basic pricesSource: IDESCAT

Barcelona Datasheet 2012 11
2.3. CompaniesBusiness fabric with entrepreneurial spirit and predominance of SMes
TRADING COMPANIES
2009 2010 2011 % OF SPAIN
Created in the city of Barcelona 6,223 6,094* 6,416* 7.6
Created in the province of Barcelona 11,432 11,376 12,335 14.5
Created in Catalonia 14,612 14,382 15,641 18.4
Created in Spain 78,204 79,994 84,812 100.0
Closed in the province of Barcelona 1,163 1,338 1,473 7.4
Closed in Catalonia 2,356 2,565 2,652 13.4
Closed in Spain 17,416 18,500 19,784 100.0
*Provisional dataSource: INE
BUSINESSES IN BARCELONA* By NUMBER OF SALARIEDWORKERS, 2011
NUMBER OF COMPANIES
% OF TOTAL
No salaried workers 263,257 58.1
With salaried workers:
1 to 199 salaried workers 189,271 41.7
Over 199 salaried workers 957 0.2
Total companies 453,485 100.0
* Provincial data January 2011Source: INE. Central Business Directory (DIRCE)
COMPANy hEADQUARTERS, 2011*
NUMBER OF COMPANIES
% OF SPANIShTOTAL
Barcelona 174,926 5.4
Barcelona province 453,485 14.0
Catalonia 601,801 18.5
Spain 3,250,576 100.0
* Provincial data January 2011Source: INE. Central Business Directory (DIRCE)
ENTREPRENEURIAL ACTIVITy IN EUROPEAN COUNTRIES2011 (% population aged 18-64)
*Provincial dataSource: Global Entrepreneurship Monitor (GEM), Executive Report Catalonia 2011
14.2%
9.0%
8.2%
8.0%
7.6%
7.5%
7.3%
7.2%
7.0%
6.8%
6.6%
6.3%
5.8%
5.8%
5.7%
5.6%
4.6%
Slovakia
Poland
Netherlands
Greece
European Union
Portugal
United Kingdom
Ireland
Barcelona*
Catalonia
Switzerland
Finland
Sweden
Spain
France
Germany
Denmark

03.
12
Qualified human capital
3.1. Activity, employment and unemployment ratesactivity and employment rates above the european average
ACTIVITy, EMPLOyMENT AND UNEMPLOyMENT RATES (%). IV Quarter 2011
ACTIVITy RATE EMPLOyMENT RATE
UNEMPLOyMENT RATE
Barcelona 79.6 65.9 17.2
Catalonia 78.1 61.9 20.7
Spain 74.8 57.6 23.0
European Union 71.4 64.3 10.0
* Specific rates (16-64 years old)Source: Labour Force Survey (EPA) and Eurostat
3.2. Number of jobs a Barcelonanearly 1 million jobs in the city, 2.3 million in the metropolitan area
WORKERS AFFILIATED WITh ThE SOCIAL SECURITy. IV Quarter 2011
TOTAL % OF SPANISh TOTAL
Barcelona 992,231 5.8
Province of Barcelona 2,274,116 13.3
Catalonia 3,001,447 17.5
Spain 17,111,792 100.0
Source: Department of Statistics. Barcelona City Council
% WORKERS WITh UNIVERSITy STUDIES* 2010
WOMEN TOTAL
Catalonia 41.4 36.9
Spain 42.7 37.8
European Union 33.7 30.7
* % of the employed population between 25 and 64 with a university degreeSource: Eurostat
3.3. SalariesInternationally competitive salaries
SALARy LEVEL IN WORLD CITIES, 2012
GROSS SALARy (New york = 100)
CITy NET SALARy (New york = 100)
131.1 Zurich 132.4
123.6 Geneva 119.2
123.1 Copenhagen 93.4
92.4 Tokyo 90.4
83.3 Chicago 80.6
91.5 Munich 76.0
79.5 London 75.2
78.1 Paris 73.6
80.2 Vienna 70.8
78.3 Amsterdam 69.4
76.2 Montreal 66.2
64.2 Lyon 64.7
59.6 Barcelona 58.7
42.8 Hong Kong 49.8
55.1 Rome 48.2
41.4 Athens 40.0
Source: UBS. Prices and Earnings around The Globe 2012
3.4. Training and universities
TRAINING AND UNIVERSITIES, 2010-2011
Total number of students in Catalonia 247,571
Total number of students in the Barcelona area* 200,989
Number of masters courses offered at universities in the Barcelona area
436
Number of students on masters and doctorate courses in the Barcelona area
29,051
Number of foreign students in Public Universities in Catalonia
14,732
Number of foreign students on masters and doctorate courses in Public Universities in Catalonia
8,677
*includes doctorate studentsSource: Department of Statistics, Barcelona City Council and Secretary for Universities and Research, Government of Catalonia

Barcelona Datasheet 2012 13
3.5. Business Schools of ExcellenceBusiness schools, universities and global Masters of excellence with international reach
BEST EUROPEAN BUSINESS SChOOLS, 2012
EUROPEAN RANKING 2012
WORLD RANKING 2012
BUSINESS SChOOL CITy
1 4 London Business School London
2 6 Insead Fontainebleau
3 8 IE Business School Madrid
4 9 Iese Business School Barcelona
5 13 IMD Lausanne
6 18 HEC Paris Paris
7 20 University of Oxford: Saïd Oxford
8 26 University of Cambridge: Judge Cambridge
9 27 Warwick Business School Coventry
10 30 Rotterdam School of Management, Erasmus University Rotterdam
11 31 Manchester Business School Manchester
12 33 Esade Business School Barcelona
13 36 Cranfield School of Management Cranfield
14 38 City University: Cass London
15 42 SDA Bocconi Milan
16 46 Imperial College Business School London
17 65 Hult International Business School London
18 70 Vlerick Leuven Gent Management School Gant
19 71 Lancaster University Management School Lancaster
20 83 University of Edinburgh Business School Edinburgh
21 86 Birmingham Business School Birmingham
22 86 University College Dublin: Smurfit Dublin
23 91 Aston Business School Birmingham
24 93 University St Gallen Switzerland
25 94 Durham Business School Durham
26 95 Bradford School of Management/TiasNimbas Business Bradford
Source: Financial Times, Global MBA Ranking

14
04. city of knowledge and creativity
4.1. Knowledge economy and societyThe city is leading Spain’s progress towards the knowledge economy
COMPANIES By KNOWLEDGE INTENSITy, 2011*
BARCELONA % OF TOTAL CATALONIA % OF TOTAL
High-technology industrial sectors 172 0.2 718 0.3
Mid-to-high-technology industrial sectors 575 0.8 4,155 1.7
Knowledge-intensive service sectors 19,897 27.6 52,091 21.0
TOTAL KNOWLEDGE-INTENSIVE COMPANIES 20,644 28.7 56,964 23.0
Rest of companies 51,369 71.3 190,558 77.0
TOTAL COMPANIES IN THE CITY 72,013 100.0 247,522 100.0
*4th quarter dataSource: Department of Enterprise and Labour of Catalonia
DISTRIBUTION OF SALARIED WORKERS By ECONOMIC SECTOR ACCORDING TO KNOWLEDGE INTENSITy, 2011*
BARCELONA % OF TOTAL CATALONIA % OF TOTAL
High-technology industrial sectors 8,212 1.0 27,578 1.2
Mid-to-high-technology industrial sectors 30,214 3.5 113,932 4.8
Knowledge-intensive service sectors 412,511 48.4 880,095 37.4
TOTAL KNOWLEDGE-INTENSIVE SALARIED WORKERS 450,937 52.9 1,021,605 43.4
Rest of salaried workers 402,195 47.1 1,333,288 56.6
TOTAL SALARIED WORKERS 853,132 100.0 2,354,893 100.0
*4th quarter dataSource: Department of Enterprise and Labour of Catalonia
ICT IN ThE hOME(% OF POPULATION BETWEEN 16 AND 74)
2010 2011 ChANGE (%)2010-2011
Have a computer at home 75.7 79.0 3.3
Internet connection at home 72.4 75.7 3.3
Use the Internet regularly 78.3 82.1 3.8
Source: Survey on equipment and use of information and communication technology in the home (INE)

Barcelona Datasheet 2012
1996 1997 1998 1999 2000 2001 2002 2003 2004 2005 2006 2007 2008 2009 2010
50,000
45,000
40,000
35,000
30,000
25,000
20,000
15,000
10,000
18,395
46,335
47,32446,520
43,037
40,867
37,86236,634
33,411
28,03426,03725,107
21,89620,023
17,773
15
4.2. ResearchQualitative and quantitative commitment to research, with international benchmark science facilities EVOLUTION OF R&D EXPENDITURE AS A PERCENTAGE OF GDP IN CATALONIA AND SPAIN, 1996-2010
EVOLUTION OF R&D PERSONNEL. CATALONIA, 1996-2010
INTERNATIONAL BENChMARK SCIENCE AND TEChNOLOGy FACILITIES IN BARCELONA, 2012
Barcelona Supercomputing Centre - National Supercomputing Centre (BSC-CNS)
Maritime Research and Experimentation Channel (CIEM)
Catalan Supercomputing Centre (CESCA)
Barcelona Nuclear Magnetic Resonance Laboratory (LRB)
National Microelectronics Centre White Room (IMB-CNM)
ALBA Synchrotron - Cells
Source: Ministry of Economy and Competitiveness. Map of unique science and technology facilities
TOP WORLD CITIES IN TERMS OF SCIENTIFIC PRODUCTION, 2011
WORLD RANKING
EUROPEAN RANKING
Beijing 1 -
London 2 1
Tokyo 3 -
Seoul 4 -
Paris 5 2
Boston 6 -
New York 7 -
Shanghai 8 -
Moscow 9 3
Madrid 10 4
Los Angeles 11 -
Barcelona 12 5
Baltimore 13 -
Toronto 14 -
Rome 15 6
São Paulo 16 -
Philadelphia 17 -
Chicago 18 -
Houston 19 -
Berlin 20 7
Source: Polytechnic University of Catalonia - Centre for Land Policy and Assessment
Source: INE
* Data 2009 and 2010 for Spain calculated with respect to base 2008 GDP.Source: INE
Catalonia Spain
1.05 1.061.12
1.201.27
1.35
1996 1997 1998 1999 2000 2001 2002 2003 2004 2005 2006 2007 2008 2009* 2010*
1.8
1.6
1.4
1.2
1.0
0.8
0.6
0.810.87 0.86
0.91 0.910.99
0.80
1.35
0.900.92
1.061.03
1.06 1.041.19
1.271.33
1.421.48
1.611.68
1.63
1.39 1.39

16
4.3. Business innovationBarcelona and catalonia, leaders in innovation among Spanish businesses
INNOVATION INDICATORS
PATENT APPLICATIONS
UTILITyMODEL APPLICATIONS
2011 % of Spain 2011 % of Spain
Barcelona 522 14.8 505 19.5
Catalonia 625 17.7 629 24.3
Spain 3,528 100.0 2,585 100.0
Source: Spanish Patent and Trademark Office
NUMBER OF INNOVATIVE COMPANIES
EXPENDITURE ON INNOVATION (thousands €)
2010 % of Spain 2010 % of Spain
Catalonia 5,334 21.6 3,642,187 22.5
Spain 24,645 100.0 16,171,218 100.0
Source: INE
4.4. Creative sectorsMore than half of all catalonia’s jobs in creative industries are in Barcelona
EMPLOyMENT IN CREATIVE INDUSTRIES, 2010
BARCELONA % OF CATALONIA
Heritage-related activities 2,424 65.7
Architecture and engineering 11,839 41.8
Graphic arts and printing 3,793 20.2
Cinema, video and music 3,284 59.8
Design and photography 6,257 61.4
Publishing 10,421 73.3
Writing, theatre arts, visual arts and artisans
4,453 71.4
Creative research and development 8,434 58.3
Fashion 2,169 14.6
Advertising 13,130 68.5
Radio and television 1,360 28.6
Software, videogames and e-publishing 21,244 69.1
Total creative industries 88,808 52.0
Source: Barcelona Institute of Regional and Metropolitan Studies, IERMB

Barcelona Datasheet 2012 17
05. competitive supply of real estate for businesses
MARKET FOR OFFICES, 2011
Total office space 5,953,995 m2
Available office space 792,477 m2
Vacancy rate 13.3 %
Source: Jones Lang Lasalle. On point
5.1. Offices Wide range of premises for high value added economic activities
OFFICE PRICES, 2011
7 8 9 10 11 12 13 14 15 16 17 18 19
14.75-18.50€ m2/month
7-10€ m2/month
10-16€ m2/month
9.50-16.25€ m2/month
Source: Jones Lang Lasalle. On point
Prime (Pg. Gràcia-Diagonal)
Business district (consolidated centre)
Periphery (Sabadell, St. Cugat, Esplugues, etc.)
New business areas
TOP TEN MOST ATTRACTIVE DESTINATIONS FOR INTERNATIONAL RETAIL COMPANIES, 2012
RANKING CITy
1 London
2 Paris
3 Moscow
4 Madrid
5 Milan
6 Prague
7 Barcelona
8 Munich
9 Istanbul
10 Rome
Source: Jones Lang Lasalle, Real Estate
5.2. Premises for commerce
18
06. an economy that is open to the world
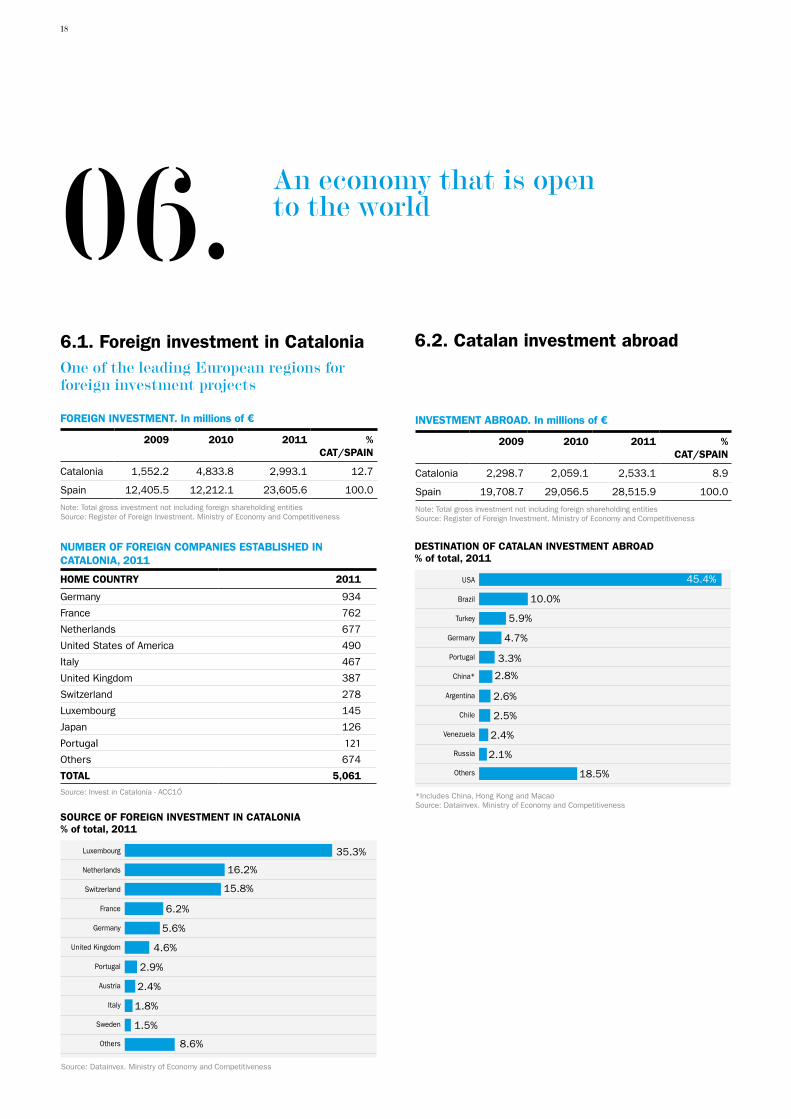
6.1. Foreign investment in Cataloniaone of the leading european regions for foreign investment projects
FOREIGN INVESTMENT. In millions of €
2009 2010 2011 % CAT/SPAIN
Catalonia 1,552.2 4,833.8 2,993.1 12.7
Spain 12,405.5 12,212.1 23,605.6 100.0
Note: Total gross investment not including foreign shareholding entitiesSource: Register of Foreign Investment. Ministry of Economy and Competitiveness
NUMBER OF FOREIGN COMPANIES ESTABLIShED IN CATALONIA, 2011
hOME COUNTRy 2011
Germany 934
France 762
Netherlands 677
United States of America 490
Italy 467
United Kingdom 387
Switzerland 278
Luxembourg 145
Japan 126
Portugal 121
Others 674
TOTAL 5,061Source: Invest in Catalonia - ACC1Ó
6.2. Catalan investment abroad
INVESTMENT ABROAD. In millions of €
2009 2010 2011 % CAT/SPAIN
Catalonia 2,298.7 2,059.1 2,533.1 8.9
Spain 19,708.7 29,056.5 28,515.9 100.0
Note: Total gross investment not including foreign shareholding entitiesSource: Register of Foreign Investment. Ministry of Economy and Competitiveness
SOURCE OF FOREIGN INVESTMENT IN CATALONIA% of total, 2011
Source: Datainvex. Ministry of Economy and Competitiveness
35.3%
16.2%
15.8%
6.2%
5.6%
4.6%
2.9%
2.4%
1.8%
1.5%
8.6%
Luxembourg
Netherlands
Switzerland
France
Germany
United Kingdom
Portugal
Austria
Italy
Sweden
Others
DESTINATION OF CATALAN INVESTMENT ABROAD% of total, 2011
*Includes China, Hong Kong and MacaoSource: Datainvex. Ministry of Economy and Competitiveness
45.4%
10.0%
5.9%
4.7%
3.3%
2.8%
2.6%
2.5%
2.4%
2.1%
18.5%
USA
Brazil
Turkey
Germany
Portugal
China*
Argentina
Chile
Venezuela
Russia
Others

Barcelona Datasheet 2012 19
6.3. ExportsThe Barcelona area is the leading exporter in Spain, with one fifth of all sales abroad
EXPORTS. In millions of €
2009 2010 2011* % of SPAIN 2011
Barcelona 32,480.8 38,073.9 42,036.2 19.6
Catalonia 41,460.9 48,866.3 55,524.7 25.9
Spain 159,889.6 186,780.1 214,485.5 100.0
* Provisional dataSource: Ministry of Economy and Competitiveness
MAIN DESTINATION COUNTRIES FOR EXPORTS FROM BARCELONA (PROVINCE). % of total, 2011
*Includes China, Hong Kong and MacaoSource: Ministry of Economy and Competitiveness
18.1%
9.6%
8.0%
7.0%
5.0%
5.4%
3.0%
2.6%
2.4%
2.3%
2.0%
1.9%
1.7%
1.4%
France
Germany
Italy
Portugal
Switzerland
United Kingdom
USA
Netherlands
Belgium
Turkey
China*
Mexico
Morocco
Poland
DISTRIBUTION OF EXPORTS FROM ThE PROVINCE OF BARCELONA By TEChNOLOGy CONTENT, 2011
DISTRIBUTION OF EXPORTS FROM SPAIN By TEChNOLOGy CONTENT, 2011
Source: Ministry of Economy and Competitiveness
■ High technology content
■ Medium-high technology content
■ Medium-low technology content
■ Low technology content
■ Not classified
46.9%
21.3%
16.5%
11.5%
3.8%
38.0%
4.4%
24.3%
25.2%
8.1%
Source: Ministry of Economy and Competitiveness
45,000
40,000
35,000
30,000
25,000
20,000
15,000
10,000
EVOLUTION OF EXPORTS FROM ThE PROVINCE OF BARCELONA. In millions of €, 1995 - 2011
1995 1996 1997 1998 1999 2000 2001 2002 2003 2004 2005 2006 2007 2008 2009 2010 2011

20
6.4. Port of Barcelonaone of the top twelve european container ports
6.5. Airport of BarcelonaTenth most important airport in number of passengers.Intercontinental flights to 27 destinations, with 132 flights per week in 2011
PORT OF BARCELONA INDICATORS
TRAFFIC (Data in millions)
2010 2011
Goods (tonnes) 43.0 43.1
Containers (TEU*) 1.9 2.0
Passengers 3.4 3.8
INFRASTRUCTURES
Surface area (ha) 1,065.3
Docks and berths (km) 20.3
*TEU= Standard measure of maritime transport equivalent to a 20-foot containerSource: Barcelona Port Authority
EUROPEAN RANKING OF CONTAINER PORTS, 2010
RANKING 2010 CITy PORT TEU % ChANGE 2009/10
1 Rotterdam 11,145,804 14.4%
2 Antwerp 8,468,475 15.9%
3 Hamburg 7,900,000 12.7%
4 Bremen 4,871,297 7.4%
5 Valencia 4,206,937 15.1%
6 Felixstowe 3,400,000 9.7%
7 Gioia Tauro 2,851,261 -0.2%
8 Algeciras 2,810,242 -7.6%
9 Istanbul 2,720,000 34.4%
10 Zeebrugge 2,500,000 7.4%
11 Le Havre 2,400,000 7.1%
12 Barcelona 1,945,735 8.1%
Source: Cargo Systems, Top 100 Container ports
BARCELONA EL PRAT AIRPORT
2010 2011
Total passengers 29,209,595 34,398,226
Goods (in tons) 104,280 96,573
Source: Spanish Airports Authority (AENA)
MAIN EUROPEAN AIRPORTS By PASSENGER VOLUME, 2011
CITy (AIRPORT) PASSENGERS
London Heathrow (LHR) 69,433,565
Paris Roissy (CDG) 60,970,551
Frankfurt (FRA) 56,436,255
Amsterdam (AMS) 49,754,910
Madrid (MAD) 49,644,302
Munich (ZHR) 37,763,701
Roma-Fiumicino (FCO) 37,651,222
Istanbul (IST) 37,398,221
Barcelona (BCN)* 34,398,226
London Gatwick (LGW) 33,668,048
(*) Data from AENASource: Airports Council International. Airport Traffic Report, 2011
AVE BARCELONA - MADRID
2010 2011
Passengers 2,602,300 2,604,500
Duration of Journey 2 hours 30 minutes
Source: Department of Statistics. Barcelona City Council
BARCELONA AIRPORT. INTERCONTINENTAL FLIGhTS By GEOGRAPhIC AREA, 2011
GEOGRAPhIC AREA
DESTINATION AIRPORTS
NUMBER OF WEEKLy FLIGhTS
TOTAL NUMBER OF DIRECT PASSENGERS
North America 6 34 931,213
Africa 11 52 568,972
Middle East 3 22 504,568
South America 3 13 253,807
Asia 4 11 149,862
27 132 2,408,422
Source: BCN Air Route Development Committee
Total direct intercontinental
Barcelona Datasheet 2012
07.
21
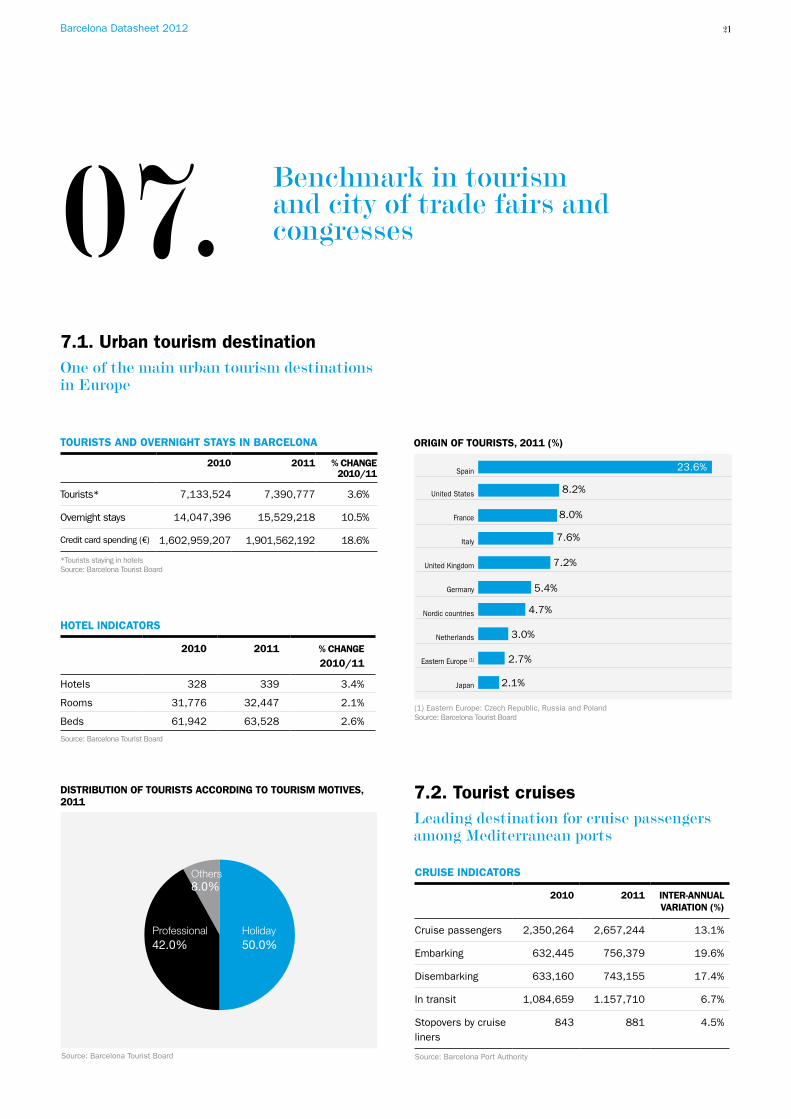
Benchmark in tourism and city of trade fairs and congresses
7.1. Urban tourism destinationone of the main urban tourism destinations in europe
TOURISTS AND OVERNIGhT STAyS IN BARCELONA
2010 2011 % ChANGE2010/11
Tourists* 7,133,524 7,390,777 3.6%
Overnight stays 14,047,396 15,529,218 10.5%
Credit card spending (€) 1,602,959,207 1,901,562,192 18.6%
*Tourists staying in hotelsSource: Barcelona Tourist Board
hOTEL INDICATORS
2010 2011 % ChANGE 2010/11
Hotels 328 339 3.4%
Rooms 31,776 32,447 2.1%
Beds 61,942 63,528 2.6%
Source: Barcelona Tourist Board
ORIGIN OF TOURISTS, 2011 (%)
(1) Eastern Europe: Czech Republic, Russia and PolandSource: Barcelona Tourist Board
23.6%
8.2%
8.0%
7.6%
7.2%
5.4%
4.7%
3.0%
2.7%
2.1%
Spain
United States
France
Italy
United Kingdom
Germany
Nordic countries
Netherlands
Eastern Europe (1)
Japan
7.2. Tourist cruisesleading destination for cruise passengers among Mediterranean ports
CRUISE INDICATORS
2010 2011 INTER-ANNUAL VARIATION (%)
Cruise passengers 2,350,264 2,657,244 13.1%
Embarking 632,445 756,379 19.6%
Disembarking 633,160 743,155 17.4%
In transit 1,084,659 1.157,710 6.7%
Stopovers by cruise liners
843 881 4.5%
Source: Barcelona Port Authority
DISTRIBUTION OF TOURISTS ACCORDING TO TOURISM MOTIVES, 2011
50.0%
8.0%
42.0%Professional
Others
Holiday
Source: Barcelona Tourist Board

22
7.3. City of fairs and congressesBarcelona, third city in the world for organising international meetings
CONGRESS ACTIVITy INDICATORS
2010 2011 % ChANGE 2010/11
Total meetings 2,138 2,283 6.8%
Congresses 310 255 -17.7%
Conferences, symposia, courses 226 378 67.3%
Conventions and incentives 1,602 1,650 3.0%
Total delegates 616,833 647,693 5.0%
Source: Barcelona Tourist Board and Barcelona City Council
RANKING CITy NUMBER OF MEETINGS
1 Vienna 181
2 Paris 174
3 Barcelona 150
4 Berlin 147
5 Madrid 130
6 London 115
7 Amsterdam 114
8 Istanbul 113
9 Budapest 108
10 Lisbon 107
Source: International Congress & Convention Association
WORLD RANKING OF CITIES By NUMBER OF INTERNATIONAL MEETINGS, 2011 BARCELONA TRADE FAIRS. BENChMARK IN EUROPE
BARCELONA TRADE FAIR
GSMA WORLD CONGRESS
ALIMENTARIA
HISPACK + BTA Foodstuff technologies
EIBTM
CARBON EXPO
PISCINA BCN. International Swimming Pool Fair
HOSTELCO
CONSTRUMAT
3E / EXPOQUIMIA + EQUIPLAST + EUROSURFAS
BARCELONA BRIDAL WEEK - NOVIAESPAÑA
GRAPHISPAG
SALÓ INTERNACIONAL DE L'AUTOMÒBIL
SALÓ NÀUTIC INTERNACIONAL DE BARCELONA
SMART CITY EXPO WORLD CONGRESS
Source: Fira de Barcelona

Barcelona Datasheet 2012 23
08.retail 09.Quality of life
7.3. City of fairs and congressesa model of quality, diverse and local retail, which generates economic activity and social cohesion in the city’s neighbourhoods
RETAIL IN BARCELONA
RETAIL (IV Quarter 2011)
Number of companies 16,379
Jobs 146,676
MUNICIPAL MARKETS (2011)
Food 39
Specialised 4
Number of establishments 2,785
Total floor area 208,465 m2
Turnover* 22,658 €
*Average sales per month and establishmentSource: Department of statistics and municipal markets Institute of the city of Barcelona
7.3. City of fairs and congressesTop european city in quality of life
BEST EUROPEAN CITIES IN TERMS OF QUALITy OF LIFEFOR WORKERS, 2011
RANKING CITy
1 Barcelona
2 Stockholm
3 Zurich
4 Geneva
5 Madrid
6 Munich
7 Copenhagen
8 Paris
8 Vienna
10 London
Source: Cushman & Wakefield, European Cities Monitor 2011
9.1. Energy and the environment commitment to energy saving, energy efficiency and the development of renewable energies GREEN ZONE INDICATORS IN BARCELONA, 2011
Urban parks (green zones for public use)
559.5 ha.
Urban green space (green spaces built into the urban fabric)
Per capita urban green space 6.8 m2/inhabitant
Source: Barcelona City Council. Statistics Yearbook 2011
BEAChES (NUMBER / km2) 7 / 4.41
ThE GLOBAL ShOPPER CITy INDEX - EUROPE
RANKING CITy GLOBAL INDEX
1 London 67.3
2 Barcelona 67.1
2 Madrid 67.1
4 Paris 65.5
5 Rome 62.9
6 Berlin 62.3
7 Lisbon 61.6
8 Amsterdam 61.3
9 Prague 59.7
10 Budapest 59.6
11 Milan 59.3
12 Viena 59.1
13 Istanbul 58.4
14 Dublin 57.6
15 Brussels 56.8
Notes: The index has a range from 0 to 100, with 100 being the best city for shopping. The index is made up of 22 indicators divided into 5 categories: shops, affordability, convenience, hotels and transport, culture and climate. The indicators and categories have equal weightings in the overall resultSource: Economist Intelligence Unit
10,981,127 m2

24
09.Quality of life
9.1. Energy and the environment commitment to energy saving, energy efficiency and the development of renewable energies
BREAKDOWN OF ENERGy USE By SECTOR (%), 2010*
* Data provisionalSource: City of Barcelona’s Energy Agency and Urban Habitat Area
EVOLUTION OF BARCELONA’S POPULATION, ENERGy CONSUMPTION AND GDP, 1999-2010 (1999=100)
EVOLUTION OF SELECTIVE WASTE COLLECTION IN BARCELONA
Source: Urban Habitat Area of the Barcelona City Council
40
30
20
10
0
2000 2005 2007 2009 2010 2011
11.1%
29.6%33.2% 33.6%
39.5%
125
120
115
110
105
100
95
901999 2000 2001 2002 2003 2004 2005 2006 2007 2008 2009 2010
Source: City of Barcelona’s Energy Agency and Urban Habitat Area
GDP PopulationTotal energy use
117.1
110.6
107.8
35.5%Domestic
28.4%Retail and services
24.5%Transport
11.6%Industry
37.9%
EVOLUTION OF WATER CONSUMPTION IN BARCELONA
200
180
160
140
120
100
80
60
40
2006 2007 2008 2009 2010 2011
Source: Department of Statistics and Urban Habitat Area of the Barcelona City Council
Global consumption
Domesticconsumption
182.8
165.3
109.5
178.2 169.9
164.9164.8
109.8
110.1
112.9
114.5
118.1
Industrialconsumption
64.7
63.7 57.0
54.8 55.0
55.8
litre
s/in
habi
tant
/day

Barcelona Datasheet 2012 25
9.2. Sustainable mobility Its compact urban model fosters the predo-minance of public transport, getting around on foot and by bike
MEANS OF TRANSPORT USED FOR TRAVEL INSIDE ThE CITy, % OF TOTAL, 2011
Source: ATMNote: Results of the analysis of data from ATM, the city’s traffic reccording systems, tourist activity, school transport, traffic composition flows, bicycle and pedestrian flows
48.6%On foot or
by bike33.8%Public
transport
17.6%Private
transport
BIKE LANES (km/public users) 181.5 /121,819
9.3. Residential real estate market adjustment in house prices
9.4. Culture and educationVibrant cultural life, with a wide variety of services and activities
CULTURE AND EDUCATION, 2011
Public libraries (number and users) 37 / 6,178,297
Museums, collections and exhibition centres (number and users)
40/18,604,402
Theatre, music and cinema audiences 12,213,301
Public sports facilities (number and members)
1,776 / 194,656
Infant, primary and secondary schools (2012)
944
Foreign schools in the Barcelona area (2012)
35
Source: Institute of Culture.Department of Statistics. Barcelona City Council
AVERAGE hOUSING PRICES IN BARCELONA, 2011
Rent (€/m2/month) 12.37
Second-hand housing sales (€/m2) 3,548
New housing sales (€/m2) 4,853
Source: Department of Statistics. Barcelona City Council and idealista.com
Source: Department of Statistics. Barcelona City Council
EVOLUTION OF DAILy MOVEMENTS By STAGES IN ThOUSANDS (2006-2011)
2,500
2,000
1,500
1,000
500
Source: ATM
On foot or by bike Private transportPublic transport
2006 2007 2008 2009 2010 2011

26
10. International positioning of Barcelona
European Cities Monitor (2011) 6th best European city for business2nd European city that has made most progress1st European city with quality of life for workers3rd European city best known as a business centre6th internal transport6th availability of office space11th value for money office space11th cost of staff
hot spots: Benchmarking Global City Competitiveness (2012)9th world global appeal5th world social and cultural character (with 5 other cities)9th world infrastructure (with 8 cities more) European cities and regions of the future (2012-2013)22nd city of Europe1st city of Southern Europe8th city with best qualified staff 4th foreign direct investment promotion
European Attractiveness Survey (2012)3rd European city in number of international investment projects
Cities for Citizens (2011)Most admired city for its urban development model Global Cities Investment Monitor (2012)10th best metropolis in the world for investment projects in the period 2007-20113rd investment in research centres10th investment in business headquarters6th and 17th Europe and the world respectively in international investor perceptions
Globe Shoppers Cities Index (2011)2nd in Europe (shared with another city)
Top ten most attractive cross-border retail destination in Europe (2012) 7th (shared with two cities) Best city in Europe for setting up a retail business
European Cities Marketing Benchmarking Report (2012)4th city with most international tourist overnights
World Country & City Rankings (2011)3rd world city for the organisation of international meetings
Worldwide cost of living survey (2012)Outside the top 45 most expensive cities in the world
Prices and Earnings (2012)World comparative of gross salaries29th global city
The global Fashion Capital (2011)The strength of brand in the internet and media7th global city

Barcelona Datasheet 2012 27
Montjuïc trade fair venue in Barcelona

With co-financing through
bcn.cat/barcelonagrowth