bar charts - …€¦ · web viewtask two on the ielts exam requires a student to write a 250...
TRANSCRIPT

Bar & Line Charts
Task one on the IELTS exam requires a student to transfer information from a chart, table, illustration, or diagram into a written report. You need to be able to give a
coherent interpretation of the data in the chart. You need to produce a report that gives an introduction and a body paragraph for each of the data sources. Task two on
the IELTS exam requires a student to write a 250 word essay.
Name: _____________________________
Number: _____________________________
Section: _____________________________
Teacher: Shanthi Tiru

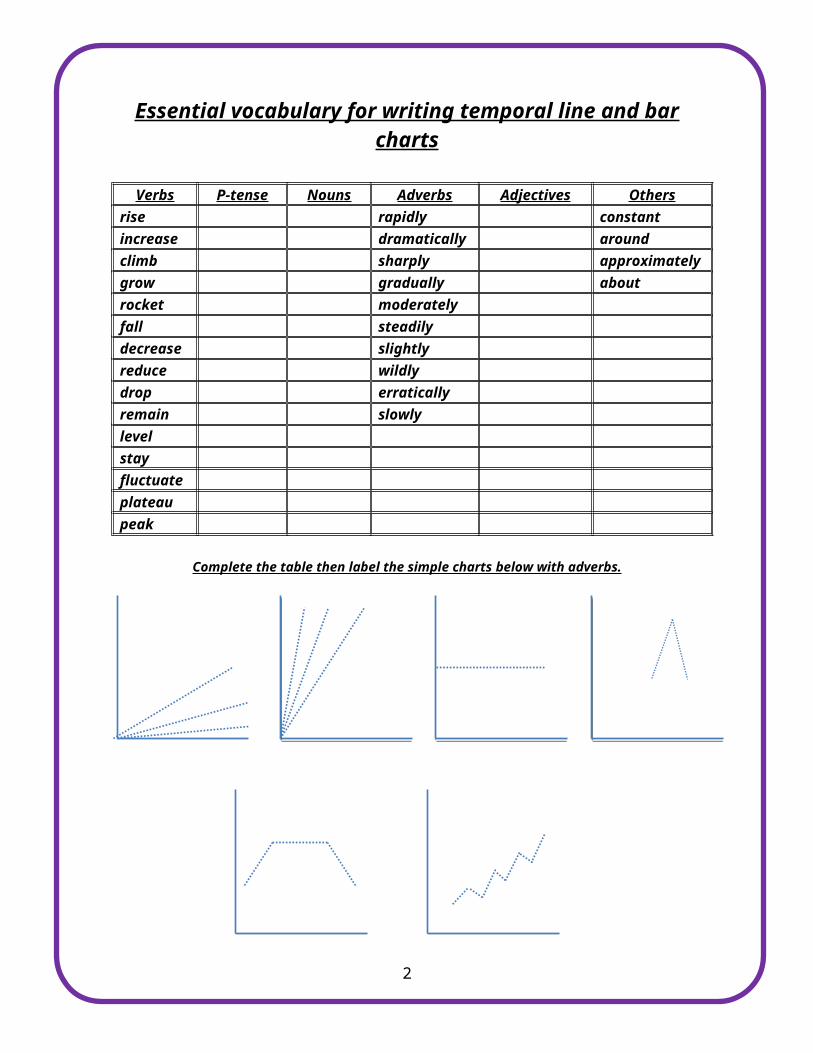
Essential vocabulary for writing temporal line and bar charts
Verbs P-tense Nouns Adverbs Adjectives Othersrise rapidly constantincrease dramatically aroundclimb sharply approximatelygrow gradually aboutrocket moderatelyfall steadilydecrease slightlyreduce wildlydrop erraticallyremain slowlylevelstayfluctuateplateaupeak
Complete the table then label the simple charts below with adverbs.
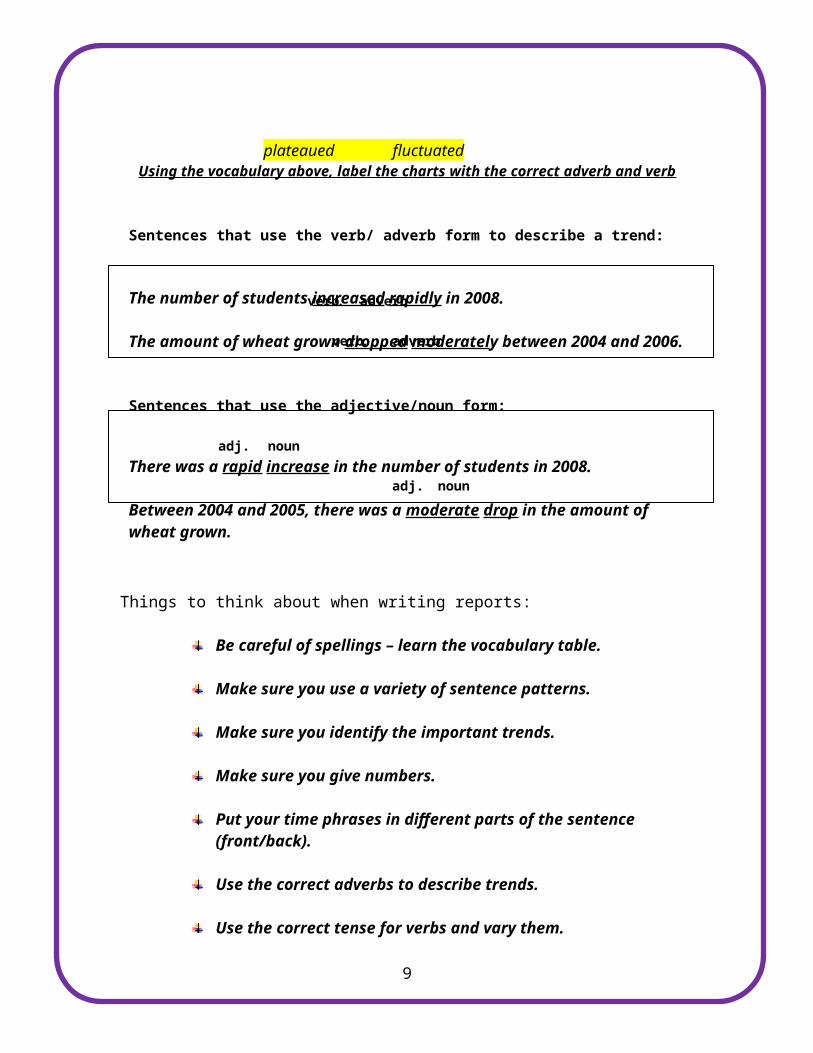
Using the vocabulary above, label the charts with the correct adverb and verb
1
Sentences that use the verb/ adverb form to describe a trend:
The number of students increased rapidly in 2008.
The amount of wheat grown dropped moderately between 2004 and 2006.
Sentences that use the adjective/noun form:
There was a rapid increase in the number of students in 2008.
Between 2004 and 2005, there was a moderate drop in the amount of wheat grown.
verb. adverb
verb. adverb.
adj. noun
adj. noun
Things to think about when writing reports:
Be careful of spellings – learn the vocabulary table.
Make sure you use a variety of sentence patterns.
Make sure you identify the important trends.
Make sure you give numbers.
Put your time phrases in different parts of the sentence (front/back).
Use the correct adverbs to describe trends.
Use the correct tense for verbs and vary them.
Don’t give too much information.
Check that you have an overall trend and that it is correct.
2
The population of rabbits in Queensland ___________ __________ during 1998.
The number of households owning more than one car ___________ ____________ between 2001 and 2003.
The number of students attending Oxford University _________ ______________ between 1997 and 200.
Stocks in computer chips ___________ __________ during December.
The amount of rainfall in the UAE ________ ____________ during July.
The number of homes owning more than one TV ________ ________ during September then __________ ________ during October and November.
TV ratings ________ at ten million on June 30th.
Sales of Play Station Three ___________ _________ during March then ____________ _____________ during April.
The number of people investing in on-line bonds ______________ during the months of February and March.
Sales of crude oil ________________ between 2 and 2.5 million barrels during May.

3
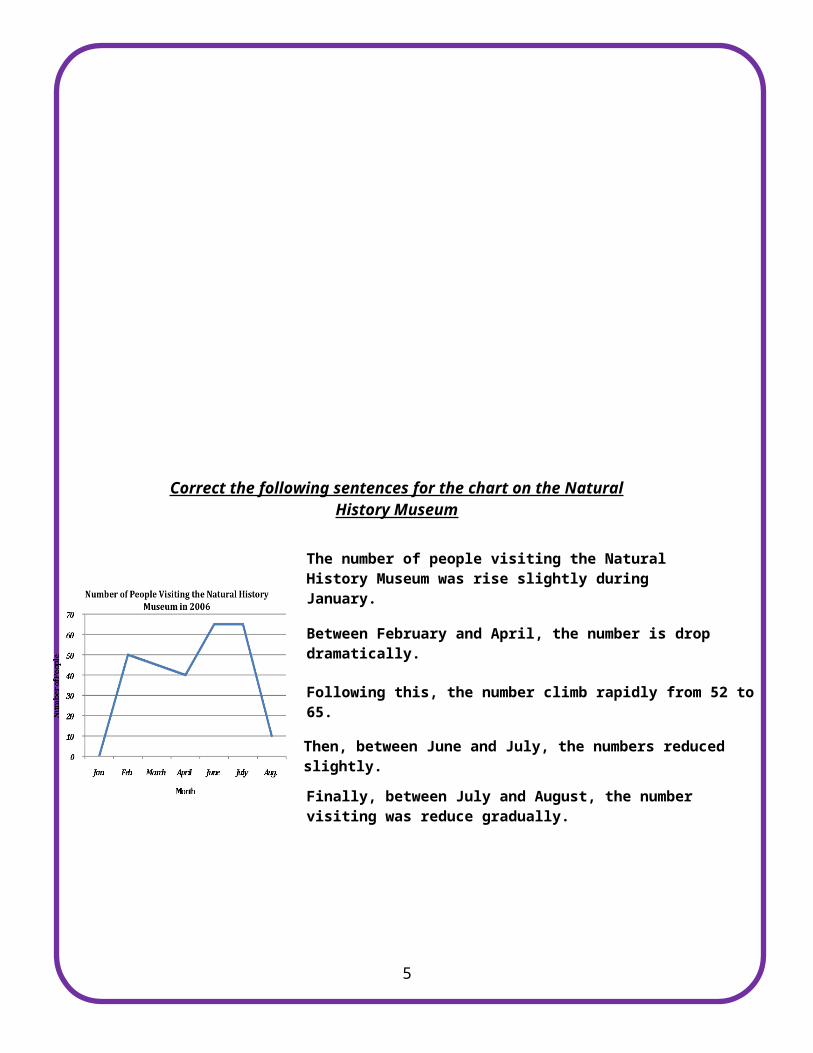
Correct the following sentences for the chart on the Natural History Museum
The number of people visiting the Natural History Museum was rise slightly during January.

4
Between February and April, the number is drop dramatically.
Following this, the number climb rapidly from 52 to 65.
Then, between June and July, the numbers reduced slightly.Finally, between July and August, the number visiting was reduce gradually.
Bar & Line Charts ( Amswers )
Task one on the IELTS exam requires a student to transfer information from a chart, table, illustration, or diagram into a written report. You need to be able to give a
coherent interpretation of the data in the chart. You need to produce a report that gives an introduction and a body paragraph for each of the data sources. Task two on
the IELTS exam requires a student to write a 250 word essay.
5
Name: _____________________________
Number: _____________________________
Section: _____________________________
Teacher: Shanthi Tiru

Essential vocabulary for writing temporal line and bar charts
Verbs P-tense Nouns Adverbs Adjectives Othersrise rose rise rapidly rapid constantincrease increased increase dramatically dramatic aroundclimb climbed climb sharply sharp approximatelygrow grew growth gradually gradual aboutrocket rocketed moderately moderatefall fell fall steadily steadydecrease decreased decrease slightly slightreduce reduced reduction wildly wilddrop dropped drop erratically erraticremain remained slowly slowlevel levelled levelling
outstay stayedfluctuate fluctuated fluctuationplateau plateaued plateaupeak peaked peak
Complete the table then label the simple charts below with some of the words in the table.
increased slowly increased dramatically remained constantpeaked
plateaued fluctuated Using the vocabulary above, label the charts with the correct adverb
and verb
6
Sentences that use the verb/ adverb form to describe a trend:
The number of students increased rapidly in 2008.
The amount of wheat grown dropped moderately between 2004 and 2006.
Sentences that use the adjective/noun form:
There was a rapid increase in the number of students in 2008.
Between 2004 and 2005, there was a moderate drop in the amount of wheat grown.
verb. adverb
verb. adverb.
adj. noun
adj. noun

Things to think about when writing reports:
Be careful of spellings – learn the vocabulary table.
Make sure you use a variety of sentence patterns.
Make sure you identify the important trends.
Make sure you give numbers.
Put your time phrases in different parts of the sentence (front/back).
Use the correct adverbs to describe trends.
Use the correct tense for verbs and vary them.
Don’t give too much information.
Check that you have an overall trend and that it is correct.
7
The population of rabbits in Queensland increased __________ during 1998.
The number of households owning more than one car remained constant ____________ between 2001 and 2003.
The number of students attending Oxford University increased moderately between 1997 and 200.
Stocks in computer chips climbed slightly during December.
The amount of rainfall in the UAE fell sharply during July.
The number of homes owning more than one TV rose moderately during September then stayed constant during October and November.
TV ratings peaked at ten million on June 30th.
Sales of Play Station Three dropped steadily during March then rose dramatically during April.
The number of people investing in on-line bonds plateaued during the months of February and March.
Sales of crude oil fluctuated between 2 and 2.5 million barrels during May.

8
Correct the following sentences for the chart on the Natural History Museum
For the above chart, write sentences that are similar to the above sentences.
1. ________________________________________________________________________________________
________________________________________________________________________________________
2. ________________________________________________________________________________________
________________________________________________________________________________________
3. ________________________________________________________________________________________
________________________________________________________________________________________
4. ________________________________________________________________________________________
________________________________________________________________________________________With your highlight pen, identify the parts of the bar chart you want to describe.
9
The number of people visiting the Natural History Museum was rose dramatically during January.
Between February and April, the number is dropped slightly.
Following this, the number climbed rapidly from 40 to 65.
Then, between June and July, the numbers plateaued.
Finally, between July and August, the number visiting was reduced sharply.

Look at the chart below and describe each part of the line.
Form a sentence for each part of the line and link the sentences using cohesion. Vary your use of time markers and verb and adverbs.
10
(in m
illio
ns)
H
G
F
A
B
C
D
E
A The number of rabbits in Queensland increased moderately from 1.5 million in 1993 to 2 million in 1995.

Write an introduction and an overall trend for the chart on rabbits.
General statement:
Overall trend:
11
B
C
D
E
F
G
H

Convert the following sentences into ones that use verbs as nouns and adverbs as adjectives. The first one is done as an example.
In 1994, the number rose gradually to 10 thousand tons.
Example: In 1994, there was a gradual rise to 10 thousand tons.
Following this, it increased slightly to 12 thousand in 1996.
Between 1996 and 1999, the number fluctuated rapidly.
Then, from 1999 to 2001, the number fell sharply to 3 thousand tons.
From 2002 to 2005, it fluctuated upwards from 3 to 7 thousand tons.
Next, it peaked at around 10 thousand in 2006.
Finally, the number dropped moderately to 7 thousand in 2007.
Body paragraph one (from the chart on p.6)
12

The number of students who _________ football at the UAEU ______ at _______ 85
students __ _____. __________ this, the ________ grew __________ to around 110 in
2004. Next, in 2006, there ____ a ________ at ______ 140 __________. ________,
between 2006 and 2008, ______ ____ a __________ drop to _______________ ___
students.
gradually was played Following 55 dramatic Finally about stood in 2000 there number students was approximately peak
around
Body paragraph two:
__ _____, the number of UAEU students _________ tennis ________ at 40. _____,
from 2000 to 2003, ___ ___________ up to approximately 60 _________. Following
this, there ____ a _______ rise to ________ 65 between 2003 ____ 2005. ________,
from 2006 to 2008, the number _________ out ___ around 55
was fluctuated Finally around leveled In 2000 playing slight at students it stood Next and
Body paragraph three:
In 2000, ____ _______ of students ____ ________ __________ stood at 60.
__________ _____, there _____ a ______ decrease to ______ 10 students ___ ______.
________ 2002 and 2003, ______ was a _______ _____ to 20. ________, in 2004, the
number _______ at around 65 while during the __________ four years ___ fell
___________ to about 20.
about it was rise played Finally Between following in 2001 peaked gradually who the there slight rapid Following
number this badminton
Using all that you have learned from the previous pages, write a report for the bar chart below. Think about your use of vocabulary, sentence patterns, and cohesion.
13

________________________________________________________________________
________________________________________________________________________
________________________________________________________________________
________________________________________________________________________
________________________________________________________________________
________________________________________________________________________
________________________________________________________________________
________________________________________________________________________
________________________________________________________________________
________________________________________________________________________
________________________________________________________________________
________________________________________________________________________
________________________________________________________________________
________________________________________________________________________
14

________________________________________________________________________
________________________________________________________________________
________________________________________________________________________
________________________________________________________________________
________________________________________________________________________
________________________________________________________________________
________________________________________________________________________
________________________________________________________________________
________________________________________________________________________
________________________________________________________________________
________________________________________________________________________
________________________________________________________________________
________________________________________________________________________
________________________________________________________________________
________________________________________________________________________
________________________________________________________________________
________________________________________________________________________
________________________________________________________________________
________________________________________________________________________
________________________________________________________________________
________________________________________________________________________
________________________________________________________________________
________________________________________________________________________
________________________________________________________________________
________________________________________________________________________
________________________________________________________________________
________________________________________________________________________
________________________________________________________________________
Write a 150 word report for a university lecturer on the bar graph below. Summarise the information by selecting and reporting the main features, and make comparisons where relevant.
15

________________________________________________________________________
________________________________________________________________________
________________________________________________________________________
________________________________________________________________________
________________________________________________________________________
________________________________________________________________________
________________________________________________________________________
________________________________________________________________________
________________________________________________________________________
________________________________________________________________________
________________________________________________________________________
________________________________________________________________________
________________________________________________________________________
________________________________________________________________________
________________________________________________________________________
________________________________________________________________________
16

________________________________________________________________________
________________________________________________________________________
________________________________________________________________________
________________________________________________________________________
________________________________________________________________________
________________________________________________________________________
________________________________________________________________________
________________________________________________________________________
________________________________________________________________________
________________________________________________________________________
________________________________________________________________________
________________________________________________________________________
________________________________________________________________________
________________________________________________________________________
________________________________________________________________________
________________________________________________________________________
________________________________________________________________________
________________________________________________________________________
________________________________________________________________________
________________________________________________________________________
________________________________________________________________________
________________________________________________________________________
________________________________________________________________________
________________________________________________________________________
________________________________________________________________________
________________________________________________________________________
Write a 150 word report for a university lecturer on the bar graph below. Summarise the information by selecting and reporting the main features, and make comparisons where relevant.
17

______________________________________________________________________________________
______________________________________________________________________________________
______________________________________________________________________________________
______________________________________________________________________________________
______________________________________________________________________________________
______________________________________________________________________________________
______________________________________________________________________________________
______________________________________________________________________________________
______________________________________________________________________________________
______________________________________________________________________________________
______________________________________________________________________________________
______________________________________________________________________________________
______________________________________________________________________________________
______________________________________________________________________________________
______________________________________________________________________________________
______________________________________________________________________________________
______________________________________________________________________________________
______________________________________________________________________________________
______________________________________________________________________________________
18

______________________________________________________________________________________
______________________________________________________________________________________
______________________________________________________________________________________
______________________________________________________________________________________
______________________________________________________________________________________
______________________________________________________________________________________
______________________________________________________________________________________
______________________________________________________________________________________
______________________________________________________________________________________
______________________________________________________________________________________
______________________________________________________________________________________
______________________________________________________________________________________
______________________________________________________________________________________
______________________________________________________________________________________
______________________________________________________________________________________
______________________________________________________________________________________
______________________________________________________________________________________
______________________________________________________________________________________
______________________________________________________________________________________
______________________________________________________________________________________
______________________________________________________________________________________
______________________________________________________________________________________
______________________________________________________________________________________
______________________________________________________________________________________
______________________________________________________________________________________
______________________________________________________________________________________
______________________________________________________________________________________
______________________________________________________________________________________
______________________________________________________________________________________
______________________________________________________________________________________
______________________________________________________________________________________
______________________________________________________________________________________
______________________________________________________________________________________
______________________________________________________________________________________
Write a 150 word report for a university lecturer on the bar graph below.
19

Summarise the information by selecting and reporting the main features, and make comparisons where relevant.
______________________________________________________________________________________
______________________________________________________________________________________
______________________________________________________________________________________
______________________________________________________________________________________
______________________________________________________________________________________
______________________________________________________________________________________
______________________________________________________________________________________
______________________________________________________________________________________
______________________________________________________________________________________
______________________________________________________________________________________
______________________________________________________________________________________
______________________________________________________________________________________
______________________________________________________________________________________
______________________________________________________________________________________
______________________________________________________________________________________
______________________________________________________________________________________
______________________________________________________________________________________
______________________________________________________________________________________
20

______________________________________________________________________________________
______________________________________________________________________________________
______________________________________________________________________________________
______________________________________________________________________________________
______________________________________________________________________________________
______________________________________________________________________________________
______________________________________________________________________________________
______________________________________________________________________________________
______________________________________________________________________________________
______________________________________________________________________________________
______________________________________________________________________________________
______________________________________________________________________________________
______________________________________________________________________________________
______________________________________________________________________________________
______________________________________________________________________________________
______________________________________________________________________________________
______________________________________________________________________________________
______________________________________________________________________________________
______________________________________________________________________________________
______________________________________________________________________________________
______________________________________________________________________________________
______________________________________________________________________________________
______________________________________________________________________________________
______________________________________________________________________________________
______________________________________________________________________________________
______________________________________________________________________________________
______________________________________________________________________________________
______________________________________________________________________________________
______________________________________________________________________________________
______________________________________________________________________________________
______________________________________________________________________________________
______________________________________________________________________________________
______________________________________________________________________________________
______________________________________________________________________________________
The following two charts are identical in their data. Choose one and write a 150 word report for a university lecturer on the line graph below.
21

Summarise the information by selecting and reporting the main features, and make comparisons where relevant.
______________________________________________________________________________________
______________________________________________________________________________________
22

______________________________________________________________________________________
______________________________________________________________________________________
______________________________________________________________________________________
______________________________________________________________________________________
______________________________________________________________________________________
______________________________________________________________________________________
______________________________________________________________________________________
______________________________________________________________________________________
______________________________________________________________________________________
______________________________________________________________________________________
______________________________________________________________________________________
______________________________________________________________________________________
______________________________________________________________________________________
______________________________________________________________________________________
______________________________________________________________________________________
______________________________________________________________________________________
______________________________________________________________________________________
______________________________________________________________________________________
______________________________________________________________________________________
______________________________________________________________________________________
______________________________________________________________________________________
______________________________________________________________________________________
______________________________________________________________________________________
______________________________________________________________________________________
______________________________________________________________________________________
______________________________________________________________________________________
______________________________________________________________________________________
______________________________________________________________________________________
______________________________________________________________________________________
______________________________________________________________________________________
______________________________________________________________________________________
______________________________________________________________________________________
______________________________________________________________________________________
______________________________________________________________________________________
______________________________________________________________________________________
______________________________________________________________________________________
23

______________________________________________________________________________________
______________________________________________________________________________________
______________________________________________________________________________________
______________________________________________________________________________________
______________________________________________________________________________________
______________________________________________________________________________________
______________________________________________________________________________________
______________________________________________________________________________________
______________________________________________________________________________________
______________________________________________________________________________________
______________________________________________________________________________________
______________________________________________________________________________________
______________________________________________________________________________________
______________________________________________________________________________________
______________________________________________________________________________________
______________________________________________________________________________________
______________________________________________________________________________________
______________________________________________________________________________________
______________________________________________________________________________________
______________________________________________________________________________________
______________________________________________________________________________________
______________________________________________________________________________________
______________________________________________________________________________________
______________________________________________________________________________________
______________________________________________________________________________________
______________________________________________________________________________________
______________________________________________________________________________________
______________________________________________________________________________________
______________________________________________________________________________________
______________________________________________________________________________________
______________________________________________________________________________________
______________________________________________________________________________________
______________________________________________________________________________________
______________________________________________________________________________________
The graph below compares the number of cars imported by three countries over a ten-year period.
24

Summarise the information by selecting and reporting the main features, and make comparisons where relevant.
______________________________________________________________________________________
______________________________________________________________________________________
______________________________________________________________________________________
______________________________________________________________________________________
______________________________________________________________________________________
______________________________________________________________________________________
______________________________________________________________________________________
______________________________________________________________________________________
______________________________________________________________________________________
______________________________________________________________________________________
______________________________________________________________________________________
______________________________________________________________________________________
______________________________________________________________________________________
______________________________________________________________________________________
______________________________________________________________________________________
______________________________________________________________________________________
______________________________________________________________________________________
______________________________________________________________________________________
25

______________________________________________________________________________________
______________________________________________________________________________________
______________________________________________________________________________________
______________________________________________________________________________________
______________________________________________________________________________________
______________________________________________________________________________________
______________________________________________________________________________________
______________________________________________________________________________________
______________________________________________________________________________________
______________________________________________________________________________________
______________________________________________________________________________________
______________________________________________________________________________________
______________________________________________________________________________________
______________________________________________________________________________________
______________________________________________________________________________________
______________________________________________________________________________________
______________________________________________________________________________________
______________________________________________________________________________________
______________________________________________________________________________________
______________________________________________________________________________________
______________________________________________________________________________________
______________________________________________________________________________________
______________________________________________________________________________________
______________________________________________________________________________________
______________________________________________________________________________________
______________________________________________________________________________________
______________________________________________________________________________________
______________________________________________________________________________________
______________________________________________________________________________________
______________________________________________________________________________________
______________________________________________________________________________________
______________________________________________________________________________________
______________________________________________________________________________________
______________________________________________________________________________________
26

The bar chart below illustrates the amount of carbon dioxide emitted by three Asian countries. Summarise the information by selecting and reporting the main features, and making comparisons where relevant.
________________________________________________________________________
________________________________________________________________________
________________________________________________________________________
________________________________________________________________________
________________________________________________________________________
________________________________________________________________________
________________________________________________________________________
________________________________________________________________________
________________________________________________________________________
________________________________________________________________________
________________________________________________________________________
________________________________________________________________________
________________________________________________________________________
27

________________________________________________________________________
________________________________________________________________________
________________________________________________________________________
________________________________________________________________________
________________________________________________________________________
________________________________________________________________________
________________________________________________________________________
________________________________________________________________________
________________________________________________________________________
________________________________________________________________________
________________________________________________________________________
________________________________________________________________________
________________________________________________________________________
________________________________________________________________________
________________________________________________________________________
________________________________________________________________________
________________________________________________________________________
________________________________________________________________________
________________________________________________________________________
________________________________________________________________________
________________________________________________________________________
________________________________________________________________________
________________________________________________________________________
________________________________________________________________________
________________________________________________________________________
________________________________________________________________________
________________________________________________________________________
________________________________________________________________________
________________________________________________________________________
________________________________________________________________________
28

The bar chart below illustrates the coal produced by three countries. Summarise the information by selecting and reporting the main features, and making comparisons where relevant.
________________________________________________________________________
________________________________________________________________________
________________________________________________________________________
________________________________________________________________________
________________________________________________________________________
________________________________________________________________________
________________________________________________________________________
________________________________________________________________________
________________________________________________________________________
________________________________________________________________________
________________________________________________________________________
________________________________________________________________________
29

________________________________________________________________________
________________________________________________________________________
________________________________________________________________________
________________________________________________________________________
________________________________________________________________________
________________________________________________________________________
________________________________________________________________________
________________________________________________________________________
________________________________________________________________________
________________________________________________________________________
________________________________________________________________________
________________________________________________________________________
________________________________________________________________________
________________________________________________________________________
________________________________________________________________________
________________________________________________________________________
________________________________________________________________________
________________________________________________________________________
________________________________________________________________________
________________________________________________________________________
________________________________________________________________________
________________________________________________________________________
________________________________________________________________________
________________________________________________________________________
________________________________________________________________________
________________________________________________________________________
________________________________________________________________________
________________________________________________________________________
30

________________________________________________________________________
________________________________________________________________________
The bar chart below illustrates the amount of oil produced by three Middle Eastern countries. Summarise the information by selecting and reporting the main features, and making comparisons where relevant.
________________________________________________________________________
________________________________________________________________________
________________________________________________________________________
________________________________________________________________________
________________________________________________________________________
________________________________________________________________________
31

________________________________________________________________________
________________________________________________________________________
________________________________________________________________________
________________________________________________________________________
________________________________________________________________________
________________________________________________________________________
________________________________________________________________________
________________________________________________________________________
________________________________________________________________________
________________________________________________________________________
________________________________________________________________________
________________________________________________________________________
________________________________________________________________________
________________________________________________________________________
________________________________________________________________________
________________________________________________________________________
________________________________________________________________________
________________________________________________________________________
________________________________________________________________________
________________________________________________________________________
________________________________________________________________________
________________________________________________________________________
________________________________________________________________________
________________________________________________________________________
________________________________________________________________________
________________________________________________________________________
________________________________________________________________________
________________________________________________________________________
________________________________________________________________________
________________________________________________________________________
________________________________________________________________________
32

________________________________________________________________________
________________________________________________________________________
________________________________________________________________________
________________________________________________________________________
Introduction
Main Body 1 – Human Population
33
The graph ______ the number of humans and animals (large and small)
in ______ from ______ to ______. ___ ______, the number of humans ______
______, w______ the number of both large and small animals decreased
over the ______.
1900 – 1940 2) 1940 – 2000
_______ at the number of humans, ______ 1900 ______ 1940,
it ______ ______ at ______ million, after which it ______ ______ from
______ million to ______ million, ______ and ______.

Main Body 2 – Large Animal Population
Main Body 3 – Small Animal Population
34
1900 – 1930 2) 1930 - 2000
______ humans, the ______ of large animals _____ ______ ______
13 million to a ______ of 22 million, ______ 1900 ______ 1930.
_______, ______ 1930 ______ 2000, it ______ ______ from _______ to _____ 5
million.
1900 – 1960 2) 1960 – 1970 3) 1970 – 2000
______ to large animals, the ______ of small animals ______ around _____
million, _____ 1900 _____ 1960, after ______ it _____ _____ to ______ in
1970. ______, from 1970 to 2000, the number ______ ______ ______ 10
million _____ 13 million.

Things to work on and think about – Report
Task Fulfillment:
You do not give an overview or you have introduction problems □You sometimes don’t give numbers □The description of the data is sometimes incorrect □You miss out on parts of the data □You do not meet the word count □Some data is repetitive □
Vocabulary:
You have some ( or many) spelling errors □You do not use a variety of vocabulary □You use wrong word forms □Some words are difficult to understand □Some words are repetitive □
Organization:
You do not use a good range of cohesive devices □You do not write enough paragraphs □You do not organize your data clearly □Some of the paragraphs can be difficult to follow □
Grammar:
You use mainly simple sentences □You use some compound sentences incorrectly □You use some complex sentences incorrectly □You have some punctuation errors □You have some capitalization errors □Use some pronouns incorrectly □The grammar makes it difficult sometime to understand □Some general problems with grammar □
35

36