banking systems around the globe: do regulation and ownership
TRANSCRIPT

This PDF is a selection from an out-of-print volume from the National Bureauof Economic Research
Volume Title: Prudential Supervision: What Works and What Doesn't
Volume Author/Editor: Frederic S. Mishkin, editor
Volume Publisher: University of Chicago Press
Volume ISBN: 0-226-53188-0
Volume URL: http://www.nber.org/books/mish01-1
Conference Date: January 13-15, 2000
Publication Date: January 2001
Chapter Title: Banking Systems around the Globe: Do Regulation and OwnershipAffect Performance and Stability?
Chapter Author: James R. Barth, Gerard Caprio Jr., Ross Levine
Chapter URL: http://www.nber.org/chapters/c10757
Chapter pages in book: (p. 31 - 96)

James R. Barth is the Lowder Eminent Scholar in Finance at Auburn University and aSenior Finance Fellow at the Milken Institute. Gerard Caprio Jr. holds the joint positions ofDirector, Financial Policy and Strategy, and Manager, Financial Sector Research, at theWorld Bank. Ross Levine is Professor of Finance at the Carlson School of Management,University of Minnesota.
The authors benefited from comments by Joseph Stiglitz, Mark Gertler, Rick Mishkin,and conference participants. The authors gratefully acknowledge the excellent research assis-tance provided by Teju Herath, Cindy Lee, and Iffath Sharif. The findings, interpretations,and conclusions expressed in this paper are entirely those of the authors and do not necessar-ily represent the views of the World Bank, its executive directors, or the countries they rep-resent.
1. For cross-country evidence supporting this relationship, see King and Levine (1993a,b);Levine and Zervos (1998); Beck, Levine, and Loayza (2000); and Levine, Loayza, and Beck(2000). In a similar vein, Rajan and Zingales (1998) provide cross-country, industry-levelevidence. Using firm-level data, Demirguc-Kunt and Maksimovic (1998) show that financialdevelopment increases economic growth whereas Wurgler (2000) shows the benefits of fi-nancial development for the allocation of investments across industries based upon theirgrowth opportunities. In a related context, Jayaratne and Strahan (1996) show that liberaliz-ing restrictions on interstate branching in the United States has led to more rapid stategrowth. More generally, Gertler (1988) and Levine (1997) provide literature reviews on theimportance of financial systems.
�2Banking Systems around the GlobeDo Regulation and OwnershipAffect Performance and Stability?
James R. Barth, Gerard Caprio Jr., and Ross Levine
2.1 Introduction
Financial systems in countries throughout the world range from fairlyrudimentary to quite sophisticated and from extremely fragile to relativelystable. A growing number of studies provide empirical evidence that well-functioning financial systems accelerate long-run economic growth byallocating funds to more productive investments than poorly developed fi-nancial systems.1 This convincing evidence has intensified calls for finan-cial sector reforms that improve financial system performance and therebypromote economic development.
31

2. The most notable exception is the Basel Committee on Banking Supervision’s proposednew capital adequacy framework, which provides for more risk classes and raises the possibil-ity of using credit ratings to set risk weights. For more information, see Caprio and Hono-han (1999).
Stable banking systems are an important component of well-functioningfinancial systems, as has been vividly demonstrated by recent develop-ments around the globe. When banking or, more generally, financial sys-tems temporarily break down or operate ineffectively, the ability of firmsto obtain funds necessary for continuing existing projects and pursuingnew endeavors is curtailed. Severe disruptions in the intermediation pro-cess can even lead to financial crises and, in some cases, undo years ofeconomic and social progress. Since 1980 more than 130 countries haveexperienced banking problems that have been costly to resolve and disrup-tive to economic development. This troublesome situation has led to callsfor banking reform by national governments and such international organ-izations as the World Bank and the International Monetary Fund. Apartfrom some fairly general proposals for reform, such as greater transpar-ency and an international financial authority, there are relatively few pro-posals for specific structural, regulatory, and supervisory reforms.2 This isunderstandable because there is relatively little empirical evidence to sup-port any specific proposal.
To determine specific banking reforms that will limit bank fragility andpromote well-functioning financial systems requires two steps. First, onemust obtain cross-country data on bank ownership, regulation, and super-vision. This enables one to establish the extent to which banks operate indifferent ownership, regulatory, and supervisory environments. Only byknowing the regulatory environment can one really know what a bank isor what a bank does in different countries. Surprisingly, such informationis not widely available from official sources for a wide range of countries.In practical terms, however, it is the regulatory environment that actuallydefines what is meant by the term bank. Second, one must use such datato assess the relationships between different environments and bank per-formance or, more generally, financial performance. Only by doing thiscan one really know whether banks matter. In other words, such an effortenables one to identify better those bank ownership, regulatory, and super-visory practices that will foster financial stability and enhance long-runeconomic growth.
The purposes of this paper are (a) to collect and report cross-countrydata on bank regulation and ownership and (b) to evaluate the links be-tween different regulatory/ownership practices and both financial sectorperformance and banking system stability. In so doing our paper helps fillthe gap between the questions posed by policymakers about how to reformbanking systems and the currently available evidence on the issue pro-
32 James R. Barth, Gerard Caprio Jr., and Ross Levine
3. For reviews of the literature regarding this issue, see Kwan and Laderman (1999) andSantos (1998a,b,c). Also, see Barth, Brumbaugh, and Yago (1997); Kane (1996); Krosznerand Rajan (1994); and White (1986) for discussions of some of these issues. On 12 November1999 laws in the United States restricting banks from engaging in securities and insuranceactivities were repealed (see Barth, Brumbaugh, and Wilcox 2000).
4. Camdessus (1997) describes this as: “the development of new types of financial instru-ments, and the organization of banks into financial conglomerates, whose scope is often hardto grasp and whose operations may be impossible for outside observers—even [sic!] bankingsupervisors—to monitor” (537).
duced by researchers. The paper in several respects substantially extendsthe preliminary investigation reported in Barth, Caprio, and Levine (1999).We do this by enlarging our earlier sample of forty-five countries to morethan sixty countries, updating existing data, materially improving the qual-ity of the data, adding new information on the banking environment indifferent countries, and testing additional hypotheses. We provide doc-umentation showing the substantial cross-country variation in regula-tory restrictions on various activities of banks, in legal restrictions on themixing of banking and commerce, and in the structure of bank owner-ship. Although we examine the socioeconomic determinants of regulatorychoices by governments, the focus is on examining which types of reg-ulatory practices and ownership structures are associated with well-functioning, stable banking systems.
Motivated by a long and divisive policy debate (especially in the UnitedStates)3 over the extent to which the activities of banks should be limited,this paper examines the following questions:
1. Do countries with regulations that impose tighter restrictions on theability of commercial banks to engage in securities, insurance, and realestate activities have (a) less efficient but (b) more stable financial systems?
2. Do countries that restrict the mixing of banking and commerce—both in terms of banks owning nonfinancial firms and nonfinancial firmsowning banks—have (a) less efficient but (b) more stable banking systems?
3. Do countries in which state-owned banks play a large role have morepoorly functioning financial systems?
Those who favor restricting commercial banks to traditional deposittaking and loan making argue that inherent conflicts of interest arise whenbanks engage in such activities as securities underwriting, insurance un-derwriting, real estate investment, and owning nonfinancial firms. Ex-panding the array of permissible activities, moreover, may provide greateropportunities for moral hazard to distort the investment decisions ofbanks, especially when they operate within a deposit insurance system(Boyd, Chang, and Smith 1998). Furthermore, in an unrestricted environ-ment, the outcome may be a few large, functionally diverse, and dominantbanks that could (a) complicate monitoring by bank supervisors and mar-ket participants4 and (b) lead to a more concentrated and less competitive
Banking Systems around the Globe 33

5. Mishkin (1999, 686), furthermore, states that the “benefits of increased diversificationopen up opportunities for reform of the banking system because it makes broad-based de-posit insurance less necessary and weakens the political forces supporting it.”
6. This may reflect the fact that in such a situation banks are limited to the extent thatthey can cover costs with fee income.
nonfinancial sector. Relatively few regulatory restrictions on commercialbanking activities and relatively few legal impediments to the mixing ofbanking and commerce may therefore produce less efficient and more frag-ile financial systems.
Those who favor substantial freedom with respect to the activities ofcommercial banks argue that universal banking creates more diversifiedand thereby more stable banks. Fewer regulatory restrictions may also in-crease the franchise value of banks and thereby augment incentives forbankers to behave more prudently, with positive implications for bank sta-bility. Furthermore, the opportunity to engage in a wide range of activitiesenables banks to adapt and hence provide more efficiently the changingfinancial services being demanded by the nonfinancial sector. Thus, fewerregulatory restrictions on the activities of commercial banks and the mix-ing of banking and commerce may produce more efficient and more stablefinancial systems.5 The lack of appropriate cross-country data, however,has impeded the ability to examine the relationship between commercialbank regulations and both the functioning and the stability of the finan-cial system.
This paper attempts to rectify this situation and in so doing providesthe following answers to the questions posed above. First, we do not finda reliable statistical relationship between regulatory restrictions on theability of commercial banks to engage in securities, insurance, and realestate activities and (a) the level of banking sector development, (b) securi-ties market and nonbank financial intermediary development, or (c) thedegree of industrial competition. Indeed, based on the cross-country evi-dence, it would be quite difficult for someone to argue confidently thatrestricting commercial banking activities impedes—or facilitates—finan-cial development, securities market development, or industrial competi-tion. We do, however, find that regulatory restrictions on the ability ofbanks to engage in securities activities tend to be associated with higherinterest rate margins for banks.6 Thus, even though there may be somenegative implications for bank efficiency due to restricting commercialbank activities, the main message is that there is little relationship betweenregulatory restrictions on banking powers and overall financial develop-ment and industrial competition.
Second, in terms of stability, we find a strong and robust link to theregulatory environment. Countries with greater regulatory restrictions onthe securities activities of commercial banks have a substantially higherprobability of suffering a major banking crisis. More specifically, countrieswith a regulatory environment that inhibits the ability of banks to engage
34 James R. Barth, Gerard Caprio Jr., and Ross Levine

7. For a view on ownership links that is relatively unfashionable today, see Lamoreaux(1994).
in the businesses of securities underwriting, brokering, dealing, and allaspects of the mutual fund business tend to have more fragile financialsystems. The positive link between regulatory restrictions and major oreven systemic banking crises, moreover, does not appear to be due to re-verse causation.
Third, we find no beneficial effects from restricting the mixing of bank-ing and commerce. We specifically examine (a) the ability of banks to ownand control nonfinancial firms and (b) the ability of nonfinancial firms toown and control commercial banks. There is not a reliable relationshipbetween either of these measures of mixing banking and commerce andthe level of banking sector development, securities market and nonbankfinancial intermediary development, or the degree of industrial compe-tition.
Fourth, restricting the mixing of banking and commerce is associatedwith greater financial fragility. Whereas restricting nonfinancial firms fromowning commercial banks is unassociated with financial fragility, re-stricting banks from owning nonfinancial firms is positively associatedwith bank instability. We find that those countries that restrict banks fromowning nonfinancial firms have a robustly higher probability of sufferinga major banking crisis. Thus, one of the major reasons for restricting themixing of banking and commerce—to reduce financial fragility—is notsupported by the cross-country evidence presented in this paper. Thisfinding is particularly notable in the wake of the East Asian crisis and thehaste with which many have concluded that all things Asian—includingclose ownership links—lead to crises. Besides the fact that for decadessuch links did not produce crises, our research shows that concerns aboutneither financial sector development nor financial fragility should promptcalls for a more restrictive environment.7
Fifth, greater state ownership of banks tends to be associated with morepoorly developed banks, nonbanks, and securities markets. In an inde-pendent study using alternative measures of bank ownership, La Porta,Lopez-de-Silanes, and Shleifer (2000) also examine the relationship be-tween government ownership and financial development. They convinc-ingly show that government ownership retards financial development.Thus, even though the proponents of state ownership of banks argue thatit helps overcome informational problems and better directs scarce capitalto highly productive projects, the data assembled here and by La Porta,Lopez-de-Silanes, and Shleifer (2000) tell a different story. On average,greater state ownership of banks tends to be associated with more poorlyoperating financial systems.
Besides documenting the substantial cross-country variation in commer-cial banking regulations and ownership, our analyses of the data highlight
Banking Systems around the Globe 35
some negative implications of imposing regulatory restrictions on the ac-tivities of commercial banks. Specifically, regulations that restrict the abil-ity of banks to (a) engage in securities activities and (b) own nonfinancialfirms are closely associated with greater banking sector instability. Theanalyses, moreover, suggest no countervailing beneficial effects from re-stricting the mixing of banking and commerce or from restricting the ac-tivities of banks in the areas of securities, insurance, and real estate.
The research upon which this paper is based is still ongoing, so ourpaper should be viewed as a progress report. We are collecting consider-ably more information about bank structure, regulation, and especiallysupervision, and the sample of countries is being enlarged. The new cross-country data that we are collecting on the supervisory environment willpermit us—and others—to investigate more fully the interrelated issuesof regulatory and supervisory practices or policies. To date, our effortsnonetheless represent substantial progress on understanding what a bankdoes in different countries and whether it matters. By publishing the ex-isting data and reporting the empirical results, we hope both to contributeto the ongoing debate over appropriate banking reforms and to facilitatefurther research on this important topic.
2.2 Bank Regulations and Ownership versus FinancialDevelopment and Industrial Competition
This section examines the relationship between commercial bankingregulations and state ownership of banks on the one hand and the level offinancial sector development and the degree of industrial sector competi-tion on the other. The objective is to assess whether governments thatrestrict the activities of banks, inhibit the mixing of banking and com-merce, and own a substantial fraction of the banking sector tend to have(a) more or less efficient and developed banks, (b) better or worse func-tioning securities markets and nonbank financial intermediaries, and(c) greater or lesser competition in the nonfinancial sector. To examine allthese issues, we constructed an extensive data set.
Section 2.2.1 introduces the regulatory and ownership variables. We de-fine the variables, briefly describe their construction, and present summarystatistics. Section 2.2.2 briefly describes the various measures of financialsector development and industrial competition that are employed. Section2.2.3 presents our regression results and a summary of our conclusions.
2.2.1 Regulatory Restrictions and Ownership
Data Collection and Definitions
We have constructed indexes on the degree to which government regula-tors permit commercial banks to engage in securities, insurance, and real
36 James R. Barth, Gerard Caprio Jr., and Ross Levine

estate activities. We have also constructed indexes on the degree to whichregulators permit commercial banks to own nonfinancial firms and viceversa. Furthermore, we have obtained information on the degree of stateownership of commercial banks. We have assembled this data and checkedits accuracy through a number of different channels. Specifically, we haveobtained the data used in this paper primarily from international surveysconducted independently by the Office of the Comptroller of the Currency(OCC) and the World Bank. We have confirmed the responses for as manycountries as possible using information from Barth, Nolle, and Rice(2000); the Institute of International Bankers (Global Survey, variousyears); Euromoney (Banking Yearbook, various years); and various centralbank and bank regulatory agency publications. When inconsistencies havearisen, we have—through the OCC and the World Bank—attempted tocommunicate with the relevant national regulatory authorities to resolvethem. Although some problems undoubtedly remain, we nonetheless be-lieve we have assembled the most accurate and comprehensive data oncommercial bank regulatory policies to date.
Bank Activities. We use measures of the degree to which national regula-tory authorities allow commercial banks to engage in the following three“nontraditional” activities: Securities, the ability of commercial banks toengage in the business of securities underwriting, brokering, dealing, andall aspects of the mutual fund industry; Insurance, the ability of banks toengage in insurance underwriting and selling; Real Estate, the ability ofbanks to engage in real estate investment, development, and management.
We have assessed each country’s regulations concerning these activitiesand rated the degree of regulatory restrictiveness for each activity from 1to 4, with larger numbers representing greater restrictiveness. The defini-tions of the designations are as follows:
1. Unrestricted: A full range of activities in the given category can beconducted directly in the commercial bank.
2. Permitted: A full range of activities can be conducted, but all or somemust be conducted in subsidiaries.
3. Restricted: Less than a full range of activities can be conducted inthe bank or subsidiaries.
4. Prohibited: The activity cannot be conducted in either the bank orsubsidiaries.
Mixing Banking and Commerce. We have constructed two measures of thedegree of regulatory restrictions on the mixing of banking and commerce.Again, we have rated the regulatory restrictiveness for each variable from1 to 4. The variable definitions and the definitions of the designations areas follows:
Banking Systems around the Globe 37

Nonfinancial Firms Owning Banks: the ability of nonfinancial firms toown and control banks.
1. Unrestricted: A nonfinancial firm may own 100 percent of the equityin a bank.
2. Permitted: Ownership is unrestricted with prior authorization or ap-proval.
3. Restricted: Limits are placed on ownership, such as a maximum per-centage of a bank’s capital or shares.
4. Prohibited: There is no equity investment in a bank.
Banks Owning Nonfinancial Firms: the ability of banks to own and con-trol nonfinancial firms.
1. Unrestricted: A bank may own 100 percent of the equity in any non-financial firm.
2. Permitted: A bank may own 100 percent of the equity in a nonfinan-cial firm, but ownership is limited based on a bank’s equity capital.
3. Restricted: A bank can only acquire less than 100 percent of theequity in a nonfinancial firm.
4. Prohibited: A bank may not acquire any equity investment in a non-financial firm.
State Ownership. We also have data on the degree of state ownership ofbanks:
Stateowned Bank Assets: State-owned bank assets as a share of totalcommercial bank assets.
In terms of timing, the data represent the regulatory environment in1997. In an earlier study, we collected information on these regulations fora smaller sample of countries in 1995. Even though there were very fewregulatory changes, some of our assessments changed as more informationbecame available. We discuss the issue of regulatory change as it relates toour findings in greater detail later when we examine the linkages betweenthe regulations and banking crises.
Summary Statistics
Table 2.1 lists the numerical values for each of the six indicators for theregulatory environment. We also compute a summary index of the firstfour indicators of the regulatory restrictions imposed on banks. Specifi-cally, Restrict equals the average of Securities, Insurance, Real Estate, andBanks Owning Nonfinancial Firms. Table 2.2 presents summary statisticsindicating the extensive cross-country variation in the data. For example,there were nine countries with very restrictive regulatory systems (Restrict� 3): Japan, Mexico, Rwanda, Ecuador, Barbados, Botswana, Indonesia,Zimbabwe, and Guatemala. The value for the United States is 3. There
38 James R. Barth, Gerard Caprio Jr., and Ross Levine

Tabl
e2.
1C
ount
ryD
ata
onB
ank
Reg
ulat
ions
and
Sta
teO
wne
rshi
pof
Ban
kA
sset
s
Ban
ksO
wni
ngN
onfin
anci
alSt
ate-
Ow
ned
Rea
lN
onfin
anci
alF
irm
sO
wni
ngB
ank
Secu
riti
esIn
sura
nce
Est
ate
Fir
ms
Res
tric
tB
anks
Ass
ets
Arg
enti
na3
22
32.
501
0.30
5A
ustr
alia
12
32
2.00
20.
000
Aus
tria
12
11
1.25
10.
044
Bar
bado
s3
43
43.
502
0.19
5B
elgi
um2
23
32.
501
0.00
0B
oliv
ia2
24
43.
001
0.00
0B
otsw
ana
24
44
3.50
20.
000
Bra
zil
22
33
2.50
10.
510
Can
ada
22
23
2.25
30.
000
Chi
le3
23
32.
753
0.23
8C
olom
bia
22
24
2.50
10.
19C
ypru
s2
24
32.
753
0.03
4D
enm
ark
12
22
1.75
10.
000
Ecu
ador
24
43.
33E
gypt
,Ara
bR
ep.
22
33
2.50
0.66
6E
lSal
vado
r2
24
43.
002
0.06
9F
iji2
34
22.
753
0.08
5F
inla
nd1
32
11.
751
0.41
1F
ranc
e2
22
22.
002
0.14
5T
heG
ambi
a2
42
43.
002
0.00
0G
erm
any
13
21
1.75
10.
429
Gha
na2
14
22.
252
0.38
8G
reec
e2
33
12.
251
0.62
8(c
onti
nued
)

Gua
tem
ala
44
43
3.75
20.
051
Guy
ana
13
33
1.75
30.
233
Hon
gK
ong
12
23
2.00
30.
000
Icel
and
22
43
2.75
10.
644
Indi
a2
44
23.
002
0.80
0In
done
sia
24
44
3.50
10.
415
Irel
and
14
11
1.75
10.
000
Isra
el1
11
11.
001
Ital
y1
23
32.
253
0.25
0Ja
pan
34
33
3.25
30.
000
Jord
an2
43
22.
751
0.00
0R
epub
licof
Kor
ea2
22
32.
253
0.00
0L
esot
ho2
43
33.
002
0.72
0L
uxem
bour
g1
31
11.
503
0.00
0M
adag
asca
r2
43
33.
002
0.22
0M
alay
sia
22
32
2.25
20.
096
Mal
ta1
33
32.
504
0.47
5M
exic
o3
43
33.
252
0.41
5N
ethe
rlan
ds1
22
11.
501
0.00
0N
ewZ
eala
nd1
11
21.
252
0.00
0N
iger
ia1
22
21.
750.
130
Tabl
e2.
1(c
onti
nued
)
Ban
ksO
wni
ngN
onfin
anci
alSt
ate-
Ow
ned
Rea
lN
onfin
anci
alF
irm
sO
wni
ngB
ank
Secu
riti
esIn
sura
nce
Est
ate
Fir
ms
Res
tric
tB
anks
Ass
ets

Nor
way
22
22
2.00
20.
376
Pak
ista
n2
43
12.
501
0.50
1P
eru
22
22
2.00
20.
000
The
Phi
lippi
nes
12
23
2.00
30.
198
Port
ugal
12
32
2.00
10.
170
Rw
anda
14
44
3.25
10.
000
Seyc
helle
s2
22
22.
002
0.36
4Si
ngap
ore
22
23
2.25
1So
uth
Afr
ica
22
11
1.50
20.
000
Spai
n1
23
11.
752
0.01
9Sr
iLan
ka2
22
22.
003
0.58
0Su
rina
me
11
13
1.50
30.
277
Swed
en4
23
33.
001
0.00
0Sw
itze
rlan
d1
11
31.
501
0.15
1T
anza
nia
23
43
3.00
20.
501
Tha
iland
22
23
2.25
30.
290
Tur
key
32
43
3.00
10.
365
Uni
ted
Kin
gdom
12
11
1.25
10.
000
Uni
ted
Stat
es3
33
33.
003
0.00
0U
rugu
ay3
23
43.
000.
455
Ven
ezue
la2
23
32.
503
0.07
2Z
imba
bwe
24
44
3.50
20.
246

Tabl
e2.
2S
umm
ary
Sta
tist
ics
for
Reg
ulat
ory
and
Sta
te-O
wne
rshi
pV
aria
bles
Ban
ksO
wni
ngN
onfin
anci
alSt
ate-
Ow
ned
Rea
lN
onfin
anci
alF
irm
sO
wni
ngB
ank
Res
tric
tSe
curi
ties
Est
ate
Insu
ranc
eF
irm
sB
anks
Ass
ets
Mea
n2.
401.
852.
672.
552.
551.
920.
21M
edia
n2.
382
32
32
0.15
Max
imum
3.75
44
44
40.
80M
inim
um1
11
11
10
Std.
Dev
.0.
670.
750.
980.
950.
970.
860.
23Sk
ewne
ss0.
000.
69�
0.18
0.47
�0.
260.
310.
80K
urto
sis
2.12
3.39
2.03
2.01
2.09
1.84
2.55
Jarq
ue-B
era
2.13
5.71
2.93
5.13
2.94
4.48
7.21
Pro
babi
lity
0.35
0.06
0.23
0.08
0.23
0.11
0.03
No.
ofob
serv
atio
ns66
6666
6665
6263

were nine countries that permitted wide latitude in terms of commercialbanking activities (Restrict � 1.75): Switzerland, Suriname, South Africa,the Netherlands, Luxembourg, United Kingdom, New Zealand, Austria,and Israel. Furthermore, there is substantial representation in terms ofboth geographical location and income level of the sample countries. Be-sides the twenty-four Organization for Economic Cooperation and Devel-opment (OECD) countries, there are fourteen Latin American countries,eleven countries from Sub-Saharan Africa, and twelve from Asia, as wellas five countries from northern Africa and non-OECD Europe.
At the outset, we expected to observe that governments that restrictedbanking activities in one area—for example, securities activities—wouldalso restrict banking activities in other areas, like real estate activities. Wetherefore expected extremely large, positive correlations among the Securi-ties, Real Estate, Insurance, Banks Owning Nonfinancial Firms, and Non-financial Firms Owning Banks variables. There is clearly a positive associ-ation among the different regulatory variables, but it is not extremely high.Table 2.3 shows the correlations among the six regulatory/ownership in-dicators. Although Securities and Real Estate are significantly correlatedwith three of the four other regulatory indicators at the 0.05 significancelevel, Insurance and Banks Owning Nonfinancial Firms are significantlycorrelated with only two of the four other indicators, and NonfinancialFirms Owning Banks is not significantly correlated with any of the others.Furthermore, the correlation coefficients on the statistically significant re-lationships are all below 0.50. Thus, there is cross-country diversity in theindividual regulatory restrictions. This suggests that it is important to ex-amine each of the regulatory variables individually, instead of using only asingle index such as Restrict to capture the regulatory environment. Thus,even though we report the results on Restrict, we focus our discussionalmost entirely on the individual regulatory variables because they providemuch more information.
2.2.2 Financial Sector Performance andIndustrial Competition: Definitions
This section describes the paper’s indicators of bank development, secu-rities market development, and industrial competition. For each category,we considered a wide array of measures. We highlight the measure pre-sented in the tables (see table 2A.2 for the values of the measures for oursample countries) and also mention the other measures that were studied.
Bank Development
Net interest margin equals net income divided by total assets and is theaverage value over the 1990–95 period (Beck, Demirguc-Kunt, and Levine2001). Recognizing that many factors influence interest rates besides thedegree of efficiency of bank operations, we include this in our measures of
Banking Systems around the Globe 43

Tabl
e2.
3C
orre
lati
ons
for
Reg
ulat
ion
and
Sta
te-O
wne
rshi
pV
aria
bles
Ban
ksO
wni
ngN
onfin
anci
alSt
ate-
Ow
ned
Rea
lN
onfin
anci
alF
irm
sO
wni
ngB
ank
Res
tric
tSe
curi
ties
Insu
ranc
eE
stat
eF
irm
sB
anks
Ass
ets
Res
tric
t1.
000.
700.
640.
810.
720.
050.
18(0
.00)
(0.0
0)(0
.00)
(0.0
0)(0
.52)
(0.1
7)Se
curi
ties
1.00
0.25
0.43
0.42
0.00
0.11
(0.0
4)(0
.00)
(0.0
0)(0
.97)
(0.3
8)In
sura
nce
1.00
0.41
0.18
�0.
030.
13(0
.00)
(0.1
6)(0
.85)
(0.3
2)R
ealE
stat
e1.
000.
490.
040.
26(0
.00)
(0.7
4)(0
.04)
Ban
ksO
wni
ngN
onfin
anci
alF
irm
s1.
000.
190.
01(0
.14)
(0.9
6)N
onfin
anci
alF
irm
sO
wni
ngB
anks
1.00
�0.
09(0
.51)
Stat
e-O
wne
dB
ank
Ass
ets
1.00
Not
e:N
umbe
rsin
pare
nthe
ses
are
p-va
lues
.

bank development because of its wide use in the literature and its empiri-cal availability.
Private credit equals claims on the private sector by deposit moneybanks and other financial institutions as a share of GDP and is the averagevalue over the 1980–95 period (Levine, Loayza, and Beck 2000). This is ageneral and widely used measure of financial sector development. We alsoused other measures such as (a) claims by deposit money banks on theprivate sector, (b) liquid liabilities, and (c) total assets of the commercialbanking sector relative to GDP in 1997. These alternative measures do notalter any of the conclusions, however.
Bank concentration equals the share of total assets of the three largestbanks and is the average value over the 1990–95 period (Beck, Demirguc-Kunt, and Levine 2001). This variable captures the degree of concentrationin the banking industry. We also used such measures as the number ofbanks per capita and the share of total assets of the single largest bank.These alternative measures produced similar results, however.
Securities Development
Total value traded equals the value of domestic equities traded on do-mestic exchanges divided by GDP, averaged over the 1980–95 period(Beck, Demirguc-Kunt, and Levine 2001). Levine and Zervos (1998) showthat stock market liquidity is important for economic growth. They furthernote that it is liquidity per se, not equity market capitalization, that iscrucial. We also used measures of primary market activity and bond mar-ket activity. Specifically, we collected information on the (a) total amountof outstanding domestic debt securities issued by private or public domes-tic entities as a share of GDP, (b) total equity issues as a share of GDP,and (c) private, long-term debt issues as a share of GDP. Although thesealternative measures yield similar results, they are available for far fewercountries.
Nonbank credits equals nonbank financial institution claims on the pri-vate nonfinancial sector as a share of GDP and is the average value overthe 1980–95 period (Beck, Demirguc-Kunt, and Levine 2001). To assessthe robustness of our findings, we also used direct measures of the size ofparticular nonbank financial institutions, including insurance companies,mutual funds, and private pension funds. Again, these alternative mea-sures produced similar findings, but they are available for far fewer coun-tries.
Industrial Competition
Industrial competition is based upon a survey question in which respon-dents indicate the degree to which they agree with the following statement:“Market domination is not common in your country” (Dutz and Hayri1999). To examine whether commercial bank regulatory restrictiveness is
Banking Systems around the Globe 45

associated with industrial competition, we also examined such measuresas (a) the degree of business freedom and competition, (b) the percentageof economic activity controlled by the thirty largest companies, and (c) theperceived effectiveness of antitrust policy. These alternative measures pro-duced similar results, however.
2.2.3 Empirical Results
The objective here is to present a rudimentary, first-cut empirical evalu-ation of the relationship between bank regulatory restrictions, mixingbanking and commerce, and state ownership of banks, on the one hand,and bank development, securities development, and industrial competition,on the other. Future work will deal more rigorously with specific hypothe-ses about such relationships as well as with numerous methodologicalissues.
To this end, we first present the simple correlations between each of themeasures of the regulatory/ownership environment and the indicators ofbank development, securities development, and industrial competition.We then present regression results in which we control for economic devel-opment (i.e., the level of real per capita GDP) and an index of the qualityof government. More specifically, Development equals the logarithm ofreal per capita GDP in 1980 (source: Penn World Tables). Good Govern-ment equals the summation of three variables: (a) risk of expropriation bythe government, (b) degree of corruption, and (c) the law-and-order tradi-tion of the country, with greater values signifying less risk of expropriation,less official corruption, and a greater law-and-order tradition (source: LaPorta et al., 1999).
It is important to control for other features of the environment in evalu-ating the relationship between the commercial bank regulatory/ownershipregime with financial development and industrial competition. For in-stance, there may be countries in which corrupt governments that do notenforce the rule of law and tend to expropriate private property have se-lected policies that have led to both poor economic performance andunderdeveloped financial systems. If such governments also uniformly en-act certain types of commercial bank regulations, we would not want tointerpret a significant correlation between bank regulations and financialdevelopment as representing an independent link unless we control forthe quality of the government. We therefore use the simple measures justdescribed to control for some natural characteristics of the policy environ-ment in assessing whether there is an independent link between the com-mercial bank regulatory/ownership structure and the financial/industrialsystem more generally. These variables to some extent also serve as a proxyfor the overall quality of bank supervision. Heteroscedasticity-consistentstandard errors are reported for these regression results.
The empirical findings are startlingly underwhelming as summarized in
46 James R. Barth, Gerard Caprio Jr., and Ross Levine

8. In this regard, Cetorelli and Gambera (2001, 23), in a study assessing the relevance ofthe market structure for the “finance-growth relationship,” state that “it would be interestingto investigate whether it matters if banks are privately or state-owned.”
tables 2.4–2.10. First, it would be very difficult for someone to argue con-fidently that restricting the activities of commercial banks adversely affectsfinancial development, securities market development, or industrial com-petition. At the same time, it would be very difficult for someone to argueconfidently that easing restrictions on commercial banking activities facili-tates greater financial development, securities market development, or in-dustrial competition. Specifically, although countries with more restrictiveregulations tend to have less well developed banking sectors and securitiesmarkets as well as lower levels of industrial competition, the correlationsare frequently not statistically significant; nor do they retain their valueswhen controlling for other factors in a regression context. Indeed, Securi-ties, Insurance, and Real Estate do not enter any of the regressions signifi-cantly when one includes Private Credit, Bank Concentration, IndustrialCompetition, Total Value Traded, or Nonbank Credits. As discussed ear-lier, these conclusions are robust to a wide assortment of measures ofbanking sector development, industrial competition, and securities mar-ket development.
Second, it would be very difficult to argue that restricting the mixing ofbanking and commerce—either by restricting bank ownership of nonfi-nancial firms or by restricting nonfinancial firm ownership of banks—impedes or facilitates overall financial development or industrial competi-tion. Banks Owning Nonfinancial Firms and Nonfinancial Firms OwningBanks do not enter any of the regressions significantly. These findings holdwhen using alternative measures of banking sector development, industrialcompetition, and securities market development.
Third, there is some evidence that restricting commercial banks fromsecurities and real estate activities tends to raise net interest margins. Thus,restricting commercial banks from securities and real estate activities mayhave some negative implications for bank efficiency. Taken as a whole,however, the analysis of the data indicates little link between the restric-tiveness of commercial bank regulations and the mixing of banking andcommerce, on the one hand, and financial development (taken broadly)and industrial competition, on the other.
Fourth, in terms of state ownership, the empirical evidence suggests anegative relationship between the degree of state ownership of banks andfinancial development.8 Countries with greater state ownership of bankstend to have less-developed banks and nonbanks. It should also be notedin this context that underdeveloped financial systems tend to exert a nega-tive influence on long-run growth (see Levine, Loayza, and Beck 2000 andLevine 2001). Although considerably more research needs to be done
Banking Systems around the Globe 47

Tabl
e2.
4R
elat
ions
hip
Bet
wee
nB
ank
Reg
ulat
ory
Res
tric
tiven
ess
and
Alt
erna
tive
Mea
sure
sof
Fin
anci
alD
evel
opm
ent
Net
Inte
rest
Pri
vate
Ban
kIn
dust
rial
Tota
lVal
ueN
onba
nkM
argi
nC
redi
tC
once
ntra
tion
Com
peti
tion
Tra
ded
Cre
dits
A.C
orre
lati
ons
Res
tric
t0.
365
�0.
299
�0.
182
�0.
324
�0.
249
�0.
068
(0.0
05)
(0.0
20)
(0.1
74)
(0.0
32)
(0.0
70)
(0.6
71)
B.R
egre
ssio
nsR
estr
ict
0.00
7�
0.01
6�
0.10
1�
0.16
3�
0.02
20.
067
(0.0
20)
(0.8
32)
(0.0
46)
(0.4
22)
(0.4
80)
(0.1
88)
No.
ofco
untr
ies
5760
5744
5441
R2
0.28
0.47
0.12
0.29
0.18
0.46
Not
es:R
egre
ssio
nsin
clud
ea
cons
tant
,the
loga
rith
mof
real
per
capi
taG
DP,
and
the
vari
able
Goo
dG
over
nmen
t,w
hich
com
bine
sm
easu
res
ofex
prop
riat
ion
risk
,th
ela
wan
dor
der
trad
itio
nof
the
coun
try,
and
the
leve
lof
corr
upti
on.
Num
bers
inpa
rent
hese
sar
ep-
valu
es.
Res
tric
t�
the
aver
age
ofre
gula
tory
rest
rict
ions
onth
eab
ility
ofba
nks
toen
gage
in(a
)se
curi
ties
acti
viti
es,
(b)
insu
ranc
eac
tivi
ties
,(c
)re
ales
tate
acti
viti
es,
and
(d)
the
owne
rshi
pof
non-
finan
cial
firm
s.

Tabl
e2.
5R
elat
ions
hip
Bet
wee
nR
estr
icti
onof
Sec
urit
ies
Act
ivit
ies
ofB
anks
and
Alt
erna
tive
Mea
sure
sof
Fin
anci
alD
evel
opm
ent
Net
Inte
rest
Pri
vate
Ban
kIn
dust
rial
Tota
lVal
ueN
onba
nkM
argi
nC
redi
tC
once
ntra
tion
Com
peti
tion
Tra
ded
Cre
dits
A.C
orre
lati
ons
Secu
riti
es0.
369
�0.
121
�0.
199
�0.
273
�0.
152
0.15
5(0
.005
)(0
.359
)(0
.137
)(0
.073
)(0
.274
)(0
.332
)
B.R
egre
ssio
nsSe
curi
ties
0.00
70.
010
�0.
065
�0.
131
�0.
007
0.05
6(0
.016
)(0
.860
)(0
.197
)(0
.316
)(0
.809
)(0
.121
)
No.
ofco
untr
ies
5760
5744
5441
R2
0.30
0.47
0.09
0.29
0.17
0.47
Not
es:R
egre
ssio
nsin
clud
ea
cons
tant
,the
loga
rith
mof
real
per
capi
taG
DP,
and
the
vari
able
Goo
dG
over
nmen
t,w
hich
com
bine
sm
easu
res
ofex
prop
riat
ion
risk
,th
ela
wan
dor
der
trad
itio
nof
the
coun
try,
and
the
leve
lof
corr
upti
on.
Secu
riti
es�
the
abili
tyof
bank
sto
enga
gein
the
busi
ness
ofse
curi
ties
unde
rwri
ting
,br
oker
ing,
deal
ing,
and
all
aspe
cts
ofth
em
utua
lfu
ndbu
sine
ss.
Lar
ger
valu
esim
ply
grea
ter
rest
rict
ions
onba
nkac
tivi
ties
.4
�pr
ohib
ited
;3
�ba
nks
(and
subs
idia
ries
)re
stri
cted
inac
tivi
ties
;2�
perm
itte
din
subs
idia
ries
;1�
perm
itte
ddi
rect
lyin
the
bank
.Num
bers
inpa
rent
hese
sar
ep-
valu
es.

Tabl
e2.
6R
elat
ions
hip
Bet
wee
nR
estr
icti
onof
Insu
ranc
eA
ctiv
itie
sof
Ban
ksan
dA
lter
nativ
eM
easu
res
ofF
inan
cial
Dev
elop
men
t
Net
Inte
rest
Pri
vate
Ban
kIn
dust
rial
Tota
lVal
ueN
onba
nkM
argi
nC
redi
tC
once
ntra
tion
Com
peti
tion
Tra
ded
Cre
dits
A.C
orre
lati
ons
Insu
ranc
e�
0.03
5�
0.19
4�
0.08
6�
0.11
0�
0.20
0�
0.03
1(0
.797
)(0
.138
)(0
.527
)(0
.477
)(0
.147
)(0
.845
)
B.R
egre
ssio
nsIn
sura
nce
�0.
003
�0.
011
�0.
038
�0.
010
�0.
023
0.02
6(0
.321
)(0
.843
)(0
.272
)(0
.926
)(0
.405
)(0
.382
)
No.
ofco
untr
ies
5760
5744
5441
R2
0.25
0.47
0.06
0.27
0.18
0.43
Not
es:R
egre
ssio
nsin
clud
ea
cons
tant
,the
loga
rith
mof
real
per
capi
taG
DP,
and
the
vari
able
Goo
dG
over
nmen
t,w
hich
com
bine
sm
easu
res
ofex
prop
riat
ion
risk
,th
ela
wan
dor
der
trad
itio
nof
the
coun
try,
and
the
leve
lof
corr
upti
on.
Insu
ranc
e�
the
abili
tyof
bank
sto
enga
gein
the
busi
ness
ofin
sura
nce
unde
rwri
ting
and
selli
ngin
sura
nce
prod
ucts
/ser
vice
sas
prin
cipa
land
asag
ent.
Lar
ger
valu
esim
ply
grea
ter
rest
rict
ions
onba
nkac
tivi
ties
.4�
proh
ibit
ed;
3�
bank
s(a
ndsu
bsid
iari
es)
rest
rict
edin
acti
viti
es;2
�pe
rmit
ted
insu
bsid
iari
es;1
�pe
rmit
ted
dire
ctly
inth
eba
nk.N
umbe
rsin
pare
nthe
ses
are
p-va
lues
.

Tabl
e2.
7R
elat
ions
hip
Bet
wee
nR
estr
icti
onof
Rea
lEst
ate
Act
ivit
ies
ofB
anks
and
Alt
erna
tive
Mea
sure
sof
Fin
anci
alD
evel
opm
ent
Net
Inte
rest
Pri
vate
Ban
kIn
dust
rial
Tota
lVal
ueN
onba
nkM
argi
nC
redi
tC
once
ntra
tion
Com
peti
tion
Tra
ded
Cre
dits
A.C
orre
lati
ons
Rea
lEst
ate
0.39
5�
0.34
6�
0.06
8�
0.23
6�
0.36
0�
0.21
8(0
.002
)(0
.007
)(0
.617
)(0
.123
)(0
.008
)(0
.171
)
B.R
egre
ssio
nsR
ealE
stat
e0.
006
�0.
035
�0.
045
�0.
074
�0.
042
0.02
2(0
.021
)(0
.445
)(0
.181
)(0
.631
)(0
.105
)(0
.480
)
No.
ofco
untr
ies
5760
5744
5441
R2
0.29
0.47
0.07
0.28
0.22
0.42
Not
es:R
egre
ssio
nsin
clud
ea
cons
tant
,the
loga
rith
mof
real
per
capi
taG
DP,
and
the
vari
able
Goo
dG
over
nmen
t,w
hich
com
bine
sm
easu
res
ofex
prop
riat
ion
risk
,the
law
and
orde
rtr
adit
ion
ofth
eco
untr
y,an
dth
ele
velo
fco
rrup
tion
.Rea
lEst
ate
�th
eab
ility
ofba
nks
toen
gage
inre
ales
tate
inve
stm
ent,
deve
lop-
men
t,an
dm
anag
emen
t.L
arge
rva
lues
impl
ygr
eate
rre
stri
ctio
nson
bank
acti
viti
es.4
�pr
ohib
ited
;3�
bank
s(a
ndsu
bsid
iari
es)
rest
rict
edin
acti
viti
es;2
�pe
rmit
ted
insu
bsid
iari
es;1
�pe
rmit
ted
dire
ctly
inth
eba
nk.N
umbe
rsin
pare
nthe
ses
are
p-va
lues
.

Tabl
e2.
8R
elat
ions
hip
Bet
wee
nR
estr
icti
onof
Ban
ksO
wni
ngN
onfin
anci
alF
irm
san
dA
lter
nativ
eM
easu
res
ofF
inan
cial
Dev
elop
men
t
Net
Inte
rest
Pri
vate
Ban
kIn
dust
rial
Tota
lVal
ueN
onba
nkM
argi
nC
redi
tC
once
ntra
tion
Com
peti
tion
Tra
ded
Cre
dits
A.C
orre
lati
ons
Ban
ksO
wni
ngN
onfin
anci
alF
irm
s0.
339
�0.
209
�0.
081
�0.
316
0.00
1�
0.10
1(0
.011
)(0
.111
)(0
.552
)(0
.037
)(0
.993
)(0
.534
)
B.R
egre
ssio
nsB
anks
Ow
ning
Non
finan
cial
Fir
ms
0.00
40.
021
�0.
033
�0.
102
0.02
70.
049
(0.0
66)
(0.6
29)
(0.2
66)
(0.4
11)
(0.2
70)
(0.1
31)
No.
ofco
untr
ies
5659
5644
5340
R2
0.26
0.47
0.06
0.29
0.19
0.46
Not
es:R
egre
ssio
nsin
clud
ea
cons
tant
,the
loga
rith
mof
real
per
capi
taG
DP,
and
the
vari
able
Goo
dG
over
nmen
t,w
hich
com
bine
sm
easu
res
ofex
prop
riat
ion
risk
,th
ela
wan
dor
der
trad
itio
nof
the
coun
try,
and
the
leve
lof
corr
upti
on.
Ban
ksO
wni
ngN
onfin
anci
alF
irm
s�
the
abili
tyof
bank
sto
own
and
cont
rol
nonfi
nanc
ialfi
rms.
Lar
ger
valu
esim
ply
grea
ter
rest
rict
ions
onba
nkac
tivi
ties
.4�
proh
ibit
ed;3
�le
ssth
an10
0%ow
ners
hip;
2�
unre
stri
cted
,but
owne
rshi
pis
limit
edba
sed
onba
nk’s
equi
tyca
pita
l;1
�10
0%ow
ners
hip
perm
itte
d.N
umbe
rsin
pare
nthe
ses
are
p-va
lues
.

Tabl
e2.
9R
elat
ions
hip
Bet
wee
nR
estr
icti
onof
Non
finan
cial
Fir
ms
Ow
ning
Ban
ksan
dA
lter
nativ
eM
easu
res
ofF
inan
cial
Dev
elop
men
t
Net
Inte
rest
Pri
vate
Ban
kIn
dust
rial
Tota
lVal
ueN
onba
nkM
argi
nC
redi
tC
once
ntra
tion
Com
peti
tion
Tra
ded
Cre
dits
A.C
orre
lati
ons
Non
finan
cial
Fir
ms
Ow
ning
Ban
ks�
0.05
60.
065
�0.
130
�0.
193
0.02
90.
132
(0.6
90)
(0.9
96)
(0.3
54)
(0.2
16)
(0.8
42)
(0.4
29)
B.R
egre
ssio
nsN
onfin
anci
alF
irm
sO
wni
ngB
anks
�0.
003
0.07
2�
0.03
2�
0.12
30.
011
0.04
3(0
.364
)(0
.165
)(0
.412
)(0
.272
)(0
.701
)(0
.139
)
No.
ofco
untr
ies
5356
5343
5038
R2
0.27
0.48
0.06
0.35
0.15
0.44
Not
es:R
egre
ssio
nsin
clud
ea
cons
tant
,the
loga
rith
mof
real
per
capi
taG
DP,
and
the
vari
able
Goo
dG
over
nmen
t,w
hich
com
bine
sm
easu
res
ofex
prop
riat
ion
risk
,th
ela
wan
dor
der
trad
itio
nof
the
coun
try,
and
the
leve
lof
corr
upti
on.
Non
finan
cial
Fir
ms
Ow
ning
Ban
ks�
the
abili
tyof
nonfi
nanc
ialfi
rms
toow
nba
nks.
Lar
ger
valu
esim
ply
grea
ter
rest
rict
ions
onba
nkac
tivi
ties
.1�
limit
spl
aced
onow
ners
hip;
0�
nolim
its
plac
edon
owne
rshi
p.N
umbe
rsin
pare
nthe
ses
are
p-va
lues
.

Tabl
e2.
10R
elat
ions
hip
Bet
wee
nS
tate
Ow
ners
hip
ofB
ank
Ass
ets
and
Alt
erna
tive
Mea
sure
sof
Fin
anci
alD
evel
opm
ent
Net
Inte
rest
Pri
vate
Ban
kIn
dust
rial
Tota
lVal
ueN
onba
nkM
argi
nC
redi
tC
once
ntra
tion
Com
peti
tion
Tra
ded
Cre
dits
A.C
orre
lati
ons
Stat
e-O
wne
dB
ank
Ass
ets
0.21
6�
0.34
50.
095
�0.
247
�0.
273
�0.
380
(0.1
17)
(0.0
09)
(0.4
96)
(0.1
15)
(0.0
52)
(0.0
17)
B.R
egre
ssio
nsSt
ate-
Ow
ned
Ban
kA
sset
s0.
011
�0.
275
0.00
7�
0.41
4�
0.12
9�
0.24
2(0
.522
)(0
.088
)(0
.962
)(0
.562
)(0
.065
)(0
.012
)
No.
ofco
untr
ies
5457
5442
5139
R2
0.24
0.48
0.05
0.28
0.18
0.49
Not
es:R
egre
ssio
nsin
clud
ea
cons
tant
,the
loga
rith
mof
real
per
capi
taG
DP,
and
the
vari
able
Goo
dG
over
nmen
t,w
hich
com
bine
sm
easu
res
ofex
prop
riat
ion
risk
,the
law
and
orde
rtr
adit
ion
ofth
eco
untr
y,an
dth
ele
velo
fco
rrup
tion
.Sta
teO
wne
rshi
pof
Ban
kA
sset
s�
perc
enta
geof
bank
asse
tsac
coun
ted
for
byst
ate-
owne
dba
nks.
Num
bers
inpa
rent
hese
sar
ep-
valu
es.

before a causal interpretation can be given to these findings, it may justifysome concern among policy makers in countries where state banks play amajor role in credit allocation. In this sample alone it appears that abouthalf the world’s people live in countries with banking systems that are amajority state-owned (Brazil, China, Egypt, India, Pakistan, and recentlyIndonesia), which underscores the importance of this concern.
In sum, the lack of a close and reliable link between the regulatory envi-ronment and overall financial development and industrial competition isrobust to various alterations in the conditioning information set and toredefinitions of the regulatory indicators. In the analysis, however, the reg-ulatory variables take values ranging from 1 through 4. This particularscaling may create an interpretation problem because the difference be-tween a 2 and a 3 may not be the same as the difference between a 3 anda 4, or a 1 and a 2. We therefore examine the sensitivity of the empiricalresults to this scale in three ways. First, we created a new regulatory indica-tor that assumed values of 1 through 3, rather than 1 through 4. This newvariable equals 1 if the original indicator equals 1; the new variable equals2 if the original indicator equals 2 or 3; and the new variable equals 3 ifthe original indicator equals 4. Second, we created an additional regulatoryindicator for each category (Securities, Insurance, Real Estate, BanksOwning Nonfinancial Firms, and Nonfinancial Firms Owning Banks)with values of either 1 or 0. The additional regulatory indicator takes thevalue 1 if the original indicator was 1 or 2, and 0 otherwise. Finally, wealso used separate dummy variables for each value between 1 and 4. Inthis case, we created four dummy variables: Securities1, Securities2, Secu-rities3, and Securities4. Securities1 equals 1 if Securities equals 1, and 0otherwise; Securities2 equals 1 if Securities equals 2, and 0 otherwise; andso on. We created these new variables for all the regulatory indicators.Using these alternative indicators, however, did not change this section’sconclusions. The results are robust to changes in the other regressors too.Also, it is important to note that these conclusions are robust to the inclu-sion of regional dummy variables. Thus, the results are not simply re-flecting regional differences in regulatory policies. Furthermore, we con-ducted the analysis using the individual components of Good Governmentinstead of the conglomerate index. This modification also did not alterthe results. Lastly, we confirmed our empirical results using indexes ofbureaucratic efficiency, government red tape, and the degree to which gov-ernments repudiate contracts.
2.3 Regulatory Restrictions, Ownership, and Banking Crises
This section evaluates the relationship between banking crises and(a) regulatory restrictions on the activities of commercial banks, (b) regu-latory restrictions on the mixing of banking and commerce, and (c) state
Banking Systems around the Globe 55
ownership of banks. Allowing banks to engage in a wide range of activitiesmay increase bank fragility by expanding the set of external risks affectingbanks and by allowing banks themselves to choose among a broader as-sortment of risky ventures. On the other hand, allowing banks more free-dom may lower bank fragility through greater diversification of the sourcesof profits for banks. This paper assesses which of these two opposingforces tends to dominate. In terms of state ownership of banks, we believethe links will be more opaque. State-owned banks that encounter difficul-ties may receive subsidies through various channels, so that the banks arenever identified as being in a crisis. Nonetheless, we conduct the analysiswith the information available. After describing our definition of whether acountry experienced a banking crisis or not, we present probit regressionsincorporating the regulatory/ownership variables and a wide array of fac-tors to control for other potential influences on bank fragility. We find thatregulatory restrictiveness is positively linked with financial fragility. Wethen present evidence suggesting that this result is not due to reverse cau-sation.
2.3.1 Definition of a Crisis
To investigate the relationship between the regulatory/ownership envi-ronment and financial fragility, we use two measures of whether a county’sbanking system suffered a crisis during the last fifteen years.
Systemic is based upon Caprio and Klingebiel’s (1999) determination ofwhether a country experienced a systemic banking crisis. The variabletakes the value 1 if there was a systemic crisis, and 0 otherwise. The au-thors define a systemic crisis as meaning that all or most of the bankingsystem’s capital was eroded during the period of the crisis. The assess-ments are made for countries from the late 1970s into early 1999.
Major equals Systemic except for two adjustments. First, the Caprioand Klingebiel (1999) indicator of systemic banking crises is expanded toinclude countries that experienced major, though perhaps not systemic,banking crises over the 1985–97 period. This results in the addition ofCanada (fifteen members of Canadian Deposit Insurance Companyfailed), Denmark (cumulative losses of 9 percent of loans), Hong Kong(nine out of eighteen banks failed over the period), India (nonperformingloans estimated as 16 percent of total loans), Italy (fifty-eight banks ac-counting for 11 percent of total loans were forcibly merged), and theUnited States (estimated savings and loans clean-up costs of 3.2 percentof GDP). Second, we exclude two countries (Israel and Spain) from theCaprio/Klingebiel list of systemic banking crises because their crises oc-curred in the late 1970s and therefore are outside our sample period. Wereport the results using Major but reach similar conclusions using Sys-temic. The values of Major and Systemic are listed in table 2A.3.
56 James R. Barth, Gerard Caprio Jr., and Ross Levine

2.3.2 Empirical Results
The empirical results indicate that countries that restrict commercialbanks from engaging in securities activities and countries that restrictcommercial banks from owning nonfinancial firms have a higher probabil-ity of suffering a major banking crisis. Table 2.11 summarizes these find-ings. Besides simple correlations, we present probit regressions that con-trol for other characteristics of the national environment. Specifically, wecontrol for the level of economic development (Development) and the qual-ity of the government (Good Government) in the probit regressions. Asshown, countries with greater regulatory restrictions on commercial banksecurities activities and the ability of banks to own and control nonfinan-cial firms have a higher probability of experiencing major banking sectordistress.
The positive and significant relationship between financial fragility andregulatory restrictions on the securities activities of banks and restrictionson commercial bank ownership of nonfinancial firms is robust to a num-ber of alterations in the econometric specification. First, we obtain thesame results using a logit estimation procedure. Second, we obtain similarresults when controlling for the degree of private property rights protec-tion, the degree to which regulations restrict the opening and operation ofbusinesses, a measure of bureaucratic efficiency, the rate of economicgrowth, inflation, the existence of a deposit insurance scheme, and the sizeof the financial intermediary sector (Private credit). Thus, we control forthe standard variables used in the large and growing empirical literaturethat tries to explain banking crises. The coefficients on Securities andBanks Owning Nonfinancial Firms remain significantly positive in the cri-sis regressions (when also including Development and Good Govern-ment). Third, as noted earlier, we obtain similar results when using Sys-temic instead of Major as the indicator of whether a country experienceda banking crisis or not. Fourth, we obtain similar results when using thealternative measures of Securities and Bank Ownership of NonfinancialFirms as just discussed. Specifically, we also use the regulatory measuresbased on (a) values from 1 through 3, (b) values of 0 or 1, and (c) valuesof individual dummy variables for each of the values 1 through 4. Thesealternative specifications do not alter the findings. Fifth, these conclusionsare robust to the inclusion of regional dummy variables; the results are notdriven by regional factors. Sixth, because the degree of securities marketdevelopment may influence financial fragility, we also included measuresof the degree of securities market development. Specifically, we used mea-sures of (a) equity market liquidity, (b) the issuance of equity (in the pri-mary market) as a share of GDP, and (c) the issuance of long-term bonds(in the primary market) as a share of GDP. This modification did not alter
Banking Systems around the Globe 57

Tabl
e2.
11R
elat
ions
hip
Bet
wee
nB
ank
Cri
ses
and
Ban
kR
egul
atio
nsan
dP
olic
ies
Ban
ksSt
ate-
Non
finan
cial
Ow
ning
Ow
ned
Fir
ms
Goo
dR
eal
Non
finan
cial
Ban
kO
wni
ngF
inan
cial
Gov
ernm
ent
Res
tric
tSe
curi
ties
Insu
ranc
eE
stat
eF
irm
sA
sset
sB
anks
Stru
ctur
e
A.C
orre
lati
ons
Ban
kC
risi
s�
0.30
10.
393
0.37
7�
0.00
60.
298
0.41
80.
217
0.18
8�
0.15
7(0
.019
)(0
.002
)(0
.003
)(0
.964
)(0
.020
)(0
.001
)(0
.102
)(0
.161
)(0
.267
)
B.S
impl
eP
robi
tR
egre
ssio
nsB
ank
Cri
sis
�0.
056
0.68
90.
584
�0.
154
0.30
00.
527
0.87
30.
237
�0.
265
(0.3
72)
(0.0
20)
(0.0
15)
(0.4
36)
(0.1
23)
(0.0
10)
(0.2
96)
(0.2
33)
(0.6
43)
No.
ofco
untr
ies
6161
6161
6160
5857
52P
roba
bilit
y(L
R0.
052
0.00
90.
006
0.08
90.
039
0.00
50.
105
0.12
40.
014
stat
)
Not
es:
Sim
ple
prob
itre
gres
sion
sin
clud
ea
cons
tant
,the
loga
rith
mof
real
per
capi
taG
DP,
and
the
vari
able
Goo
dG
over
nmen
t,w
hich
com
bine
sm
easu
res
ofex
prop
riat
ion
risk
,the
law
and
orde
rtr
adit
ion
ofth
eco
untr
y,an
dth
ele
velo
fco
rrup
tion
.The
Goo
dG
over
nmen
tre
gres
sion
incl
udes
Dev
elop
men
ton
ly.
Pro
babi
lity
(LR
stat
isti
c)is
the
p-va
lue
for
the
test
that
the
coeffi
cien
tson
the
(non
cons
tant
)re
gres
sors
equa
lzer
o.N
umbe
rsin
pare
nthe
ses
are
p-va
lues
.

9. For a detailed discussion and analysis of bank-based versus market-based financialsystems, see Allen and Gale (2000) and Levine (2000).
10. The source of the additional variables used in this analysis is Beck, Demirguc-Kunt,and Levine (2001).
the results, and these securities market indicators enter the crisis regres-sions insignificantly. Similarly, we also tried controlling for the net interestincome of banks (Net interest margin), the degree of banking sector con-centration (Bank concentration), and a measure of the degree to whichthe financial system is primarily bank-based or market-based (Structure).9
These additional variables did not enter the crises regressions significantly.Moreover, including these measures did not alter this section’s major con-clusion: There is a positive, significant, and robust relationship betweenbank fragility and regulatory restrictions on securities market activitiesand bank ownership of nonfinancial firms.10
2.3.3 Endogeneity
Endogeneity is an issue that merits further consideration. Countries thatexperience banking crises might have responded to them by adopting regu-latory restrictions on the activities of banks. If this situation actually hap-pened, it would be inappropriate to interpret the results in table 2.11 assuggesting that regulatory restrictions increase the probability that a crisiswill occur. To control for potential simultaneity bias, we have used a two-step instrumental variable estimator. Using instrumental variables did notalter the main results: Countries in which banking systems face greaterregulatory restrictions on securities activities and on owning nonfinancialfirms have a higher probability of suffering a major crisis (see Barth, Cap-rio, and Levine 1999). However, because the instrumental variables are notvery good predictors of regulatory restrictions, we decided to examine theissue of endogeneity using a more laborious—albeit less statistically rigor-ous—procedure.
Table 2.12 presents the results of this effort. As the table indicates, forthose countries in our sample experiencing a crisis, information is providedregarding the dates of the banking crises, the scope of the problems, andthe estimated costs of resolution. In addition, information is providedabout whether or not there was any change in regulations with respect tosecurities, insurance, and real estate activities as well as to the mixing ofbanking and commerce during or shortly after a banking crisis occurred.For some countries and for some time periods, the required regulatoryinformation has not yet been obtained. For the majority of our countries,however, such information was available from publications of the Instituteof International Bankers, materials from the OCC and the World BankSurvey.
Banking crises generally did not induce governments to enact more
Banking Systems around the Globe 59
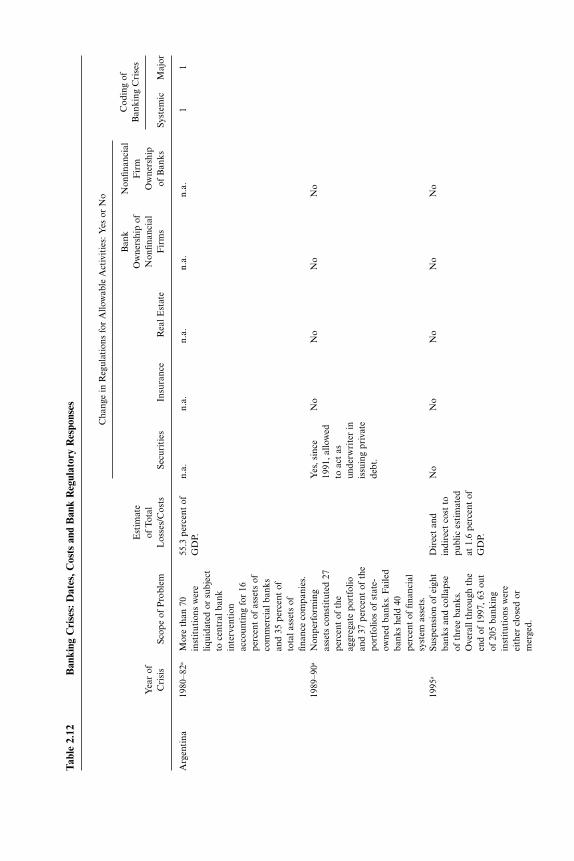
Tabl
e2.
12B
anki
ngC
rise
s:D
ates
,Cos
tsan
dB
ank
Reg
ulat
ory
Res
pons
es
Cod
ing
of
Cha
nge
inR
egul
atio
nsfo
rA
llow
able
Act
ivit
ies:
Yes
orN
o
Ban
king
Cri
ses
Ban
kN
onfin
anci
alE
stim
ate
Ow
ners
hip
ofF
irm
Yea
rof
ofTo
tal
Non
finan
cial
Ow
ners
hip
Cri
sis
Scop
eof
Pro
blem
Los
ses/
Cos
tsSe
curi
ties
Insu
ranc
eR
ealE
stat
eF
irm
sof
Ban
ksSy
stem
icM
ajor
Arg
enti
na19
80–8
2aM
ore
than
7055
.3p
erce
ntof
n.a.
n.a.
n.a.
n.a.
n.a.
11
inst
itut
ions
wer
eG
DP.
liqui
date
dor
subj
ect
toce
ntra
lban
kin
terv
enti
onac
coun
ting
for
16p
erce
ntof
asse
tsof
com
mer
cial
bank
san
d35
per
cent
ofto
tala
sset
sof
finan
ceco
mpa
nies
.19
89–9
0aN
onp
erfo
rmin
gY
es,s
ince
No
No
No
No
asse
tsco
nsti
tute
d27
1991
,allo
wed
per
cent
ofth
eto
act
asag
greg
ate
port
folio
unde
rwri
ter
inan
d37
per
cent
ofth
eis
suin
gpr
ivat
epo
rtfo
lios
ofst
ate-
debt
.ow
ned
bank
s.F
aile
dba
nks
held
40p
erce
ntof
finan
cial
syst
emas
sets
.19
95a
Susp
ensi
onof
eigh
tD
irec
tan
dN
oN
oN
oN
oN
oba
nks
and
colla
pse
indi
rect
cost
toof
thre
eba
nks.
publ
ices
tim
ated
Ove
rall
thro
ugh
the
at1.
6p
erce
ntof
end
of19
97,6
3ou
tG
DP.
of20
5ba
nkin
gin
stit
utio
nsw
ere
eith
ercl
osed
orm
erge
d.

Bol
ivia
1986
–87a
Fiv
eba
nks
wer
en.
a.n.
a.n.
a.n.
a.n.
a.1
1liq
uida
ted.
Tota
lN
PL
sof
bank
ing
syst
emre
ache
d29
.8p
erce
ntin
1987
;in
mid
-198
8re
port
edar
rear
sst
ood
at92
per
cent
ofco
mm
erci
alba
nks’
net
wor
th.
1994
aT
wo
bank
sw
ith
11N
oN
oN
oN
oN
op
erce
ntof
bank
ing
syst
emas
sets
wer
ecl
osed
inN
ovem
ber
1994
.In
1995
,fou
rou
tof
15do
mes
tic
bank
s,w
hich
acco
unte
dfo
r30
per
cent
ofba
nkin
gsy
stem
asse
tsex
per
ienc
edliq
uidi
typr
oble
ms
and
suff
ered
from
high
leve
lsof
NP
Ls.
Bra
zil
1990
a(d
epos
itto
bond
No
No
No
No
No
11
conv
ersi
on)
1994
–B
yen
d19
97,t
heIn
1996
,N
oN
oN
oN
oN
oon
goin
gaC
entr
alB
ank
had
nega
tive
net
inte
rven
edin
,or
wor
thof
put
unde
rth
ese
lect
edst
ate
Tem
pora
rySp
ecia
lan
dfe
dera
lA
dmin
istr
atio
nfu
nds
bank
sR
egim
e(R
AE
T)
esti
mat
edat
syst
em,4
3fin
anci
al5–
10p
erce
ntof
inst
itut
ions
.Als
oG
DP.
Cos
tsof
byen
d19
97in
divi
dual
bank
nonp
erfo
rmin
glo
ans
reca
pita
lizat
ion,
ofth
een
tire
bank
ing
byen
d19
97:
(con
tinu
ed)

syst
emha
dre
ache
dB
anco
15p
erce
nt.
Eco
nom
ico,
USD
2.9
billi
on;
Bam
erid
us,
USD
3bi
llion
;B
anco
doB
razi
l,U
SD8
billi
on.
Can
ada
1983
–85b
Fif
teen
mem
bers
ofN
o,bu
tN
o,bu
tN
oN
oN
o0
1th
eC
anad
ian
chan
ged
from
chan
ged
from
Dep
osit
Insu
ranc
epr
ohib
ited
topr
ohib
ited
toC
orpo
rati
on,
per
mit
ted
inp
erm
itte
din
incl
udin
gtw
oba
nks,
1987
.19
92.
faile
d.C
hile
1981
–83a
Aut
hori
ties
1982
–85:
No,
but
No,
but
No,
but
No
No,
but
inte
rven
edin
four
gove
rnm
ent
chan
ged
from
star
ting
star
ting
inch
ange
dfr
omba
nks
and
four
spen
t41
.2re
stri
cted
toin
1997
1993
bank
sun
rest
rict
edno
nban
kfin
anci
alp
erce
ntof
GD
P.p
erm
itte
din
bank
sw
ere
wer
eal
low
edto
per
mit
ted
inst
itut
ions
(wit
h19
97/9
8.al
low
edto
toin
vest
inin
1993
.33
per
cent
ofin
term
edia
tere
ales
tate
outs
tand
ing
loan
s)(s
ell)
thro
ugh
in19
81.I
n19
83,
insu
ranc
esu
bsid
iari
esse
ven
bank
san
dth
roug
hth
aton
efin
anci
era
subs
idia
ries
.sp
ecia
lized
inac
coun
ting
for
45(h
ousi
ngan
dp
erce
ntof
tota
loffi
cesp
ace)
asse
ts.B
yth
een
dof
leas
ing.
1983
,19
per
cent
oflo
ans
wer
eno
nper
form
ing.
Tabl
e2.
12(c
onti
nued
)
Cod
ing
of
Cha
nge
inR
egul
atio
nsfo
rA
llow
able
Act
ivit
ies:
Yes
orN
o
Ban
king
Cri
ses
Ban
kN
onfin
anci
alE
stim
ate
Ow
ners
hip
ofF
irm
Yea
rof
ofTo
tal
Non
finan
cial
Ow
ners
hip
Cri
sis
Scop
eof
Pro
blem
Los
ses/
Cos
tsSe
curi
ties
Insu
ranc
eR
ealE
stat
eF
irm
sof
Ban
ksSy
stem
icM
ajor

Col
ombi
a19
82–8
7aC
entr
alB
ank
Cos
tsof
No
No,
but
No
No,
but
No
11
inte
rven
edin
six
rest
ruct
urin
gch
ange
dfr
omch
ange
dfr
omba
nks
acco
unti
nges
tim
ated
top
erm
itte
dto
per
mit
ted
tofo
r25
per
cent
ofbe
arou
nd5
proh
ibit
edin
proh
ibit
edin
bank
ing
syst
emp
erce
ntof
GD
P.19
98.
1994
.as
sets
.D
enm
ark
1987
–92b
Cum
ulat
ive
loan
No
No
No
No
No
01
loss
esov
erth
ep
erio
d19
90–9
2w
ere
9p
erce
ntof
loan
s;40
ofth
e60
prob
lem
bank
sw
ere
mer
ged.
Ecu
ador
earl
yIm
plem
enta
tion
ofn.
a.n.
a.n.
a.n.
a.n.
a.1
119
80sa
exch
ange
prog
ram
(dom
esti
cfo
rfo
reig
nde
bt)
toba
ilou
tba
nkin
gsy
stem
1996
–A
utho
riti
esn.
a.n.
a.n.
a.n.
a.n.
a.on
goin
gain
terv
ened
inse
vera
lsm
alle
rfin
anci
alin
stit
utio
nsin
late
1995
toea
rly
1996
and
inth
efif
thla
rges
tco
mm
erci
alba
nkin
1996
.Sev
enfin
anci
alin
stit
utio
ns,
whi
chac
coun
ted
for
25–3
0p
erce
ntof
com
mer
cial
bank
ing
asse
ts,w
ere
clos
edin
1998
/99.
InM
arch
1999
,aut
hori
ties
decl
ared
aon
ew
eek
bank
holid
ay.
Egy
pt,A
rab
earl
yG
over
nmen
tcl
osed
Nin
est
ate-
n.a.
n.a.
n.a.
n.a.
n.a.
11
Rep
.19
80sa
seve
rall
arge
owne
din
vest
men
tco
mm
erci
alco
mpa
nies
.Fou
rba
nks
reco
rded
(con
tinu
ed)

publ
icse
ctor
bank
sN
PL
rati
osof
wer
egi
ven
capi
tal
37p
erce
nton
assi
stan
ce.
aver
age
in19
89.
1991
–95b
Fou
rpu
blic
sect
orn.
a.n.
a.n.
a.n.
a.n.
a.ba
nks
wer
egi
ven
capi
tala
ssis
tanc
e.E
lSal
vado
r19
89a
Nin
est
ate-
owne
dn.
a.n.
a.n.
a.n.
a.n.
a.1
1co
mm
erci
alba
nks
reco
rded
NP
Lra
tios
of37
per
cent
onav
erag
ein
1989
.F
inla
nd19
91–9
4aSa
ving
sba
nkin
gR
ecap
.cos
tsN
oN
oN
oN
oN
o1
1se
ctor
badl
yaff
ecte
d;am
ount
edto
11G
over
nmen
tto
okp
erce
ntof
GD
P.co
ntro
lof
thre
eba
nks
that
toge
ther
acco
unte
dfo
r31
per
cent
ofto
tal
syst
emde
posi
ts.
Gha
na19
82–8
9aSe
ven
audi
ted
bank
sR
estr
uctu
ring
n.a.
n.a.
n.a.
n.a.
n.a.
11
(out
of11
)in
solv
ent;
cost
ses
tim
ated
rura
lban
king
sect
orat
6p
erce
ntof
affec
ted.
GN
P.19
97–
NP
Lle
vels
incr
ease
dO
nela
rge
No
No
No
No
No
ongo
ingb
shar
ply
duri
ng19
97in
vest
men
tfr
om15
.5p
erce
ntof
bank
fails
.lo
ans
outs
tand
ing
toN
onp
erfo
rmin
g26
.5p
erce
nt.T
wo
asse
tsof
the
27st
ate-
owne
dpu
blic
sect
orco
mm
erci
alba
nks
bank
ses
tim
ated
Tabl
e2.
12(c
onti
nued
)
Cod
ing
of
Cha
nge
inR
egul
atio
nsfo
rA
llow
able
Act
ivit
ies:
Yes
orN
o
Ban
king
Cri
ses
Ban
kN
onfin
anci
alE
stim
ate
Ow
ners
hip
ofF
irm
Yea
rof
ofTo
tal
Non
finan
cial
Ow
ners
hip
Cri
sis
Scop
eof
Pro
blem
Los
ses/
Cos
tsSe
curi
ties
Insu
ranc
eR
ealE
stat
eF
irm
sof
Ban
ksSy
stem
icM
ajor

acco
unti
ngfo
r33
.9at
19.5
per
cent
per
cent
ofm
arke
tof
tota
lloa
nssh
are
inba
dsh
ape.
and
adva
nces
asT
hree
bank
s,of
end
ofM
arch
acco
unti
ngfo
r3.
619
95.
per
cent
ofm
arke
tN
onp
erfo
rmin
gsh
are
inte
rms
ofas
sets
toto
tal
depo
sits
faile
d.as
sets
reac
hed
Seve
nba
nks
or10
.8p
erce
ntin
Dep
osit
Tak
ing
1993
–94.
At
end
Inst
itut
ions
wer
e19
98,N
PL
sei
ther
liqui
date
dor
esti
mat
edat
16ta
ken
over
.p
erce
ntof
tota
l.H
ong
Kon
g19
82–8
3bN
ine
Dep
osit
Tak
ing
n.a.
n.a.
n.a.
n.a.
n.a.
11
Com
pani
esfa
iled.
1983
–86b
Seve
nba
nks
orn.
a.n.
a.n.
a.n.
a.n.
a.D
epos
itT
akin
gIn
stit
utio
nsw
ere
eith
erliq
uida
ted
orta
ken
over
.19
98b
One
larg
ein
vest
men
tN
oN
oN
oN
oN
oba
nkfa
ils.
Indi
a19
93–
Non
per
form
ing
No
No
No
No
No
01
ongo
ingb
asse
tsof
the
27pu
blic
sect
orba
nks
esti
mat
edat
19.5
per
cent
ofto
tall
oans
and
adva
nces
asof
end
ofM
arch
1995
.N
onp
erfo
rmin
gas
sets
toto
tala
sset
sre
ache
d10
.8p
erce
ntin
1993
–94.
At
end
1998
,NP
Ls
esti
mat
edat
16p
erce
ntof
tota
llo
ans.
(con
tinu
ed)

Indo
nesi
a19
94b
Cla
ssifi
edas
sets
Rec
apit
ali-
Yes
,aN
oN
oN
oN
o1
1eq
ualt
oov
er14
zati
onco
stfo
rre
gula
tion
per
cent
ofba
nkin
gfiv
est
ate
bank
spr
ohib
itin
gsy
stem
asse
tsw
ith
exp
ecte
dto
bank
sfr
omov
er70
per
cent
inam
ount
to1.
8un
derw
riti
ngth
est
ate
bank
s.p
erce
ntof
GD
P.se
curi
ties
was
issu
edin
Aug
.19
95.T
hede
cree
how
ever
allo
wed
bank
sto
act
asar
rang
er,
issu
er,d
eale
r,in
vest
oror
buyi
ngag
ent.
1997
–A
sof
Mar
ch19
99,
Fis
calc
osts
No
No
No
No
No
ongo
inga
Ban
kof
Indo
nesi
aes
tim
ated
toha
dcl
osed
dow
nra
nge
from
61ba
nks
and
50–5
5p
erce
ntof
nati
onal
ized
54G
DP.
bank
s,of
ato
talo
f24
0.N
PL
ses
tim
ates
for
the
tota
lban
king
syst
emra
nge
from
65–7
5p
erce
ntof
tota
lloa
ns.
Ital
y19
90–9
5bD
urin
g19
90–9
4,58
No
No
No
No,
but
No
01
bank
s(a
ccou
ntin
gch
ange
dfr
om
Tabl
e2.
12(c
onti
nued
)
Cod
ing
of
Cha
nge
inR
egul
atio
nsfo
rA
llow
able
Act
ivit
ies:
Yes
orN
o
Ban
king
Cri
ses
Ban
kN
onfin
anci
alE
stim
ate
Ow
ners
hip
ofF
irm
Yea
rof
ofTo
tal
Non
finan
cial
Ow
ners
hip
Cri
sis
Scop
eof
Pro
blem
Los
ses/
Cos
tsSe
curi
ties
Insu
ranc
eR
ealE
stat
eF
irm
sof
Ban
ksSy
stem
icM
ajor

for
11p
erce
ntof
proh
ibit
edto
tota
llen
ding
)w
ere
rest
rict
edin
mer
ged
wit
hot
her
1995
.in
stit
utio
ns.
Japa
n19
90sa
Ban
kssu
ffer
ing
from
In19
96,r
escu
eN
oN
oN
oN
oN
o1
1sh
arp
decl
ine
inco
sts
esti
mat
edst
ock
mar
ket
and
atov
erU
SDre
ales
tate
pric
es;
100
bn.I
n19
98,
offici
ales
tim
ate
ofgo
vern
men
tN
PL
s:40
trill
ion
yen
ofJa
pan
(US$
469
billi
on)
inan
noun
ced
the
1995
(10
per
cent
ofO
buch
iPla
nG
DP
);un
offici
alw
hich
prov
ides
esti
mat
espu
tN
PL
s60
trill
ion
yen
at1
trill
ion
or25
(US$
500
per
cent
ofG
DP
;for
billi
on),
abou
tso
me
ofba
dlo
ans,
12.3
per
cent
bank
sha
veal
read
yof
GD
P,in
mad
epr
ovis
ions
.At
publ
icfu
nds
for
the
end
of19
98,t
otal
loan
loss
es,
bank
ing
syst
emre
capi
taliz
atio
nN
PL
ses
tim
ated
atof
bank
san
dye
n87
.5tr
illio
nde
posi
tor
(US$
725
billi
on),
prot
ecti
on.
abou
t17
.9p
erce
ntof
GD
P.In
Mar
ch19
99,H
akka
ido
Tak
usho
duba
nkcl
osed
,Lon
gT
erm
Cre
dit
Ban
kna
tion
alis
ed;
Yat
suda
Tru
stm
erge
dw
ith
Fuj
iB
ank,
and
Mit
sui
Tru
stm
erge
dw
ith
Chu
oT
rust
.R
epub
licof
1997
–B
yM
arch
1999
,tw
oF
isca
lcos
tsof
No
No,
but
No
No
No
11
Kor
eaon
goin
gaou
tof
26co
mm
erci
alcr
isis
esti
mat
edch
ange
dfr
om(c
onti
nued
)

bank
sac
coun
ting
for
tore
ach
34pr
ohib
ited
to11
.8p
erce
ntof
tota
lp
erce
ntin
1999
.p
erm
itte
din
bank
ing
syst
em19
95.
asse
tsna
tion
aliz
ed;5
bank
s,ac
coun
ting
for
7.8
per
cent
ofto
talb
anki
ngsy
stem
asse
tscl
osed
.Sev
enba
nks
acco
unti
ngfo
r38
per
cent
ofba
nkin
gsy
stem
asse
ts,p
lace
dun
der
spec
ials
uper
visi
on.
Ove
rall,
bank
ing
syst
emN
PL
exp
ecte
dto
pea
kat
30–4
0p
erce
nt.
Mad
agas
car
1988
a25
per
cent
ofN
oN
oN
on.
a.n.
a.1
1ba
nkin
gse
ctor
loan
sde
emed
irre
cove
rabl
e.M
alay
sia
1985
–88b
Inso
lven
tin
stit
utio
nsR
epor
ted
loss
esn.
a.n.
a.n.
a.n.
a.n.
a.1
1ac
coun
tfo
r3.
4eq
uiva
lent
to4.
7p
erce
ntof
finan
cial
per
cent
ofG
NP.
syst
emde
posi
ts;
mar
gina
llyca
pita
lized
and
per
haps
inso
lven
tin
stit
utio
nsac
coun
tfo
ran
othe
r4.
4
Tabl
e2.
12(c
onti
nued
)
Cod
ing
of
Cha
nge
inR
egul
atio
nsfo
rA
llow
able
Act
ivit
ies:
Yes
orN
o
Ban
king
Cri
ses
Ban
kN
onfin
anci
alE
stim
ate
Ow
ners
hip
ofF
irm
Yea
rof
ofTo
tal
Non
finan
cial
Ow
ners
hip
Cri
sis
Scop
eof
Pro
blem
Los
ses/
Cos
tsSe
curi
ties
Insu
ranc
eR
ealE
stat
eF
irm
sof
Ban
ksSy
stem
icM
ajor

per
cent
offin
anci
alsy
stem
sde
posi
ts.
1997
–F
inan
ceco
mpa
nyN
etlo
ssN
o,bu
tN
o,bu
tN
oN
o,bu
tN
oon
goin
gase
ctor
isbe
ing
esti
mat
edat
chan
ged
from
chan
ged
from
chan
ged
from
rest
ruct
ured
and
USD
14.9
bn,o
rre
stri
cted
tore
stri
cted
tore
stri
cted
tonu
mbe
rof
finan
ce20
.5p
erce
ntof
per
mit
ted
inp
erm
itte
din
per
mit
ted
inco
mpa
nies
isto
beG
DP
by19
99.
1991
.19
91.
1991
.re
duce
dfr
om39
to16
thro
ugh
mer
gers
.T
wo
finan
ceco
mpa
nies
wer
eta
ken
over
byC
entr
alB
ank
incl
udin
gM
Bf
Fin
ance
,the
larg
est
inde
pen
dent
finan
ceco
mpa
ny.T
wo
bank
s,de
emed
inso
lven
t,ac
ount
ing
for
14.2
per
cent
offin
anci
alsy
stem
asse
ts,t
obe
mer
ged
wit
hot
her
bank
s.O
vera
ll,at
end
1998
,N
PL
ses
tim
ated
betw
een
25–3
5p
erce
ntof
tota
lba
nkin
gsy
stem
asse
ts.
Mex
ico
1981
/82
Gov
ernm
ent
took
n.a.
n.a.
n.a.
n.a.
n.a.
11
(per
haps
over
trou
bled
unti
lba
nkin
gsy
stem
.re
priv
a-ti
zed
1990
/91
)a
1995
–O
utof
34D
istr
esse
dN
oN
oN
oN
oN
oon
goin
gaco
mm
erci
alba
nks
asba
nks
of19
94,n
ine
bank
sac
coun
ted
for
(con
tinu
ed)
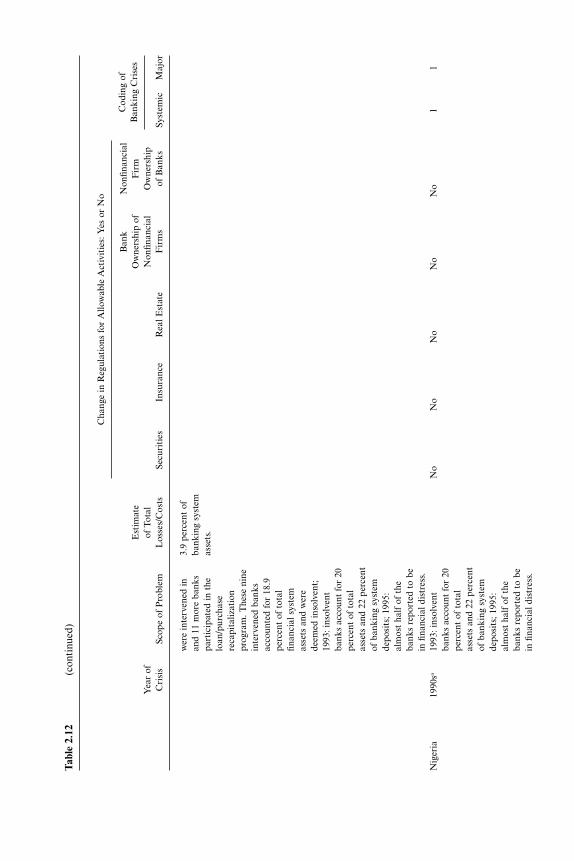
wer
ein
terv
ened
in3.
9p
erce
ntof
and
11m
ore
bank
sba
nkin
gsy
stem
part
icip
ated
inth
eas
sets
.lo
an/p
urch
ase
reca
pita
lizat
ion
prog
ram
.The
seni
nein
terv
ened
bank
sac
coun
ted
for
18.9
per
cent
ofto
tal
finan
cial
syst
emas
sets
and
wer
ede
emed
inso
lven
t;19
93:i
nsol
vent
bank
sac
coun
tfo
r20
per
cent
ofto
tal
asse
tsan
d22
per
cent
ofba
nkin
gsy
stem
depo
sits
;199
5:al
mos
tha
lfof
the
bank
sre
port
edto
bein
finan
cial
dist
ress
.N
iger
ia19
90sa
1993
:ins
olve
ntN
oN
oN
oN
oN
o1
1ba
nks
acco
unt
for
20p
erce
ntof
tota
las
sets
and
22p
erce
ntof
bank
ing
syst
emde
posi
ts;1
995:
alm
ost
half
ofth
eba
nks
repo
rted
tobe
infin
anci
aldi
stre
ss.
Tabl
e2.
12(c
onti
nued
)
Cod
ing
of
Cha
nge
inR
egul
atio
nsfo
rA
llow
able
Act
ivit
ies:
Yes
orN
o
Ban
king
Cri
ses
Ban
kN
onfin
anci
alE
stim
ate
Ow
ners
hip
ofF
irm
Yea
rof
ofTo
tal
Non
finan
cial
Ow
ners
hip
Cri
sis
Scop
eof
Pro
blem
Los
ses/
Cos
tsSe
curi
ties
Insu
ranc
eR
ealE
stat
eF
irm
sof
Ban
ksSy
stem
icM
ajor

1997
bD
istr
esse
dba
nks
No
No
No
No
No
acco
unte
dfo
r3.
9p
erce
ntof
bank
ing
syst
emas
sets
.N
orw
ay19
87–9
3aC
entr
alB
ank
Rec
apit
aliz
atio
nN
oN
oN
oN
oN
o1
1pr
ovid
edsp
ecia
lco
sts
amou
nted
loan
sto
six
bank
s,to
8p
erce
ntof
suff
erin
gfr
ompo
st-
GD
P.oi
lrec
essi
onof
1985
–86
and
from
prob
lem
real
esta
telo
ans;
stat
eto
okco
ntro
lof
thre
ela
rges
tba
nks
(equ
ival
ent
to85
per
cent
ofba
nkin
gsy
stem
asse
ts,w
hose
loan
loss
esha
dw
iped
out
capi
tal)
,pa
rtly
thro
ugh
aG
over
nmen
tB
ank
Inve
stm
ent
Fun
d(N
kr5
billi
on)
and
the
stat
e-ba
cked
Ban
kIn
sura
nce
Fun
dha
dto
incr
ease
capi
talt
oN
kr11
billi
on.
Per
u19
83–9
0aT
wo
larg
eba
nks
No
No
No
No
No
11
faile
d.T
here
stof
the
syst
emsu
ffer
edfr
omhi
ghle
vels
ofno
nper
form
ing
loan
san
dfin
anci
aldi
sint
erm
edia
tion
follo
win
gth
ena
tion
aliz
atio
nof
the
bank
ing
syst
emin
1987
.(c
onti
nued
)

The
Phi
lippi
nes
1981
–87a
Tw
opu
blic
bank
sA
tit
sp
eak,
n.a.
n.a.
n.a.
n.a.
n.a.
11
acco
unti
ngfo
r50
cent
ralb
ank
per
cent
ofba
nkin
gas
sist
ance
tosy
stem
asse
ts,s
ixfin
anci
alpr
ivat
eba
nks
inst
itut
ions
acco
unti
ngfo
r12
amou
nted
top
erce
ntof
bank
ing
19.1
bnp
esos
(3sy
stem
asse
ts,3
2p
erce
ntof
thri
fts
acco
unti
ngfo
rG
DP
).53
.2p
erce
ntof
thri
ftba
nkin
gas
sets
and
128
rura
lban
ks.
1998
–Si
nce
Janu
ary
1998
,N
etlo
ssN
oN
oN
oN
oN
oon
goin
gaon
eco
mm
erci
ales
tim
ated
atba
nk,s
even
out
ofU
SD4.
0bn
,or
88th
rift
san
d40
out
6.7
per
cent
ofof
750
rura
lban
ksG
DP
by19
99.
have
been
plac
edun
der
rece
iver
ship
.B
anki
ngsy
stem
NP
Ls
reac
hed
10.8
per
cent
byA
ugus
tof
1998
and
12.4
per
cent
byN
ovem
ber
1998
.E
xpec
ted
tore
ach
20p
erce
ntin
1999
.Sr
iLan
ka19
89–9
3aSt
ate-
owne
dba
nks
Res
truc
turi
ngn.
a.n.
a.n.
a.n.
a.n.
a.1
1co
mpr
isin
g70
cost
amou
nted
per
cent
ofba
nkin
gto
25bn
rup
ees
Tabl
e2.
12(c
onti
nued
)
Cod
ing
of
Cha
nge
inR
egul
atio
nsfo
rA
llow
able
Act
ivit
ies:
Yes
orN
o
Ban
king
Cri
ses
Ban
kN
onfin
anci
alE
stim
ate
Ow
ners
hip
ofF
irm
Yea
rof
ofTo
tal
Non
finan
cial
Ow
ners
hip
Cri
sis
Scop
eof
Pro
blem
Los
ses/
Cos
tsSe
curi
ties
Insu
ranc
eR
ealE
stat
eF
irm
sof
Ban
ksSy
stem
icM
ajor

syst
emes
tim
ated
to(5
per
cent
ofha
veno
nper
form
ing
GD
P).
loan
rati
oof
abou
t35
per
cent
.Sw
eden
1991
aN
ordb
anke
nan
dC
ost
ofN
oN
oN
oY
es,c
hang
edN
o1
1G
ota
Ban
kin
solv
ent,
reca
pita
lizat
ion
from
acco
unti
ngfo
r21
.6am
ount
edto
4pr
ohib
ited
top
erce
ntof
tota
lp
erce
ntof
GD
P.re
stri
cted
inba
nkin
gsy
tem
Aug
ust
1991
.as
sets
.Spa
rban
ken
For
esta
inte
rven
ed,
acco
unti
ngfo
r24
per
cent
ofto
tal
bank
ing
syst
emas
sets
.Ove
rall,
five
ofsi
xla
rges
tba
nks,
acco
unti
ngfo
rov
er70
per
cent
ofba
nkin
gsy
stem
asse
tsex
per
ienc
eddi
fficu
ltie
s.T
anza
nia
Lat
e19
87:t
hem
ain
1987
:im
plie
dn.
a.n.
a.n.
a.n.
a.n.
a.1
119
80s;
finan
cial
inst
itut
ions
loss
esam
ount
1990
saha
dar
rear
sto
near
ly10
amou
ntin
gto
half
ofp
erce
ntof
GN
P.th
eir
port
folio
;199
5:T
heN
atio
nalB
ank
ofC
omm
erce
whi
chac
coun
ted
for
95p
erce
ntof
bank
ing
syst
emas
sets
,in
solv
ent
sinc
e19
90–9
2,po
ssib
lylo
nger
.T
haila
nd19
83–8
7aA
utho
riti
esG
over
nmen
tn.
a.n.
a.n.
a.n.
a.n.
a.1
1in
terv
ened
in50
cost
for
50fin
ance
and
secu
rity
finan
cefir
ms
and
5co
mpa
nies
com
mer
cial
bank
sor
esti
mat
edat
0.5
(con
tinu
ed)

abou
t25
per
cent
ofp
erce
ntof
GN
P;
tota
lfina
ncia
lsys
tem
gove
rnm
ent
cost
asse
ts;3
com
mer
cial
for
subs
idiz
edba
nks
judg
edlo
ans
amou
nted
inso
lven
t(1
4.1
toab
out
0.2
per
cent
ofp
erce
ntof
GD
Pco
mm
erci
alba
nkin
gan
nual
ly.
asse
ts).
1997
–U
pto
Mar
ch19
99,
Net
loss
esN
oN
oN
oN
oN
oon
goin
gaB
ank
ofT
haila
ndes
tim
ated
atin
terv
ened
in70
USD
59.7
bn,o
rfin
ance
com
pani
es42
.3p
erce
ntof
(out
of91
)w
hich
GD
Pin
1999
.to
geth
erac
coun
ted
for
12.8
per
cent
offin
anci
alsy
stem
asse
tsof
72p
erce
ntof
finan
ceco
mpa
nyas
sets
.It
also
inte
rven
edin
six
bank
sth
atto
geth
erha
da
mar
ket
shar
eof
12.3
per
cent
.At
end
1998
,ban
king
syts
emN
PL
sha
d
Tabl
e2.
12(c
onti
nued
)
Cod
ing
of
Cha
nge
inR
egul
atio
nsfo
rA
llow
able
Act
ivit
ies:
Yes
orN
o
Ban
king
Cri
ses
Ban
kN
onfin
anci
alE
stim
ate
Ow
ners
hip
ofF
irm
Yea
rof
ofTo
tal
Non
finan
cial
Ow
ners
hip
Cri
sis
Scop
eof
Pro
blem
Los
ses/
Cos
tsSe
curi
ties
Insu
ranc
eR
ealE
stat
eF
irm
sof
Ban
ksSy
stem
icM
ajor

reac
hed
46p
erce
ntof
tota
lloa
ns.
Tur
key
1994
bT
hree
bank
sfa
iled
Up
toJu
neN
oN
oN
oN
oY
es,c
hang
ed1
1in
Apr
il19
94.
1994
,fr
omau
thor
itie
sun
rest
rict
edsp
ent
1.1
top
erm
itte
d.p
erce
ntof
GD
P.A
sof
1993
,ba
nks
may
only
acqu
ire
shar
es,
incl
udin
gbo
nus
shar
es,
ofa
nonfi
nanc
ial
firm
upto
am
axim
umof
15p
erce
ntof
thei
row
nfu
nd,a
ndth
eto
tals
umof
inve
stm
ent
inth
ese
com
pani
esm
ayno
tex
ceed
60p
erce
ntof
the
bank
s’to
tal
fund
s.U
nite
dSt
ates
1984
–91b
Mor
eth
an1,
400
Cos
tof
No
No
No
No
No
01
savi
ngs
&lo
ans
and
savi
ngs
&lo
an1,
300
bank
sfa
iled.
clea
nup
amou
nted
toan
(con
tinu
ed)

esti
mat
edU
SD18
0bi
llion
equi
vale
ntto
3.2
per
cent
ofG
DP.
Uru
guay
1981
–84a
Aff
ecte
din
stit
utio
nsC
osts
ofn.
a.n.
a.n.
a.n.
a.n.
a.1
1ac
coun
ted
for
30re
capi
taliz
ing
per
cent
offin
anci
alba
nks
esti
mat
edsy
stem
asse
ts;
atU
SD35
0in
solv
ent
bank
sm
illio
n(7
acco
unte
dfo
r20
per
cent
ofp
erce
ntof
finan
cial
GN
P);
Cen
tral
syst
emde
posi
ts.
Ban
k’s
quas
i-fis
call
osse
sas
soci
ated
wit
hsu
bsid
ized
cred
itop
erat
ions
and
purc
hase
oflo
anpo
rtfo
lios
amou
nted
to24
.2p
erce
ntof
GD
Pdu
ring
1982
–85.
Tabl
e2.
12(c
onti
nued
)
Cod
ing
of
Cha
nge
inR
egul
atio
nsfo
rA
llow
able
Act
ivit
ies:
Yes
orN
o
Ban
king
Cri
ses
Ban
kN
onfin
anci
alE
stim
ate
Ow
ners
hip
ofF
irm
Yea
rof
ofTo
tal
Non
finan
cial
Ow
ners
hip
Cri
sis
Scop
eof
Pro
blem
Los
ses/
Cos
tsSe
curi
ties
Insu
ranc
eR
ealE
stat
eF
irm
sof
Ban
ksSy
stem
icM
ajor

Ven
ezue
laL
ate
Not
able
bank
n.a.
n.a.
n.a.
n.a.
n.a.
11
1970
sbfa
ilure
s:B
anco
and
Nac
iona
lede
1980
sD
escu
ento
(197
8);
BA
ND
AG
RO
(198
1);B
anco
delo
sT
raba
jado
res
deV
enez
uela
(198
2);
Ban
code
Com
erci
o(1
985)
;BH
CU
(198
5);B
HC
O(1
985)
;Ban
coL
ara
(198
6).
1994
–In
solv
ent
bank
sN
oN
oN
oN
oN
oon
goin
gaac
coun
ted
for
30p
erce
ntof
finan
cial
syst
emde
posi
ts.
Aut
hori
ties
inte
rven
edin
13ou
tof
47ba
nks
whi
chhe
ld50
per
cent
ofde
posi
tsin
1994
,and
infiv
ead
diti
onal
bank
sin
1995
.Z
imba
bwe
1995
–T
wo
out
offiv
eN
oN
oN
oN
oN
o1
1on
goin
gaco
mm
erci
alba
nks
reco
rded
high
NP
Lra
tio.
Sou
rces
:A
utho
rs,b
ased
onC
apri
oan
dK
linge
biel
(199
9);G
loba
lSur
vey,
Inst
itut
eof
Inte
rnat
iona
lBan
kers
,var
ious
year
s;an
dth
eO
ffice
ofth
eC
ompt
rolle
rof
the
Cur
renc
y.
Not
e:n.
a.�
not
avai
labl
e.aSy
stem
icba
nkin
gcr
ises
.bN
onsy
stem
icba
nkin
gcr
ises
.
11. The inability to make limits on powers stick may be one reason for this trend. Bandieraand colleagues (1999) characterized financial reforms as a vector of variables pertaining tochanges over long periods of time in interest rate regulation, reserve requirements, directedcredit, bank ownership (moves toward privatization), liberalization of securities markets,prudential regulation, and international financial liberalization. They did not includechanges in banks’ powers insofar as there were so few changes. Note also that in the particu-lar case of the United States, banks were allowed to underwrite corporate debt in 1989 andcorporate equity in 1990 through subsidiaries, but subject to a revenue restriction. In 1999there were more than forty banking organizations that had established such subsidiaries.
12. In this respect, Kwan and Laderman (1999, 24), in a review of literature pertaining tothe United States, state that “On the effects of securities activities on banking organizations’safety and soundness, the bulk of empirical evidence indicated some potential for risk reduc-tion in expanding banks’ securities powers.”
restrictive regulations. Indeed, the overall indication is that there was notmuch change in these regulations: Of the 250 possible entries in the table,141 showed no subsequent change at all (neither during nor immediatelyafter the crisis), 14 showed a change in the direction of fewer restrictions(only 2 of which could be linked to a crisis), and only 3 showed greaterrestrictions after the crisis; in 92 cases we have no data. Thus, even in therelatively few cases in which there was a change during or after a crisis, itwas in the direction of broader powers for banks, meaning that we were us-ing fewer restrictions than actually existed. This biases the results againstthe conclusion that greater restrictions increase the likelihood of a crisis.
Governments generally do respond to banking crises, but the responsehas typically been in the direction of limiting the bank safety net or raisingits cost, as in the cases of the early crises from the 1980s in Argentina andChile, rather than attempting to restrict banks’ powers. Interestingly, bothcountries in fact have moved in the other direction, providing added pow-ers to banks, which is consistent with the general trend toward broaderpowers. More generally, any concern about the endogeneity in the crisisregressions would appear to be unwarranted.11 Reestimating the probit re-gressions in table 2.11 with the data from table 2.12, moreover, does notproduce any significant changes.
Thus, although the analysis does not fully resolve the endogeneity issue,the results clearly suggest that greater regulatory restrictions on the abilityof commercial banks to engage in securities activities and the ability ofcommercial banks to own and control nonfinancial firms tend to increasethe probability that a country will experience a major banking crisis.12
2.4 Summary and Conclusions
The purposes of this paper have been twofold. The first is to presentcomprehensive and detailed information on the regulatory environmentand ownership structure of commercial banks in a large number of coun-tries around the world. There is substantial variation among the more thansixty countries in our sample about what banks are allowed to do with
78 James R. Barth, Gerard Caprio Jr., and Ross Levine

respect to securities, insurance, and real estate activities. A bank in onecountry, in other words, is not necessarily the same as a bank in anothercountry. As a result of all the banking crises in different countries in recentyears, there have been numerous calls for banking reforms. Yet, they typi-cally fail to address the issue of exactly which regulatory environment ismost appropriate for simultaneously promoting bank performance andstability. The information presented here helps one address this issue byinitially recognizing the substantial cross-country variation that exists inbank regulation. This variation occurs, moreover, in countries that differ interms of geographical location and level of economic development, amongother ways. At the same time, it is found that state ownership of banksvaries from a high of 80 percent to a low of 0 percent in our sample ofcountries.
The second purpose is to assess whether or not it matters what a bankis permitted to do with respect to securities, insurance, and real estateactivities. As summarized in table 2.13, whether restrictions are placed onsecurities activities matters most. The tighter the restrictions placed onthis activity, on average, the more inefficient banks are and the greater thelikelihood of a banking crisis is. The likelihood of a banking crisis is alsogreater, on average, the tighter are the restrictions placed on bank owner-ship of nonfinancial firms. Perhaps surprisingly, not one of these restric-tions produces any beneficial effects with respect to financial development,nonbank sector and stock market development, or industrial competition.Nor is it found that any of them lessen the likelihood of a banking crisisor enhance bank efficiency. At the same time, the greater the share ofbank assets controlled by state-owned banks, on average, the less financialdevelopment as well as the development of the nonbank sector and thestock market will be.
It is important to emphasize that this paper is the product of an ongoingresearch project. Thus, as more information is collected and analyzed, thefindings and conclusions reported here may be modified. This means thatthe paper actually represents a progress report on a timely and importantpublic policy issue. Much more work remains. We are in the process ofcollecting and analyzing information on supervision. Optimal regulatoryrestrictions may depend importantly on the type of supervisory regime.Indeed, the choice of regulatory restrictions may be importantly influ-enced by the efficiency of supervision. We plan to explore these relation-ships in future research. The bottom line, however, is that this paper pres-ents new cross-country data and analyses of what a bank is and whetheror not it matters. For now it does indeed matter what a bank is permittedto do. The imposition of tight restrictions on some activities of banks ap-pears not to be beneficial and, worse yet, downright harmful in some im-portant ways.
Banking Systems around the Globe 79

Tabl
e2.
13S
umm
ary
ofE
mpi
rica
lRes
ults
Ban
kF
inan
cial
Con
cent
rati
on&
Indu
stri
alN
onba
nk&
Ban
kIn
effici
ency
Dev
elop
men
tB
ank
per
capi
taC
ompe
titi
onSt
ock
Mar
ket
Cri
sis
Secu
riti
esre
stri
ctio
nsSP
RSP
RIn
sura
nce
rest
rict
ions
Rea
lest
ate
rest
rict
ions
SPR
SNC
SNC
SPC
Ban
kow
ning
nonfi
nanc
ialfi
rms
rest
rict
ions
SPC
SNC
SPR
Non
finan
cial
firm
sow
ning
bank
sre
stri
ctio
nsSt
ate-
owne
dba
nkas
sets
SPC
SNC
SNR
Not
es:S
PC
indi
cate
sa
sign
ifica
ntpo
siti
veco
rrel
atio
n;SP
Rin
dica
tes
sign
ifica
ntpo
siti
vere
lati
onsh
ip,c
ontr
ollin
gfo
rG
DP
per
capi
taan
dgo
vern
men
tqua
lity;
SNC
indi
cate
sa
sign
ifica
ntne
gati
veco
rrel
atio
n;SN
Rin
dica
tes
asi
gnifi
cant
nega
tive
rela
tion
ship
,con
trol
ling
for
GD
Ppe
rca
pita
and
gove
rnm
ent
qual
ity.

Appendix A
Bank Regulations and the Socioeconomic Environment
This appendix presents correlations between the commercial bank regula-tory indicators and the degree of state ownership of banks and a varietyof political, cultural, legal, and economic characteristics. These socioeco-nomic factors may influence bank regulations and state ownership ofbanks. For instance, it has been found that income diversity and ethnicdiversity influence many policy decisions (see Engerman and Sokoloff1997 and Easterly and Levine 1997). Consequently, we examine the associ-ations between ethnic and income diversity and the commercial bank reg-ulatory decisions of governments. Furthermore, La Porta and colleagues(1998) emphasize that common law countries tend to provide greater pro-tection to outside investors in firms (creditors and minority shareholders).This may influence public demand for regulation. Thus, we examine therelationship between the legal environment and both regulatory regimeand state ownership of banks. Also, regulatory policies reflect the outcomeof political decisions. Thus, it is worth examining whether countries withgood public institutions tend to select particular financial sector policies.Lastly, we include the level of economic development. Not only is it worthexamining whether relatively successful countries tend to have particularregulatory/ownership patterns, but economic development may also behighly correlated with a variety of institutional and other national traitsthat are both associated with financial sector policies and for which we donot have direct measures. The goal here is to present some summary statis-tics regarding the relationship between the bank regulatory environmentand the socioeconomic environment more generally. More specifically, thesix indicators that we study are as follows:
1. Development: Real per capita GDP in 1980 (source: Penn WorldTables).
2. Good Government: Average value of three variables: (a) risk of expro-priation by the government, (b) the degree of corruption, and (c) the law-and-order tradition of the country. Each variable is based on a scale from0 to 10, where higher values signify better government (La Porta, Lopez-de-Silanes, and Shleifer 1999).
3. Income diversity: Average of Gini coefficients for each country overthe period 1980–95 (Deininger and Squire 1996).
4. Ethnic diversity: Average value of five indexes of ethnolinguistic frac-tionalization, with higher values denoting greater diversity. The scale ex-tends from 0 to 1 (Easterly and Levine 1997).
5. Common law country: Dummy variable with a value of 1 if the coun-
Banking Systems around the Globe 81

82 James R. Barth, Gerard Caprio Jr., and Ross Levine
13. We calculate this from La Porta and colleagues (1998). Specifically, for shareholderrights, we add 1 if (1) the country allows the shareholders to mail their proxy to the firm; (2)shareholders are not required to deposit their shares prior to the General Shareholders’Meeting; (3) cumulative voting or proportional representation of minorities in the board ofdirectors is allowed; (4) an oppressed minorities mechanism is in place; (5) the minimumpercentage of share capital that entitles a shareholder to call for an Extraordinary Sharehold-ers’ Meeting is less than or equal to 10 percent (the sample median); or (6) shareholders havepreemptive rights that can only be waived by a shareholder’s vote. Then, we add 1 for creditorrights if (7) the country imposes restrictions, such as creditors’ consent, to file for reorganiza-tion; (8) secured creditors are able to gain possession of their security once the reorganizationpetition has been approved (no automatic stay); (9) secured creditors are ranked first in thedistribution of the proceeds that result from the disposition of assets of a bankrupt firm; and(10) the debtor does not retain the administration of its property pending the resolution ofthe reorganization. Thus, the legal rights of investors index can potentially assume valuesbetween 0 and 10.
try has an English, common law heritage, and 0 otherwise (La Porta,Lopez-de-Silanes, and Shleifer 1999).
6. Legal rights of investors: An index of the legal rights of creditors andminority shareholders (computed from La Porta, Lopez-de-Silanes, andShleifer 1998).13
Table 2A.1 presents simple correlations (and p-values for the correla-tions) between the regulatory/ownership indicators and the six indicatorsof the national environment. A few findings worth mentioning are as fol-lows. First, legal heritage and the legal rights of investors are not stronglyassociated with commercial banking regulations or state ownership ofbanks. Second, although ethnic diversity is not highly correlated with theregulatory/ownership environment, income diversity is strongly linked.Countries with greater income diversity tend to have more restrictions ontheir commercial banks with respect to (a) engaging in securities marketactivities and (b) owning nonfinancial firms. Third, governments in richercountries (and good governments—those with low corruption, a stronglaw-and-order tradition, and low risk of expropriation) tend to (a) imposefewer regulatory restrictions on their banks and (b) own a small percent-age of the banking industry. The level of economic development and thequality of the government are very highly correlated (0.82).

Tabl
e2A
.1C
orre
lati
ons
for
Ban
kR
egul
atio
nsan
dE
nvir
onm
ent
inw
hich
Ban
ksO
pera
te
Ban
ksO
wni
ngN
onfin
anci
alSt
ate-
Ow
ned
Rea
lN
onfin
anci
alF
irm
sO
wni
ngB
ank
Res
tric
tSe
curi
ties
Insu
ranc
eE
stat
eF
irm
sB
anks
Ass
ets
Dev
elop
men
t�
0.44
0�
0.11
0�
0.37
8�
0.45
0�
0.34
2�
0.05
0�
0.34
6(0
.000
)(0
.379
)(0
.002
)(0
.000
)(0
.005
)(0
.700
)(0
.005
)G
ood
Gov
ernm
ent
�0.
374
�0.
224
�0.
176
�0.
374
�0.
380
�0.
161
�0.
286
(0.0
03)
(0.0
83)
(0.1
74)
(0.0
04)
(0.0
03)
(0.2
30)
(0.0
30)
Inco
me
dive
rsit
y0.
347
0.39
60.
106
0.15
80.
371
0.19
50.
080
(0.0
10)
(0.0
03)
(0.4
47)
(0.2
55)
(0.0
06)
(0.1
71)
(0.5
71)
Eth
nic
dive
rsit
y0.
092
�0.
006
0.06
70.
134
0.04
80.
139
0.04
2(0
.464
)(0
.959
)(0
.592
)(0
.285
)(0
.707
)(0
.283
)(0
.744
)C
omm
onla
wco
untr
y�
0.06
0�
0.08
60.
093
�0.
042
�0.
078
0.23
3�
0.04
2(0
.634
)(0
.493
)(0
.458
)(0
.735
)(0
.535
)(0
.068
)(0
.744
)L
egal
righ
tsof
inve
stor
s�
0.06
9�
0.06
10.
092
�0.
035
�0.
193
0.14
1�
0.02
7(0
.653
)(0
.690
)(0
.547
)(0
.818
)(0
.208
)(0
.380
)(0
.866
)
Not
e:N
umbe
rsin
pare
nthe
ses
are
p-va
lues
.

Tabl
e2A
.2D
ata
onF
inan
cial
Dev
elop
men
tan
dth
eP
olit
ical
/Eco
nom
icE
nvir
onm
ent
Goo
dN
etIn
tere
stP
riva
teB
ank
Indu
stri
alTo
talV
alue
Non
bank
Dev
elop
men
tG
over
nmen
tM
argi
nC
redi
tC
once
ntra
tion
Com
peti
tion
Tra
ded
Cre
dits
Arg
enti
na6,
506
12.7
0.08
20.
150.
573.
050.
017
0.01
Aus
tral
ia12
,520
20.4
0.01
90.
810.
673.
040.
144
0.34
Aus
tria
10,5
0920
.80.
019
0.87
0.72
4.03
0.04
00.
04B
arba
dos
6,37
90.
00.
033
0.40
1.00
0.00
30.
08B
elgi
um11
,109
20.9
0.02
30.
370.
623.
930.
034
Bol
ivia
1,98
98.
00.
035
0.20
0.46
0.00
00.
02B
otsw
ana
1,94
016
.50.
052
0.11
0.95
0.00
5B
razi
l4,
303
15.2
0.12
00.
250.
683.
310.
064
0.09
Can
ada
14,1
3321
.70.
018
0.77
0.58
3.90
0.15
30.
28C
hile
3,89
214
.90.
045
0.50
0.49
3.62
0.03
80.
06C
olom
bia
2,94
611
.20.
064
0.27
0.46
2.17
0.00
70.
13C
ypru
s5,
295
15.7
0.06
70.
770.
880.
015
0.21
Den
mar
k11
,342
21.7
0.04
90.
420.
754.
760.
064
Ecu
ador
3,23
813
.70.
072
0.19
0.41
0.01
70.
04E
gypt
,Ara
bR
ep.
1,64
511
.10.
012
0.28
0.65
4.19
0.00
40.
04E
lSal
vado
r2,
014
8.3
0.03
90.
240.
860.
00F
iji3,
609
0.0
0.30
0.02
Fin
land
10,8
5121
.70.
016
0.67
0.86
2.77
0.04
4F
ranc
e11
,756
20.5
0.03
50.
910.
413.
720.
084
0.09
The
Gam
bia
1,01
715
.00.
16G
erm
any
11,9
2020
.80.
025
0.92
0.44
4.53
0.18
70.
07G
hana
976
10.3
0.07
10.
030.
940.
004
Gre
ece
5,90
115
.20.
035
0.40
0.77
3.18
0.01
60.
18G
uate
mal
a2,
574
8.2
0.05
40.
150.
430.
000
0.01
Guy
ana
1,92
77.
90.
044
0.30
1.00
0.08
Hon
gK
ong
8,71
918
.30.
020
1.36
0.80
3.88
0.50
6Ic
elan
d11
,566
21.6
0.39
2.00
0.00
5In
dia
882
13.0
0.03
00.
270.
422.
870.
048
0.03
Indo
nesi
a1,
281
10.8
0.04
10.
260.
433.
290.
018

Irel
and
6,82
319
.50.
016
0.63
0.79
4.07
0.14
40.
36Jo
rdan
3,38
412
.00.
022
0.62
0.90
2.63
0.09
10.
07R
epub
licof
Kor
ea3,
093
14.7
0.02
30.
810.
332.
450.
266
0.35
Les
otho
994
0.0
0.16
1.00
0.02
Lux
embo
urg
11,8
9322
.00.
007
0.24
0.38
3.00
0.01
6M
adag
asca
r98
411
.70.
060
0.16
0.96
Mal
aysi
a3,
799
16.5
0.02
50.
800.
543.
880.
427
0.21
Mal
ta4,
483
14.0
0.02
30.
600.
970.
11M
exic
o6,
054
13.4
0.05
30.
180.
592.
760.
063
0.03
Net
herl
ands
11,2
8422
.00.
015
1.28
0.73
4.77
0.19
10.
54N
ewZ
eala
nd10
,362
21.7
0.02
50.
540.
773.
400.
080
0.13
Nig
eria
1,43
88.
80.
047
0.15
0.83
0.00
00.
02N
orw
ay12
,141
21.9
0.03
10.
890.
853.
470.
061
0.40
Pak
ista
n1,
110
9.2
0.02
90.
230.
780.
019
Per
u2,
875
9.9
0.07
20.
100.
722.
940.
014
0.03
The
Phi
lippi
nes
1,87
98.
60.
042
0.29
0.47
2.67
0.05
30.
07Po
rtug
al4,
982
18.5
0.03
50.
630.
454.
270.
021
Rw
anda
757
0.0
0.04
40.
081.
000.
01Se
yche
lles
2,90
60.
00.
10Si
ngap
ore
7,05
319
.40.
021
0.95
0.73
4.16
0.44
60.
16So
uth
Afr
ica
3,49
614
.90.
039
0.79
0.78
2.28
0.07
60.
28Sp
ain
7,39
018
.60.
038
0.72
0.46
4.06
0.06
20.
06Sr
iLan
ka1,
635
10.2
0.05
10.
190.
830.
013
Suri
nam
e3,
737
8.6
0.37
Swed
en12
,456
21.4
0.02
71.
090.
892.
860.
137
0.64
Swit
zerl
and
14,3
0122
.00.
016
1.78
0.74
4.00
0.97
50.
34T
anza
nia
480
13.2
Tha
iland
2,17
814
.30.
030
0.68
0.54
2.62
0.20
30.
17T
urke
y2,
874
13.2
0.09
40.
140.
453.
140.
062
0.01
Uni
ted
Kin
gdom
10,1
6720
.30.
020
0.74
0.58
4.46
0.35
5U
nite
dSt
ates
15,2
9521
.20.
039
1.31
0.18
4.22
0.34
40.
66U
rugu
ay5,
091
12.6
0.05
60.
310.
860.
001
Ven
ezue
la7,
401
13.5
0.07
80.
390.
522.
280.
014
0.18
Zim
babw
e1,
206
11.1
0.04
40.
220.
822.
400.
010
0.09

Table 2A.3 Banking Crises Around the Globe
Systemic Major Systemic Major
Argentina 1 1 Jordan 0 0Australia 0 0 Republic of Korea 1 1Austria 0 0 Lesotho 0 0Barbados 0 0 Luxembourg 0 0Belgium 0 0 Madagascar 1 1Bolivia 1 1 Malaysia 1 1Botswana 0 0 Malta 0 0Brazil 1 1 Mexico 1 1Canada 0 1 Netherlands 0 0Chile 1 1 New Zealand 0 0Colombia 1 1 Nigeria 1 1Cyprus 0 0 Norway 1 1Denmark 0 1 Pakistan 0 0Ecuador 1 1 Peru 1 1Egypt, Arab Rep. 1 1 The Philippines 1 1El Salvador 1 1 Portugal 0 0Fiji 0 0 Rwanda 0 0Finland 1 1 Seychelles 0 0France 0 0 Singapore 0 0The Gambia 0 0 South Africa 0 0Germany 0 0 Spain 0 0Ghana 1 1 Sri Lanka 1 1Greece 0 0 Suriname 0 0Guatemala 0 0 Sweden 1 1Guyana 0 0 Switzerland 0 0Hong Kong 0 1 Tanzania 1 1Iceland 0 0 Thailand 1 1India 0 1 Turkey 1 1Indonesia 1 1 United Kingdom 0 0Ireland 0 0 United States 0 1Israel 0 0 Uruguay 1 1Italy 0 1 Venezuela 1 1Japan 1 1 Zimbabwe 1 1
86 James R. Barth, Gerard Caprio Jr., and Ross Levine
References
Allen, F., and Douglas Gale. 2000. Comparing financial systems. Cambridge,Mass.: MIT Press.
Bandiera, O., G. Caprio, P. Honohan, and F. Schiantarelli. 2000. Does financialreform raise or reduce savings? Review of Economics and Statistics 82 (2):239–63.
Barth, J. R., R. D. Brumbaugh Jr., and J. A. Wilcox. 2000. The repeal of Glass-Steagall and the advent of broad banking. Journal of Economic Perspectives 14(2): 191–204.
Barth, J. R., R. D. Brumbaugh Jr., and G. Yago. 1997. Breaching the walls be-tween banking and commerce. Banking Strategies 10 (July/August): 47–52.
Barth, J. R., G. Caprio Jr., and R. Levine. 1999. Financial regulation and perfor-mance: Cross-Country Evidence. World Bank Policy Research Working Paperno. 2037. Santa Monica, Calif.: Milken Institute.
Barth, J. R., D. E. Nolle, and T. N. Rice. 2000. Commercial banking structure,regulation, and performance: An international comparison. In ModernizingFinancial Systems, ed. D. B. Papadimmitriou, 119–251. New York: St. Martin’sPress.
Beck, T., A. Demirguc-Kunt, and R. Levine. 2001. A new database on financialdevelopment and structure. World Bank Economic Review, forthcoming.
Beck, T., R. Levine, and N. Loayza. 2000. Finance and the sources of growth.Journal of Financial Economics 58 (1): 261–300.
Boyd, J. H., C. Chang, and B. D. Smith. 1998. Moral hazard under commercialand universal banking. Journal of Money, Credit, and Banking 30 (3, pt. 2):426–68.
Camdessus, M. 1997. The challenges of a sound banking system. In Bankingsoundness and monetary policy, ed. C. Charles Enoch and J. H. Green, 535–39.Washington, D.C.: International Monetary Fund.
Caprio, G., Jr., and P. Honohan. 1999. Restoring banking stability: Beyond super-vised capital requirements. Journal of Economic Perspectives 13 (4): 43–64.
Caprio, G., Jr., and D. Klingebiel. 1999. Episodes of systemic and borderline fi-nancial crises. Washington, D.C.: World Bank. Mimeograph.
Cetorelli, N., and M. Gambera. 2001. Banking market structure, financial depen-dence and growth: International evidence from industry data. Journal of Fi-nance, forthcoming.
Deininger, K., and L. Squire. 1996. A new data set on measuring income inequal-ity. World Bank Economic Review 10 (3): 565–92.
Demirguc-Kunt, A., and V. Maksimovic. 1998. Law, finance, and firm growth.Journal of Finance 53:2107–137.
Dutz, M., and A. Hayri. 1999. Does more intense competition lead to highergrowth? Washington, D.C.: World Bank. Mimeograph.
Easterly, W., and R. Levine. 1997. Africa’s growth tragedy: Policies and ethnicdivisions. Quarterly Journal of Economics 112:1203–50.
Engerman, S., and K. Sokoloff. 1997. Factor endowments, institutions, and differ-ential paths of growth among new world economies. In How Latin America fellbehind, ed. S. Haber, 260–304. Stanford, Calif.: Stanford University Press.
Gertler, M. 1988. Financial structure and aggregate economic activity: An over-view. Journal of Money, Credit, and Banking 20:559–88.
Jayaratne, J., and P. E. Strahan. 1996. The finance-growth nexus: Evidence frombank branch deregulation. Quarterly Journal of Economics 111:639–70.
Kane, E. J. 1996. The increasing futility of restricting bank participation in insur-ance activities. In Universal banking: Financial system Design Reconsidered, ed.I. Walter and A. Saunders, 338–417. Chicago: Irwin.
King, R. G., and R. Levine. 1993a. Finance and growth: Schumpeter might beright. Quarterly Journal of Economics 108:717–38.
———. 1993b. Finance, entrepreneurship, and growth: Theory and evidence. Jour-nal of Monetary Economics 32:513–42.
Kroszner, R. S., and R. G. Rajan. 1994. Is the Glass-Steagall Act justified? A studyof the US experience with universal banking before 1933. American EconomicReview 84:810–32.
Kwan, S. H., and E. S. Laderman. 1999. On the portfolio effects of financial con-vergence: A review of the literature. Federal Reserve Bank of San Francisco Eco-nomic Review 2:18–31.
Lamoreaux, N. 1994. Insider lending: Banks, personal connections, and economicdevelopment in industrial New England. New York: Cambridge University Press.
Banking Systems around the Globe 87

Mark Gertler is the Henry and Lucey Moses Professor of Economics and Director of theC. V. Starr Center for Applied Economics at New York University, and a research associateof the National Bureau of Economic Research.
La Porta, R., F. Lopez-de-Silanes, and A. Shleifer. 2000. Government ownershipof commercial banks. Cambridge, Mass.: Harvard University. Mimeograph.
La Porta, R., F. Lopez-de-Silanes, A. Shleifer, and R. W. Vishny. 1998. Law andfinance. Journal of Political Economy 106:1113–155.
———. 1999. The quality of government. Journal of Law, Economics, and Organi-zation 15:222–79.
Levine, R. 1997. Financial development and economic growth: Views and agenda.Journal of Economic Literature 35:688–726.
———. 2000. Bank-based or market-based financial systems: Which is better? Fi-nance Department, University of Minnesota, Carlson School of Management.Mimeograph.
———. 2001. Napoleon, Bourses, and growth: With a focus on Latin America.In Market augmenting government, ed. O. Azfar and C. Cadwell. Ann Arbor:University of Michigan Press, forthcoming.
Levine, R., N. Loayza, and T. Beck. 2000. Financial intermediation and growth:Causality and causes. Journal of Monetary Economics 46 (August): 31–77.
Levine, R., and S. Zervos. 1998. Stock markets, banks, and economic growth.American Economic Review 88:537–58.
Mishkin, F. S. 1999. Financial consolidation: Dangers and opportunities. Journalof Banking and Finance 23:675–91.
Penn World Tables. Available at http://pwt.econ.upenn.edu.Rajan, R. G., and L. Zingales. 1998. Financial dependence and growth. American
Economic Review 88:559–86.Santos, J. A. C. 1998a. Banking and commerce: How does the United States com-
pare to other countries? Federal Reserve Bank of Cleveland Economic Review 34(4): 14–26.
———. 1998b. Commercial banks in the securities business: A review. Journal ofFinancial Services Research 14 (1): 35–60.
———. 1998c. Mixing banking with commerce: A review. Bank for InternationalSettlements. Mimeograph.
White, E. 1986. Before the Glass-Steagall Act: An analysis of the investment bank-ing activities of commercial banks. Explorations in Economic History 23:33–55.
Wurgler, J. 2000. Financial markets and the allocation of capital. Journal of Finan-cial Economics 58 (1): 187–214.
Comment Mark Gertler
Overview
There are two parts to the paper: The first develops a data set that pro-vides cross-country measures of the stringency of legal restrictions on themix of banking and commerce and on bank ownership structure. The sec-ond part explores the extent to which these measures help explain (a) vari-
88 James R. Barth, Gerard Caprio Jr., and Ross Levine
ous measures of financial development and real development and (b) fi-nancial crises. The most striking finding is that more restrictive ownershipstructures tend to raise the likelihood of a financial crisis.
Overall, I find the paper a very useful addition to the literature. The de-velopment of the data set is a particularly important contribution. The em-pirical results are thought provoking. I do think, however, that there aresome serious identification problems that make the findings hard to inter-pret. But I also believe that there may be ways to address this issue, as Idiscuss here.
The data are of three types:
1. Qualitative indicators of restrictions on the mix of banking and com-merce and on bank ownership structure. Specifically, each indicator is agrade of 1 to 4 for a variety of regulatory categories.
2. Quantitative measures of the degree of financial sophistication andreal development.
3. An indicator (unity or zero) of whether or not a country experienceda banking crisis, based on the Caprio and Klingebiel (1999) rating.
The overall empirical strategy of the paper is to consider the explanatorypower of variables in category 1 for variables in categories 2 and 3. Thefirst part of the paper considers regressions of variables in 2 on variablesin 1; the second considers regressions of variables in 3 on variables in 1.Following I discuss each part in turn. Because the results on financialcrises are the most striking and controversial, I spend most of the time onthe second part and only briefly touch on the first.
Part I: Does Regulatory Structure AffectFinancial or Real Development, or Both?
The authors’ answer is generally no. There appears to be little correla-tion between measures of regulatory tightness and financial development.In some ways this result is disappointing because it offers no clear guid-ance for regulatory reform—“try it; it can’t hurt” is not exactly a compel-ling argument for regulatory reform.
However, the lack of statistical significance could in part reflect the na-ture of the data in conjunction with the way the econometric model isspecified. As just discussed, the independent variables that measure legalrestrictions are qualitative indicators. It is accordingly difficult to measureintensity (e.g., is going from category 2 to 3 the same in percent terms asgoing from 3 to 4?). On the other hand, the authors impose a linear rela-tion in the estimation between the quantitative dependent variables andthe qualitative independent variables. To the extent that the restriction oflinearity is not correct (as is likely to be the case in general), low statisticalsignificance could result.
Another factor is that with the current data, the authors are unable to
Banking Systems around the Globe 89

control for the adequacy of supervision and regulation. Having legal re-strictions on the books is of little meaning if these restrictions cannot beenforced. In this regard, it would obviously be desirable to extend the dataset to include a measure of the quality of regulatory enforcement.
One positive finding is that a more restrictive regulatory structure im-plies a higher net interest margin. This result is consistent with the argu-ment that relaxing ownership restrictions could produce efficiency gains.Rather than reflect true efficiency gains, however, a high net interest mar-gin could simply reflect legal deposit rate ceilings, which force down thecost of liabilities. It could be the case that countries that heavily regulateownership structure are also more likely to restrict deposit rates. If thelatter scenario is true, then the evidence does not necessarily support re-laxing ownership structure. I believe, however, that there is sufficient dataon deposit rate restrictions to get to the bottom of the issue.
Part II: Does Regulatory Structure Affectthe Likelihood of Financial Crisis?
The authors’ answer is yes, very much so. Probit regressions yield statis-tically and quantitatively significant effects of regulatory structure on thelikelihood of a crisis for post-1980 data. The authors make a convincingcase, furthermore, that the results are not due to reverse causation. Thatis, by and large regulations were not imposed in the wake of a crisis.
The authors’ preferred explanation for the link between ownership re-strictions and financial crises is that limits on the diversification of activi-ties raised risk exposure. Although I do not necessarily disagree, note thatthis argument runs directly counter to the argument used to justify impos-ing the restrictions in the first place. The original justification for the now-defunct Glass-Steagall Act was that it would reduce risk taking by banks.Obviously, there are some theoretical issues to sort out here.
Overall, the results are impressive, but they raise a huge puzzle. In par-ticular, variables are found to predict financial crises that bear no obviousrelation to the factors emphasized in conventional descriptions of recentfinancial turmoil. Indeed, the entire discussion and formal analysis is or-thogonal to the standard literature. The conventional theories indeed makealmost no mention of ownership structure. They instead (e.g. Borio, Ken-nedy, and Prowse 1994) stress the following factors:
1. Financial liberalization, which leads to increased competition.2. Increased risk taking by financial institutions due to the first factor
along with failure by the regulatory authority to adjust the safety net toaccount for the change in competition and also along with weak supervi-sion and enforcement of existing regulations.
3. Macro shocks; for example, asset price contractions (real estate, ex-change rate, stock market, etc.) and associated recessions that have an
90 James R. Barth, Gerard Caprio Jr., and Ross Levine

unduly harmful effect due to the increased risk taking by financial institu-tions.
Hutchinson and McDill (1999) provide formal support for the conven-tional theory, using a very similar methodology and, indeed, the exactsame dependent variable (the Caprio and Klingebiel [1999] measure offinancial crisis). In particular, they find that three factors contribute sig-nificantly to the likelihood of a crisis: (a) financial liberation; (b) explicitdeposit insurance protection; and (c) macroeconomic distress, as mea-sured by either real GDP growth or the change in real stock prices. Thiskind of empirical relation is exactly what the convention story suggests.
How do we reconcile the authors’ findings with those of Hutchinsonand McDill? The authors implicitly assume that the regulatory variablesthey include in their regressions are orthogonal to everything else thatmight affect the likelihood of a financial crisis, including the Hutchinsonand McDill variables. (The orthogonality assumption is required to justifythe coefficients on the regulatory variables as capturing the true effect ofthese variables on the likelihood of a crisis.)
There is, however, a clear geographic pattern to financial crises. In figure2C.1, the darkly shaded countries experienced a financial crisis; the lightlyshaded ones did not; and the countries not shaded do not appear in thesample. The crises are concentrated in four regions: Latin America, NorthAmerica, East Asia, and Scandinavia. Europe, for the most part, and Oce-ania (Australia and New Zealand) escaped formal banking crises.
Furthermore, in regions dominated by crises, it is unlikely that the coun-tries that escaped financial turmoil did so because they had fewer restric-tions on ownership. Table 2C.1 lists the countries by region, along with theauthors’ measure of the stringency of ownership restrictions. It is clear, forexample, that the countries in Latin America, East Asia, and Scandinaviathat did not have crises also did not have restrictions significantly weakerthan the norm for the region.
It is true, though, that the regions that largely escaped crises (Europeand Oceania) did have less restrictive systems. In other words, there is acorrelation between geography and the nature of the financial system,which reconciles the authors’ findings with the clear regional pattern infigure 2C.1. On the other hand, there is an identification problem becausegeography might be correlated with other relevant factors. For example,Europe and Oceania may simply have suffered less severe aggregate shocksthan the other regions.
Evidence from Higgens and Osler (1997), however, suggests that thesimple asymmetric shock hypothesis may not be correct. In particular, Eu-rope and Australia did experience asset price contractions similar in mag-nitude. Thus, there is some reason to believe that the banking systems inthese countries were more resilient than those in the regions experiencing
Banking Systems around the Globe 91
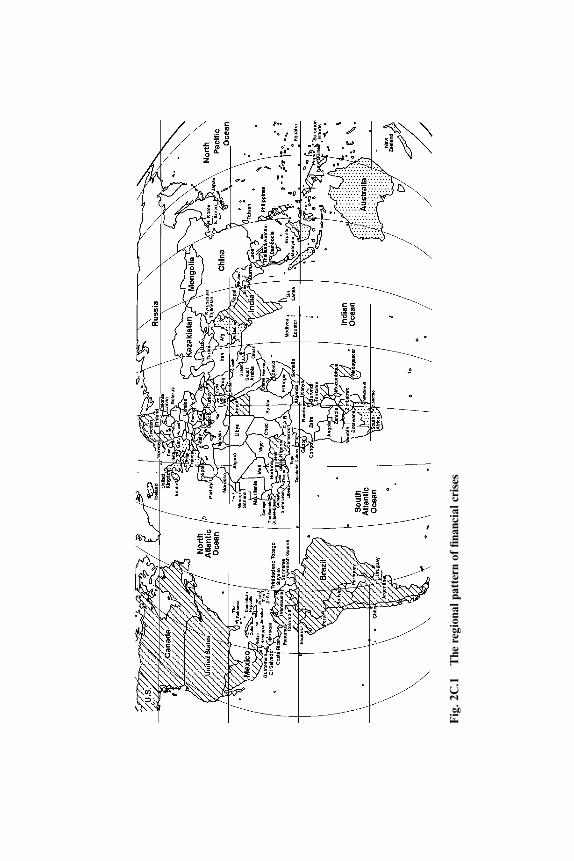
Fig
.2C
.1T
here
gion
alpa
tter
nof
finan
cial
cris
es

Tabl
e2C
.1R
egio
nalC
rise
san
dO
wne
rshi
pR
estr
icti
ons
Sout
hA
mer
ica
Cen
tral
Am
eric
aN
orth
Am
eric
aSc
andi
navi
aE
urop
e
Arg
enti
naE
cuad
orC
anad
aD
enm
ark
(1.7
5)It
aly
(2.2
5)B
oliv
iaE
lSal
vado
rU
nite
dSt
ates
Fin
land
(1.7
5)T
urke
yB
razi
lM
exic
oN
orw
ay(2
.00)
Bel
gium
a(2
.50)
Chi
leB
arba
dosa
(3.5
0)Sw
eden
Cyp
rusa
(2.7
5)C
olom
bia
Gua
tem
ala
(3.7
5)Ic
elan
da(2
.75)
Fra
ncea
(2.0
0)P
eru
(2.0
0)G
erm
anya
(1.2
5)U
rugu
ayG
reec
ea(2
.25)
Ven
ezue
laIr
elan
da(1
.25)
Guy
anaa
(1.7
5)L
uxem
bour
ga(1
.50)
Suri
nam
ea(1
.50)
Mal
taa
(2.5
0)N
ethe
rlan
dsa
(1.5
0)Po
rtug
ala
(2.0
0)Sw
itze
rlan
da(1
.50)
Uni
ted
Kin
gdom
a(1
.25)
Afr
ica
Mid
dle
Eas
tA
sia
Eas
tA
sia
Aus
tral
ia
Egy
ptIs
rael
a(1
.00)
Indi
aH
ong
Kon
g(2
.00)
Aus
tral
iaa
(2.0
0)G
hana
(2.2
5)Jo
rdan
a(2
.75)
SriL
anka
Indo
nesi
aN
ewZ
eala
nda
(1.2
5)M
adag
asca
rP
akis
tana
(2.5
0)Ja
pan
Fiji
a(2
.75)
Tan
zani
a(1
.75)
Rep
ublic
ofK
orea
(2.2
5)Z
imba
bwe
Mal
aysi
a(2
.25)
The
Gam
biaa
(3.0
0)T
heP
hilip
pine
s(2
.00)
Rw
anda
a(3
.25)
Tha
iland
(2.2
5)Se
yche
llesa
(2.0
0)Si
ngap
orea
(2.2
5)So
uth
Afr
icaa
(1.5
0)
Not
e:N
umbe
rsin
pare
nthe
ses
corr
espo
ndto
Res
tric
tva
riab
lein
tabl
e2.
1.aN
ofin
anci
alcr
isis
.
crises. On the other hand, this alone does not prove the authors’ theory,which stresses that alternative lines of business helped smooth banks’ cashflow. For example, it might have been the case that banks in these regionswere simply less exposed to real estate risk. Fortunately, the data exist tosort out these competing hypotheses.
In addition to sorting out these competing stories, it would be worth-while to integrate the formal panel data analysis with other studies onfinancial crises (e.g., Hutchinson and McDill 1999). For example, it mightbe worthwhile to interact the authors’ regulatory variables with other fac-tors that appear to cause crises (e.g., liberalization and macroshocks). Ata minimum, there should be regional dummies, as figure 2C.1 makes clear.
References
Borio, C. E. V., N. Kennedy, and S. D. Prowse. 1994. Exploring aggregate assetprice fluctuations across countries: Measurement, determinants, and monetarypolicy implications. BIS Economics Papers no. 40. Bank for International Settle-ments, April.
Caprio, G., Jr., and D. Klingebiel. 1999. Episodes of systemic and borderline fi-nancial crises. Washington, D.C.: World Bank. Mimeograph.
Higgens, M., and C. Osler. 1997. Asset market hangover and economic growth:The OECD during 1984–93. Oxford Review of Economic Policy 13 (3): 110–134.
Hutchinson, M., and K. McDill. 1999. Are all banking crises alike? The Japaneseexperience in international comparison. NBER Working Paper no. 7253. Cam-bridge, Mass.: National Bureau of Economic Research.
Discussion Summary
Charles Calomiris began the general discussion by raising an empiricalquestion about business-bank linkages. He noted that the regulatory envi-ronment is not fully captured by laws that prevent ownership of banks byfirms and vice versa. He argued that in some of the crisis countries, insiderlending is high because of concentration in the industrial sector that has aclaim on bank lending resources. He wondered if another variable mightnot be appropriate—an interaction between industrial concentration andinsider lending. He concluded by noting that ownership variables used inthe paper do not fully capture the regulatory environment.
Raghuram Rajan began by asking about the role of changes in regulationand ownership to complement the cross-sectional evidence presented inthe regressions. He asked whether the authors had examples of changesin regulation and ownership where the regulation is getting tighter. MarkFlannery asked about the role of foreign banks. He noted that in Singa-pore, for example, significant banking assets are held in foreign bank
94 James R. Barth, Gerard Caprio Jr., and Ross Levine

branches instead of domestic institutions. He suggested that the authorslook at restraints on real estate holdings as well. He also wondered aboutthe endogeneity of the regulatory structure.
Andrew Powell raised the issue of entrance by foreign banks. He won-dered if the entrance of foreign banks could be correlated with the restric-tions. Martin Feldstein also questioned the role of foreign banks—in par-ticular the scope and size of their activities.
Eric Rosengren raised the question of whether one regulatory structureshould fit all. He noted that restrictions might be optimal in a volatileeconomic environment, and that in such an environment banks might notbe able to act effectively as intermediaries. He observed that in a stableenvironment, a different and less-restrictive environment might be better.He noted that the regulatory environment might, in fact, be endogenousto the macroeconomic environment.
Following up on comments made by the discussant Mark Gertler, Ste-phen Cecchetti emphasized the role of deposit insurance. He noted thatthe authors could try to exploit any information that is available on boththe amount and changes of deposit insurance coverage.
Gerard Caprio began by responding to Rosengren and agreeing that onesize does not fit all. He noted that if the world is changing or internationalagencies are pushing in that direction, this could be a mistake. In responseto Rajan, Caprio observed that most countries have moved in the otherdirection, going from restrictive rules to looser rules. Fewer data are avail-able for those countries, however.
James Barth also replied, noting that evidence on foreign ownershipneeds to distinguish wholesale from retail operations. Foreign ownershipmay also be correlated with government ownership. He also noted that, inpart, the wealth variable captures family involvement. He also noted thatalong the same lines it would be helpful to look at government-directedlending.
Finally, Ross Levine noted that additional research on deposit insuranceis currently underway (in particular, at a large World Bank research proj-ect). He observed that the inclusion of the deposit insurance variable avail-able does not seem to affect the paper’s findings. He also observed that, asexpected, there is an increase in the probability of a crisis with more andexplicit deposit insurance. Finally, he noted that data for foreign bankownership and the regulation of foreign participation have also been in-cluded and that these variables do not seem to affect the ownership orsecurities results presented.
Banking Systems around the Globe 95
