banking market structure, financial dependence and …/media/publications/working-papers/... ·...
TRANSCRIPT

Banking Market Structure,Financial Dependence and Growth:
International Evidence from Industry Data
Nicola Cetorelli and Michele Gambera∗
ABSTRACT
This paper explores the empirical relevance of banking market structure on
growth. There is substantial evidence of a positive relationship between the level of
development of the banking sector of an economy and its long-run output growth.
Little is known, however, about the role played by the market structure of the
banking sector on the dynamics of capital accumulation. This paper provides
evidence that bank concentration promotes the growth of those industrial sectors
that are more in need of external finance by facilitating credit access to younger
firms. However, we also find evidence of a general depressing effect on growth
associated with a concentrated banking industry, which impacts all sectors and all
firms indiscriminately.∗Cetorelli is at the Federal Reserve Bank of Chicago and Gambera is at Morningstar, Inc. The
paper was written mainly while both authors were at the Federal Reserve Bank of Chicago. We thankthe editor, Rene Stulz, and two anonymous referees for inputs that substantially improved the overallquality of the paper. We have also benefited from the comments of seminar participants at the FederalReserve Bank of Chicago, Purdue University, Duke University, Loyola University, Ente Einaudi of Rome,Banco Central de Chile, the 1999 Midwest Macro and 1999 Society of Economic Dynamics conferences,the 1999 System Committee on Financial Structure and Regulation, the Wharton School-University ofFrankfurt conference on “Bank Competition: Good or Bad?”, the 2000 meetings of the Association ofFinancial Economists, and the NBER-Universities research conference on the Macroeconomic Effectsof Corporate Finance. In particular, we thank Judy Chevalier, Gary Gorton, Norman Loayza, LeonardNakamura, Marco Pagano, and Oren Sussman for their insightful remarks. We also thank Rob Bliss,Doug Evanoff, George Kaufman, Jim Kolari, Robert Marquez, Nara Milanich, Raghu Rajan, KlausSchmidt-Hebbel, Sherrill Shaffer, Shouyong Shi, and especially David Marshall and Luigi Zingalesfor fruitful conversations. The views expressed in this paper are those of the authors and do notnecessarily reflect official positions of the Federal Reserve Bank of Chicago, the Federal Reserve System,or Morningstar, Inc.

The importance of financial development for economic growth has been extensively ana-
lyzed in recent years. The amount of credit that the banking sector makes available for
productive uses is one of the most significant measures of financial development. Such
an indicator of size of the banking sector has been shown to have a significant, positive
effect on growth. In this paper we study whether for a given size, the market structure of
the banking sector has empirical relevance for economic growth. If it is agreed that the
size of the banking sector is important to capital accumulation, does it matter whether
the underlying industry structure is unconcentrated, thus approximating perfectly com-
petitive conditions, or whether instead market power is concentrated among few banking
institutions?
We find that concentration in the banking sector determines a general deadweight
loss which depresses growth. However, we also find evidence that bank concentration
promotes the growth of those industries that are more in need of external finance by
facilitating credit access to firms, especially younger ones.
There are theoretical reasons, as well as anecdotal evidence, suggesting that the mar-
ket structure of the banking sector has a non-trivial impact on the process of capital
accumulation. Conventional wisdom suggests that any departure from perfect competi-
tion in the credit market introduces inefficiencies that would harm firms’ access to credit,
thus hindering growth. Pagano (1993), for example, shows this effect in a simple endoge-
nous growth model. On the other hand, some recent contributions have pointed out that
banks with monopoly power have a greater incentive to establish lending relationships
with their client firms, thus facilitating their access to credit lines. Mayer (1988), Mayer
(1990) and Petersen and Rajan (1995) highlight this potential incompatibility between
bank competition and the establishment of close lending relationships.
There is some historical evidence on the positive role of concentrated credit markets
for economic development. Gerschenkron (1965), for example, mentions the importance
1

of institutions such as the Credit Mobilier for the industrialization of France, or that
of the Great Banks for Germany’s development. Cohen (1967) explains the similar role
played by Banca Commerciale Italiana and Credito Italiano for Italy, two banks whose
combined assets accounted for about 60 percent of the total market. Likewise, Sylla
(1969) argues that monopoly-enhancing regulation in the financial sector at the time of
the Civil War contributed to industrialization in the United States. By the same token,
Mayer (1990) mentions how Japan’s post-war development has been boosted by their
main-bank system.
While the arguments on both sides of this theoretical debate are compelling, no
broad-scope, cross-country empirical study has been conducted to test either stance. In
this paper we choose to take an agnostic position on the issue in order to explore the
consistency of each theory with the available data.1
This paper contributes to the recent line of empirical research on financial interme-
diation and growth. Following the original contributions by Goldsmith (1969), Gurley
and Shaw (1967), McKinnon (1973), and Shaw (1973), economists in recent years have
returned to this problem. Among the newer contributions, King and Levine (1993)
present the first broad, cross-country analysis of the importance of various indicators of
financial development. They find that countries initially endowed with a more sizeable
credit sector experienced faster growth in the following thirty years. Also using cross-
country regression analysis, Levine and Zervos (1998) make an important refinement by
showing the joint, independent relevance for growth of both banks and capital markets.
1Petersen and Rajan (1995) present some indirect empirical evidence analyzing credit availabilityfor a cross-section of U.S. small businesses located in markets characterized by different degrees of bankconcentration. They find that firms are less credit constrained in more concentrated banking markets,and younger firms are charged lower loan rates. Shaffer (1998), on the other hand, finds evidencefrom cross-sectional U.S. data that household income grows faster in markets with a higher numberof banks. In two very recent contributions, Bonaccorsi di Patti and Dell’Ariccia (2000), using cross-industry, cross-provinces Italian data, find that firms in more informationally opaque sectors grow morein more concentrated banking markets, while Black and Strahan (2000), with cross-state U.S. data finda negative relationship between banking concentration and the number of new firms.
2

Demirguc-Kunt and Maksimovic (1998) use instead firm-level data and show, in a cross-
country study, that where the legal system is more developed firms have greater access
to external funds, which in turn allows them to grow faster. Meanwhile, Rajan and
Zingales (1998) render an innovative contribution to the field by focusing on a cross-
industry, cross-country analysis. First, they construct a measure of the dependence on
external finance of a wide range of industrial sectors, in which differences among sectors
depend mainly on technology-specific factors.2 Second, they test whether industries that
are more dependent on external finance grow faster in countries that are more financially
developed. They find that this is indeed the case, thus providing evidence confirming
the overall importance of financial development on growth.
Our paper tests the importance of banking market structure for growth. We use
an extension of the Rajan and Zingales data set, with both cross-industry and cross-
country characteristics. Similar to the approach taken by King and Levine or Levine
and Zervos, we begin by evaluating the total, average effect of bank concentration on
industrial growth. That is, we test whether, by and large, industries grow more or less
if they are in countries with a more concentrated banking sector. Given the opposing
theoretical views described earlier, the answer to this question is not obvious. On the
one hand, if bank concentration simply results in lower credit availability, then growth
should be slower in countries with a more concentrated banking market. On the other
hand, if the market power associated with bank concentration generates positive effects
by enhancing the formation of lending relationships, then growth should be faster in
countries with a concentrated banking sector. We find that bank concentration has an
average depressive effect on industry growth.
However, our empirical study goes beyond the analysis of this average effect of bank
2For example, an industrial sector at high R&D intensity is expected to rely more on external sourcesof finance than other, more traditional, sectors (e.g. Computing or Chemical products as opposed toTobacco or Leather).
3
market structure. As remarked by Rajan and Zingales, industries differ among each
other in terms of their relative dependence on external sources of finance. Again, given
the opposing theoretical views one might expect that firms in sectors especially depen-
dent on external finance should suffer more, and therefore grow less than average, when
faced with a concentrated banking sector. On the other hand, if bank concentration en-
hances the formation of lending relationships, then one could expect that precisely those
firms in industries especially dependent on external finance should benefit disproportion-
ately more when faced with a concentrated banking sector. Exploiting industry-specific
information, we thus ask whether bank concentration has a heterogeneous impact across
industrial sectors.
The tests we carry out are actually even more precise: corporate finance theory
suggests that firms’ relative age may affect their dependence on external finance. For
example, Rajan and Zingales show that, in median terms, U.S. firms raise a positive
amount of external finance only up to the tenth year of their life. Therefore, one would
expect to find stronger evidence of either effect of bank concentration by focusing the
analysis specifically on the external financial needs of younger firms. Since the data
set provides separate information on the financial needs of firms less than ten years
old and on the more mature ones, we are able to do that. Therefore, our empirical
test is: all else equal, do industries whose younger firms are especially dependent on
external finance grow more or less rapidly in countries where the banking sector is
highly concentrated? The results show robust evidence that industries in which young
firms are more dependent on external finance will in fact grow relatively faster in those
countries where the banking sector is more concentrated.
The two results are not in contradiction. On the contrary, taken together they allow
us to confirm the basic predictions of both theories of banking market structure and
growth: a more concentrated banking industry imposes a deadweight loss in the credit
4

market as a whole, resulting in a reduction in the total quantity of loanable funds, exactly
as conventional wisdom would suggest. However, subjecting to more careful scrutiny
the complexity of the microeconomic relationship between firms’ financial needs and
sources of finance, we also find evidence that the effect is heterogeneous across industrial
sectors, and that in fact, specific categories of firms and industries seem to benefit from
a concentrated banking sector.
In the next section we describe in more detail the theory behind our empirical study.
Section II contains the illustration of the models used for hypothesis testing. In Section
III we describe the data set. The empirical results are presented in Section IV, while
Sections V and VI contain a large variety of robustness tests. In Section VII we present
various refinements of the analysis, while Section VIII elaborates on the several policy
implications associated with the results of our investigation and presents concluding
remarks.
I. Theoretical Background
The negative effect of banking market power is a direct application of standard re-
sults from market theory. Banks with monopoly power would determine, with respect
to perfect competition, an equilibrium with higher loan rates and a smaller quantity of
loanable funds. This would clearly reduce economic growth. Conversely, the positive
effect derives from the greater incentive for monopolistic banks to establish lending re-
lationships, which in turn promotes firms’ access to investment funds. According to the
model developed in Petersen and Rajan (1995), a bank will establish lending relation-
ships with young firms with no record of performance, thus bearing initial informational
costs, if it can share in their future stream of profits, should they turn out to be success-
ful. However, in highly competitive credit markets, a bank knows that it may not be able
to maintain a tie with the successful firms: once these firms are established they will seek
the lowest-cost supply of credit available in the market. Banks that did not invest initial
5
resources in funding the unknown firms would have a cost advantage in offering better
credit conditions than the bank attempting to recoup the original cost. In the presence
of this free-riding problem, competition in banking can induce credit rationing in the
sense that potentially high quality (but young and unknown) entrepreneurs may not get
funded (for similar analyses of externalities in information production and credit market
competition see also Lang and Nakamura (1989) and Cetorelli and Peretto (2000)).
This theoretical argument is implicitly based on an assumption of market incom-
pleteness. For example, a possible solution to the free-riding problem under competition
would be to allow banks to hold equity positions. Under this scenario, the bank would
participate in future profit sharing regardless of whether the firm maintains a lending
relationship. In fact, one can argue that monopoly power gives the bank an implicit
equity stake in the firm it is financing. Regulatory restrictions, however, may prevent a
bank from writing equity contracts. We explore how the degree of regulatory restrictions
affect the empirical relationship between banking market power and industrial growth
in Section VII.
II. Model Specifications
A. Basic Model
The first model explores the role of bank concentration for industrial growth at large,
that is, regardless of specific industry characteristics. We write our basic growth equation
as,
Growthj,k = Constant +Ψ1 · Industry dummiesj (1)
+ Ψ2 · Country controlsk
+ ψ3 · Industry share of manufacturing value addedj,k
+ ψ4 · Bank concentrationk
6

+ Errorj,k,
where a subscript j indicates that the variable refers to the j-th industry. Similarly,
a subscript k indicates a variable regarding the k-th country. Uppercase coefficients
indicate vectors.
The industry dummies correct for industry-specific effects. The country controls,
among which is the level of bank development, are regressors customarily used in cross-
country growth studies that we include to reduce the possibility of model mispecification
due to the omission of important variables. The entire vector of country control variables
is described in greater detail in the presentation of the empirical results.
The j industries in the data set all belong to manufacturing.3 Similar to the role
played by per-capita income in standard cross-country growth equations, the industry
j share of total value added in manufacturing in country k, calculated at the beginning
of the period, captures an industry-specific convergence effect: sectors that have already
grown substantially in the past are unlikely to continue to grow at a high rate in the
future. Therefore, ψ3 is expected to have a negative sign.
Finally, the level of bank concentration isolates the total effect of bank market struc-
ture on industrial growth. As we mentioned above, theory suggests that there are two
opposing effects on growth that we can associate with bank concentration. Therefore,
the sign of ψ4 is a priori ambiguous.
B. Extended Model
The approach outlined above enables us to identify an economy-wide effect of bank
concentration, common to all industrial sectors. In other words, this would be the
effect we would find if we used growth rate averages, aggregated across sectors in each
3As Rajan and Zingales note, this is done “. . .in order to reduce the dependence on country-specificfactors, like natural resources. . .” (Rajan and Zingales (1998, p. 567]).
7
country. The use of industry-specific information yields instead a deeper exploration and
understanding of the role played by banking market structure for growth. This model
specification allows us to decompose the total effect of bank concentration in first, an
economy-wide effect and second, a sector-specific effect.
The extended model specification is as follows:
Growthj,k = Constant + Φ1 · Industry dummiesj (2)
+ Φ2 · Country controlsk
+ φ3 · Industry share of manufacturing value addedj,k
+ φ4 · Bank concentrationk
+ φ5 · (External dependencej · Bank concentrationk)
+ φ6 · (External dependencej · Bank developmentk)
+ Errorj,k.
In this extended specification of the model we include the interaction between the level
of external financial dependence of industry j and bank concentration in country k. We
test whether sectors that are more in need of external finance grow disproportionately
slower or faster if they are in a country with high bank concentration. Following the same
arguments as above, the sign of φ5 is a priori ambiguous. As an additional control, we
also include the interaction between external financial dependence and the level of bank
development. The coefficient φ6 of this interaction term, extensively analyzed in Rajan
and Zingales (1998), is expected to be positive. As anticipated in the introduction, we
focus on the external financial needs of younger firms (those less than ten years old).4
4Results regarding more mature firms are, however, presented in the section devoted to robustnesstests.
8
C. Focusing on the Interaction
Finally, in a third model specification we focus our attention on the analysis of the
differential effect of bank concentration across industries, captured by the interaction
term. Since we find that bank concentration actually has beneficial effects on industries
more in need of external finance, a result not obvious ex-ante, we want to be convinced
that this effect is indeed robust. We thus estimate a third model specification, where
we drop the level of bank concentration by itself, keeping only the interaction terms.
The reason for choosing to focus on this specification to run robustness tests is that it is
econometrically more sound: since we are not identifying first-order effects, we can drop
the vector of country controls, and instead we can include country dummies (in addition
to the industry ones), thus eliminating possible biases caused by omitted country-specific
regressors. The model specification is therefore as follows:
Growthj,k = Constant + Γ1 · Industry dummiesj (3)
+ Γ2 · Country dummiesk
+ γ3 · Industry share of manufacturing value addedj,k
+ γ4 · (External dependencej · Bank developmentk)
+ γ5 · (External dependencej · Bank concentrationk)
+ Errorj,k,
where subscripts and variables are the same as described previously.
III. Data
The empirical analysis relies on our augmented version of the Rajan and Zingales data
set.5 The sample includes 41 countries and for each of them 36 industries, yielding a re-
markably large sample size. The 36 industries, as mentioned earlier, are all selected from5The data set was kindly made available by the authors.
9

the manufacturing sector. The relevant growth variable is the average (compounded)
rate of growth of real value added for each industrial sector in each country between
1980 and 1990.
Rajan and Zingales calculate the measure of external financial dependence for each
industry for U.S. sectors, arguing that the “dependence of U.S. firms on external finance
[is] a good proxy for the demand for external funds in other countries” (Rajan and
Zingales 1998, pp. 563–65)).
Table I about here
We augment the data set to include measures of concentration of the banking sec-
tor. Specifically, for each country we calculate the sum of market shares (measured in
total assets) of the three and of the five largest banks. The data source is the IBCA-
BankScope 1997 CD, which contains detailed balance sheet information on individual
banking institutions for the period 1989 to 1996. For each country we then compute the
concentration ratios for every year in the sample for which there is exhaustive informa-
tion (the computation for some countries in some years is made unreliable since only a
small fraction of bank balance sheets were reported.) Averages over time constitute our
measures of bank concentration. Table I contains the list of countries in the data set
and the corresponding measures of bank concentration. As we proceed in the descrip-
tion of the empirical results, we will introduce and describe additional variables used for
robustness tests (all variables are summarized in Table II.)
Table II about here
IV. Empirical Results
We were unable to find data to construct the concentration measures going back
earlier than 1989. Since the growth variable refers to the decade 1980 to 1990, we
10

are exposed to the potential problems that an ex-post variable could generate, such as
endogeneity. However, we are confident that in this case the ex-post determination does
not constitute an important issue. First, the market structure of the banking sector, at
the country level, does not vary substantially over such a short time period. We checked
this by analyzing for each country the pattern of variability of the concentration ratios
calculated for the 1989 to 1996 period. We found that indeed such ratios are remarkably
stable over time. For example, we calculated the range for the three-bank concentration
ratio in each country. The cross-country median range of variation in the 1989 to 1996
period was only three percentage points. Even more telling, in about seventy percent of
the countries (27 out of 41) the three-bank ratio had a variation over time of less than
five percentage points.6 To our knowledge, there are no reasons to believe that such
stability over the 1989 to 1996 period should not also be found in the contiguous 1980
to 1990 period.
In addition, we also constructed the series of the rank of the three-bank and the five-
bank concentration ratios. In other words, we allow for the possibility that the averages
calculated over the 1989 to 1996 period are possibly different from the ones we would
have calculated for the 1980 to 1990 period, but we require that countries keep their
relative position in the ranking. This is a less stringent condition than requiring that
concentration ratios remain unchanged. Finally, we calculate a dummy variable (high-
low concentration) as an additional alternative to our three-bank and five-bank ratios.
Following the above reasoning, even though the actual values of concentration in the
earlier period may have been different from our indices, and perhaps some rankings may
have changed as well, as long as the range of variation was not so large to make a country
shift from the high to the low concentration cluster (or vice versa), a concentration
measure constructed on 1989 to 1996 averages is very likely to be similar to the one we
6As a term of comparison, the cross-country average three-bank ratio in our sample is approximatelyfifty-five percent.
11

would have constructed for the 1980 to 1990 period, had the data been available. In
the empirical analysis we test the robustness of the results to the use of this alternative
measures of market structure.
Table III about here
Still on the issue of endogeneity, one could also argue that bank market structure
simply adjusts to a level which is optimal for a country’s industrial structure. However,
this consideration overlooks the fact that there are political and institutional factors that
distort the natural development of financial systems. Interest groups, or governments,
or both, will shape the legal, institutional and economic environment for private gains
that may not necessarily coincide with the proper development, in terms of both size and
structure, of the financial industry.7 Moreover, in general, the market structure of the
banking sector is a favorite policy variable for reasons not necessarily related to industry
growth.8 Hence, the objective function of the regulator is such that the “optimal” level
of bank concentration may be unrelated to that requested by the industry structure of
the economy.
Beyond this line of discussion, we resolve the concerns regarding the potential en-
dogeneity of the market structure of the banking sector using instrumental variables
(IV) estimation. We have selected as instruments two variables determining a country’s
institutional characteristics, and two variables proxying for market size. In addition to
institutional factors, it is in fact likely that for reasons of minimum scale economies,
a larger market is able to accommodate a higher number of banks. The institutional
variables are an indicator of the legal origin of a country and one concerning the extent
to which laws are enforced in a country (see La Porta, Lopez-de-Silanes, Shleifer and
7Rajan and Zingales (1999) extensively elaborate on this argument.8For example, the regulator often controls competition in the banking industry to prevent excessive
surplus extraction or for reasons related to the safety and soundness of the industry.
12

Vishny (1997)).9 The proxies for market size are country total population and total
Gross Domestic Product (GDP), measured in U.S. dollars.10
We perform a Durbin-Wu-Hausman (DWH) test of overidentifying restrictions for
each of the regressions in the paper. The test (see Davidson and MacKinnon (1993,
pp. 237–42)) verifies the null hypothesis that the introduction of IVs has no effect on the
estimates of the regression’s coefficients. There are two terms including the measure of
concentration in our equations, namely, the level of concentration and the interaction of
external dependence and concentration. When both terms are present in the regressions,
instruments must be used for both variables. Therefore, for each of the regressions we
perform a DWH F-test, which is reported as the bottom line in each table. If the P-
value of the F-test is below ten percent (i.e., the null hypothesis is rejected and the IVs
are jointly accepted), then IV estimates are reported. Otherwise, OLS estimates are
reported. We choose the ten percent significance level for prudence, since we want to
correct for possible endogeneity when there is the slightest risk of its occurrence.
Anticipating our results, in the vast majority of the regressions we find that the
test fails to reject the null hypothesis and that, even when they are used, IVs do not
particularly alter the results of the OLS estimations. Therefore, bank concentration is
robust to the issue of endogeneity, both in level and in interaction.
A. Basic Model
In table IV we report the results of regressions based on the specification in equation
(1), in which we add one country control variable at a time.
Table IV about here9For another example of instrumental variable approach to tackle the issue of endogeneity of financial
variables in growth regressions, see Levine, Loayza and Beck (2000). A time-series analysis of causalitybetween financial variables and growth is in Demetriades and Hussein (1996).
10As shown in Table III, the negative correlation between bank concentration and the measures ofmarket size are indeed quite high, especially that with total GDP. In fact, we also tested whether byusing bank concentration we were not just capturing a market size effect. The results, not reported,show that bank concentration is robust to the inclusion of market size variables.
13
The dependent variable is the average annual growth in value added for each sector
in each country, while the three-bank ratio is the measure of bank concentration. Unless
otherwise noted, the dependent variable and the measure of bank concentration will
remain the same in all of the following regressions. The country control variables are
the level of bank development, the logarithm of per capita income in 1980, stock market
capitalization over GDP in 1980, an accounting standards indicator, and a measure of
the level of human capital. The measure of bank development is the commonly used
ratio between domestic credit to the private sector and GDP, and is expected to have
a positive effect. Per-capita GDP captures the convergence effect of the economy as a
whole to its long-run steady state, and is therefore expected to have a negative sign.
Stock market capitalization controls for the relative importance of alternative sources
of external finance and is expected to have a positive sign. Accounting standards is an
index reflecting the quality of disclosure of firms’ annual reports (see Rajan and Zingales
(1998, p. 571)). The poorer such standards, the higher the information cost that a bank
has to sustain to determine the quality of an entrepreneur. The expected sign for this
term is also positive. The level of human capital, another typical regressor in growth
equations, is measured as average number of school years in population over age 25 (as
in Barro and Lee (1993)), and is expected to have a positive effect as well.
All control variables have the sign that one would expect to find in any cross-country
growth equation. Also as expected, the share of total value added in manufacturing
is negative and significant. The main result to highlight is that the level of bank con-
centration has a negative and significant coefficient. The effect of bank concentration
is robust to the inclusion of the various control variables. This result lends support to
the prior that a concentrated banking industry imposes a deadweight loss in the credit
market and on the economy as a whole.
In order to gauge the economic relevance of the bank concentration variable, we
14

perform a standard comparative dynamics exercise. Specifically, we calculate the to-
tal impact on growth if we were going from a country at the 25th percentile of the
distribution of bank concentration to a country at the 75th percentile. The effect on
growth based on the estimated coefficients in the regression in column (b) of Table IV
is a negative 1.5 percentage points.11 Note that the average growth across sectors is
3.6 percent (see Table II). We should not take these number at face value, since this
model specification is exposed to the aforementioned omitted variable bias, due to the
non-inclusion of potentially important country variables. However, the overall evidence
suggests that the total effect is, on average, negative and significant, both statistically
and economically.
B. Extended Model: Economy-wide and Sector-specific Effects
In Table V we report the results of regressions based on the specification in equation
(2), in which, again, we add one country control variable at a time, and where we include
the interaction between external financial dependence and bank concentration, together
with that between external financial dependence and bank development, acting as a
control. External financial dependence refers to that of the younger firms in the data
set.
Table V about here
The level of bank concentration by itself maintains a negative and significant coeffi-
cient in the regressions (a) through (d), while we highlight that the interaction coefficient
11Column (b) regression has the highest number of controls that still allows us to use the largest samplesize, with 1150 observations. Column (c) and (d) regressions have more controls but the inclusion ofaccounting standards and human capital brings the sample size down to 950 observations, with a lossof nine of the original countries in the data set. The countries are Bangladesh, Costa Rica, Egypt,Jordan, Kenya, Morocco, Pakistan, Sri Lanka, and Zimbabwe. We choose to present our basic resultsbased on the larger sample, in order to minimize informational losses (nine countries out of forty-onerepresent a rather significant twenty-two percent). Moreover, since the nine countries are all developingcountries, we want to avoid sample bias. At any rate, based on the estimates of column (d), the effectof increasing bank concentration would be a negative 2.4 percentage points.
15

is instead positive and significant. The two effects of bank concentration are robust to
the inclusion of the various control variables, all showing the expected sign.12 The
interaction between external financial dependence and bank development becomes in-
significant in the last three columns where, as we mentioned in footnote 11, the inclusion
of accounting standards and human capital makes nine countries drop from the sample.
The combined results are consistent with the theoretical priors. They suggest that
bank concentration has a negative effect on growth that, on average, affects all sectors
indiscriminately. However, when we introduce the dimension of the intensity of external
financial dependence, we identify an industry-specific, positive effect of bank concentra-
tion. This effect is consistent with the theoretical prior that bank market power, by
facilitating the formation of lending relationships, enhances the growth potentials for
those sectors that are more in need of establishing such relationships. The result indi-
cates that the impact of bank concentration on growth is not uniform across industries.
Consequently, bank concentration has an important redistribution effect. We elaborate
further on this point and the related policy implications in the following sections.
It is also worthwhile remarking that our results are shielded by a potentially im-
portant objection. External financial dependence in the data set is measured on U.S.
sectors. However, U.S. sectors with higher external financial dependence are those that
grew more over time. We also know that countries at a comparable level of economic
development are similar in terms of their industry structure. Therefore, it is likely that
sectors with high external financial dependence grew more not just in the U.S. but also
in those countries similar to the U.S., i.e., the richest countries. Suppose now that,
similar to bank development, bank concentration had a positive, high correlation with
income per capita. In that case, the finding of a positive and significant bank concentra-
12We also ran a regression where we included external financial dependence by itself as a regressor.In order to do that, however, we had to exclude the industry dummy variables. Such a regressor wasnot significant while all other coefficients were unchanged.
16
tion interaction, especially when the bank development interaction is insignificant, could
simply capture this positive association between external financial dependence and the
level of economic development. However, we do not think this is a matter of concern,
since there is actually no correlation in the data between bank concentration and income
per capita (see Table III).
We also add a squared term of bank concentration to check for non-linearity. As
the results in column (e) of Table V show, bank concentration has in fact a slight
inverted-U effect. The interpretation for this result is actually provided by what we
learn from the sector-specific analysis: intuitively, at low levels of concentration only the
sectors that have the lowest need to establish a lending relationship receive the maximum
benefit, in that the deadweight loss from rent extraction is minimal but the potential
informational gains from establishing lending relationships are also minimal. Conversely,
at high levels of concentration only the sectors that are highly dependent on banks will
benefit. The non-linearity seems to suggest that at intermediate values of concentration
the overall growth potential of the entire economy is the highest, since sectors in an
intermediate range of the distribution of external finance benefit substantially, and those
at the extremes of the distribution of external finance are not highly penalized.
We evaluate the magnitude of the total effect of bank concentration on economic
growth, decomposed in the first-order, economy-wide effect and the second-order, sector-
specific ones. More precisely, we calculate the effect on growth of sectors with different
levels of external financial dependence if we went from a level at the 25th percentile to
one at the 75th percentile of the distribution of bank concentration. As we did above,
we perform this calculation based on the estimation results of the regression in column
(b) of Table V. The economy-wide effect is a negative 2.6 percent. For the sector at the
25th percentile of the distribution of external financial dependence (Wood products),
17

the sector-specific effect is a positive 0.8 percent.13 The net effect for such sector is thus
around minus 1.7 percentage points.14 If we perform this calculation for other sectors,
the second order effect becomes stronger as the intensity of external financial dependence
increases.15 Indeed, the net effect actually turns positive for those sectors at the upper
tail of the distribution.16
V. Statistical Robustness Tests
We now turn to present a large battery of robustness tests, for which we focus on
the specification in equation (3). Nevertheless, the reader must rest assured that all the
pertinent robustness tests have also been conducted on the first-order effect, also shown
to be very robust. When relevant, we do mention or report the result of tests carried
out on the equation (2) model specification.
Table VI about here
Table VI reports in column (a) the estimation results for the benchmark equation
(3). The share of total value added in manufacturing remains negative and significant,
and the interaction between external dependence and bank development positive and
significant. The coefficient of the interaction between external financial dependence and
bank concentration is still positive and significant at the five percent level.
Based on the results of this model specification, the sector at the 25th percentile of
the external financial dependence distribution would receive a positive effect translating
13The distribution of external financial dependence for young firms has virtually identical mean andmedian. The median is equal to 0.66 and the mean equal to 0.67.
14Based on the estimates of column (d) regression, the first-order effect would be a negative 4.5 percentand the second-order effect a positive one percent, with a net effect of around minus 3.5 percentagepoints. Remember, however, the remarks in Footnote 11 about sample size.
15For example, for the sector at the 75th percentile of the distribution (Ship), the second order effect,calculated on column (b) coefficients, is estimated to be a positive 1.9 percent, bringing the net effectto minus 0.7 percentage points.
16For example, based on column (b) coefficients, the net effect of bank concentration would be positivefor sectors such as Glass, Professional goods and Drugs.
18

in 0.9 percent of higher growth in going from a country at the 25th percentile of the
distribution of bank concentration to a country at the 75th percentile. A sector at the
75th percentile would receive instead a positive effect of two percent higher growth.
These results confirm the robustness of those obtained with the model specification of
equation (2). Recall, however, that all sectors are also subject to the negative economy-
wide effect, which is not identifiable with this model specification. The information on
the different sector-specific effect allows us to gauge the impact of bank concentration
on the size distribution across industrial sectors. Specifically, we learn that the growth
differential between an industrial sector at the 75th percentile and one at the 25th
percentile of the distribution of external financial dependence for younger firms, if we
were going from a country at the 25th percentile of the distribution of bank concentration
to a country at the 75th percentile is estimated to be about 2 − 0.9 = 1.1 percentage
points on an annual basis. Again recalling that the average growth over all sectors is
3.6 percent, this redistribution effect of bank concentration appears to be economically
significant.
A. Do the Results Depend on the Choice of the Concentration Measure?
We first check whether the three-bank ratio calculated over the 1989 to 1996 period
is an adequate measure of concentration. In column (b) of Table VI, the concentration
measure is the rank of the three-bank ratio, while in column (c) is the high-low con-
centration dummy for the three-bank ratio.17 In column (d) we use the five-bank ratio,
to check that the results would not depend on the arbitrary choice of computing the
concentration measure as the sum of the market shares of the top three banks only. The
strong similarity of the results obtained with these alternative measures suggests that
17For the calculation of the concentration dummy, countries were divided between those with a valueof the ratio below and those above a value equal to 0.70, which is what would be considered highconcentration, for example, in the U.S. banking industry (see, e.g., Calem and Carlino (1991)). Analternative specification, which gave unchanged results and is not reported in the table, divided thecountries around the median of the distribution (0.57).
19

the three-bank ratio computed for the 1989 to 1996 period is a reliable measure for our
analysis.
In what follows we therefore continue to present regression results using the three-
bank concentration ratio calculated over the 1989 to 1996 period as our benchmark
measure of banking market structure.
B. Omitted Variables
We test whether the term of interaction of bank concentration is significant when
we omit the bank development interaction from the basic model specification. The
results, reported in column (a) of Table VII, show that the concentration variable remains
positive and significant at the ten percent level.18
Table VII about here
Subsequently, we check whether the bank concentration interaction variable is still
significant after controlling for the relative importance of alternative sources of external
finance. We therefore start by adding the interaction between external dependence and
the size of stock market capitalization over GDP. The coefficient is expected to have a
positive sign. The results in Table VII, column (b), show that this coefficient is indeed
positive, although not significant. The bank concentration term is still positive and
significant at the five percent level, with an estimated coefficient close in magnitude to
the one in the baseline regression (column (b), Table VI).
In column (c) of Table VII we report the results of a regression where we add the in-
teraction between external dependence and the logarithm of per-capita income in 1980.
There is a concern that the interaction term of bank development in our basic specifica-
tion may be proxying for the general level of economic development of a country. The18We note a decrease in the estimated coefficient, from 0.063 to 0.048. This is likely to be the result
of an omitted variable bias. Performing a bias analysis (see, e.g., Berndt (1991, p. 322) it is indeedconfirmed that the omission of the bank development variable determines a downward bias on thecoefficient of bank concentration.
20

simple correlation between bank development and per-capita income, 0.56 (reported in
Table III), may justify this concern. The coefficient of the bank concentration interac-
tion remains positive and is significant at the ten percent level. Confirming the existence
of some collinearity, the bank development and the income interaction terms have the
expected sign but neither is significant.19
Finally, we add to the basic regression the interaction between external financial
dependence and the measure of accounting standards. The expected sign for this term
of interaction is positive. Column (d) in Table VII presents the results of this augmented
specification of the model. The coefficient of bank concentration is still positive and
significant, even though the size of the estimated coefficient decreases from 0.063 to
0.035. The two coefficients, however, are not immediately comparable, again due to
the fact that by including the accounting standard variable the number of observations
decreases from 1150 to 984.20
C. Outliers
A general concern is that the results based on these growth regressions could be
driven by the exceptional performance of some countries (for example, Southeast Asian
countries) or certain industrial sectors in particular countries, which could not be fully
captured by the inclusions of the country and sector dummies. This should not affect our
analysis, since the sample in the Rajan and Zingales data set does not include countries
such as Taiwan or Hong Kong. In addition, the series of growth in value added censors
from above sectors that, on average, grew more than 100 percent annually in the 1980
to 1990 period. To be sure, we run a regression dropping the censored observations
19If we run an equation (3) regression where we replace the bank development interaction term withthe income level interaction term, the bank concentration interaction maintains its sign, significanceand magnitude as well.
20If we run the equation (3) regression on the restricted sample excluding records for these countries,the coefficient of the bank concentration variable is equal to 0.042, significant at the one percent level.As pointed out earlier, we choose to present our basic results based on the larger sample, in order tominimize informational losses and sample bias.
21

altogether.21 The results, reported in column (e) of Table VII, show that the bank
concentration interaction becomes significant at the one percent level, although with a
smaller coefficient. The coefficient of the bank development interaction, significant now
at the ten percent level only, decreases as well.
In addition, we evaluate whether the results are sensitive to high and low values in
the distribution of young firms’ external financial dependence. We use a dummy variable
to separate sectors above the median from those below the median of the distribution
of external financial dependence and redefine the bank concentration interaction term
accordingly. The results of this regression are reported in column (f) of Table VII.
They show that the interaction term is positive and highly significant while the dummy
variable term is not significantly different from zero. This is interpreted as confirming
that the effect of bank concentration is stable across the entire sample.
VI. Economic Robustness Tests
A. Tests on Mature Firms
We also investigate the role of bank concentration for the financial needs of the more
mature firms in the data set, that is, establishments more than ten years old. As we
mentioned earlier, the external financial needs of this category of firms are much lower
than for younger ones. Moreover, the problem of information acquisition on established
firms is less severe than for younger firms. Therefore, focusing specifically on mature
firms, we might expect a less important effect of bank concentration on industrial growth.
In the first column of Table VIII we report the results of the third model specification,
this time calculating the terms of interaction using the external financial dependence of
mature firms.
Table VIII about here
21We thank Rob Bliss for suggesting this and other outlier tests.
22
The bank concentration term is still positive and significant. However, the economic
effect on growth is half the size of that determined on young firms: the growth differential
between an industrial sector at the 75th percentile and one at the 25th percentile of the
distribution of external financial dependence for mature firms, if we were going from a
country at the 25th percentile of the distribution of bank concentration, to a country at
the 75th percentile, is estimated to be about 0.5 percentage points on an annual basis.
This is much lower (the difference is statistically significant) than the growth differential
for young firms, which, as reported above, is instead 1.1 percentage points.
Among the mature firms, those that have already grown substantially and are well
established are likely to receive minor benefits from a banking relationship, and are
therefore more likely to be exposed to the rent extraction activity of a concentrated
banking sector. Therefore, we perform an additional test on mature firms, splitting
the sample between large and small sectors, i.e., those sectors in each country that had
a share of value added in manufacturing above the country median, and those below.
Columns (b) and (c) of Table VIII report the results for the two subsets. The bank
concentration interaction term continues to be positive and significant for the sectors
below the median. For sectors above the median the coefficient is positive but no longer
significant.
In summary, bank concentration appears to have a positive effect on growth of sectors
that are more in need of external finance. Consistent with theory, the economic impact is
more pronounced for younger firms than for more mature ones. The dominating positive
effect of bank concentration seems to disappear only when we focus on a particular subset
of the more mature firms.
B. Market Contestability
Concentration ratios are widely used in empirical analysis to proxy for competitive
23
conduct.22 However, the potential weakness of this measure is that if markets are con-
testable, market structure does not necessarily affect conduct. In a cross-country study,
market contestability can be gauged in terms of the ability of foreign banks to access
domestic markets. We can test whether the actual presence of foreign banks affects the
relationship between bank concentration and industry growth using data on the share
of total domestic assets owned by foreign banks (taken from Demirguc-Kunt and Levine
(1999)), and on the fraction of foreign banks over the total number of banks (taken from
Claessens, Demirguc-Kunt and Huizinga (1998)). Admittedly, such measures may not
capture the effect on the conduct of domestic banks of a potential threat of entry, which
is what contestability is more about. On the other hand “the threat of foreign bank
entry may not be credible in the absence of actual entry” (Claessens, Demirguc-Kunt
and Huizinga (1998, p. 7)).
Data show a limited presence of foreign banks in most of the countries in the sample.
For instance, the median share of assets owned by foreign banks is six percent (the 75th
percentile is 14 percent). At the same time, in terms of the number of foreign banks
over the total, perhaps a better indicator of the potentials for entry, the median fraction
is a more substantial 24 percent. The relatively low weight of foreign banks in most
countries may be due to the existence of administrative barriers to entry that were or
still are in place in developing countries, where hostility toward foreign institutions can
be traced back to the experience of colonialism (Vittas (1992)). Such restrictions are
found in developed countries as well. For example, prior to 1993, countries that are now
members of the European Union (EU) significantly restricted the entry of foreign banks.
Such restrictions are still in place with respect to banks from non-EU countries.23
22Recent developments in empirical industrial organization have proposed alternative measures ofmarket power, which could be used instead of the traditional concentration ratios (see, e.g., Bresnahan(1991). Such measures are identified through econometric estimation of industry’s demand and supplyconditions. The major drawback of such an alternative approach is the need for extensive data, whichis only available for the most developed countries.
23One can also argue that besides regulatory restrictions, informational barriers play an important
24

We generate a dummy variable equal to one for countries with both a three-bank ratio
and a foreign share of bank assets above their medians. These are countries where, given
the relatively high presence of foreign banks, a high concentration ratio may overestimate
the actual degree of monopoly power. We run an equation (3) regression where we add
the product of the dummy with the concentration interaction term. The results, in
column (a) of Table IX, show that the concentration interaction alone is still positive
and significant, while the dummy term is not.
Table IX about here
This suggests that even if the concentration measure may be biased upward in some
countries, such bias is not driving the main findings.24
C. Under-reporting Bias
We use data of foreign banking penetration to take into account another potential
source of bias in the concentration variable. As described in Section III, the concen-
tration ratios are calculated using the IBCA data set. Such a data set collects balance
sheet items for all banks that report such information. While the percentage of banks
reporting is very high, it is still possible to introduce a bias due to under-reporting. In
particular, Beck, Demirguc-Kunt and Levine (1999) observe that “. . .[using these data]
the concentration measure might be biased upwards for developing countries, if foreign
and large banks are more likely to report than domestic and smaller banks.” To ad-
role as well in preventing a banking market from being contestable. The existence of informationalbarriers is discussed, and evidence is provided, e.g., in Berger, Bonime, Covitz and Hancock (1999).Some casual evidence is also provided by the observation that despite the removal of the aforementionedregulatory barriers to entry among EU countries, the actual presence of banks from other EU countriesis still very limited, averaging about five percent of total bank assets across country (European CentralBank (1999)).
24As an alternative test, we dropped the records for those countries altogether and ran a regressionon the restricted sample. We also repeated these tests with different cutoffs in the bank concentrationand foreign share distributions, and we also used the proportion of foreign banks in place of foreignshare. Similar tests of robustness were also performed on the equation (2) model specification. Theresults, available upon request, are in all instances qualitatively identical, indicating an effect of bankconcentration on industrial growth robust to the issue of market contestability.
25
dress this problem, we generate a dummy variable equal to one for countries below the
median in per-capita GDP and above the median in the foreign bank share, in order to
isolate those countries where the concentration measure is more likely to be biased due
to under-reporting. We then run regressions adding the product of the dummy with the
bank concentration interaction term. While the bank concentration term alone remains
significant, the dummy term is not significant, suggesting that the under-reporting bias
is not a problem (see column (b), Table 9).25
D. Using Measures of Bank Efficiency
We use interest margins and overhead costs as alternative measures of competition.
Using cross-country data from Demirguc-Kunt and Huizinga (1998), we find that the
concentration measure is not correlated with either variable (see Table III). We run
regressions using either one in place of bank concentration, but we do not find significant
results. An explanation is that interest margins and overhead costs are measures of
bank efficiency that, in a cross-country analysis, are likely to be affected by country-
specific factors. Consistent with this argument, Demirguc-Kunt and Huizinga (1998),
in a cross-country analysis find that, in fact, factors such as macroeconomic conditions,
bank taxation, deposit insurance, legal structure, and other institutional indicators are
very important in the determination of interest margins and overhead costs. They also
confirm that bank concentration, at the cross-country level, is only mildly related to
interest margins and to overhead costs. Hence, trying to trace information on bank
competitive conduct via interest margins or overhead costs is in this case likely to yield
spurious results. For instance, relatively higher margins in one country do not necessarily
imply relatively higher banking market power.
25The same results are obtained using the proportion of foreign banks in place of foreign share.
26
VII. Refinements and Extensions
A. State-owned Banks
Another potential criticism of our use of the concentration ratios is that in some
countries a large proportion of banks is owned by the government. In such cases, where
the same subject owns many banks, those banks might act as a cartel. As a consequence,
the concentration measure in some countries could underestimate the actual market
power. At the same time, it is also plausible to argue that public banks may not
necessarily be profit maximizers and may not have an incentive to establish lending
relationships with potentially profitable enterprises.
Beck, Demirguc-Kunt and Levine (1999) and Demirguc-Kunt and Levine (1999)
collect cross-country information on state ownership in the banking sector. We generate
a dummy variable equal to one if the share of state-owned banks is above a certain
threshold to single out countries with a significant government presence in the banking
sector.26 Then we test for a non-linear response to the concentration interaction term in
the case where state ownership is particularly high. The coefficient of the product of the
dummy and the concentration interaction term is negative, significant and almost the
same in absolute value as the concentration interaction term alone (column (c) in Table
IX). Hence, the positive effect of bank concentration appears to be offset in countries
with a dominant government presence in the banking industry.
To explore further, we also run regressions where we add the interaction between
external financial dependence and state ownership. The concentration interaction term
is still significant, with a slightly decreased coefficient. The state ownership interac-
tion is negative and significant (column (d) in Table IX). Interestingly enough, in the
extended model specification we notice that even the level of bank development turns
26We set the threshold at 50 percent, 60 percent and 70 percent, obtaining virtually identical results.The regression described in the text is that with the threshold at 60 percent.
27

insignificant when we control for the degree of state ownership (column (e) in Table IX),
thus suggesting a general negative impact associated with the presence of the state in
the credit market.
B. Bank Powers
The effect of bank monopoly power may differ depending on the regulatory environ-
ment in which banks operate in a country. As mentioned in Section I, if a bank were
allowed to finance firms through equity, then even under perfect competition it would
have an incentive to establish close relationships. Hence, in a world where banks are
less constrained in their financing choices, we may expect the positive effect of banking
concentration on growth to be less important.
Barth, Caprio and Levine (2000) compile information across countries on the re-
strictions for banks in terms of their ability to write contracts. They summarize this
information in a quantitative indicator ranging from one (broadest powers) to four (nar-
rowest powers). We add to the model an interaction between this measure of bank
powers and financial dependence. The bank concentration interaction remains highly
significant, while the bank development interaction loses significance.
Table X about here
The bank powers interaction is not significant (column (a) of Table X).27 We also
add both bank powers alone and the interaction to the equation (2) model. Both bank
concentration alone and its interaction are highly significant while the bank powers
variables are not significant (column (b) of Table X).
As an additional test on the equation (2) model we also include an interaction of
the level of bank concentration with bank powers, to see if the first-order negative effect
27We also generate a dummy variable equal to one if bank powers are very broad (below the median).We then add the product of the dummy and the concentration-dependence interaction to the regression.This new term is also not significant.
28

of concentration on industrial growth differs across countries with different regulatory
restrictions. One could argue, for example, that if banks were allowed to operate in
multiple lines of business, they would face increasing cross-markets competitive pressure
that could reduce their ability to extract rent. The result (column (c), Table X) shows,
however, that this interaction is not significant as well. In sum, there is not evidence from
this data set that bank regulatory restrictions have a direct impact on the relationship
between banking market structure and growth.
C. Does Bank Concentration Lead to Industry Concentration?
Another relevant issue is whether bank concentration causes financially dependent
industries to become concentrated, thus enabling firms to earn monopoly profits. Banks
may act as a barrier to entry by privileging incumbents, with whom they already estab-
lished relationships, over new entrants.28 Since we measure industrial growth in terms of
value added, under such a scenario we could observe positive growth due to an increase
in profits and not necessarily in production, with important welfare implications.
The Rajan and Zingales data set contains information on growth in the number of
establishments and growth in the average size of existing establishments that can be
used to test this hypothesis. If bank concentration induces industry concentration, and
thus industry monopoly profits, then we should find that in those sectors that are more
dependent on external finance there is a relatively slower growth in the number of new
establishments, and in association with it a relatively faster growth in the average size
of existing establishments. In our model specification, this implies that the hypothesis
that bank concentration induces industry concentration is consistent with the finding
that the interaction between bank concentration and external financial dependence is
negative and significant in a regression with growth in number of establishments as
28In his study of Italian industrialization at the turn of the past century, Cohen (1967, p. 363) reportsthe relation between a quasi-monopolistic banking industry and “. . .the emergence of concentration ofownership and control in the new and rapidly growing sectors of the industrial structure.”
29

dependent variable, and positive and significant in a regression with growth in average
size as dependent variable.
We first run regressions with growth in number of establishments as the dependent
variable. The results in column (d) of Table X show that while the level of concentration
is negative and significant, the interaction term is positive and significant. Column (e)
shows that the interaction term remains positive and significant even when we drop the
regressors in level and we can introduce country dummies.
We then use growth in average size as the dependent variable. The results of these
regressions are reported in column (f) and (g) of Table X. In both model specifications
the interaction term is never significant. Overall, the evidence does not support the
argument that bank concentration may enhance industry concentration. The results
thus indicate that growth in value added is a good proxy for growth in output.
VIII. Concluding Remarks
Important recent contributions have established with reasonable confidence that fi-
nancial development, characterized by a sizeable banking sector, matters for economic
growth. The next important step in the research agenda involves delving deeper into
the micro details governing the actual functioning of the finance-growth nexus. Beyond
a “black-box” characterization of the banking sector, implicit in focusing on its relative
size only, there is a much more complex web of banks and other institutions interacting
in the credit markets. The various attributes of such a system are likely to have a qual-
ifying impact on the finance-growth relationship. The market structure of the banking
industry, reflecting its competitive conditions, is, in our opinion, one such attribute.
The findings in our paper suggest a non-trivial impact of bank concentration on in-
dustrial growth. There is evidence that bank concentration has a first-order negative
effect on growth. This finding is consistent with the theoretical prediction that higher
30

bank concentration results in a lower amount of credit available in the economy as a
whole. Regardless of their external financial dependence, this effect is common to all
industrial sectors. However, we also find evidence that bank concentration has a het-
erogeneous effect across industries. In particular, sectors that are more dependent on
external finance enjoy a beneficial effect from a concentrated banking sector. This posi-
tive effect could actually more than compensate the direct, negative effect on quantities.
This finding supports models predicting that concentration of market power in banking
facilitates the development of lending relationships, which have in turn an enhancing
effect on firms’ growth.
The main insights of this study are that first, at least maintaining the focus on the
effects on industrial growth, there does not seem to be a Pareto-dominant policy regard-
ing the optimal banking market structure: competition in banking does not necessarily
dominate monopoly, and vice versa. Second, depending on the level of bank concentra-
tion, and ceteris paribus, individual industries will grow at different speeds. Therefore,
banking market structure plays an important role in shaping the cross-industry size dis-
tribution within a country. Moreover, since bank concentration plays a more substantial
role for growth by facilitating credit access of younger firms, and to the extent that
investment by younger firms is more likely to introduce innovative technologies, banking
market structure should have an impact on the pace of technological progress.
The results of the paper have relevance for developing countries, where government-
sponsored programs, such as development banks (see Armendariz de Aghion (1999))
or micro banking (see Morduch (1999)), which affect credit market structure, aim at
providing the conditions for convergence to higher levels of welfare. Yet, our findings
are also relevant for developed countries where we witness important regulatory reforms
and significant structural transformations of the banking industry.
31
References
Armendariz de Aghion, Beatriz, 1999, Development banking, Journal of Development
Economics 58, 83–100.
Barro, Robert J., and Jong W. Lee, 1993, International comparisons of educational
attainment, Journal of Monetary Economics 32, 363–394.
Barth, James R., Gerard Caprio, and Ross Levine, 2000, Banking systems around
the world: do regulation and ownership affect performance and stability?, in Frederic
Mishkin, ed.: Prudential supervision: What works and what doesn’t (NBER Press, Cam-
bridge, MA).
Beck, Thorsten, Aslı Demirguc-Kunt, and Ross Levine, 1999, A new database on finan-
cial development and structure, Working paper, World Bank.
Bencivenga, Valerie R., and Bruce Smith, 1991, Financial intermediation and endoge-
nous growth, Review of Economic Studies 58, 195–209.
Berger, Allen N., Seth D. Bonime, Daniel M. Covitz, and Diana Hancock, 1999, Why
are bank profits so persistent? The roles of product market competition, informational
opacity, and regional/macroeconomic shocks, Working paper, Board of Governors of the
Federal Reserve.
Berndt, Ernst R., 1991, The practice of classic and contemporary econometrics (Addison-
Wesley, New York, NY).
Black, Sandra E., and Philip E. Strahan, 2000, Entrepreneurship and bank credit avail-
ability, Working paper, Federal Reserve Bank of New York.
Bonaccorsi di Patti, Emilia, and Giovanni Dell’Ariccia, 2000, Bank competition and firm
creation, Working paper, Bank of Italy.
32

Bresnahan, Timothy, 1991, Empirical studies of industries with market power, in Richard
Schmalensee and Robert D. Willig, eds.: Handbook of industrial organization (North
Holland, Amsterdam).
Calem, Paul, and Gerald Carlino, 1991, The concentration/conduct relationship in bank
deposit markets, Review of Economics and Statistics 73, 268–276.
Cameron, Rondo, 1967, Banking in the early stages of industrialization (Oxford Univer-
sity Press, New York, NY).
Cetorelli, Nicola, and Pietro F. Peretto, 2000, Oligopoly banking and capital accumula-
tion, Working paper, Federal Reserve Bank of Chicago.
Claessens, Stijn, Aslı Demirguc-Kunt, and Harry Huizinga, 1998, How does foreign entry
affect the domestic banking market?, Working paper, World Bank.
Cohen, Jon, 1967, Financing industrialization in Italy, 1894–1914, Journal of Economic
History 27, 363–382.
Davidson, Russell, and James G. MacKinnon, 1993, Estimation and inference in econo-
metrics (Cambridge University Press, New York, NY).
Demetriades, Panicos O., and Khaled A. Hussein, 1996, Does financial development
cause economic growth? time-series evidence from sixteen countries, Journal of Devel-
opment Economics 51, 387–411.
Demirguc-Kunt, Aslı, and Harry Huizinga, 1998, Determinants of commercial bank in-
terest margins and profitability: some international evidence, Working paper, World
Bank.
Demirguc-Kunt, Aslı, and Ross Levine, 1999, Bank-based and market-based financial
systems: cross-country comparisons, Working paper, World Bank.
33

Demirguc-Kunt, Aslı, and Vojislav Maksimovic, 1998, Law, finance, and firm growth,
Journal of Finance 56, 2107–2137.
European Central Bank, 1999, Possible effects of EMU on the EU banking systems in
the medium to long term (European Central Bank, Frankfurt).
Gerschenkron, Alexander, 1965, Economic backwardness in historical perspective (Praeger,
New York, NY).
Goldsmith, Raymond, 1969, Financial structure and economic development (Yale Uni-
versity Press, New Haven, CT).
Gurley, John G., and Edward S. Shaw, 1967, Financial structure and economic develop-
ment, Economic Development and Cultural Change 15, 257–278.
King, Robert, and Ross Levine, 1993, Finance and growth: Schumpeter might be right,
Quarterly Journal of Economics 108, 717–737.
La Porta, Rafael L., Florencio Lopez-de-Silanes, Andrei Shleifer, and Robert W. Vishny,
1997, Legal determinants of external finance, Journal of Finance 52, 1131–1150.
Lang, William W., and Leonard I. Nakamura, 1989, Information losses in a dynamic
model of credit, Journal of Finance, 44, 731–746.
Levine, Ross, Norman Loayza, and Thorsten Beck, 2000, Financial intermediation and
growth: causality and causes, Journal of Monetary Economics, forthcoming.
Levine, Ross, and Sara Zervos, 1998, Stock markets and economic growth, American
Economic Review 88, 537–558.
Mayer, Colin, 1988, New issues in corporate finance, European Economic Review 32,
1167–1183.
Mayer, Colin, 1990, Financial systems, corporate finance and economic development,
34

in R. Glenn Hubbard, ed.: Asymmetric information, corporate finance and investment
(The University of Chicago Press, Chicago, IL).
McKinnon, Ronald I., 1973, Money and capital in economic development, (Brooking
Institution, Washington, DC).
Morduch, Jonathan, 1999, The microfinance promise, Journal of Economic Literature
37, 1569–1614.
Pagano, Marco, 1993, Financial markets and growth. An overview, European Economic
Review 37, 613–622.
Petersen, Mitchell A., and Raghuram G. Rajan, 1995, The effect of credit market com-
petition on lending relationships, Quarterly Journal of Economics 110, 407–443.
Rajan, Raghuram G., and Luigi Zingales, 1998, Financial dependence and growth, Amer-
ican Economic Review 88, 559–586.
Rajan, Raghuram G., and Luigi Zingales, 1999, The politics of financial development,
Working paper, University of Chicago.
Shaffer, Sherrill, 1998, The winner’s curse in banking, Journal of Financial Intermedia-
tion 7, 359–392.
Shaw, Edward S., 1973, Financial deepening in economic development (Oxford Univer-
sity Press, New York, NY).
Sylla, Richard, 1969, Federal policy, banking market structure and capital mobilization
in the United States, 1863–1913, Journal of Economic History 29, 657–686.
Vittas, Dimitri, 1992, The impact of regulation on financial intermediation, in Dim-
itri Vittas, ed.: Financial regulation. Changing the Rules of the Games (World Bank,
Washington, DC).
35
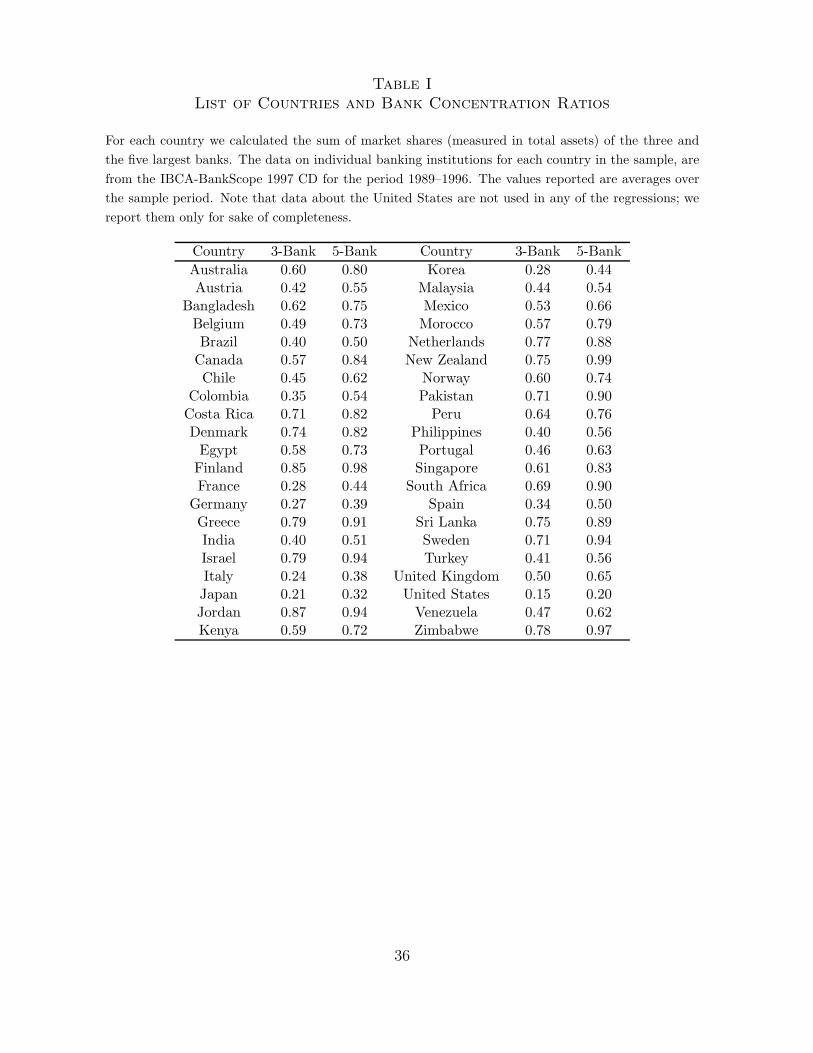
Table I
List of Countries and Bank Concentration Ratios
For each country we calculated the sum of market shares (measured in total assets) of the three andthe five largest banks. The data on individual banking institutions for each country in the sample, arefrom the IBCA-BankScope 1997 CD for the period 1989–1996. The values reported are averages overthe sample period. Note that data about the United States are not used in any of the regressions; wereport them only for sake of completeness.
Country 3-Bank 5-Bank Country 3-Bank 5-BankAustralia 0.60 0.80 Korea 0.28 0.44Austria 0.42 0.55 Malaysia 0.44 0.54
Bangladesh 0.62 0.75 Mexico 0.53 0.66Belgium 0.49 0.73 Morocco 0.57 0.79Brazil 0.40 0.50 Netherlands 0.77 0.88Canada 0.57 0.84 New Zealand 0.75 0.99Chile 0.45 0.62 Norway 0.60 0.74
Colombia 0.35 0.54 Pakistan 0.71 0.90Costa Rica 0.71 0.82 Peru 0.64 0.76Denmark 0.74 0.82 Philippines 0.40 0.56Egypt 0.58 0.73 Portugal 0.46 0.63Finland 0.85 0.98 Singapore 0.61 0.83France 0.28 0.44 South Africa 0.69 0.90Germany 0.27 0.39 Spain 0.34 0.50Greece 0.79 0.91 Sri Lanka 0.75 0.89India 0.40 0.51 Sweden 0.71 0.94Israel 0.79 0.94 Turkey 0.41 0.56Italy 0.24 0.38 United Kingdom 0.50 0.65Japan 0.21 0.32 United States 0.15 0.20Jordan 0.87 0.94 Venezuela 0.47 0.62Kenya 0.59 0.72 Zimbabwe 0.78 0.97
36
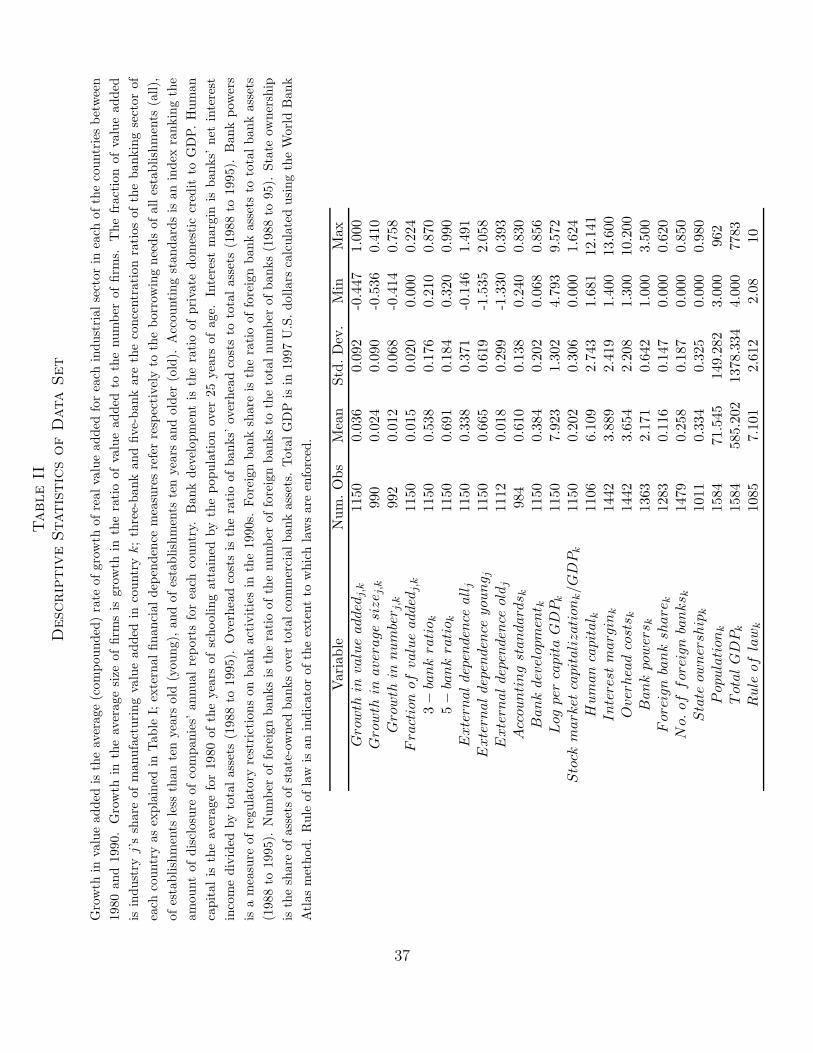
Table
II
Descriptive
Statistics
of
Data
Set
Growthinvalueaddedistheaverage(compounded)rateofgrowthofrealvalueaddedforeachindustrialsectorineachofthecountriesbetween
1980and1990.Growthintheaveragesizeoffirmsisgrowthintheratioofvalueaddedtothenumberoffirms.Thefraction
ofvalueadded
isindustry
j’sshareofmanufacturingvalueaddedincountry
k;three-bank
andfive-bank
aretheconcentrationratiosofthebankingsectorof
eachcountryasexplainedinTableI;externalfinancialdependencemeasuresreferrespectivelytotheborrowingneedsofallestablishments(all),
ofestablishmentslessthantenyearsold(young),andofestablishmentstenyearsandolder(old).Accountingstandardsisanindexrankingthe
amountofdisclosureofcompanies’annualreportsforeachcountry.BankdevelopmentistheratioofprivatedomesticcredittoGDP.Human
capitalistheaveragefor1980oftheyearsofschoolingattainedby
thepopulation
over25yearsofage.Interestmarginisbanks’netinterest
incomedividedbytotalassets(1988to1995).Overheadcostsistheratioofbanks’overheadcoststototalassets(1988to1995).Bankpowers
isameasureofregulatoryrestrictionsonbankactivitiesinthe1990s.Foreignbankshareistheratioofforeignbankassetstototalbankassets
(1988to1995).Numberofforeignbanksistheratioofthenumberofforeignbankstothetotalnumberofbanks(1988to95).Stateownership
istheshareofassetsofstate-ownedbanksovertotalcommercialbankassets.TotalGDPisin1997U.S.dollarscalculatedusingtheWorldBank
Atlasmethod.Ruleoflawisanindicatoroftheextenttowhichlawsareenforced.
Variable
Num.Obs
Mean
Std.Dev.
Min
Max
Gro
wth
invalu
eadded
j,k
1150
0.036
0.092
-0.447
1.000
Gro
wth
inaver
age
size j
,k990
0.024
0.090
-0.536
0.410
Gro
wth
innum
ber j
,k992
0.012
0.068
-0.414
0.758
Fra
ctio
nof
valu
eadded
j,k
1150
0.015
0.020
0.000
0.224
3−
bank
rati
o k1150
0.538
0.176
0.210
0.870
5−
bank
rati
o k1150
0.691
0.184
0.320
0.990
Exte
rnaldep
enden
ceall
j1150
0.338
0.371
-0.146
1.491
Exte
rnaldep
enden
ceyou
ng j
1150
0.665
0.619
-1.535
2.058
Exte
rnaldep
enden
ceol
dj
1112
0.018
0.299
-1.330
0.393
Acc
ounti
ng
standard
s k984
0.610
0.138
0.240
0.830
Bank
dev
elop
men
t k1150
0.384
0.202
0.068
0.856
Log
per
capit
aG
DP
k1150
7.923
1.302
4.793
9.572
Sto
ckm
ark
etca
pit
alizati
onk/G
DP
k1150
0.202
0.306
0.000
1.624
Hum
an
capit
al k
1106
6.109
2.743
1.681
12.141
Inte
rest
marg
ink
1442
3.889
2.419
1.400
13.600
Over
hea
dco
sts k
1442
3.654
2.208
1.300
10.200
Bank
pow
ers k
1363
2.171
0.642
1.000
3.500
For
eign
bank
share
k1283
0.116
0.147
0.000
0.620
No.
offor
eign
banks k
1479
0.258
0.187
0.000
0.850
Sta
teow
ner
ship
k1011
0.334
0.325
0.000
0.980
Pop
ula
tion
k1584
71.545
149.282
3.000
962
Tot
alG
DP
k1584
585.202
1378.334
4.000
7783
Rule
ofla
wk
1085
7.101
2.612
2.08
10
37

Table
III
Correlations
betw
een
Concentration
Measures
and
Selected
Variables
Stockmarket/GDPistheratiobetweenstockmarketcapitalizationandGDPin1980;LogpercapitaGDPisthelogofpercapitaGDPin
1980;Accountingstandardsisameasureofthequalityofaccountinganddisclosurelevelsofbusinesses;Bankdevelopmentistheratioofprivate
domesticcredittoGDP;three-bank
andfive-bank
aretheconcentrationratiosofthebankingsectorofeachcountryasexplainedinTableI.
Interestmarginisbanks’netinterestincomedividedbytotalassets(1988to1995).Overheadcostsistheratioofbanks’overheadcoststototal
assets(1988to1995);Stateownershipistheshareofassetsofstate-ownedbanksovertotalcommercialbankassets;foreignpresenceistheratio
offoreignbank
assetstototalbank
assets(1988to1995);Bankpowersisameasureofregulatoryrestrictionson
bank
activitiesinthe1990s.
Foreignbankshareistheratioofforeignbankassetstototalbankassets(1988to1995).
Variables
Sto
ckG
DP
Acc
ounti
ng
Bank
3−
Bank
5−
Bank
Sto
ckm
ark
etk/G
DP
k1.000
Log
per
capit
aG
DP
k0.175*
1.000
Acc
ounti
ng
standard
s k0.444*
0.587*
1.000
Bank
dev
elop
men
t k0.169*
0.560*
0.259*
1.000
3−
bank
rati
o k0.142*
-0.057
0.172*
-0.270*
1.000
5−
bank
rati
o k0.213*
-0.015
0.224*
-0.288*
0.972*
1.000
Variables
Inte
rest
Over
hea
dS
tate
For
eign
Pow
ers
3−
Bank
Inte
rest
marg
ink
1.000
Over
hea
dco
sts k
0.847*
1.000
Sta
teow
ner
ship
k0.066
0.098
1.000
For
eign
pre
sence
k0.245*
0.395*
-0.023
1.000
Bank
pow
ers k
0.352*
0.317*
-0.049
0.240*
1.000
3−
bank
rati
o k0.024
-0.020
-0.132*
0.125*
-0.250*
1.000
*indicatesthatthecorrelationisdifferentfrom
zeroatthe1percentsignificancelevel.
38
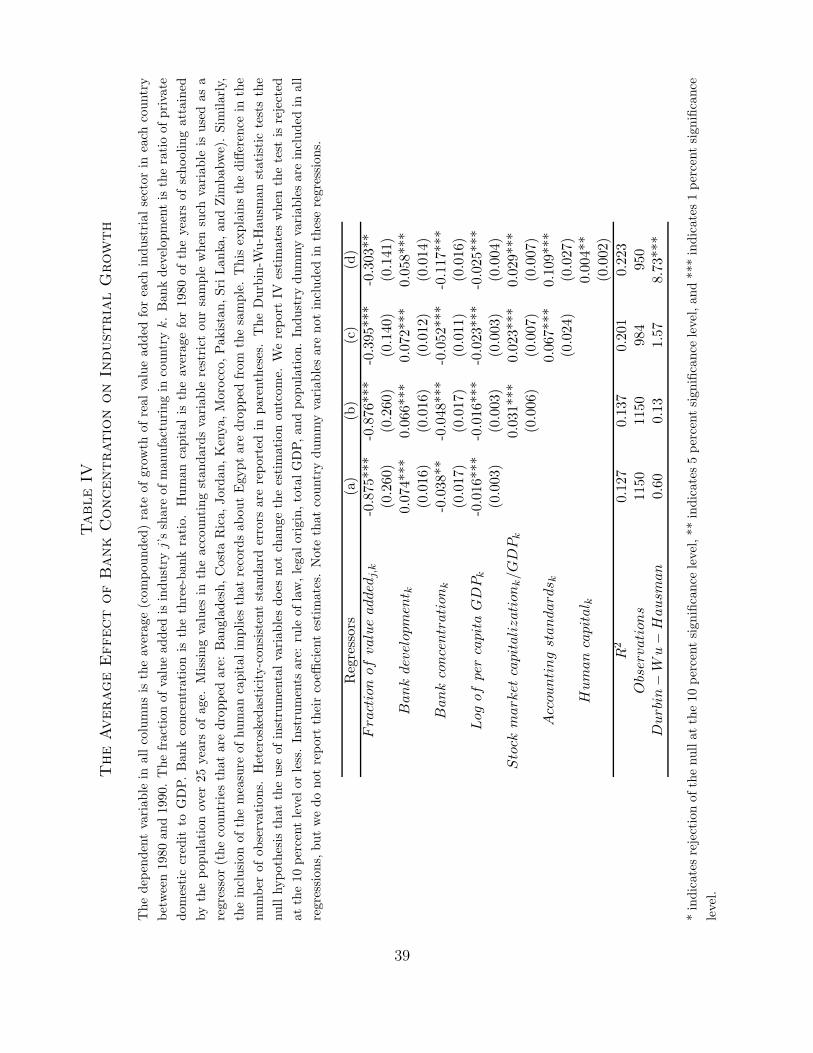
Table
IV
The
Average
Effect
of
Bank
Concentration
on
Industrial
Grow
th
Thedependentvariableinallcolumnsistheaverage(compounded)rateofgrowthofrealvalueaddedforeachindustrialsectorineachcountry
between1980and1990.Thefractionofvalueaddedisindustry
j’sshareofmanufacturingincountry
k.Bankdevelopmentistheratioofprivate
domesticcredittoGDP.Bankconcentrationisthethree-bank
ratio.Human
capitalistheaveragefor1980oftheyearsofschoolingattained
bythepopulationover25yearsofage.Missingvaluesintheaccountingstandardsvariablerestrictoursamplewhensuchvariableisusedasa
regressor(thecountriesthataredroppedare:Bangladesh,CostaRica,Jordan,Kenya,M
orocco,Pakistan,SriLanka,and
Zimbabwe).Similarly,
theinclusionofthemeasureofhumancapitalimpliesthatrecordsaboutEgyptaredroppedfrom
thesample.Thisexplainsthedifferenceinthe
numberofobservations.Heteroskedasticity-consistentstandarderrorsarereportedinparentheses.TheDurbin-Wu-Hausmanstatisticteststhe
nullhypothesisthattheuseofinstrumentalvariablesdoesnotchangetheestimationoutcome.WereportIV
estimateswhenthetestisrejected
atthe10percentlevelorless.Instrumentsare:ruleoflaw,legalorigin,totalGDP,andpopulation.Industrydummyvariablesareincludedinall
regressions,butwedonotreporttheircoefficientestimates.Notethatcountrydummyvariablesarenotincludedintheseregressions.
Regressors
(a)
(b)
(c)
(d)
Fra
ctio
nof
valu
eadded
j,k
-0.875***
-0.876***
-0.395***
-0.303**
(0.260)
(0.260)
(0.140)
(0.141)
Bank
dev
elop
men
t k0.074***
0.066***
0.072***
0.058***
(0.016)
(0.016)
(0.012)
(0.014)
Bank
conce
ntr
ati
onk
-0.038**
-0.048***
-0.052***
-0.117***
(0.017)
(0.017)
(0.011)
(0.016)
Log
ofper
capit
aG
DP
k-0.016***
-0.016***
-0.023***
-0.025***
(0.003)
(0.003)
(0.003)
(0.004)
Sto
ckm
ark
etca
pit
alizati
onk/G
DP
k0.031***
0.023***
0.029***
(0.006)
(0.007)
(0.007)
Acc
ounti
ng
standard
s k0.067***
0.109***
(0.024)
(0.027)
Hum
an
capit
al k
0.004**
(0.002)
R2
0.127
0.137
0.201
0.223
Obs
ervati
ons
1150
1150
984
950
Durb
in−
Wu−
Hausm
an
0.60
0.13
1.57
8.73***
*indicatesrejectionofthenullatthe10percentsignificancelevel,**indicates5percentsignificancelevel,and***indicates1percentsignificance
level.
39
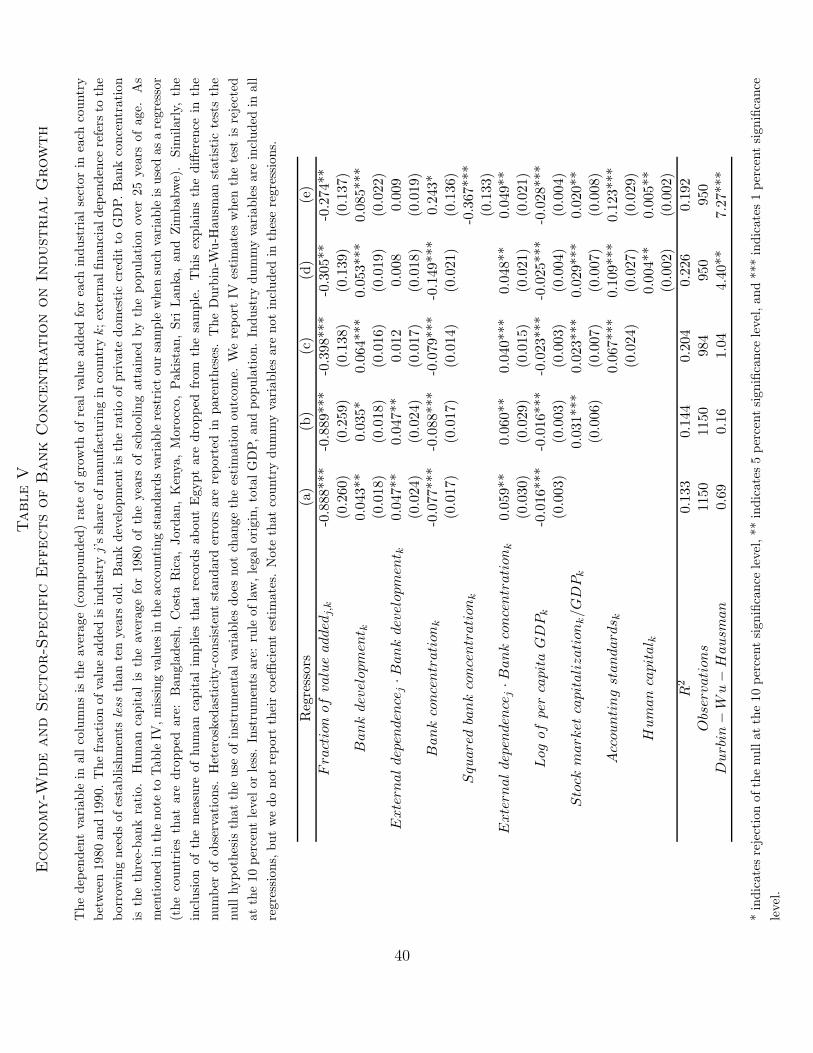
Table
V
Economy-W
ide
and
Sector-Specific
Effects
of
Bank
Concentration
on
Industrial
Grow
th
Thedependentvariableinallcolumnsistheaverage(compounded)rateofgrowthofrealvalueaddedforeachindustrialsectorineachcountry
between1980and1990.Thefractionofvalueaddedisindustry
j’sshareofmanufacturingincountry
k;externalfinancialdependencereferstothe
borrowingneedsofestablishments
lessthantenyearsold.BankdevelopmentistheratioofprivatedomesticcredittoGDP.Bankconcentration
isthethree-bank
ratio.
Human
capitalistheaveragefor1980oftheyearsofschoolingattainedby
thepopulation
over25yearsofage.As
mentionedinthenotetoTableIV,missingvaluesintheaccountingstandardsvariablerestrictoursamplewhensuchvariableisusedasaregressor
(the
countriesthataredroppedare:Bangladesh,CostaRica,Jordan,Kenya,Morocco,Pakistan,SriLanka,andZimbabwe).Similarly,the
inclusionofthemeasureofhuman
capitalimpliesthatrecordsaboutEgyptaredroppedfrom
thesample.Thisexplainsthedifferenceinthe
numberofobservations.Heteroskedasticity-consistentstandarderrorsarereportedinparentheses.TheDurbin-Wu-Hausmanstatisticteststhe
nullhypothesisthattheuseofinstrumentalvariablesdoesnotchangetheestimationoutcome.WereportIV
estimateswhenthetestisrejected
atthe10percentlevelorless.Instrumentsare:ruleoflaw,legalorigin,totalGDP,andpopulation.Industrydummyvariablesareincludedinall
regressions,butwedonotreporttheircoefficientestimates.Notethatcountrydummyvariablesarenotincludedintheseregressions.
Regressors
(a)
(b)
(c)
(d)
(e)
Fra
ctio
nof
valu
eadded
j,k
-0.888***
-0.889***
-0.398***
-0.305**
-0.274**
(0.260)
(0.259)
(0.138)
(0.139)
(0.137)
Bank
dev
elop
men
t k0.043**
0.035*
0.064***
0.053***
0.085***
(0.018)
(0.018)
(0.016)
(0.019)
(0.022)
Exte
rnaldep
enden
cej·B
ank
dev
elop
men
t k0.047**
0.047**
0.012
0.008
0.009
(0.024)
(0.024)
(0.017)
(0.018)
(0.019)
Bank
conce
ntr
ati
onk
-0.077***
-0.088***
-0.079***
-0.149***
0.243*
(0.017)
(0.017)
(0.014)
(0.021)
(0.136)
Squ
are
dba
nk
conce
ntr
ati
onk
-0.367***
(0.133)
Exte
rnaldep
enden
cej·B
ank
conce
ntr
ati
onk
0.059**
0.060**
0.040***
0.048**
0.049**
(0.030)
(0.029)
(0.015)
(0.021)
(0.021)
Log
ofper
capit
aG
DP
k-0.016***
-0.016***
-0.023***
-0.025***
-0.028***
(0.003)
(0.003)
(0.003)
(0.004)
(0.004)
Sto
ckm
ark
etca
pit
alizati
onk/G
DP
k0.031***
0.023***
0.029***
0.020**
(0.006)
(0.007)
(0.007)
(0.008)
Acc
ounti
ng
standard
s k0.067***
0.109***
0.123***
(0.024)
(0.027)
(0.029)
Hum
an
capit
al k
0.004**
0.005**
(0.002)
(0.002)
R2
0.133
0.144
0.204
0.226
0.192
Obs
ervati
ons
1150
1150
984
950
950
Durb
in−
Wu−
Hausm
an
0.69
0.16
1.04
4.40**
7.27***
*indicatesrejectionofthenullatthe10percentsignificancelevel,**indicates5percentsignificancelevel,and***indicates1percentsignificance
level.
40

Table
VI
Tests
of
Robustness,Focusing
on
the
Interaction
of
Bank
Concentration
and
Young
Firms’
Financial
Needs
Thedependentvariableinallregressionsistheaverage(compounded)rateofgrowthofrealvalueaddedforeachindustrialsectorineachofthe
countriesbetween1980and1990.Thefractionofvalueaddedisindustry
j’sshareofmanufacturingvalueaddedincountry
k;externalfinancial
dependencereferstotheborrowingneedsofestablishments
lessthantenyearsold.Bankingdevelopmentistheratioofprivatedomesticcredit
toGDP.Column(a)usesthethree-bankratio(asdefinedinthetext)asameasureofbankingconcentration.Incolumn(b)bankconcentration
istherankofthethree-bankratio,column(c)usesahigh-low
concentrationdummy,whilecolumn(d)hasthefive-bankconcentrationratio.The
high-low
dummyisequaltooneforthecountrieswithahighvalueofconcentration(≥0.7)andzerootherwise.Alternativeestimation,withthe
dummyforcountriesbeloworabovethemedian(0
.57),yieldedvirtually
unchangedresultsandisnotreportedinthetable.Otherregressors
includedarecountrydummiesandindustrydummies,butwedo
notreporttheircoefficientestimates.Heteroskedasticity-consistentstandard
errorsarereportedinparentheses.TheDurbin-Wu-Hausman
statisticteststhenullthattheuseofinstrumentalvariablesdoesnotchangethe
estimationoutcome.WereportIV
estimateswhenthetestisrejectedatthe10percentlevelorless.Instrumentsare:ruleoflaw,legalorigin,
totalGDP,andpopulation.
3-Bank
Rank
High/Low
5-Bank
Regressors
(a)
(b)
(c)
(d)
Fra
ctio
nof
valu
eadded
j,k
-0.905***
-0.906***
-0.903***
-0.903***
(0.285)
(0.285)
(0.286)
(0.285)
Exte
rnaldep
enden
cej·B
ank
dev
elop
men
t k0.049**
0.046**
0.031*
0.045**
(0.022)
(0.022)
(0.019)
(0.021)
Exte
rnaldep
enden
cej·B
ank
conce
ntr
ati
onk
0.063**
0.088**
0.019*
0.085**
(0.029)
(0.041)
(0.010)
(0.035)
R2
0.288
0.287
0.286
0.288
Obs
ervati
ons
1150
1150
1150
1150
Durb
in−
Wu−
Hausm
an
0.48
0.41
0.73
0.22
*indicatesrejectionofthenullatthe10percentsignificancelevel,twoasterisksindicates5percentsignificancelevel,andthreeasterisksindicates
1percentsignificancelevel.
41

Table
VII
Tests
of
Robustness,C
ontinued
Thedependentvariableinallregressionsistheaverage(compounded)rateofgrowthofrealvalueaddedforeachindustrialsectorineachcountry
between1980and1990.Thefractionofvalueaddedisindustry
j’sshareofmanufacturingincountry
k;externalfinancialdependencereferstothe
borrowingneedsofestablishments
lessthantenyearsold.BankingdevelopmentistheratioofprivatedomesticcredittoGDP.Bankconcentration
isthethree-bankratio.Accountingstandardsisanindexrankingtheamountofdisclosureofcompanies’annualreportsforeachcountry.Because
ofmissingvaluesinaccountingstandards,theinclusionofaccountingstandardsincolumn(d)causesallrecordsreferringtothefollowingcountries
tobedropped:Bangladesh,CostaRica,Jordan,Kenya,M
orocco,Pakistan,SriLanka,andZimbabwe.Column(e)isourbaselineregression(as
incolumn(a)ofTableVI),butweexcludetheobservationswherethedependentvariablewascensoredatgrowth=100percentperyear.The
regressionincolumn(f)includes
Hig
h,adummyvariableequaltoonewhenasector’sexternalfinancialneedisabovethemedian(0
.60).Other
regressorsincludedarecountrydummiesandindustrydummies,butwedo
notreporttheircoefficientestimates.Heteroskedasticity-consistent
standarderrorsarereportedinparentheses.TheDurbin-Wu-Hausman
statisticteststhenullhypothesisthattheuseofinstrumentalvariables
doesnotchangetheestimationoutcome.WereportIVestimateswhenthetestisrejectedatthe10percentlevelorless.Instrumentsare:ruleof
law,legalorigin,totalGDP,andpopulation.
Omittedvariables
Outliers
Regressors
(a)
(b)
(c)
(d)
(e)
(f)
Fra
ctio
nof
valu
eadded
j,k
-0.887***
-0.914***
-0.905***
-0.296**
-0.816***
-0.905***
(0.287)
(0.286)
(0.285)
(0.147)
(0.260)
(0.286)
Exte
rnaldep
enden
cej·B
ank
dev
elop
men
t k0.045**
0.028
0.005
0.033*
0.049**
(0.022)
(0.030)
(0.012)
(0.017)
(0.023)
Exte
rnaldep
enden
cej·B
ank
conce
ntr
ati
onk
0.048*
0.059**
0.058*
0.035**
0.036***
0.076***
(0.026)
(0.029)
(0.033)
(0.014)
(0.014)
(0.028)
Exte
rnaldep
enden
cej·S
tock
mark
etk/G
DP
k0.012
(0.010)
Exte
rnaldep
enden
cej·L
ogof
per
capit
aG
DP
k0.005
(0.005)
Exte
rnaldep
enden
cej·A
ccou
nti
ng
Sta
ndard
s k0.032
(0.022)
Hig
hj·E
xte
rnaldep
enden
cej·B
ank
conce
ntr
ati
onk
-0.017
(0.038)
R2
0.284
0.288
0.289
0.416
0.327
0.288
Obs
ervati
ons
1150
1150
1150
984
1148
1150
Durb
in−
Wu−
Hausm
an
0.69
0.45
0.58
0.00
0.14
0.50
*indicatesrejectionofthenullatthe10percentsignificancelevel,**indicates5percentsignificancelevel,and***indicates1percentsignificance
level.
42
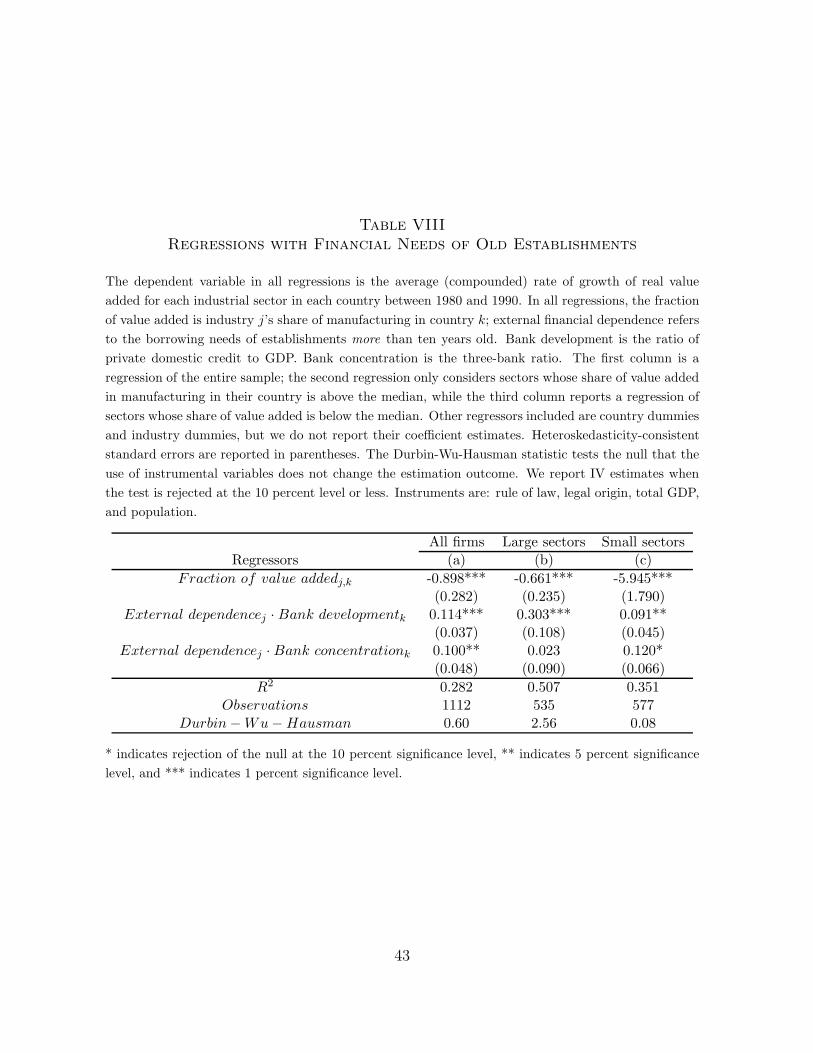
Table VIII
Regressions with Financial Needs of Old Establishments
The dependent variable in all regressions is the average (compounded) rate of growth of real valueadded for each industrial sector in each country between 1980 and 1990. In all regressions, the fractionof value added is industry j’s share of manufacturing in country k; external financial dependence refersto the borrowing needs of establishments more than ten years old. Bank development is the ratio ofprivate domestic credit to GDP. Bank concentration is the three-bank ratio. The first column is aregression of the entire sample; the second regression only considers sectors whose share of value addedin manufacturing in their country is above the median, while the third column reports a regression ofsectors whose share of value added is below the median. Other regressors included are country dummiesand industry dummies, but we do not report their coefficient estimates. Heteroskedasticity-consistentstandard errors are reported in parentheses. The Durbin-Wu-Hausman statistic tests the null that theuse of instrumental variables does not change the estimation outcome. We report IV estimates whenthe test is rejected at the 10 percent level or less. Instruments are: rule of law, legal origin, total GDP,and population.
All firms Large sectors Small sectorsRegressors (a) (b) (c)
Fraction of value addedj,k -0.898*** -0.661*** -5.945***(0.282) (0.235) (1.790)
External dependencej · Bank developmentk 0.114*** 0.303*** 0.091**(0.037) (0.108) (0.045)
External dependencej · Bank concentrationk 0.100** 0.023 0.120*(0.048) (0.090) (0.066)
R2 0.282 0.507 0.351Observations 1112 535 577
Durbin − Wu − Hausman 0.60 2.56 0.08
* indicates rejection of the null at the 10 percent significance level, ** indicates 5 percent significancelevel, and *** indicates 1 percent significance level.
43

Table
IX
Contestability,U
nder-R
eporting,and
State
Ow
nership
Thedependentvariableinallcolumnsistheaverage(compounded)rateofgrowthofrealvalueaddedforeachindustrialsectorineachcountry
between1980and1990.Thefractionofvalueaddedisindustry
j’sshareofmanufacturingincountry
k;externalfinancialdependencereferstothe
borrowingneedsofestablishments
lessthantenyearsold.BankdevelopmentistheratioofprivatedomesticcredittoGDP.Bankconcentration
isthethree-bank
ratio.HighForeign&HighBankConcentrationisadummyvariableequaltooneforcountrieswithbothathree-bank
ratio
andaforeignshareofbankassetsabovetheirmedian.HighForeign&Low
per-capitaGDPisadummyvariableequaltooneforcountriesbelow
themedianinper-capitaGDPandabovethemedianintheforeignbank
share.Statemeasurestheshareofassetsofstate-ownedbanksover
totalcommercialbankassets.HighStateisadummyvariableequaltooneiftheshareofstate-ownedbanksisabove60percent.Industry-and
country-dummyvariablesareincludedincolumns(a)through(d),butwedonotreporttheircoefficientestimates.Incolumn(e)alsoper-capita
GDP,stockmarketcapitalization,andaccountingstandardsareusedascountrycontrols(becausethecountrydummiesareexcluded),butwe
donotreporttheirestimates.Heteroskedasticity-consistentstandarderrorsarereportedinparentheses.TheDurbin-Wu-Hausmanstatistictests
thenullhypothesisthatinstrumentalvariablesdonotchangetheestimationoutcome.WereportIVestimateswhenthetestisrejectedatthe10
percentlevelorless.Instrumentsare:ruleoflaw,legalorigin,totalGDP,andpopulation.
Contestability
Under-reporting
Stateownership
Regressors
(a)
(b)
(c)
(d)
(e)
Fra
ctio
nof
valu
eadded
j,k
-0.802**
-0.810**
-1.003***
-1.008***
-0.371***
(0.335)
(0.334)
(0.364)
(0.366)
(0.137)
Bank
dev
elop
men
t k0.020
(0.020)
Ext.
dep
. j·B
ank
dev
elop
men
t k0.030*
0.022
0.046*
0.034
0.011
(0.017)
(0.018)
(0.024)
(0.023)
(0.020)
Bank
conce
ntr
ati
onk
-0.060***
(0.015)
Ext.
dep
. j·B
ank
conce
ntr
ati
onk
0.044**
0.037**
0.048***
0.035**
0.041***
(0.019)
(0.018)
(0.016)
(0.016)
(0.015)
Hig
hF
orei
gn&
Hig
hB
ank
Con
centr
ati
onk·E
xt.
dep
. j-0.015
(0.027)
Hig
hF
orei
gn&
Low
per
capit
aG
DP
k·E
xt.
dep
. j-0.020
(0.027)
Sta
tek
0.014
(0.011)
Ext.
dep
. j·S
tate
k-0.035***
-0.023***
(0.012)
(0.009)
Hig
hS
tate
k·E
xt.
dep
. j-0.056**
(0.025)
R2
0.253
0.253
0.238
0.236
0.173
Obs
ervati
ons
952
952
741
741
635
Durb
in−
Wu−
Hausm
an
1.57
0.36
0.27
0.38
2.29
*indicatesrejectionofthenullatthe10percentsignificancelevel,**indicates5percentsignificancelevel,and***indicates1percentsignificance
level.
44

Table
X
Bank
Pow
ers
and
Industry
Concentration
Thedependentvariableincolumns(a)through(c)istheaverage(compounded)rateofgrowthofrealvalueaddedforeachindustrialsectorin
eachcountrybetween1980and1990.Thedependentvariableincolumns(d)–(e)isgrowthinnumberoffirms,andincolumns(f)–(g)isgrowth
inaveragefirmsize.Thefractionofvalueaddedisindustry
j’sshareofmanufacturingincountry
k;externalfinancialdependencereferstothe
borrowingneedsofestablishments
lessthantenyearsold.BankdevelopmentistheratioofprivatedomesticcredittoGDP.Bankconcentration
isthethree-bankratio.Bankpowersisameasureofregulatoryrestrictionsonbankactivitiesinthe1990s.Heteroskedasticity-consistentstandard
errorsarereportedinparentheses.TheDurbin-Wu-Hausman
statisticteststhenullthattheuseofinstrumentalvariablesdoesnotchangethe
estimationoutcome.WereportIVestimateswhenthetestisrejectedatthe10percentlevelorless.Instrumentsare:ruleoflaw,legalorigin,total
GDP,andpopulation.Industry-andcountry-dummyvariablesareincludedincolumns(a),(e),and(g),butwedo
notreporttheircoefficient
estimates.Incolumns(b),(c),(d)and(f),per-capitaGDP,stockmarketcapitalization,accountingstandards,andbankdevelopmentareusedas
countrycontrols(becausethecountrydummiesareexcluded),butwedonotreporttheirestimates.
Bankpowers
GrowthinNo.
Growthavg.size
Regressors
(a)
(b)
(c)
(d)
(e)
(f)
(g)
Fra
ctio
nof
valu
eadded
j,k
-0.360**
-0.387***
-0.382***
0.038
-0.212
-0.572**
-0.940***
(0.146)
(0.139)
(0.140)
(0.137)
(0.172)
(0.244)
(0.361)
Exte
rnaldep
enden
cej·B
ank
dev
elop
men
t k0.012
0.014
0.003
0.025
0.023
-0.010
0.005
(0.012)
(0.017)
(0.018)
(0.020)
(0.015)
(0.015)
(0.017)
Bank
conce
ntr
ati
onk
-0.111***
-0.113***
-0.143***
0.015
(0.022)
(0.027)
(0.032)
(0.031)
Exte
rnaldep
enden
cej·B
ank
conce
ntr
ati
onk
0.039***
0.052**
0.036*
0.058**
0.048**
-0.009
0.021
(0.015)
(0.021)
(0.021)
(0.029)
(0.021)
(0.026)
(0.018)
Bank
Pow
ers k
-0.004
(0.005)
Exte
rnaldep
enden
cej·B
ank
Pow
ers k
-0.001
0.000
-0.007
(0.005)
(0.005)
(0.005)
Bank
conce
ntr
ati
onk·B
ank
Pow
ers k
0.012
(0.014)
R2
0.381
0.203
0.200
0.074
0.442
0.207
0.444
Obs
ervati
ons
1035
984
984
876
961
876
990
Durb
in−
Wu−
Hausm
an
0.34
2.34*
4.03***
25.08***
4.47**
7.57***
2.52
*indicatesrejectionofthenullatthe10percentsignificancelevel,**indicates5percentsignificancelevel,and***indicates1percentsignificance
level.
45