banking indusind bank - business...
TRANSCRIPT
1 IndusInd Bank
Analyst: Anand Dama [email protected]
91 22 3028 6391 Date: 25
th March, 2010
Transiting from correction to expansion phase: Business re‐engineering initiated by the new management resulted into significant business turnaround and is now on a task to take growth to higher trajectory, supported by recovering economy. The next wave of growth will be strong and well supported by significant branch expansion. Bank has set ambitious growth targets over next 2 years, with continued focus on productivity, efficiency and thus profitability.
Liability driven growth strategy to prop‐up NIMs: Shrugging‐ off earlier disparaging strategy to fund business growth through high‐cost bulk/wholesale deposits, bank envisages a multi‐pronged approach including significant branch expansion to mop up higher CASA deposits, to further reduce its overall cost of funds and thus prop‐up NIMs above 3% level.
Asset quality to be under‐tight control: Plagued with high GNPAs till 2HFY09 courtesy its high corporate NPAs, bank has managed to cut down GNPAs to ~ 1.3% by Q3FY10. Going‐forward, when bank is embarking upon higher growth trajectory, managing asset quality remains a daunting task, which we believe management is committed to, supported by recovering economy. We estimate bank to maintain its GNPA ratio at about 1.3% and improve its PCR >70% by FY12E.
Expect strong expansion in return ratios: Driven by high‐voltage business expansion, improving NIMs, fee income and cost efficiency, we expect bank to register 62% PAT CAGR over FY09‐12E and more than two‐fold expansion in its return ratios. We estimate banks RoE at about 22.1% and RoA at 1.3% in FY12E.
Growth‐stage bank commands premium valuation; recommend buy: Bank’s stock has re‐rated to higher levels coinciding with overall improvement in fundamentals and transformation to a growth bank. Going forward, we expect bank to move in to next phase of growth warranting enhanced re‐rating prospects. Initiate coverage on the stock with a TP of Rs202, providing an upside of about 20% from current levels.
Key risks: Higher delinquencies, delay in branch expansion and change in top management.
Rating BuyTarget Price Rs202CMP Rs169Upside 20%Sensex 17,451
Key Data Bloomberg Code IIB IN Reuters Code INBK.BONSE Code INDUSINDBKCurrent Share o/s (mn) 410.4MktCap (Rsbn/USDmn) 69.5/1524.352 Wk H/L (Rs) 174.9/30.3Daily Vol.(3M NSE Avg) 1.14mnFace Value (Rs) 10Beta 1.11USD/INR 45.6
Shareholding Pattern (%)Promoters 22.2FII 26.5Others 51.3
Price Performance (%) 1m 6m 1yr
IndusInd 14.0 22.8 442.1NIFTY 7.3 1.6 77.7Source: Bloomberg;*As on 23rd Mar, 2010
INDIA
Institutional Research
BANKING
Initiating Coverage
IndusInd Bank
Reincarnated; now set for higher growth
Y/E Mar (Rs mn) NII YoY (%) Net Income YoY (%) Adj PAT YoY (%) RoE (%) RoA (%) EPS Adj BV P/E (x) P/ABV (x)
FY08 3,008 11 5,984 20 751 10 6.9 0.3 2.3 25.6 72.1 6.6
FY09 4,590 53 9,184 53 1,483 98 11.7 0.6 4.2 35.1 40.5 4.8
FY10E 8,675 89 14,141 54 3,394 129 18.8 1.1 8.3 50.4 20.4 3.4
FY11E 11,418 32 18,141 28 4,636 37 19.4 1.2 11.3 60.4 15.0 2.8
FY12E 15,383 35 23,451 29 6,345 37 22.1 1.3 15.5 74.3 10.9 2.3
Source: Company, Networth Research
2 IndusInd Bank
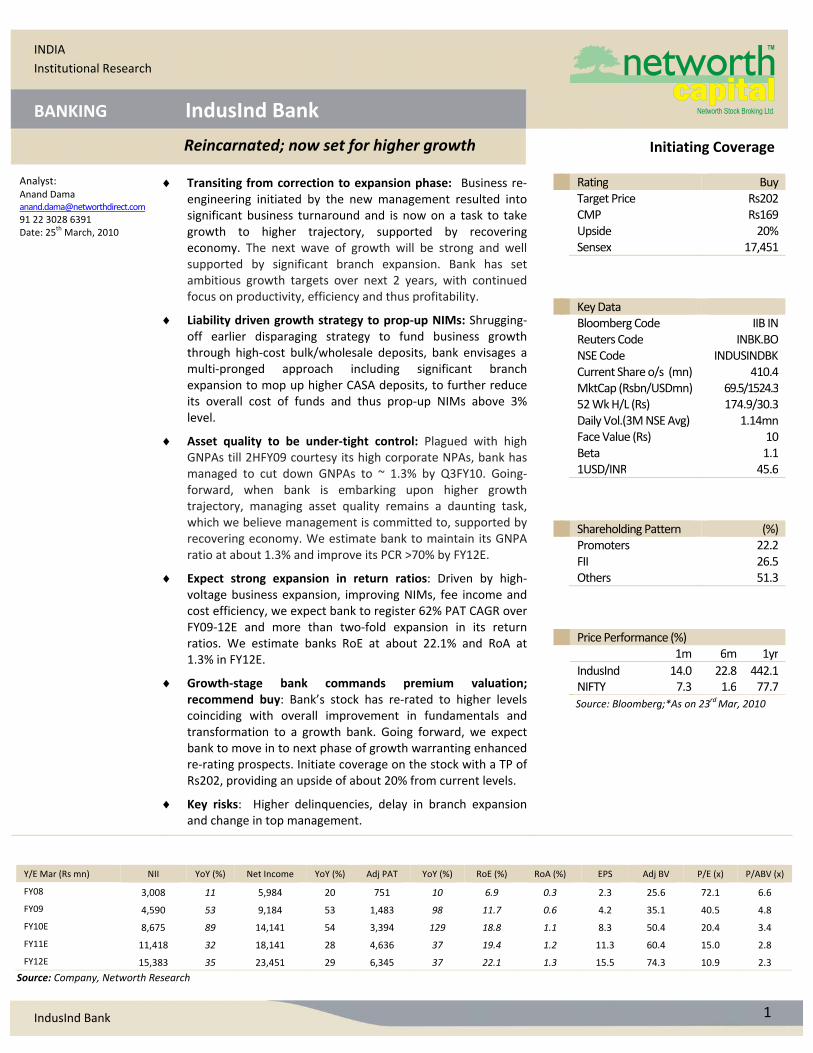
1.8 1.8 2.1
0.6 0.3 0.6
20.1
11.7
0
5
10
15
20
25
NII Non‐Int inc
Opex Prov Taxes RoA Avg. Asset/Eq
RoE
(%)
Source: Networth Research
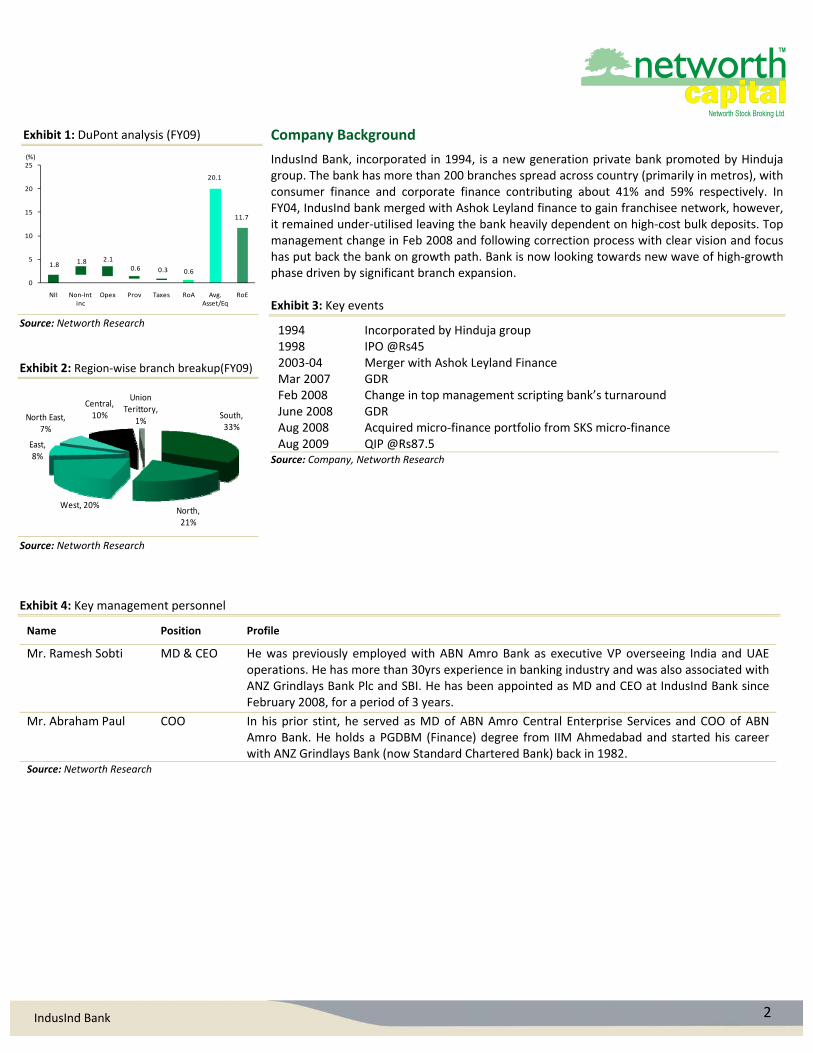
Exhibit 2: Region‐wise branch breakup(FY09)
South, 33%
North, 21%
West, 20%
East, 8%
North East, 7%
Central, 10%
Union Terittory,
1%
Source: Networth Research
Company Background
IndusInd Bank, incorporated in 1994, is a new generation private bank promoted by Hinduja group. The bank has more than 200 branches spread across country (primarily in metros), with consumer finance and corporate finance contributing about 41% and 59% respectively. In FY04, IndusInd bank merged with Ashok Leyland finance to gain franchisee network, however, it remained under‐utilised leaving the bank heavily dependent on high‐cost bulk deposits. Top management change in Feb 2008 and following correction process with clear vision and focus has put back the bank on growth path. Bank is now looking towards new wave of high‐growth phase driven by significant branch expansion. Exhibit 3: Key events
1994 Incorporated by Hinduja group1998 IPO @Rs452003‐04 Mar 2007
Merger with Ashok Leyland FinanceGDR
Feb 2008June 2008 Aug 2008 Aug 2009
Change in top management scripting bank’s turnaroundGDR Acquired micro‐finance portfolio from SKS micro‐finance QIP @Rs87.5
Source: Company, Networth Research
Exhibit 4: Key management personnel
Name Position Profile
Mr. Ramesh Sobti MD & CEO He was previously employed with ABN Amro Bank as executive VP overseeing India and UAE operations. He has more than 30yrs experience in banking industry and was also associated with ANZ Grindlays Bank Plc and SBI. He has been appointed as MD and CEO at IndusInd Bank since February 2008, for a period of 3 years.
Mr. Abraham Paul COO In his prior stint, he served as MD of ABN Amro Central Enterprise Services and COO of ABN Amro Bank. He holds a PGDBM (Finance) degree from IIM Ahmedabad and started his career with ANZ Grindlays Bank (now Standard Chartered Bank) back in 1982.
Source: Networth Research
Exhibit 1: DuPont analysis (FY09)
3 IndusInd Bank
Investment Rationale
Business re‐engineering leading the transformation…
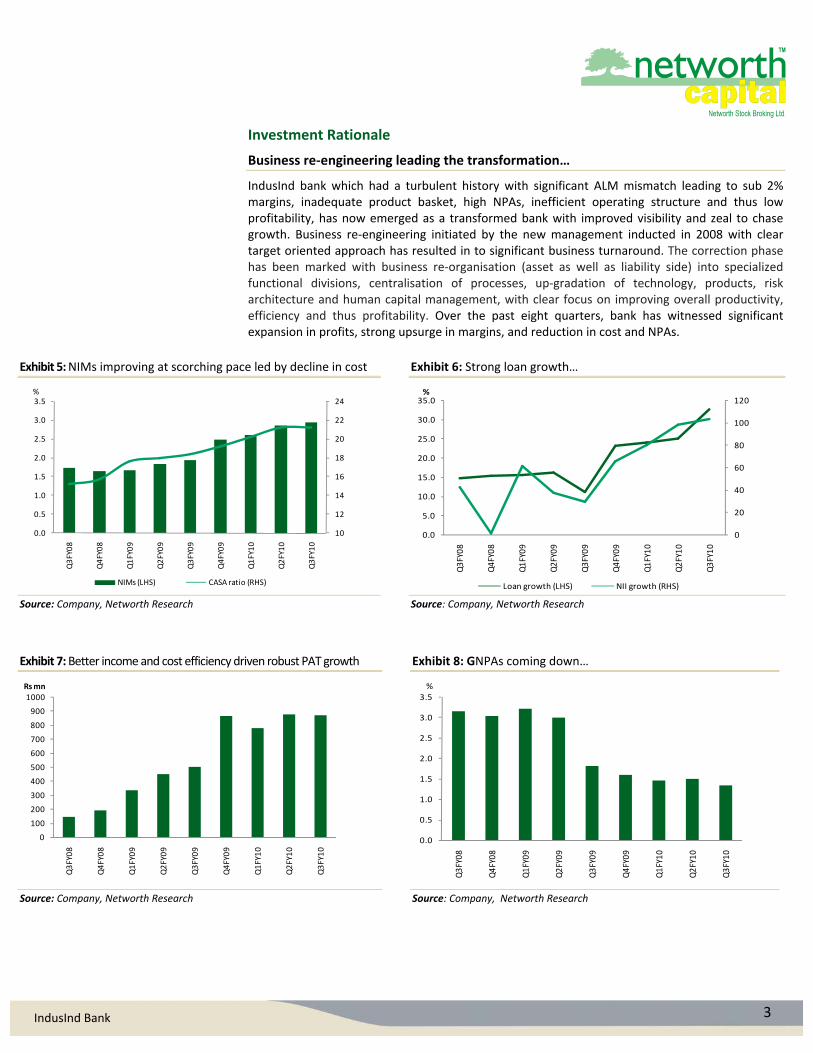
IndusInd bank which had a turbulent history with significant ALM mismatch leading to sub 2% margins, inadequate product basket, high NPAs, inefficient operating structure and thus low profitability, has now emerged as a transformed bank with improved visibility and zeal to chase growth. Business re‐engineering initiated by the new management inducted in 2008 with clear target oriented approach has resulted in to significant business turnaround. The correction phase has been marked with business re‐organisation (asset as well as liability side) into specialized functional divisions, centralisation of processes, up‐gradation of technology, products, risk architecture and human capital management, with clear focus on improving overall productivity, efficiency and thus profitability. Over the past eight quarters, bank has witnessed significant expansion in profits, strong upsurge in margins, and reduction in cost and NPAs.
Exhibit 5: NIMs improving at scorching pace led by decline in cost Exhibit 6: Strong loan growth…
10
12
14
16
18
20
22
24
0.0
0.5
1.0
1.5
2.0
2.5
3.0
3.5
Q3FY08
Q4FY08
Q1FY09
Q2FY09
Q3FY09
Q4FY09
Q1FY10
Q2FY10
Q3FY10
%
NIMs (LHS) CASA ratio (RHS)
0
20
40
60
80
100
120
0.0
5.0
10.0
15.0
20.0
25.0
30.0
35.0
Q3FY08
Q4FY08
Q1FY09
Q2FY09
Q3FY09
Q4FY09
Q1FY10
Q2FY10
Q3FY10
%
Loan growth (LHS) NII growth (RHS)
Source: Company, Networth Research Source: Company, Networth Research
Exhibit 7: Better income and cost efficiency driven robust PAT growth Exhibit 8: GNPAs coming down…
0
100
200
300
400
500
600
700
800
900
1000
Q3FY08
Q4FY08
Q1FY09
Q2FY09
Q3FY09
Q4FY09
Q1FY10
Q2FY10
Q3FY10
Rs mn
0.0
0.5
1.0
1.5
2.0
2.5
3.0
3.5
Q3FY08
Q4FY08
Q1FY09
Q2FY09
Q3FY09
Q4FY09
Q1FY10
Q2FY10
Q3FY10
%
Source: Company, Networth Research Source: Company, Networth Research
4 IndusInd Bank
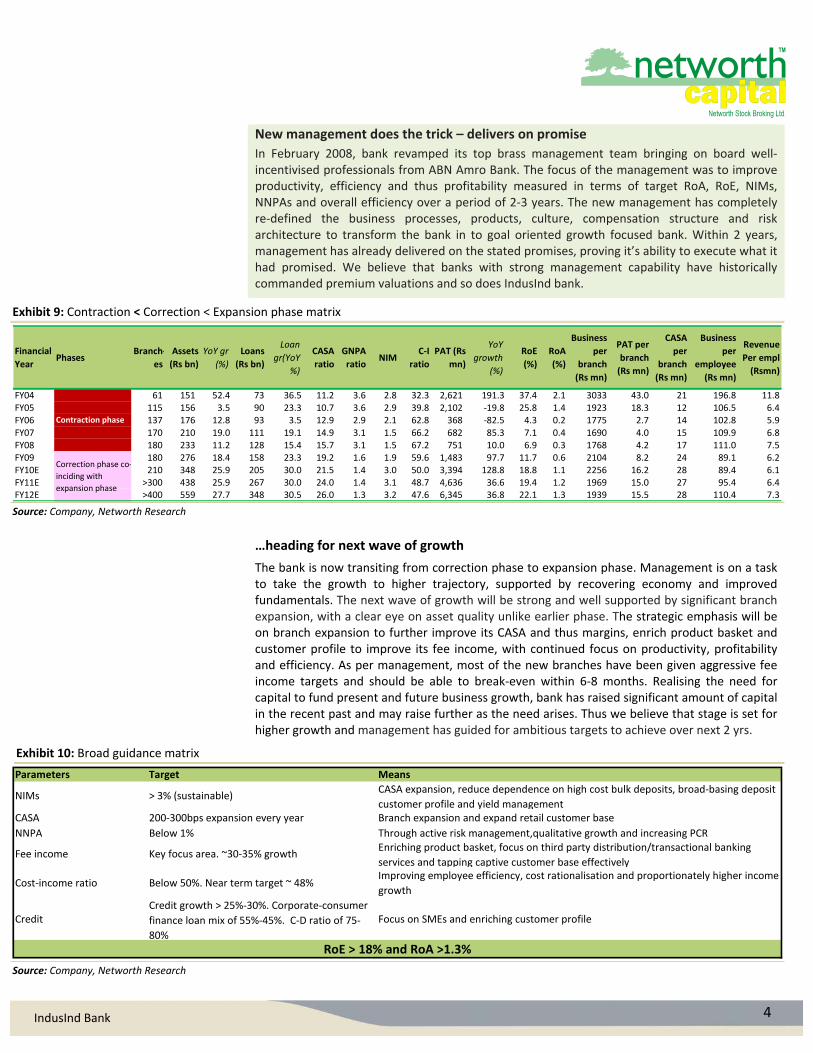
New management does the trick – delivers on promise
In February 2008, bank revamped its top brass management team bringing on board well‐incentivised professionals from ABN Amro Bank. The focus of the management was to improve productivity, efficiency and thus profitability measured in terms of target RoA, RoE, NIMs, NNPAs and overall efficiency over a period of 2‐3 years. The new management has completely re‐defined the business processes, products, culture, compensation structure and risk architecture to transform the bank in to goal oriented growth focused bank. Within 2 years, management has already delivered on the stated promises, proving it’s ability to execute what it had promised. We believe that banks with strong management capability have historically commanded premium valuations and so does IndusInd bank.
Exhibit 9: Contraction < Correction < Expansion phase matrix
Financial
YearPhases
Branch‐
es
Assets
(Rs bn)
YoY gr
(%)
Loans
(Rs bn)
Loan
gr(YoY
%)
CASA
ratio
GNPA
ratioNIM
C‐I
ratio
PAT (Rs
mn)
YoY
growth
(%)
RoE
(%)
RoA
(%)
Business
per
branch
(Rs mn)
PAT per
branch
(Rs mn)
CASA
per
branch
(Rs mn)
Business
per
employee
(Rs mn)
Revenue
Per empl
(Rsmn)
FY04 61 151 52.4 73 36.5 11.2 3.6 2.8 32.3 2,621 191.3 37.4 2.1 3033 43.0 21 196.8 11.8FY05 115 156 3.5 90 23.3 10.7 3.6 2.9 39.8 2,102 ‐19.8 25.8 1.4 1923 18.3 12 106.5 6.4FY06 137 176 12.8 93 3.5 12.9 2.9 2.1 62.8 368 ‐82.5 4.3 0.2 1775 2.7 14 102.8 5.9FY07 170 210 19.0 111 19.1 14.9 3.1 1.5 66.2 682 85.3 7.1 0.4 1690 4.0 15 109.9 6.8FY08 180 233 11.2 128 15.4 15.7 3.1 1.5 67.2 751 10.0 6.9 0.3 1768 4.2 17 111.0 7.5FY09 180 276 18.4 158 23.3 19.2 1.6 1.9 59.6 1,483 97.7 11.7 0.6 2104 8.2 24 89.1 6.2FY10E 210 348 25.9 205 30.0 21.5 1.4 3.0 50.0 3,394 128.8 18.8 1.1 2256 16.2 28 89.4 6.1FY11E >300 438 25.9 267 30.0 24.0 1.4 3.1 48.7 4,636 36.6 19.4 1.2 1969 15.0 27 95.4 6.4FY12E >400 559 27.7 348 30.5 26.0 1.3 3.2 47.6 6,345 36.8 22.1 1.3 1939 15.5 28 110.4 7.3
Contraction phase
Correction phase co‐
inciding with
expansion phase
Source: Company, Networth Research
…heading for next wave of growth
The bank is now transiting from correction phase to expansion phase. Management is on a task to take the growth to higher trajectory, supported by recovering economy and improved fundamentals. The next wave of growth will be strong and well supported by significant branch expansion, with a clear eye on asset quality unlike earlier phase. The strategic emphasis will be on branch expansion to further improve its CASA and thus margins, enrich product basket and customer profile to improve its fee income, with continued focus on productivity, profitability and efficiency. As per management, most of the new branches have been given aggressive fee income targets and should be able to break‐even within 6‐8 months. Realising the need for capital to fund present and future business growth, bank has raised significant amount of capital in the recent past and may raise further as the need arises. Thus we believe that stage is set for higher growth and management has guided for ambitious targets to achieve over next 2 yrs.
Exhibit 10: Broad guidance matrix
Parameters Target Means
NIMs > 3% (sustainable)CASA expansion, reduce dependence on high cost bulk deposits, broad‐basing deposit
customer profile and yield managementCASA 200‐300bps expansion every year Branch expansion and expand retail customer base
NNPA Below 1% Through active risk management,qualitative growth and increasing PCR
Fee income Key focus area. ~30‐35% growthEnriching product basket, focus on third party distribution/transactional banking
services and tapping captive customer base effectively
Cost‐income ratio Below 50%. Near term target ~ 48%Improving employee efficiency, cost rationalisation and proportionately higher income
growth
Credit Credit growth > 25%‐30%. Corporate‐consumer
finance loan mix of 55%‐45%. C‐D ratio of 75‐
80%
Focus on SMEs and enriching customer profile
RoE > 18% and RoA >1.3% Source: Company, Networth Research
5 IndusInd Bank
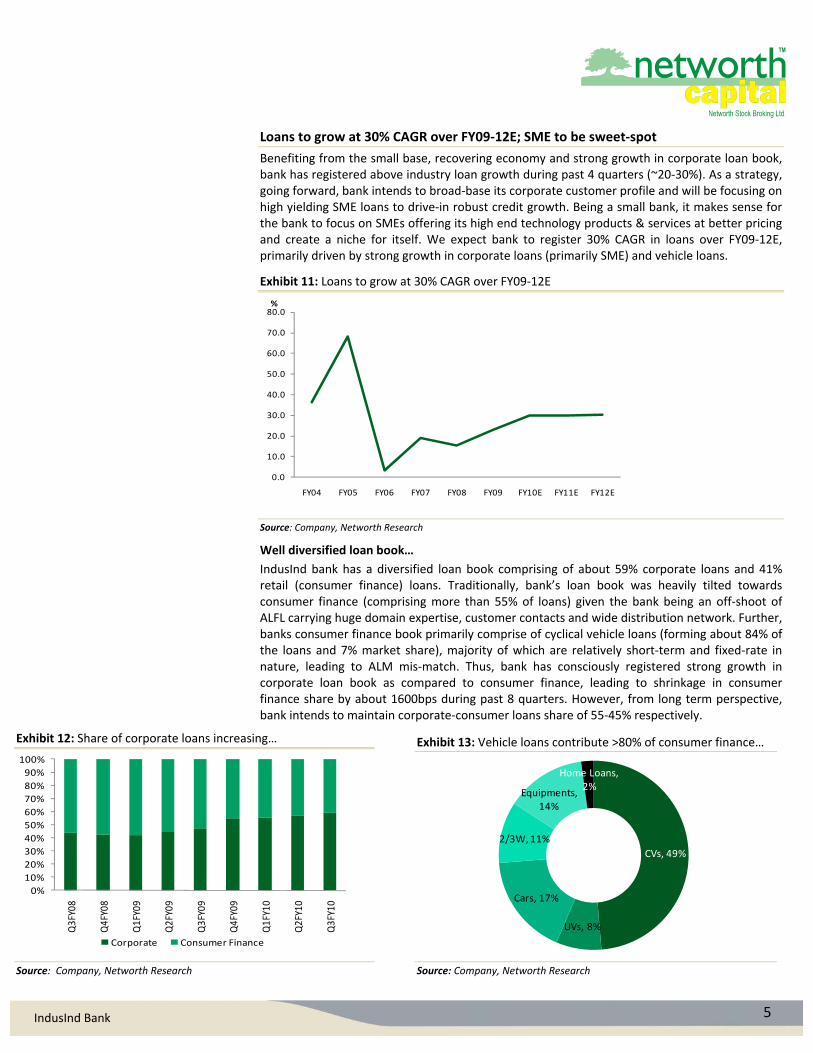
Loans to grow at 30% CAGR over FY09‐12E; SME to be sweet‐spot
Benefiting from the small base, recovering economy and strong growth in corporate loan book, bank has registered above industry loan growth during past 4 quarters (~20‐30%). As a strategy, going forward, bank intends to broad‐base its corporate customer profile and will be focusing on high yielding SME loans to drive‐in robust credit growth. Being a small bank, it makes sense for the bank to focus on SMEs offering its high end technology products & services at better pricing and create a niche for itself. We expect bank to register 30% CAGR in loans over FY09‐12E, primarily driven by strong growth in corporate loans (primarily SME) and vehicle loans.
Exhibit 11: Loans to grow at 30% CAGR over FY09‐12E
0.0
10.0
20.0
30.0
40.0
50.0
60.0
70.0
80.0
FY04 FY05 FY06 FY07 FY08 FY09 FY10E FY11E FY12E
%
Source: Company, Networth Research
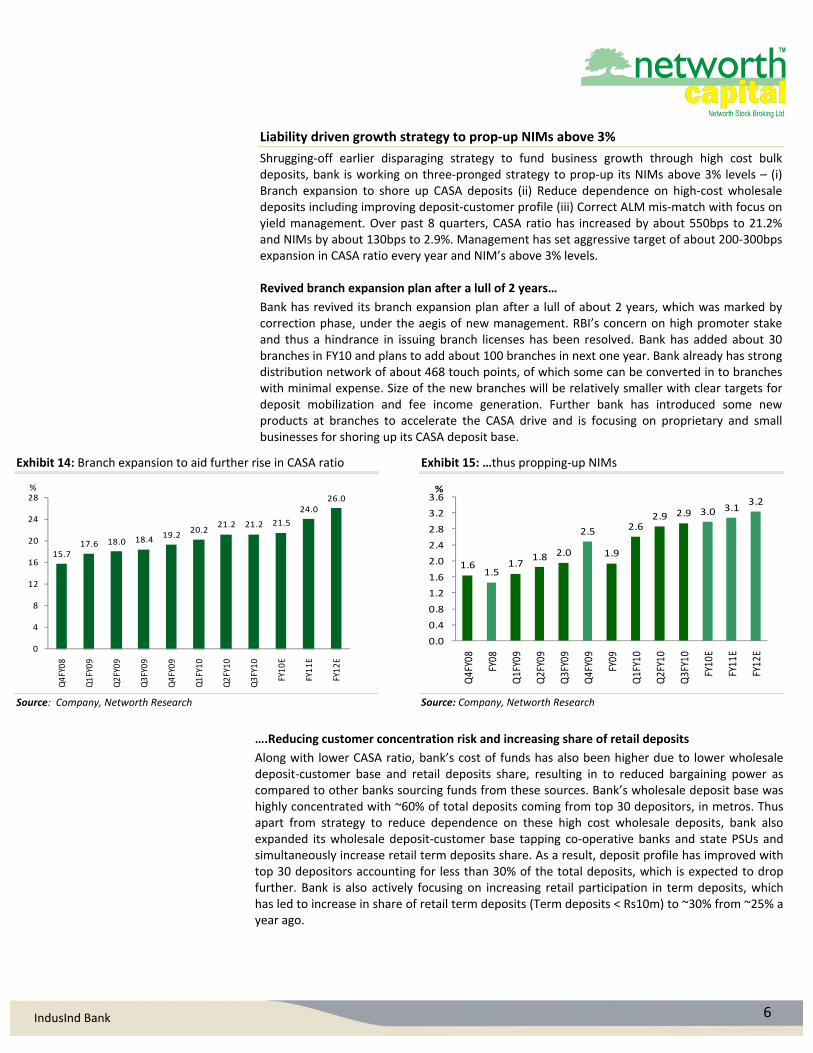
Well diversified loan book…
IndusInd bank has a diversified loan book comprising of about 59% corporate loans and 41% retail (consumer finance) loans. Traditionally, bank’s loan book was heavily tilted towards consumer finance (comprising more than 55% of loans) given the bank being an off‐shoot of ALFL carrying huge domain expertise, customer contacts and wide distribution network. Further, banks consumer finance book primarily comprise of cyclical vehicle loans (forming about 84% of the loans and 7% market share), majority of which are relatively short‐term and fixed‐rate in nature, leading to ALM mis‐match. Thus, bank has consciously registered strong growth in corporate loan book as compared to consumer finance, leading to shrinkage in consumer finance share by about 1600bps during past 8 quarters. However, from long term perspective, bank intends to maintain corporate‐consumer loans share of 55‐45% respectively.
Exhibit 12: Share of corporate loans increasing… Exhibit 13: Vehicle loans contribute >80% of consumer finance…
0%
10%
20%
30%
40%
50%
60%
70%
80%
90%
100%
Q3FY08
Q4FY08
Q1FY09
Q2FY09
Q3FY09
Q4FY09
Q1FY10
Q2FY10
Q3FY10
Corporate Consumer Finance
CVs, 49%
UVs, 8%
Cars, 17%
2/3W, 11%
Equipments, 14%
Home Loans, 2%
Source: Company, Networth Research Source: Company, Networth Research
6 IndusInd Bank
Liability driven growth strategy to prop‐up NIMs above 3%
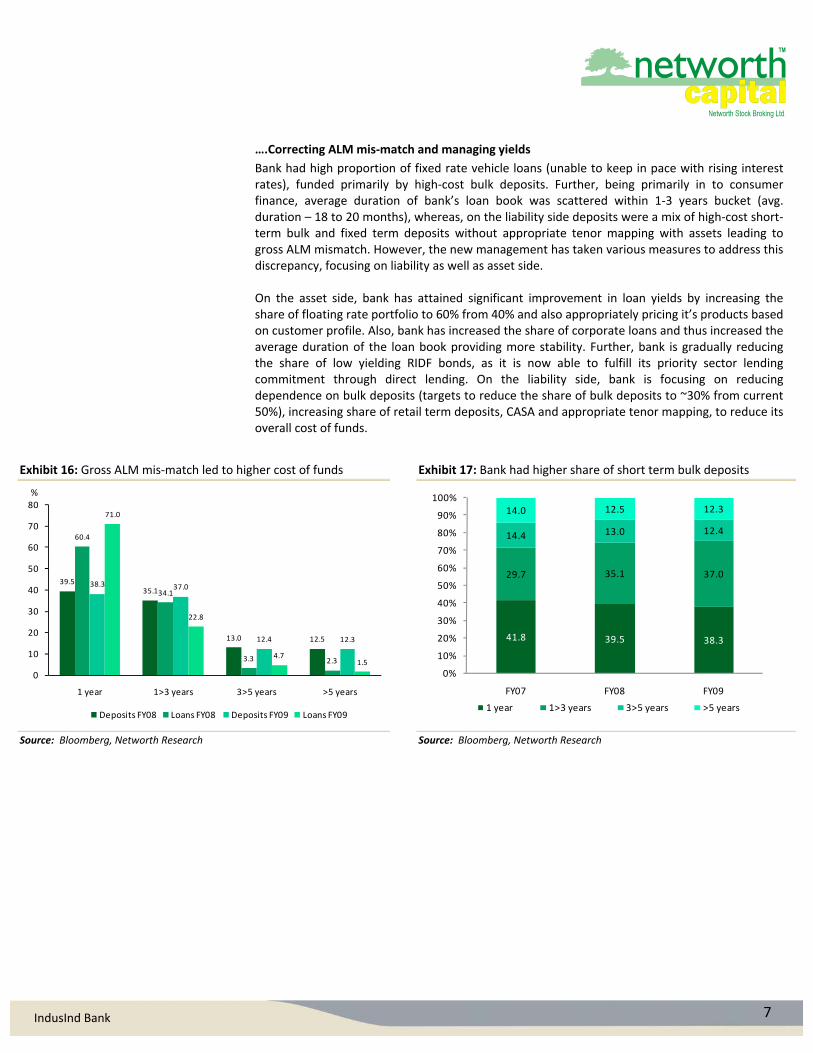
Shrugging‐off earlier disparaging strategy to fund business growth through high cost bulk deposits, bank is working on three‐pronged strategy to prop‐up its NIMs above 3% levels – (i) Branch expansion to shore up CASA deposits (ii) Reduce dependence on high‐cost wholesale deposits including improving deposit‐customer profile (iii) Correct ALM mis‐match with focus on yield management. Over past 8 quarters, CASA ratio has increased by about 550bps to 21.2% and NIMs by about 130bps to 2.9%. Management has set aggressive target of about 200‐300bps expansion in CASA ratio every year and NIM’s above 3% levels. Revived branch expansion plan after a lull of 2 years…
Bank has revived its branch expansion plan after a lull of about 2 years, which was marked by correction phase, under the aegis of new management. RBI’s concern on high promoter stake and thus a hindrance in issuing branch licenses has been resolved. Bank has added about 30 branches in FY10 and plans to add about 100 branches in next one year. Bank already has strong distribution network of about 468 touch points, of which some can be converted in to branches with minimal expense. Size of the new branches will be relatively smaller with clear targets for deposit mobilization and fee income generation. Further bank has introduced some new products at branches to accelerate the CASA drive and is focusing on proprietary and small businesses for shoring up its CASA deposit base.
Exhibit 14: Branch expansion to aid further rise in CASA ratio Exhibit 15: …thus propping‐up NIMs
15.717.6 18.0 18.4
19.220.2
21.2 21.2 21.5
24.026.0
0
4
8
12
16
20
24
28
Q4FY08
Q1FY09
Q2FY09
Q3FY09
Q4FY09
Q1FY10
Q2FY10
Q3FY10
FY10E
FY11E
FY12E
%
1.61.5
1.71.8 2.0
2.5
1.9
2.62.9 2.9 3.0 3.1
3.2
0.0
0.4
0.8
1.2
1.6
2.0
2.4
2.8
3.2
3.6
Q4FY08
FY08
Q1FY09
Q2FY09
Q3FY09
Q4FY09
FY09
Q1FY10
Q2FY10
Q3FY10
FY10
E
FY11
E
FY12
E
%
Source: Company, Networth Research Source: Company, Networth Research
….Reducing customer concentration risk and increasing share of retail deposits
Along with lower CASA ratio, bank’s cost of funds has also been higher due to lower wholesale deposit‐customer base and retail deposits share, resulting in to reduced bargaining power as compared to other banks sourcing funds from these sources. Bank’s wholesale deposit base was highly concentrated with ~60% of total deposits coming from top 30 depositors, in metros. Thus apart from strategy to reduce dependence on these high cost wholesale deposits, bank also expanded its wholesale deposit‐customer base tapping co‐operative banks and state PSUs and simultaneously increase retail term deposits share. As a result, deposit profile has improved with top 30 depositors accounting for less than 30% of the total deposits, which is expected to drop further. Bank is also actively focusing on increasing retail participation in term deposits, which has led to increase in share of retail term deposits (Term deposits < Rs10m) to ~30% from ~25% a year ago.
7 IndusInd Bank
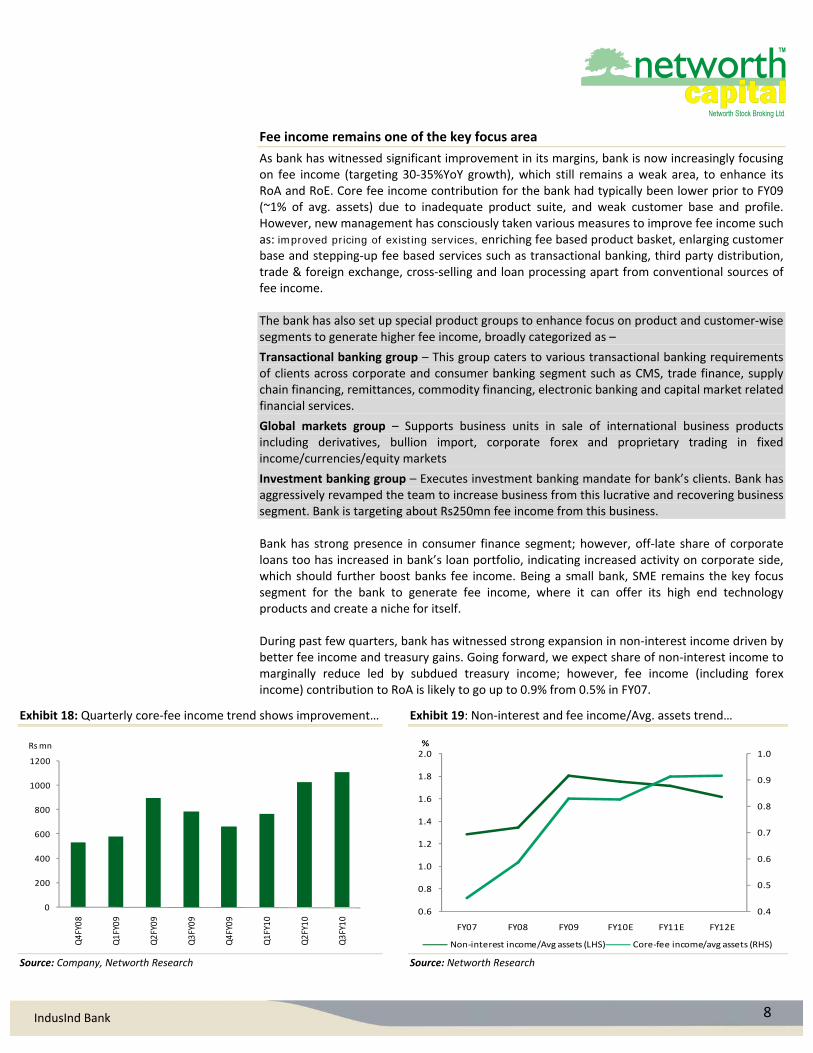
….Correcting ALM mis‐match and managing yields
Bank had high proportion of fixed rate vehicle loans (unable to keep in pace with rising interest rates), funded primarily by high‐cost bulk deposits. Further, being primarily in to consumer finance, average duration of bank’s loan book was scattered within 1‐3 years bucket (avg. duration – 18 to 20 months), whereas, on the liability side deposits were a mix of high‐cost short‐term bulk and fixed term deposits without appropriate tenor mapping with assets leading to gross ALM mismatch. However, the new management has taken various measures to address this discrepancy, focusing on liability as well as asset side. On the asset side, bank has attained significant improvement in loan yields by increasing the share of floating rate portfolio to 60% from 40% and also appropriately pricing it’s products based on customer profile. Also, bank has increased the share of corporate loans and thus increased the average duration of the loan book providing more stability. Further, bank is gradually reducing the share of low yielding RIDF bonds, as it is now able to fulfill its priority sector lending commitment through direct lending. On the liability side, bank is focusing on reducing dependence on bulk deposits (targets to reduce the share of bulk deposits to ~30% from current 50%), increasing share of retail term deposits, CASA and appropriate tenor mapping, to reduce its overall cost of funds.
Exhibit 16: Gross ALM mis‐match led to higher cost of funds Exhibit 17: Bank had higher share of short term bulk deposits
39.535.1
13.0 12.5
60.4
34.1
3.3 2.3
38.3 37.0
12.4 12.3
71.0
22.8
4.71.5
0
10
20
30
40
50
60
70
80
1 year 1>3 years 3>5 years >5 years
%
Deposits FY08 Loans FY08 Deposits FY09 Loans FY09
41.8 39.5 38.3
29.7 35.1 37.0
14.4 13.0 12.4
14.0 12.5 12.3
0%
10%
20%
30%
40%
50%
60%
70%
80%
90%
100%
FY07 FY08 FY09
1 year 1>3 years 3>5 years >5 years
Source: Bloomberg, Networth Research Source: Bloomberg, Networth Research
8 IndusInd Bank
Fee income remains one of the key focus area
As bank has witnessed significant improvement in its margins, bank is now increasingly focusing on fee income (targeting 30‐35%YoY growth), which still remains a weak area, to enhance its RoA and RoE. Core fee income contribution for the bank had typically been lower prior to FY09 (~1% of avg. assets) due to inadequate product suite, and weak customer base and profile. However, new management has consciously taken various measures to improve fee income such as: improved pricing of existing services, enriching fee based product basket, enlarging customer base and stepping‐up fee based services such as transactional banking, third party distribution, trade & foreign exchange, cross‐selling and loan processing apart from conventional sources of fee income. The bank has also set up special product groups to enhance focus on product and customer‐wise segments to generate higher fee income, broadly categorized as –
Transactional banking group – This group caters to various transactional banking requirements of clients across corporate and consumer banking segment such as CMS, trade finance, supply chain financing, remittances, commodity financing, electronic banking and capital market related financial services.
Global markets group – Supports business units in sale of international business products including derivatives, bullion import, corporate forex and proprietary trading in fixed income/currencies/equity markets
Investment banking group – Executes investment banking mandate for bank’s clients. Bank has aggressively revamped the team to increase business from this lucrative and recovering business segment. Bank is targeting about Rs250mn fee income from this business. Bank has strong presence in consumer finance segment; however, off‐late share of corporate loans too has increased in bank’s loan portfolio, indicating increased activity on corporate side, which should further boost banks fee income. Being a small bank, SME remains the key focus segment for the bank to generate fee income, where it can offer its high end technology products and create a niche for itself. During past few quarters, bank has witnessed strong expansion in non‐interest income driven by better fee income and treasury gains. Going forward, we expect share of non‐interest income to marginally reduce led by subdued treasury income; however, fee income (including forex income) contribution to RoA is likely to go up to 0.9% from 0.5% in FY07.
Exhibit 18: Quarterly core‐fee income trend shows improvement… Exhibit 19: Non‐interest and fee income/Avg. assets trend…
0
200
400
600
800
1000
1200
Q4FY08
Q1FY09
Q2FY09
Q3FY09
Q4FY09
Q1FY10
Q2FY10
Q3FY10
Rs mn
0.4
0.5
0.6
0.7
0.8
0.9
1.0
0.6
0.8
1.0
1.2
1.4
1.6
1.8
2.0
FY07 FY08 FY09 FY10E FY11E FY12E
%
Non‐interest income/Avg assets (LHS) Core‐fee income/avg assets (RHS)
Source: Company, Networth Research Source: Networth Research

9 IndusInd Bank
Cost likely to rise, but improved efficiency and income to keep C‐I ratio in check
In its earlier avatar, bank had elevated cost structure with very high cost‐income ratio at about 67% in FY08, due to significant operational inefficiencies coupled with lower income. However, bank has taken various corrective steps to improve operational efficiencies such as centralization of some significant operations, optimal leveraging of network, better supervisory architecture, performance linked incentives and replenishing work force to meet the requirements of transformed organization. Bank has also improved its technology backbone to ensure faster processing without much human effort at relatively lower cost. This has resulted in significant reduction in banks C‐I ratio to about 60% in FY09 and 51% for 9mFY10, despite nearly doubling its work force during this period.
Bank is envisaging significant branch and business expansion ahead, which we believe will put upward pressure on the cost. However, bank has set aggressive target of bringing down C‐I ratio below 50% through cost rationalisation and generating higher revenues.
Exhibit 20: Cost as well as income to rise… Exhibit 21: Cost‐income ratio to fall below 50%...
0.0
10.0
20.0
30.0
40.0
50.0
60.0
FY07 FY08 FY09 FY10E FY11E FY12E
%
Net income growth Opex growth
30.0
35.0
40.0
45.0
50.0
55.0
60.0
65.0
70.0
75.0
80.0
FY07 FY08 FY09 FY10E FY11E FY12E
%
Source: Company, Networth Research Source: Company, Networth Research
10 IndusInd Bank
Asset quality to be under‐tight control
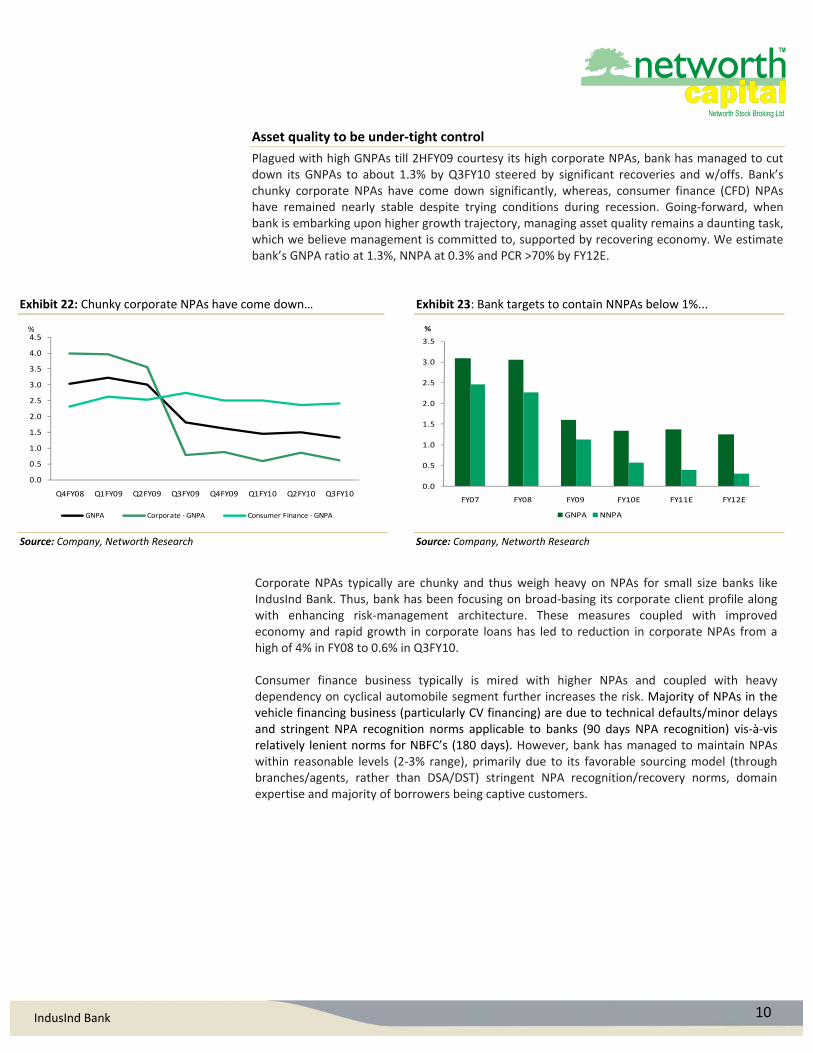
Plagued with high GNPAs till 2HFY09 courtesy its high corporate NPAs, bank has managed to cut down its GNPAs to about 1.3% by Q3FY10 steered by significant recoveries and w/offs. Bank’s chunky corporate NPAs have come down significantly, whereas, consumer finance (CFD) NPAs have remained nearly stable despite trying conditions during recession. Going‐forward, when bank is embarking upon higher growth trajectory, managing asset quality remains a daunting task, which we believe management is committed to, supported by recovering economy. We estimate bank’s GNPA ratio at 1.3%, NNPA at 0.3% and PCR >70% by FY12E.
Exhibit 22: Chunky corporate NPAs have come down… Exhibit 23: Bank targets to contain NNPAs below 1%...
0.0
0.5
1.0
1.5
2.0
2.5
3.0
3.5
4.0
4.5
Q4FY08 Q1FY09 Q2FY09 Q3FY09 Q4FY09 Q1FY10 Q2FY10 Q3FY10
%
GNPA Corporate ‐ GNPA Consumer Finance ‐ GNPA
0.0
0.5
1.0
1.5
2.0
2.5
3.0
3.5
FY07 FY08 FY09 FY10E FY11E FY12E
%
GNPA NNPA
Source: Company, Networth Research Source: Company, Networth Research
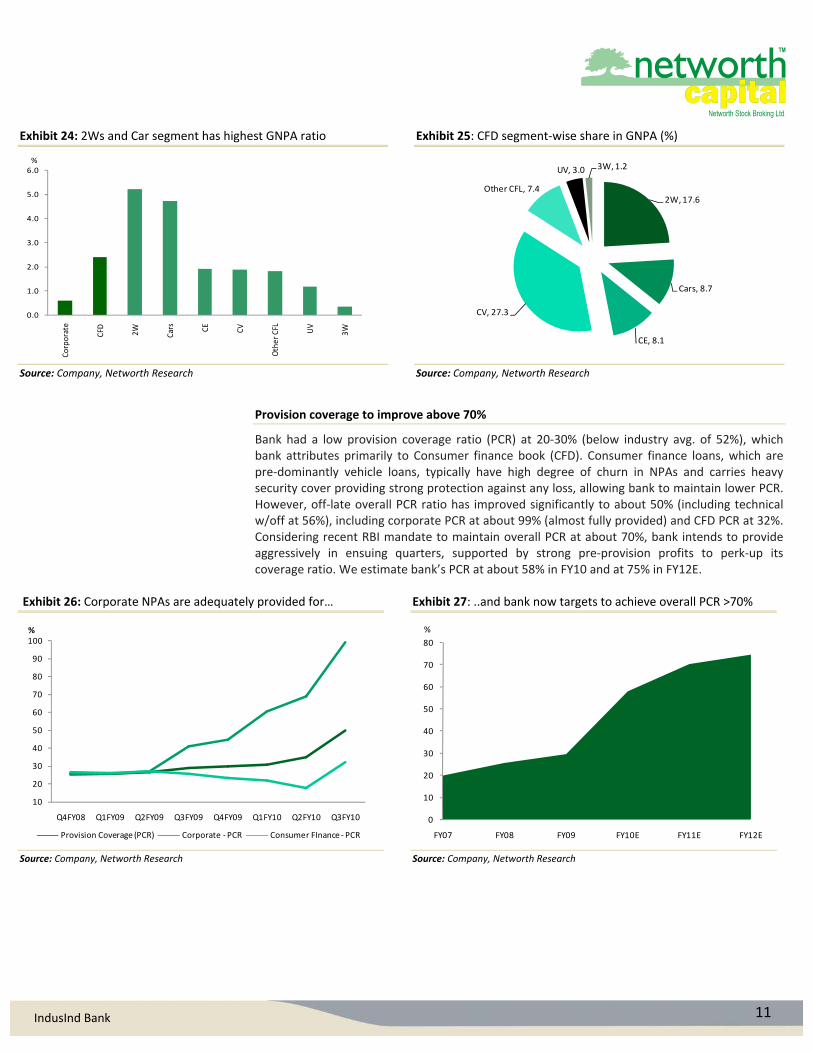
Corporate NPAs typically are chunky and thus weigh heavy on NPAs for small size banks like IndusInd Bank. Thus, bank has been focusing on broad‐basing its corporate client profile along with enhancing risk‐management architecture. These measures coupled with improved economy and rapid growth in corporate loans has led to reduction in corporate NPAs from a high of 4% in FY08 to 0.6% in Q3FY10. Consumer finance business typically is mired with higher NPAs and coupled with heavy dependency on cyclical automobile segment further increases the risk. Majority of NPAs in the vehicle financing business (particularly CV financing) are due to technical defaults/minor delays and stringent NPA recognition norms applicable to banks (90 days NPA recognition) vis‐à‐vis relatively lenient norms for NBFC’s (180 days). However, bank has managed to maintain NPAs within reasonable levels (2‐3% range), primarily due to its favorable sourcing model (through branches/agents, rather than DSA/DST) stringent NPA recognition/recovery norms, domain expertise and majority of borrowers being captive customers.
11 IndusInd Bank
Exhibit 24: 2Ws and Car segment has highest GNPA ratio Exhibit 25: CFD segment‐wise share in GNPA (%)
0.0
1.0
2.0
3.0
4.0
5.0
6.0
Corporate
CFD 2W Cars CE
CV
Other CFL
UV
3W
%
2W, 17.6
Cars, 8.7
CE, 8.1
CV, 27.3
Other CFL, 7.4
UV, 3.0 3W, 1.2
Source: Company, Networth Research Source: Company, Networth Research
Provision coverage to improve above 70%
Bank had a low provision coverage ratio (PCR) at 20‐30% (below industry avg. of 52%), which bank attributes primarily to Consumer finance book (CFD). Consumer finance loans, which are pre‐dominantly vehicle loans, typically have high degree of churn in NPAs and carries heavy security cover providing strong protection against any loss, allowing bank to maintain lower PCR. However, off‐late overall PCR ratio has improved significantly to about 50% (including technical w/off at 56%), including corporate PCR at about 99% (almost fully provided) and CFD PCR at 32%. Considering recent RBI mandate to maintain overall PCR at about 70%, bank intends to provide aggressively in ensuing quarters, supported by strong pre‐provision profits to perk‐up its coverage ratio. We estimate bank’s PCR at about 58% in FY10 and at 75% in FY12E.
Exhibit 26: Corporate NPAs are adequately provided for… Exhibit 27: ..and bank now targets to achieve overall PCR >70%
10
20
30
40
50
60
70
80
90
100
Q4FY08 Q1FY09 Q2FY09 Q3FY09 Q4FY09 Q1FY10 Q2FY10 Q3FY10
%
Provision Coverage (PCR) Corporate ‐PCR Consumer FInance ‐PCR
0
10
20
30
40
50
60
70
80
FY07 FY08 FY09 FY10E FY11E FY12E
%
Source: Company, Networth Research Source: Company, Networth Research
12 IndusInd Bank
Expect strong expansion in return ratios
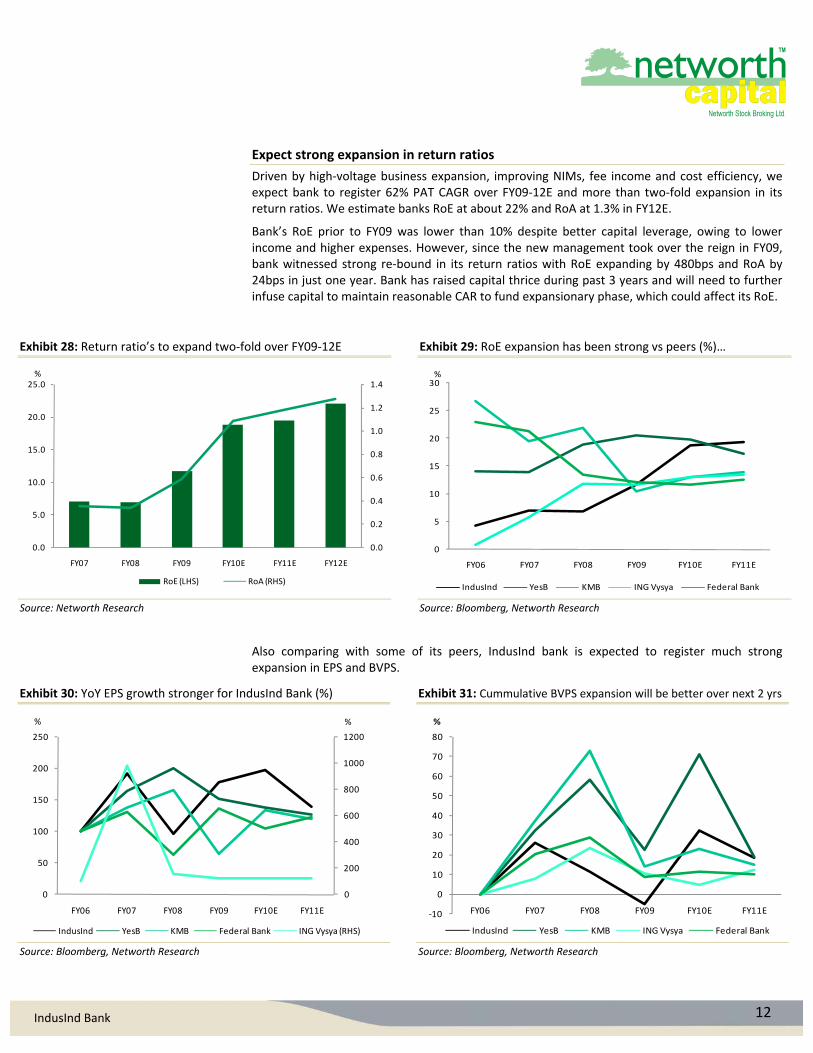
Driven by high‐voltage business expansion, improving NIMs, fee income and cost efficiency, we expect bank to register 62% PAT CAGR over FY09‐12E and more than two‐fold expansion in its return ratios. We estimate banks RoE at about 22% and RoA at 1.3% in FY12E.
Bank’s RoE prior to FY09 was lower than 10% despite better capital leverage, owing to lower income and higher expenses. However, since the new management took over the reign in FY09, bank witnessed strong re‐bound in its return ratios with RoE expanding by 480bps and RoA by 24bps in just one year. Bank has raised capital thrice during past 3 years and will need to further infuse capital to maintain reasonable CAR to fund expansionary phase, which could affect its RoE.
Exhibit 28: Return ratio’s to expand two‐fold over FY09‐12E Exhibit 29: RoE expansion has been strong vs peers (%)…
0.0
0.2
0.4
0.6
0.8
1.0
1.2
1.4
0.0
5.0
10.0
15.0
20.0
25.0
FY07 FY08 FY09 FY10E FY11E FY12E
%
RoE (LHS) RoA (RHS)
0
5
10
15
20
25
30
FY06 FY07 FY08 FY09 FY10E FY11E
%
IndusInd YesB KMB ING Vysya Federal Bank
Source: Networth Research Source: Bloomberg, Networth Research
Also comparing with some of its peers, IndusInd bank is expected to register much strong expansion in EPS and BVPS.
Exhibit 30: YoY EPS growth stronger for IndusInd Bank (%) Exhibit 31: Cummulative BVPS expansion will be better over next 2 yrs
0
200
400
600
800
1000
1200
0
50
100
150
200
250
FY06 FY07 FY08 FY09 FY10E FY11E
%%
IndusInd YesB KMB Federal Bank ING Vysya (RHS)
‐10
0
10
20
30
40
50
60
70
80
FY06 FY07 FY08 FY09 FY10E FY11E
%
IndusInd YesB KMB ING Vysya Federal Bank
Source: Bloomberg, Networth Research Source: Bloomberg, Networth Research
13 IndusInd Bank
Valuation Analysis
Growth‐stage bank commands premium valuation; buy with TP of Rs202
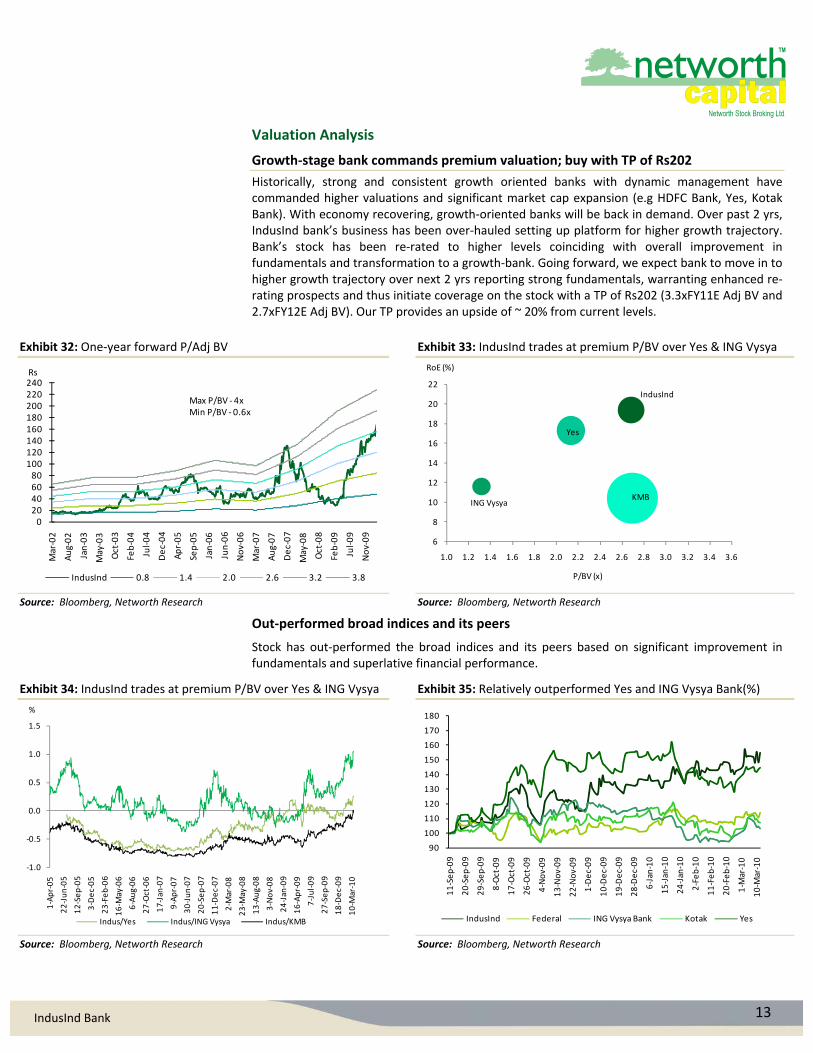
Historically, strong and consistent growth oriented banks with dynamic management have commanded higher valuations and significant market cap expansion (e.g HDFC Bank, Yes, Kotak Bank). With economy recovering, growth‐oriented banks will be back in demand. Over past 2 yrs, IndusInd bank’s business has been over‐hauled setting up platform for higher growth trajectory. Bank’s stock has been re‐rated to higher levels coinciding with overall improvement in fundamentals and transformation to a growth‐bank. Going forward, we expect bank to move in to higher growth trajectory over next 2 yrs reporting strong fundamentals, warranting enhanced re‐rating prospects and thus initiate coverage on the stock with a TP of Rs202 (3.3xFY11E Adj BV and 2.7xFY12E Adj BV). Our TP provides an upside of ~ 20% from current levels.
Exhibit 32: One‐year forward P/Adj BV Exhibit 33: IndusInd trades at premium P/BV over Yes & ING Vysya
020406080
100120140160180200220240
Mar‐02
Aug‐02
Jan‐03
May‐03
Oct‐03
Feb‐04
Jul‐04
Dec‐04
Apr‐05
Sep‐05
Jan‐06
Jun‐06
Nov‐06
Mar‐07
Aug‐07
Dec‐07
May‐08
Oct‐08
Feb‐09
Jul‐09
Nov‐09
Rs
IndusInd 0.8 1.4 2.0 2.6 3.2 3.8
Max P/BV ‐4xMin P/BV ‐0.6x
IndusInd
ING Vysya
Yes
KMB
6
8
10
12
14
16
18
20
22
1.0 1.2 1.4 1.6 1.8 2.0 2.2 2.4 2.6 2.8 3.0 3.2 3.4 3.6
RoE (%)
P/BV (x)
Source: Bloomberg, Networth Research Source: Bloomberg, Networth Research
Out‐performed broad indices and its peers
Stock has out‐performed the broad indices and its peers based on significant improvement in fundamentals and superlative financial performance.
Exhibit 34: IndusInd trades at premium P/BV over Yes & ING Vysya Exhibit 35: Relatively outperformed Yes and ING Vysya Bank(%)
‐1.0
‐0.5
0.0
0.5
1.0
1.5
1‐Apr‐05
22‐Jun‐05
12‐Sep‐05
3‐Dec‐05
23‐Feb‐06
16‐M
ay‐06
6‐Aug‐06
27‐Oct‐06
17‐Jan
‐07
9‐Apr‐07
30‐Jun‐07
20‐Sep‐07
11‐Dec‐07
2‐M
ar‐08
23‐M
ay‐08
13‐Aug‐08
3‐Nov‐08
24‐Jan
‐09
16‐Apr‐09
7‐Jul‐09
27‐Sep‐09
18‐Dec‐09
10‐M
ar‐10
%
Indus/Yes Indus/ING Vysya Indus/KMB
90
100
110
120
130
140
150
160
170
180
11‐Sep‐09
20‐Sep‐09
29‐Sep‐09
8‐Oct‐09
17‐Oct‐09
26‐Oct‐09
4‐Nov‐09
13‐Nov‐09
22‐Nov‐09
1‐Dec‐09
10‐Dec‐09
19‐Dec‐09
28‐Dec‐09
6‐Jan
‐10
15‐Jan
‐10
24‐Jan
‐10
2‐Feb‐10
11‐Feb‐10
20‐Feb‐10
1‐M
ar‐10
10‐M
ar‐10
IndusInd Federal ING Vysya Bank Kotak Yes
Source: Bloomberg, Networth Research Source: Bloomberg, Networth Research
14 IndusInd Bank
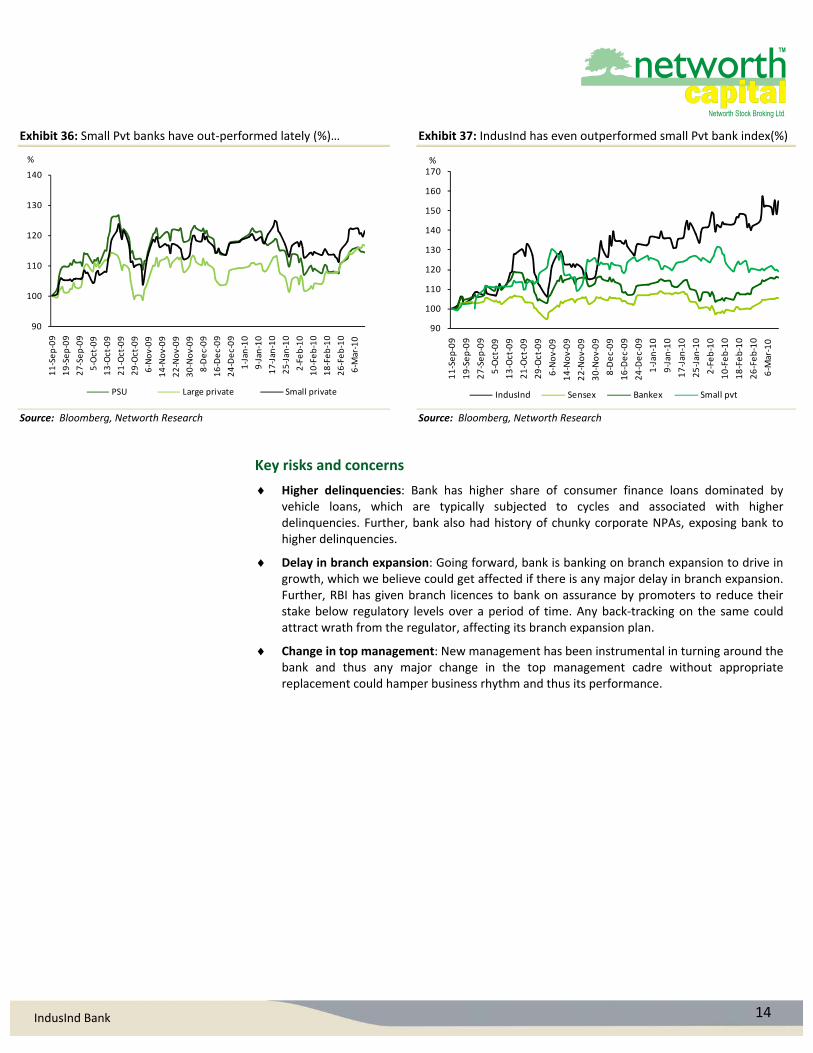
Exhibit 36: Small Pvt banks have out‐performed lately (%)… Exhibit 37: IndusInd has even outperformed small Pvt bank index(%)
90
100
110
120
130
140
11‐Sep‐09
19‐Sep‐09
27‐Sep‐09
5‐Oct‐09
13‐Oct‐09
21‐Oct‐09
29‐Oct‐09
6‐Nov‐09
14‐Nov‐09
22‐Nov‐09
30‐Nov‐09
8‐Dec‐09
16‐Dec‐09
24‐Dec‐09
1‐Jan
‐10
9‐Jan
‐10
17‐Jan
‐10
25‐Jan
‐10
2‐Feb‐10
10‐Feb‐10
18‐Feb‐10
26‐Feb‐10
6‐M
ar‐10
%
PSU Large private Small private
90
100
110
120
130
140
150
160
170
11‐Sep‐09
19‐Sep‐09
27‐Sep‐09
5‐Oct‐09
13‐Oct‐09
21‐Oct‐09
29‐Oct‐09
6‐Nov‐09
14‐Nov‐09
22‐Nov‐09
30‐Nov‐09
8‐Dec‐09
16‐Dec‐09
24‐Dec‐09
1‐Jan
‐10
9‐Jan
‐10
17‐Jan
‐10
25‐Jan
‐10
2‐Feb‐10
10‐Feb‐10
18‐Feb‐10
26‐Feb‐10
6‐M
ar‐10
%
IndusInd Sensex Bankex Small pvt
Source: Bloomberg, Networth Research Source: Bloomberg, Networth Research
Key risks and concerns
Higher delinquencies: Bank has higher share of consumer finance loans dominated by vehicle loans, which are typically subjected to cycles and associated with higher delinquencies. Further, bank also had history of chunky corporate NPAs, exposing bank to higher delinquencies.
Delay in branch expansion: Going forward, bank is banking on branch expansion to drive in growth, which we believe could get affected if there is any major delay in branch expansion. Further, RBI has given branch licences to bank on assurance by promoters to reduce their stake below regulatory levels over a period of time. Any back‐tracking on the same could attract wrath from the regulator, affecting its branch expansion plan.
Change in top management: New management has been instrumental in turning around the bank and thus any major change in the top management cadre without appropriate replacement could hamper business rhythm and thus its performance.
15 IndusInd Bank
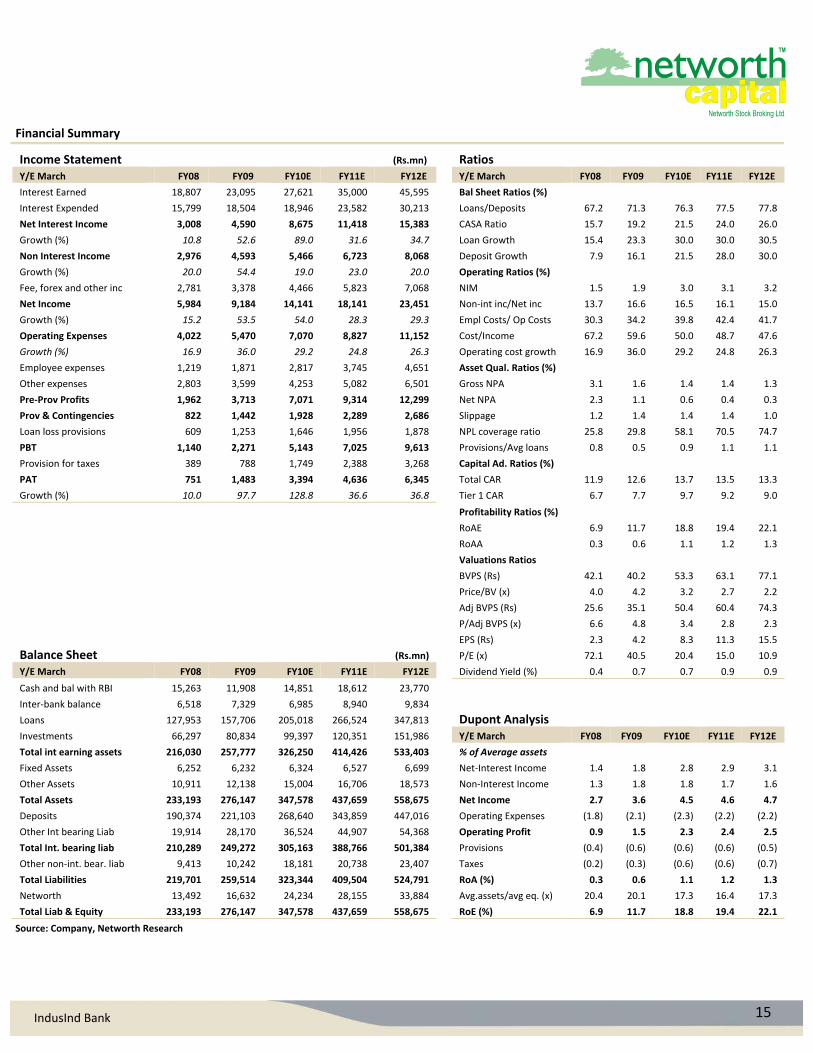
Financial Summary
Income Statement (Rs.mn) Ratios
Y/E March FY08 FY09 FY10E FY11E FY12E Y/E March FY08 FY09 FY10E FY11E FY12E
Interest Earned 18,807 23,095 27,621 35,000 45,595 Bal Sheet Ratios (%)
Interest Expended 15,799 18,504 18,946 23,582 30,213 Loans/Deposits 67.2 71.3 76.3 77.5 77.8
Net Interest Income 3,008 4,590 8,675 11,418 15,383 CASA Ratio 15.7 19.2 21.5 24.0 26.0
Growth (%) 10.8 52.6 89.0 31.6 34.7 Loan Growth 15.4 23.3 30.0 30.0 30.5
Non Interest Income 2,976 4,593 5,466 6,723 8,068 Deposit Growth 7.9 16.1 21.5 28.0 30.0
Growth (%) 20.0 54.4 19.0 23.0 20.0 Operating Ratios (%)
Fee, forex and other inc 2,781 3,378 4,466 5,823 7,068 NIM 1.5 1.9 3.0 3.1 3.2
Net Income 5,984 9,184 14,141 18,141 23,451 Non‐int inc/Net inc 13.7 16.6 16.5 16.1 15.0
Growth (%) 15.2 53.5 54.0 28.3 29.3 Empl Costs/ Op Costs 30.3 34.2 39.8 42.4 41.7
Operating Expenses 4,022 5,470 7,070 8,827 11,152 Cost/Income 67.2 59.6 50.0 48.7 47.6
Growth (%) 16.9 36.0 29.2 24.8 26.3 Operating cost growth 16.9 36.0 29.2 24.8 26.3
Employee expenses 1,219 1,871 2,817 3,745 4,651 Asset Qual. Ratios (%)
Other expenses 2,803 3,599 4,253 5,082 6,501 Gross NPA 3.1 1.6 1.4 1.4 1.3
Pre‐Prov Profits 1,962 3,713 7,071 9,314 12,299 Net NPA 2.3 1.1 0.6 0.4 0.3
Prov & Contingencies 822 1,442 1,928 2,289 2,686 Slippage 1.2 1.4 1.4 1.4 1.0
Loan loss provisions 609 1,253 1,646 1,956 1,878 NPL coverage ratio 25.8 29.8 58.1 70.5 74.7
PBT 1,140 2,271 5,143 7,025 9,613 Provisions/Avg loans 0.8 0.5 0.9 1.1 1.1
Provision for taxes 389 788 1,749 2,388 3,268 Capital Ad. Ratios (%)
PAT 751 1,483 3,394 4,636 6,345 Total CAR 11.9 12.6 13.7 13.5 13.3
Growth (%) 10.0 97.7 128.8 36.6 36.8 Tier 1 CAR 6.7 7.7 9.7 9.2 9.0
Profitability Ratios (%)
RoAE 6.9 11.7 18.8 19.4 22.1
RoAA 0.3 0.6 1.1 1.2 1.3
Valuations Ratios
BVPS (Rs) 42.1 40.2 53.3 63.1 77.1
Price/BV (x) 4.0 4.2 3.2 2.7 2.2
Adj BVPS (Rs) 25.6 35.1 50.4 60.4 74.3
P/Adj BVPS (x) 6.6 4.8 3.4 2.8 2.3
EPS (Rs) 2.3 4.2 8.3 11.3 15.5
Balance Sheet (Rs.mn) P/E (x) 72.1 40.5 20.4 15.0 10.9
Y/E March FY08 FY09 FY10E FY11E FY12E Dividend Yield (%) 0.4 0.7 0.7 0.9 0.9
Cash and bal with RBI 15,263 11,908 14,851 18,612 23,770
Inter‐bank balance 6,518 7,329 6,985 8,940 9,834
Loans 127,953 157,706 205,018 266,524 347,813 Dupont Analysis
Investments 66,297 80,834 99,397 120,351 151,986 Y/E March FY08 FY09 FY10E FY11E FY12E
Total int earning assets 216,030 257,777 326,250 414,426 533,403 % of Average assets
Fixed Assets 6,252 6,232 6,324 6,527 6,699 Net‐Interest Income 1.4 1.8 2.8 2.9 3.1
Other Assets 10,911 12,138 15,004 16,706 18,573 Non‐Interest Income 1.3 1.8 1.8 1.7 1.6
Total Assets 233,193 276,147 347,578 437,659 558,675 Net Income 2.7 3.6 4.5 4.6 4.7
Deposits 190,374 221,103 268,640 343,859 447,016 Operating Expenses (1.8) (2.1) (2.3) (2.2) (2.2)
Other Int bearing Liab 19,914 28,170 36,524 44,907 54,368 Operating Profit 0.9 1.5 2.3 2.4 2.5
Total Int. bearing liab 210,289 249,272 305,163 388,766 501,384 Provisions (0.4) (0.6) (0.6) (0.6) (0.5)
Other non‐int. bear. liab 9,413 10,242 18,181 20,738 23,407 Taxes (0.2) (0.3) (0.6) (0.6) (0.7)
Total Liabilities 219,701 259,514 323,344 409,504 524,791 RoA (%) 0.3 0.6 1.1 1.2 1.3
Networth 13,492 16,632 24,234 28,155 33,884 Avg.assets/avg eq. (x) 20.4 20.1 17.3 16.4 17.3
Total Liab & Equity 233,193 276,147 347,578 437,659 558,675 RoE (%) 6.9 11.7 18.8 19.4 22.1
Source: Company, Networth Research
16 IndusInd Bank
Networth Research: E‐mail‐ [email protected]
Satish Pasari Head‐ Institutional Business [email protected] 022‐22823225/22840219
Institutional Research Team
Anand Dama Banking & Financial Services [email protected] 022‐30286391 Sanjeev Hota IT / Education [email protected] 022‐30286407 Ashwani Sharma Power / Capital Goods [email protected] 022‐30286389 Kanika Bihany Engineering / Capital Goods [email protected] 022‐39517618 Chintan Mehta Metals/mining [email protected] 022‐30281580
Derivative & Technical Team
Akshata Deshmukh Sr. Technical & Derivatives Analyst [email protected] 022‐39517632 Amol Shrivastava Derivatives Analyst [email protected] 022‐39517638
Quantitative Research
Shubha Aggarwal Research Analyst [email protected] 022‐30281580 Ritesh Jain Research Analyst [email protected] 022‐30281580
Networth Institutional Sales: E‐mail‐ [email protected]
Prakash Diwan Head‐Institutional Sales & Strategy [email protected] 022‐30286403/30286389 Nilesh Sangani AVP – Institutional Sales and Dealing [email protected] 022‐30286403/39517635 Shalaka Jadhav Sr. Manager ‐ Institutional Sales & Dealing [email protected] 022‐22840217/39517636
Key to NETWORTH Investment Rankings Buy: Upside by>15, Accumulate: Upside by +5 to 15, Hold: Upside/Downside by ‐5 to +5, Reduce: Downside by 5 to 15, Sell: Downside by>15
Disclaimer: This document has been prepared by Networth Stock Broking Ltd. (NSBL). NSBL is a full service, integrated investment banking, portfolio management and brokerage group. Our research analysts and sales persons provide important input into our investment banking activities. This document does not constitute an offer or solicitation for the purchase or sale of any financial instrument or as an official confirmation of any transaction. The information contained herein is from publicly available data or other sources believed to be reliable, but we do not represent that it is accurate or complete and it should not be relied on as such. NSBL or any of its affiliates shall not be in any way responsible for any loss or damage that may arise to any person from any inadvertent error in the information contained in this report. This document is provided for assistance only and is not intended to be and must not alone be taken as the basis for an investment decision. The user assumes the entire risk of any use made of this information. Each recipient of this document should make such investigation as it deems necessary to arrive at an independent evaluation of an investment in the securities of companies referred to in this document (including the merits and risks involved), and should consult his own advisors to determine the merits and risks of such investment. The investment discussed or views expressed may not be suitable for all investors. We and our affiliates, officers, directors, and employees may: (a) from time to time, have long or short positions in, and buy or sell the securities thereof, of company (ies) mentioned herein or (b) be engaged in any other transaction involving such securities and earn brokerage or other compensation or act as advisor or lender / borrower to such company (ies) or have other potential conflict of interest with respect to any recommendation and related information and opinions. This information is strictly confidential and is being furnished to you solely for your information. This information should not be reproduced or redistributed or passed on directly or indirectly in any form to any other person or published, copied, in whole or in part, for any purpose. This report is not directed or intended for distribution to, or use by, any person or entity who is a citizen or resident of or located in any locality, state, country or other jurisdiction, where such distribution, publication, availability or use would be contrary to law, regulation or which would subject NSBL and affiliates to any registration or licensing requirements within such jurisdiction. The distribution of this document in certain jurisdictions may be restricted by law, and persons in whose possession this document comes, should inform themselves about and observe, any such restrictions. The information given in this document is as of the date of this report and there can be no assurance that future results or events will be consistent with this information. This information is subject to change without any prior notice. NSBL reserves the right to make modifications and alterations to this statement as may be required from time to time. However, NSBL is under no obligation to update or keep the information current. Nevertheless, NSBL is committed to providing independent and transparent recommendation to its client and would be happy to provide any information in response to specific client queries. Neither NSBL nor any of its affiliates, directors, employees, agents or representatives shall be liable for any damages whether direct, indirect, special or consequential including lost revenue or lost profits that may arise from or in connection with the use of the information. The analyst for this report certifies that all of the views expressed in this report accurately reflect his or her personal views about the subject company or companies and its or their securities, and no part of his or her compensation was, is or will be, directly or indirectly related to specific recommendations or views expressed in this report. Analyst holding in stock: no.
Networth Stock Broking Ltd. (www.networthdirect.com)
Regd. Office:‐ 2nd Floor, D. C. Silk Mills Compound, Kondivita Road, Opp J.B. Nagar Market, Andheri (E), Mumbai ‐ 400059. Tel Phone nos.: 022 – 30641600
Corporate Office: ‐ 1/A/A, Ground Floor, Mittal Court, “A” Wing, 224, Nariman Point, Mumbai – 400021. Tel Phone nos.: 022 ‐ 30286389 Fax nos.: 022 ‐ 22836306