banking and climate-related risks, implications for
TRANSCRIPT

Staff memo
Banking and climate-related
risks, implications for financial
stability in Sweden
Cristina Cella
Financial Stability Department
May 2021
Abstract Cristina Cella
Senior Economist, Systemic Risk Division (SRD), Financial Stability Department
In this paper, using Credit Registry data (KRITA) and industry level CO₂ equivalent
emissions data from Statistic Sweden (SCB), I study how exposed the Swedish banking
system was to high-emission industries in 2020. Then, I investigate how much of this
exposure was represented by financially vulnerable firms defined as firms that, even
before the economic crisis in 2020, were struggling with paying the interest on their
debt. I find that, in December 2020, the banks reporting to KRITA lent a total of more
than SEK 2 trillion to the firms in this study. Of this amount, circa SEK 250 billion went
to firms in high-emission industries. Importantly, a large part of this money (a total of
about SEK 57 billion) went to financially vulnerable firms. These results confirm the
need to further investigate the impact that the realization of climate-related risks, and
transition risks in particular, together with existing vulnerabilities, may have on the
Swedish banking system. Yet, to be able to perform these analyses, all firms should
not only start to consistently report data about their emissions, but also be more
transparent about how climate-related risks may affect them.
Keywords: climate change, climate-related risks, transition risks, greenhouse gases
(GHG) emissions, corporate sector vulnerabilities, financial stability.
Acknowledgements: I would like to thank Mia Holmfeldt, Jens Iversen, Thomas Jans-
son, Martin Regnér, Olof Sandstedt, Annika Svensson, Tamás Vasi, and the partici-
pants at the AFS seminars in February and April for their feedback. I am also very
thankful to Ulrika Bast, Tracey Green and Gary Watson for their help. Please note that
the views expressed in this paper are solely those of the author and do not necessarily
reflect the views of the Riksbank.

Abstract in Swedish Med utgångspunkt i information från kreditdatabasen KRITA och Statistiska centralby-
råns data på växthusgaser, undersöker jag här i vilken utsträckning det svenska bank-
systemet under 2020 var exponerat mot branscher med höga koldioxidutsläpp. Jag
undersöker därefter i hur stor utsträckning exponeringen gällde företag som redan in-
nan pandemin hade en svag finansiell ställning, det vill säga företag som redan hade
svårt att betala sina räntekostnader. Enligt studien gick ungefär 250 miljarder kronor,
av totalt cirka 2 000 miljarder kronor i total företagsutlåning i december 2020, till fö-
retag i branscher med höga koldioxidutsläpp. Studien finner vidare att en stor del av
dessa lån (57 miljarder) gick till företag med svag finansiell ställning. Resultaten visar
hur viktigt det är att fortsätta undersöka vilken inverkan klimatrelaterade risker, och
omställningsrisker i synnerhet, tillsammans med andra sårbarheter, kan ha på den
svenska banksektorn. Men för att göra en sådan undersökning är det viktigt att företa-
gen dels förbättrar sin rapportering av data om utsläpp, dels blir tydligare med hur de
kan påverkas av klimatrelaterade risker.

Contents
1 Introduction 3
2 Main results 6
2.1 Bank exposure to high-emission industries 6
2.2 Decomposition of bank lending 9
3 Conclusions 13
References 14 APPENDIX 18
Staff Memo
A Staff Memo provides members of the Riksbank's staff with the opportunity to pub-
lish advanced analyses of relevant issues. It is a publication for civil servants that is
free of policy conclusions and individual standpoints on current policy issues. Publica-
tion is approved by the appropriate Head of Department. The opinions expressed in
staff memos are those of the authors and are not to be seen as the Riksbank's stand-
point.
Introduction
3
1 Introduction This memo studies how exposed the Swedish banking system is to firms that may be
affected by climate related risks, and, in particular, by transition risks, which are “the
financial risks which could result from the process of adjustment towards a lower-car-
bon economy” (Carney 2015). In the analysis, I employ Credit Registry data (KRITA)
and I identify the industries that produced the largest amount of carbon dioxide
equivalent (CO2e)1 in 2019 (i.e. high-emission industries) using data from the Swedish
office of national statistics, Statistics Sweden (SCB).
Importantly, I also consider that climate-related risks may affect the financial system
by exacerbating existing financial vulnerabilities. Therefore, to better assess the po-
tential consequences for the stability of the Swedish banking system, I do not only
study how exposed the system is to high-emission industries but also how exposed it
is to financially vulnerable firms in these industries. To do so, I identify firms’ financial
vulnerabilities by building on my recent work on financial vulnerabilities in the uni-
verse of Swedish limited liability firms (Cella 2020a, 2020b and 2021).
For years now, we have known that climate change has the potential to affect every
life on the planet with large consequences for the economy and the financial system
(e.g. Giglio et al. 2020 and BIS 2021).2 The effects on the ecosystem are in fact already
visible.3 To save the planet (and the economy),4 important change is needed: firms
(and households) have to drastically reduce their emissions of greenhouse (GHG)
gases. However, as usual with change, together with opportunities, risks could also
arise. These risks need to be quantified and managed in a timely fashion.
Broadly speaking, banks and the banking system are exposed to climate change
through macro- and microeconomic transmission channels that arise from two dis-
tinct components of climate-related risk: physical risks and transition risks (BIS 2021).
Physical risks result directly from how changes in the climate (e.g. natural disasters)
affect economic activity. Transition risks instead cover a broader range of effects on
firms’ operations and business models that come from the transition to a low-carbon
economy. These risks can materialize together or separately, and can have very differ-
ent, even opposite, effects (see Giglio et al. 2020 for a comprehensive discussion).
1 In the text, I use the words CO₂ equivalents (CO₂e) and greenhouse gases (GHG) interchangeably. This is because carbon-dioxide equivalents (CO₂e) describe different greenhouse gases in a common unit. For any quantity and type of greenhouse gas, CO₂e signifies the amount of CO₂ which would have the equivalent global warming impact (Brander and Davis 2012). SCB reports the total of emissions from stationary and mobile sources. This total roughly maps into the total of scope 1 and scope 2 emissions as defined by the GHG Protocol Corporate Standard. Please, see Appendix A.1 for more details and specific references. 2 Giglio et al. 2020 provides a review of the literature on the interactions between climate change and fi-nancial markets. The report from BIS (BIS 2021) reviews the effects of climate-related risk drivers on banks and the banking system. 3 For example, Portugal, California and Australia have been affected by raging wild fires in the past few years that can be directly connected to climate change (Borunda 2020). Glaciers are also melting with large consequences for the ecosystem: the level of the sea is rising, more fresh water in the sea is changing the gulf stream with consequences for the weather all over the planet. Also less fresh water will be available as the glaciers melt into the oceans (Glick 2018). 4 In 2008, leading economist Nicholas Stern started his Richard T. Ely lecture with this sentence: “Green-house gas (GHG) emissions are externalities and represent the biggest market failure the world has seen.” (Stern 2008).
Introduction
4
While both types of risks are relevant from a financial stability point of view, in this
study, because of the nature of the data, I mostly focus on transition risks.
The speed of the transition to a low carbon economy can be influenced by public pol-
icy, technology, investor preferences and, even physical events (Carney 2015). Policy
makers in Sweden aim for the country to be climate neutral by 2045 and for the trans-
portation industry (one of the highest-emission industry in 2019) to become fossil-
free by 2030. To meet these goals, Swedish firms need to move away from fossil fuels
toward greener sources of energy quite quickly. 5 Moreover, these changes should not
only be made rapidly but should also be done in an orderly way so to avoid exacerbat-
ing the potential risks from the transition itself.
To help the transition, large investments in green technologies have already started.6
The issuance of financial instruments to invest specifically in projects to help the tran-
sition to a green economy (so-called ‘green bonds’) is picking up (Ferlin and Sternbeck
Fryxell 2020) and both institutional investors and retail investors have become more
engaged in climate-risk-related questions.7 In fact, in the long run, firms have a lot to
gain from greening their operations and becoming more sustainable. Yet, in the short
run, these changes may increase the probability of default for all firms in the economy
because of the impact they may have on the firms’ business models and economic
growth more generally.8
More directly related to high-emission industries, as the discussion about climate
change intensifies,9 firms with high emissions could also be affected by consumer
movements (for example, boycotts, protests, and reputational risks), shareholder ac-
tivism,10 and litigation risks (for example, lawsuits over environmental damage).11
Moreover, as greener technology becomes available, carbon-intensive assets (so-
called ‘stranded assets’) will become obsolete. Therefore, these assets, usually largely
financed by debt originated by banks,12 could be repriced with substantial losses. Im-
portantly, this asset re-evaluation may not necessarily happen at the same pace as
the transition. In fact, asset managers can already reduce the carbon footprint of their
portfolios (and move away from carbon-intensive assets) rebalancing toward firms
5 To achieve the climate neutrality goals, firms must emit drastically less than what they have done in the past 10 years (Swedish Climate Policy Council 2021). 6 For example, some of the largest Swedish firms are investing in producing fossil-free steel. See Reuters (2021) and Carpenter (2020). 7 For example, Alecta (2020), one of the largest Swedish pension funds, in the spring 2020 published its first climate report in accordance with the principles of the Task Force on Climate-related Financial Disclosure (TCFD). 8 For example, even though many firms may be willing to transition toward using more green energy, renew-able energy may not be available in the necessary quantities. Even in Sweden capacity has to be enhanced substantially to fully substitute fossil fuels (Sweden.se 2021). This suggests that, at least in the short run, green energy could be substantially more expensive than fossil-based energy, at the margin. The potentially higher cost of green energy could then negatively affect both the demand and supply of goods and services. 9 Harvey (2020) and Gordon and Look (2020). 10 Cardwell (2017), Lemos Stein (2018) and McCormick (2021). 11 Viglione (2020). 12 In 2016, in the EU, the majority of the fossil-fuel activities were financed with debt. More than half of this debt was originated by banks (Gros et al. 2016).

Introduction
5
that emit less (Bolton and Kacperczyk 2021 and Jondeau et al. 2021b). This rebalanc-
ing alone could largely affect the stock value of high-emission firms and may have im-
portant consequences for financial stability (Jondeau et al. 2021a).
Importantly, as suggested above, there is large heterogeneity in the effects of transi-
tion risks on asset values and, subject to their current dependence on carbon-inten-
sive assets, some firms may not be affected at all. Yet, it is still reasonable to believe
that, because of the nature of their businesses and their current dependence on car-
bon-intensive assets, firms in high-emission industries may be the most sensitive to
the realization of these risks. This study therefore maps how much of the lending
portfolios of the banks reporting to KRITA consists of credit to firms in high-emission
industries.
However, to better understand how transition risks may affect our financial system, I
also argue that it is not enough to only study how exposed banks are to high-emission
industries. In fact, from a risk management perspective, by looking at climate-related
risks in isolation, one may paint a partial picture of the actual risks that could be build-
ing up in the financial system. This is because if many of the firms that need to green
their operations are already financially vulnerable (for example, they can barely ser-
vice their debt or already have quite high leverage), their existing vulnerabilities could
be exacerbated by the realization of transitions risks.
As mentioned in the discussion above, a rapid transition to a greener economy may in
itself exacerbate existing financial vulnerabilities by affecting firms’ economic and fi-
nancial costs and their probability of default. Moreover, to adapt to the change, firms
may need to borrow to make the necessary investments to transition to a greener
economy (away from fossil-fuel energy into environmentally friendly technologies). If
these firms are already financially vulnerable, they may be unable to borrow more
(debt overhang problem). If this is the case, then, there could be important conse-
quences for the firms’ ability to survive (and also for the effort to meet the goal of cli-
mate neutrality). On the other hand, if financially vulnerable firms are able to further
increase their leverage, this may exacerbate their existing financial vulnerabilities, at
least in the short run. Hence, to fully grasp the effect of transitions risks on the finan-
cial system, it is important to understand how these risks may interact with existing
vulnerabilities.
To be able to fully analyse the interaction between transition risks and existing finan-
cial vulnerabilities, one would need to have firm-level information on emissions of
greenhouse gases, on how much of the firm’s total assets consist of carbon-intensive
assets and, ideally, information on the firm’s investment plans to green its operations.
Unfortunately, none of this information is available to me. Yet, using the available
data, I illustrate how financial vulnerabilities are distributed in high-emission indus-
tries and how much the banking system is exposed to these firms.
All of the main results of this study are illustrated in Section 2, while Section 3 con-
cludes. CO2e emissions data is described in the Appendix A.1.

Main results
6
2 Main results To understand how dependent firms are on fossil fuels and how much they are ex-
pected to reduce their emissions to slow climate change, one would ideally like to
know how much they emit (directly and indirectly), what the sources of their emis-
sions are, and what plans they have to make their energy consumption more efficient
and sustainable. Even better, one would like to know how much of the firms’ total as-
sets consist of carbon-intensive assets and how the value of these assets (and all as-
sets) will be affected by climate-related risks and transition risks, in particular.
Unfortunately, none of this information is currently (publicly) available for the vast
majority of the firms on the planet. Yet, in Sweden, the office of national statistics,
Statistics Sweden (SCB), estimates industry-level data for the total amount of CO₂e
gases emitted by Swedish firms sorted in 32 industries (SCB 2020b, 2021a and SCB
2021b).
The data has shortcomings (see the Appendix A.1 for a comprehensive discussion) but
it is based on a clear methodology, is quite granular and easy to use and, although
one cannot classify firms within the same industry, one can compare industries with
different levels of emissions. Hence, using the data provided by SCB, I sort all indus-
tries in quartiles based on total CO₂e emissions in 2019: High-emission (the fourth
quartile of the emissions distribution), Medium-emission (the third quartile of the dis-
tribution) and Low-emission (both the first and second quartile of the distribution).13
Descriptive statistics for the firms in each category can be found in Appendix A.1.
In the remaining part of this section, I study how exposed the banks reporting to
KRITA are to firms in high-emission industries (Section 2.1), and then I show how
much of the amount lent goes to vulnerable firms in these industries (Section 2.2). I
introduce the other sources of data used in this study while discussing the results.
2.1 Bank exposure to high-emission industries
To study banks’ lending to non-financial firms in high-emission industries, I match the
emission data from SCB with data reported in KRITA. KRITA is a survey run by Statistic
Sweden on behalf of the Riksbank to collect information on loans to companies and to
the public sector.14 Eighteen monetary financial institutions are surveyed to compile
the data collected in KRITA. The data covers about 95% of all loans to sectors other
13 The high-emission group contains the following industries: Wholesale and Retail Trade (WRT), Construc-tion (CON), Plastic (PLAS), Petroleum (PETR), Metals (META), Electricity Gas and Water Supplies (ELGAG), Agriculture, Forestry and Fishing (AGRF), Transportation (TRAN). The medium-emission group consists of the following industries: Health (HEAL), Vehicles (VEHI), RE (REAL ESTATE), Consultancy (CONSUL), Adminis-trative Support (ADMI), Food and Tobacco (FOOD), Mining (MINI), Wood (WOOD). Finally, all of the other industries are in the low-emission group: Computers (COMP), Transportation Equipment (TRA-EQ), Telecom (TEXT), Textiles (TELE), TV and Movies (TVMO), Electronics Equipment (ELEC-EQ), Social Work (SOCIO), Edu-cation (EDUC), Programming (PROG), Advertising (ADVE), Hotels and Restaurants (H&R), Other Services (OTHES), Furniture (FURN), Arts (ARTS), Machinery (MACH). 14 KRITA is still an ongoing project and is being continuously updated and improved. The results in this paper are based on a data extraction conducted on 4 March 2021.
Main results
7
than households. In KRITA, firms’ organization numbers and primary industry codes
(SNI07 industry codes) are also available.
The SCB data on emissions is matched with KRITA using the firm’s primary industry
code. In December 2020, KRITA reported information for a total of about 199,000
firms (about 204,000 in December 2019). However, after matching with the emission
data (firms with missing industry codes are dropped) and dropping firms in the finan-
cial and insurance activities industry (SNI07 64110-66309), about 192,000 (195,000)
firm-observations remain in December 2020 (December 2019).
Using the data described above, for the month of December 2019 and December
2020, I start by showing the proportion that the firms in high-emission industries bor-
rowed from the banks in the sample. Results are shown in Figure 1.
Figure 1 shows results also for medium and low-emission industries. Importantly, to
be able to better describe potential exposure to climate-related risks, I decompose
the total amount borrowed by medium-emission industries in two parts: the total bor-
rowed by firms in the real estate industry (SNI07 68100-68320) and the total bor-
rowed by firms in medium-emission industries, excluding real estate.
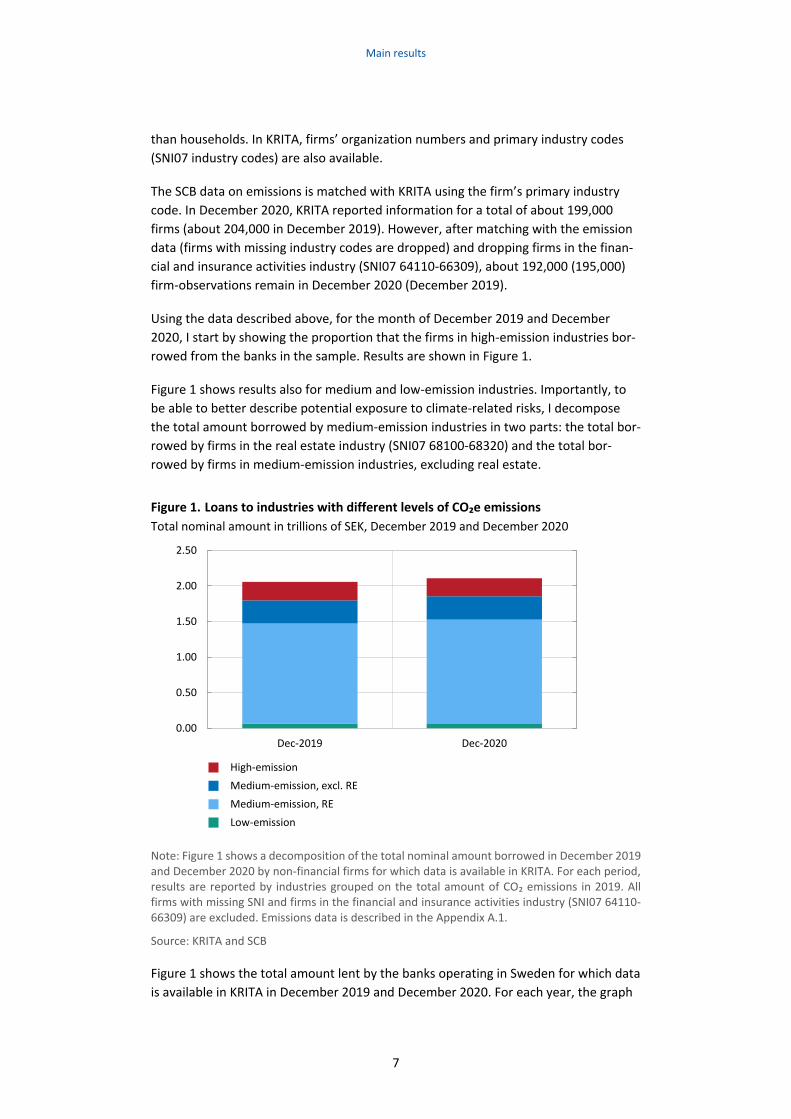
Figure 1. Loans to industries with different levels of CO₂e emissions
Total nominal amount in trillions of SEK, December 2019 and December 2020
Note: Figure 1 shows a decomposition of the total nominal amount borrowed in December 2019 and December 2020 by non-financial firms for which data is available in KRITA. For each period, results are reported by industries grouped on the total amount of CO₂ emissions in 2019. All firms with missing SNI and firms in the financial and insurance activities industry (SNI07 64110-66309) are excluded. Emissions data is described in the Appendix A.1.
Source: KRITA and SCB
Figure 1 shows the total amount lent by the banks operating in Sweden for which data
is available in KRITA in December 2019 and December 2020. For each year, the graph
0.00
0.50
1.00
1.50
2.00
2.50
Dec-2019 Dec-2020
High-emission
Medium-emission, excl. RE
Medium-emission, RE
Low-emission

Main results
8
shows the total lent to firms in four different groups: all firms in high-emission indus-
tries (the red part of the bar), all firms in medium-emission industries excluding real
estate (the dark blue portion of the bar), all real-estate firms alone (clear blue portion
of each bar) and firms in low-emission industries (in green).
In December 2020, the firms in this study borrowed a total of more than SEK 2 trillion.
Of this amount, about SEK 69 billion was lent to firms in low-emission industries, more
than SEK 1.7 trillion was lent to firms in medium-emission industries and about SEK
250 billion to firms in high-emission industries. Therefore, around 12% of the total
amount lent in December 2020 by the banks reporting to KRITA went to firms in high-
emission industries.
Figure 1 also shows that, collectively, the banks reporting to KRITA have very limited
exposure to firms in low–emission industries (circa 3% of the total amount lent went
to these firms in December 2020) but a substantial exposure to medium-emission in-
dustries and in particular to the real estate industry. Firms in medium-emission indus-
tries, excluding real estate (the dark blue bars), in December 2020, accounted for al-
most 16% of total lending to all of the firms in KRITA, while firms in the real estate in-
dustry (the clear blue bars) have borrowed almost 70% of the total amount recorded.
Figure 1 also reports results for December 2019 to show whether exposure to high-
emission industries, and other industries, has decreased in 2020, for example because
of the economic crisis or because banks themselves have started greening their port-
folios in earnest. I do not find any evidence of this. In fact, very little has changed be-
tween 2019 and 2020.
The results above have important implications for financial stability. To begin with,
Figure 1 shows that the Swedish banking system is largely exposed to high-emission
industries and to medium-emission industries excluding real estate. Since we do not
know how the firms in these industries may be affected by transition risks and we do
not have the data to assess the impact that such risks may have on these firms, one
cannot ignore the potential consequences of such exposure. Second, Figure 1 shows
that the Swedish banking system is substantially exposed to firms in the real estate in-
dustry. Data from SCB (see appendix A.1) show that real estate is one of the industries
that emits the least among medium-emission industries, thus, one can argue that the
firms in this industry may not be largely affected by transition risks per se. Yet, one
needs to remember that this industry could be largely affected by physical risks.
Therefore, even from a climate-related risk perspective this industry appears to be a
key one for financial stability.
Results in Figure 1 then confirm two important facts. First, they substantiate the need
to obtain more transparent and timely data from firms (and financial institutions)
about their exposure to climate-related risks. Second, they reiterate the importance
of the real estate industry for the stability of our financial system and reinforce the
importance of closely monitoring developments in this industry.
Finally, in unreported analysis, I find large heterogeneity in banks’ exposure to high-
and medium-emission industries. This suggests that greening the banking system will

Main results
9
affect banks differently. In particular, this process will affect banks differently depend-
ing on the composition of their portfolios within those industries. Therefore, it will be
important to monitor the transition closely and to do so, again, more data (and better
data) is necessary.
The results in this section show that both high- and medium-emission industries are
particularly important in the portfolio of the banks reporting to KRITA. Therefore, to
better understand the potential risks for our financial system, I focus in the next sec-
tion on the firms within these industries and study how much of the total amount lent
in 2020 was allocated to financially vulnerable firms.
2.2 Decomposition of bank lending
2.2.1. Definition of financially vulnerable firms
I employ data from KRITA also to study lending to vulnerable firms in high-emission
industries. In this case, the firms in KRITA are matched with the CO₂e data from SCB
and the Serrano database provided by Bisnode in November 2020. The Serrano data-
base contains detailed financial statement information for all Swedish limited liability
companies (aktiebolag) that reported to the Swedish Companies Registration Office
(Bolagsverket) in 2019.
Following my work on financial vulnerabilities, (Cella 2020a, 2020b and 2021) and
building on the existing literature (see for example, International Monetary Fund 2019
and Altman et al. 2019), I use financial statement information for the entire universe
of limited liability firms in Serrano in 2019, to identify firms that may be more exposed
to the risk of financial distress (i.e. financially vulnerable firms).15 In particular, I try to
capture as many potentially vulnerable firms as possible by employing a broad defini-
tion based on leverage, return on assets (ROA) and interest coverage ratio.16 Using
these variables, I sort all firms into the following categories:
1. ICR (interest coverage ratio) <=1: This category includes all firms that in 2019
had an ICR below or equal to 1 and firms that have filed for bankruptcy or re-
structuring in either 2019 or 2020 and for which the bankruptcy process was
not yet concluded by October 2020.
2. High leverage-poor performance: This category contains firms with leverage
above the median in their industry-size category and profitability (ROA) be-
low the median in their industry-size category.
15 Financial distress usually proceeds bankruptcy, however the definition of financial distress is less rigorous than the definition of bankruptcy. For example, the International Monetary Fund (2019) defines firms with ICR below 1 as firms with imminent risk of distress since these firms are technically insolvent (they are una-ble to pay the interest on their debt). However, the literature does not only use this definition to identify firms at risk of distress. See Platt et al. (2006) for a discussion of the differences between financial distress and bankruptcy. For more information about the Swedish legal system for bankruptcies and re-organiza-tion, see Cella (2020b). 16 A firm’s leverage is calculated as the ratio between its debt and the sum of its debt and equity. A firm’s performance is calculated by its return on assets (ROA) obtained as the ratio between its earnings before interest and taxes (EBIT) and its total assets. A firm’s ICR is obtained as the ratio between a firm’s earnings before interest and taxes (EBIT), and (the absolute value) of its interest expenses.

Main results
10
3. High leverage-good performance: This group contains all firms with leverage
above the median in their industry-size category.
4. Other firms: This category contains all firms that could not be otherwise clas-
sified.
The classification described above suffers from short-comings that are common in this
literature (see Appendix A.2 for a discussion). Importantly though, descriptive statis-
tics, reported in Table 1.a in Appendix A.3, suggest that firms with ICR<=1 are not only
at risk of insolvency but, on average, are also highly levered and perform quite poorly.
Because of these characteristics, the firms in this category may be more sensitive to
financial distress (Altman et al. 2019).17 Therefore, in the rest of the study, unless oth-
erwise specified, I refer to firms with ICR<=1 as “vulnerable firms” and I use the terms
“firms with ICR<=1” and “vulnerable firms” interchangeably.
2.2.2. Lending to vulnerable firms in high-emission industries
In this section, using the matching between KRITA and Serrano, I calculate how much,
in December 2020, the banks reporting to KRITA lent to the firms that could already
be identified as vulnerable firms in 2019. Then, employing emissions data from SCB, I
show how lending to vulnerable firms is allocated within industries with different lev-
els of emissions. Results are reported in Figure 2.
17 Altman et al. (2019) indicates poor performance, high financial leverage and liquidity issues as factors that contribute to a firm’s distress.

Main results
11
Figure 2. Loans to firms with ICR<=1 in industries with different levels of CO₂e emissions
Total nominal amount in billions of SEK, December 2020
Note: Figure 2 shows a decomposition of the total monthly amount borrowed in December 2020 by non-financial limited liability firms for which data is available in KRITA and Serrano. Re-sults are reported by industries grouped on the total amount of CO₂ emissions in 2019: high emissions, medium emissions, and low emissions industries. The total amount lent to each one of these groups is then further decomposed by firms classified in different categories in 2019. All firms with missing SNI and firms in the financial and insurance activities industry (SNI07 64110-66309) are excluded. A description of the firms’ categories can be found in section 2.2.1 while emissions data is described in the Appendix A.1.
Source: KRITA, Bisnode and SCB.
After matching KRITA with Serrano and with the emissions data from SCB, in Decem-
ber 2020, I am left with 147,150 non-financial limited liability firms.18 In Figure 2, firms
are first grouped into industries sorted according to total amount of CO2e emissions:
high-emission (high), medium-emission (medium), and low-emission (low). Then, the
total amount lent in December 2020 to each one of these groups is further decom-
posed by type of firm: firms with ICR<=1 (red portion of each bar), firms with high lev-
erage and poor performance (blue portion of each bar), firms classified as high lever-
age and good performance (clear blue portion of each bar) and other firms (orange
portion of each bar). While Figure 1 shows that, in December 2020, a large amount of
money was lent to firms in high-emission industries, Figure 2 shows that a substantial
18 Matching between Serrano and KRITA is based on each firm’s unique organization number. Data is then matched with the SCB emissions dataset using the firm’s primary industry code. It is important to notice that because of the matching with Serrano to identify financial vulnerabilities, the total amount of firms em-ployed in this section is smaller than that employed to construct Figure 1, since I now only employ data for non-financial limited liability (AB) firms while Figure 1 was built using all firms that were available in KRITA, after matching with the emissions data. Nevertheless, this smaller sample of firms has received in Decem-ber 2020 a large chunk of the credit extended by the banks in this study. Please, see Figure 1 and Figure 2 for details.
0
200
400
600
800
1000
1200
Low-emission Medium-emission High-emission
ICR<=1
High Leverage-Poor Performance
High Leverage-Good Performance
Other Firms

Main results
12
part of this money went to non-financial limited liability firms that were already quite
financially vulnerable in 2019 (firms with ICR<=1).
Figure 2 shows that, in December 2020, out of the total of more than SEK 2 trillion re-
ported in Figure 1, a total of around SEK 1.4 trillion went to the non-financial limited
liability firms that are both in KRITA and Serrano, after matching with SCB emission
data. Of this total, about SEK 62 billion was borrowed by firms in low-emission indus-
tries, more than SEK 1.1 trillion was lent to firms in medium-emission industries and
about SEK 240 billion was borrowed by firms in high-emission industries. If we focus
on vulnerable firms only, it appears that they received a considerable part of these
loans in each of the emissions categories.
Figure 2 shows that almost 36% of the total 1.4 trillion SEK lent out by the banks in
KRITA in December 2020 went to firms that, already before the economic crisis in
2020, appeared to be struggling with paying the interest on their debt. In fact, firms
with ICR<=1 in 2019 received about SEK 500 billion in total, and of this, circa SEK 57
billion went to vulnerable firms in high-emission industries, SEK 413 billion went to
vulnerable firms in medium-emission industries and approximately SEK 15 billion
went to vulnerable firms in low-emission industries. Therefore, firms with ICR<=1 in
high-emission industries received 24% of the total lent to all firms in these industries
(57 out of 240 billion SEK). Vulnerable firms in medium-emission industries borrowed
almost 39% of the total allocated to these industries (413 out of 1.1 trillion SEK). And,
even in low emissions industries vulnerable firms account for almost 24% of the total
lent to these industries (15 out of 62 billion SEK). These results suggest that the large
concentration of loans to vulnerable firms together with the potential materialization
of climate-related risks, and transition risks in particular, could have important impli-
cations for the stability of the Swedish banking system, at least in the short run.
To summarize, the results in Section 2 clearly show that, in December 2020, a large
part of the lending portfolio of the banks reporting to KRITA was exposed to firms in
industries with high and medium emissions (Figure 1). Moreover, a large part of this
money was allocated to firms that with an ICR<=1 (Figure 2). These results further cor-
roborate the idea that to fully understand the impact of transition risks, and more in
general climate-related risks, on the financial stability of the Swedish banking system,
it is important to continue monitoring the evolution of firms’ financial vulnerabilities
and study how the materialization of transition risks may exacerbate existing firms’
vulnerabilities.
Conclusions
13
3 Conclusions The COVID-19 pandemic has taught the world how hard nature can hit us. Despite the
continued effort to start seriously addressing climate change, we still have a long way
to go. Nevertheless, the transition to a greener economy is necessary to insure a livea-
ble future on our planet. Therefore, both firms and financial institutions (and house-
holds) should learn how to take advantage of the opportunities that this transition of-
fers but should also learn how to deal with the potential risks involved.
To help assess the potential financial stability risks stemming from the realization of
transition risks, and climate-related risks in general, this study shows how exposed the
Swedish banking system is to industries that account for the majority of the CO₂e
gases emitted directly in the atmosphere by Swedish firms. I find that 12% of the total
amount lent in December 2020 by the banks reporting to KRITA went to firms in high-
emission industries (around SEK 250 billion out of a total of about SEK 2 trillion). The
analysis also shows that a large portion of this exposure (a total of about 57 billion
SEK) went to non-financial limited liability firms that, in 2019, struggled with servicing
the interest on their debt.
However, the aim of this study is not only to create more awareness about how ex-
posed the Swedish financial system is to high-emission industries but also to highlight
how difficult it is to clearly assess the consequences of climate-related risks for finan-
cial stability.
In Sweden, firms are not required by law to report their CO₂e emissions consistently.
Complying with international regulations, firms that choose to report their emissions
can, for example, decide how to report and change their reporting methods over
time. Therefore, there is a clear need to improve reporting standards and transpar-
ency (see Ferlin et al. 2021 for a discussion). To be able to paint a complete picture of
how climate-related risks may affect the stability of the Swedish banking system, we
need better data: all firms should systematically and transparently report how their
operations and the value of their assets are affected by climate-related risks, how
much they emit (directly and indirectly) and what their plans are to reduce these
emissions.
Reporting is expensive and exposes firms to reputational risks, yet both firms’ custom-
ers and providers of capital have the right to know what firms are doing (or not doing)
to help meet the goal of carbon neutrality and what risks this may pose to them, at
least in the short run. A lot can already be done, but once this data is available, the
way forward will be easier to pave and both private and public institutions will be able
work more effectively towards greening the financial system and managing the risks
in their portfolios.

References
14
References Alecta (2020), Alecta’s Annual and Sustainability Report 2020.
https://www.alecta.se/globalassets/dokument/finansiella-rapporter/in-english/an-
nual-reports/alecta-annual-and-sustainability-report-2020.pdf.Accessed April 2021.
Altman, Edward I., Edith Hotchkiss and Wei Wang (2019), Corporate financial distress,
restructuring, and bankruptcy: analyze leveraged finance, distressed debt, and bank-
ruptcy. John Wiley & Sons.
Banerjee, Ryan, Anamaria Illes, Enisse Kharroubi, and José María Serena Garralda
(2020), Covid-19 and corporate sector liquidity. BIS Bulletin no. 10. Bank for Interna-
tional Settlements.
Basel Committee on Banking Supervision (2021), Climate-related risk drivers and their
transmission channels. Bank for International Settlements.
Bolton, Patrick and Kacperczyk, Marcin T. (2021), Global pricing of carbon-transition
risk. NBER Working Paper Series no. 28510. National Bureau of Economic Research.
Borunda, Alejandra (2020), The science connecting wildfires to climate change. Na-
tional Geographic 17 September 2020. https://www.nationalgeographic.com/sci-
ence/article/climate-change-increases-risk-fires-western-us.
Brander, Matthew, and Gary. Davis (2012), Greenhouse gases, CO₂, CO₂e, and carbon:
what do all these terms mean. Ecometrica, Insight. https://ecometrica.com/as-
sets/GHGs-CO2-CO2e-and-Carbon-What-Do-These-Mean-v2.1.pdf. Accessed April
2021.
Cardwell, Diane (2017), Exxon Mobil shareholders demand accounting of climate
change policy risks. The New York Times 31 May 2017. https://www.ny-
times.com/2017/05/31/business/energy-environment/exxon-shareholders-climate-
change.html
Carney, Mark. (2015), Breaking the tragedy of the horizon-climate change and finan-
cial stability. [Speech] 29 September 2015 https://www.bankofeng-
land.co.uk/speech/2015/breaking-the-tragedy-of-the-horizon-climate-change-and-fi-
nancial-stability
Carpenter, Scott (2020), Swedish steelmaker uses hydrogen instead of coal to make
fossil-free steel. Forbes 31 August 2020. https://www.forbes.com/sites/scottcarpen-
ter/2020/08/31/swedish-steelmaker-uses-hydrogen-instead-of-coal-to-make-fossil-
free-steel/?sh=630fbec72c8b.
Cella, Cristina (2020a), Zombie firms in Sweden: implications for the real economy and
financial stability, Staff Memo, September 2020. Sveriges riksbank.
Cella, Cristina (2020b), Bankruptcy at the time of COVID-19: the Swedish Experience,
Staff Memo, November 2020. Sveriges riksbank.

References
15
Cella, Cristina (2021), Financially vulnerable firms. A post-pandemic exercise. Staff Memo,
forthcoming 2021. Sveriges riksbank.
Ferlin, Maria, Johan Blixt and Emma Brattström (2021), Sustainability reporting - need
for greater standardisation and transparency. Economic Commentaries no: 4 2021.
Sveriges riksbank.
Ferlin, Maria and Vanessa Sternbeck Fryxell (2020), Green bonds – big in Sweden and
with the potential to grow. Economic Commentaries no: 12 2020. Sveriges riksbank.
Giglio, Stefano, Bryan T. Kelly, and Johannes Stroebel (2020), Climate Finance. NBER
Working Paper no. 28226. National Bureau of Economic Research.
Glick, Daniel (2018), The Big Thaw: as the climate warms, how much, and how quickly,
will Earth's glaciers melt? National Geographic https://www.nationalgeo-
graphic.com/environment/article/big-thaw. Accessed April 2021.
Gordon, Paul and Carolynn Look (2020), Paragliding Greenpeace activists take to ECB’s
roof in protest. Bloomberg Green 10 mars 2021. https://www.bloom-
berg.com/news/articles/2021-03-10/paragliding-greenpeace-activists-take-to-ecb-s-
roof-in-protest
Greenhouse Gas Protocol (2015a) GHG Protocol Scope 2 Guidance: An amendment to
the GHG Protocol Corporate Standard. World Resources Institute. https://ghgproto-
col.org/scope_2_guidance . Accessed April 2021.
Greenhouse Gas Protocol (2015b), Corporate Value Chain (Scope 3) Accounting and
Reporting Standard: Supplement to the GHG Protocol Corporate Accounting and Re-
porting Standard. World Resources Institute and World Business Council for Sustaina-
ble Development https://ghgprotocol.org/standards/scope-3-standard. Accessed April
2021.
Gros, D., Lane, P.R., Langfield, S., Matikainen, S., Pagano, M., Schoenmaker, D. and
Suarez, J. (2016), Too late, too sudden: transition to a low-carbon economy and sys-
temic risk. Reports of the Advisory Scientific Committee no 6 February 2016. European
Systemic Risk Board.
Harvey, Fiona (2020), Young people resume global climate strikes calling for urgent
action. The Guardian 25 September 2020. https://www.theguardian.com/environ-
ment/2020/sep/25/young-people-resume-global-climate-strikes-calling-urgent-ac-
tion-greta-thunberg
International Monetary Fund, Monetary and Capital Markets Department (2019),
Global corporate vulnerabilities. In Global Financial Stability Report: lower for longer.
October 2019. International Monetary Fund
Jondeau, Eric, Benoit Mojon and Cyril Monnet (2021a), Greening (runnable) brown as-
sets with a liquidity backstop. BIS Working Papers No. 929. March 2021. Bank for In-
ternational Settlements.
References
16
Jondeau, Eric, Benoit Mojon and L A Pereira Da Silva (2021b), Excluding firms with
large carbon emission for portfolio investment. BIS Working Papers forthcoming. Bank
for International Settlements.
Le Quéré, Corinne., Jackson, Robert.B., Jones, Matthew.W. et al. (2020), Temporary
reduction in daily global CO₂ emissions during the COVID-19 forced confinement. Na-
ture climate change. 10, 647–653.
Lemos Stein, Mara (2018), More shareholder proposals spotlight climate change. Wall
Street Journal 8 February 2018. https://www.wsj.com/articles/more-shareholder-pro-
posals-spotlight-climate-change-1518127308?tesla=y
McCormick, Myles (2021), SEC forces oil companies to hold investor votes on emission
targets. Financial Times 20 March 2021. https://www.ft.com/content/50b52600-
dd43-427c-88a6-149cf790cb70
Platt, Harlan D. and Marjorie B. Platt (2006), Understanding differences between fi-
nancial distress and bankruptcy. Review of Applied Economics 2(2), 1-17.
Reuters (2021), Volvo, SSAB plan first fossil-free steel trucks on road to carbon neu-
trality. The Economic Times E-paper 8 April 2021. https://www.reuters.com/arti-
cle/us-volvo-ssab-idUSKBN2BV14G.
SCB (2020a), Greenhouse gas emissions in Sweden’s economy decreased in the first
quarter of 2020. Environmental Accounts – Emissions to air Q1 2020
https://www.scb.se/en/finding-statistics/statistics-by-subject-area/environment/envi-
ronmental-accounts-and-sustainable-development/system-of-environmental-and-
economic-accounts/pong/statistical-news/environmental-accounts--emissions-to-air-
q1-2020/ . Published 1 September 2020.
SCB(2020b), Utsläpp av växthusgaser redovisat efter näringsgren SNI 2007 och kvar-
tal, 2008K1-2020K2. https://www.scb.se/conten-
tassets/de58291533084337843bfaf98d1f30ba/utslapp_och_intensite-
ter_per_kvartal_och_prel_ar_2008-2020k2.xlsx . Published October 2020. Accessed
November 2020.
SCB (2021a), Kvalitetsdeklaration. Industrins energianvändning (Isen). 20 January
2021. SCB. https://www.scb.se/conten-
tassets/c837d2ceb9fc44fab501cb316295c181/en0113_kd_-2019_ma_210120.pdf
SCB (2021b), Kvalitetsdeklaration. Miljöräkenskaperna – Utsläpp till luft per kvartal.
Version 2. 5 February 2021. SCB. https://scb.se/conten-
tassets/f0d9c7eda5be4b8a96c5827e4bebf513/mi1301_kd_2020_fk_210205.pdf
Stern, Nicholas (2008), The economics of climate change. American Economic Review
98 (2), 1-37.
Sweden.se (2021), Energy use in Sweden. Swedish Institute. https://sweden.se/na-
ture/energy-use-in-sweden/ . Accessed April 2021.

References
17
Swedish Climate Policy Council (2021), Klimatpolitiska rådetsrapport 2021. [Report of
the Swedish Climate Policy Council]. 25 March 2021.. https://www.klimat-
politiskaradet.se/en/rapport-2020/ . Swedish Climate Policy Council [Only in Swedish
as of April 2021]
U.S. Environmental Protection Agency [2015], EPA Center for Corporate Climate Lead-
ership. Scope 1 and Scope 2 Inventory Guidance. https://www.epa.gov/climateleader-
ship/scope-1-and-scope-2-inventory-guidance. Accessed April 2021.
Viglione, Giuliana (2020), Climate lawsuits are breaking new legal ground to protect
the planet. Nature 28 February 2020. https://www.nature.com/articles/d41586-020-
00175-5

APPENDIX
18
APPENDIX
A.1 Carbon dioxide equivalent data
In this study, I employ industry level carbon dioxide equivalent (CO2e)19 emissions
data estimated by Statistic Sweden (SCB) for the year 2019. For each of the 32 indus-
tries in their sample, SCB reports yearly total emissions from stationary and mobile
sources (SCB 2020b, 2021a and 2021b).20 All firms are assigned to a given industry us-
ing the firm’s primary SNI code and are considered as stand-alone even if they belong
to a group.21
Using the data provided by SCB, I sort all industries by total emissions and then divide
all of them into quartiles based on emissions.22 I do this exercise using total industry
emissions of CO2e in 2019.23 The industries in each quartile and their respective emis-
sions are reported in Figure 1.a.
19 The carbon dioxide (CO₂) equivalent is the unit of measure that expresses the climate impact from emis-sions of different greenhouse gases by converting amounts of other gases into the equivalent amount of carbon dioxide with the same global warming potential. Emissions are converted into CO₂ emissions using a methodology provided by the UN climate panel, the IPCC. SCB. 20 To the best of my knowledge, the total of emissions from stationary and mobile sources should roughly map into the total of scope 1 and scope 2 emissions as defined by the GHG Protocol Corporate Standard. The GHG Protocol defines three types of emissions: scope 1, 2 and 3. Scope 1 emissions are direct green-house (GHG) emissions from sources that are controlled or owned by an organization (e.g. emissions associ-ated with fuel combustion in boilers, furnaces, vehicles). Scope 2 emissions are indirect GHG emissions as-sociated with the purchase of electricity, steam, heat, or cooling. Scope 3 emissions are the result of activi-ties from assets not owned or controlled by the reporting organization, but that the organization indirectly impacts in its value chain. These are not reported by SCB. See Greenhouse Gas Protocol (2015a and 2015b), U.S. Environmental Protection Agency (2015) and SCB (2021a and 2021b). 21 SCB’s yearly emissions data is based on the survey on industry yearly energy use (SCB 2021a). To give a practical example of how emissions are imputed from the firm level to the industry level, assume that firm A belongs to a group of firms composed of firms A and B. Firm A’s primary SNI code shows that this firm is in the manufacturing industry, while firm B is a holding company classified in the consulting service indus-try. The emissions of firm B are estimated based on the energy use in the manufacturing industry. Firm B would be allocated some emissions but only at SNI-level (consulting industry), based on what can be found in the yearly energy balance for the service sector in combination with information from the National ac-counts data on energy expenditure for that specific SNI. In other words, even though firms A and B belong to the same group, their emissions are never added together. Full documentation can be found in SCB (2021a and 2021b). 22 Notice that in May 2021 data have been revised and some differences have arisen with respect to the data employed in this study which have been downloaded in November 2020. First, using the data ex-tracted in November 2020, I classify the Health industry (HEAL), Q86 human health activities, as a medium-emission industry, but using data revised in May 2021 this industry should have been classified as a low emissions industry. Similarly, the industry Arts (ARTS), R90-R93 arts entertainment and recreation, was clas-sified as a low-emission industry with data obtained in November 2020. Yet, revised data, show that this industry should have been classified as a medium-emission industry. Finally, within high emitting industries in Figure 1.a, the most polluting industry appears to be the Transportation (TRAN), H49-H53 transport and storage. Yet, employing the revised data in May 2021, the most polluting industry appears to be Agricul-ture, Forestry and Fishing (AGRF), A01-A03 agriculture, forestry and fishing. Importantly, none of these changes affect the main results of this study. 23 Even though emissions in Sweden have decreased in 2020 with respect to 2019 (SCB 2020a), that result was most likely driven by the reduction in economic activity due to the pandemic (Le Quéré, Jackson, and Jones et al. 2020). Therefore, emissions in 2019 are also more similar to what emissions may have looked like if the pandemic had not happened since in the last 10 years total emissions have not dramatically changed even though much effort has been put into fighting climate change.

APPENDIX
19
Figure 1.a Total CO₂ Equivalent Emissions in 2019, by industry
Thousand tonnes
Note: Figure 1.a shows for each industry the total amount, in thousands of tons, of CO₂ equiva-lent emissions estimated by Statistic Sweden for the year 2019. Results are reported by indus-try sorted by the total amount of CO₂ emissions, from those that emit the least to those that emit the most. All industries are grouped in quartiles based on emissions. The fourth quartile is represented by the red bars. The third quartile is represented by the blue bars. Since the indus-tries in the first and second quartile emit very little, I have collated them into one large group: Q1+Q2. The industries are the following: Computers (COMP), Transportation Equipment (TRA-EQ), Telecom (TEXT), Textiles (TELE), TV and Movies (TVMO), Electronics Equipment (ELEC-EQ), Social Work (SOCIO), Education (EDUC), Programming (PROG), Advertising (ADVE), Hotels and Restaurants (H&R), Other Services (OTHES), Furniture (FURN), Arts (ARTS), Machinery (MACH), Health (HEAL), Vehicles (VEHI), Real Estate (RE), Consultancy (CONSUL), Administrative Support (ADMI), Food and Tobacco (FOOD), Mining (MINI), Wood (WOOD), Wholesale and Retail Trade (VS.), Construction (CON), Plastic (PLAS), Petroleum (PETR), Metals (META), Electricity Gas and Water Supplies (ELGAG), Agriculture, Forestry and Fishing (AGRF), Transportation (TRAN). Emis-sions data were downloaded in November 2020.
Data sources: SCB.
In Figure 1.a, I have collected all industries in quartiles based on the amount of total
emissions in 2019. The red bars represent all the industries in the fourth quartile of
the emissions distribution (High-emission). The blue bars represent industries in the
third quartile of the distribution (Medium-emission). Finally, the green bar represents
the industries in both the first and second quartile of the distribution (Low-emission)
since collectively these industries pollute less than the industry of Mining (MINI)
alone.
The industries in each group are as follows. The high-emission group contains the fol-
lowing industries: Wholesale and Retail Trade (WRT), Construction (CON), Plastic
(PLAS), Petroleum (PETR), Metals (META), Electricity Gas and Water Supplies (ELGAG),
Agriculture, Forestry and Fishing (AGRF), Transportation (TRAN). The medium-emis-
sion group consists of the following industries: Health (HEAL), Vehicles (VEHI), Real Es-
tate (RE), Consultancy (CONSUL), Administrative Support (ADMI), Food and Tobacco
(FOOD), Mining (MINI), Wood (WOOD). Finally, all of the other industries are in the
0
2000
4000
6000
8000
10000
Q1
+Q2
HEA
L
VEH
I
RE
CO
NSU
L
AD
MI
FOO
D
MIN
I
WO
OD
WR
T
CO
N
PLA
S
PET
R
MET
A
ELG
AG
AG
RF
TRA
N

APPENDIX
20
low-emission group: Computers (COMP), Transportation Equipment (TRA-EQ), Tele-
com (TEXT), Textiles (TELE), TV and Movies (TVMO), Electronics Equipment (ELEC-EQ),
Social Work (SOCIO), Education (EDUC), Programming (PROG), Advertising (ADVE), Ho-
tels and Restaurants (H&R), Other Services (OTHES), Furniture (FURN), Arts (ARTS),
Machinery (MACH).
Unfortunately, the data provided by SCB is not perfect to fully comprehend how cli-
mate-related risks may affect firms and, as a consequence, the stability of the finan-
cial system. Yet, given the current lack of detailed data provided by the firms them-
selves, it is a good enough proxy to at least gauge the overall severity of the problem.
To begin with, the emission data only depicts a partial picture of how much Swedish
firms contribute to global CO₂e emissions since it only refers to the total of emissions
from mobile and stationary sources. Nevertheless, to meet its neutrality target, Swe-
dish institutions need Swedish firms to reduce emissions in Sweden. Thus, the data es-
timated by Statistic Sweden is a good enough proxy for the collective effort that is
needed by all the firms in a given industry to help reduce air pollution. Nevertheless,
even within high-emission industries, some industries are going to be more affected
than others,24 and even within the same industry firms will be affected differently.
Unfortunately, with the current data it is impossible to capture within industry dy-
namics. In fact, the data overlooks the effort of firms to reduce emissions and does
not identify firms that are already employing green sources of energy or more sustain-
able technology and therefore may be less affected by transition risks.
The data though has also some clear advantages. To begin with, it is estimated over a
large set of Swedish firms and this makes the total more representative than esti-
mates based only on a small sub-sample of firms that choose to report emissions. Sec-
ond, it covers a large array of industries. This allows for more granularity in the analy-
sis and for a better understanding of industries that contribute the most to direct
emissions in Sweden. This is important because stranded-assets may be more concen-
trated in industries that are currently greatly dependent on fossil-fuels technologies.
For example, within the manufacturing industry (SNI07 10111-33200) sub-industries
do not contribute all in the same way to the total emitted by all firms in manufactur-
ing.25 If one would add together the direct emissions of all firms in the manufacturing
industry, regardless of their sub-activities, one may overestimate the potential impact
of transition risks for those firms that within the manufacturing industry belong to
24 For example, although both need to make substantial changes, the petroleum Industry (refinery of oil prod-ucts) may be more affected in the end than the transportation industry, even though, in Sweden, this latter industry currently emits far more than the petroleum industry. 25 To be more concrete, the manufactory industry covers sub-industries in all quartiles of the emissions dis-tribution. In the high-emission quartile I classify the following sub-industries: Plastic (PLAS), Petroleum (PETR), Metals (META). In the medium-emission quartile there are instead the sub-industries of Vehicles (VEHI), Food and Tobacco (FOOD), Wood (WOOD). Finally, the first and second quartile contains the sub-industries of Computers (COMP), Transportation Equipment (TRA-EQ), Textiles (TELE), Electronics Equipment (ELEC-EQ), Furniture (FURN), Machinery (MACH). Therefore, while collectively all of the firms in these industries emit a lot, it is reasonable to believe that firms in the sub-industries that belong to the high-emissions quartile may be the most affected by the realization of transition risks.

APPENDIX
21
sub-industries that emit the least. The granular definition of industries is then a clear
advantage of this data from a risk management perspective.
Next, I provide a description of the firms in each of the emissions categories. To do so,
I match the emissions data from SCB with the Serrano database provided by Bisnode.
This database contains detailed financial statement information for all Swedish lim-
ited liability companies (aktiebolag) that reported to the Swedish Companies Registra-
tion Office (Bolagsverket) in 2019. Using each firm’s primary SNI code, I can assign, ex-
actly as SCB does, firms to the industry for which SCB produces emissions statistics.
Firms with missing SNI codes cannot be matched.
After dropping firms with missing primary industry codes and firms in the financial
and insurance activities industry (SNI07 64110-66309), in Serrano there is a total of
436,329 non-financial limited liability firms that can be matched with the emissions
data. Out of the latter total, 153,025 firms are in the high-emission group. The aver-
age firm in this group is almost 16 years old, has about SEK 30 million in total assets
(the median firm has little less than SEK 2 million in assets) and 8 employees. The me-
dium-emission group contains a total of 175,202 firms. These firms, on average, are
larger (circa SEK 59 million in total assets but also in this group the median firm has
again around SEK 2 million in total assets), employ less people (about 5) and are
younger (13 years) than firms in high-emission group. Finally, the low-emission group
contains a total of 108,102 firms. The average firm in this latter group has about SEK
17 million in total assets (the median is less than SEK 1 million), employs about 7 peo-
ple and has been registered for almost 12 years. The low-emission group therefore
contains the smallest and youngest firms in the sample.
A.2 Discussion of firms’ classification
The classification I employ in this study suffers from short-comings that are common
in this literature. To begin with, by solely employing accounting data reported by the
firms themselves, it is impossible to fully gauge how financially vulnerable firms really
are (see Cella 2020a for a discussion). Therefore, some firms may be classified as fi-
nancially vulnerable even if they are not vulnerable and vice-versa. Second, 35% of
the firms in the sample belong to a group. However, because of data limitations and
the way CO₂e emissions are computed by SCB (see Appendix A.1), I consider all firms
as independent firms (also referred to as stand-alone firms). By doing so, I do not take
into considerations group-level synergies and the fact that these firms have access to
the internal capital market of the group. Therefore, I may be overestimating the
amount of vulnerable firms among firms that belong to groups. Finally, a firm’s liquid-
ity can change quite quickly. For example, firms with very good ICR could be hit by a
sudden negative shock to their operating income and become quickly insolvent, while
firms that struggle to service their debt may experience the opposite. This suggests
that the way firms are classified is not only strictly related to the definition employed
but also to the time at which the variables are calculated.
Because of the issues described above, misclassification could occur for a number of
firms. Yet, since I already employ all the data available to me, I am unable to further
APPENDIX
22
understand how these shortcomings may affect the results of this study. Neverthe-
less, to reduce concerns, when defining vulnerable firms, I follow the existing litera-
ture as closely as possible and I calculate all variables at the end of the year 2019, the
last available year of accounting data, and discuss at length the characteristics of the
firms in each group (see Appendix A.3). Additionally, as a robustness check, I try to un-
derstand whether the firms’ classification is stable and how it may have been affected
by the economic crisis that has followed the COVID-19 pandemic. To do so, I use data
from the Swedish National Institute of Economic Research (Konjunkturinstitutet, KI)
and employ a simulation methodology similar in spirit to the one used by Banerjee et
al., (2020). I find that the firms’ classification stays stable. In particular, firms that
were classified as vulnerable (ICR<=1) using data in 2019, would have been classified
as vulnerable even using the simulated data for the year 2020. Full-fledged analyses
are reported in Cella (2021).
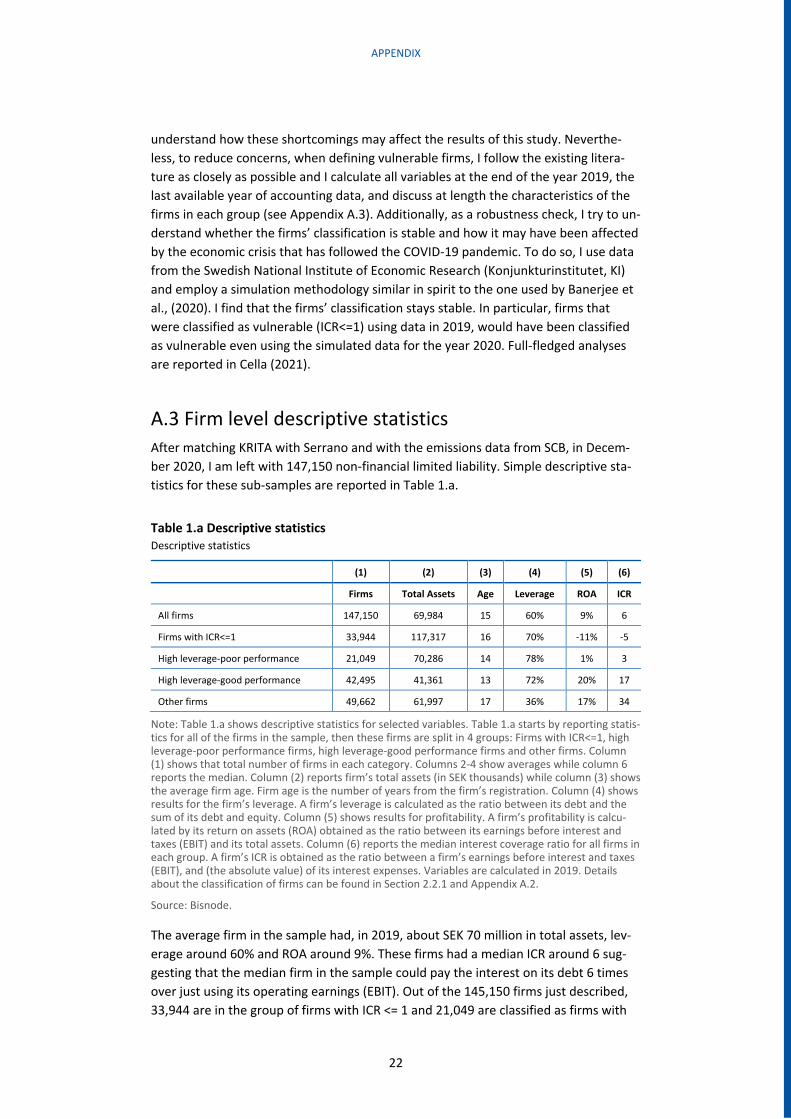
A.3 Firm level descriptive statistics
After matching KRITA with Serrano and with the emissions data from SCB, in Decem-
ber 2020, I am left with 147,150 non-financial limited liability. Simple descriptive sta-
tistics for these sub-samples are reported in Table 1.a.
Table 1.a Descriptive statistics Descriptive statistics
(1) (2) (3) (4) (5) (6)
Firms Total Assets Age Leverage ROA ICR
All firms 147,150 69,984 15 60% 9% 6
Firms with ICR<=1 33,944 117,317 16 70% -11% -5
High leverage-poor performance 21,049 70,286 14 78% 1% 3
High leverage-good performance 42,495 41,361 13 72% 20% 17
Other firms 49,662 61,997 17 36% 17% 34
Note: Table 1.a shows descriptive statistics for selected variables. Table 1.a starts by reporting statis-tics for all of the firms in the sample, then these firms are split in 4 groups: Firms with ICR<=1, high leverage-poor performance firms, high leverage-good performance firms and other firms. Column (1) shows that total number of firms in each category. Columns 2-4 show averages while column 6 reports the median. Column (2) reports firm’s total assets (in SEK thousands) while column (3) shows the average firm age. Firm age is the number of years from the firm’s registration. Column (4) shows results for the firm’s leverage. A firm’s leverage is calculated as the ratio between its debt and the sum of its debt and equity. Column (5) shows results for profitability. A firm’s profitability is calcu-lated by its return on assets (ROA) obtained as the ratio between its earnings before interest and taxes (EBIT) and its total assets. Column (6) reports the median interest coverage ratio for all firms in each group. A firm’s ICR is obtained as the ratio between a firm’s earnings before interest and taxes (EBIT), and (the absolute value) of its interest expenses. Variables are calculated in 2019. Details about the classification of firms can be found in Section 2.2.1 and Appendix A.2.
Source: Bisnode.
The average firm in the sample had, in 2019, about SEK 70 million in total assets, lev-
erage around 60% and ROA around 9%. These firms had a median ICR around 6 sug-
gesting that the median firm in the sample could pay the interest on its debt 6 times
over just using its operating earnings (EBIT). Out of the 145,150 firms just described,
33,944 are in the group of firms with ICR <= 1 and 21,049 are classified as firms with

APPENDIX
23
high leverage and poor performance with respect to their industry peers. In addition,
the group of high leverage and good performance contains about 42,495 firms while
about 49,662 firms are classified as other firms.
The firms in the group with ICR <= 1 were, on average, 16 years old and had around
SEK 117 million (median around SEK 3.7 million) in total assets, leverage of about 70%
and ROA around -11% while the median ICR is around -5. Hence, compared with the
average firm in the sample, the average firm with ICR <=1 was, in 2019, not only older
(16 vs 15 years), larger (SEK 117 million vs SEK 70 million) and at risk of insolvency (-5
vs 6) but also more levered (70% vs 60%) and less profitable (-11% vs 9%).
Table 1.a also shows that firms in the category high leverage-poor performance were,
on average, similar in age and size to those in the entire sample (with median total as-
sets of circa SEK 3 million). As expected, these firms had, on average, higher leverage
(78% vs 60%) and poorer performance (1% vs 9%) than the average firm in the sam-
ple. Importantly though, they also had a worse median ICR (3 vs 6). Yet, if we directly
compare firms with ICR <= 1 with high leverage-poor performance firms, those in the
first group appear to be larger (on average) and in a worse financial position, given
that on top of high leverage and poor performance they also had quite poor ICR (-5 vs
3).
The firms in the category of high leverage- good performance appear to be, on aver-
age, the smallest (SEK 41 million vs SEK 70 million) and youngest in the sample (13 vs
15 years). And, although almost by definition, these firms had, on average, high lever-
age (70% vs 60%) and perform better than the sample average (20% vs 9%), they also
show much higher median ICR than the entire sample (17 vs 6). Finally, the set of
“other firms” seems to contain firms that are, on average, older (17 vs 15 years),
slightly smaller (around SEK 62 million vs SEK 70 million), substantially less levered
(36% vs 60%), better performing (17% vs 9%), and, in median, very solvent (34 vs 6).
These latter two categories of firms therefore contain firms that were smaller, more
liquid, less levered and better performing than the rest of the firms in the sample.

SVERIGES RIKSBANK Tel +46 8 - 787 00 00 [email protected] www.riksbank.se
PRODUCTION SVERIGES RIKSBANK