bankers without borders - cbdviii contents global financial development report 2017/20182.1...
TRANSCRIPT


Bankers without Borders


GLOBAL FINANCIAL DEVELOPMENT REPORT 2017/2018
Bankers without Borders

© 2018 International Bank for Reconstruction and Development / The World Bank1818 H Street NW, Washington, DC 20433Telephone: 202-473-1000; Internet: www.worldbank.org
Some rights reserved
1 2 3 4 21 20 19 18
This work is a product of the staff of The World Bank with external contributions. The fi ndings, interpreta-tions, and conclusions expressed in this work do not necessarily refl ect the views of The World Bank, its Board of Executive Directors, or the governments they represent. The World Bank does not guarantee the accuracy of the data included in this work. The boundaries, colors, denominations, and other information shown on any map in this work do not imply any judgment on the part of The World Bank concerning the legal status of any territory or the endorsement or acceptance of such boundaries.
Nothing herein shall constitute or be considered to be a limitation upon or waiver of the privileges and immunities of The World Bank, all of which are specifi cally reserved.
Rights and Permissions
This work is available under the Creative Commons Attribution 3.0 IGO license (CC BY 3.0 IGO) http://creativecommons.org/licenses/by/3.0/igo. Under the Creative Commons Attribution license, you are free to copy, distribute, transmit, and adapt this work, including for commercial purposes, under the following conditions:
Attribution—Please cite the work as follows: World Bank. 2018. Global Financial Development Report 2017/2018: Bankers without Borders. Washington, DC: World Bank. doi:10.1596/978-1-4648-1148-7. License: Creative Commons Attribution CC BY 3.0 IGO
Translations—If you create a translation of this work, please add the following disclaimer along with the attribution: This translation was not created by The World Bank and should not be considered an offi cial World Bank translation. The World Bank shall not be liable for any content or error in this translation.
Adaptations—If you create an adaptation of this work, please add the following disclaimer along with the attribution: This is an adaptation of an original work by The World Bank. Views and opinions expressed in the adaptation are the sole responsibility of the author or authors of the adaptation and are not endorsed by The World Bank.
Third-party content—The World Bank does not necessarily own each component of the content contained within the work. The World Bank therefore does not warrant that the use of any third-party-owned indi-vidual component or part contained in the work will not infringe on the rights of those third parties. The risk of claims resulting from such infringement rests solely with you. If you wish to re-use a component of the work, it is your responsibility to determine whether permission is needed for that re-use and to obtain permission from the copyright owner. Examples of components can include, but are not limited to, tables, fi gures, or images.
All queries on rights and licenses should be addressed to World Bank Publications, The World Bank Group, 1818 H Street NW, Washington, DC 20433, USA; e-mail: [email protected].
ISBN (paper): 978-1-4648-1148-7ISBN (electronic): 978-1-4648-1196-8ISSN: 2304-957XDOI: 10.1596/978-1-4648-1148-7
Cover image: © Shutterstock. Used with permission. Further permission required for reuse.Cover design: Critical Stages, LLC.
The report refl ects information available up to June 30, 2017.

Contents
G L O B A L F I N A N C I A L D E V E L O P M E N T R E P O R T 2 0 1 7 / 2 0 1 8 v
Contents
Foreword . . . . . . . . . . . . . . . . . . . . . . . . . . . . . . . . . . . . . . . . . . . . . . . . . . . . . . . . . . . . . . . xi
Acknowledgments . . . . . . . . . . . . . . . . . . . . . . . . . . . . . . . . . . . . . . . . . . . . . . . . . . . . . . . xiii
Abbreviations and Glossary . . . . . . . . . . . . . . . . . . . . . . . . . . . . . . . . . . . . . . . . . . . . . . . xvii
Overview . . . . . . . . . . . . . . . . . . . . . . . . . . . . . . . . . . . . . . . . . . . . . . . . . . . . . . . . . . . . . . 11 Conceptual Framework, Stylized Facts, and the Role of Policy . . . . . . . . . . . . . . . . . . . 212 Brick-and-Mortar Operations of International Banks . . . . . . . . . . . . . . . . . . . . . . . . . . 413 Cross-Border Lending by International Banks . . . . . . . . . . . . . . . . . . . . . . . . . . . . . . . . 83
Statistical Appendixes . . . . . . . . . . . . . . . . . . . . . . . . . . . . . . . . . . . . . . . . . . . . . . . . . . . 119A Basic Data on Financial System Characteristics, 2013–15 . . . . . . . . . . . . . . . . . . . . . 121B Key Aspects of International Banking . . . . . . . . . . . . . . . . . . . . . . . . . . . . . . . . . . . . . 137
Bibliography . . . . . . . . . . . . . . . . . . . . . . . . . . . . . . . . . . . . . . . . . . . . . . . . . . . . . . . . . . . 143

vi C O N T E N T S GLOBAL FINANCIAL DEVELOPMENT REPORT 2017/2018
BOXES
O.1 Main Messages of This Report . . . . . . . . . . . . . . . . . . . . . . . . . . . . . . . . . . . . . . . . . .3
O.2 Views on International Banking by Practitioners: Global Financial Development Barometer . . . . . . . . . . . . . . . . . . . . . . . . . . . . . . . . . . . . . . . . . . . . . . . . . . . . . . . . . .5
O.3 Navigating This Report . . . . . . . . . . . . . . . . . . . . . . . . . . . . . . . . . . . . . . . . . . . . . .14
1.1 A Brief Historical Perspective on International Banking . . . . . . . . . . . . . . . . . . . . . .22
1.2 Useful Defi nitions for Understanding International Banking in the Financial System . . . . . . . . . . . . . . . . . . . . . . . . . . . . . . . . . . . . . . . . . . . . . . . . . . . . . . . . . . .23
1.3 The Rise of International Microfi nance Institutions . . . . . . . . . . . . . . . . . . . . . . . . .28
1.4 What Constitutes a Foreign Bank Claim? An Overview of the Banking Statistics of the Bank for International Settlements (BIS) . . . . . . . . . . . . . . . . . . . . . . . . . . . . .29
1.5 What Data Can Be Used to Understand the Activities of International Banks? . . . . .30
2.1 How Do Banks Expand Abroad? Branches or Subsidiaries? . . . . . . . . . . . . . . . . . . .45
2.2 Macroprudential Policies to Manage Credit Growth . . . . . . . . . . . . . . . . . . . . . . . .47
2.3 Foreign Banks in Africa: The Case of Ecobank . . . . . . . . . . . . . . . . . . . . . . . . . . . . .48
2.4 Dynamics of Postcrisis International Bank Retrenchment: From Globalization to Regionalization? . . . . . . . . . . . . . . . . . . . . . . . . . . . . . . . . . . . . . . . . . . . . . . . . . .51
2.5 Improving Rural Finance in Albania through Knowledge Exchange . . . . . . . . . . . . .53
2.6 Foreign Exchange Risk: The Case of Latvia . . . . . . . . . . . . . . . . . . . . . . . . . . . . . . .55
2.7 The Lending Cyclicality of Foreign Banks . . . . . . . . . . . . . . . . . . . . . . . . . . . . . . . . .57
2.8 The Transmission of International Monetary Policy via Foreign Banks in Mexico . .59
2.9 Lending Technologies of Foreign Banks and Their Approach to SME Lending . . . . .63
2.10 The Global Expansion of Chinese Banks . . . . . . . . . . . . . . . . . . . . . . . . . . . . . . . . .65
2.11 Decentralized Global Banks and Multiple-Point-of-Entry Resolution . . . . . . . . . . . .72
2.12 The European Banking Union . . . . . . . . . . . . . . . . . . . . . . . . . . . . . . . . . . . . . . . . . .74
2.13 Intermediate Cooperation Approaches: The ASEAN and Australia–New Zealand Cases . . . . . . . . . . . . . . . . . . . . . . . . . . . . . . . . . . . . . . . . . . . . . . . . . . . . . . . . . . . .75
2.14 Intermediate Cooperation Approaches: The WAEMU Case . . . . . . . . . . . . . . . . . . .76
3.1 The Big Sur: Beyond Banking . . . . . . . . . . . . . . . . . . . . . . . . . . . . . . . . . . . . . . . . . .93
3.2 Bank-Intermediated Trade Finance . . . . . . . . . . . . . . . . . . . . . . . . . . . . . . . . . . . . . .94
3.3 Foreign Banks and the International Transmission of Monetary Policy. . . . . . . . . . .98
3.4 Substitution Effects during Crises . . . . . . . . . . . . . . . . . . . . . . . . . . . . . . . . . . . . . .103
3.5 De-Risking in Correspondent Banking . . . . . . . . . . . . . . . . . . . . . . . . . . . . . . . . . .105
3.6 Fintech in China: An Overview . . . . . . . . . . . . . . . . . . . . . . . . . . . . . . . . . . . . . . . .109
FIGURESBO.2.1 The Impact of Global and Regional Banking . . . . . . . . . . . . . . . . . . . . . . . . . . . . . . .6
O.1 Cross-Border and Local Claims by Foreign Banks, 2005–15 . . . . . . . . . . . . . . . . . . .7
O.2 Number of Entries and Exits of Foreign Banks, 1995–2013 . . . . . . . . . . . . . . . . . . . .8
O.3 Share of Foreign Bank Assets, by Region, 2005–13 . . . . . . . . . . . . . . . . . . . . . . . . . .8

GLOBAL FINANCIAL DEVELOPMENT REPORT 2017/2018 C O N T E N T S vii
O.4 Direction of Cross-Border Bank Lending, before and after the Global Financial Crisis . . . . . . . . . . . . . . . . . . . . . . . . . . . . . . . . . . . . . . . . . . . . . . . . . . . . . . . . . . . . .9
O.5 Share of Regional Foreign Banks among Foreign Banks, Country-Level Averages, 1997–2013 . . . . . . . . . . . . . . . . . . . . . . . . . . . . . . . . . . . . . . . . . . . . . . . . . . . . . . . . .9
O.6 Trends in Bank Size . . . . . . . . . . . . . . . . . . . . . . . . . . . . . . . . . . . . . . . . . . . . . . . . .10
O.7 Share of Developing Countries with Restrictions on Foreign Bank Entry through Alternative Modes . . . . . . . . . . . . . . . . . . . . . . . . . . . . . . . . . . . . . . . . . . . . . . . . . .10
O.8 Share of Home and Host Countries That Tightened Macroprudential Policies, 2005–13 . . . . . . . . . . . . . . . . . . . . . . . . . . . . . . . . . . . . . . . . . . . . . . . . . . . . . . . . . .11
O.9 Change in Bank Lending Associated with a 1 Percent Increase in Growth in GDP per Capita . . . . . . . . . . . . . . . . . . . . . . . . . . . . . . . . . . . . . . . . . . . . . . . . . . . .15
O.10 Contribution of Local Deposits to Banks’ Total Funding . . . . . . . . . . . . . . . . . . . . .16
O.11 Volume of Debt Issuance over Time for Real Purposes . . . . . . . . . . . . . . . . . . . . . . .17
O.12 Average Change in Long-Term Debt Financing, by Ownership Type . . . . . . . . . . . .17
B1.2.1 How the International Banking System Works . . . . . . . . . . . . . . . . . . . . . . . . . . . . .23
1.1 Foreign Financial Infl ows to Developing Countries: Syndicated Loans, Bonds, and Foreign Direct Investment, 2000–15 . . . . . . . . . . . . . . . . . . . . . . . . . . . . . . . . . . . .26
1.2 Foreign Claims Reported to BIS by Counterparty Income Level, 2000–15 . . . . . . . .27
B1.4.1 A Taxonomy of Foreign Claims . . . . . . . . . . . . . . . . . . . . . . . . . . . . . . . . . . . . . . . .29
1.3 Lending by International Banks: Foreign Claims on Counterparty Nonbank Private Sector (Country-Level Average by Region) and on Counterparty Sectors (Country-Level Average by Income Level), 2005–14 . . . . . . . . . . . . . . . . . . . . . . . .31
1.4 Cross-Border Bank Flows: Cross-Border Claims on Counterparty Regions and Foreign Claims on Counterparty Economies by Position Type and Income Level, 2005–15 . . . . . . . . . . . . . . . . . . . . . . . . . . . . . . . . . . . . . . . . . . . . . . . . . . . . . . . . . .32
1.5 Foreign Bank Presence through Subsidiaries: Share of Foreign Banks of Total Banks (Country-Level Average by Region, 1997–2013) and Share of Foreign Bank Assets of Total Bank Assets (Country-Level Average by Region, 2005–13) . . .33
1.6 Rise of South–South Banking: Foreign Claims by Banks in BIS-Reporting Countries (2003–15) and Nationality of Majority Ownership of Banks in Developing Countries (1995–2013) . . . . . . . . . . . . . . . . . . . . . . . . . . . . . . . . . . . . .34
1.7 Total Assets of Largest Banks (Absolute Amounts, on a Rolling Basis) and Size of Assets in Relation to National Economies (Combined Assets of Top Five Banks, Country-Level Average by Region), 2005–14 . . . . . . . . . . . . . . . . . . . . . . . .35
1.8 Regulatory Restrictions on Foreign Bank Entry and Ownership (Country-Level Average), 2000–11 . . . . . . . . . . . . . . . . . . . . . . . . . . . . . . . . . . . . . . . . . . . . . . . . . .35
B2.3.1 Distribution of Ecobank’s Branches and Offi ces (2015) and Assets (2011 and 2015) . . . . . . . . . . . . . . . . . . . . . . . . . . . . . . . . . . . . . . . . . . . . . . . . . . .49
B2.4.1 Growth over Time of Foreign Banks by Number of Subsidiaries (2000–13) and Average Assets (2005–13) . . . . . . . . . . . . . . . . . . . . . . . . . . . . . . . . . . . . . . . . .51
B2.4.2 Acquisitions, Transferals, Greenfi eld Entries, and Closures of Foreign Banks, 2000–13 . . . . . . . . . . . . . . . . . . . . . . . . . . . . . . . . . . . . . . . . . . . . . . . . . . . . . . . . . .52
B2.7.1 Change in Bank Lending Associated with a 1 Percent Increase in GDP per Capita, 1999–2010 . . . . . . . . . . . . . . . . . . . . . . . . . . . . . . . . . . . . . . . . . . . . . . . . . . . . . . . .57

viii C O N T E N T S GLOBAL FINANCIAL DEVELOPMENT REPORT 2017/2018
2.1 Contribution of Local Deposits, Equity, and Short-Term and Long-Term Funding to Total Bank Funding, 2000–14 . . . . . . . . . . . . . . . . . . . . . . . . . . . . . . . .58
B2.10.1 Chinese Banks in the World: A Snapshot of Chinese Large Commercial Banks, 2005–15 . . . . . . . . . . . . . . . . . . . . . . . . . . . . . . . . . . . . . . . . . . . . . . . . . . . . . . . . . .65
2.2 Trends over Time of Foreign Bank Subsidiaries in Developing Countries by the Type of Country in Which Each Bank Is Headquartered, 2001–13 . . . . . . . . . . . . .67
B2.11.1 Liquidity and Cross-Border Funding of European Bank Subsidiaries in Europe and Central Asia and Latin America and the Caribbean Regions . . . . . . . . . . . . . . .72
3.1 Restrictions to Capital Flows: Average across Economies of the South, 1990–2013 . . . . . . . . . . . . . . . . . . . . . . . . . . . . . . . . . . . . . . . . . . . . . . . . . . . . . . . .86
3.2 Direction of Cross-Border Bank Lending, Selected Years . . . . . . . . . . . . . . . . . . . . .87
3.3 Average Net Syndicated Loan Outfl ows by Region, 2001–14 . . . . . . . . . . . . . . . . .89
3.4 Average Share of Intraregional Syndicated Loans of Total Cross-Border Syndicated Loans, by Region, 2001–14 . . . . . . . . . . . . . . . . . . . . . . . . . . . . . . . . . .89
3.5 Evolution of Cross-Border Bank Claims by Partner Economy, 2001–14 . . . . . . . . .90
3.6 Evolution of Cross-Border Syndicated Loan Flows by Partner Economy, 1996–2014 . . . . . . . . . . . . . . . . . . . . . . . . . . . . . . . . . . . . . . . . . . . . . . . . . . . . . . . .91
3.7 Share of Lending to the South from the North and the South, 2001–14 . . . . . . . . . .92
B3.1.1 Direction of Foreign Direct Investment and Cross-Border Portfolio Investments, Selected Years . . . . . . . . . . . . . . . . . . . . . . . . . . . . . . . . . . . . . . . . . . . . . . . . . . . . . .93
B3.2.1 Bank-Intermediated Trade Finance in Emerging and Advanced Economies: Quarterly Trends, 2005–13 . . . . . . . . . . . . . . . . . . . . . . . . . . . . . . . . . . . . . . . . . . .95
3.8 Total Amount Raised in Syndicated Loan Markets by High-Income and Developing Countries, 1991–2014 . . . . . . . . . . . . . . . . . . . . . . . . . . . . . . . . . . . . . .97
3.9 Volume and Composition of Loan Issuance over Time, 2003–14 . . . . . . . . . . . . . .100
3.10 Composition of Debt Issuance over Time, 2003–14 . . . . . . . . . . . . . . . . . . . . . . . .101
B3.5.1 Correspondent Banking: Recent Developments . . . . . . . . . . . . . . . . . . . . . . . . . . .106
B3.6.1 Fintech “Unicorns”: Fintech Firms with a Valuation of over $1 Billion, 2016 . . . .109
3.11 How Blockchain Works . . . . . . . . . . . . . . . . . . . . . . . . . . . . . . . . . . . . . . . . . . . . .112
3.12 The Remittances Market, 2011–16 . . . . . . . . . . . . . . . . . . . . . . . . . . . . . . . . . . . .113
MAPS
2.1 South–South Banking Subsidiary Networks, 2005 and 2014 . . . . . . . . . . . . . . . . . .43
3.1 South–South Lending Connections . . . . . . . . . . . . . . . . . . . . . . . . . . . . . . . . . . . . . .88
A.1 Depth—Financial Institutions . . . . . . . . . . . . . . . . . . . . . . . . . . . . . . . . . . . . . . . . .129
A.2 Access—Financial Institutions. . . . . . . . . . . . . . . . . . . . . . . . . . . . . . . . . . . . . . . . .130
A.3 Effi ciency—Financial Institutions . . . . . . . . . . . . . . . . . . . . . . . . . . . . . . . . . . . . . .131
A.4 Stability—Financial Institutions . . . . . . . . . . . . . . . . . . . . . . . . . . . . . . . . . . . . . . .132
A.5 Depth—Financial Markets . . . . . . . . . . . . . . . . . . . . . . . . . . . . . . . . . . . . . . . . . . .133
A.6 Access—Financial Markets . . . . . . . . . . . . . . . . . . . . . . . . . . . . . . . . . . . . . . . . . . .134
A.7 Effi ciency—Financial Markets . . . . . . . . . . . . . . . . . . . . . . . . . . . . . . . . . . . . . . . .135
A.8 Stability—Financial Markets. . . . . . . . . . . . . . . . . . . . . . . . . . . . . . . . . . . . . . . . . .136

GLOBAL FINANCIAL DEVELOPMENT REPORT 2017/2018 C O N T E N T S ix
TABLES
BO.2.1 Selected Results from the Financial Development Barometer . . . . . . . . . . . . . . . . . . .6
B1.3.1 Evolution of Greenfi eld MFIs in Sub-Saharan Africa during Initial Years of Operation . . . . . . . . . . . . . . . . . . . . . . . . . . . . . . . . . . . . . . . . . . . . . . . . . . . . . . . . .28
B3.3.1 Monetary Policy Interest Rates and the Cross-Border Syndicated Loan Volume . . . .99
3.1 Debt Issuance Change during the Global Financial Crisis . . . . . . . . . . . . . . . . . . . .101
B3.4.1 Market Choice and Domestic Banking Crises . . . . . . . . . . . . . . . . . . . . . . . . . . . . .104
A.1 Economies and Their Financial System Characteristics, 2013–15 . . . . . . . . . . . . . .121
A.1.1 Depth—Financial Institutions . . . . . . . . . . . . . . . . . . . . . . . . . . . . . . . . . . . . . . . . .129
A.1.2 Access—Financial Institutions. . . . . . . . . . . . . . . . . . . . . . . . . . . . . . . . . . . . . . . . .130
A.1.3 Effi ciency—Financial Institutions . . . . . . . . . . . . . . . . . . . . . . . . . . . . . . . . . . . . . .131
A.1.4 Stability—Financial Institutions . . . . . . . . . . . . . . . . . . . . . . . . . . . . . . . . . . . . . . .132
A.1.5 Depth—Financial Markets . . . . . . . . . . . . . . . . . . . . . . . . . . . . . . . . . . . . . . . . . . .133
A.1.6 Access—Financial Markets . . . . . . . . . . . . . . . . . . . . . . . . . . . . . . . . . . . . . . . . . . .134
A.1.7 Effi ciency—Financial Markets . . . . . . . . . . . . . . . . . . . . . . . . . . . . . . . . . . . . . . . .135
A.1.8 Stability—Financial Markets. . . . . . . . . . . . . . . . . . . . . . . . . . . . . . . . . . . . . . . . . .136
B.1 Foreign Penetration and Internationalization of Financial Systems, 2014 . . . . . . . .137


G L O B A L F I N A N C I A L D E V E L O P M E N T R E P O R T 2 0 1 7 / 2 0 1 8 xi
Foreword
This Global Financial Development Report is a key component in the
ongoing debate over the role of international banking in supporting economic development and promoting shared prosperity.
This report, the fourth in its series, comes at a critical time when the global reform agenda is shaping fi nancial globalization—in particular, banking. During the decade prior to the 2007–09 global fi nancial crisis, bank-ing activities across national borders increased dramatically. In many cases, the trend brought benefi ts, including additional capital, liquid-ity, and technological improvements, which resulted in greater effi ciency and fi nancial development. The global fi nancial crisis, how-ever, led to a reevaluation of the virtues of bank globalization, with global banks seen as culpable for transmitting the fi nancial crisis across borders. In fact, the Financial Stabil-ity Board (FSB), the G20, and policy makers throughout the developing world voiced con-cerns about the effects of global banking.
The Global Financial Development Report 2017/2018 offers new research and data that help fi ll gaps in the knowledge of international banking and contributes key insights to the policy discussion. The report provides stylized facts and examines existing and new evidence
of the causes and effects of bank globaliza-tion—in particular, for economic growth, shared prosperity, and poverty reduction.
For many years, the World Bank Group has supported developing countries in reap-ing the benefi ts of international banking while also minimizing risks to fi nancial stability. This work is even more critical as the world seeks to meet the rising aspirations of the poor. Crowding in private sector investment will transform the billions of dollars that are available in development assistance into tril-lions for investment in developing countries. International banks are one conduit for these private sector investments, and effective fi nan-cial sector policies will be key to creating the stability that can attract private capital.
The report provides a careful review and synthesis of recent and new research; it also notes where more research is needed. It argues that international banking is no panacea for guaranteeing fi nancial development and sta-bility, and that the right policies are central to generating benefi ts, while avoiding negative repercussions associated with cross-border banking. Consequently, to secure contract enforcement, governments and international bodies must strengthen regulations, improve information availability, and enhance legal

xii F O R E W O R D GLOBAL FINANCIAL DEVELOPMENT REPORT 2017/2018
governments, international fi nancial institu-tions, nongovernmental organizations, think tanks, academics, the private sector, donors, and the broader development community.
Jim Yong KimPresident
The World Bank Group
and judicial systems. In designing policies to overcome institutional weaknesses, it is also important to take into account the differences in bank characteristics and conditions in both home and host countries.
We hope that this year’s Global Finan-cial Development Report will prove useful to a wide range of stakeholders, including

G L O B A L F I N A N C I A L D E V E L O P M E N T R E P O R T 2 0 1 7 / 2 0 1 8 xiii
The Global Financial Development Report 2017/2018 refl ects the efforts
of a broad and diverse group of experts, both inside and outside the World Bank Group. The report was produced by the World Bank Research Department in collaboration with the Finance and Markets Global Practice, the Chief Economist’s Offi ce at the International Finance Corporation (IFC), and the Multi-lateral Investment Guarantee Agency (MIGA). Moreover, it includes inputs from a wide range of units within the World Bank Group.
Asli Demirgüç-Kunt was the report’s direc-tor. Ata Can Bertay was the task manager of the project. The main authors in charge of the chapters were: Ata Can Bertay and Miriam Bruhn (chapter 1), Robert Cull and Claudia Ruiz Ortega (chapter 2), Juan Jose Cortina Lorente, Ruth Llovet Montanes, and Sergio Schmukler (chapter 3). Nan Zhou was respon-sible for the statistical appendices and was part of the core team. Maria Soledad Mar-tínez Pería and Jeanne Verrier contributed to the concept note. Other authors that provided key contributions to the chapters include Nan Zhou (chapters 1, 2, and 3), and Maria Soledad Martínez Pería and Katia D’Hulster (chapter 2). Leila Aghabarari, Serhat Guven, and Can Sever provided excellent research
assistance. Inputs were received from Saniya Ansar (chapter 1), Leila Aghabarari (chap-ter 2, box 2.3), David Gerbrands and Bjorn Schrijver (chapter 2, box 2.5), Javier Pablo Garcia Tolonen, and Santiago Fernandez de Lis Alonso (chapter 2, box 2.11), Nan Zhou (chapter 2, box 2.10, chapter 3, boxes 3.2, 3.5, and 3.6).
Shanta Devarajan (Senior Director of Development Economics), Mahmoud Mohieldin (Senior Vice President), and Joa-quim Levy (Managing Director and World Bank Group Chief Financial Offi cer) provided overall guidance and valuable advice.
External advisors to the report included Viral Acharya (New York University, Stern School of Business, and Deputy Governor of Reserve Bank of India); Franklin Allen (Executive Director of the Brevan Howard Centre and Professor of Finance and Eco-nomics at Imperial College London); Thor-sten Beck (Professor of Banking and Finance at Cass Business School in London); Allen Berger (Professor of Banking and Finance at University of South Carolina); Charles Calo-miris (Henry Kaufman Professor of Financial Institutions at Columbia University); Stijn Claessens (Head of Financial Stability Policy, Bank of International Settlements); Patrick
Acknowledgments

xiv A C K N O W L E D G M E N T S GLOBAL FINANCIAL DEVELOPMENT REPORT 2017/2018
and Alfonso Garcia Mora (chapter 3) and the participants of these seminars.
In the Bank-wide review of the concept note and of the report, substantial comments were received from Mahmoud Mohieldin (Senior Vice President); Yvonne M. Tsikata (Vice President and Corporate Secretary); Michael Edwards, Erik Feyen, Aurora Fer-rari, and Pietro Calice (all Finance and Mar-kets Global Practice); Keiko Honda, Merli Baroudi, Dan Biller, Persephone Economou, Paul Barbour, Gianfilippo Carboni, and Petal Jean Hackett (all Multilateral Invest-ment Guarantee Agency); Nena Stoiljkovic Hans Peter Lankes, Bill Haworth, Facundo Martin, and Mahima Khanna (all Interna-tional Finance Corporation); Xiaoqing Yu, Shabih Mohib, Tatiana Nenova, and Nikola Spatafora (all East Asia and Pacifi c Region); Mariam J. Sherman and David Gould (both Europe and Central Asia Region); Antonella Bassani, Samia Msadek, Jean Denis Pesme, Christina Wood, and Omer Karasapan (all Middle East and North Africa Region); Martin Rama and Martin Melecky (both South Asia Region); Makhtar Diop, Cesar Calderon, Souleymane Coulibaly, Vinaya Swaroop, and Luis Diego Barrot (all Sub-Saharan Africa Region); Caroline Heider, Anjali Kumar, Beata Lenard, and Stoyan Tenev (All Independent Evaluation Group); Axel van Trotsenburg, Lisa Finneran, Stuart James Stephens, and Anton Dobronogov (all Development Finance Vice Presidency); Man-uela V. Ferro, Theo Thomas, Ashley Taylor, and Jane Hwang (all Operations Policy and Country Services Vice Presidency); Caren Grown and Tamova Christie (both Gender Cross-Cutting Solution Area); Alberto Ninio and Sandie Okoro (both Legal Vice Presi-dency); and Galina J. Mikhlin-Oliver (Integ-rity Vice Presidency).
The report would not be possible without the production team, including Patricia Kata-yama (acquisitions), Aziz Gokdemir (publish-ing offi cer), Susan Graham (project manager), Sabra Ledent (copy editor), and Deb Appel-Barker and Nora Leah Ridolfi (print coor-dinators). Bruno Bonansea was responsible
Honohan (Senior Fellow at the Peterson Insti-tute for International Economics and Former Governor of the Central Bank of Ireland); Harry Huizinga (Professor at Tilburg Univer-sity); and Ross Levine (Willis H. Booth Chair in Banking and Finance at the University of California at Berkeley).
The team also received valuable peer reviews and guidance from other staff mem-bers at the World Bank Group, including Dan Biller, Marcos Brujis, Ted Haoquan Chu, Augusto de la Torre, Neil Gregory, Ceyla Paz-arbasioglu, Gloria Grandolini, and Peer Stein. Aart Kraay reviewed the concept note and drafts of the report for consistency and qual-ity multiple times.
Ted Haoquan Chu and Neil Gregory were the key contacts at IFC, Ceyla Pazarbasioglu at the Finance and Markets Global Practice, and Dan Biller at MIGA. The authors ben-efi ted from informal discussions, and received valuable suggestions and other contributions from Irina Astrakhan, Stefan Avdjiev, Ana Maria Aviles, Steen Byskov, Cesar Calde-ron, Pietro Calice, Katia D’Hulster, Shantay-anan Devarajan, Michael Edwards, Aurora Ferrari, Neil Gregory, Mario Guadamillas, David Michael Gould, Erik Feyen, William Haworth, Frank Heemskerk, Leora Klapper, Emmanuel K. Lartey, William Maloney, Yira J. Mascaro, Martin Melecky, Yigal Menashe, Margaret J. Miller, Cedric Mousset, Thomas Rehermann, Matthew Saal, James Seward, Lin Shi, Susan K. Starnes, and Emile J. M. Van der Does de Willebois. Data contribu-tions were received from Subika Farazi and Diego M. Sourrouille.
A background research conference was held jointly with the Federal Reserve Bank of Chicago, and an edited volume with all con-tributions was produced (Demirgüç-Kunt, Evanoff, and Kaufman 2016). The individ-ual chapters of the report were presented at Global Financial Development seminars. The seminars were presented by members of the core team and benefi ted from thorough dis-cussions from David Michael Gould and Erik Feyen (chapter 1), Ted Haoquan Chu and Steen Byskov (chapter 2), Mario Guadamillas

GLOBAL FINANCIAL DEVELOPMENT REPORT 2017/2018 A C K N O W L E D G M E N T S xv
feedback from the World Bank Data Help Desk for the team to enhance the statistics of the Database.
The authors would like to thank the many country officials and other experts who participated in the surveys underlying this report, including the Financial Development Barometer.
Financial support from the Knowledge for Change Program’s research support budget is gratefully acknowledged.
for maps, and Sheela Na Cao designed the cover. Roula Yazigi assisted the team with the website. The communications team included Phil Hay and Ryan Douglas Hahn. Excellent administrative and budget assistance was pro-vided by Tourya Tourougui. William Prince, Tariq Afzal Khokhar, Jomo Tariku, Ana Flo-rina Pirlea, and Omar Hadi supported the publication of the Global Financial Devel-opment Database and the Financial Devel-opment Data Tables, associated with the report. Ana Florina Pirlea provided valuable


G L O B A L F I N A N C I A L D E V E L O P M E N T R E P O R T 2 0 1 7 / 2 0 1 8 xvii
AML/CFT anti-money laundering and combating the fi nancing of terrorism BCBS Basel Committee on Banking SupervisionBIS Bank for International SettlementsCBS Consolidated Banking Statistics, BISCGFS Committee on the Global Financial SystemsEAP East Asia and Pacifi cEBRD European Bank for Reconstruction and DevelopmentECA Europe and Central AsiaEU European UnionFDI foreign direct investmentFSB Financial Stability BoardG-20 Group of 20G-SIB global systematically important bankIC immediate counterpartyIFC International Finance CorporationIMF International Monetary FundLAC Latin America and the CaribbeanLBS Locational Banking Statistics, BISM&A mergers and acquisitionsMENA Middle East and North AfricaNPL nonperforming loanOECD Organisation for Economic Co-operation and DevelopmentROA return on assetsSAR South AsiaSME small and medium enterpriseSRM Single Resolution MechanismSSA Sub-Saharan AfricaSSM Single Supervisory MechanismTLAC total loss absorbing capacityUR ultimate riskWTO World Trade Organization
Note: All dollar amounts are U.S. dollars ($) unless otherwise indicated.
Abbreviations and Glossary

xviii A B B R E V I A T I O N S A N D G L O S S A R Y GLOBAL FINANCIAL DEVELOPMENT REPORT 2017/2018
GLOSSARY
Country A territorial entity for which statistical data are maintained and pro-vided internationally on a separate and independent basis (not neces-sarily a state as understood by international law and practice). The term, used interchangeably with economy, does not imply political independence or offi cial recognition by the World Bank.
Domestic bank A bank restricted to the home country operations, neither owning for-eign subsidiaries nor being owned by any foreign banking entity.
Financial Conceptually, a process of reducing the costs of acquiring information, development enforcing contracts, and making transactions.
Financial system A country’s fi nancial institutions (banks, insurance companies, and other nonbank fi nancial institutions) and fi nancial markets (such as those in stocks, bonds, and fi nancial derivatives). Also includes the fi nancial infrastructure (for example, credit information–sharing sys-tems and payments and settlement systems).
Global bank Conceptually, a bank with signifi cant asset size and an international reach of business. Although there is no single standard defi nition, in this report global bank refers to a large international bank with activi-ties in multiple regions.
Institutional investors Public and private pension funds, life insurance companies, non–life insurance companies, and mutual funds.
International bank A bank with signifi cant cross-border operations or international subsidiaries.
Nonbank fi nancial Institutional investors and other nonbank fi nancial intermediariesinstitutions (such as leasing companies and investment banks).
Offshore fi nancial A country or jurisdiction providing fi nancial services to nonresidentscenter beyond a scale commensurate with the size and fi nancing of the
domestic economy.
Regional bank A bank owning foreign subsidiaries with a focus on a specifi c host region or set of countries.

Overview
G L O B A L F I N A N C I A L D E V E L O P M E N T R E P O R T 2 0 1 7 / 2 0 1 8 1
Successful international integration, sup-ported by sound national policy and effective international cooperation,
has underpinned most experiences of rapid growth, shared prosperity, and reduced pov-erty. Perhaps no sector than banking better il-lustrates both the potential benefi ts and perils of deeper international integration. Interna-tional banks—banks that do business outside the country where they are headquartered—are often considered important contributors to sustainable fi nancial development, by pro-moting economic growth. The decade before the 2007–09 global fi nancial crisis was char-acterized by a signifi cant increase in fi nan-cial globalization, particularly for banking institutions, which coincided with increases in bank size to unprecedented levels (Claes-sens 2016; Demirgüç-Kunt, Evanoff, and Kaufman 2016). These changes were mani-fested in both a rise in cross-border lending and a growing participation of foreign banks around the world as they became an integral part of fi nancial systems, especially in devel-oping countries.
International banking activities may con-tribute to faster growth, greater welfare, and enduring stability in two important ways: fi rst, by bringing much-needed capital, expertise, and new technologies, thereby leading to more
competitive banking systems; and second, by enabling risk sharing and diversifi cation, thereby smoothing out the effects of domestic shocks (Claessens, Demirgüç-Kunt, and Huiz-inga 2001; Cull and Martínez Pería 2010; Goldberg, Dages, and Kinney 2000). Depend-ing on the conditions, however, international banking may also lead to costs. Risk sharing will inevitably expose host countries to sys-temic risks from time to time; and more re-cently, international banks have been criticized for playing a role in the transmission of shocks across borders during the global fi nancial cri-sis (De Haas and van Lelyveld 2014). Cross-border bank fl ows also play a crucial role in transmitting global liquidity to local fi nancial systems, and international banking may pro-mote destabilizing boom-bust cycles in poor institutional environments (Borio, McCauley, and McGuire 2011; Bruno and Shin 2015a).
In the wake of the global fi nancial crisis, the globalization trend has been partially re-versed, as multinational banks from devel-oped countries—“the North”—have scaled back their international operations, coincid-ing with a general backlash against globaliza-tion. While banks based in high-income coun-tries drove exits, developing country banks continued their international expansion, accounting for the bulk of new entry into

2 O V E R V I E W GLOBAL FINANCIAL DEVELOPMENT REPORT 2017/2018
to contribute to this debate on the benefi ts and costs of inter national banks and provide evidence-based policy advice. The report ex-amines both new and existing evidence on the activities of international banks, focusing on their international brick-and-mortar opera-tions as well as their cross-border activities, and their drivers and economic effects. Over-all, the report sifts through research evidence to shed light on the following long-standing policy concerns: To what extent should devel-oping countries trust international banks with the local provision of their fi nancial services, given that they may retrench and lead to a sig-nifi cant erosion of skills and services due to pressures from their home countries? Should developing country authorities be especially cautious in their approach to admitting South–South international banking activities? Is a lack of experience or insuffi cient home country prudential regulation and supervision a concern, or is it offset by the region-specifi c knowledge that gives these banks a better po-tential to provide banking services in develop-ing countries? Does allowing foreign banks to have a larger market share risk reducing ac-cess to and increasing the price of banking ser-vices for small and medium-sized enterprises (SMEs) and lower-income households? Fi-nally, how is technology—especially fi nancial-technology (fi ntech) fi rms that work globally and across borders through digital products—likely to infl uence international banking? The report provides a synthesis of what we know, as well as areas where more evidence is still needed and recent developments that raise many new questions. Box O.1 provides the main messages.
Policy makers and other fi nancial sector practitioners are divided on policies toward foreign bank entry. According to the fourth Financial Development Barometer—an infor-mal poll of policymakers in developing coun-tries undertaken for this Global Financial Development Report; see box O.2—respon-dents recognize both positive and negative effects of foreign banks. Although foreign banks are credited with providing fi nancial services to fi rms and households and with in-troducing new ways of improving access to
foreign markets. Cross-border bank claims and syndicated loans also saw signifi cant retrenchments, but “South–South” transac-tions—from developing countries to other de-veloping countries—started growing, starting to replace the leading role of “North–South” transactions in the aftermath of the global fi nancial crisis. This greater South–South ac-tivity has also coincided with regionalization, both in the roster of foreign banks in many host countries and in cross-border fl ows.
The full causes and implications of these changes are not yet completely understood. Postcrisis supervisory and regulatory reforms intended to enhance bank balance sheets and fi nancial stability, such as more stringent capital requirements for banks and macro-prudential regulations, have been at least par-tially responsible for these changes, affecting the supply of credit. During the crisis, banks also reduced lending as demand for external fi nancing abroad declined, and sovereign and other risks increased. In addition, the crisis highlighted the need for greater cooperation in resolving troubled banks with multina-tional operations and a more explicit ex ante understanding of the associated burden shar-ing. More generally, the regionalization of in-ternational banking is prompting countries to contemplate regional regulatory and supervi-sory approaches.
Given these developments, international banking has attracted heightened interest from policy makers, researchers, and other fi nancial sector stakeholders. The global fi nancial crisis has certainly led to a reevaluation of the po-tential benefi ts and costs of bank globalization because many observers perceive global banks to have been mainly responsible for the trans-mission of shocks across borders during the recent fi nancial crisis (Demirgüç-Kunt, Eva-noff, and Kaufman 2016). Concerns about the effects of international banking—in par-ticular, global systemically important banks (G-SIBs), which are deemed to be too big and interconnected to fail—have been voiced by the Financial Stability Board (FSB), the G-20, and policy makers around the world.
The Global Financial Development Report 2017/2018: Bankers without Borders seeks

GLOBAL FINANCIAL DEVELOPMENT REPORT 2017/2018 O V E R V I E W 3
BOX O.1 Main Messages of This Report
Following a decade of increased globalization, international banking suffered a setback after the global fi nancial crisis. There have been large reduc-tions in cross-border flows, and less foreign bank entry. The trends in foreign bank entry differ across countries, however. While developed country banks retrenched, developing country banks continued to invest abroad, both through cross-border and brick-and-mortar operations, leading to a more regional-ized banking system with greater South–South pres-ence. Hence, international bank lending remains an important source of fi nance for developing countries, although its composition has changed since the crisis. And although regulatory barriers to foreign banking increased over this period, large international banks continued to become larger.
Remaining open despite rising protectionism is important for countries to continue to benefi t from global fl ows of funds, knowledge, and opportunity. International banking activities have the potential to improve the degree of competition in the local banking sector, help upgrade skills, and improve the effi ciency of resource allocation. Risks can be shared and diversifi ed. Through the threat of exit, interna-tional banking can also discipline domestic fi nan-cial policies, regulations, and supervisory practices and can weaken the political entrenchment between domestic financial institutions and governments. Overall, more capital and increased efficiency of allocation will promote faster economic development and greater fi nancial stability.
However, international banking is no panacea for guaranteeing fi nancial development and stabil-ity. Openness also introduces more volatility and exposes countries to foreign exchange risks, foreign monetary policy shocks, and other mismatches. In weak institutional environments with poor informa-tion, inadequate contract enforcement, and weak regulation and supervision, global fi nance may lead to destabilizing boom-bust cycles; and competition from foreign banks may drive out domestic banks and reduce access to fi nance and inclusion. More-over, risk sharing also has a downside. International banks that export risks will also import them. And international banking can magnify distortions in domestic bank policy, regulation, and safety nets.
There is an important role for policy in maximiz-ing international banking’s benefi ts and minimizing its costs. International banking can have important benefi ts for development by improving effi ciency and risk sharing, but benefi ts do not accrue unless the institutional environment is developed and the right policies are adopted. Research suggests that institu-tionally better developed countries tend to reap both more of the development and risk-sharing benefi ts of international banking. Specifi cally, good information sharing, property rights, contract enforcement, and strong regulation and supervision are key. Of par-ticular importance, these improvements prevent for-eign banks from just displacing domestic banks and exploiting regulatory weaknesses. And with strong institutions, both the foreign banks and domestic banks that are now exposed to greater competition can go downmarket and improve access and inclu-sion for small and medium-sized enterprises (SMEs) and households that were previously excluded.
Recent research suggests that for designing effec-tive policies, it is important to keep in mind differ-ences in bank characteristics and home and host country conditions. For development considerations, larger banks and those that are culturally closer, with a greater share of domestic fi nancial intermedia-tion including deposit taking, tend to provide better access to SMEs and households and are less likely to focus only on large corporate customers. As for sta-bility, the risk-sharing benefi ts of globalization need to be considered over the long term. Cross-border fl ows tend to be more volatile and less resilient than a brick-and-mortar bank presence. Foreign banks with a greater commitment, as refl ected in closeness both in distance to headquarters and in culture, that have larger local market shares, and rely more heavily on local funding, are more willing both to incur tempo-rary costs when faced with external shocks and to support the local economy.
It is challenging to encourage the right type of for-eign bank presence or forms of capital fl ows without causing distortions. Many supervisory agencies no longer rely on the home supervisor of their local affi l-iates for ensuring stability. Compared with branches, foreign subsidiaries can be self-sufficient—with high capitalization requirements and a high share
(box continued next page)

4 O V E R V I E W GLOBAL FINANCIAL DEVELOPMENT REPORT 2017/2018
BOX O.1 Main Messages of This Report (continued)
of funding through retail deposits—which therefore improves stability. Among subsidiaries, a mix of new, greenfi eld entrants and takeovers or mergers of existing domestic banks by foreign banks may also help diversify risks. Research has found that foreign bank entry has a stronger positive effect on compe-tition with greenfi eld investments than with merg-ers and acquisitions, though greenfi eld investments are not necessarily associated with greater access to fi nancial services. Better integrated with the parent bank, greenfi elds may also help more during local downturns; however, investment through acquisi-tions may yield greater benefi ts in response to home country or global shocks. In addition, to the extent possible, host economies can opt—for example, dur-ing privatization—to allow foreign banks from home countries with stricter bank regulations, or to diver-sify foreign banks by their home country to mitigate the impact of foreign shocks from a specifi c country. For many countries, however, options to shape for-eign entry may be more circumscribed, depending on their obligations under multilateral and preferential services trade agreements.
The regulation and supervision of international banking are complex, and should involve extensive cross-border coordination. There is a need for more intensive cooperation between home and host coun-tries, going beyond memorandums of understanding and information exchanges. This need refl ects the limited ability of host country authorities to super-vise appropriately larger international banks, along with the distorted incentives of both home and host country supervisors who do not consider the effects of their decisions beyond their borders. Ideally, coor-dination should include an international agreement on crisis management that explicitly outlines respon-sibilities and processes to follow in case of a resolu-tion. With the changing composition of the industry and the increased role of technology, coordinating regulation and supervision remains a major chal-lenge for policy makers. And because this is very much an ongoing agenda, a more in-depth analysis of regulatory reform will be included in a future Global Financial Development Report.
The rise of South–South banking and banking’s greater regionalization come with benefi ts but also
possible risks. Greater South–South banking is likely to increase local competition and fi nancial develop-ment, as any other entry would. But to the extent that banks from the South are more familiar with the institutions and the culture of other developing countries, they tend to be better at serving smaller and more informationally opaque segments, such as SMEs and households. They are also likely to be more committed to host countries and less likely to exit during downturns. However, to the extent that shocks are more correlated within regions than glob-ally, greater regionalization will limit risk sharing and the diffusion of the best banking technology and skills. Greater South–South banking also entails additional risks from having foreign banks from less-regulated and institutionally weaker home countries. The net effect of regionalization is not clear a priori and is a topic for further research. Questions remain about whether there is an optimal mix of foreign entry through global and regional banks in order to maximize the benefi ts and minimize the costs of bank internationalization.
After the crisis, there was also a disintermediation trend, whereby cross-border bank credit was substi-tuted with capital market funding. The importance of well-functioning domestic capital markets as a “spare tire” was confi rmed during the global fi nancial cri-sis, when in many countries they substituted at least partially for the decline in bank funding. The pat-terns illustrated here highlight not only the benefi ts of having alternative sources of fi nance but also the need to broaden the policy discussion to consider the fi nancial system as a whole, and not focus just on one type of fi nancial intermediary such as global banks. These shifts do not alleviate the funding constraints of smaller fi rms without access to markets, however. For smaller fi rms with limited or no access to capital markets, the important role of banks remains.
Fintech developments may have important impli-cations for the global banking landscape. Fintech fi rms are rapidly expanding and speeding up trans-actions at a lower cost, and developing technologies for data security, risk management, mobile banking and alternative currencies. Large foreign banks that can devote more resources to research and devel-opment are likely to play an important role in this
(box continued next page)

GLOBAL FINANCIAL DEVELOPMENT REPORT 2017/2018 O V E R V I E W 5
(box continued next page)
BOX O.1 Main Messages of This Report (continued)
area. So far, the relationship between global banks and fi ntech fi rms has been mostly complementary, with incumbent fi rms pouring investment into the fi ntech sector. The trend toward digitalization and technological innovation will likely increase the role of nonphysical distribution channels. Fintech also comes with risks; hence, regulators are paying close attention to it and to how it is revolutionizing the sector, bringing new challenges to the already-
complex supervision and regulation of foreign banks. Regulators need to keep pace with the rapid entry of new, nonbank providers into the market and of the rapid rolling out of digital services. And they need to pay attention to the potential risks that these changes may entail—such as the protection of vulnerable cus-tomers, discrimination, disclosure requirements for SMEs, and privacy concerns related to the sharing of consumer data.
BOX O.2 Views on International Banking by Practitioners: Global Financial Development Barometer
To examine views on international banking among the World Bank group’s clients, the Global Financial Development Report team undertook new rounds of the Financial Development Barometer in 2015 and 2016. The barometer is an informal global poll of fi nancial sector practitioners focusing on devel-opment issues. This poll examines trends and sen-timents regarding financial sector issues that are under policy debate. The latest barometer explored the perceived drivers and effects of international banking as well as the effi cacy of regulatory poli-cies designed in the aftermath of the global fi nan-cial crisis. It reveals interesting insights from central bankers, fi nance ministry offi cials, regulatory/super-visory authorities, market participants, and practi-tioners at various international fi nancial institutions.
Of the 222 individuals polled, 112 (50 percent) from 9 developed and 42 developing countries responded to the survey.
More than 70 percent of the participants perceive international banking to play an important role in providing fi nancial services to fi rms, and to a lesser extent in serving households (see figure BO.2.1). More than two-thirds of the respondents acknowl-edge the novel ways international banks introduce products to improve fi nancial access. Nevertheless, more than 80 percent of respondents are concerned that foreign banks may be aggressive in cherry pick-ing the most profi table and established borrowers. Also, more than 70 percent of respondents agree that international banks contribute to the transmission of international shocks. The perceptions of global and
Given the trade-offs facing policy makers, it is crucial to thoroughly examine the costs and benefi ts of international banking and to devise effective policies based on the evi-dence. Global Financial Development Report 2017/2018: Bankers without Borders seeks to bring new data and research and to draw on available insights and experience to con-tribute to this discussion.
fi nance, there are also concerns about stabil-ity and the “cherry picking” of best clients. Financial market practitioners and policy makers also note that international banks may have become too large and complex, with only half the respondents indicating confi dence that their national policy frame-works are suffi cient to address the potential stability risks posed by these institutions.

6 O V E R V I E W GLOBAL FINANCIAL DEVELOPMENT REPORT 2017/2018
TABLE BO.2.1 Selected Results from the Financial Development BarometerPercentage of respondents agreeing with the statements
In your view…
“. . . global banks have become excessively complex.” 93
“. . . global banks have become too large from an operational effi ciency viewpoint.” 86
“. . . global banks could pose excessive stability risks to their home (host) country.” 89 (89)
“. . . existing national policy frameworks would be suffi cient to address such stability risks.” 54
“. . . the global reform agenda should be complemented by reforms of banking structures (separation of bank activities) to effectively address the risks posed by global, cross-border banks and reduce their complexity.” 92
“. . . in your country, macroprudential policies should be relied on to mitigate the risks of crises and their related cost associated with the activities of global banks.” 85
BOX O.2 Views on International Banking by Practitioners: Global Financial Development Barometer (continued)
regional banks vary, because regional banks are seen as having stronger political and cultural links to the host country. Hence, positive effects are more com-monly associated with regional banks and negative effects with global banks.
An overwhelming proportion of survey partici-pants sees global banks as having become unwieldy and complex, potentially posing stability risks
to home and host country jurisdictions (see table BO.2.1). Views differ quite a bit on whether exist-ing national policy frameworks will be suffi cient to address such risks in light of the crisis experience, where respondents are roughly split in the middle. The widespread stability concerns are also refl ected in strong support for regulatory interventions to address such risks.
Source: Financial Development Barometer.
FIGURE BO.2.1 The Impact of Global and Regional Banking
Source: Financial Development Barometer.
80
70
75
67
79
89
75
62
51
72
0 20 40 60 80 100
Choose the most profitable and established borrowers
Contribute to international shock transmissions
Introduce new ways of improving financial access for firms and households
Play an important role in providing financial services to households
Play an important role in providing financial services to firms
Share of respondents who agree (%)
Global banks Regional banks

GLOBAL FINANCIAL DEVELOPMENT REPORT 2017/2018 O V E R V I E W 7
negative since 2010 (see fi gure O.2). Although the number of foreign banks exiting markets remained more or less the same, there was much less entry after the crisis. The number of foreign banks worldwide has declined, but not relative to the number of domestic banks, which saw an even greater decline. More im-portant, banks based in high-income coun-tries drove the exits, but developing coun-tries continued their foreign bank expansion, accounting for close to 60 percent of new entries. Hence, two important trends have emerged: South–South banking, and regional-ization. By 2013, banks based in high-income countries still represented 89 percent of for-eign bank assets globally, but this share was 6 percentage points lower than before the cri-sis, representing a greater diversity of foreign bank ownership. Foreign bank presence also became more regionally concentrated, with the average intraregional share increasing by 4 percentage points. This largely refl ected the expansion of developing country banks
INTERNATIONAL BANKING: MEASUREMENT AND RECENT TRENDS
International banks are involved in two main types of international activities: cross-border fl ows, and foreign participation in domestic banking systems through brick-and-mortar operations. Trade in fi nancial services most commonly takes place through (1) cross-border operations of a bank, in lending, de-posit taking, or insurance; and (2) provision of these services through a foreign bank’s presence, which can take the form of a sub-sidiary or a branch in a foreign country. Here, an international bank is defi ned as a bank with cross-border activities or foreign subsid-iaries or branches, or both. A global bank is defi ned as an international bank with opera-tions in multiple regions. Regional banks are defi ned as banks that focus their operations in a specifi c region. And a domestic bank is defi ned as a bank that does not have interna-tional operations.
The decade before the fi nancial crisis saw signifi cant increases in international banking activities, a trend that coincided with general globalization during this period, including trade and foreign direct investment (FDI) in goods and services. Deregulation and liber-alization across the world also promoted in-creases in cross-border activities, as well as local bank presence. Hence, both types of activities displayed an increasing trend just before the global fi nancial crisis hit in 2008, yet declined afterward (fi gure O.1).1 Devel-oping countries experienced a shorter-lived decline than developed countries, particu-larly in foreign brick-and-mortar presence. It is particularly important that the volume of foreign bank claims via local lending now exceeds that of cross-border lending in devel-oped countries and is comparable in develop-ing countries, because lending by brick-and-mortar banks has proven to be more resilient in response to the fi nancial crisis.
Local lending was more resilient than cross-border fl ows after the global fi nancial crisis, but net foreign bank entry has become
FIGURE O.1 Cross-Border and Local Claims by Foreign Banks, 2005–15
Source: Consolidated Banking Statistics (Ultimate Risk Basis), Bank for International Settlements.Note: Figures are country-level averages by income level of the borrowing countries over the period 2005–15. Borrowing countries are categorized as high-income and developing countries according to the World Bank’s country classifi cations as of 2017. Cross-border claims refer to those extended by foreign bank offi ces outside the borrower’s jurisdiction. Local claims refer to those extended by foreign bank offi ces within the borrower’s jurisdiction. Total ratios of outstand-ing values to gross domestic product are provided in each case.
0
5
10
15
20
25
30
35
40
2005 2006 2007 2008 2009 2010 2011 2012 2013 2014 2015%
of G
DPDeveloping, cross-border Developing, localHigh-income, cross-border High-income, local

8 O V E R V I E W GLOBAL FINANCIAL DEVELOPMENT REPORT 2017/2018
and Central Asia (ECA), the Middle East and North Africa (MENA), and Sub-Saharan Africa (SSA), it has continued to increase in East Asia and the Pacifi c (EAP) and Latin America and the Caribbean (LAC) (see fi g-ure O.3). High-income countries also saw a decline. Nevertheless, despite these develop-ments, foreign banks continue to constitute 40–60 percent of the banking industry in the ECA, LAC, and SSA regions. Hence, lending by international banks remains an important source of fi nance, particularly in these regions.
Despite the overall drop in cross-border fl ows since the global fi nancial crisis, devel-oping countries have increased their role as providers of cross-border funds to other de-veloping countries. The share of Southern economies in cross-border bank credit chan-neled to the South has almost doubled since 2007, to 8.5 percent in 2014. The same pat-tern can be observed for syndicated loans, where South–South shares have grown from 3.5 percent before the crisis to 7.7 percent since it (fi gure O.4). Although most devel-oping countries have expanded their bank credit toward Southern economies after the crisis, the EAP region accounts for the bulk
into space opened up by the retrenchment of global banks.
These aggregate trends hide important dif-ferences across different regions. Since the crisis, while the share of foreign bank assets in total banking assets has declined in Europe
FIGURE O.2 Number of Entries and Exits of Foreign Banks, 1995–2013
Source: Foreign Bank Ownership Database (Claessen and van Horen 2015).
–80
–40
0
40
80
120
1996
1997
1998
1999
2000
2001
2002
2003
2004
2005
2006
2007
2008
2009
2010
2011
2012
2013
Num
bers
Entry Exit Net entry
FIGURE O.3 Share of Foreign Bank Assets, by Region, 2005–13
Source: Calculations based on Foreign Bank Ownership Database (Claessens and van Horen 2015).Note: Regions exclude high-income countries that belong to the Organisation for Economic Co-operation and Development (OECD).
0
10
20
30
40
50
60
70
East Asiaand Pacific
Europe andCentral Asia
Latin Americaand the
Caribbean
Middle Eastand
North Africa
South Asia Sub-SaharanAfrica
High-incomeOECD
% o
f tot
al b
ank
asse
ts
2005 2009 2013

GLOBAL FINANCIAL DEVELOPMENT REPORT 2017/2018 O V E R V I E W 9
of South–South transactions. Specifi cally, on average, EAP originated 25 percent of the total cross-border syndicated loans to devel-oping countries during the postcrisis period, up from 12 percent during the precrisis aver-age. An important part of the expansion in South–South bank credit since the crisis has been associated with a trend toward regional-ization—with Brazil, China, India, and South Africa playing an increasingly important role in their regions. In particular, intraregional syndicated lending accounted on average for 75 percent of South–South syndicated lending during the 2010–14 period, up from 70 per-cent during the 2003–07 period. This pattern held across most regions, except for LAC and MENA (Broner and others 2017).
The rise of South–South brick-and-mortar banking since the crisis has also varied across regions. As in the case of cross-border activi-ties, the increase in South–South brick-and-mortar banking operations and regionalization since the global fi nancial crisis has been more prominent in some regions than others (fi gure O.5). Specifi cally, a greater share of foreign banks in the MENA and SSA regions are now regional banks compared with precrisis years.
FIGURE O.4 Direction of Cross-Border Bank Lending, before and after the Global Financial Crisis
Source: Broner and others 2017.Note: This fi gure shows the value of the stocks (fl ows) of cross-border bank claims (syndicated loans) scaled by worldwide bank claims (syn-dicated loans). Data are aggregated for all economies within a source region to all economies within a receiver region. For cross-border bank claims, the end-of-year statistics are shown. For syndicated loans, the statistics are calculated year by year and then averaged over time. The North includes the G-7 economies and 15 other Western European economies. The South includes the remaining economies not included in the North. Offshore fi nancial centers are excluded from the sample.
7668 74 68
914
1717
1010
58
4 8 4 8
0
20
40
60
80
100
2007 2014 2003–07 2010–14Cross-borderbank claims
Cross-border syndicatedloan flows
Perc
ent
North–North North–South South–North South–South
FIGURE O.5 Share of Regional Foreign Banks among Foreign Banks, Country-Level Averages, 1997–2013
Source: Calculations based on Foreign Bank Ownership Database (Claessens and van Horen 2015).Note: Regions exclude high-income countries that belong to the Organisation for Economic Co-operation and Development (OECD).
0
10
20
30
40
50
60
70
% o
f for
eign
ban
ks
1997 2001 2005 2009 2013
East Asiaand Pacific
Europe andCentral Asia
Latin Americaand the Caribbean
Middle Eastand North Africa
South Asia Sub-Saharan Africa

10 O V E R V I E W GLOBAL FINANCIAL DEVELOPMENT REPORT 2017/2018
fi nancial crisis. There have been large re-ductions in cross-border fl ows, and fewer foreign bank entries. The trends in foreign bank entry differ across countries, however.
Another trend in bank internationalization is a dramatic increase in bank size. From 2005 to 2014, the total asset size of the world’s largest banks increased by more than 40 per-cent. Despite regulatory efforts after the crisis to address too-big-to-fail issues, bank size has not shrunk in either absolute terms or—as seen in fi gure O.6—relative to gross domestic product (GDP). The largest banks are also the ones that are active at the international level.
Finally, since 2007, with the backlash against globalization, many countries, includ-ing many developing countries, have adopted increasingly restrictive policies toward foreign banking. These policies take the form of direct restrictions (see fi gure O.7) or indirect poli-cies affecting foreign bank presence—such as macroprudential policies affecting foreign bank operations (see fi gure O.8), countercycli-cal buffers, or even ring fencing—in an effort to regulate capital fl ows. All in all, restrictions on international banking activities increased after the global fi nancial crisis, coinciding with the reduction in cross-border fl ows and net entries.
In summary, following a decade of in-creased globalization, international bank-ing has suffered a setback since the global
FIGURE O.6 Trends in Bank Size
Source: Bureau van Dijk Bankscope (database).Note: Values represent regional country-level averages of combined assets of the top fi ve banks relative to GDP, for the period 2005–14.
2005 2008 2011 2014
0
20
40
60
80
100
120
140
160
% o
f GDP
East Asiaand Pacific
Europe andCentral Asia
Latin Americaand the
Caribbean
Middle Eastand
North Africa
South Asia Sub-SaharanAfrica
High-incomeOECD
FIGURE O.7 Share of Developing Countries with Restrictions on Foreign Bank Entry through Alternative Modes
Source: World Bank Regulation and Supervision (database).Note: The analysis includes 78 developing countries providing complete responses to relevant questions in the 2003, 2007, and 2011 survey waves of the Banking Regulation and Supervision Surveys.
0
5
10
15
20
25
30
35
Acquisition Subsidiary Branch Joint venture
Perc
ent
2000 2003 2007 2011

GLOBAL FINANCIAL DEVELOPMENT REPORT 2017/2018 O V E R V I E W 11
technologies. Pressures from foreign capital may discipline countries’ macroeconomic and fi nancial management, and the entry of for-eign institutions may help improve regulation and supervision, as well as possibly breaking the political entrenchment between domestic fi nancial institutions and governments. All in all, more capital and increased effi ciency of allocation will promote faster economic de-velopment and greater fi nancial stability, be-cause risks can be exported and shared more effi ciently (Cetorelli and Goldberg 2012b;Claessens, Demirgüç-Kunt, and Huizinga 2001; De Haas and van Lelyveld 2010; Goldberg 2009). However, openness also comes with its own risks, exposing the coun-tries to foreign risks, foreign monetary pol-icy shocks, and other types of mismatches(Morais and others, forthcoming). Rapid growth in international credit may more easily lead to boom-bust cycles in poor institutional environments (Borio, McCauley, and McGuire2011). When international banks focus on prime customers and increase competition, poor information and contract enforcement may make it diffi cult for domestic banks to move to other segments and serve previously underserved clients. This can reduce the fran-chise values of domestic banks, and possibly have a negative impact on access and inclu-sion by driving them out altogether. Also, risk sharing inevitably implies that systemic risks in source countries may be imported from time to time (Peek and Rosengren 1997, 2000; Schnabl 2012). Moreover, existing policy dis-tortions in domestic systems—such as poorly designed safety nets, and weak regulation and supervision that generate excessive risk-tak-ing incentives—tend to be magnifi ed through international banking that expands risk-taking opportunities (Demirgüç-Kunt, Kane,and Laeven 2014).
Bank internationalization, on its own, is no panacea for guaranteeing fi nancial devel-opment and stability. International banking can have important benefi ts for development by improving effi ciency and risk sharing, but these benefi ts will not accrue unless the institu-tional environment is developed and the right policies are adopted (Detragiache, Tressel, and
While developed country banks retrenched, developing country banks continued to in-vest abroad, through both cross-border and brick-and-mortar operations, leading to a more regionalized banking system with a greater South–South presence. Large interna-tional banks continued to become larger. Dur-ing this period, regulatory barriers to foreign banking have also increased.
WHY DO WE CARE ABOUT INTERNATIONAL BANKING?: FINANCIAL DEVELOPMENT, STABILITY TRADE-OFFS, AND THE ROLE OF POLICY
Financial globalization comes with both op-portunities and risks. Possible benefi ts include a globally more effi cient allocation of capital and enhanced risk sharing. A liberalized capi-tal account promotes external fi nancing, and increased competition due to foreign entry is likely to improve effi ciency and domestic re-source allocation. Better know-how and fi nan-cial skills are imported, as well as specialized
FIGURE O.8 Share of Home and Host Countries That Tightened Macroprudential Policies, 2005–13
Sources: Claessens and van Horen 2015; Cerutti, Claessens, and Laeven 2015.Note: Countries are defi ned as home countries when they own more banks in other countries than the number foreign subsidiaries they host and as host countries if they host more foreign subsidiaries than the banks they own abroad.
58 56
86
44
0
20
40
60
80
100
Homecountries
Hostcountries
Homecountries
Hostcountries
High-income countries Developing countries
Shar
e of
cou
ntrie
s w
ith p
olic
y tig
hten
ing
(%)

12 O V E R V I E W GLOBAL FINANCIAL DEVELOPMENT REPORT 2017/2018
of capital fl ows and foreign bank presence matter (Claessens 2016). Some fl ows, such as bank FDI in the form of brick-and-mortar op-erations, tend to be associated with the diffu-sion of technology and know-how compared with cross-border fl ows. Larger foreign banks and those that are culturally closer, with a greater share of domestic fi nancial interme-diation, including deposit taking, tend to pro-vide better access to SMEs and households and are less likely to engage in cherry picking (Berger and Udell 2006).
For stability considerations, it is important to recognize that risk sharing also has a down-side. International banks that export risks will also import them. Hence, the net risk-sharing benefi ts of globalization need to be considered over the long term. Again, the heterogeneity of fl ows and types of institutions and inves-tors matter (Claessens 2016). Short-term, cross-border fl ows tend to be more volatile and less resilient than a brick-and-mortar bank presence. And some investors, such as international banks and mutual funds, are af-fected by global fi nancial and monetary con-ditions to a greater extent, exposing countries to more volatility. Although these can be miti-gated, they cannot be fully eliminated without giving up openness altogether. Nevertheless, research suggests that banks with a greater commitment, as refl ected in closeness both in distance to headquarters and in culture, that have larger local market shares and a greater reliance on local funding, are more willing to incur temporary costs when faced with exter-nal shocks and to support the local economy (Claessens and van Horen 2014a).
Encouraging the right type of foreign bank presence or forms of capital fl ows without causing distortions is challenging. Many su-pervisory agencies no longer rely on the home supervisor of the local affi liates for ensuring stability. Compared with branches, foreign subsidiaries can be self-suffi cient—with high capitalization requirements and a high share of funding through retail deposits—thereby improving stability. Among subsidiaries, a mix of new and greenfi eld units and takeovers or mergers may also help diversify risks. Re-search has found that foreign bank entry has
Gupta 2008; Gormley 2014; Mian 2006). Thus, the challenge for policy makers is to provide an environment that will maximize the benefi ts of internationalization while mini-mizing the costs. Research suggests that insti-tutionally better developed countries tend to reap both more of the development and risk-sharing benefi ts of international banking.
Therefore, it is important for countries to ensure that they have the right regulations and infrastructure in place. Although for-eign bank participation may help to break or mitigate the political entrenchment of in-cumbent banks, even in a bad institutional environment, those foreign banks may just replace incumbents and continue collecting profi ts and exploiting regulatory weaknesses without necessarily improving the competi-tiveness and effi ciency of the banking sector (Detragiache, Tressel, and Gupta 2008; On-gena, Popov, and Udell 2013). Thus, fi nan-cial liberalization should be accompanied by institutional reforms and may be introduced gradually, ensuring competitiveness in the banking industry to avoid foreign banks com-pletely crowding out domestic banks. Having a host country with good institutions and a competitive banking industry will also help foreign banks become core operations for their parent banks—which could reduce their incentives to retrench during home country or global downturns. Other institutional fac-tors—such as the information environment and the quality of contract enforcement—are also crucial for foreign banks to benefi t host economies by expanding their services more widely beyond their niche customers, improv-ing access and inclusion. Furthermore, when accompanied by improved information shar-ing—through credit registries, for example—foreign banks can help to lower average lend-ing interest rates and increase average loan quality (Bruno and Hauswald 2013; Claes-sens, Hassib, and van Horen 2014).
The key to designing effective policies is to recognize that the benefi ts and costs of inter-nationalization vary depending on bank char-acteristics and the conditions in the home and host countries. It is particularly important that differences in origins, types, and forms

GLOBAL FINANCIAL DEVELOPMENT REPORT 2017/2018 O V E R V I E W 13
latter approach (Claessens 2016). Ring fenc-ing is a local regulator’s reaction to limit the potentially negative consequences of having foreign banks. Host authorities request local liquidity and capital to minimize the impact of external shocks. In terms of advantages, this approach provides better incentives for local supervision and no burden sharing re-quirements. Ring fencing, however, is also less effi cient for fi nancial institutions, because it lessens the benefi ts of cross-border bank-ing in the fi rst place, reducing the scope for risk sharing and potentially imposing costs in times of stress through possible runs and liquidity problems. This approach also under-mines the incentives for cross-border regula-tion and supervision, thus impairing the gen-eral openness of fi nancial systems. Although these two approaches may be too extreme for many countries, an intermediate model of co-operation that includes some elements of the universal approach may be feasible. Ideally, this intermediate model could adopt an inter-national agreement on crisis management that explicitly outlines responsibilities and pro-cesses to follow in case of a resolution (Beck and Wagner 2016). Overall, despite progress since the fi nancial crisis, the global regulatory reform agenda is at a crossroads; many as-pects remain unfi nished, and the fi nalization of the Basel III reform package appears to have been delayed. Hence, more comprehen-sive coverage of this topic will be included in a future issue of this report, when policy mak-ing is more advanced and additional data and research are available.
Within this broader context, this overview concludes with a discussion of three focus ar-eas that are important in international bank-ing and their policy implications: the rise of South–South banking, the shift toward alter-native sources of funding, and the emergence of fi ntech. The focus on these areas refl ects the importance of these new trends for policy, because they all present challenges and oppor-tunities. These are also areas where research is new and limited, and recent developments raise many more questions for the future. For help in navigating the rest of the report, see box O.3.
stronger positive effects on the competition with greenfi eld investments than with merg-ers and acquisitions, though greenfi eld in-vestments are not necessarily associated with greater access to fi nancial services (Claeys and Hainz 2014; Delis, Kokas, and Ongena 2014; Jeon, Olivero, and Wu 2011). By being better integrated with the parent bank, greenfi elds may also help more during local downturns; however, investment through acquisitions may yield greater benefi ts in response to home country or global shocks (Jeon, Olivero, and Wu 2013). Finally, some diversifi cation of for-eign banks’ business models may be desirable in shielding host economies from the negative outcomes associated with a specifi c type of activity (for example, in response to a nega-tive shock to fee-based, non-interest-income-generating activities, or being overly reliant on wholesale funding, which could dry up during global downturns). When possible—as in a privatization—host country authorities could also try to diversify the roster of home countries and to make sure that the prospec-tive parent banks are also diversifi ed, so that they can provide liquidity and other support to their subsidiaries, even when they face shocks at home. Research shows that effec-tive home country regulations, proximity to the home country—cultural or physical—and a core position in the banking group lower the probability of exit in response to shocks (Claessens and van Horen 2014b). For many countries, however, options to shape foreign entry may be more circumscribed, depending on their obligations under multilateral and preferential service trade agreements.
The regulatory and supervisory failures during the recent global fi nancial crisis led to an intense effort to redesign the regula-tory landscape, which is still ongoing. Two extreme approaches infl uencing the ongoing policy discussions entail territoriality—that is, the ring fencing of activities under a par-ticular authority’s domain, which inhibits an open fi nancial system—and universalism, which entails an equitable distribution of bankruptcy costs involving cross-border bur-den sharing. The European Single Resolution Mechanism is a prospective example of the

14 O V E R V I E W GLOBAL FINANCIAL DEVELOPMENT REPORT 2017/2018
of developing countries in global fi nancial transactions has allowed these economies to not only diversify their investments but also obtain fi nancing from abroad, complement-ing domestic markets and widening their available funding choices. Greater South–South banking is likely to increase local com-petition and fi nancial development, as with any foreign entry. But the recent trends in South–South banking are also likely to infl u-ence who gets credit and whether it helps im-prove access to fi nancial services. Relative to a bank from the North, South–South banks invest in countries within their region and
FOCUS AREA 1: THE RISE OF SOUTH–SOUTH BANKING
One of the important recent trends in inter-national banking has been the rise of South–South banking. As the stylized facts in the previous section illustrate, developing coun-tries have become more prominent in inter-national banking, and these activities have become more regionalized. Research in this area has been scarce, however, and its policy implications are not well understood.
South–South banking may be associated with better access. The increasing participation
BOX O.3 Navigating This Report
The rest of the report consists of three chapters that cover the benefi ts and costs of international bank-ing, key facts, and general guidelines for the role of policy. Within these broader topic areas, the report focuses on policy-relevant new developments where new evidence is emerging yet also raises many more questions for the future.
Chapter 1 defines international banking and presents a conceptual framework for evaluating the benefi ts and costs associated with globalization. It offers stylized facts about the importance of interna-tional banking across countries and over time, and highlights recent trends. The chapter also discusses the advantages and disadvantages of various data sources, which help differentiate between cross-bor-der lending and the brick-and-mortar operations of international banks.
Chapter 2 examines the brick-and-mortar opera-tions of international banks. It discusses and pro-vides evidence on the determinants of foreign bank entry and its impact on bank competition, effi ciency, access to fi nance, and fi nancial stability. Implications for South–South banking and regionalization are discussed, as well as where fi ntech is infl uencing the fi nancial sector. The current global regulatory reform agenda is discussed, with alternative approaches to regulation and supervision. The chapter provides policy guidance on maximizing the benefi ts of for-eign entry and minimizing its costs.
Chapter 3 mirrors the preceding chapter but focuses on the cross-border activities of interna-tional banks. It discusses recent trends and presents
evidence on the signifi cance, drivers, and impact of cross-border bank fl ows. It focuses on three impor-tant developments that are shaping international banking: the role of the South, the substitution of fi nancing across markets, and the rise of fi ntech. The chapter discusses these new trends and how they may shape the future global banking landscape, and it draws out policy implications.
There are two statistical appendixes. Appendix A presents basic country-by-country data on fi nan-cial system characteristics around the world. It also presents averages of the same indicators for peer groups of countries, together with summary maps. It is an update of information from the 2015/2016 Global Financial Development Report. Appendix B provides additional country-by-country information on key aspects of international banking around the world.
The accompanying website (http://www.worldbank.org/financialdevelopment) contains a wealth of underlying research; additional evidence, including country examples; and extensive databases on fi nan-cial development—providing users with interactive access to information on financial systems. Users can provide feedback on the report, participate in an online version of the Financial Development Baro-meter, and submit their suggestions for future issues of the report. The website also presents an updated and expanded version of the Global Financial Devel-opment Database, a data set of more than 70 fi nan-cial system characteristics for 203 economies since 1960.

GLOBAL FINANCIAL DEVELOPMENT REPORT 2017/2018 O V E R V I E W 15
increasingly come from local customer depos-its, which the global fi nancial crisis proved to be a more stable source of funding, enabling these banks to better smooth their lending throughout the crisis (fi gure O.10).
Nevertheless, South–South banks may also bring increased risks, which stem from more lax regulation in their home countries. Indeed, Claessens and van Horen (2016) and Mehigan (2016) fi nd that foreign banks based in countries with relatively laxer regulatory requirements could amplify credit booms in host countries. The extent to which foreign banks based in the South will be committed to the host countries and therefore limit shock transmission versus the extent to which their potentially weaker regulatory and supervisory frameworks will become a source of instabil-ity is not clear a priori, and thus needs future research. Also, because regionalization by defi nition means less risk sharing, questions remain whether there is an optimal mix of foreign bank entries from global as well as re-gional banks, so as to maximize the potential benefi ts.
tend to be more familiar with the cultural, lin-guistic, legal, and institutional environment of the host country and may be better at collect-ing and processing soft information that al-lows them to overcome the common chal-lenges that foreign banks face when lending downmarket to smaller and more informa-tionally opaque segments, especially SMEs and households (Claessens and van Horen 2014b; Mian 2006). A recent study using fi rm-level data also fi nds that a foreign bank presence is more strongly linked to higher rates of business formation when those banks are headquartered in the South (Alfaro, Beck, and Calomiris 2015).
However, regionalization may also have costs. If foreign entry is more regionalized, this may constrain both the adoption of glob-ally best banking technology and skills across countries and the most effi cient allocation of capital. Increasing regionalization in the South also limits risk sharing and implies a larger exposure of an economy to shocks originating within the region.
Recent research has constructed an exten-sive, bank-level database that identifi es inter-national and domestic banks by developing indices of the internationalization of bank lia-bilities, and it investigates the performance of international banks vis-à-vis domestic banks in the 112 countries where they are headquar-tered (Bertay, Demirgüç-Kunt, and Huizinga 2017).
The results suggest that international-ization smooths banks’ credit supply over the business cycle, particularly for develop-ing country international banks. Figure O.9 shows the change in bank lending associated with a 1 percent increase in real GDP per capita growth, for domestic and international banks headquartered in high-income or de-veloping countries. In general, bank lending is procyclical, increasing during booms and fall-ing during downturns. Yet, particularly in de-veloping countries, the lending pattern of do-mestic banks is signifi cantly more procyclical in response to local business cycles compared with their international counterparts.
Furthermore, these data show that the funding of South–South subsidiaries has
FIGURE O.9 Change in Bank Lending Associated with a 1 Percent Increase in Growth in GDP per Capita
Source: Bertay, Demirgüç-Kunt, and Huizinga 2017.Note: The fi gure shows marginal effects from a regression of bank lending on GDP per capita growth and a number of control variables and bank fi xed effects, estimated using a sample of 2,750 banks based in 112 countries (47 high-income, and 65 developing) for the period 2000–15. International bank values are evaluated at the average level of internationalization; that is, the log of the number of countries in which the international bank is active. The coeffi cients are signifi -cant at the 10 percent level or better.
1.5
2.0
1.0
0
0.5
Perc
ent
High-incomecountry, domestic
banks
High-incomecountry,
internationalbanks
Developingcountry,domestic
banks
Developingcountry,
internationalbanks
0.3
0.6
0.9
1.5

16 O V E R V I E W GLOBAL FINANCIAL DEVELOPMENT REPORT 2017/2018
at least partially for the decline in bank fund-ing. Demirgüç-Kunt, Martínez Pería, and Tressel (2017) analyze the capital structures of fi rms during the crisis by investigating a large panel of listed and nonlisted fi rms over the 2004–11 period, with good coverage of SMEs. They show that fi rms listed on a stock market have, on average, experienced a much more moderate decline in leverage and in the use of long-term debt (fi gure O.12). These fi ndings are consistent with the view that capital markets may have played the role of a spare tire for publicly listed fi rms, by provid-ing an alternative source of external fi nance and better information when the functioning of the banking system was impaired during the crisis (Levine, Lin, and Xie 2016).
These patterns highlight not only the ben-efi ts of having alternative sources of fi nance but also the need to broaden the policy dis-cussion to consider the fi nancial system as a whole. When fi rms obtain fi nancing from dif-ferent sources, it is important to jointly ana-lyze the different types of fi nancing. Having access to different markets might allow fi rms to compensate for fl uctuations in particular markets by raising funds elsewhere. As such, countries might reduce contagion risks by di-versifying the sources of fi nance and, to the extent possible, having more complete mar-kets, including equity markets. Policy initia-tives, such as the Capital Markets Union in Europe, aimed to increase the substitutability between bank loans and other sources of ex-ternal fi nance (European Commission 2015), as well as those that aimed to develop innova-tive instruments, such as minibonds, and secu-ritization may be important (Borensztein and others 2008; Giovannini and others 2015).
However, these shifts do not alleviate the funding constraints of smaller fi rms with-out access to markets. Cortina, Didier, and Schmukler (2016) discuss the importance of considering the compositional change in the types of issuers that are tapping each mar-ket over time. For instance, during domestic crises, only the relatively larger fi rms have access to alternative markets such as bonds and international loans. The work of these researchers shows that during foreign shocks,
FOCUS AREA 2: THE SHIFT TOWARD ALTERNATIVE SOURCES OF FUNDING
When the global fi nancial crisis suddenly hit the banking sectors of major high-income countries, fi rms around the world compen-sated for this contraction by substituting across funding sources. Cortina, Didier, and Schmukler (2016) use issuance data for large corporates in domestic and international bond markets and syndicated loan markets to show that in high-income and developing countries, fi rms with access to capital markets moved to bond markets (fi gure O.11). In de-veloping countries, these fi rms also switched to domestic banks and away from interna-tional banks. Due to these switches, global fi nancial activity during the crisis declined less than the collapse in cross-border loans. These changes in debt composition continued dur-ing the postcrisis period.
The importance of well-functioning do-mestic capital markets as a “spare tire” was confi rmed during the global fi nancial crisis period in many countries, as they substituted
FIGURE O.10 Contribution of Local Deposits to Banks’ Total Funding
Source: Calculations based on Bertay, Demirgüç-Kunt, and Huizinga 2017.Notes: NN corresponds to bank subsidiaries from developed countries operating in developed countries. NS corresponds to bank subsidiaries from developed countries operating in developing countries. SN corresponds to bank subsidiaries from developing countries operating in developed countries. SS corresponds to subsidiaries from developing countries operating in developing countries. ND corresponds to domestic banks in developed countries. SD corresponds to domestic banks in developing countries.
30
35
40
45
50
55
60
65
70
2000 2002 2004 2006 2008 2010 2012 2014
% o
f tot
al fu
ndin
g
NN NS SN SS ND SD

GLOBAL FINANCIAL DEVELOPMENT REPORT 2017/2018 O V E R V I E W 17
Tressel (2017) as well, the decline in leverage and in long-term debt fi nancing after the crisis was particularly pronounced among all non-listed fi rms, a large proportion of which are SMEs (fi gure O.12). Hence, for smaller fi rms with limited or no access to capital markets, the important role of banks remains.
FOCUS AREA 3: THE RISE OF FINTECH—OPPORTUNITIES AND CHALLENGES
Technology is also changing the banking sec-tor and could have major implications for ac-cess, effi ciency, and fi nancial sector stability. Fintech—technology-driven new companies providing fi nancial services outside the tra-ditional fi nancial sector—can reshape com-petition among fi nancial providers and thus improve the delivery of fi nancial services and increase access. Global investment in fi ntech companies has expanded very rapidly world-wide. Although data on fi ntech are as yet very scant, there were at least 4,000 active fi ntech fi rms in 2015; and more than a dozen of them were valued at over $1 billion (The Econo-mist 2015).
large international fi rms switching to domes-tic markets can potentially crowd out smaller domestic issuers from the market. In the work of Demirgüç-Kunt, Martínez Pería, and
FIGURE O.11 Volume of Debt Issuance over Time for Real Purposes
Source: Thomson Reuters SDC Platinum (database).Note: This fi gure displays the aggregate amount raised per year for real purposes in corporate bond and syndicated loan markets by high-income (panel a) and developing countries (panel b). Real purposes refer to the exclusion of bonds and loans used for acquisition fi nancing and leveraged buyout operations, refi nancing, and capital structure management, as well as other issuances whose purposes cannot be categorized as real investments (such as those with unspecifi ed purposes or with missing information).
FIGURE O.12 Average Change in Long-Term Debt Financing, by Ownership Type
Sources: Demirgüç-Kunt, Martínez Pería, and Tressel 2017; Bureau van Dijk ORBIS (database); and staff calculations.Note: The data set covers 277,000 fi rms across 79 countries over the period 2004–11 and is composed mostly of SMEs; 98.7 percent of fi rms are not listed on a stock exchange.
–1.13
0.04
–1.71
–2.13
–1.40
–3.74–4.0
–3.5
–3.0
–2.5
–2.0
–1.5
–1.0
–0.5
0
0.5
Aver
age
chan
ge in
long
-term
deb
t to
tota
l ass
et (p
erce
ntag
e po
int)
Developing countriesHigh-income countries
All firms Listed firms Nonlisted firms
2003 2004 2005 2006 2007 2008 2009 2010 2011 2012 2013 2014
Corporate bonds Syndicated loans Total debt
2003 2004 2005 2006 2007 2008 2009 2010 2011 2012 2013 20140
100
200
300
400
500
600
700
2011
U.S
. dol
lars
(bill
ions
)
0
500
1,000
1,500
2,000
2,500
3,000
a. High-income countries b. Developing countries
2011
U.S
. dol
lars
(bill
ions
)

18 O V E R V I E W GLOBAL FINANCIAL DEVELOPMENT REPORT 2017/2018
sell any products—including illegal ones, such as drugs and guns—by using Tor, an anony-mous browser, and bitcoin, an anonymous form of payment.
Because certain aspects of fi ntech’s devel-opment remain lightly regulated, how this new area of fi nance should be regulated and supervised is generating an active debate. The new lending practices used by the online plat-forms seem to be one of the main hot spots for regulators to date. For instance, lending discrimination against consumers, disclosure requirements for SMEs, and the sharing of consumer data are some of the most relevant areas of concern currently being dealt with by regulators in the United States (Politico 2016). Moreover, because fi ntech companies usually have a base of more vulnerable customers—they are bringing some customers into the fi -nancial system for the fi rst time—consumer education and protection measures are much needed. Another source of concern is that fi -nancial regulation remains region-specifi c and fragmented, but many fi ntech fi rms work glob-ally or offer digital products that are diffi cult to contain within the borders of a particular economy. Thus, it is not clear which econo-my’s laws would be applied to a company. Some regulators seem to understand that ex-cessive regulation might be deadly for the fi n-tech start-ups and are developing regulatory sandboxes to manage the transition to a new landscape. This approach allows for the live testing of fi ntech services with a low level of regulation for a defi ned period, helping to un-derstand the risks that the new products might entail in a controlled environment. This way, the sandbox enables regulators to work with fi ntech companies to ensure that appropri-ate consumer protection safeguards are built into their new products and services before these reach a mass market (Financial Conduct Authority 2015). The United Kingdom has launched its sandbox, and other jurisdictions are following similar initiatives—such as Aus-tralia, Singapore, and, more recently, Hong Kong SAR, China (Financial Times 2016a). Regulators in the United States are also con-templating a sandbox approach (Wall Street Journal 2016). New, digitally enabled methods
Large foreign banks that can devote more resources to research and development are likely to play an important role in this process. Although, at fi rst, fi ntech helped fi nancial in-stitutions speed up transactions at a lower cost, the most recent technologies encompass a variety of services, such as data security, risk management, mobile banking and alternative currencies. For example, Blockchain, which is an immutable shared electronic record, makes lightning-fast transactions possible compared with traditional bank transfers or settlements of securities trades. In principle, digital fi nan-cial services, and in particular those provided via mobile telephony, hold the promise of deepening fi nancial inclusion to market seg-ments that have been underserved (Ahmed and others 2015). Hence, fi ntech is likely to facilitate the provision of fi nancial services and affect how banks compete with each other (and with other, nonbank providers of fi nancial services) for all market segments and across geographical boundaries, which could have broader implications for access, effi -ciency, and fi nancial sector stability.
Despite its potential, fi ntech can also pose new challenges for both the fi nancial system and policy makers. The main vulnerabilities that the new digital fi nancial practices are bringing to the fi nancial sector include the lack of safety nets in their business models, the misuse of personal data, diffi culties in identi-fying customers, and electronic fraud. Most peer-to-peer lending platforms act as brokers between borrowers and investors, and thus they do not bear the risk of those loans on their balance sheets. Because they rely on new transactions to make profi ts, their main source of funding might evaporate during a downturn. Moreover, the algorithms used to evaluate credit profi les might involve discrim-inatory systems—by, for example, discrimi-nating against borrowers in poorer areas and other vulnerable segments (U.S. Department of the Treasury 2016). With respect to pay-ments, the anonymity, speed, and global reach of the cryptocurrency payment system makes illicit transfers easier. An example of this was “Silkroad,” an anonymous e-commerceplatform that allowed customers to buy and

GLOBAL FINANCIAL DEVELOPMENT REPORT 2017/2018 O V E R V I E W 19
the advantage of scale and incumbency in a heavily regulated industry. This fosters coop-eration between banks and fi ntech compa-nies. Fintechs gain access to banks’ scale and customers, and banks can exploit fi ntechs’ ex-pertise in programming and in analyzing large databases. Nevertheless, the impact of fi ntech and newly developed digital technologies on the global fi nancial sector is expected to keep rising in the years to come.
NOTE
1. Cross-border bank lending activity is com-parable to bond issuances and equity market activity. The annual total value of foreign syndicated loans issued globally, which repre-sents only a subset of new foreign bank lend-ing, was $2.5 trillion in 2006 and $3.0 trillion in 2015. For comparison, the total value of global cross-border bond issuances was $3.2 trillion in 2006 and $3.8 trillion in 2015.
can also potentially be used to address compli-ance requirements and the monitoring of digi-tal fi nancial services, such as “regtech” (Arner, Barberis, and Buckley 2016; Financial Times 2016b).
Regulating and monitoring the develop-ment of an industry that is rapidly growing will remain a key challenge in the future. On one hand, redundant and ineffi cient regula-tions may hinder fi ntech’s potential for pro-moting overall fi nancial development. On the other hand, policy makers need to constantly monitor and adapt proper regulatory frame-works that keep pace with the speed at which fi nancial innovations occur. Although the new players are increasing competition and pushing digital transformation in the global fi nancial sector, to date the level of disruption seems low and their services appear highly complementary to the ones provided by the more established banking sector. Banks enjoy

• Financial systems are multidimensional. Four characteristics are of particular interest for benchmarking fi nancial systems: fi nancial depth, access, effi ciency, and stability. These characteristics need to be measured for fi nancial institutions and markets.
• Financial systems come in all shapes and sizes, and differ widely in terms of the four characteristics. As economies develop, services provided by fi nancial markets tend to become more important than those provided by banks.
• The global fi nancial crisis was not only about fi nancial instability. In some economies, the crisis was associated with important changes in fi nancial depth and access.
• International banks operate in foreign countries through local affi liates and cross-border lending. They offer opportunities to promote economic development because they bring with them capital, liquidity, expertise, and new technologies, which can lead to more investment, greater competition, and better resource allocation. International banks also play a risk-sharing role—that is, they can help host countries stabilize their credit supply during a local downturn, and they can shift resources back to the home country when conditions at home worsen. However, there are also reasons for caution. Borrowing from abroad involves risks such as foreign exchange exposures and other mismatches. Risk sharing can also expose host countries to systemic risks from time to time. And because global fi nance tends to be more procyclical than domestic fi nance, this factor could more easily lead to boom-bust cycles in poor institutional environments.
• The presence of international banks, as measured by their foreign claims, quadrupled in the decade leading up to the global fi nancial crisis in 2007–09, but it has since dropped and stag-nated. In fact, although the number of foreign banks exiting markets remained more or less the same, there was much less entry after the crisis, and net entry became negative for the fi rst time since 1995. Despite this decline, lending by international banks remains an important source of fi nance for private and public sectors across the world. Notably, the volume of for-eign bank claims via local lending now exceeds that of cross-border lending because lending by brick-and-mortar banks has proven to be more resilient in response to fi nancial distress.
• Indeed, the participation of foreign banks through branches and subsidiaries was rising in all regions until recent years when the major global banks began to retrench their international operations. Although banks from high-income countries drove exits, developing countries continued their foreign bank expansion, accounting for close to 60 percent of new entries. Thus, two important trends have emerged: South–South banking and regionalization. By 2013, banks from high-income countries still represented 89 percent of foreign bank assets globally, but this share was 6 percentage points lower than before the crisis, representing a greater diversity of foreign bank ownership. Foreign bank presence also became more re-gionally concentrated, with the average intraregional share increasing by 4 percentage points, largely refl ecting developing country banks expanding into space opened up by the retrench-ment of global banks.
• Another trend in bank internationalization is the dramatic increase in bank size, with the assets of the largest banks worldwide increasing by more than 40 percent from 2005 to 2014. Despite regulatory efforts after the global fi nancial crisis to address too-big-to-fail issues, bank size has not shrunk in either absolute terms or relative to gross domestic product (GDP). The largest banks are also the ones that are active at the international level.
• Since 2007, with the backlash against globalization, many countries, including many develop-ing ones, have been adopting increasingly restrictive policies that directly and indirectly affect the presence of foreign banks. All in all, restrictions on international banking activities increased after the global fi nancial crisis.
• Overall, international banking can have important benefi ts for development by improving effi ciency and risk sharing, but benefi ts do not accrue unless the institutional environment is developed and the right policies are adopted. Thus, the challenge for policy makers is to provide an environment that will maximize the benefi ts from internationalization while mini-mizing the costs. The key to addressing this challenge is to devise policies acknowledging that benefi ts and costs vary, depending on bank characteristics and home and host country conditions. The rise of South–South banking ties as well as the emergence of new fi nancial technologies will also present new challenges for policy makers.
C O N C E P T U A L F R A M E W O R K , S T Y L I Z E D F A C T S , A N D T H E R O L E O F P O L I C Y
CHAPTER 1: KEY MESSAGES

1Conceptual Framework,Stylized Facts, and the
Role of Policy
G L O B A L F I N A N C I A L D E V E L O P M E N T R E P O R T 2 0 1 7 / 2 0 1 8 21
INTRODUCTION
International banks can play an important role in shaping fi nancial and economic de-velopment. They may bring much-needed
capital, liquidity, and technological expertise to host countries. In return, however, they will expect high returns, diversifi cation bene-fi ts, and growth opportunities. In fact, histori-cally such international activities have been essential to banking (see box 1.1).
This chapter provides a conceptual frame-work for understanding the dynamics of in-ternational banking, its effects on economic development, and the scope for public policy. The chapter then introduces relevant defi ni-tions and stylized facts that shed light on re-cent trends and pave the way for the analyses in the rest of the report. The chapter con-cludes with a discussion of the policy implica-tions and the prospective role of government in international banking.
A CONCEPTUAL FRAMEWORK FOR UNDERSTANDING INTERNATIONAL BANKING
Banks provide many important functions that facilitate economic activity. These functions include allocating scarce resources to their
best uses, enabling diversifi cation of risk, mo-bilizing and pooling savings (thereby enabling large, indivisible, and long-term investments through maturity transformation), facilitating the exchange of goods and services (such as via payment services), and monitoring fi rms and managers (Levine 1997). The ability of a bank to perform these functions changes when it operates in an international setting as opposed to autarky, and this change has im-plications for the owners of the bank and its home country (the country in which the bank is headquartered) and for the clients of the bank in both home countries and host coun-tries (the foreign countries in which banks op-erate). Box 1.2 provides the defi nitions needed to understand international banking and illus-trates how stakeholders in different countries interact through international banks.
Banks expand their activities to other countries to further diversify risk, to realize higher profi ts, and to achieve economies of scale. Banks also have a long tradition of fi -nancing trade across borders—and sometimes even following their client fi rms involved in international trade (Cull and Martínez Pería 2010). Risk diversifi cation is particularly suc-cessful if the home country faces shocks that are not highly correlated with shocks in the

22 F R A M E W O R K , S T Y L I Z E D F A C T S , A N D T H E R O L E O F P O L I C Y GLOBAL FINANCIAL DEVELOPMENT REPORT 2017/2018
other types of fl ows—such as when foreign banks help deepen local capital markets in host countries or increase the fl ows of foreign direct investment (FDI) to nonfi nancial sec-tors (Ongena, Qi, and Qin 2014; Poelhekke 2015). From the perspective of borrowers in host countries, the diversity of funding sources
host country (García-Herrero and Vázquez 2013). This situation often arises when the host country is in a different geographic re-gion. More broadly, banking activity is one way in which capital fl ows from low- to high-return countries, and in many cases in-ternational banking activities interact with
BOX 1.1 A Brief Historical Perspective on International Banking
The internationalization of money and fi nance can be traced back to the fourth century A.D., when the bezant was introduced by Emperor Constantine of Byzantium and effectively used as an international currency in the Mediterranean region (Lothian 2002). Although not on a scale comparable with globalization in modern times, banks were involved in cross-jurisdictional activities for centuries. What follows, based largely on Roussakis (1997), is an account of the historical international banking strongholds that dominated global fi nance.
Early banks from 15th-century Italy. Even in the Middle Ages, banks that were succeeding in local city-states sought to increase the geographical reach and scope of their operations. Their efforts contrib-uted to international trade and sovereign debt fund-ing. For example, in the mid-15th century Medici Bank in Florence had branches in Rome, Venice, Avignon, London, Bruges, and Geneva; it distributed liquidity from the papal deposits through its branch network (Roussakis 1997). Eventually, the bank-ruptcy of the bank resulted at least in part from the losses in its “foreign” branches stemming from sover-eign delinquencies (De Roover 1963).
Emergence of German merchant banks. In the 16th century, German banks emerged, sometimes replac-ing the services provided by Italian banks. They became widely involved in fi nancing trade, providing credit to industry, and fi nancing sovereigns such as the Tudors of England and the Hapsburgs of Europe. The German banks, notably the Fugger, financed assets in part through the money markets in Antwerp (Roussakis 1997).
Dutch banks and syndications. In addition to fi nanc-ing trade, Dutch banks funded foreign governments throughout the 17th and 18th centuries. In the lat-ter period, they began to share the fi nancing of these loans with other merchants and wealthy individuals and to sell these bonds to the rest of Europe through the Amsterdam stock exchange—early examples of syndicated loans and securities underwriting.
Industrialization and the rise of modern global banks. At the dawn of 19th century, the long-term financing needs for industrial investments were met through bond and equity issuance, largely in London. Merchant banks such as Baring Brothersa were among the most important players, channel-ing capital across the Atlantic. It was also common practice for foreign governments to raise funds in London (see, for example, Reinhart and Rogoff 2008) and for foreign banks to be established with foreign capital.b Indeed, it has been widely acknowl-edged that the second half of the 19th century saw the first wave of globalization, in which multina-tional banking activity increased dramatically. For example, Battilossi (2006) reveals that the number of foreign branches of British, French, and Ger-man banks increased from 525 in 1880 to 1,610 in 1913. Accompanied by the gold standard in many countries, which provided monetary stability and reduced exchange rate risk, capital moved almost freely around the world, mostly from Europe to North America and Latin America. Finally, the 20th century saw U.S. and Japanese banks emerging as global banks, which led to the globalization trend in recent decades, strengthened by technological advances and fi nancial deregulation.
a. In 1890 Baring Brothers suffered a liquidity crisis because of its deteriorating loan portfolio concentrated in Latin America. Eventually, leading fi nancial institutions in London had to guarantee Baring’s liabilities in an effort orchestrated by the Bank of England—an early example of a bank bailout/rescue (Baker and Collins 1999; Cassis 2013).b. For example, the Ottoman Bank, established in the mid-19th century in Istanbul, was founded mostly by British and French capital. See http://www.obarsiv.com/english/history.html.

GLOBAL FINANCIAL DEVELOPMENT REPORT 2017/2018 F R A M E W O R K , F A C T S , A N D T H E R O L E O F P O L I C Y 23
BOX 1.2 Useful Defi nitions for Understanding International Banking in the Financial System
After decades of internationalization, international banks remain quite heterogeneous, and further cat-egorization is helpful in distinguishing their differ-ences from each other and from other banks in their home countries. In this report, an international bank is defined as one with cross-border lending facilities or foreign bank subsidiaries or both. Some international banks have emerged as global giants in both size and international reach. A standard defi ni-tion of a global bank does not exist.a Thus here a global bank is defi ned as a large international bank with activities in multiple regions. The banking landscape is also populated with regional banks—those that focus on a specifi c region (or set of coun-tries)b—and domestic banks—those that have only home country operations. Global and regional banks—located in home countries—are interna-
tional banks that own foreign bank subsidiaries in host countries.c Domestic banks, by contrast, are banks that do not own foreign bank subsidiaries; nor are they owned by foreign (banking) entities. In short, foreign banks are defi ned by the nationality of their ownership, whereas international banks are defi ned by the geographical scope of their business and operations.
As shown in figure B1.2.1, all agents in both countries may directly interact with the financial markets through different operations. Bidirectional fl ows, including round-tripping transactions, are also identifi ed in the fi gure. In addition to the net fl ows, these interactions are crucial, as noted by Avdjiev, McCauley, and Shin (2015)—that is, gross flows matter in assessing the amount of the risk in the banking system.d
FIGURE B1.2.1 How the International Banking System Works
(i.e., global andregional banks)
Internationalbanks
Foreign claims
Shadow banking system, capital markets, bond and equity issuance,special-purpose vehicles, wholesale funding, money market funds
Financial markets
Domesticbanks
Borrowers Savers
Syndicated loans, equity investment capital injection, intragroup loans
Direct loans, syndicated loans
Dividend payments, profit transfers, intragroup loans
Foreignbanks
a. The most relevant offi cial defi nition is that used for a global systemically important bank (G-SIB) by the Bank for International Settlements (BIS) in which factors such as bank size and cross-jurisdictional activities, among others, are considered (details are discussed in box 1.4).b. For example, the Austrian Erste Group, which has assets totaling some €200 billion, is active in seven countries in the Europe and Central Asia (ECA) region. By contrast, as of the end of 2014, State Street Bank, a U.S. bank of similar size, was active in 29 jurisdictions—Canada, Germany, India, Ireland, Italy, and the United Kingdom, among others. The Austrian Erste Group is not in the global bank sample of BIS, whereas State Street Bank is a G-SIB.c. International banks may also own foreign branches in host countries. The main difference between a foreign branch and a foreign bank subsidiary is that the branch is regulated by the home country and the subsidiary is regulated by the host country. Moreover, unlike foreign branches, foreign bank subsidiaries are locally chartered, self-standing banks with their own capital—see Cerutti, Dell’Ariccia, and Martínez Pería (2007) for details.d. The aspect of currency denominations described by Avdjiev, McCauley, and Shin (2015) is not included in this framework. According to these authors, international currencies serve as “funding currency.” For example, the U.S. dollar plays the preeminent role in international banking because non-U.S. banks also use the dollar in their transactions. In line with this, the currency mismatch in the real sector debt creates a “risk-taking channel,” as noted by Bruno and Shin (2015b), and yields the relationship between the exchange rate and fi nancial stability.

24 F R A M E W O R K , S T Y L I Z E D F A C T S , A N D T H E R O L E O F P O L I C Y GLOBAL FINANCIAL DEVELOPMENT REPORT 2017/2018
pressures, but they apply mostly to large fi rms and not small and medium-sized enterprises (SMEs) and households because of fi xed costs and information problems.1 Those problems are directly addressed by bank business mod-els through economies of scale and monitoring and screening activities (such as collecting valuable information from deposit services). Benefi ts for the underserved segments unable to tap into capital markets for funding could occur in two ways: (1) foreign banks could directly penetrate those segments through transactional lending approaches (Beck, Ioan-nidou, and Schäfer 2012) or relationship banking (Beck, Degryse, and others 2014); or (2) foreign banks could force domestic banks, in search of profi t margins dimmed by foreign competition, to serve those previously ne-glected segments. In fact, foreign banks do not need to enter a contestable banking industry to create competitive pressures—the sheer threat of entry by foreign banks may lead to more effi cient fi nancial intermediation (Claes-sens, Demirgüç-Kunt, and Huizinga 2001; Claessens and Laeven 2004). And yet, the con-tribution of international banking to fi nancial development depends on the characteristics of parent banks (such as the health of their bal-ance sheets) and foreign subsidiaries (such as the use of relationship banking techniques), as well as the market conditions in the host coun-try (such as the existence of credit information and contract enforcement).
By contrast, in weak institutional environ-ments with poor information and contract enforcement, international banks may focus only on large corporations or governments (so-called cherry picking or cream skimming). Such a focus on large borrowers may result in the exclusion of poor households or SMEs from the fi nancial system, thereby reducing access to fi nance (Detragiache, Tressel, and Gupta 2008).2 Furthermore, intensifi ed com-petition and reduced profi tability may lead to higher risk taking by domestic banks (particu-larly in the presence of fi nancial safety nets), which can lead to moral hazard.3 For example, a domestic bank in a developing country may extend foreign currency–denominated credit to households that do not have any capacity
from foreign as well as domestic banks low-ers the risk of losing credit during crises or domestic downturns (Goldberg, Dages, and Kinney 2000).
International bank fl ows are characterized by important differences when compared with other types of capital fl ows, such as debt and equity investments. These differences can be traced back to the uniqueness of the bank business model. First, banks have the ability to reduce information asymmetries between savers and users of funds through screening and monitoring (Diamond 1984; Fama 1985). Second, banks are vulnerable to bank runs be-cause of their obligation to provide immediate access to depositors’ funds on demand (Dia-mond and Dybvig 1983; Diamond and Rajan 2001). Third, because of this vulnerability, banks tend to be supported by a fi nancial safety net (such as deposit insurance or bank access to the short-term discount windows provided by central banks), possibly inducing moral hazard and greater risk-taking incen-tives (Demirgüç-Kunt and Detragiache 2002). Finally, because of this tendency to take ex-cessive risks, banks often face tight regulatory measures—mostly on a national level with limited cross-border coordination. These dif-ferences are conceptually important because they can determine the international banking landscape and the economic outcomes of in-ternational banking activities in both home and host countries. Depending on the institu-tional environment, quality of regulation and supervision, macroeconomic stability in home and host countries, and the different charac-teristics of international banks, cross-border banking activities that bring benefi ts may also lead to certain costs for stakeholders, suggest-ing an important role for government.
INTERNATIONAL BANKING AND ECONOMIC DEVELOPMENT
Foreign banks can increase competition in the banking industry, leading to more effi cient resource mobilization and allocation and greater access to fi nance for both fi rms and households. International debt and equity in-vestments should also create such competitive

GLOBAL FINANCIAL DEVELOPMENT REPORT 2017/2018 F R A M E W O R K , F A C T S , A N D T H E R O L E O F P O L I C Y 25
And yet in another study, for a large panel of countries a foreign bank presence is also posi-tively related to inequality (Delis, Hasan, and Mylonidis 2016). This relationship, however, tends to turn negative when institutional and regulatory differences between home and host countries are suffi ciently large or when foreign banks maintain a large presence in host coun-tries for extended periods of time, suggesting gradual improvement. All in all, even though international banks can potentially increase effi ciency and access, the informational, insti-tutional, and regulatory environments in both home and host countries play a crucial role in determining the effect of international bank-ing on economic development.
INTERNATIONAL BANKING AND FINANCIAL STABILITY
The presence of international banks is likely to be accompanied by greater fi nancial in-fl ows and outfl ows for host markets as part of risk sharing, which could be stabilizing for the local credit supply overall. For example, international banks are more likely than do-mestic banks to maintain their lending in host countries during local economic downturns, thanks to their deep pockets and possibly long-term investment horizons (De Haas and van Lelyveld 2010). On the other hand, in-ternational banks appear to curtail credit in host countries more aggressively than domes-tic banks when a crisis hits the international banks’ home country. This then allows these international banks to perform better in their home country when compared with domes-tic competitors without foreign subsidiaries (De Haas and van Lelyveld 2014; Peek and Rosengren 1997, 2000). International banks thus share risk between host and home coun-tries, transferring funds from home to host countries when a host country crisis hits, and transferring funds from host to home countries when a home country crisis hits. Although this risk-sharing arrangement im-plies greater fi nancial fl ows, it allows both host and home countries to buffer the greatest shocks to their credit supply, thereby stabiliz-ing credit overall.
to hedge, implying high credit risk and vul-nerability to exchange rate fl uctuations. High risk taking may also be associated with for-eign banks if their parent banks try to use them to avoid relatively more stringent regu-lation and supervision in their home coun-tries—that is, engage in regulatory arbitrage (Ongena, Popov, and Udell 2013). Indeed, international banks, and especially global sys-temically important banks (G-SIBs), are very complicated to supervise and to unwind, and thus they pose serious challenges in cross-border bank regulation, supervision, and res-olution in both home and host countries and require cross-border cooperation.
Another channel through which interna-tional banking can promote fi nancial and economic development in host countries is by providing additional human capital and knowledge. Foreign bank entry can lead to improvements in the technology of the host country’s fi nancial systems and business mod-els of domestic banks, allowing fi rms and households to access more sophisticated fi -nancial services (de la Torre, Martínez Pería, and Schmukler 2010). Foreign banks could also impose discipline on policy makers and regulators by breaking the political entrench-ment of certain connected fi rms in the fi nan-cial system that often leads to highly ineffi -cient resource allocation and bad development outcomes.4
Empirical evidence suggests that a foreign bank presence fosters a country’s economic growth and entrepreneurship and, under some conditions, reduces inequality. For ex-ample, Bruno and Hauswald (2013) analyze data for 36 manufacturing industries across 81 countries and fi nd that a foreign bank presence displays a strong positive correla-tion with economic growth in industries with greater dependence on external fi nance. This fi nding is particularly strong for developing economies, where informational and legal frictions often hinder access to credit. Simi-larly, according to Alfaro, Beck, and Calo-miris (2015), in developing countries a greater foreign bank presence is associated with a higher share of business formation in indus-tries with a greater need for external fi nance.

26 F R A M E W O R K , S T Y L I Z E D F A C T S , A N D T H E R O L E O F P O L I C Y GLOBAL FINANCIAL DEVELOPMENT REPORT 2017/2018
banking industries, the existing fi nancial and information infrastructure, the mode of entry of the international banks (cross-border lend-ing versus brick-and-mortar operations via subsidiaries or branches, or greenfi eld versus mergers and acquisitions), and the fi nancial characteristics (such as funding structure) of the parent bank or foreign affi liate (Bertay 2014; De Haas and van Horen 2013; Schnabl 2012). Policy making that affects or stipulates these characteristics may thus have an impor-tant infl uence on host country experiences with international banks, which is discussed in the coming chapters.
International bank lending is an impor-tant source of funds for developing coun-tries compared with international fi nancial market activity and FDI. International banks are involved in two main types of interna-tional activities: (1) cross-border lending and (2) foreign participation in domestic banking systems through brick-and-mortar opera-tions—that is, where the bank is physically present in a country through an offi ce, which can be a branch or part of a foreign bank sub-sidiary owned by the bank. These two activi-ties are the main focus of this Global Finan-cial Development Report 2017/2018 (GFDR), and they are discussed in the next two chap-ters.8 Figure 1.1 illustrates the importance of international banking activity in developing countries compared with foreign bond issu-ances and FDI. These comparisons are not straightforward because data on international bank activities include bond issuances and eq-uity holdings (see box 1.4 later in this chap-ter), data on bond issuances include bonds held by banks, and FDI includes equity invest-ments by banks. For a cleaner comparison, fi gure 1.1 focuses on issuances of syndicated loans led by foreign banking entities, which is only a fraction of all cross-border bank loans, but has the advantage of excluding bond and equity activity. These numbers thus provide a lower bound on the value of international bank lending. Despite being a lower bound, foreign syndicated loan issuances were much larger than foreign bond issuances before the global fi nancial crisis (in 2006, $239 billion for syndicated loans versus $117 billion for
Nevertheless, international banks may also fuel credit booms in host countries that end up in busts if domestic fi nancial systems are not capable of handling such fl ows.5 Credit booms may occur, for example, if international banks lower lending standards (Dell’Ariccia and Marquez 2006a). These booms may end up in busts that are exacerbated if international banks choose to exit. Such behavior—ampli-fi ed by global risk and liquidity conditions—could be harmful to the fi nancial stability of the home or host countries, ending in costly boom and bust cycles and cross-border con-tagion risks (Forbes and Warnock 2012).6 Moreover, developing countries or small economies could also be negatively affected because their monetary policy cannot infl u-ence the decisions of large international banks, making monetary policy less effective.7
The global fi nancial crisis revealed that the extent to which international banks shift funds from host to home countries during a home country crisis is related to a number of country and bank characteristics. These char-acteristics include the cultural and institutional distance between the home and host coun-tries and their relative legal and regulatory frameworks, the structure of their respective
FIGURE 1.1 Foreign Financial Infl ows to Developing Countries: Syndicated Loans, Bonds, and Foreign Direct Investment, 2000–15
Source: World Bank, World Development Indicators (database) and FinDebt (database).
0
2000
2001
2002
2003
2004
2005
2006
2007
2008
2009
2010
2011
2012
2013
2014
2015
100
200
300
400
500
600
700
800
Flow
s (U
S$, b
illio
ns)
Syndicated loans Bonds FDI net inflow

GLOBAL FINANCIAL DEVELOPMENT REPORT 2017/2018 F R A M E W O R K , F A C T S , A N D T H E R O L E O F P O L I C Y 27
the Sub-Saharan Africa (SSA) regions wit-nessed the greatest declines in foreign lending; in both regions, foreign claims on the non-bank private sector, with respect to domestic credit to the private sector by banks, were half of their respective peak values in 2005 (SSA) and 2008 (MENA).
Foreign claims mostly fund the nonbank private sector, particularly in developing countries. At their highest level (in 2008), foreign claims going to the nonbank private sector reached almost 43 percent of gross do-mestic product (GDP) in high-income coun-tries and 32 percent of GDP in developing countries. By contrast, foreign claims going to the offi cial sector have typically remained be-low 10 percent of GDP in high-income coun-tries and below 4 percent of GDP in devel-oping countries. Panel b in fi gure 1.3 shows large reductions in foreign lending to banks and the nonbank private sector, as a percent-age of GDP, after 2008 in both high-income and developing countries, whereas lending to governments by international banks in-creased. Given the relative resilience of total foreign claims in developing countries (see fi gure 1.2), these reductions in relative values to GDP indicate that international banking
bonds). In the years following the global fi -nancial crisis, cross-border bond issuances overtook the foreign syndicated loans, but their sizes were still comparable (in 2015, $233 billion for syndicated loans versus $292 billion for bonds).9 The issuance of syndicated loans led by foreign banks represented about one-third of the volume of FDI net infl ows in the postcrisis years.
International banking activity increased dramatically from 2001 until the global fi nan-cial crisis in 2007–09, but it did not recover from the retrenchment in high-income coun-tries during the crisis. Figure 1.2 reveals that all foreign exposures of international banks from Bank for International Settlements (BIS) reporting countries increased from $8.6 tril-lion in 2000 to $31 trillion in 2008. After the crisis, the international banks reduced their exposures, leading to a signifi cant retrench-ment (by the end of 2015 total foreign claims were $24 trillion, or 22.5 percent lower than in 2008). This retrenchment came from a reduction of foreign claims in high-income countries rather than developing countries, where foreign exposures remain resilient in absolute terms. Another recent development in the global fi nancial arena is the rise of international microfi nance institutions (MFI) (see box 1.3).
Despite the signifi cant decline after the global fi nancial crisis, lending by interna-tional banks continues to represent an impor-tant share of total bank credit in many coun-tries. Data on lending by international banks are provided primarily by BIS. BIS data on foreign claims cover both cross-border lend-ing and loans made by foreign-owned banks within a country (see box 1.4 for a more de-tailed description of foreign claims and box 1.5 for alternative sources of data).10 De-spite the postcrisis decline, lending by foreign banks accounted for 27.6 percent of credit to the private sector in developing countries in 2014 (in high-income countries, 40.6 per-cent). As panel a of fi gure 1.3 shows, both the extent of the foreign bank presence and the impact of the crisis varied by region from 2005 to 2014. After the 2007–09 crisis, the Middle East and North Africa (MENA) and
FIGURE 1.2 Foreign Claims Reported to BIS by Counterparty Income Level, 2000–15
Source: Consolidated Banking Statistics (Immediate Risk Basis), Bank for International Settlements.
2000
2001
2002
2003
2004
2005
2006
2007
2008
2009
2010
2011
2012
2013
2014
2015
0
5
10
15
20
25
30
35
Clai
ms
(US$
, tril
lions
)Claims on developing countries Claims on high-income countries

28 F R A M E W O R K , S T Y L I Z E D F A C T S , A N D T H E R O L E O F P O L I C Y GLOBAL FINANCIAL DEVELOPMENT REPORT 2017/2018
BOX 1.3 The Rise of International Microfi nance Institutions
Over the last two decades, international microfi-nance institutions (MFIs)—institutions affiliated with a common owner that have operations in dif-ferent countries—have emerged and have focused on expanding access to fi nancial services around the world. Many of these institutions follow the green-fi eld business model, which has two main elements: (1) creation of a group of “greenfi eld MFIs,” defi ned as institutions that are newly created without preex-isting infrastructure, staff, clients, or portfolios; and (2) use of central organizing bodies—often holding companies—that create these MFIs through com-mon ownership and management. The holding com-pany usually also plays a large role in backstopping operations, formulating standard policies and proce-dures, providing staff development and training, and cobranding the subsidiaries in the network (Earne and others 2014). Examples of these greenfi eld MFIs are Access, Advans, BRAC, FINCA, and ProCredit.
Some holding companies such as Access, Advans, and ProCredit were founded by specialized microfi -nance consulting fi rms with the purpose of invest-ing in and building a global network of subsidiaries. Others, such as BRAC and FINCA, were established to consolidate the affiliates of existing microfi-nance networks and expand them by creating new greenfi elds.
Greenfi eld MFIs are typically driven by a mission to expand access to financial services and to pro-mote economic development while offering commer-cial success for their shareholders. Shareholders and
investors in these MFIs are primarily development finance institutions, including the African Devel-opment Bank (AfDB), European Investment Bank (EIB), International Finance Corporation (IFC), and KfW Development Bank. The holding company model has provided depository fi nancial institutions with a single vehicle for making larger investments in microfi nance and leveraging their participation with other investors (Earne and others 2014).
Cull and others (2015) have studied the role of greenfi eld MFIs in promoting the quality, breadth, and depth of usage of financial services in Sub-Saharan Africa (SSA). According to their analysis, relative to other African microfinance providers, greenfi eld MFIs grew faster, improved profi tability to levels comparable to those of the top MFIs, and substantially increased their lending to women. Table B1.3.1 illustrates some of these fi ndings. Greenfi eld MFIs in Africa started out with a smaller number of loans and deposits than other MFIs and with a worse fi nancial performance, but they saw a rapid increase in both loans and deposits during their fi rst few years of operation. The numbers also show that, after fi ve years in operation, greenfi eld MFIs had a positive net income, whereas other MFIs had a negative net income. Overall, Cull and others (2015) conclude that, although the loan sizes of greenfi eld MFIs are larger than those of most African MFIs, indicating less outreach to the poorest market segments, green-field MFIs have achieved rapid gains in financial inclusion for somewhat more affl uent clients.
Source: Cull and others 2015.Note: MIX young Africa refers to MFIs four to seven years old that report to the Microfi nance Information eXchange (MIX). The original underlying data were provided by MIX and the International Finance Corporation. BRAC = Building Resources Across Communities; FINCA = Foundation for International Community Assistance; and MFI = microfi nance institution.
TABLE B1.3.1 Evolution of Greenfi eld MFIs in Sub-Saharan Africa during Initial Years of Operation Greenfi elds
Measure Month 12 Month 36 Month 60 MIX young Africa
No. of staff 131 318 524 69No. of branches 9 22 31 10No. of loans outstanding 9,495 25,009 36,714 11,255Gross portfolio (US$, millions) $2.3 $9.2 $20.0 $2.7No. of deposit accounts 7,123 37,460 81,682 18,127Deposits (US$, millions) $0.8 $8.7 $23.1 $2.0Share of portfolios at risk >30 days 3.9% 4.0% 3.4% 9.5%Operating expenses/portfolio 200% 53% 36% 113%Equity (US$, millions) $3.6 $4.3 $6.6 $1.2Net income/assets −12.4% −0.1% 3.1% −2.4%Net income/equity −44.6% −0.3% 18.9% −3.4%

GLOBAL FINANCIAL DEVELOPMENT REPORT 2017/2018 F R A M E W O R K , F A C T S , A N D T H E R O L E O F P O L I C Y 29
BOX 1.4 What Constitutes a Foreign Bank Claim? An Overview of the Banking Statistics of the Bank for International Settlements (BIS)
A foreign bank claim is a fi nancial claim extended by an international bank (as defi ned in box 1.2) to a nonresident of the bank’s headquarters country (García-Herrero and Martínez Pería 2007). It typi-cally includes financial assets such as loans, debt securities, equity holdings, and derivatives with posi-tive market values (BIS 2015). At the banking sys-tem level, claim information is available from BIS International Banking Statistics through two parallel data sets.
Consolidated Banking Statistics (CBS). This data set measures the consolidated assets and liabilities of banks headquartered in 31 reporting countries. Intra-group transactions are netted out using an approach similar to that adopted by banking supervision. The CBS disaggregates along two important dimensions. First, it distinguishes between foreign claims booked by bank offi ces within counterparty jurisdictions as local claims and those booked outside from global or regional headquarters as cross-border claims (see fi gure B1.4.1). This approach provides a channel for understanding the sources of foreign credit for indi-vidual countries and sectors. Second, the CBS reports on an immediate counterparty (IC) basis according to the residences of the contracted parties, and it reports on an ultimate risk (UR) basis, accounting for risk transferalsa to parent entities or third-party guaran-tors. This kind of reporting reveals the country risk exposures of international banks. And these two features make the CBS a valuable source of infor-mation for tracing shock transmissions across bank-ing systems and economies. In addition, the CBS/IC contains maturity disaggregation for international claims (defi ned as the combination of cross-border
claims and nonlocal currency claims by local bank affiliates). Quarterly stock value series are avail-able from 2000 onward, and semiannual data for a smaller number of countries begin as early as 1983.
Locational Banking Statistics (LBS). The LBS pro-vides the gross assets and liabilities of banks head-quartered in 44 countries. However, unlike the CBS, under principles consistent with balance of payments accounting, it notably does not adjust for intragroup positions. Details in the LBS reveal the location and nationality of reporting banks, the residence and sec-tor of counterparties,b as well as the currencies and instruments used by banks in transactions. The LBS is especially useful in understanding the capital fl ows, monetary spillovers, and funding risks of banking systems. Quarterly series of amounts outstanding and adjusted fl ows are available from as early as 1977.
a. Through credit commitments, guarantees, and derivative contracts.b. As of December 2016, LBS information by reporting, parent, and counterparty country was unilateral.
FIGURE B1.4.1 A Taxonomy of Foreign Claims
Source: Adapted from Cerutti, Claessens, and McGuire 2012.Note: The blocks indicate data availability: block A = CBS/UR only; blocks A + B and block C = CBS/IC only; block B = unavailable in CBS; and blocks A + B + C = CBS/UR and CBS/IC. CBS = Consolidated Banking Statistics; IC = immedi-ate counterparty; and UR = ultimate risk.
Cross-borderclaims
A
A + B = International claims
A + B + C = Foreign claims
Local claims offoreign affiliates in
foreign currency
BLocal claims of
foreign affiliates inlocal currency
C
⎭⎩ ⎬
has not kept up with the economic growth in developing countries.
Cross-Border Lending versus Local Lending by Foreign Banks
Almost all regions witnessed enormous in-creases in cross-border claims before the global
fi nancial crisis, followed by a postcrisis drop in cross-border claims. Although all regions saw such a drop immediately after the crisis, cross-border claims going to the Latin America and the Caribbean (LAC) and East Asia and Pa-cifi c (EAP) regions showed a signifi cant recov-ery after this period (panel a, fi gure 1.4).11 By contrast, the exceptional precrisis increase in

30 F R A M E W O R K , S T Y L I Z E D F A C T S , A N D T H E R O L E O F P O L I C Y GLOBAL FINANCIAL DEVELOPMENT REPORT 2017/2018
BOX 1.5 What Data Can Be Used to Understand the Activities of International Banks?
Data at different levels of granularity offer nuanced details on the evolution of global banking and shed light on bank activities from various perspectives.
Transaction-Level Data: Syndicated Bank Lending
Syndicated lending is one type of bank credit more systematically documented in commercially avail-able data sets. Sources such as Dealogic, Thompson Reuters, and Bloomberg provide the number, volume, and currency denomination of syndicated loans, the country and sector of borrowers, and the identity and funding shares of syndicate members.
World Bank FinDebt Database. The World Bank’s Finance and Markets Global Practice constructs the Global Bond and Syndicated Loan Database (FinDebt) quarterly using Dealogic information. The database reports at the borrower sector level syndi-cated lending volumes, maturities, pricing margins, currency decompositions, and fund uses. A timely source for identifying trends in domestic and cross-border bank lending activities, FinDebt provides data on 182 borrower countries as of early 2000.a
Bank-Level Data: Financials and Ownership Structures
As international bank lending via local affiliates expands, the equity structures of global banks and balance sheets of affi liates become essential elements in understanding risk propagation in banking sys-tems. Although bank-level data are released by regu-lators in specifi c countries, comparable information at the international level is limited, except for sys-temically important banks.
BIS G-SIB Assessment. Following the methodology identifi ed by the Basel Committee on Banking Super-vision (BCBS), the Bank for International Settlements (BIS) publishes 12 indicators in fi ve categories that capture the size, interconnectedness, substitutability, complexity, and cross-jurisdictional activity of an annually updated list of global systemically impor-tant banks, or G-SIBs (BIS 2013).b This list consists of 75 of the largest global banks (BIS 2013), including those from emerging markets in Brazil, China, India, and the Russian Federation. Notably, bank-level for-eign positions not available in the BIS International Banking Statistics are disclosed annually by most of
the G-SIBs in this sample. These data enable users to identify the most recent trends in the size and cross-border activities of global banks and compare global banks from developed and developing countries.
Other than regulatory disclosures, financials and ownership information are typically provided in packages, along with rating information, by pri-vate companies through data services such as Bureau van Dijk Orbis Bank Focus (formerly Bankscope), Fitch EM Banking Datawatch, and S&P Global Market Intelligence (formerly SNL Financials). Such commercial data sets may cover large samples with various degrees of comprehensiveness. Building on Bureau van Dijk Bankscope, two recent statistical efforts identify the nationality of majority owners and provide insights into the evolution of bank par-ticipation through foreign subsidiaries:c
Foreign Bank Ownership Database. Initially pub-lished as an annex by Claessens and van Horen (2014b), the updated database reveals the national-ity of direct majority ownership for more than 5,000 banking entitiesd in 138 economies for each year an entity was active during 1995–2013. Having also absorbed information from bank reports, regulatory agencies, monetary authorities, and stock exchanges, this comprehensive data set covers more than 90 percent of banking assets in each country’s banking system. It has been applied by researchers seeking to understand the relationship between foreign bank presence and private credit provision (Claessens and van Horen 2014b), business regulations (Kouretas and Tsoumas 2016), and the impact of the global fi nancial crisis on banking globalization (Claessens and van Horen 2015). The Foreign Bank Ownership Database is available publicly.
Bertay, Demirgüç-Kunt, and Huizinga (2017). This recent study captures ownership structures from the viewpoint of ultimate shareholders for the period 2000–15. It maps direct owner and subsidiary links onto banking group-level equity networks. The data set identifi es more than 2,750 banking groups with majority-owned affi liates, 325 of which control at least one foreign bank subsidiary. The data set also demonstrates evolutionary trends of bank foreign exposure and organizational complexity by linking subsidiary asset and liability information with that of controlling banks. It provides an alternative perspec-tive of country exposures in contrast to those based
(box continued next page)

GLOBAL FINANCIAL DEVELOPMENT REPORT 2017/2018 F R A M E W O R K , F A C T S , A N D T H E R O L E O F P O L I C Y 31
BOX 1.5 What Data Can Be Used to Understand the Activities of International Banks? (continued)
on banking claims, and it reveals intragroup and intergroup differences in asset composition, funding strategy, operational effi ciency, and risk transmission channels among global bank offi ces.
System-Level Data: Claims and Liabilities
The gross and net asset and liability positions of banking systems are useful from a fi nancial develop-ment perspective for cross-country analysis.
BIS International Banking Statistics. As discussed in detail in box 1.4, such information is typically col-lected and reported by national monetary authorities and reported through the BIS International Banking Statistics. Recent studies such as Broner and oth-ers (2017) have applied bilateral locational banking
information derived from more nuanced, confi den-tial bank-level reports of counterparty exposures. Covering banks from 44 reporting countries (mostly advanced economies, offshore centers, and emerg-ing marketse), this type of information provides broad coverage because the global banking industry remains geographically concentrated. The informa-tion revealed on cross-border bank assets and liabili-ties is particularly useful for capturing bank fl ows to and from high-income economies.
Data challenges remain in addressing global banking systemic risk assessments and accounting for cross-border financial linkages. The IMF-FSB G-20 Data Gaps Initiative recommends the collec-tion of consistent bank-level data for joint analyses and continued enhancement of existing aggregate statistics.
a. FinDebt was accessible only within the World Bank as of December 2016.b. The list of G-SIBs/G-SIFIs (global systemically important fi nancial institutions) was initially published by the Financial Stability Board (FSB) in November 2011 using end-2009 data. Since July 2013, it has been adjusted annually. In the end-2014 exercise, 30 banks were identifi ed as G-SIBs that are required to meet higher loss absorbency as well as regulatory capital requirements under the Basel III framework (see http://www.bis.org/bcbs/gsib/gsib_assessment_samples.htm).c. Bankscope does not contain information systematically covering foreign branches. Thus bank-level databases exclusively relying on it include foreign bank participation through subsidiaries only. The difference may have important implications, as discussed in chapter 2.d. Including commercial banks, saving banks, cooperative banks, and bank holding companies.e. With the exception of China and Russia.
FIGURE 1.3 Lending by International Banks: Foreign Claims on Counterparty Nonbank Private Sector (Country-Level Average by Region) and on Counterparty Sectors (Country-Level Average by Income Level), 2005–14
Sources: Consolidated Banking Statistics (Ultimate Risk Basis); Bank for International Settlements, and International Financial Statistics (database); and International Monetary Fund.Note: Regions exclude high-income countries that belong to the Organisation for Economic Co-operation and Development (OECD).
a. Lending to the private sector b. Counterparty sectoral composition
0
10
20
30
40
50
60
70
% o
f dom
estic
cre
dit t
o pr
ivat
e se
ctor
by d
epos
it m
oney
ban
ks
0
10
20
30
40
50
60
70
80
2005 2008 2011 2014 2005 2008 2011 2014High income Developing
% o
f GDP
Nonbank private sector Official sector Banks2005 2008 2011 2014
East Asiaand Pacific
Europe andCentral Asia
LatinAmericaand the
Caribbean
Middle Eastand
North Africa
SouthAsia
Sub-SaharanAfrica

32 F R A M E W O R K , S T Y L I Z E D F A C T S , A N D T H E R O L E O F P O L I C Y GLOBAL FINANCIAL DEVELOPMENT REPORT 2017/2018
claims over the last few years (panel b, fi gure 1.4). This difference is also pronounced for developing countries, where local claims were higher than cross-border claims before the global fi nancial crisis and where local claims have increased even more than cross-border claims since the crisis.
New Developments in International Banking
Foreign bank participation in local markets was on the rise in all regions until recently, when some major banks began to retrench their international operations. In all regions, the shares of foreign banks of the total number of banks increased slightly from 2009 to 2013 and remained higher than during the pre crisis period (see panel a, fi gure 1.5). From 1995 to 2013, the share of foreign banks increased about twofold in the EAP, LAC, and MENA regions and threefold in the ECA region. The asset shares of foreign banks also increased
cross-border claims in the Europe and Central Asia (ECA) region did not continue after the crisis, and claims on this region remained more or less fi xed until 2013, when they began to fall signifi cantly.12 As of 2014:Q4, total cross-border claims by all bank nationalities report-ing to the BIS Consolidated Banking Statistics (CBS) reached $12 trillion on an UR basis, ac-counting for about one-sixth of global bank-ing assets.13 High-income countries received about three-quarters of all cross-border claims in 2014.
Proving more resilient to the fi nancial cri-sis, lending by local foreign banks is now a more important source of credit than cross-border lending in both high-income and de-veloping countries. In high-income countries, cross-border claims, which used to be higher than local claims before the global fi nan-cial crisis, fell signifi cantly after the crisis, whereas local claims by foreign affi liates suf-fered much less from the fi nancial crisis, mak-ing them more important than cross-border
FIGURE 1.4 Cross-Border Bank Flows: Cross-Border Claims on Counterparty Regions and Foreign Claims on Counterparty Economies by Position Type and Income Level, 2005–15
Source: Consolidated Bank Statistics (Ultimate Risk Basis), Bank for International Settlements.Note: According to the World Bank’s classifi cation, developed countries are defi ned as high-income countries; the rest of the countries are defi ned as developing countries. Regions exclude high-income countries that belong to the Organisation for Economic Co-operation and Development (OECD).
a. Cross-border claims on counterparty regions b. Cross-border claims versus local claims
0
2
4
6
8
10
12
14
16
0
100
200
300
400
500
600
700
800
Clai
ms
(US$
, tril
lions
)
Clai
ms
(US$
, bill
ions
)
East Asia and PacificEurope and Central AsiaLatin America and the CaribbeanMiddle East and North Africa
South AsiaSub-Saharan AfricaHigh-income OECD (right axis)
0
0.5
1.0
1.5
2.0
2.5
3.0
3.5
4.0
0
2
4
6
8
10
12
14
16
Clai
ms
(US$
, tril
lions
)
Clai
ms
(US$
, tril
lions
)
Cross-border, high incomeLocal, high income
Cross-border, developing(right axis)Local, developing (right axis)
2005
2006
2007
2008
2009
2010
2011
2012
2013
2014
2015
2005
2006
2007
2008
2009
2010
2011
2012
2013
2014
2015

GLOBAL FINANCIAL DEVELOPMENT REPORT 2017/2018 F R A M E W O R K , F A C T S , A N D T H E R O L E O F P O L I C Y 33
information problems because of their short cultural and institutional distances and region-specifi c knowledge. On the other hand, the lack of experience and technical know-how, as well as the probable insuffi cient prudential and AML/CFT (anti–money laundering and com-bating the fi nancing of terrorism) regulation and supervision in the home country, may be harmful to economic development and fi nan-cial stability. Although internationally compa-rable data on developing country international banks are relatively limited, the available evi-dence suggests the rising importance of devel-oping country banks as foreign participants. Panel a of fi gure 1.6 shows the large increases in absolute amounts of foreign claims origi-nating from Brazil, India, Mexico, and Turkey. The increase mostly stems from the increases in the foreign claims of banks from Brazil and India, with Turkish and Mexican banks playing a small role. The increases in foreign claims of these countries suggest the greater in-ternational involvement of developing country banks. Indeed, in developing country bank-ing systems, the share of foreign banks owned by other developing countries (in terms of
in all regions before the crisis (panel b, fi gure 1.5); but since the crisis the share of foreign bank assets has declined across the board, except in East Asia and Latin America.14 In fact, several major international banks (such as Deutsche Bank) recently announced plans to drastically reduce the number of countries in which they operate. Overall, despite this re-trenchment in the ECA and SSA regions, for-eign banks continue to constitute over 40–50 percent of the banking industry in both num-bers of banks and their asset shares—similar to the more resilient LAC region’s foreign banking landscape.
In some regions, the retrenchment of global banks has been accompanied by an expansion of regional players, involving a greater variety of players. Indeed, the prospects for interna-tional banking might inspire developing coun-tries to have their own international banks investing regionally or globally. On the one hand, such South–South international bank-ing might offer greater potential to provide banking services. Developing country banks may be more successful in navigating weaker legal frameworks and solving asymmetric
FIGURE 1.5 Foreign Bank Presence through Subsidiaries: Share of Foreign Banks of Total Banks (Country-Level Average by Region, 1997–2013) and Share of Foreign Bank Assets of Total Bank Assets (Country-Level Average by Region, 2005–13)
Source: Claessens and van Horen 2015.Note: Regions exclude high-income countries that belong to the Organisation for Economic Co-operation and Development (OECD).
a. Share of foreign banks of total banks b. Share of foreign bank assets of total bank assets
% o
f tot
al b
ank
asse
ts
0
10
20
30
40
50
60
70
% o
f ban
ks
0
10
20
30
40
50
60
70
2005 2009 20131997 2001 2005 2009 2013
East Asiaand
Pacific
Europeand
CentralAsia
LatinAmericaand the
Caribbean
MiddleEast
and NorthAfrica
SouthAsia
Sub-SaharanAfrica
High-incomeOECD
East Asiaand
Pacific
Europeand
CentralAsia
LatinAmericaand the
Caribbean
MiddleEast
and NorthAfrica
SouthAsia
Sub-SaharanAfrica
High-incomeOECD

34 F R A M E W O R K , S T Y L I Z E D F A C T S , A N D T H E R O L E O F P O L I C Y GLOBAL FINANCIAL DEVELOPMENT REPORT 2017/2018
(panel b, fi gure 1.7).16 This trend suggests that a handful of banks have become very large compared with GDP, possibly leading to sys-temic problems in the banking system if one of them fails.17 The share of foreign banks among the largest banks in developing coun-tries is rather low (as suggested by panel b, fi g-ure 1.7). Nevertheless, in some regions such as ECA and SSA, the assets of the largest foreign banks correspond to a sizable 10–20 percent of GDP on average. These banks may be sys-temically important in the host countries but not necessarily in the home country or for the parent bank, which can have important impli-cations for fi nancial stability and cross-border policy coordination. Almost all banks tend to hold some foreign assets, but the largest banks dominate cross-border activities through sub-sidiaries and branches (Buch, Koch, and Koet-ter 2011). Data from the assessment of G-SIBs by BIS confi rm that virtually all the banks in their sample of large banks have signifi cant foreign claims,18 making up on average 23 percent of their total on- and off-balance-sheet exposure. These fi gures suggest that bank size
number of banks) has increased dramatically, from 8 percent in 2001 to 16 percent in 2013, whereas foreign banks owned by high-income countries have fallen to 23 percent from their peak of 25 percent during the global fi nancial crisis (panel b, fi gure 1.6).
Banks have also become very large over the last decade, and most of the largest ones are international. During the last decade, but es-pecially leading up to the global fi nancial cri-sis of 2007–09, the size of the world’s largest banks increased dramatically (panel a, fi gure 1.7). From 2005 to 2014, the total size (mea-sured by real total assets from unconsolidated balance sheets) of the world’s largest 10, 50, and 100 banks increased by more than 40 percent (from $14.2 trillion to $20 trillion in the case of the top 10). Interestingly, despite all the regulatory efforts to curb bank size and address too-big-to-fail problems, banks did not on average contract in size after the crisis.15 In most regions, the largest banks in-creased their size not only in absolute terms but also relative to their national economies when compared with the precrisis period
FIGURE 1.6 Rise of South–South Banking: Foreign Claims by Banks in BIS-Reporting Countries (2003–15) and Nationality of Majority Ownership of Banks in Developing Countries (1995–2013)
Sources: Panel a: Consolidated Bank Statistics (Immediate Risk Basis), Bank for International Settlements; and panel b: Claessens and van Horen 2015.
a. Foreign claims by banks of BIS-reporting developingand developed countries
b. Composition of developing country banking systems
0
50
100
150
200
250
300
350
0
2003
2004
2005
2006
2007
2008
2009
2010
2011
2012
2013
2014
2015
5
10
15
20
25
30
35
Clai
ms
(US$
, bill
ions
)
Clai
ms
(US$
, tril
lions
)
High-income reporting countriesBrazil, India, Mexico, and Turkey (right axis)
81 78 73 7062 61
14 15 19 2025 23
6 7 8 9 13 16
0
20
40
60
80
100
1995 1997 1999 2001 2003 2005 2007 2009 2011 2013
Cum
ulat
ive
shar
e in
term
s of
num
ber o
f ban
ks (%
)
Domestic Foreign, high income Foreign, developing

GLOBAL FINANCIAL DEVELOPMENT REPORT 2017/2018 F R A M E W O R K , F A C T S , A N D T H E R O L E O F P O L I C Y 35
should be a central issue in any discussion of international banking.
Many countries, including many develop-ing countries, have increased their restrictive policies on international banking. Regulatory and supervisory restrictions on foreign bank entry may reduce bank competition, leading to ineffi ciencies, inferior capital allocation, and a slower pace of economic develop-ment. Figure 1.8 presents an index proxying restrictions on foreign bank entry and rates of license application denials over the period 2000–11. In both developed and develop-ing countries, foreign bank entry was easier during the fi rst half of the 2000s than dur-ing the second half, which includes the global fi nancial crisis. A recent survey by Ichiue and Lambert (2016) on postcrisis interna-tional banking regulation also reveals tighter regulation of international bank activities in both home and host countries (and espe-cially in developed economies) from 2006 to 2014. Other recent policy changes, including macro prudential policies (such as increased
FIGURE 1.7 Total Assets of Largest Banks (Absolute Amounts, on a Rolling Basis) and Size of Assets in Relation to National Economies (Combined Assets of Top Five Banks, Country-Level Average by Region), 2005–14
Sources: Bureau van Dijk Bankscope (database); and World Development Indicators (database).Note: Panel b indicates asset decomposition on an unconsolidated basis. Regions exclude high-income countries that belong to the Organisation for Economic Co-operation and Development (OECD).
a. Assets, absolute amounts b. Assets of top five banks relative to GDP
0
20
40
60
80
100
120
140
2005 2006 2007 2008 2009 2010 2011 2012 2013 201420
0520
0920
1320
0520
0920
1320
0520
0920
1320
0520
0920
1320
0520
0920
1320
0520
0920
13
Asse
ts (2
010
US$,
trill
ions
)
Top 10 Top 50 Top 100 Top 500 Top 1,000
0
10
20
30
40
50
60
70
80
Shar
e of
GDP
(%)
Foreign Domestic
East Asiaand
Pacific
Europeand
CentralAsia
LatinAmericaand the
Caribbean
MiddleEast
and NorthAfrica
SouthAsia
Sub-SaharanAfrica
FIGURE 1.8 Regulatory Restrictions on Foreign Bank Entry and Ownership (Country-Level Average), 2000–11
Source: Barth, Caprio, and Levine 2013.Note: The index of foreign bank entry and ownership captures restric-tions on foreign bank entry to a market through four channels: acquisi-tions, subsidiaries, branches, and joint ventures. At the country level, the index is equal to four minus the number of restricted channels.
High-income countries Developing countries
3.4
3.5
3.6
3.7
3.8
3.9
4.0 4.00
2000
4.00
2003
3.90
2007
3.72
2011
3.74
2000
3.71
2003
3.56
2007
3.61
2011
Inde
x, 0
–4 (w
ith 4
bei
ng le
ast r
estri
ctiv
e)

36 F R A M E W O R K , S T Y L I Z E D F A C T S , A N D T H E R O L E O F P O L I C Y GLOBAL FINANCIAL DEVELOPMENT REPORT 2017/2018
these companies, information sharing, super-vision, and joint assessment of “systemically important” fi ntech fi rms will be important tasks for regulators.
POLICY IMPLICATIONS
Overall, effi cient allocation of resources is key to economic development, and interna-tional banks can play an important role in introducing competition and improving the effi ciency of the fi nancial system. In addition, international banking can act as a risk-sharingscheme, smoothing downturns by sharing them among home and host countries. Risk sharing implies greater fi nancial infl ows and outfl ows for host markets, but it should sta-bilize the local credit supply overall. Neverthe-less, a country’s experience with international banks tends to depend on the characteristics of those banks as well as the country’s insti-tutional and regulatory environment, implying that policy can play a crucial role in shaping this experience. The global fi nancial crisis pro-vided crucial insights into the importance of international banking for economic develop-ment and fi nancial stability, confi rming the im-portance of heterogeneity of impact based on differences in home and host country policies.
The benefi ts and costs of international banking are two sides of the same coin, imply-ing that good policy making is very important in ensuring that developing countries benefi t from international banking. The challenge of policy is to maximize the benefi ts of bank in-ternationalization while minimizing the costs and making international banking a reliable component of the global fi nancial system for developing countries. Cross-border regulation,supervision, and resolution mechanisms; legal, information, and other institutional frame-works; and competition policy in the fi nancial sector, including entry regulations—all can be designed with an eye toward minimizing the costs and maximizing the benefi ts of bank globalization. Finally, two new trends—the increasing South–South activity by interna-tionalizing developing country banks and the potential of technological advances and fi ntech to modify global banking—present
capital requirements or discriminatory reserve requirement ratios) and ring-fencing of for-eign bank subsidiaries, may also restrict inter-national banking activities (Claessens 2016). All in all, various regulatory actions after the global fi nancial crisis have led to de jure and de facto restrictions on international banking activities. This is also refl ected in the reduc-tion of entry after the crisis. Indeed, although the number of foreign banks exiting markets has remained more or less the same, there was much less entry after the crisis, and net entry became negative for the fi rst time since 1995.
A recent factor in the global banking land-scape is the new fi nancial technology (fi ntech) fi rms. Fintech refers to technology-enabled fi nancial innovation facilitating new prod-ucts, services, and business models. After the global fi nancial crisis, low interest rates and the departure of traditional banks from some specifi c segments created opportunities for fi ntech fi rms to disrupt the traditional fi -nancial intermediation process. Although the size of these fi rms is currently negligible com-pared with that of traditional banks, the ser-vices they provide can result in competition in many lines of bank business. Indeed, digital fi -nancial services lead to cost reductions and to better capture of new market segments, and therefore greater fi nancial inclusion. Many traditional banks have already acknowledged these prospects and have begun to work with fi ntech fi rms, focusing on complementarities or pursuing new digital technologies in house (see chapter 3). From peer-to-peer (P2P) lend-ing practices to payment services, many of the areas in which fi ntech fi rms operate have natural international extensions. For exam-ple, crowdfunding microloans to households or groups in developing countries saves the valuable capital of MFIs such as Kiva.org, and cross-border, P2P money transfer services (such as TransferWise) reduce the cost of sending remittances to developing countries. If successful, fi ntech fi rms will pose various challenges for regulators worldwide. There will be cross-jurisdictional concerns because fi ntech fi rms largely work globally, and it is not clear which country’s laws would be ap-plied to them. To achieve coordination among
GLOBAL FINANCIAL DEVELOPMENT REPORT 2017/2018 F R A M E W O R K , F A C T S , A N D T H E R O L E O F P O L I C Y 37
9. The pattern looks similar when examining data for all countries, not just developing ones. Here, the value of foreign syndicated loan issuances was $2.5 trillion in 2006 and $3.0 trillion in 2015. The total value of global cross-border bond issuances was $3.2 trillion in 2006 and $3.8 trillion in 2015. The proceeds from initial public offerings (IPOs) globally were about $0.8 trillion in both 2006 and 2013, according to the “Global Equity Capital Markets Review” by Reuters (2014).
10. The BIS data contain information on the posi-tions of banks, which include other fi nancial assets such as debt securities and equity hold-ing on top of loans. The series can be used as a proxy for international bank lending (see, for example, Cetorelli and Goldberg 2011).
11. These series look quite similar (except their magnitudes are smaller) when the BRICS countries (Brazil, Russia, India, China, and South Africa) are excluded—they are the larg-est receivers of cross-border funds. The only exception here is the South Asia (SAR) region, in which almost all cross-border claims go to India.
12. During the global fi nancial crisis, the ECA region acted as a laboratory for international banking activities because of high foreign bank involvement. This experiment provided lessons for other countries, which are detailed in chapter 2.
13. Here, global assets include those of deposit money banks, which are restricted to deposi-tory institutions such as commercial banks, credit unions, savings institutions, and money market mutual funds, according to defi nitions in the International Financial Statistics of the International Monetary Fund. The World Bank’s Global Financial Development Data-base indicates that by 2013:Q4, total assets owned by deposit money banks stood at $72.3 trillion.
14. The difference between increases in the share of number of foreign banks and in the share of foreign bank assets indicates domestic banking consolidation in some regions.
15. The total asset size of the 10 largest banks in 2013 was virtually the same as in 2007, although the list consists in part of different banks.
16. Percentage increases in the assets of the larg-est fi ve banks with respect to national econo-mies are higher in many regions (specifi cally,
new challenges. We turn to these in the next chapters.
NOTES
1. Large domestic banks may receive funding from international capital markets to supply credit to fi rms and households. Yet they may still lack the necessary risk management tools or corporate governance practices, or they may behave politically if they are state-owned (Dinc 2005), channeling funds to less effi cient fi rms and ending up with lower profi ts and higher costs than foreign banks (Micco, Pan-izza, and Yañez 2007). They may also not be able to roll over debt in the case of domes-tic turmoil (see Schnabl 2012), such as when internationally funded domestic banks cut credit more than foreign banks.
2. This may especially be severe when a lack of an information infrastructure prohibits domestic banks from reaching SMEs and the poorest households. In such an environment, even if domestic banks move down the mar-ket, that may be another example of excessive risk taking causing problems in the future.
3. Jeon and others (2016) show that domestic bank risk taking increases as the foreign bank presence increases in a developing country setting.
4. See Goldberg (2009) for an overview. 5. For example, in the early 2000s (2001–04)
international banks played an important role in expanding credit in economies in Central and Eastern Europe (Enoch 2007), leading in some cases to excessive credit booms (Duen-wald, Gueorguiev, and Schaechter 2005).
6. Boom/bust cycles similar to those in the tra-ditional banking sectors may also apply to microfi nance institutions in developing coun-tries (Wagner 2012).
7. According to Wu, Luca, and Jeon (2011), compared with domestic banks, foreign banks are less responsive to host monetary policy shocks, weakening lending chan-nels in emerging economies. Wu, Lim, and Jeon (2016) provide similar evidence for the Republic of Korea, emphasizing that foreign bank branches rather than subsidiaries drove the results during the global fi nancial crisis.
8. See Smith, Walter, and DeLong (2012) for a general outlook on the activities of global banks, which include bond and equity issu-ance, wealth management, advisory or pay-ment services, and trading.

38 F R A M E W O R K , S T Y L I Z E D F A C T S , A N D T H E R O L E O F P O L I C Y GLOBAL FINANCIAL DEVELOPMENT REPORT 2017/2018
try—are associated with various bank charac-teristics such as risk and return, activity mix, and funding strategy. They show, for example, that banks with a larger systemic size have lower returns on assets without necessarily having lower risk as measured by the z-score, whereas those with a larger absolute size have higher returns on assets without necessarily having high risk as measured by the z-score.
18. The term used in the assessment templates is cross-jurisdictional claims.
the ECA, LAC, MENA, and SSA, and high-income OECD countries) than the asset growth of the remaining banking systems, relative to GDP.
17. Furthermore, the absolute and systemic size of banks could have consequences for their business models and funding structures. Ber-tay, Demirgüç-Kunt, and Huizinga (2013) analyze how absolute size—measured by real total assets—and systemic size—measured by total assets over the GDP of the home coun-


• Financial systems are multidimensional. Four characteristics are of particular interest for benchmarking fi nancial systems: fi nancial depth, access, effi ciency, and stability. These characteristics need to be measured for fi nancial institutions and markets.
• Financial systems come in all shapes and sizes, and differ widely in terms of the four characteristics. As economies develop, services provided by fi nancial markets tend to become more important than those provided by banks.
• The global fi nancial crisis was not only about fi nancial instability. In some economies, the crisis was associated with important changes in fi nancial depth and access.
B R I C K - A N D - M O R T A R O P E R A T I O N S O F I N T E R N A T I O N A L B A N K S
• Foreign banks, through their brick-and-mortar operations, have the potential to improve the performance of local banks as well as the degree of competition in the local banking sector and the overall access to credit in the host economy. These benefi ts are more likely to mate-rialize when the proper regulatory and supervisory frameworks are in place in both the host and home countries, and when fi nancial liberalization is accompanied by institutional reforms that strengthen the information environment and contract enforcement of the host economy.
• Although foreign banks can help smooth credit fl ows during local fi nancial crises, they also can import shocks from abroad. Cross-border cooperation between authorities from both the home and host countries can help minimize the propagation of shocks. In addition, host economies can opt to allow the entry of foreign banks from home countries with stricter bank regulations, or to diversify the roster of foreign banks by the home country in order to miti-gate the impact of shocks from a specifi c country.
• The composition of foreign banks is evolving rapidly. Since the global fi nancial crisis, most bank exits have been by banks with headquarters in high-income countries, whereas South–South entry has been increasing and greater regionalization in the roster of foreign banks has been observed. These trends could affect who gets credit because South–South banking may be better at overcoming the challenges of lending to the smaller and more informationally opaque clients common in developing countries. Nevertheless, greater South–South banking may also entail additional risks from hosting foreign banks from less regulated and institu-tionally weaker home countries.
• More intensive cooperation is needed between home and host countries, going beyond in-ternational agreements and the exchange of information. Under the current cooperation ar-rangements, host country authorities have limited ability to properly supervise international banks, and supervisors from home and host countries do not fully consider the effects of their decisions beyond their borders.
• New technologies in the fi nance area are bringing new competitors and altering the way banks do business. These changes are likely to impact access to fi nancial services as well as the effi ciency and stability of the fi nancial sector. Financial technology can increase access and improve the delivery of fi nancial services, thereby reshaping competition among fi nancial pro-viders. Large international banks that can afford to increase investment in research and de-velopment are likely to play an important role in this area. A key challenge for policy makers will be to closely monitor the risks of a new, rapidly developing industry without hindering its potential.
CHAPTER 2: KEY MESSAGES

2Brick-and-Mortar
Operations of International Banks
G L O B A L F I N A N C I A L D E V E L O P M E N T R E P O R T 2 0 1 7 / 2 0 1 8 41
An extensive body of literature is de-voted to studying the role of foreign banks in the domestic banking sectors
that host their brick-and-mortar operations and their impact on local bank competition, fi nancial stability, and access to credit. The bulk of the research published from the late 1980s to the early 2000s found that a foreign bank presence had generally positive effects on banking sector competition, effi ciency, and stability, with more mixed results on access to credit. But this generally positive assessment was, at least in part, a refl ection of the types of banks that chose to go abroad during this period—that is, they were mostly well-estab-lished banks from developed countries. And their effects on domestic banking sectors de-pended crucially on the extent of development of the host country’s banks, with greater gains in competition and effi ciency in host countries with less developed banking sectors. Indeed, foreign banks found it much harder to com-pete effectively when entering many developed countries (Berger and others 2000; Chang, Hasan, and Hunter 1998; DeYoung and Nolle 1996; Hasan and Hunter 1996; Miller and Parkhe 2002; Peek, Rosengren, and Kasirye1999). Also, banking crises generally ema-nated from less developed host countries, and
the entry of foreign banks helped them restore fi nancial intermediation. Moreover, the for-eign banks that were already present in those countries (again, largely the affi liates of par-ent banks in developed countries) were often able to help stabilize the credit supply.
A wider reading of the literature, especially in light of new research since the global fi -nancial crisis and euro area crises, makes it clear that international banking has always been accompanied by both risks and oppor-tunities. The balance between benefi ts and costs has depended on the roster of foreign participants, the health of their home country banking sectors, and, perhaps most impor-tant, the institutional and legal environments of the host country. Global evidence indicates that the relationship between the presence of foreign banks and private credit levels is nega-tive in low-income countries and in countries where contract enforcement is costly and ac-cess to credit information is limited (Claessens and van Horen 2014b).
New evidence also reveals that a foreign bank presence fosters higher rates of busi-ness formation, but that these effects are much stronger in economies with tougher le-gal enforcement. Foreign bank entrants from

42 B R I C K - A N D - M O R T A R O P E R A T I O N S O F I N T E R N A T I O N A L B A N K S GLOBAL FINANCIAL DEVELOPMENT REPORT 2017/2018
regulatory and supervisory framework, ac-companied by institutional reforms that strengthen the local banking sector and thus prevent foreign banks from capturing enough market power to force out domestic banks (Demirgüç-Kunt, Beck, and Honohan 2008). As for institutional factors, host countries should improve their information environ-ment and the quality of contract enforcement, which can enable foreign banks to further develop the domestic banking sector. Host country authorities can also minimize the risks associated with foreign bank participa-tion, by, for example, having their regulators strive for a diversifi ed roster of foreign banks, which would limit the exposure to shocks from a particular country.
Regulators should also be aware of the increase in South–South banking. Although the overall levels of foreign presence have re-mained steady since the global fi nancial crisis, the composition of foreign banks is chang-ing. The network of foreign bank subsidiaries from emerging markets and developing econ-omies operating in other developing countries increased substantially over the last decade (map 2.1). Banks from developing countries represented about two-thirds of the new en-tries postcrisis, and banks from high-income member countries of the Organisation for Economic Co-operation and Development (OECD) were responsible for most of the ex-its from markets (Claessens and van Horen 2015). Greater South–South entry has also coincided with regionalization in the roster of foreign banks in many host countries (Claes-sens 2016). These trends could affect who gets credit. For example, a foreign bank pres-ence is more strongly linked to higher rates of business formation when those banks are headquartered in developing countries, al-though banks from developing countries are mainly able to spur business formation in in-dustries characterized by simpler production processes, where agency confl icts are lower (Alfaro, Beck, and Calomiris 2015). However, South–South banking may also bring addi-tional risks in terms of stability because the home economies of the new foreign banks are more likely to have weaker institutional envi-ronments and more lax regulations.
developed economies are especially dependent on strong legal frameworks to foster busi-ness formation (Alfaro, Beck, and Calomiris 2015). Further fi ndings indicate that the com-petitiveness of the domestic banking sector at the time of liberalization affects how domes-tic banks respond to the added competitive pressures imposed by foreign banks. Post-liberalization gains in the aggregate supply of credit, increases in growth, and declines in the volatility of growth are more likely to occur if countries have domestic banking sectors that are already relatively competitive (Behn and others 2014).
The impact of foreign banks on banking sector stability clearly depends on fi nancial conditions in the countries in which their par-ents are headquartered as well as the condi-tions in the banking sector of the countries that host them. International banks can offer the host economy a risk-sharing arrangement in which, on the one hand, they can help to stabilize credit fl ows during local crises, while on the other hand, they may more easily spread foreign shocks to the local economy (Chava and Purnanandam 2011; Morais and others forthcoming; Peek and Rosengren 1997, 2000; Schnabl 2012). Nevertheless, evi-dence suggests that the transmission of shocks varies substantially across foreign banks, and it is greatly infl uenced by conditions in the home and host countries, as well as the char-acteristics of the parent bank (Buch and Gold-berg 2015). In the wake of the global fi nancial crisis, the differing business strategies pursued by foreign banks implied that not all of them responded to fi nancial shocks in the same way. Even in emerging Europe, which was hard-hit by the crisis, a number of large foreign banks remained committed to their host countries, in effect treating them as a second home mar-ket (Bonin and Louie, forthcoming).
The impact of foreign banks largely de-pends, then, on the actions taken by the host country before and after fi nancial liberaliza-tion. On their own, foreign banks are no panacea for guaranteeing fi nancial develop-ment and stability. Host countries should, therefore, aim to create the conditions needed to reap the benefi ts of international banking. Regulators should adopt a strong fi nancial

GLOBAL FINANCIAL DEVELOPMENT REPORT 2017/2018 B R I C K - A N D - M O R T A R O P E R A T I O N S O F I N T E R N A T I O N A L B A N K S 43
to credit—but through the lens of the recent developments and trends just described. The chapter closes with a review of the most re-cent cross-border approaches to supervising and regulating international banks and a se-ries of recommendations for policy makers.
DETERMINANTS OF FOREIGN BANK ENTRY
By identifying the factors that drive foreign banks into a host economy, regulators can better assess ways to attract international banks. The banking sectors of many develop-ing countries and emerging economies have experienced a signifi cant increase in foreign bank entry since the 1990s (Cull and Mar-tínez Pería 2010). The experiences of fi nancial
Alternative delivery mechanisms are an-other aspect to monitor closely because they are reshaping who has access to banking services, and foreign banks are likely to play an important role in providing those ser-vices. In principle, digital fi nancial services, and in particular those provided via mobile telephony, hold the promise of deepening fi nancial inclusion to market segments that have been underserved (Ahmed and others 2015; Demirgüç-Kunt and Klapper 2012). But even though deeper fi nancial inclusion likely improves household welfare, it also exposes newly served households and fi rms to risks, mainly in the credit market, which could have implications for overall fi nancial stability.1 More broadly, fi nancial technol-ogy (fi ntech) is likely to affect the way banks compete with each other (and other non-bank providers of fi nancial services) for all market segments, which could again have implications for access, effi ciency, and fi nan-cial sector stability.
The greater regionalization in foreign bank presence and the increasing reliance on alternative delivery mechanisms for digi-tal banking services will pose challenges for bank regulation and supervision. Responsibil-ity for the supervision and resolution of the affi liates of international banks is a burden largely borne by the host countries. Greater regionalization in foreign bank participation could open the door to more effective coop-eration and information sharing between su-pervisors across host countries. But a general supervisory approach—as dictated by, for example, the Basel Committee on Banking Supervision—could be poorly suited to some countries, especially in light of the substantial increases in South–South foreign bank entry.2 The regulation of nonbank providers of digi-tal fi nancial services also remains an impor-tant challenge.
The remainder of this chapter is structured as follows. It begins with a discussion of the conditions and drivers that determine the en-try of foreign banks in an economy. It then discusses three standard aspects of the perfor-mance of foreign banks and their infl uence on host country banking sectors—competition and effi ciency, fi nancial volatility, and access
MAP 2.1 South–South Banking Subsidiary Networks, 2005 and 2014
a. 2005
b. 2014
Source: Visualization based on Bertay, Demirgüç-Kunt, and Huizinga 2017. Note: The maps show the location of foreign bank subsidiaries to and from developing countries. The connections refl ect majority ownership.

44 B R I C K - A N D - M O R T A R O P E R A T I O N S O F I N T E R N A T I O N A L B A N K S GLOBAL FINANCIAL DEVELOPMENT REPORT 2017/2018
International Diversifi cation
Benefi ts from prospective diversifi cation are also among the most important motivations for bank internationalization. The literature on portfolio optimization in an international setting dates back to the late 1960s, but only during the last decade have researchers begun looking at the benefi ts of international diver-sifi cation in banking. Hayden, Porath, and Westernhagen (2007) fi nd evidence that such diversifi cation tends to be associated with re-ductions in German banks’ returns, even after controlling for risk, whereas García-Herrero and Vázquez (2013) suggest that the risk re-turn gains from the foreign subsidiaries of international banks from eight high-income countries are potentially substantial and not entirely exploited. Buch, Driscoll, and Oster-gaard (2010) compute optimally diversifi ed international asset portfolios for banks us-ing the mean-variance portfolio model and compare them with the actual cross-border asset positions of banks to show that there are effective impediments to international diversifi cation.
Entry Barriers and Other Restrictions
Barriers and regulatory restrictions are impor-tant determinants of foreign bank entry. In the last few years, several studies have deepened understanding of how the entry decisions of banks may be motivated by cross-country dif-ferences in banking regulation. A few theo-retical papers in the 2000s tried to model the “race to the bottom” in the presence of regulatory arbitrage opportunities. Acharya (2003) shows, in a two-economy model of fi nancial integration, how more regulatory forbearance in one country induces banks to assume more risk abroad. This factor re-duces the competitive advantage of banks in countries with less forbearance, and, because it forces some banks to exit the market, the regulators of these countries adopt greater forbearance.4 The empirical evidence suggests that regulatory differences in both home and host countries infl uence cross-border bank mergers and acquisitions (M&As) and lead to
liberalization have differed greatly from coun-try to country, and they have increased under-standing of the factors that attract foreign banks to a host economy. Overall, foreign banks expand abroad to pursue profi table opportunities by either following their home customers or seeking new clients. Expand-ing abroad also allows them to diversify their business. However, the entry of foreign banks is greatly dependent on the information en-vironment of the host country. Thus, foreign banks fi nd it easier to operate in countries in which the proper mechanisms to reduce the information costs of doing business abroad are in place. Barriers to entry and restrictions on the operations of foreign banks also mat-ter. This section reviews these drivers in more detail.
Following Home Country Customers and Profi t Opportunities in Host Countries
Two of the main reasons that foreign banks expand abroad are to follow their interna-tional clients and to seek new profi t oppor-tunities in host countries. Studies from the 1990s found that foreign banks are more likely to enter host economies with higher for-eign direct investment (FDI) from or higher bilateral trade with their home country in relation to other countries, which is indi-rect evidence that banks follow home clients across borders.3 Using granular data, Seth, Nolle, and Mohanty (1998) document that a substantial fraction of the lending of foreign banks operating in the United States goes to clients from their home countries. Other stud-ies, however, also show that foreign banks are interested in expanding their business to new clients. Analyzing the international location choices of Japanese banks, Yamori (1998) confi rms that these banks have pursued lo-cal banking opportunities in host countries. Indeed, some cross-country studies have posi-tively related a host country’s economic activ-ity and fi nancial depth to higher foreign bank participation (Focarelli and Pozzolo 2000), suggesting that international banks look for profi table markets when making their inter-nationalization decisions.

GLOBAL FINANCIAL DEVELOPMENT REPORT 2017/2018 B R I C K - A N D - M O R T A R O P E R A T I O N S O F I N T E R N A T I O N A L B A N K S 45
abroad also fi nds evidence that regulation in the host country relative to the home country matters for location decisions. Using a bank-level data set of the most active American banks operating in 82 foreign countries from 2003 to 2013, Temesvary (2015b) shows that U.S. banks are more likely to open sub-sidiaries in host economies with laxer capital requirements and disclosure rules and where banking activities are less restricted than those in the United States. Similarly, the closure of U.S. banks abroad is more likely to occur if the host economy has stricter deposit insur-ance schemes and more restrictions on bank activities than those in the United States. As box 2.1 further discusses, the legal structure of foreign banks is also infl uenced by regulation.
a reallocation of international banks’ activi-ties. Karolyi and Taboada (2015) and Dong, Song, and Tao (2011) fi nd that cross-border acquisitions primarily involve acquirers from countries with more regulation, and that the takeover premium tends to increase for banks located in less regulated countries. Analyzing the European context, Carbo-Valverde, Kane, and Rodriguez-Fernandez (2012) fi nd evi-dence validating the hypothesis of a race-to-the-bottom form of arbitrage. However, in a similar context, Hagendorff and others (2012) fi nd contradictory results, in that less regula-tion in the host country does not mean that bidders are willing to pay a premium for less regulated regimes. A more recent study that analyzes the activities of U.S. banks operating
BOX 2.1 How Do Banks Expand Abroad? Branches or Subsidiaries?
In practice, there are two different ways in which international banks can expand abroad: as subsidiar-ies or as branches.
Branches are legally integrated with the par-ent bank. Capital requirements are generally waived because the parent bank remains responsible for the regulation and the liabilities of its operations in the host country. Deposits tend to be insured by the deposit insurance agency of the foreign bank’s home country. Subsidiaries entail setting up or acquiring a separate legal entity, and thus they tend to operate like independent foreign banks. They are capitalized sepa-rately, they are subject to host country regulation, their deposits can be insured by the host country’s deposit insurance agency, and they can even fail separately from their parent bank (Calzolari and Loranth 2011).a
In both scenarios, the host country authorities should exchange relevant information with the home country authorities because the banking group is reg-ulated and supervised on a consolidated basis. Fiech-ter and others (2011) point out that under the home–host supervisory accord of the Committee on Banking Supervision, the responsibilities of host countries are far greater for subsidiaries, whereas home countries have much greater control over branches.
Several factors, such as the levels of legal restric-tions on their operations as well as entry require-
ments and corporate taxes, are crucial in the choice of operation of cross-border banks. Based on their analysis of a database on the operations of cross-border banks in Latin America and Eastern Europe, Cerutti, Dell’Ariccia, and Martínez Pería (2007) pro-vide evidence of the importance of these elements. They fi nd that foreign banks are less likely to operate as branches in countries that limit fi nancial activities or when there are barriers to the entry of new banks. They are more likely to open branches in host coun-tries with high corporate tax rates or where foreign operations are smaller.
Many of the factors that affect entry decisions can be seen as forms of ex ante ring-fencing on the part of host countries. Ring-fencing refers to the geographical separation of part of a cross-border banking group from its parent institutions or other affi liates—an approach that aims to protect domestic fi nancial markets, but typically makes a host market less attractive to multinational banking groups.b Ex ante ring-fencing often takes the form of higher capi-tal or liquidity requirements, tighter dividend restric-tions, and limitations on liquidity fl ows.
More generally, although host country regulatory authorities may have strong incentives to impose ex post ring-fencing measures—for example, to preserve banking sector liquidity after the onset of a crisis—
(box continued next page)

46 B R I C K - A N D - M O R T A R O P E R A T I O N S O F I N T E R N A T I O N A L B A N K S GLOBAL FINANCIAL DEVELOPMENT REPORT 2017/2018
BOX 2.1 How Do Banks Expand Abroad? Branches or Subsidiaries? (continued)
these measures should be distinguished from the ex-ante measures that are likely to affect the mode of operation of cross-border banks and thus the struc-ture of the banking sector.
The factors that lead foreign banks to enter as either a branch or a subsidiary have implications for their subsequent performance and thus poten-tial implications for how they should be regulated and supervised. For example, Danisewicz, Rein-hardt, and Sowerbutts (2015) fi nd that following a tightening of capital requirements in the home countries of their parents, branches of international banks reduce the growth of their interbank lend-ing by 6 percent more relative to subsidiaries of the same banking group. This result suggests that when a branch operates within the capital require-ments of its parent, it cuts lending activities in the host country signifi cantly in response to an increase in the capital requirement in the home country of the parent bank. As a result, a policy change in the home country will affect the host country differ-ently, depending on the legal structure of the foreign operation.
Studies suggest that the mode of entry of foreign banks can also affect credit procyclicality. Alber-tazzi and Bottero (2014) analyze the contraction of credit of Italian banks during the collapse of Lehman Brothers, and fi nd that the difference in the contrac-tion of credit between foreign and domestic banks was mainly explained by the credit contraction of branches, rather than subsidiaries, of foreign banks.
However, the legal structure of foreign banks cannot by itself protect banks from systemic shocks. When the global financial crisis hit, contagion in some countries happened very quickly, no matter how the foreign operations were legally organized. Iceland, for example, had structured its foreign oper-ation using both subsidiaries and branches, and the detrimental impacts were similar, no matter how the activities of foreign banks in Iceland were organized. This experience provides potentially important les-sons for emerging market supervisors because it indi-cates that the fi nancial, operational, and reputational ties between home and host operations can over-ride legal and ownership structures in governing the responses of foreign banks to a crisis.
a. See Hoggarth, Hooley, and Korniyenko (2013) and Fiechter and others (2011) for detailed explanations.b. A report by the International Monetary Fund (IMF 2015a) emphasizes the perspective of the regulator rather than that of the banking group, defi ning ring-fencing as “measures imposed by prudential supervisors with the objective of protecting the domestic assets of a bank so they can be seized and liquidated under local law in case of failure of the whole or part of an international banking group.” See also D’Hulster and Ötker-Robe (2015) for a detailed explanation of ring-fencing.
More evidence is provided by research look-ing at how global banks tend to reallocate their activities between domestic and international locations when regulation tightens. According to Ongena, Popov, and Udell (2013), in Eu-rope foreign banks incur greater risk abroad when bank regulation and supervision in the home country tighten, suggesting that they try to compensate for a lower charter value or a restriction on certain risky activities at home. Aiyar, Calomiris, and Wieladek (2014) and Danisewicz, Reinhardt, and Sowerbutts (2015) obtain similar results in the context of the United Kingdom. Meanwhile, regulatory arbi-trage could conceivably be curbed by adopting
a level playing fi eld in international bank regu-lation (such as the Basel Accords). Morrison and White (2009) show theoretically, how-ever, that such efforts are not without cost; the better-regulated economy suffers in favor of the weaker one, but multinational bank-ing helps to reduce the damage. Nevertheless, harmonizing and enforcing effective regulation and supervision across countries with different incentives and degrees of fi nancial, legal, and economic development have proved to be ex-tremely diffi cult. This was particularly evident in the recent global fi nancial crisis.
Since the crisis, although entry has not generally been restricted, the activities of

GLOBAL FINANCIAL DEVELOPMENT REPORT 2017/2018 B R I C K - A N D - M O R T A R O P E R A T I O N S O F I N T E R N A T I O N A L B A N K S 47
is, whether banks have to be large to compete in international markets. They test their hy-pothesis using microdata within the universe of German banks and learn that only the larg-est and most productive banks have a com-mercial presence abroad. This fi nding con-fi rms the importance of scale in international operations. However, in contrast to the pre-dictions of recent trade models, the smallest banks also hold foreign assets, and some un-productive banks have an international pres-ence. Galema, Koetter, and Liesegang (2016) focus on relative cost advantages instead, and fi nd that less profi table, riskier, and larger banks are more likely to operate abroad.
Financial safety nets may also play a role in banks’ internationalization decisions because home country authorities may be less likely to intervene when the bank holds considerable international assets. Bank size in both absolute and systemic (relative to national economies) terms affects the market discipline applied to a bank. This market discipline, which can be defi ned as the response of depositors, or more broadly bank funding costs, to changes in bank risk, depends on the strength of the fi nancial safety net (that is, the capacity of national economies to bail out banks in trou-ble). Thus banks that are too large systemi-cally, especially in countries suffering public
foreign banks have been curtailed. As dis-cussed in more detail in the last section of this chapter, other, sometimes more informal measures have been adopted to limit the infl u-ence of cross-border fi nancing as a response to the fi nancial crisis. Common measures that countries have adopted are macropru-dential policies, countercyclical buffers, or even ring-fencing in an effort to constrain capital fl ows (box 2.2). Meanwhile, the regu-lation and supervision of global banks have become stricter and more intense. These in-creased restrictions may induce global banks to shift their activities to other countries (Ber-lin 2015) or to replace activities regulated at the host country level with those regulated at the home country level (Temesvary 2015a). In general, the arbitrage practices revealed in different studies highlight the challenges pre-sented by cross-country differences in bank-ing regulation and the need for international coordination to regulate and supervise the ac-tivities of international banks.
High fi xed costs may be a barrier to entry for some banks, depending on their size and productivity. Buch, Koch, and Koetter (2011, 2014) investigate theoretically and empirically whether the size pecking order documented for manufacturing fi rms in the international trade literature holds for global banks—that
BOX 2.2 Macroprudential Policies to Manage Credit Growth
Cerutti, Claessens, and Laeven (2015) examine the effect of macroprudential policies on credit growth in 119 countries from 2000 to 2013. They fi nd that emerging economies are more likely to adopt such policies than others. Although borrower-based macro prudential tools such as limits on loan-to-value and debt-to-income ratios are associated with slower credit growth in all countries, the relationship is stron-ger for developing countries. Similarly, institution-based tools such as dynamic provisioning, limits on leverage, and countercyclical capital requirements are negatively associated with credit growth in
developing economies. Finally, limits on foreign cur-rency lending are negatively related to credit growth in all countries, but especially in emerging markets and developing economies. The patterns suggest that macroprudential policies can help countries manage financial cycles, though the evidence also indicates that they are more effective in boom than bust phases. These policies are also associated with increased cross-border lending, suggesting that some lending that would otherwise occur in host countries is diverted to avoid them.

48 B R I C K - A N D - M O R T A R O P E R A T I O N S O F I N T E R N A T I O N A L B A N K S GLOBAL FINANCIAL DEVELOPMENT REPORT 2017/2018
defi cits, can be too big to save and therefore are subject to more intense market discipline (Demirgüç-Kunt and Huizinga 2013).
Financial safety nets, and more specifi -cally the incentive for national authorities to bail out a bank in trouble, can also be related to bank internationalization because cross-border resolution proved to be problematic during the recent crisis period. Beck and oth-ers (2013) develop a model that they then test in the data, highlighting the incentives that national authorities have to intervene in a troubled cross-border bank. Because in-tervention is costly and national supervisors are mainly interested in protecting domestic stakeholders, the incentives for intervention are stronger if the share of domestic assets and deposits is high. Likewise, if the share of domestic bank equity is high, the incentives to intervene will be low because the national authorities will align with the interests of domestic shareholders, who will prefer to let the bank continue operating and avoid the costs of bank failure. In line with the fi nan-cial safety net and distorted incentives of na-tional authorities’ arguments, Bertay, Demir-güç-Kunt, and Huizinga (2016) show that internationalizing banks face greater market
discipline via increased funding costs—a re-sult that is especially driven by banks in coun-tries with large public defi cits.
Conditions That Mitigate Asymmetries of Information
Geographical, cultural, and institutional dis-tances are important determinants of banks’ entry decisions because they affect informa-tion asymmetries. Buch (2003) reveals how information costs, proxied by geographical distance and cultural and legal system simi-larities, drive the international investment decisions of banks.5 Moreover, van Horen (2007) suggests that developing country for-eign banks are more likely than their devel-oped country counterparts to invest in small developing countries with weak institutions, suggesting a role for institutional proximity.6
These results may help shed light on the re-cent trends in international banking, where the entry of foreign banks from developing countries into other developing economies has been steadily increasing. One example, outlined in box 2.3, is Ecobank, an African bank that has expanded its operations across more than 30 countries in Africa.
BOX 2.3 Foreign Banks in Africa: The Case of Ecobank
The banking industry in Africa has traditionally been dominated by European banks because of its economic and legal legacies. Over the last decade, the rise of South–South banking has gained importance globally, and it has signifi cantly affected fi nance in Sub-Saharan Africa (Beck, Fuchs, and others 2014).
Compared with developing countries elsewhere, Sub-Saharan economies tend to be characterized by shallower and less effi cient fi nancial systems (Hono-han and Beck 2007) that offer relatively limited basic services (Beck and Cull 2013). Based on common fi nancial access and depth measures, access to tra-ditional banking services in West and East Africa is
among the lowest globally (Nyantakyi and Sy 2015). Meanwhile, the synergy of fi nancial liberalization and postcrisis retrenchment of European banks have induced the international expansion of Sub-Saharan banks within the region (Honohan and Beck 2007; Moyo and others 2014). Such developments have opened up possibilities for enhancing banking sector competition, deepening fi nancial systems, and wid-ening fi nancial access.
Ecobank Transnational Incorporated, or Ecobank, is an example of regionalization by an African bank during the last two decades, highlighting both the opportunities and risks related to South–South bank-
(box continued next page)

GLOBAL FINANCIAL DEVELOPMENT REPORT 2017/2018 B R I C K - A N D - M O R T A R O P E R A T I O N S O F I N T E R N A T I O N A L B A N K S 49
BOX 2.3 Foreign Banks in Africa: The Case of Ecobank (continued)
ing. Founded in 1985 when foreign- and state-owned entities controlled West African banking industries, Ecobank had by 1990 expanded to fi ve countries in West Africa from its home country of Togo; and by 2001 it had further extended its reach to 12 countries across Africa to become a regional bank. Tradition-ally serving wholesale customers, by around 2005 Ecobank had gradually transformed itself into a full-service, pan-African bank. A decade later, Ecobank is among the few multinational fi nancial institutions operating extensively beyond their home countries in Africa (Beck, Fuchs, and others 2014). With 1,239 banking offi ces in 33 countries across the continent (see fi gure B2.3.1), Ecobank has a footprint in Africa that surpasses that of any bank in the world.a
Since 2011, Ecobank has been rebalancing its presence in neighboring Nigeria (Nigeria is the home of Ecobank’s largest subsidiary, holding 40 percent of the group’s assets) in order to further grow into central, eastern, and southern Africa. The redistri-bution of its activities to different regions is aimed at obtaining more profitability and efficiency as well as reevaluating its business model. The group also has established representative offi ces in fi nan-
cial centers such as Paris, Beijing, Dubai, Johannes-burg, and London, thereby gaining access to global and regional fi nancial markets—a common move by internationalizing developing country banks.
Ecobank is particularly notable for the relatively small size of its domestic operations; 12 percent of its total revenue of $2.1 billion in 2015 originated in Togo. Furthermore, its share of Togolese assets fell from 16.5 percent in 2011 to 9.2 percent in 2015, sug-gesting signifi cant expansion into the wider African economy.
However, Ecobank’s achievements as a sizable regional bank in Africa have not been without chal-lenges. In 2013, the bank went through turmoil related to corporate governance issues, which also produced judiciary and political tensions among home and host countries. Given the complexity of international banks, this experience has highlighted the importance of strong legal institutions in empow-ering supervision and regulatory enforcement. Fur-thermore, it shows that the increasing geographical reach of international banks also warrants deepening cross-border information sharing and coordination mechanisms for banking supervision.
FIGURE B2.3.1 Distribution of Ecobank’s Branches and Offi ces (2015) and Assets (2011 and 2015)
Source: Ecobank 2017.Note: The geographical regions are classifi ed according to Ecobank: UEMOA (West African Economic and Monetary Union), Benin, Burkina Faso, Cabo Verde, Côte d’Ivoire, Guinea Bissau, Mali, Niger, Senegal, and Togo; AWA (Anglophone West Africa), The Gambia, Ghana, Guinea, Liberia, Sierra Leone; CESA (Central, Eastern, and Southern Africa), Burundi, Cameroon, the Central African Republic, Chad, Democratic Republic of Congo, Equatorial Guinea, Gabon, Kenya, Malawi, Mozambique, Republic of Congo, Rwanda, São Tomé and Príncipe, South Sudan, Tanzania, Uganda, Zambia, and Zimbabwe.
a. Ecobank relies extensively on a network of subsidiaries, as opposed to parent-reliant branches.
a. Branches and offices, 2015 b. Assets
512
292
150
2857.5 4.7 2.2 2.4
9.2 7.1 2.6 4.3 2.3
3.3
0 5 10 15 20 25 30
2015
2011
Assets (US$, billions)
Nigeria UEMOA AWA CESA ParentNigeria UEMOA AWA CESA

50 B R I C K - A N D - M O R T A R O P E R A T I O N S O F I N T E R N A T I O N A L B A N K S GLOBAL FINANCIAL DEVELOPMENT REPORT 2017/2018
in high-income countries fi nd that domestic banks are more effi cient than foreign banks (Berger and others 2000; Chang, Hasan, and Hunter 1998; DeYoung and Nolle 1996; Hasan and Hunter 1996; Miller and Parkhe 2002; Peek, Rosengren, and Kasirye 1999), studies focusing on developing countries fi nd the opposite pattern: foreign banks tend to be more effi cient than domestic banks in terms of cost and profi ts.7 Indeed, consistent with the evidence from country case studies, empirical work that exploits large panels of countries fi nds that, although in developed countries foreign banks tend to be less effi cient than do-mestic ones, in developing countries the pat-tern is reversed (Claessens, Demirgüç-Kunt, and Huizinga 2001; Demirgüç-Kunt and Huizinga 1999).
The performance of foreign banks in a host country depends on various factors, such as home country characteristics, geographic and cultural determinants, and market structure. In developing countries, foreign banks have lower overhead costs, higher interest margins, and higher profi tability, which may suggest that foreign banks, in general, bring better technologies to less developed banking sec-tors (Claessens, Demirgüç-Kunt and Huizinga 2001; Demirgüç-Kunt and Huizinga 1999; Micco, Panizza, and Yañez 2007). But foreign banks may not have that technological edge in more developed banking markets. More re-cently, Claessens and van Horen (2012) fi nd that foreign banks are relatively more profi t-able when coming from a high-income coun-try, when the competition in the local banking sector is limited, and when the foreign bank is larger. Foreign banks become more profi table over time, especially when the host economy shares similar geographical and cultural back-grounds with a bank’s home country.
In principle, the higher effi ciency of for-eign banks in developing countries can im-prove the performance of local banks and the degree of competition in the system. Foreign banks can improve the performance of domes-tic banks in several ways. For one thing, the increased competition from new foreign play-ers puts pressure on local banks to increase their effi ciency by, for example, reducing their
Recent studies have found that the location decisions of foreign banks are infl uenced not only by the bilateral distance between their home country and the host economy, but also by how close other competing foreign banks are to the host economy. The farther away its competitors, the more likely it is that a foreign bank will enter a host economy. Claessens and van Horen (2014a) introduce this concept as “competitor remoteness”—defi ned as the weighted average distance of all competing banks from a host country—to account for the fact that the closest country for a foreign bank might not be the most attractive one if the bank’s competitors are already closer to this country. Using bilateral data on 1,199 foreign banks from 75 home countries pres-ent in 110 host countries, the authors fi nd that closer distance and greater competitor re-moteness increase the likelihood that a foreign bank will enter a host country. The impact is stronger for home and host countries that are not members of the OECD, for banks from countries that have engaged relatively more in FDI, and for host countries in which foreign banks dominate. The richness of their data allows Claessens and van Horen (2015) to further examine some patterns related to the recent growth of South–South banking and the dynamics of foreign bank retrenchment after the global fi nancial crisis (see box 2.4).
IMPACTS OF FOREIGN BANK PARTICIPATION
Competition and Effi ciency
Evidence suggests that although foreign banks are less effi cient than domestic banks in high-income countries, they perform better than their domestic counterparts in developing countries. Foreign banks may bring superior technologies and processes to a host economy, but they face the extra cost of doing business abroad. Part of this cost may arise from oper-ating in a different environment in which for-eign banks may have to familiarize themselves with the institutional development, regulatory frameworks, fi nancial markets, or credit risk of the host economy. Whereas most studies

GLOBAL FINANCIAL DEVELOPMENT REPORT 2017/2018 B R I C K - A N D - M O R T A R O P E R A T I O N S O F I N T E R N A T I O N A L B A N K S 51
BOX 2.4 Dynamics of Postcrisis International Bank Retrenchment: From Globalization to Regionalization?
Nevertheless, the dynamics of entry and exit among foreign banks reveal some interesting trends (see fi gure B2.4.2). Greenfi eld entries have been simi-lar for high-income and developing country foreign banks (panel c), but closures have been mainly by the foreign banks of high-income countries (panel d). In terms of foreign acquisitions of domestic banks, in the precrisis period most domestic banks were acquired by banks from high-income countries. After the crisis, the number of foreign acquisitions dropped drastically (panel a), and of those acquisitions that did take place, most were by foreign banks from developing countries. In some regions, the retrench-ment of global banks has been accompanied by an expansion of regional players. As panel b shows, most ownership transferals of foreign banks have been from high-income foreign banks to banks from developing countries. All in all, even though the overall number of foreign banks has remained stable, signifi cant changes in the composition of banks have been observed in recent years.
(box continued next page)
Several major international banks headquartered in high-income member countries of the Organisa-tion for Economic Co-operation and Development, such as Deutsche Bank, recently announced plans to drastically reduce the number of countries in which they operate. The general view has been that fi nan-cial markets have been fragmenting since the global fi nancial crisis. However, as Claessens (2016) argues, fragmentation of the financial systems has been observed more in cross-border claims than in foreign bank presence.
A comparison over time of the number and size of subsidiaries of foreign banks reveals that retrench-ment has not been that severe. Even though the num-ber of foreign banks headquartered in high-income countries declined after the crisis (Claessens and van Horen 2015), in terms of their assets, foreign banks from high-income countries that continued to oper-ate abroad grew, widening the gap (in terms of assets) between them and foreign banks from developing countries (see fi gure B2.4.1).
FIGURE B2.4.1 Growth over Time of Foreign Banks by Number of Subsidiaries (2000–13) and Average Assets (2005–13)
Source: Analysis based on Claessens and van Horen’s Foreign Bank Ownership Database, matched with consolidated Bankscope statements (Claessens and van Horen 2015).Note: “High income” and “developing” categories correspond to banks headquartered in high-income and developing countries, as defi ned by the World Bank. The gray area indicates the global fi nancial crisis period.
a. Number of subsidiaries b. Average assets
0
100
200
300
400
500
600
700
No.
of s
ubsi
diar
ies
0
1
2
3
4
5
6
7
Aver
age
asse
ts (U
S$, t
rillio
ns)
High income Developing
2000
2001
2002
2003
2004
2005
2006
2007
2008
2009
2010
2011
2012
2013
2005
2006
2007
2008
2009
2010
2011
2012
2013

52 B R I C K - A N D - M O R T A R O P E R A T I O N S O F I N T E R N A T I O N A L B A N K S GLOBAL FINANCIAL DEVELOPMENT REPORT 2017/2018
2008). For another, through spillovers local banks can learn from foreign banks about new fi nancial services, better practices, or more so-phisticated techniques (such as risk manage-ment, personnel training, or data processing) that make them more effi cient, even without
costs and offering products of higher qual-ity. In particular, the greenfi eld entry of for-eign banks increases the number of banks in the host economy, induces more competition, and could lead to lower market concentration (Claeys and Hainz 2014; Lehner and Schnitzer
BOX 2.4 Dynamics of Postcrisis International Bank Retrenchment: From Globalization to Regionalization? (continued)
Source: Analysis is based on Claessens and van Horen’s Foreign Bank Ownership Database, matched with consolidated Bankscope statements (Claessens and van Horen 2015).Note: “High-income” and “developing” categories correspond to banks headquartered in high-income and developing countries, as defi ned by the World Bank. The gray area indicates the global fi nancial crisis period.
a. Foreign acquisitions of domestic banks
0
10
20
30
40
No.
of a
cqui
sitio
ns
High-income Developing
2000
2001
2002
2003
2004
2005
2006
2007
2008
2009
2010
2011
2012
2013
b. Ownership transferals of foreign banks
0
4
8
12
16
No.
of t
rans
fera
ls
High-income to developing Developing to high-income
2000
2001
2002
2003
2004
2005
2006
2007
2008
2009
2010
2011
2012
2013
0
5
10
15
20
25
No.
of c
losu
res
d. Foreign bank closures
High-income Developing
2000
2001
2002
2003
2004
2005
2006
2007
2008
2009
2010
2011
2012
2013
0
5
10
15
20
25
30
No.
of e
ntrie
s
c. Foreign greenfield entries
High-income Developing
2000
2001
2002
2003
2004
2005
2006
2007
2008
2009
2010
2011
2012
2013
FIGURE B2.4.2 Acquisitions, Transferals, Greenfi eld Entries, and Closures of Foreign Banks, 2000–13

GLOBAL FINANCIAL DEVELOPMENT REPORT 2017/2018 B R I C K - A N D - M O R T A R O P E R A T I O N S O F I N T E R N A T I O N A L B A N K S 53
particularly when more effi cient and less risky foreign banks enter markets with less concen-trated banking sectors.
Recent empirical studies have attempted to quantify the role of knowledge spillovers from foreign to domestic banks. Besides the direct impact of foreign banks on competition, a host economy might experience further gains as it opens up to foreign bank entry (Goldberg 2009). These gains can take the form of tech-nology transfers, institutional change, pro-ductivity enhancements, and wage spillovers from foreign banks. Such spillover effects are documented by Zhu (2012), who fi nds that the managerial performance of domestic banks in Eastern Europe and Latin America is positively linked to foreign bank presence. The gap in managerial effi ciency between for-eign and local banks not only narrows over time but also does so even when competition is low. Box 2.5 presents a case study of such
directly competing with their foreign peers (Lehner and Schnitzer 2008; Zhu 2012).
The empirical evidence mostly indicates that foreign bank participation is positively related to bank competition and effi ciency in host countries. Analyzing a panel of 80 coun-tries over time, Claessens, Demirgüç-Kunt, and Huizinga (2001) fi nd that in developing countries, a larger foreign ownership share of banks is associated with the lower profi t-ability and margins of local banks. The effects of foreign bank entry are apparent shortly upon entry, and they do not increase as for-eign banks gain market share. More recent cross-country studies confi rm a positive link between foreign bank entry and competition. Using bank-level data over time across 17 developing countries, Jeon, Olivero, and Wu (2011) demonstrate that when foreign bank penetration increases, competition in the banking sector of the host economy improves,
BOX 2.5 Improving Rural Finance in Albania through Knowledge Exchange
In Albania, as in many developing countries, the financing needs of households and firms in rural areas are largely met by cooperative fi nancial insti-tutions (CFIs). Although CFIs have an extensive information network in local areas, their governance and technological and institutional capacity tend to be weak, and their regulation is usually not well defi ned.
In 2014 the Albanian Savings and Credit Union (ASCU) approached the European Fund for South-east Europe (EFSE) and Rabobank, an international bank with vast experience in providing financial services to small and unbanked clients, for help in designing and implementing a structural reform that would allow it to professionalize and organize its operations on a par with commercial banks. The ASCU, a CFI that was established in 1992, provides microloans to over 30,000 rural families in Albania (Rabobank 2015). It has built a strong local presence and a healthy asset portfolio, but further growth has been hampered by a weak institutional capacity, a lack of information technology, and limited funding.
The reform was a collaborative effort among regulators, ASCU, and Rabobank, a large Dutch cooperative bank with subsidiaries in 23 develop-
ing countries. They targeted smallholders, small and medium-sized enterprises, and individuals who lacked access to banking services. Their strategy consisted of merging several small savings and credit associations (SCAs) into a one-tier operational struc-ture, with a multitier governance model that would provide the new institution with greater economies of scale in terms of products and services and would improve its access to fi nancial markets, yet with con-tinued bottom-up member involvement.
As part of the reform, the cooperative legal and judicial framework was amended to provide room for the sector to grow and consolidate under a stronger regulatory regime. A more inclusive deposit insur-ance agency was also designed in order to include financial cooperatives. As a result, by the end of 2015, 70 out of the 84 rural SCAs were merged into one large SCA, even before the new cooperative law was ratifi ed. It was a unique achievement because very few CFIs have leapt forward to welcome a one-tier operational structure. In February 2016, the new fi nancial institution, called FED, was licensed by the Bank of Albania. The EFSE and Rabobank will con-tinue to support FED for three years by providing technical assistance for the restructuring process.

54 B R I C K - A N D - M O R T A R O P E R A T I O N S O F I N T E R N A T I O N A L B A N K S GLOBAL FINANCIAL DEVELOPMENT REPORT 2017/2018
the other, shocks from abroad may be more easily imported. Studies of fi nancial stability fi nd that the degree of risk sharing is mixed because it depends on conditions in both the host and home countries. The impact of for-eign banks on the stability of host economies has been studied widely. Foreign banks have been found to adjust their lending when fi nan-cial or macroeconomic factors in the home or host country change, which may have am-biguous effects on the stability of the host economy. Foreign banks may enhance the sta-bility of a domestic banking system exposed to local shocks because they have access to liquidity and capital from their parent com-panies. In addition, because foreign banks are typically more diversifi ed than domestic ones, they should be less affected by local shocks. And yet foreign banks could also destabilize host economies by transmitting shocks from their home country or other countries where they operate.8 Destabilization of the domes-tic banking sector may also occur through competitive pressure if, for instance, foreign banks push local banks to riskier segments or even to exit the market. Alternatively, as box 2.6 discusses, foreign banks may hinder the stability of the domestic banking sector by in-creasing the foreign exchange risk of the host economy.
Countries with a higher foreign bank pres-ence appear to have fewer crises. Analysis of bank-level data across 80 developed and de-veloping countries suggests that greater for-eign bank participation is associated with a reduced probability of fi nancial crises in the host country (Demirgüç-Kunt, Levine, and Min 1998). Barth, Caprio, and Levine (2004) compare the performance and stability of the banking sectors in a sample of over 100 coun-tries with those countries’ regulatory and su-pervisory practices. They fi nd that countries that impose offi cial barriers to foreign bank entry tend to have more fragile banking sec-tors and, in particular, tend to have a higher likelihood of a major banking crisis.
Meanwhile, credit growth from foreign banks can be more resilient during local fi -nancial turmoil. Using bank-level data for over 300 foreign and domestic banks oper-ating in 10 Eastern European countries, De
knowledge transfers from the experience of a large Dutch bank operating in Albania.
Evidence suggests that the role that foreign banks play in a host economy is also deter-mined by the mode of entry. When foreign banks expand abroad, one decision they face is the mode of entry—that is, through green-fi eld investments or acquisition of existing banks. Some theories suggest that this deci-sion is largely infl uenced by the effi ciency of the entering bank in screening potential cli-ents. If the bank is ineffi cient (for example, if information about clients in the local market is nonexistent or too costly), then the bank may choose to enter through acquisitions and make use of the information already pos-sessed by the acquired bank. With increasing effi ciency, greenfi eld entry becomes more at-tractive for a foreign bank (Lehner 2009).
The type of entry will affect not only the number of competitors in the host economy but also the way in which information is dis-tributed among foreign and domestic banks, which in turn will infl uence the degree of competition in the domestic banking sector (Claeys and Hainz 2006). Empirical work has found that foreign bank entry via green-fi eld investments has a stronger positive effect on competition than entry via M&As—see Claeys and Hainz (2014) and Jeon, Olivero, and Wu (2011). Exploiting a large sample of countries over time, Delis, Kokas, and Ongena (2014) confi rm these results, but they also fi nd that as the share of foreign banks in a host economy increases, the market power of the average bank in the industry also rises. This occurs because the primary mode of en-try of foreign banks is through M&As. And yet, even though foreign banks are more ef-fi cient, that effi ciency does not translate into more competitive pricing. Meanwhile, even though greenfi eld investments are associated with higher levels of competition, they are not necessarily associated with greater access to fi nancial services.
Financial Stability
International banks play a risk-sharing role in the host economy in which, on the one hand, local shocks may be better diversifi ed, but, on

GLOBAL FINANCIAL DEVELOPMENT REPORT 2017/2018 B R I C K - A N D - M O R T A R O P E R A T I O N S O F I N T E R N A T I O N A L B A N K S 55
and van Lelyveld (2010) analyze data from multinational banking groups to examine the extent to which parent banks manage the credit growth of their subsidiaries abroad. Consistent with previous fi ndings, their evi-dence confi rms that when a host economy is hit by a banking crisis, parent banks can inject funds in their subsidiaries in order to main-tain their levels of credit supply.9 In line with this research, Cetorelli and Goldberg (2012b) show that internal capital markets are active in international banks and that parent sup-port makes foreign bank subsidiaries more re-silient than local banks. Finally, a recent study
Haas and van Lelyveld (2006) study the re-sponses of banks to changing business cycle conditions and to domestic fi nancial crises. Their fi ndings show that during fi nancial crises, domestic banks contract their credit and deposits, whereas foreign banks continue lending at the same level. Similar fi ndings are drawn from a study analyzing banks across 20 Asian and Latin American countries from 1989 to 2001 (Arena, Reinhart, and Vazquez 2007). The study documents that, compared with those of local banks, the lending and de-posit rates of foreign banks have a smoother pattern in times of fi nancial distress. De Haas
BOX 2.6 Foreign Exchange Risk: The Case of Latvia
In the absence of a well-developed local currency deposit base, most of the funding for international banks may be in a foreign currency, either from their parent entities, international capital markets, or international fi nancial institutions. Foreign exchange risks pose a problem when banks lend in a foreign currency to households and fi rms with incomes and assets denominated in the local currency. While bor-rowers may fi nd debt contracts in a foreign currency attractive due to lower interest rates, they are unable to protect themselves against future exchange rate fl uctuations. Concerns are even greater when longer- term loans, such as mortgages, are extended in a for-eign currency.
During the global fi nancial crisis, Latvia show-cased the negative consequences that foreign cur-rency lending can bring (IEG 2012). In 2008, Latvian subsidiaries of Nordic banks accounted for 60 per-cent of total banking sector assets. Their increased presence also brought a rise in the proportion of loans denominated in a foreign currency, which rose from 50 percent in 2001 to more than 85 percent in 2007 (Blanchard and others 2013). By 2007, the IMF warned that rapid growth in credit in foreign curren-cies was leading to large currency mismatches on the balance sheets of fi rms and households and a boom in housing prices (Cordero 2009).
According to Weisbrot and Ray (2010), one important driver of the fi nancial crisis in Latvia was
its pegged exchange rate. They argue that the fi xed exchange regime was widely believed to be perma-nent, encouraging borrowers and lenders to issue and obtain debt in euros, assuming no exchange rate risk. However, once the global recession hit and foreign banks began retrenching, exchange rate uncertainty substantially impacted the economy. The Latvian authorities decided to maintain the fixed exchange rate, and thus allow the adjustment in the real exchange rate to take place via declining prices and wages. Even though the nominal exchange rate was left untouched, increasing numbers of borrow-ers were not able to pay off their loans due to fall-ing incomes and unemployment.a In the third quarter of 2010, NPLs in Latvia were 19.4 percent of total loans (Škarica 2014).
Foreign exchange risk is not exclusively attached to foreign currency loans. Collecting deposits in a foreign currency may also distort local credit mar-kets, as funding in the local currency may drop. This was the case in Azerbaijan, where foreign banks received a high share of their deposits in a foreign currency. When the government banned foreign currency loans to unhedged borrowers, banks had to curb total lending because their local currency funds were insuffi cient to support it. Moreover, once devaluation hit, foreign currency deposits became extremely costly for foreign banks.
a. Beck, Jakubik, and Piloiu (2013) note that even though the foreign exchange rate was kept fi xed during the crisis, since interest rates had to increase to defend the fi xed exchange rate, higher lending rates were one of the factors that contributed to the large increase in NPLs among households and fi rms.

56 B R I C K - A N D - M O R T A R O P E R A T I O N S O F I N T E R N A T I O N A L B A N K S GLOBAL FINANCIAL DEVELOPMENT REPORT 2017/2018
throughout the crisis period. The more diver-sifi ed foreign banks continued lending and had substantially higher profi ts and fewer nonperforming loans than both local banks and foreign banks specializing in the region.
Evidence suggests that the stabilizing role of foreign banks is greatly dependent on the char-acteristics of their parent banks. Analyzing the lending patterns of a large sample of domestic and foreign banks, a report by the IMF fi nds that the lending behavior of foreign subsidiar-ies during fi nancial crises varies (IMF 2015c). Foreign subsidiaries of better-capitalized par-ent banks and parent banks with more stable funding sources tend to be more stable lend-ers. This heterogeneity across foreign banks may help explain why some studies see more nuanced results when analyzing the lending procyclicality of foreign banks. In some stud-ies, the lending from foreign banks is shown to be more procyclical than that of domestic banks. If lending from foreign banks accen-tuates the business cycles of host economies, then fi nancial instability can increase. In good times, lending from foreign banks may fuel lending booms, possibly associated with the lower lending standards of banks (Dell’Ariccia and Marquez (2006b); and in bad times, it may worsen the credit crunch.11 Albertazzi and Bottero (2014) fi nd the latter for Italy af-ter the collapse of Lehman Brothers. Notably, their results are driven by foreign banks with a lower local presence, proxied by loans over lo-cal deposit funding. Box 2.7 describes further empirical evidence of a higher lending cyclical-ity for foreign banks.
As South–South banking and bank region-alization expand, the stabilizing role of foreign banks may change. On the one hand, closer geographical proximity to the host country could limit the potential of foreign banks to diversify shocks because shocks are more likely to be correlated between host and home countries. On the other hand, greater prox-imity (physical, institutional, or cultural) may facilitate communication and coordination between host and home country authorities. Moreover, differences in the funding sources of the new generation of foreign banks (such
by Demirgüç-Kunt and others (2017) reveals how a greater foreign bank presence in an in-ternational sample of countries makes cross-border lending (through syndicated loans) more stable and less destabilizing in response to international monetary policy shocks.10 The study also illustrates the interaction be-tween brick-and-mortar activities—the focus of this chapter—and cross-border lending, which is examined in chapter 3.
The stabilizing role of foreign banks dur-ing local fi nancial crises is further confi rmed in several studies at the country level. Only a few studies at the country level have exam-ined the role of foreign bank participation during periods of fi nancial crisis. Overall, the fi ndings from these studies support the previ-ously discussed cross-country results; foreign banks appear to have a stabilizing effect in times of fi nancial distress. Goldberg, Dages, and Kinney (2000) analyze the experiences of Argentina and Mexico in the 1990s by exam-ining bank-level quarterly loan data for each country. Their fi ndings reveal that in both countries, foreign banks were more stable lenders than local banks. The authors argue that having diverse ownership in the banking system is important because it, in turn, di-versifi es the sources of foreign funding in the banking system. Crystal, Dages, and Gold-berg (2001, 2002) also analyze Latin Ameri-can foreign and local banks in the late 1990s, which was a period characterized by both the large entry of foreign banks in the region and signifi cant macroeconomic stress. They fi nd that throughout this period, foreign banks had consistently stronger credit growth, were more aggressive in addressing asset quality deterioration, and were better able to absorb losses. More nuanced evidence from Malaysia highlights the importance of diversifi cation among foreign banks. Detragiache and Gupta (2006) compare the performance of local and foreign banks in Malaysia during the Asian crisis of the late 1990s, distinguishing foreign banks that specialize in Asia from those that have more diversifi ed operations outside Asia. The study fi nds that diversifi ed foreign banks were crucial in helping the banking system

GLOBAL FINANCIAL DEVELOPMENT REPORT 2017/2018 B R I C K - A N D - M O R T A R O P E R A T I O N S O F I N T E R N A T I O N A L B A N K S 57
BOX 2.7 The Lending Cyclicality of Foreign Banks
Bertay, Demirgüç-Kunt, and Huizinga (2015) com-pare cyclicality in lending across different types of banks (private versus state-owned, and domestic ver-sus foreign-owned) for a yearly panel spanning 1999 to 2010 and consisting of 1,633 banks from 111 countries.
In their sample, 52.8 percent of bank-year obser-vations correspond to private domestic banks, fol-lowed by 35.8 percent to private foreign banks and 11.4 percent to state-owned banks. To examine cycli-cality in lending, they analyze how the credit growth of the different types of banks in a given period is associated with the growth rate of the gross domestic product (GDP) per capita (as a measure of the busi-ness cycle).
Their results confi rm that, although lending from state banks is essentially insensitive to GDP per cap-ita growth, lending from private banks increases as GDP rises, and it increases even more strongly for foreign banks. Specifi cally, a 1 percent increase in GDP per capita growth leads to credit growth of 1.0–1.1 percent for private domestic banks and 2.1 percent for private foreign banks.
Overall, the authors fi nd evidence that the lending of foreign banks is more sensitive to macro develop-ments in the host country (and thus more procyclical) than that of their domestic counterparts (see fi gure B2.7.1), which may have consequences for fi nancial stability. One explanation may be that, with funding from their international parents, foreign banks are more likely to take advantage of local lending oppor-tunities during economic booms. The authors are not able to identify the parents of the foreign banks they study, and thus are unable to test this conjecture directly.
However, evidence from other sources indicates the substantial heterogeneity in the cyclicality of lending among foreign banks. For example, Cull and Martínez Pería (2013) fi nd that foreign banks in Eastern Europe were better able to maintain credit growth during the global fi nancial crisis if their par-ents were profi table and liquid (although the same patterns did not hold in Latin America, where the solvency of the subsidiaries themselves proved more important). Bonin and Louie (forthcoming) fi nd simi-
lar lending behavior during the crisis among domes-tic banks and the six multinational European banks (the “Big Six”) that were operating in Bulgaria, Croa-tia, the Czech Republic, Hungary, Poland, Romania, the Slovak Republic, and Slovenia. By contrast, the lending of other foreign banks operating in these countries was much more procyclical than that of domestic banks. These authors speculate that the Big Six treated these countries as something akin to a second home market.
As noted, during many of the crisis episodes in the banking sectors of developing countries, foreign banks were better able to maintain lending than domestic banks. A report by the IMF (2015a) provides bank-level evidence across countries that foreign-owned subsidiaries, and in particular those with well-capitalized parent banks, lend less procyclically than domestic banks during domestic crises.
FIGURE B2.7.1 Change in Bank Lending Associatedwith a 1 Percent Increase in GDP per Capita, 1999–2010
Source: Recalculated from Bertay, Demirgüç-Kunt, and Huizinga 2015.Note: The fi gure shows the marginal effects of a regression of bank lending on GDP per capita growth and other control variables, estimated using a sample of 1,633 banks from 111 countries. Developed economies are defi ned as high-income countries based on the World Bank classifi cation, and the rest of the countries are defi ned as developing economies. ** and *** indicate statistical signifi cance at the 5 and 1 percent levels.
2.0*** 2.0***2.1***
0.9**
0.6
1.3***
0
0.5
1.0
1.5
2.0
2.5
Full sample High-incomecountries
Developingcountries
Perc
ent
Foreign banks Domestic banks

58 B R I C K - A N D - M O R T A R O P E R A T I O N S O F I N T E R N A T I O N A L B A N K S GLOBAL FINANCIAL DEVELOPMENT REPORT 2017/2018
of credit in the United States that was in-dependent of the demand for credit in the United States. The authors found that Japa-nese banks operating in the United States sig-nifi cantly reduced their supply of credit as a result of the collapse of stock prices. Using a similar event, Chava and Purnanandam (2011) and Schnabl (2012) examine how the 1998 Russian crisis was transmitted via for-eign banks to borrowers in the United States and Peru, respectively.
There is growing evidence for the trans-mission of foreign monetary policies to host economies via foreign banks. In recent years, policy makers and scholars have been con-cerned that the foreign monetary policy of developed countries may have substantial spillovers into the credit cycles and fi nancial stability of developing countries (Fischer and others 2014; Rajan 2014; Rey 2015). A recent study of Mexico by Morais and others (forth-coming) uncovered rigorous evidence that foreign banks transmit the monetary policy of their home countries through the lending of their subsidiaries in host economies. The
as local deposits versus equity, and short-term funding versus long-term funding) may also infl uence the stability of their credit behavior. As fi gure 2.1 shows, South–South subsidiar-ies are increasingly being funded by local de-posits, which during the global fi nancial crisis proved to be a more stable source of funding, enabling foreign banks to better smooth their lending throughout the crisis. During that pe-riod, local deposits accounted for 57 percent of funding for South–South subsidiaries and 47 percent for North–South subsidiaries.
Although foreign banks can attenuate lo-cal shocks in a host country, they also can spread shocks from one country to another. The literature also suggests that, as with any other risk-sharing scheme, foreign banks can pass external shocks to the host economy. Among the fi rst studies to employ a rigorous methodology to causally identify that shocks can be transmitted across countries via for-eign banks was that by Peek and Rosengren (1997, 2000). This study exploited the col-lapse in Japanese stock prices in the late 1980s as an exogenous shock to the supply
FIGURE 2.1 Contribution of Local Deposits, Equity, and Short-Term and Long-Term Funding to Total Bank Funding, 2000–14
Source: Bertay, Demirgüç-Kunt, and Huizinga 2017.
0
10
20
30
40
50
60
70
80
Perc
ent
90
100a. Customer deposits by North–South subsidiaries b. Customer deposits by South–South subsidiaries
2000 2002 2004 2006 2008 2010 2012 2014
OtherLong-term fundingMoney market and short-term fundingEquityCustomer deposits
0
10
20
30
40
50
60
70
80
Perc
ent
90
100
2000 2002 2004 2006 2008 2010 2012 2014

GLOBAL FINANCIAL DEVELOPMENT REPORT 2017/2018 B R I C K - A N D - M O R T A R O P E R A T I O N S O F I N T E R N A T I O N A L B A N K S 59
Since the global fi nancial crisis, a large number of studies have examined in greater depth the ways in which foreign banks con-tribute to cross-border contagion. The vast majority of studies use microdata to disen-tangle the effects of supply and demand. The evidence is consistent with the fact that during the crisis, foreign banks contracted their lending earlier and faster than domestic banks. Aiyar (2012) fi nds that in the United
authors found that the credit supply of foreign banks increases when the monetary policy of their home country softens. The future de-faults on these loans also increase, suggesting that foreign banks may be engaging in more risk taking abroad when their home country policy rates are low. Box 2.8 presents a more detailed discussion of this study, and chapter 3 discusses the international transmission of foreign monetary policies at greater length.
BOX 2.8 The Transmission of International Monetary Policy via Foreign Banks in Mexico
Morais and others (forthcoming) analyze the impact that foreign monetary policy, transmitted via banks’ lending channels, has on Mexican firms. Over a 10-year period, using the universe of new and out-standing commercial bank loans, they examine monetary policy shocks in the form of interest rates and nonstandard quantitative easing (QE) transmit-ted from three regions: the United States, the United Kingdom, and the euro area. The main foreign banks operating in Mexico have their headquarters in these regions.
One of the main challenges in identifying the impact that foreign monetary policy has on the sup-ply of credit is that both the supply and demand for credit may change in response to a monetary policy shock. Morais and colleagues overcome this chal-lenge in two ways. First, they compare loans offered in the same period to the same fi rm by different for-eign banks exposed to different monetary policies, thereby allowing them to hold the demand for credit constant. Second, because only 21 percent of all fi rms borrow from multiple banks in the same period, they also compare loans offered by different foreign banks in the same period with fi rms from the same state and industry—an alternative way to hold the demand for credit constant.
To identify whether the transmission of foreign monetary policy through bank credit leads to real effects on fi rms, they examine the dynamics of fi rms’ assets, employment, and total credit from any source. Analyzing these variables is important because fi rms may switch from foreign bank credit to credit from other banks or other sources when their credit condi-
tions change. In other words, fi rms could neutralize international shocks by replacing bank credit from foreign banks with other sources of fi nance. If fi rms fi nd it costly to change banks and thus cannot pro-tect themselves from the shocks transmitted by their banks, foreign monetary policy shocks could have real effects on the performance and operations of fi rms.
The study results indicate that a softening of for-eign monetary policy increases the supply of credit that foreign banks extend to Mexican fi rms. Con-sistent with the evidence on the transmission of monetary policy from home to host countries, each type of regional policy shock affects supply via each region’s foreign banks. For example, U.S., U.K., and euro area monetary policies affect the credit supply to Mexican fi rms via those regions’ banks in Mexico. All loan terms are affected (loan volume, maturity, loan interest rate, and collateral rate), but the effects are substantially weaker for loan rates. Moreover, the international monetary policy channel implies strong real effects, with substantially stronger elas-ticities from monetary rates than from QE.
A decline in foreign monetary policy rates and an expansion of QE lead to a higher credit supply for borrowers with higher ex ante loan rates (consistent with a reach-for-yield) and substantially higher ex post loan defaults, which suggests that foreign banks increase their risk taking when their country’s mone-tary policy softens. Furthermore, foreign QE is found to bring about greater risk taking in emerging mar-kets through an expansion of credit to riskier fi rms rather than improving the real outcomes of fi rms in those markets.

60 B R I C K - A N D - M O R T A R O P E R A T I O N S O F I N T E R N A T I O N A L B A N K S GLOBAL FINANCIAL DEVELOPMENT REPORT 2017/2018
market and show that greater exposure to banks in crisis-affected countries reduces prof-itability and the supply of new credit (Hale, Kapan, and Minoiu 2016).
There are, however, ways to reduce the international transmission of shocks from home to host countries. By analyzing the Vi-enna Initiative, in which some parent banks committed to supporting their subsidiar-ies in emerging Europe, De Haas and others (2015) show that cross-border coordination efforts can reduce cross-border transmission and make foreign subsidiaries relatively stable lenders without imposing negative externali-ties on the other countries in the region. Since the global fi nancial crisis, other initiatives, such as alternative cross-border resolution schemes, have been put in place with the ob-jective of reducing the cost of future fi nancial crises. A comprehensive review of the differ-ent approaches that have been followed for the regulation, supervision, and resolution of global banks is presented later in this chapter.
Foreign banks may also transmit shocks from their host countries to their home coun-tries, hindering the home countries’ stability (Cetorelli and Goldberg 2012b). Buch and others (2012) look at the impact of the in-ternationalization of German banks on the structure and risk taking of Germany’s bank-ing sector. They fi nd that bank international-ization is weakly related to bank risk. Some recent studies, however, imply that bank in-ternationalization leads to higher bank risk for the (internationalizing) parent bank—see Berger and others (2016) focusing on U.S. banks and Gulamhussen, Pinheiro, and Poz-zolo (2014) for an international sample of banks. Nevertheless, evidence from the recent fi nancial crisis suggests that the parent banks, especially those with liquid foreign subsidiar-ies, were better able than their domestic coun-terparts to protect their home country opera-tions (De Haas and van Lelyveld 2014).
Foreign banks may also experience sys-temic risk consequences because of their size and complexity. The associations be-tween bank size and bank performance and activity mix and funding strategy have been
Kingdom, the shock to external bank fund-ing caused by the crisis led to a substantial re-duction in banks’ credit supply, driven mainly by branches of foreign banks. In the Russian Federation, foreign banks reduced their lend-ing more than other banks (Fungáčová, Her-rala, and Weill 2013).12 One conclusion from a review of the literature is that the responses of foreign banks to shocks vary substantially, depending on country and bank-level charac-teristics. The evidence suggests that the trans-mission of shocks is stronger when regulation is lax in the home country (Bertay 2014) or in host countries (Anginer, Cerutti, and Mar-tínez Pería 2017). The transmission of shocks also appears to be stronger among host coun-tries that are more fi nancially open and that have more competitive banking sectors (Jeon, Olivero, and Wu 2013). As for bank-level characteristics, the transmission of shocks is stronger for foreign banks that have lower levels of capital, are less profi table, and are more dependent on their parent banks (Ang-iner, Cerutti, and Martínez Pería 2017; Choi, Gutierrez, and Martínez Pería 2014; De Haas and van Lelyveld 2014; De Haas and others 2015; Jeon, Olivero, and Wu 2013; Popov and Udell 2012). In addition, the transmission of shocks is stronger if foreign banks entered host markets via greenfi eld investment rather than M&As (Jeon, Olivero, and Wu 2013).
Recent studies have furthered understand-ing of how foreign banks can lead to cross-border contagion. Cetorelli and Goldberg (2012a, 2012b, 2012c) and Jeon, Olivero, and Wu (2013) reveal the existence of an active cross-border internal capital market whereby global banks reallocate funds across their branches and subsidiaries to buffer shocks to the parent bank’s balance sheet. These studies show how a monetary policy shock in the home country can spill over to other countries through a reduction in lending by global banks’ subsidiaries. Global banks also contribute to the transmission of shocks via interbank lending. The authors of a recent study construct a network of direct and indi-rect bilateral exposures using detailed data on loan transactions in the syndicated interbank

GLOBAL FINANCIAL DEVELOPMENT REPORT 2017/2018 B R I C K - A N D - M O R T A R O P E R A T I O N S O F I N T E R N A T I O N A L B A N K S 61
Access to Credit
The impact that foreign bank participation can have on overall access to credit is greatly dependent on host country factors. On the one hand, the advantages that foreign banks could bring to a host economy, such as supe-rior technology, better supervision practices, or achievement of larger economies of scale, may allow these banks to overcome the costs of doing business abroad, and they may ma-terialize in more widespread access to credit. In principle, these advantages could give foreign banks an edge with segments of the population that are underserved by domestic banks. On the other hand, the cost of acquir-ing information about new clients may be too high for foreign banks, forcing them to lend exclusively to the largest, safest fi rms. Access to credit may be hindered if foreign banks not only limit their lending to the largest custom-ers but also, by their entry, force domestic banks out of the market. Aggregate credit in the host country may then contract, particu-larly among the smaller and more informa-tionally opaque clients that previously were dependent on credit from domestic banks. Detragiache, Tressel, and Gulpta (2008) and Gormley (2014) develop theoretical frame-works to illustrate that only under certain conditions does the entry of foreign banks increase access to credit. One implication of these models is that foreign banks are more likely to have a negative effect on credit access in host economies where obtaining informa-tion is costly (Gormley 2014).
Consistent with theory, empirical research reveals a negative association between for-eign bank entry and access to credit in host countries with less competitive banking sec-tors or weak institutional and legal environ-ments.13 Behn and others (2014) analyze a sample of 26 developing countries around the time of bank liberalization and fi nd that in countries with more competitive local banks, foreign bank entry resulted in a greater sup-ply of credit. By contrast, host countries with less competitive banking sectors experienced a reduction in aggregate lending, whereby
documented for an international sample of banks by Bertay, Demirgüç-Kunt, and Huiz-inga (2013), who differentiate between ab-solute and relative (to national economies) size. They fi nd that bank returns increase with absolute bank size but decrease with systemic size (proxied by bank size with re-spect to national GDP), and that returns are uncorrelated with bank risk measured by the Z-score. Focusing on bank holding compa-nies in the United States, Hughes and Mester (2013) provide evidence of economies of scale for both small and large banks, and they ar-gue that those economies are not driven by too-big-to-fail subsidies. Nevertheless, banks, especially in advanced economies, suffered very large losses during the crisis, and regula-tors have taken steps to end the too-big-to-fail problem. Indeed, recent regulatory changes may have important implications for bank internationalization because larger banks are increasingly tending to become international. Large, internationally active banks that face regulatory scrutiny of their risk capital alloca-tion in both home and host countries may de-cide to reduce their international operations (as discussed in box 3.5 in chapter 3 or, as observed anecdotally, from Deutsche Bank’s exit from many markets).
One other crucial dimension of large banks is their complexity. Cetorelli and Goldberg (2014) propose measures to cap-ture two aspects of the complexity of global banks: “organization” complexity, account-ing for the number and geographic spread of an institution’s affi liates; and “business” complexity, capturing the type and variety of activities of an institution. These measures reveal a substantial degree of diversity in complexity within the universe of U.S. banks and prompt a call for further research on the positive and negative externalities generated by complexity. In a recent study, Carmassi and Herring (2015) analyze the corporate complexity of global systematically impor-tant banks (G-SIBs), fi nding a signifi cant increase in complexity (proxied by the num-ber of majority-owned subsidiaries) through 2011.

62 B R I C K - A N D - M O R T A R O P E R A T I O N S O F I N T E R N A T I O N A L B A N K S GLOBAL FINANCIAL DEVELOPMENT REPORT 2017/2018
lead to an overall increase in credit supply in the host economy. Several studies provide evidence in favor of this mechanism. Clarke, Cull, and Martínez Pería (2006), analyzing a sample of fi rms from developing and transi-tion countries, reveal that foreign bank par-ticipation is associated with better fi nancing conditions for all fi rms, even though the fi rms that benefi t most are the largest ones. Similar evidence from Eastern Europe also indicates that, even though foreign banks target larger fi rms, access to credit for small and medium-sized enterprises (SMEs) is not reduced by the presence of foreign banks (De Haas, Ferreira, and Taci 2010; Giannettia and Ongena 2012).
Alternatively, foreign banks may adopt new lending technologies to expand their business to SMEs. Even though relationship lending is challenging and costly for foreign banks, these banks have found alternative technologies that rely on hard information and allow them to lend to more opaque fi rms (Berger and Udell 2006). In this way, even when customers do not have formal fi nan-cial statements, they may have other types of hard information that allow banks to cal-culate their repayment probability. Some of the technologies targeted to more informa-tionally opaque customers are credit scoring, asset-based lending, factoring, leasing, and fi xed-asset lending. Public policies aimed at improving the informational, legal, and regu-latory environments in which fi nancial insti-tutions operate could make it possible to use these technologies, and thus, affect access to credit for more informationally opaque cus-tomers. Box 2.9 provides more detail on these alternative lending technologies and foreign banks’ approach to SME lending.
Foreign banks can also affect governments’ access to fi nance. Home bias in sovereign debt involving domestic banks is well-documented (Hesse, Bakhache, and Asonuma 2015; Hor-váth, Huizinga, and Ioannidou 2015). Some-times called the “doom loop,” home bias is a problem because it ties a government’s de-fault to banks’ defaults (Reuters 2013).17 One possible explanation for this home bias in sovereign debt is moral suasion by the government toward domestic banks. Indeed,
foreign lending mostly crowded out lending from domestic banks. Similarly, exploiting India’s commitment to the World Trade Or-ganization (WTO) to allow a greater foreign bank presence during the 1990s, Gormley (2010) presents further evidence of a negative effect of foreign banks on access to credit in the country.14 In a sample of 137 countries over 1995–2009, Claessens and van Horen (2014b) fi nd a negative correlation between the presence of foreign banks and the ratio of private credit to GDP in low-income coun-tries, in countries where contract enforcement is costlier and access to credit information is limited, in countries where the share of for-eign banks is smaller, and in countries where parent banks are located far away.15 These fi ndings are consistent with the theoretical implications that highlight the importance of the information environment (as modeled in Dell’Ariccia and Marquez 2004) and con-tract enforcement in reaping the benefi ts of increased access to credit from foreign banks.
In countries with a more competitive bank-ing sector, one way in which foreign banks can expand overall access to credit is by pushing domestic banks to lend to smaller clients. Even though foreign banks may have more funding sources or better screening technologies than domestic banks, local banks have better infor-mation about the quality of local borrowers, and in particular about the more information-ally opaque ones, which gives them a com-parative advantage in serving these segments (Dell’Ariccia and Marquez 2004). By offering more competitive services, foreign banks may attract the best clients in the host economy, pushing domestic banks to improve their ser-vices to prevent good clients from switching banks. Alternatively, domestic banks may also be pushed to expand their operations to SMEs and other previously underserved cli-ents. Several studies from different regions have corroborated that foreign banks lend in general to the largest and safest borrowers.16 Thus for those domestic banks trying to com-pete with foreign banks for the large, more informationally transparent fi rms, it may be preferable to expand their business to smaller, more opaque customers. This, in turn, may

GLOBAL FINANCIAL DEVELOPMENT REPORT 2017/2018 B R I C K - A N D - M O R T A R O P E R A T I O N S O F I N T E R N A T I O N A L B A N K S 63
data security, risk management, mobile bank-ing, and alternative currencies. In principle, digital fi nancial services, especially those pro-vided via mobile telephony, hold the promise of deepening fi nancial inclusion to market seg-ments that have been underserved (Ahmed and others 2015). Fintech is likely to facilitate the provision of fi nancial services and affect the ways in which banks compete with each other (and with other nonbank providers of fi nancial services) for all market segments and across geographical boundaries, which could have broader implications for access, effi ciency, and fi nancial sector stability (see a more in-depth discussion of fi ntech in chapter 3).
Ongena, Popov, and van Horen (2016) show that during the European sovereign debt crisis of 2010–12, domestic banks were more likely to increase sovereign debt holdings than for-eign banks when governments had to roll over large amounts of debt. This fi nding suggests a role for foreign banks in breaking the harmful sovereign bank loop.
On the technology side, today fi ntech is re-shaping who has access to banking services, and foreign banks are likely to play an impor-tant role in this process. Initially, fi ntech helped fi nancial institutions to speed up transactions at a lower cost, whereas the most recent tech-nologies include a variety of services such as
BOX 2.9 Lending Technologies of Foreign Banks and Their Approach to SME Lending
Typically, studies comparing foreign banks with domestic banks point to the screening technologies used to assess credit risk as one of their main dif-ferences. Because local banks have better informa-tion on domestic customers, they can rely on soft information to evaluate these customers’ creditwor-thiness. In the absence of soft information, foreign banks need to rely more on the hard information offered by credit bureaus and found in collateral reg-istries and audited balance sheets and income state-ments (Cull, Martínez Pería, and Verrier 2017).
Indeed, large fi nancial institutions and foreign banks have developed and implemented innovative business strategies and technologies that, by relying on hard information, facilitate arm’s-length lend-ing to more informationally opaque fi rms (Berger and Udell 2006; De la Torre, Martínez Pería, and Schmukler 2010). These strategies and technolo-gies include credit scoring, in which banks use hard information from credit registries or bureaus to determine the likelihood of loan repayment; asset-based lending, which relies on assets pledged as col-lateral; factoring, in which banks purchase a fi rm’s accounts receivable at a discount; and leasing/fi xed-asset lending, in which banks rely on valuations of a fi rm’s fi xed assets that are either owned by the fi rm (in the case of leasing) or pledged as collateral (in the case of fi xed-asset lending). This effort of for-eign banks to develop and implement new screening and lending technologies is consistent with evidence
from Clarke and others (2005), who fi nd that large foreign banks in four Latin American countries lend as actively to small and medium-sized enter-prises (SMEs) as large domestic banks. Similarly, Beck, Ioannidou, and Schäfer (2012) use detailed credit registry data on the terms and pricing of loans to show that foreign banks in Bolivia are able to serve the same clientele as domestic banks by requiring collateral, imposing shorter maturities on loans, and basing their pricing on credit ratings and collateral pledges.
De la Torre, Martínez Pería, and Schmukler (2010) surveyed 48 banks across 12 countries to document to what extent banks are engaged in SME lending. Their findings suggest that most banks, including large and foreign ones, are not only inter-ested in the SME segment but also fi nd it profi table. Banks rely on various transactional technologies to screen the creditworthiness of their SME customers. Large international banks have several comparative advantages in dealing with the SME segment, such as economies of scale or superior business models and risk management systems. The authors argue that the ability of foreign banks to serve many SMEs in different countries using superior business and risk management technologies gives them a competitive edge over other banks because they can compensate more easily for the costs of developing new products geared toward SMEs while exploiting larger econo-mies of scale and scope.

64 B R I C K - A N D - M O R T A R O P E R A T I O N S O F I N T E R N A T I O N A L B A N K S GLOBAL FINANCIAL DEVELOPMENT REPORT 2017/2018
Meanwhile, the ratio of debt to liabilities (measured by local deposits to total liabilities) has remained higher for foreign banks from developing countries over the past decade (panel c). And whereas before the crisis, for-eign banks from emerging economies earned a higher share of income from interest than foreign banks from developed countries, this pattern reversed starting in 2007 (panel d).As for the health of their portfolios, although the nonperforming loan (NPL) ratio of foreign banks from developing countries improved over time, during the crisis years NPLs in-creased substantially for all banks, particu-larly for foreign banks from developing coun-tries. Interestingly, in recent years the NPLs of foreign banks from developing countries have declined, even to levels lower than those of banks from high-income countries (panel e).By contrast, the Z-scores of foreign banks from high-income countries have been catch-ing up to the levels of developing country for-eign banks (panel f).
The recent trends in South–South bank-ing will likely infl uence who gets credit. Since the global fi nancial crisis, the composition of foreign banks has changed substantially. Whereas banks from developing economies have been increasing their presence abroad, most of the exits from markets have been by banks from OECD countries. These trends may have an impact on who gets credit; relative to a “North–South” foreign bank, a “South–South” foreign bank may be more fa-miliar with the cultural, legal, political, and economic environments of the host country and thus may be better suited to overcome the common challenges that foreign banks face when lending to smaller and more infor-mationally opaque segments (Mian 2006). A recent cross-country study using fi rm-level data fi nds that a foreign bank presence is more strongly linked to higher rates of busi-ness formation when those banks are head-quartered in developing countries. However, banks from developing countries are better able to spur business formation in industries that rely on standardized inputs, which po-tentially have fewer agency confl icts (Alfaro, Beck, and Calomiris 2015).
Although fi ntech could signifi cantly alter the fi nancial inclusion landscape, it also could entail new risks. A key challenge going for-ward is how to regulate and monitor an in-dustry with such exponential growth. If regu-lation is redundant or excessive, the potential that fi ntech has to promote overall fi nancial inclusion may be hindered. And yet, policy makers need to adopt and monitor regula-tion that will keep pace with the fast speed at which fi ntech is growing. The full set of risks, which are explored in detail in chapter 3, are not yet understood. They range from data security and cyber risk to regulatory arbitrage from rules that are not consistent across countries or even companies (World Economic Forum 2016a).
Another recent development that can change the role of foreign banks is the in-creasing importance of South–South banking. Since the global fi nancial crisis, the roster of international banks in developing economies has been changing. Although foreign bank-ing assets in developing economies continue to grow as fi nancial systems deepen, the pres-ence of developed economy banks, as mea-sured by the number of local bank subsidiar-ies, has been in decline since 2009, according to the Foreign Bank Ownership Database (Claessens and van Horen 2015). In the wake of this retrenchment, banks from regional fi -nancial centers (Hong Kong SAR, China and Singapore) as well as emerging economies (China, Colombia, Russia, and South Africa)have steadily expanded into developing mar-kets (box 2.10 discusses the expansion abroad of the largest Chinese banks).
Even though foreign banks from emerging economies tend to be smaller than their high-income country counterparts, their overall performance has been similar since the global fi nancial crisis. In terms of profi tability, the re-turn on assets of foreign banks from emerging economies has followed closely those of banks from high-income countries over the years.18 As for the size of their credit portfolios, since the global fi nancial crisis foreign banks from developing countries have been growing their lending at faster rates than their high-income competitors (see panels a and b of fi gure 2.2).

GLOBAL FINANCIAL DEVELOPMENT REPORT 2017/2018 B R I C K - A N D - M O R T A R O P E R A T I O N S O F I N T E R N A T I O N A L B A N K S 65
BOX 2.10 The Global Expansion of Chinese Banks
With commercial banking assets totaling $24.2 tril-lion in 2015, China is home to one of the largest bank-ing systems in the world.a As trade and investment ties strengthen in the global economy, Chinese banks are beginning to create a global fi nancial services net-work that supports domestic clients and contributes to the fi nancial development of host countries.
Data collected from the annual reports of the fi ve largest commercial banks (LCBs) in China reveal a steady increase in their brick-and-mortar opera-tions abroad from 2005 to 2015.b As fi gure B2.10.1 illustrates, the LCBs had by 2015 established 153 branches and subsidiaries in 50 overseas jurisdic-tions, 35 of which were located in 19 developing countries.c The bank branch presence in developed countries has rebounded sharply since a temporary setback after the global fi nancial crisis in 2007–09. Subsidiaries have increasingly penetrated markets in Latin America and the Caribbean, in addition to those in Europe and Asia and the Pacifi c. The num-ber of subsidiaries in developing countries more than tripled during these years.d
Because of its cultural similarity, political con-nectedness, and geographical proximity, as well as its established fi nancial industry, Hong Kong SAR, China has been host to many of the earliest affi li-ated overseas offi ces of Chinese banks. Around the time of the Great Depression, the Bank of China entered global financial centers to gain access to foreign currency clearance and security trading. Its banking offi ces in London, Luxembourg, New York, Singapore, and Tokyo would in the fol-lowing decades become regional hubs of Chinese banking operations. Following China’s accession to the World Trade Organization (WTO) in 2001, its banking presence expanded from regional host countries (such as Australia, the Republic of Korea, and Russian Federation) to Western Europe, Tur-key, the Gulf Cooperation Council (GCC) countries, Latin America, and several countries in Sub-Saharan Africa. In recent years, commensurate with China’s fundamental role in global trade, the international-ization of Chinese banks has facilitated the use of
(box continued next page)
FIGURE B2.10.1 Chinese Banks in the World: A Snapshot of Chinese Large Commercial Banks, 2005–15
No.
of s
ubsi
diar
ies
and
bran
ches
27 29 39
51 41
79510
19
511
16
0
40
80
120
160
a. Global subsidiaries and branchesby type of host country
2005 2010 2015
High income, subsidiaryHigh income, branch
Developing, subsidiaryDeveloping, branch
b. Developing country hosts
2005 2010 2015
5 6
22
22
2
8
3
5
12
0
5
10
15
20
No.
of h
ost c
ount
ries
East and Asia and PacificEurope and Central AsiaLatin America and the CaribbeanSouth AsiaSub-Saharan Africa

66 B R I C K - A N D - M O R T A R O P E R A T I O N S O F I N T E R N A T I O N A L B A N K S GLOBAL FINANCIAL DEVELOPMENT REPORT 2017/2018
BOX 2.10 The Global Expansion of Chinese Banks (continued)
the yuan as an increasingly important currency for settlements (Eichengreen, Walsh, and Weir 2014).
Associated with $1.5 trillion in overseas assets (out of a gross total of $12.1 trillion), in 2016 the overseas business portfolio of Chinese LCBs included investment loans, project loans, trade fi nance, and fi nancial consulting (CBRC 2016a).e In addition, the
c. Subsidiaries in developing countries
East and Asia and PacificEurope and Central AsiaLatin America and the CaribbeanSub-Saharan Africa
1
4 53
4
71
6
1
1
1
0
5
10
15
20
No.
of s
ubsi
diar
ies
2005 2010 2015
FIGURE B2.10.1 Chinese Banks in the World: A Snapshot of Chinese Large Commercial Banks, 2005–15 (continued)
a. Including large commercial banks, joint stock commercial banks, urban and rural commercial banks, and foreign banks.b. Large commercial banks, as categorized by the China Banking Regulatory Commission (CBRC), include the Industrial and Commercial Bank of China, China Construction Bank, Agricultural Bank of China, Bank of China, and Bank of Communications. They represent the majority of the international Chinese banking presence. In 2015 joint stock commercial banks as a group established seven branches in Luxembourg; Hong Kong SAR, China; Singapore; and the United States.c. Argentina, Brazil, Cambodia, India, Indonesia, Kazakhstan, Lao People’s Democratic Republic, Malaysia, Mexico, Myanmar, Panama, Peru, the Philippines, Russia, South Africa, Thailand, Turkey, Vietnam, and Zambia.d. In a regulatory and supervisory context, home countries exert more control over overseas branches than subsidiaries. This is often one consideration when banks expand abroad. Box 2.1 offers further discussion on foreign bank entry via branches and subsidiaries.e. A 2016 assessment of global systemically important banks (G-SIBs) by the Basel Committee on Banking Supervision indicated that the LCBs’ consolidated cross-jurisdictional activities in 2015 amounted to $1.1 trillion in claims and $1.6 trillion in liabilities (BCBS 2016).
Sources: 2016 Annual Reports of Agriculture Bank of China; Bank of China; Bank of Communications; China Construction Bank; Industrial and Commercial Bank of China.
LCBs participated in lending syndications and cross-border security issuances for clients in the infra-structure, energy, natural resources, and telecom-munication sectors, undertaking major international endeavors. Altogether, the overseas business contrib-uted to 7.5 percent of the aggregate pretax profi t of LCBs as a group (PwC 2016).
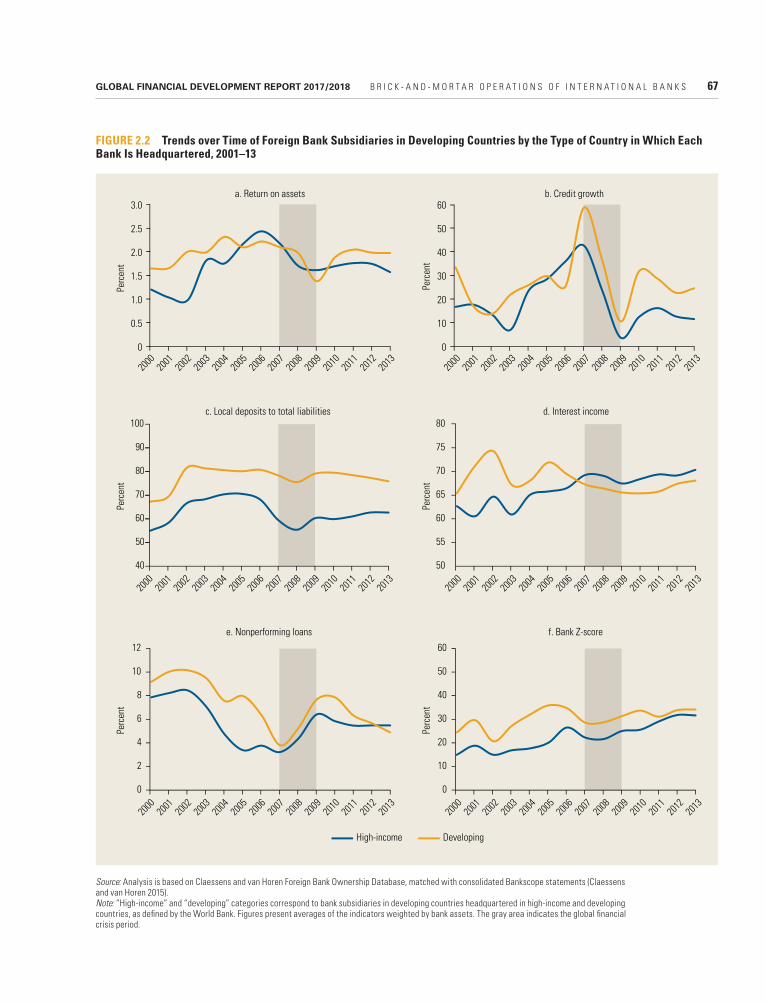
GLOBAL FINANCIAL DEVELOPMENT REPORT 2017/2018 B R I C K - A N D - M O R T A R O P E R A T I O N S O F I N T E R N A T I O N A L B A N K S 67
FIGURE 2.2 Trends over Time of Foreign Bank Subsidiaries in Developing Countries by the Type of Country in Which Each Bank Is Headquartered, 2001–13
Source: Analysis is based on Claessens and van Horen Foreign Bank Ownership Database, matched with consolidated Bankscope statements (Claessens and van Horen 2015). Note: “High-income” and “developing” categories correspond to bank subsidiaries in developing countries headquartered in high-income and developing countries, as defi ned by the World Bank. Figures present averages of the indicators weighted by bank assets. The gray area indicates the global fi nancial crisis period.
High-income Developing
e. Nonperforming loans
0
2
4
6
8
10
12
Perc
ent
2000
2001
2002
2003
2004
2005
2006
2007
2008
2009
2010
2011
2012
2013
f. Bank Z-score
0
10
20
30
40
50
60
Perc
ent
2000
2001
2002
2003
2004
2005
2006
2007
2008
2009
2010
2011
2012
2013
c. Local deposits to total liabilities
40
50
60
70
80
90
100
Perc
ent
2000
2001
2002
2003
2004
2005
2006
2007
2008
2009
2010
2011
2012
2013
d. Interest income
50
55
60
65
70
75
80Pe
rcen
t
2000
2001
2002
2003
2004
2005
2006
2007
2008
2009
2010
2011
2012
2013
a. Return on assets
0
0.5
1.0
1.5
2.0
2.5
3.0
Perc
ent
2000
2001
2002
2003
2004
2005
2006
2007
2008
2009
2010
2011
2012
2013
b. Credit growth
0
10
20
30
40
50
60
Perc
ent
2000
2001
2002
2003
2004
2005
2006
2007
2008
2009
2010
2011
2012
2013

68 B R I C K - A N D - M O R T A R O P E R A T I O N S O F I N T E R N A T I O N A L B A N K S GLOBAL FINANCIAL DEVELOPMENT REPORT 2017/2018
domestic banks to anticipate trade risks from both importers and exporters. This could al-low them to better overcome information asymmetries and contracting problems.
Studies have also found that a foreign bank presence enables and fosters FDI in a host economy. In developing countries, FDI may be limited by the lack of information about the local market, or by the absence of bank fi nancial expertise. Foreign banks, with expertise in global transactions and plausibly more sophisticated lending technologies than local banks, can help overcome these barri-ers and thus enable FDI in a host economy. Recent studies have shed light on the role of foreign banks in promoting FDI. Ongena, Qi, and Qin (2014) collected data on FDI and the presence of foreign banks by source economy for 12 regions in China over a period of 14 years, and they found that the level of FDI in a region indeed increases as the network of foreign banks expands. Using the instru-mental variables approach, they show that their results are robust to instrumenting for the presence of foreign banks with the tim-ing of the regional phasing out of the local limits for foreign banks on local currency business.19 Foreign banks may also facilitate investment by fi rms from their home econ-omy in which they operate. Poelhekke (2015) fi nds evidence supporting this view. Using data on FDI and exploiting the large differ-ences in the deregulation of banking sectors across economies and time, Poelhekke shows that the entry of foreign banks in a host economy was followed by an expansion innonfi nancial FDI from fi rms in the same homeeconomy.
Foreign banks may also have a direct ef-fect on fi rm innovation. Bircan and De Haas (2015) fi nd that Russian fi rms that receive credit from foreign banks are more innova-tive. Innovation is not only higher in localities with a greater number of foreign banks, but also conditional on borrowing; fi rms that bor-row from a foreign bank innovate more than fi rms that borrow from domestic banks.20
Although the presence of foreign banks may have long-term effects on the economy of their host country, studies have found mixed
Meanwhile, more lax regulation in the home countries of South–South banks may bring higher risks to the host country. In terms of stability, the home country of a for-eign bank matters. Although foreign banks can spread shocks from their home countries to a host economy, this transmission has been found to be stronger among foreign banks from home countries with lax fi nancial regu-lation and weaker institutional environments, and those banks are more likely to be head-quartered in less developed countries. Foreign banks from developing countries may bring better knowledge on how to operate in a weaker and more informationally opaque en-vironment, but they may be poorly supervised in their home country, which could translate into more instability for the host economy (Claessens and van Horen 2007).
Other Real Effects
Foreign banks also play an important role in the trade sector of the host economy. Several empirical studies show that fi rms in countries with a higher level of fi nancial development are not only more likely to export but also more likely to export in sectors that are more dependent on external fi nance (Beck 2002; Manova 2013). Moreover, in less developed economies, fi rms in sectors with more external fi nancial dependence tend to export more as the share of foreign banks in the economy in-creases, and particularly when foreign banks are headquartered in the importing country (Claessens, Hassib, and van Horen 2014). This fi nding suggests that foreign banks may have an edge in supplying specifi c fi nancing needs to exporting fi rms. This edge may be a result of the more advanced lending technolo-gies that foreign banks tend to use or of the ability of foreign banks to diversify risks (be-cause of their scale and global nature), which may allow them to specialize in specifi c trade-related products such as letters of credit. This fi nding also indicates that foreign banks can facilitate trade through an information chan-nel (see box 3.2 in chapter 3). Foreign banks, particularly if they are headquartered in the importing country, may be better able than

GLOBAL FINANCIAL DEVELOPMENT REPORT 2017/2018 B R I C K - A N D - M O R T A R O P E R A T I O N S O F I N T E R N A T I O N A L B A N K S 69
especially, resolving a global bank. One key diffi culty is that national sovereign countries operate within globalized and international markets (Goodhart 2013). In these intercon-nected markets, bank failures in one country may result in substantial externalities in other countries. For example, when a bank with a high share of foreign deposits fails, depositors abroad may be at risk. However, such costs may not be considered by domestic supervi-sors, leading to ineffi cient decisions (Beck, Todorov, and Wagner 2013).22 This is where the value of international regulation lies. To avoid these distortions and externalities, the regulation, supervision, and resolution of global banks should occur at a supranational level.
However, there is a basic trade-off when se-lecting the optimal international fi nancial ar-chitecture. As Beck, Silva-Buston, and Wagner (2015), discuss, if all countries were identical, it would be easy to agree on the right model for international regulation. However, the greater the differences among countries (for example, in their legal and regulatory systems, or in their exposure to costs in bank failure), the higher is the cost of closer cooperation. Therefore, the larger these differences across countries, the less desirable and less effective supranational supervision becomes. Beck, Silva-Buston, and Wagner (2015) argue that as externalities become more important and failure costs are more similar between coun-tries, the more likely it is that supranational supervision is preferred over national supervi-sion. As discussed later in this section, this ba-sic trade-off can serve as a general framework for assessing the effectiveness and suitability of different forms of cross-border integration of bank supervision.
Until now, international supervisory co-operation has been the preferred way to deal with the geographic mismatch between global banks and national supervision. For more than 40 years, supervisors have cooperated not only by harmonizing regulations and su-pervision standards but also by exchanging information on individual cross-border fi nan-cial institutions. Exchanging information on fi nancial institutions helps the host country
results. Many studies have analyzed the indi-rect links between foreign banking and long-term growth, but very little attention has been devoted to the direct links between banking openness and economic growth. Early stud-ies that investigated the relationship between foreign bank presence and growth at the macro level were inconclusive. Demirgüç-Kunt, Levine, and Min (1998) regressed real GDP per capita growth on foreign assets (or foreign bank presence) while controlling for other factors associated with growth, and they found no signifi cant direct effects. Later studies tried to address the endogeneity issues present in these studies by refi ning the estima-tion techniques. Employing dynamic panel estimators on a sample of 28 countries be-tween 1994 and 2003, Bayraktar and Wang (2008) reveal that the asset share of foreign banks has a signifi cant positive effect on GDP per capita growth. Other studies have ana-lyzed the causal impact of the liberalization of intrastate branching in the United States by exploiting the differentiated responses across states and time. For example, Beck, Levine, and Levkov (2010) look at the con-sequences for the distribution of income and fi nd boosted incomes for the lower part of the distribution, whereas Huang (2008) studies economic growth, fi nding limited evidence of higher growth. Using an international panel, Bremus and Buch (2014) analyze whether fi -nancial openness may affect economic growth through “granularity” in the banking sec-tor—that is, the propensity of idiosyncratic shocks affecting large banks to affect in turn the aggregate economy.21 The results suggest that fi nancial openness is negatively associ-ated with economic growth (but this is mostly driven by countries with low fi nancial depth), and they fi nd evidence that granular effects exist and are stronger in fi nancially closed economies.
CROSS-BORDER APPROACHES TO REGULATION, SUPERVISION, AND RESOLUTION
Authorities face a complex challenge when it comes to regulating, supervising, and,

70 B R I C K - A N D - M O R T A R O P E R A T I O N S O F I N T E R N A T I O N A L B A N K S GLOBAL FINANCIAL DEVELOPMENT REPORT 2017/2018
resolution phase, when distress, chaos, and improvisation were common. During the cri-sis, supervisory cooperation broke down, and many banks had to be resolved along national lines. The reasons for these breakdowns are complex, and a large body of literature has analyzed them. One lesson from the fi nancial crisis is that the existing cooperation arrange-ments seemed appropriate in normal times, but they failed in times of crisis, when rapid, collaborative responses were needed. The in-ternational rules of cooperation laid out in memoranda of understanding between au-thorities were, and remain, nonbinding. These nonbinding approaches clearly did not suf-fi ce during bad times, when cooperation was signifi cantly reduced and most cross-border resolutions were poor (Claessens 2016). One example was the resolution of Fortis, the larg-est Belgian bank with signifi cant operations in the Netherlands and Luxembourg. Regula-tors from the Netherlands, Luxembourg, and Belgium decided to inject capital into the fail-ing bank, until the Dutch government nation-alized its Dutch assets, which led to an unco-ordinated resolution along national borders (Wiggins, Tente, and Metrick 2014). The sale of Belgian Fortis to BNP Paribas was chal-lenged in court by its shareholders, postpon-ing fi nalization of the deal (IMF 2010).
Another important reason for the break-down in international cooperation was the lack of coordinated resolution mechanisms that could minimize the impact of distressed fi nancial institutions on global fi nancial sta-bility. A core feature of a stable system is that fi nancial institutions must be able to fail in an orderly fashion, which means without exces-sively disrupting the fi nancial system; without interrupting, when possible, the critical func-tions that banks provide; and without expos-ing taxpayers to losses. Because of the absence of specifi c instruments to resolve systemically important banks in an orderly way, the tools used to resolve cross-border banks were last-minute, ad hoc interventions involving pub-lic support.26 Global banks that failed or ran into trouble during the global fi nancial crisis were largely supported by the governments of
to evaluate the risk profi le of a foreign bank based on its activities in the home country, and such information enables it to take the actions needed to deal with potential risks. Exchanging information is also crucial for preventing signifi cant operational risks, such as money laundering and terrorism fi nancing.
The Basel Committee on Banking Super-vision has been the primary global standard-setter for bank regulation and supervision. Its mandate is to improve the regulation, super-vision, and practices of internationally active banks, and thus seeking to increase global fi -nancial stability. Supervisory cooperation, de-signed by the Basel Committee, is based on an agreed-on division of responsibilities among prudential supervisors. Specifi cally, supervi-sors in the home country are responsible for consolidated supervision, and supervisors in the host country are responsible for supervi-sion on an individual or subconsolidated ba-sis for fi nancial institutions operating in their country. Cooperation should take place at all stages of supervision (prevention), early reme-diation (recovery), and resolution (crisis man-agement). It can take different forms, includ-ing supervisory colleges, bilateral cooperation, regulatory harmonization, and more recently established crisis management groups.23
Nevertheless, coordination across coun-tries is challenging, and the resolution of global banks is extremely complex. Effec-tive coordination across countries of regula-tion and supervision as well as intervention in case of fi nancial distress are very diffi cult to achieve because countries have different policy preferences and incentives.24 When for-eign banks are systemic in host countries but not large in their home country, as in many developing countries, the incentives of foreign authorities to cooperate may be low (Claes-sens 2016).25 The reason is simple: even when the risks associated with weak supervision are high, if the costs are largely borne by the host country then regulators in the home country, may have little incentive to act.
The need to improve the current arrange-ments for cooperation was clear during the global fi nancial crisis, particularly in the

GLOBAL FINANCIAL DEVELOPMENT REPORT 2017/2018 B R I C K - A N D - M O R T A R O P E R A T I O N S O F I N T E R N A T I O N A L B A N K S 71
detail other initiatives aimed at reducing the cost of future fi nancial crises.
Structural banking reform measures can be used to limit activities that are too risky or whose risks are too complex to measure. Because price-based regulations such as capi-tal requirements or leverage ratios may be inadequate for measuring the risks associ-ated with certain activities, structural reforms have been proposed that move risky, complex businesses into stand-alone subsidiaries or prohibit these activities altogether. An impor-tant aim of these measures is to limit conta-gion from fi nancial markets and thus limit the benefi ts of public guarantees to core banking services, such as deposits, lending, and pay-ments (Viñals and others 2013). U.S. ap-proaches have favored the outright separation of investment banking and trading activities, whereas European approaches to ring-fencing entail subsidiarizing them.27 Although struc-tural separation may be warranted for some activities, regulators should also recognize that this may curtail the ability of banks to diversify risks across activities to some extent and, perhaps more importantly, could push risks outside the formally regulated fi nancial sector to shadow banks whose regulation and supervision would need commensurate improvement.
But more importantly, the global fi nan-cial crisis highlighted the need to improve the cross-border regulation and supervision of global banks, as well as their resolution in case of stress. The existing cross-border resolutions and cross-country cooperation were poor because of the so-called fi nancial trilemma. According to Schoenmaker (2013), a trilemma entails the incompatibility of pur-suing fi nancial stability and fi nancial integra-tion while maintaining national resolution authority. Any two of these policy objectives can be combined, but not all three. Thus, taking into account these trade-offs, regula-tors need to decide on a supervisory coopera-tion model that maximizes welfare. There is a wide spectrum of supervisory cooperation models, which can be positioned along a continuum of increasing loss of sovereignty.
host economies. As Beck, Todorov, and Wag-ner (2013) document, supervisors were more likely to intervene if banks’ equity was in the hands of foreigners, and incentives to inter-vene were lower if the deposits or assets of a bank were held abroad (that is, by nonlocals).
Since the global fi nancial crisis, policy makers have been addressing this lack of en-forceable and effective mechanisms for crisis resolution of cross-border banking groups in various ways. Since the crisis, regulation of cross-border fl ows has become more re-strictive, and informal barriers in the form of ring-fencing have increased. A report by the IMF (2015) emphasizes that the destabi-lizing effects of cross-border lending during shock episodes are best confronted by mutu-ally compatible resolution frameworks that could provide a global safety net, preventing the ad hoc imposition of ex post ring-fencing by prudential supervisors. Regulators and su-pervisors should also be aware that ex ante ring-fencing measures are likely to affect the operational structures and the roster of for-eign banks that operate in a host country.
The greater focus on crisis management and resolution is refl ected in the policy re-sponse by the Group of 20 and the Financial Stability Board (FSB). Signifi cant progress has been made in strengthening cooperation by establishing crisis management groups, which have been set up for systemically important institutions, and by creating recovery and resolution plans. Another example is “bail-in” mechanisms, which consist of writing off banks’ liabilities or converting them to equity, allowing the institution to continue as a going concern while giving the authorities’ time to reorganize or wind down parts of the busi-ness in an orderly manner without the need for taxpayer support. Claessens (2016) de-scribes specifi c regulations passed after the global fi nancial crisis and intended to better regulate and supervise international banks. More intense monitoring of large global banks and their risks is now in place, and pre-ventive measures, such as total loss absorbing capacity (TLAC) in case of fi nancial distress, have been implemented. Box 2.11 discusses in

72 B R I C K - A N D - M O R T A R O P E R A T I O N S O F I N T E R N A T I O N A L B A N K S GLOBAL FINANCIAL DEVELOPMENT REPORT 2017/2018
FIGURE B2.11.1 Liquidity and Cross-Border Funding of European Bank Subsidiaries in Europe and Central Asia and Latin America and the Caribbean Regions
BOX 2.11 Decentralized Global Banks and Multiple-Point-of-Entry Resolution
One key challenge arising from the recent fi nancial crisis that has not yet been solved is how to deal with global systemically important banks (G-SIBs). The failure of such too-big-to-fail institutions could be devastating for the fi nancial system and the economy as a whole. However, bailing out institutions entails large costs and may give them an incentive to increase their risk taking and grow ever larger (Bolton and Oehmke 2015).
In the aftermath of the global financial crisis, regulators decided to put in place a new bank resolu-tion framework aimed at reducing the cost of future banking crises. This framework requires sharehold-ers and creditors to absorb losses while avoiding the use of taxpayer money (the European Union’s Bank Recovery and Resolution Directive is one example of this arrangement). One of the main challenges of this new way of handling crises is the cross-border dimension, in particular for global banks, which would be refl ected in the resolution strategy selected by regulators.
The resolution strategy for global banks should be consistent with the way in which they operate. Broadly speaking, global banks tend to follow either a centralized business model or a decentralized one.
Under the decentralized model, global retail banks operate abroad with legally independent subsidiar-ies with autonomous capital and liquidity manage-ment, relying mainly on local currency–denominated deposits. The subsidiaries are supervised by the local authorities and protected by the host country deposit guarantee scheme. The parent provides group strat-egy guidelines, such as setting the global risk appe-tite framework, as well as a common culture, gover-nance, and control. Intragroup connections are very limited. Although support from the parent to the subsidiaries is possible, it is exceptional, temporary, and at market prices.
Recent studies—such as those by Kamil and Rai (2010) and Feyen and others (2014)—uncovered the resilience of decentralized banking during the global financial crisis and highlighted its stabilizing role in limiting contagion from connected countries. In the 2011 deleveraging episode, for example, Latin American subsidiaries of European banks suffered relatively little liquidity contraction, in contrast to their counterparts in Europe and Central Asia (ECA), which were more reliant on parent funding (see fi gure B2.11.1). The vulnerability of the subsidiaries in the ECA region to contagion necessitated the Vienna Ini-
(box continued next page)
Sources: Staff calculations, based on Bankscope (database).Note: The gray area in panel a indicates the global fi nancial crisis period.
Sources: Álvarez, García, and Gouveia 2016, based on Bank for International Settlements International Banking Statistics.
0
5
10
15
20
25
30
35
40a. Liquidity of European bank subsidiaries, 2005–13
b. Change in cross-border claims onbank counterparties, 2004–16
2005 2007 2009 2011 2013
Liqu
id a
sset
s (%
of t
otal
)
Europe and Central AsiaLatin America and the Caribbean
–50
0
50
100
150
200
250
300
350
Europe and Central Asia Latin Americaand the Caribbean
Perc
ent
2004–08 2008–12 2012–16

GLOBAL FINANCIAL DEVELOPMENT REPORT 2017/2018 B R I C K - A N D - M O R T A R O P E R A T I O N S O F I N T E R N A T I O N A L B A N K S 73
capital and liquidity globally, potentially hin-dering the benefi ts that global banks may bring to the host economy.
An alternative model for supervisory co-operation is a more intermediate approach. In the years before the onset of the global fi nancial crisis, countries were moving to-ward a more universal approach to super-visory cooperation. Since the crisis, a more territorial view has prevailed. Countries have adopted barriers to limit cross-border fi nance, such as macroprudential measures
At one end of the spectrum is the universal approach, with legally binding frameworks, loss of sovereignty, and centralized decision making. An example of this approach is the European banking union (box 2.12). At the other end of the spectrum is a more territo-rial approach, consisting of a noncooperative solution whereby each unit of a global bank is resolved according to local regulations (Claes-sens 2016). Although there is no international burden sharing under the latter approach, it would be costlier for global banks to allocate
BOX 2.11 Decentralized Global Banks and Multiple-Point-of-Entry Resolution (continued)
tiative, which was given the goal of improving home-host coordination and safeguarding fi nancial stability in emerging Europe. Cerutti and others (2010) argue, however, that such a decentralized model may also lead to ineffi ciencies, such as reducing the ability to relocate bank capital internationally and increasing the size of capital buffers at the subsidiary level.
The Financial Stability Board (FSB) has defi ned two resolution approaches for global banks:
• Single point of entry (SPE). Resolution power is exercised at the top level by the supervisory author-ity of the parent, with losses absorbed within the banking group. To reassure host banking authori-ties, this strategy normally requires total loss-absorbing capacity (TLAC) to be internally prepo-sitioned by the parent bank.
• Multiple point of entry (MPE). Resolution power is distributed to different authorities relevant to the entire banking group, along dimensions of geo-graphic location or business line. Each subsidiary is then resolved by the local authority according to the applicable resolution frameworks.
Using a simple model, Bolton and Oehmke (2015) highlight the trade-offs that arise in cross-border resolutions of global banks, including the political constraints faced by national regulators. Their main results suggest that even though an SPE resolution is in principle more effi cient than an MPE solution,
such an arrangement may be incompatible with the interests of national regulators because they would prefer to ring-fence their national fi nancial systems. The authors’ analysis shows that the more decentral-ized the operations of a global bank, the more effi -cient the MPE resolution is relative to the SPE one.
The MPE resolution strategy is better adapted to decentralized banks funded with local deposits under the legal structure of subsidiaries, with little or no intragroup positions and decentralized capital and liquidity management.a Local authorities that already supervise the local subsidiary on a business-as-usual basis would retain this feature when the bank is failing or likely to fail. Local authorities would also be the leaders in any resolution. The home authority would mainly act as a coordinator in case several subsidiaries have to be resolved at the same time, which is very unlikely because of the diversifi cation inherent in this model.
Although there is no unique foreign bank busi-ness paradigm, the MPE resolution strategy is more appropriate in the ring-fencing context, where the bail-in paradigm still faces the test of practical imple-mentation. It is important that regulations acknowl-edge the specifi cities of the MPE model and do not penalize it by requiring internal TLAC (which com-plicates the functioning of this model by increasing intragroup positions) or by imposing consolidated requirements over and above those decided by local authorities.
a. See, for example, Faia and Weder di Mauro (2015) for a recent theoretical approach to optimal resolution design.

74 B R I C K - A N D - M O R T A R O P E R A T I O N S O F I N T E R N A T I O N A L B A N K S GLOBAL FINANCIAL DEVELOPMENT REPORT 2017/2018
often bilateral and nonbinding cooperation models, such as the Association of Southeast Asian Nations (ASEAN) or the West African Economic and Monetary Union (WAEMU), are examples of the intermediate approaches discussed in boxes 2.13 and 2.14. As Claes-sens (2016) suggests, the intermediate ap-proach could aim to have a “concordat,” an international agreement with a framework
and countercyclical buffers. However, the in-tended impact of these measures is diffi cult to achieve without coordination with authorities in the countries in which foreign banks are headquartered.28 Nevertheless, an intermedi-ate model of cooperation, in which some ele-ments of the universal approach are adopted (such as resolution procedures), may be the preferred model for many countries. Looser,
BOX 2.12 The European Banking Union
The European Union’s (EU’s) banking union was launched in 2012 in response to the deterioration of credit conditions during the European debt crisis. Under this arrangement, the responsibility for bank-ing policy passes from the national level to the euro area level. As of 2016, the union had two main pil-lars, the Single Supervisory Mechanism (SSM) and the Single Resolution Mechanism (SRM). A third pil-lar, European Deposit Insurance, is currently under development.
The Single Supervisory Mechanism is part of the European Central Bank (ECB). Its main goals are ensuring the safety and soundness of the European banking system, increasing fi nancial integration and stability in Europe, and conducting consistent super-vision across participant banks. It directly supervises some 130 signifi cant banks, which account for about 85 percent of the total banking assets in the euro area, and it is empowered to intervene directly in less signifi cant institutions. The SSM licenses all banks in the euro area. It works with national authorities, and it currently is limited to the euro area. The SSM relies on local supervisors to collect information and perform on-site inspections.
The Single Resolution Mechanism was put in place to ensure that the resolution of credit institu-tions facing fi nancial diffi culties is carried out effi -ciently, thereby reducing its costs to the real econ-omy. In the resolution of a systemically important institution, the costs of failure should not be borne by taxpayers. Instead, the EU’s banking union will set up a Single Resolution Fund (SRF) that has no national elements either in the calculation of its fund-
ing or in the use of the fund itself. The fund will be built up over a 10-year period by contributions reaching the target funding level of at least 1 percent of covered deposits. During an eight-year transition period, national contributions are still earmarked and held in national compartments, after which the SRF will be set up as a truly European fund. Even though the fund will be small, it can help to meet the unavoidable costs of resolution, and the main capital defi ciency can be borne by the total loss-absorbing capacity (TLAC) liabilities.
In November 2015, the European Commission adopted a legislative proposal for a European Deposit Insurance Scheme (EDIS), which will be fully opera-tional by 2024. EDIS would create a centralized euro area–wide deposit insurance scheme that would com-prise national deposit guarantee schemes plus a Euro-pean deposit insurance fund built over eight years. The existing national deposit guarantee funds would remain in place as part of EDIS, which would be built up by coinsuring national deposit guarantee schemes and pooling the available funds for payouts over time without requiring an overall increase in bank contri-butions. EDIS would be developed in three stages: (1) a reinsurance scheme for the first three years, providing liquidity assistance and limited loss absor-bance of the national schemes; (2) a coinsurance scheme for four years, until 2024, under which EDIS would absorb a progressively larger share of losses of the national schemes; and (3) a fi nal stage, in which EDIS would fully insure deposits and cover all liquid-ity needs and losses in the event of a payout or resolu-tion procedure and protect deposits below €100,000.a
a. At the time this chapter was drafted, political resistance to EDIS was continuing, and implementation had not yet been scheduled.

GLOBAL FINANCIAL DEVELOPMENT REPORT 2017/2018 B R I C K - A N D - M O R T A R O P E R A T I O N S O F I N T E R N A T I O N A L B A N K S 75
BOX 2.13 Intermediate Cooperation Approaches: The ASEAN and Australia–New Zealand Cases
A recent, looser form of cooperation is the ASEAN Economic Community, which was established at the end of 2015. The 10 member states of the Association of Southeast Asian Nations (ASEAN) entered the ASEAN Banking Integration Framework in March 2015.a Member states may enter bilateral agreements that allow qualifi ed ASEAN banks to operate in part-ner countries on the same terms as domestic banks. The criteria and reciprocal terms for bank access are negotiated bilaterally. This agreement is part of ASEAN’s efforts to create a single economic market. It grants ASEAN banks greater market access than non-ASEAN banks, but it remains based on a net-work of bilateral agreements. The ASEAN Banking Integration Framework is fundamentally different from the European Union’s “single passport regime.” Their main similarity is that they both seek to make market access for banks less burdensome.b
Another example of legally binding cooperation is the supervisory cooperation between Australia and New Zealand. The largest Australian banks dominate the fi nancial system of New Zealand.c As a result, both countries have a very close home–host relationship. The cooperation and information shar-ing between the Australian Prudential Regulation Authority (APRA) and the Reserve Bank of New Zealand (RBNZ) are extensive. This cooperation has been further reinforced by a 2006 amendment to the RBNZ Act that legally obliges the RBNZ to cooperate and consult with the fi nancial supervisory authorities in Australia to try to avoid actions that may negatively affect fi nancial stability in Austra-lia. The Australian Banking Act contains similar provisions.
countries and emerging markets do not have much representation in the relevant bod-ies and forums, which creates problems for them in the design and implementation of regulation and supervision arrangements (FSB 2011). These obstacles are particularly impor-tant because of the growing trends in region-alization and South–South banking.
In the years to come, South–South entry and more regionalization of foreign banks will substantially shape cross-border supervi-sory and regulatory arrangements. As South–South banking and bank regionalization continue to develop, the benefi ts and risks of international banks may also change, with important consequences for their regulation and supervision. The new generation of for-eign banks from other developing countries,
similar to that of the Basel Committee on Banking Supervision but focused on crisis management and, importantly, with explicit incentives for collaboration, credible resolu-tion processes, and clarity on cost sharing in a resolution.
Nevertheless, obstacles to cross-border resolution, particularly among developing countries, continue to exist. For cross-border cooperation agreements to work, both host and home authorities need to cooperate fully and commit to legislative action as necessary to empower resolutions. As noted by the Fi-nancial Stability Board (FSB 2013), emerg-ing and developing countries may not have adequate supervisory expertise, capacity, or resources to respond to postcrisis global regu-latory incentives. Moreover, many developing
a. ASEAN is a political and economic organization comprising Brunei, Cambodia, Indonesia, Lao People’s Democratic Republic, Malaysia, Myanmar, the Philippines, Singapore, Thailand, and Vietnam.b. The European passport principle allows a bank that is licensed in one EU member state to open branches in other member states by simply notifying the host country before opening the branch. The relevant host authorities do not have the right to refuse the establishment of the branch if it has been authorized by the home country and cannot force the branch to take another legal form.c. Australia’s big four banks—the ANZ, Commonwealth Bank, National Australia Bank, and Westpac—control almost 90 percent of the assets of New Zealand’s banking system.

76 B R I C K - A N D - M O R T A R O P E R A T I O N S O F I N T E R N A T I O N A L B A N K S GLOBAL FINANCIAL DEVELOPMENT REPORT 2017/2018
BOX 2.14 Intermediate Cooperation Approaches: The WAEMU Case
Cross-border banking has been increasing in Africa. As of 2014, there were 104 active cross-border banks with at least one branch or subsidiary outside their home countries.a The recent growth of pan-African banks has transferred the risks and benefi ts of cross-border banking from European to African policy makers. Regional integration of African banks brings many benefi ts but also a cost of contagion, hence the need for increased supervisory cooperation. That is, potential instabilities arising from pan-African banks will need to be handled collaboratively rather than by individual supervisors.
The West African Monetary Union Banking Commission, founded in 1990, is overseen by the governor of the Central Bank of West African States (BCEAO). As a further step for supervisory coop-eration, the treaty for the West African Economic and Monetary Union (WAEMU, also known by its French acronym, UEMOA) was signed in 1994. The member states are Benin, Burkina Faso, Côte d’Ivoire, Guinea-Bissau, Mali, Niger, Senegal, and Togo. The focus of the WAEMU and its Banking Commission has been the banking sector, but this is evolving rapidly with the emergence of transnational banking groups and microcredit institutions. As of 2015, the WAEMU banking sector included 127 credit institutions, including 114 commercial banks and 13 other quasi-bank fi nancial institutions.b This amounts to more than 90 percent of all financial assets in the region and more than half of regional GDP. The WAEMU aims to maintain a common legal and regulatory framework for the regional banking system. Considering the political and regional characteristics of these countries, address-ing these issues requires different approaches than in developed countries. More specifi cally, the political and institutional characteristics of these countries are more heterogeneous than in European countries. In addition, fi nancial deepening and access, super-visory capacity, and fi nancial infrastructure are dif-ferent in Africa than in developed economies. As a
result, the standards set by the Basel Committee may not be appropriate for African banking cooperation. As noted by the Financial Stability Board (2013), these countries may not have adequate supervisory expertise or resources to respond to postcrisis global regulatory incentives. When compared to the level of cooperation in the European or Australia–New Zea-land examples, WAEMU is at its early steps. Beck, Fuchs, and others (2014) discuss that information exchange is still very weak in Africa, and it would be a fi rst step to create a basic data set, and hence facilitate better supervisory cooperation.
Member countries of the WAEMU are affected by frequent and often idiosyncratic shocks, such as natural disasters or political instabilities. The macro-economic volatility makes the domestic financial sector more unstable. Hence, policies must be based on bilateral or subregional agreements rather than being unique across all countries in the region. In the case of West Africa, an increasing level of fi nancial integration coexists with these heterogeneities across countries. More specifi cally, fi nancial systems have developed differently in the countries with Anglo-phone and Francophone cultures. This may suggest a more detailed framework within subregions. Another aspect of the heterogeneity is the ownership struc-ture of banks in African countries. African coun-tries that are mostly dominated by European banks, for instance Mozambique, may need considerations within the subregions. Security risks may also yield delays in reforms, which creates another problem for the harmonization goals of WAEMU. Another concern is that less developed business conditions, asymmetric information, and weak judicial envi-ronments impose diffi culties for an effective union in the region. Finally, despite the centralized struc-ture of WEAMU, supervisory decisions made by the WAEMU Banking Commission are mostly subject to the approval of national agencies. This aspect of the African case differs from the EU’s banking union model.
a. Some of these infl uential banks of African origin that operate in many African countries outside their home country are Ecobank, United Bank for Africa, Standard Bank Group, Banque Marocaine du Commerce Extérieur, Banque Sahélo-Saharienne pour l’Investissement et le Commerce, and Attijariwafe Bank.b. European Investment Bank, “Recent Trends in Banking in Sub-Saharan Africa: From Financing to Investment,” July 2015.

GLOBAL FINANCIAL DEVELOPMENT REPORT 2017/2018 B R I C K - A N D - M O R T A R O P E R A T I O N S O F I N T E R N A T I O N A L B A N K S 77
bad ways of attracting international banks. Opening host economies to foreign nonfi -nancial fi rms and providing foreign fi rms with profi t opportunities will attract foreign banks looking for profi ts and diversifi cation. Host countries should, however, avoid offer-ing foreign banks these profi t opportunities via weak regulation and supervision because this approach will tempt parent banks to in-cur excessive risk in host economies, such as through regulatory arbitrage. Thus, for host economies, the best way to avoid being ex-ploited as a risk-taking haven is to adopt a strong fi nancial regulatory and supervisory framework and ensure that foreign subsid-iaries are self-suffi cient (with high capitaliza-tion requirements and a high share of fund-ing through retail deposits). Because foreign branches are mostly under home country regulation, host country authorities should prefer subsidiaries as the mode of entry for in-ternational banks. Moreover, a mix of green-fi eld and foreign bank subsidiary takeover investment should be welcomed. Because they are better integrated with the parent bank, greenfi elds may help more during local down-turns, whereas investment through acquisi-tions may yield greater benefi ts in response to home country or global shocks. Finally, some diversifi cation of foreign banks’ business models may shield host economies from the negative outcomes associated with a specifi c type of activity (for example, a negative shock to fee-based, noninterest, income-generating activities).
Strong regulation and supervision are not possible in a weak institutional environment. Financial liberalization should be accom-panied by institutional reforms that prevent foreign banks from crowding out incumbents without increasing the competitiveness and effi ciency of the banking sector in the host economy. Financial liberalization should also be introduced gradually to allow domestic banks to adapt and better compete with new foreign banks. During home country or global downturns, foreign banks will be less likely to retrench from host countries that have solid institutional environments and competitive
with more proximity to host countries in terms of culture, economic conditions, and even physical distance, may facilitate commu-nication and coordination between host and home country authorities. The rise of foreign banks from developing countries also implies that the developing countries that host them need to be more engaged with the interna-tional fi nancial agenda and need to better monitor the activities of their foreign banks. Regulators should also be cautious about the regionalization of foreign banks because this trend could lead to fi nancial repression, ring-fencing, and fragmentation, which could in turn adversely affect the fi nancial stability of the host economy (Claessens 2016).
Regulators must also pay close attention to fi ntech and the way it is revolutionizing the banking sector. Fintech may bring new chal-lenges to the already-complex supervision and regulation of foreign banks. Regulators need to keep pace with the rapid speed with which nonbank providers enter the market and digital services are rolled out and the po-tential risks that these changes may entail.
CONCLUSIONS AND POLICY IMPLICATIONS
The brick-and-mortar operations of interna-tional banks can have important benefi ts for the higher fi nancial development of a host economy. The entry of foreign banks into a host economy can increase competition in the banking sector, the performance of lo-cal banks, and overall access to credit. For-eign banks also can provide the host country with a risk-sharing scheme, but, as in all risk-sharing schemes, it is not a one-way relation-ship; the two sides (parent banks and foreign affi liates, or home countries and host coun-tries) must support each other during diffi cult times. The experience of international banks over the last few decades offers valuable pol-icy lessons for reaping the benefi ts of interna-tional banking while keeping the costs at a minimum for both sides.
Studying the drivers of bank international-ization and its consequences reveals good and

78 B R I C K - A N D - M O R T A R O P E R A T I O N S O F I N T E R N A T I O N A L B A N K S GLOBAL FINANCIAL DEVELOPMENT REPORT 2017/2018
an open fi nancial system—and universal-ism—the equitable distribution of bankruptcy costs involving cross-border burden sharing. The European SRM is a prospective exam-ple of the latter approach (Claessens 2016). Although these two approaches may be too extreme for many countries, an intermediate model of cooperation that includes some ele-ments of the universal approach may be fea-sible. Ideally, this intermediate model would adopt an international agreement on crisis management that explicitly outlines responsi-bilities and processes to follow in a resolution.
Ring-fencing is how some local regulators seek to limit the potentially negative conse-quences of having foreign banks. Host author-ities request local liquidity and capital to mini-mize the impact of external shocks. In terms of advantages, this approach provides better incentives for local supervision and no bur-den-sharing requirements. Ring-fencing, how-ever, is less effi cient for fi nancial institutions because it reduces the benefi ts of cross-border banking in the fi rst place, potentially imposing costs in times of stress through possible runs and liquidity problems. This approach also undermines any cross-border regulation and supervision incentives, thereby hurting the general openness of fi nancial systems.
NOTES
1. See Čihák, Mare, and Melecky (2016) on the trade-offs between the pursuit of deeper fi nancial inclusion and fi nancial stability.
2. Even though most emerging economies and developing countries have strengthened their banking supervision and regulation, they still face various challenges, such as supervi-sory capacity constraints or incomplete legal frameworks (Financial Stability Board 2011).
3. See, for example, Goldberg and Johnson (1990) for the U.S. case and Focarelli and Pozzolo (2000) for an international analysis. Also see Cull and Martínez Pería (2010) for a literature review on foreign bank participa-tion in developing countries.
4. Another example is from Dell’Ariccia and Marquez (2006a), who develop a race-to-the-bottom model in which they show that com-
banking systems. Moreover, host economies with a good information environment and effective contract enforcement are likely to reap more benefi ts from foreign banks, as improved information sharing—through, for example, credit registries—can help foreign banks to lower average lending interest rates and increase average loan quality.29
When possible, such as in a privatization process, host country authorities should con-sider choosing among foreign parent banks as prospective owners. They could try to diver-sify the roster of home countries and ensure that the prospective parent banks are also di-versifi ed and not overly dependent on whole-sale funding so they can provide liquidity and other support to their subsidiaries even during bad times at home. Host countries can try to pick parent banks from home countries with effective banking regulations and some prox-imity to the host country (culturally, institu-tionally, or in physical distance) to increase the stability of the foreign bank subsidiary or branch. Host country authorities may also di-versify across other characteristics of foreign banks, such as their business models. This strategic diversifi cation may be planned at the level of fi nancial sector strategies, rather than at the more ad hoc stage of the licensing pro-cess. Finally, a core position in the banking group—in terms of relative size or profi tabil-ity—lowers the chances that a foreign bank will run for the exit in response to a shock. Any efforts to shape the roster of foreign banks must be consistent with a country’s ob-ligations under multilateral and preferential service trade agreements. A country that pur-sues this approach would likely need to iden-tify a set of objective criteria for evaluating prospective entrants to ensure that provisions in trade agreements precluding discrimination against other countries are not violated.
The regulatory and supervisory failures during the recent global fi nancial crisis led to an intensive effort to redesign the regulatory landscape. Two extreme approaches infl uenc-ing the ongoing policy discussions entail ter-ritoriality—ring-fencing of activities under a particular authority’s domain, which inhibits

GLOBAL FINANCIAL DEVELOPMENT REPORT 2017/2018 B R I C K - A N D - M O R T A R O P E R A T I O N S O F I N T E R N A T I O N A L B A N K S 79
sis (and were not just as the result of removal of entry barriers).
10. Evidence on the transmission of international monetary policy via foreign banks in a par-ticular country such as Mexico is discussed in box 2.8.
11. See, for example, De Haas and van Lelyveld (2006), who confi rm the procyclicality of for-eign banks for Eastern Europe.
12. Other empirical studies analyzing the lending of foreign banks during the global fi nancial crisis are those by Choi, Gutierrez, and Mar-tínez Pería (2014); Claessens and van Horen 2015; De Haas and van Lelyveld (2014); De Haas and others (2015); and Mihaljek (2011).
13. Using individual-level data across 123 dif-ferent countries, Allen and others (2012) analyze the association between fi nancial inclusion measures and different individual and country characteristics, and they fi nd that the share of foreign banks is not signifi cantly correlated with fi nancial inclusion. This fi nd-ing, however, may mask the fact that the impact of foreign banks in a host economy is not homogeneous across countries and largely depends on the institutional context of the host economy.
14. Also see Detragiache, Tressel, and Gupta (2008) for a focus on poor countries showing similar results.
15. Although a foreign bank presence is nega-tively associated with credit access in low-income countries, it is not necessarily true that a foreign bank presence causes reduc-tions in lending. As Cull and Martínez Pería (2010) show, the context surrounding the entry of foreign banks is likely to affect the relationship between their presence and credit levels. In this way, the negative relationship between foreign bank presence and credit lev-els could be driven by the nonrandom entry of foreign banks into banking markets that were in crisis or had experienced large drops in credit levels prior to their entry.
16. This pattern has been found especially in developing countries, where foreign banks overwhelmingly lend to the safest, largest already-banked customers such as large fi rms, corporations, and public fi rms (Beck and Brown 2013; Beck and Martínez Pería 2010; Berger, Klapper, and Udell 2001; Berger and
petition among regulators reduces regulatory standards, creating competition in laxity in order to promote their domestic banks.
5. See Mian (2006), who relates various distance measures to information, agency, or enforce-ment costs in a developing country environ-ment.
6. As highlighted by Claessens (2016), foreign banks are likely to select host countries that have income levels and institutional develop-ment similar to or lower than that in their home countries.
7. An extensive number of studies in develop-ing countries, at both the regional and coun-try levels, fi nd evidence that foreign banks are more effi cient than domestic banks (see, for example, Bonaccorsi di Patti and Hardy 2005; Detragiache and Gupta 2006; Havryl-chyk and Jurzyk 2011; Isik and Hassan 2002; Matoušek and Taci 2004; Weill 2003). However, other studies fi nd a more ambigu-ous pattern. For example, in countries with a limited foreign bank presence, such as India and China, differences in effi ciency between domestic and foreign banks are not very large (Berger, Hasan, and Zhou 2009; Bhat-tacharya, Lovell, and Sahay 1997; Sensarma 2006; Wu, Chen, and Lin 2007). In other studies from Latin America, the fi ndings dif-fer, depending on the effi ciency measure used (Barajas, Steiner, and Salazar 2000; Berger and others 2005; Crystal, Dages, and Gold-berg 2001; Goldberg, Dages, and Kinney 2000).
8. Morgan, Rime, and Strahan (2004) illustrate this ambiguous relationship with a simple model in which they compare the impact of collateral and bank capital shocks under a regime in which banks can allocate their capital freely across states versus a regime with restricted interstate bank capital fl ows. Although these shocks are contractionary in both environments, their magnitudes vary. If banks are allowed to move their capital freely, bank capital shocks in the host economy may be less intense because international banks can import capital from abroad. However, international banks may help amplify collat-eral shocks in the host economy because they can lend away their capital.
9. A substantive share of the entry episodes of foreign banks in emerging markets and devel-oping countries occurred after a fi nancial cri-

80 B R I C K - A N D - M O R T A R O P E R A T I O N S O F I N T E R N A T I O N A L B A N K S GLOBAL FINANCIAL DEVELOPMENT REPORT 2017/2018
they supervise a part of the banking group that is not considered material to the global bank) still have access to relevant information about the bank using bilateral contacts.
25. Consider, for example, two Portuguese banks operating in Mozambique that were autho-rized to merge by Banco de Portugal in 2000. Although this merger did not represent a dramatic change in the fi nancial sector of Portugal, it signifi cantly affected the banking sector of Mozambique, where a new foreign banking entity with substantial market power was created. After the merger, almost 50 per-cent of banking assets in Mozambique were owned by this new institution.
26. One example is Landsbanki, an Icelandic bank that collected deposits from Dutch and British households through its online branch, Icesave. When the bank went bankrupt during the global fi nancial crisis, Icelandic deposit insurance should have applied to the Icelan-dic, Dutch, and British depositors of Icesave. The Icelandic authorities, however, decided to honor the insurance for only domestic deposi-tors, a decision that was later approved by a European court (The Economist 2013b). The British government then used an antiterror-ism law to freeze the assets of the failed bank. Eventually, the losses of foreign depositors were covered by the British (fully) and Dutch governments (up to €100,000)—see Zeissler, Piontek, and Metrick (2015).
27. For example, in the United States the Volcker rule mandates the separation of proprietary trading, hedge fund investments, and private equity fund investments because they “gen-erate a risk culture that is fundamentally at odds with banks’ client-facing activities, particularly deposits, lending, and wholesale banking” (Viñals and others 2013).
28. Claessens (2016) discusses the various types of externalities and negative spillovers that these measures could create when coordina-tion across countries is not in place.
29. See Claeys and Hainz (2006) for a theoretical discussion.
others 2008; Bonin and Wachtel 2003; Gorm-ley 2005; Mian 2003, 2006).
17. Gennaioli, Martin, and Rossi (2014) provide a theoretical model and empirical evidence on how public defaults relate to the fi nancial system and on how this relationship has a dis-ciplinary effect on governments in countries with good market institutions.
18. Similar trends are observed when comparing the returns on equity of both types of foreign banks.
19. Although the phasing out of limits strongly encouraged foreign bank participation, it was driven by compliance with the original WTO commitments.
20. The conclusions of this study are robust to a series of tests that rule out that fi rms that borrow from local banks are statistically dif-ferent from fi rms that borrow from foreign banks.
21. Both the de jure and de facto dimensions of fi nancial openness are examined. The de jure dimensions are measured using Chinn and Ito (2006, 2008), and Schindler (2009). The de facto dimensions are (1) the sum of total foreign assets and total foreign liabilities rela-tive to GDP, (2) the sum of cross-border bank loans relative to GDP, and (3) FDI in banking.
22. Evidence from Beck, Todorov, and Wagner (2013) shows that during the global fi nancial crisis, the incentives of supervisors to resolve failing banks were distorted by the type of cross-border activities of these banks.
23. Supervisory colleges are composed of the supervisors of both the home and host coun-tries of a foreign bank. Crisis management groups are integrated by the various home and host authorities of all global and large systemic banks (such as central banks and supervisory authorities) with the objective of increasing the ability to act quickly and effec-tively in a crisis situation.
24 According to the Financial Stability Board (FSB 2015), it is important that host supervi-sors not represented in coordination groups for different reasons (for example, because


• Financial systems are multidimensional. Four characteristics are of particular interest for benchmarking fi nancial systems: fi nancial depth, access, effi ciency, and stability. These characteristics need to be measured for fi nancial institutions and markets.
• Financial systems come in all shapes and sizes, and differ widely in terms of the four characteristics. As economies develop, services provided by fi nancial markets tend to become more important than those provided by banks.
• The global fi nancial crisis was not only about fi nancial instability. In some economies, the crisis was associated with important changes in fi nancial depth and access.
C R O S S - B O R D E R L E N D I N G B Y I N T E R N A T I O N A L B A N K S
• Banks have globalized in part through their cross-border lending activity, which doubled from 2001 to 2014 and has become a substantial part of international capital transactions. The stock of cross-border bank claims around the world in 2012 was larger than that of cross-border portfolio holdings and foreign direct investment.
• Whereas Japan, the United States, and Western Europe have historically accounted for most cross-border banking activity, economies in the “South” (mainly developing countries) have been gaining ground since the early 1990s. The South, as a source and destination of cross-border bank funds, increased from representing 28 percent of the world’s cross-border bank claims in 2001 to 33 percent in 2014, and from 21 percent of syndicated loans in 2001 to 31 percent in 2014.
• The growing participation of the South in global fi nancial transactions has allowed these economies to not only diversify their investments but also obtain fi nancing from abroad, com-plementing domestic markets and widening their available funding choices.
• As part of the risk-sharing arrangement, cross-border banking also tends to act as a transmis-sion mechanism for external shocks. This tendency was observed during the global fi nancial crisis, when cross-border bank fl ows collapsed after having risen during the early 2000s.
• Because the largest global banks were mostly located in high-income countries hit by the global fi nancial crisis, the shock to their balance sheets affected both their domestic and cross-border activities, spilling over to developing countries.
• Firms reacted to the decline in the supply of cross-border banking activity during the global fi nancial crisis by switching to different sources of fi nancing. In high-income and developing countries, fi rms moved toward bond markets. In developing countries, fi rms also switched to domestic banks. Because of these switches, global fi nancial activity during the crisis declined to less than the collapse in cross-border loans. The change in debt composition then continued during the postcrisis period. The substitution and compositional effects were also observed at the aggregate level. Whereas before the global fi nancial crisis, North–South lending grew faster than South–South lending, this situation reversed after the crisis.
• The postcrisis period has also been characterized by the emergence of a broad set of technology-driven nonfi nancial companies acting in parallel with traditional banking services. These so-called fi ntech companies have been adding solutions to different segments of the banking value chain, such as payments, cross-border transfers, and savings vehicles. Although the new players are ramping up competition and pushing digital transformation in the global fi nancial sector, to date the level of disruption has seemed low, and their services appear highly comple-mentary to the ones provided by the more established banking sector.
CHAPTER 3: KEY MESSAGES

3Cross-Border Lending by
International Banks
G L O B A L F I N A N C I A L D E V E L O P M E N T R E P O R T 2 0 1 7 / 2 0 1 8 83
Cross-border bank credit has expanded rapidly in recent decades, and has become an important part of global
banks’ business activities. Cross-border bank claims worldwide doubled during the period 2001–14. An important part of this growth was transactions involving developing nations as a source and destination of funds. For ex-ample, cross-border bank claims to develop-ing economies expanded by a factor of three during the same period. The rise in cross-border bank credit to and from economies in the South occurred in parallel with the rapid growth of other fi nancial transactions, deep-ening developing countries’ integration into global fi nancial markets.
This expansion has not been monotonic; cross-border lending has been characterized by boom-and-bust patterns. Of special im-portance, because of its scope and length, was the across-the-board retrenchment observed during the global fi nancial crisis. Although cross-border lending to developing econo-mies primarily originated with global banks located in high-income countries, the period since the crisis has been characterized by in-creased South–South lending. Moreover, as bank credit to and from high-income coun-tries has declined, the postcrisis years have been characterized by greater use of alterna-tive sources of fi nance, such as bond markets
and domestic loans, and also by the emer-gence of new digitally enabled businesses providing fi nancial services outside the tra-ditional banking sector. These developments have allowed fi rms to diversify their funding sources, but they also have exposed them to new types of risks. This chapter studies these developments, which have shaped the global fi nancial landscape in recent decades.
THE PROS AND CONS OF CROSS-BORDER LENDING
Cross-border credit can provide both lend-ers and borrowers with important benefi ts. Through cross-border banking, savings can be channeled toward countries with more productive investment opportunities, so that capital is allocated more effi ciently globally. It also allows global banks to achieve better international risk diversifi cation and to hedge against country-specifi c risks (De Haas and van Lelyveld 2010; Goldberg 2009). From the borrowers’ perspective, global banks can ease fi nancial constraints in host economies by providing access to alternative sources of external fi nancing and compensating for the volatility of domestic credit (Allen and others 2011). In turn, the presence of foreign capital may pressure policy makers in host countries

84 C R O S S - B O R D E R L E N D I N G B Y I N T E R N A T I O N A L B A N K S GLOBAL FINANCIAL DEVELOPMENT REPORT 2017/2018
banking. Capital fl ows are highly heteroge-neous across countries and regions, refl ecting the relevance of a country’s idiosyncratic, or pull, factors as drivers of capital fl ows. For example, the literature has found macroeco-nomic conditions in the recipient countries to be important pull factors of cross-border fl ows (Buch, Carstensen, and Schertler 2009; Jean-neau and Micu 2002; Müller and Uhde 2013). Sound institutions are another important driver. Using a large panel of fi nancial fl ow data from banks, Papaioannou (2009) fi nds that the protection of property rights, legal ef-fi ciency, and expropriation risk are important determinants of bank capital fl ows. Siregar and Choy (2010) fi nd that political instabil-ity and weaknesses in the legal, judicial, and bureaucratic systems help to explain the con-tinued stagnation in lending after the Asian fi nancial crisis. Conversely, Kalemli-Ozcan, Papaioannou, and Peydró (2010) show that in the European Union, the convergence in the legislative and regulatory frameworks with the adoption of the euro has spurred cross-border fi nancial transactions. The literature also fi nds evidence of regulatory arbitrage. Cross-borderbank fl ows are positively correlated with regu-latory restrictions in the source country and negatively correlated with restrictions in the recipient country (Aiyar, Calomiris, and Wie-ladek 2014; Houston, Lin, and Ma 2012). Moreover, gravity models applied to interna-tional fi nance suggest that the geographical and cultural distances between countries are also important factors explaining the volume of bank fl ows (Brüggemann, Kleinert, and Prieto 2011; Buch, Carstensen, and Schertler 2009; Heuchemer, Kleimeier, and Sander 2009).
As fi nancial globalization has increased, push factors have also become key drivers of capital fl ows. Push factors refer to conditions outside the recipient economy. These condi-tions can originate in one particular economy or in several economies (involving a whole region or group of economies). Decades ago, Calvo, Leiderman, and Reinhart (1993, 1996) pointed to global external factors as opposed to country-specifi c pull factors as the driving
to adopt good policies and better governance practices so they can attract foreign lending and to maintain those policies to avoid capital fl ight (Gourinchas and Jeanne 2009). Foreign capital also intensifi es competition among the different providers of fi nancing, thereby creat-ing a threat of “fl ight to quality” that can im-prove the effi ciency of the domestic banking system (Agenor 2003).
And yet, cross-border banking can also pose threats to fi nancial stability through fi -nancial spillovers or contagion. An inevitable consequence of international risk diversifi ca-tion is that global banks could cut foreign lending to accommodate adverse balance sheet conditions at home, among other rea-sons (Peek and Rosengren 2000). This is just part of the bargain; an economy open to in-ternational transactions benefi ts from more lending when times are good in the source economy, and it receives less when times are bad. For example, some banks in Western Europe cut back credit to their Eastern Euro-pean subsidiaries during the global fi nancial crisis (Popov and Udell 2012). Global banks’ balance sheets were severely affected by the crisis, and they reacted by pulling back from their international investments. Countries that relied heavily on foreign lending during the precrisis years were hit harder (Milesi-Ferretti and Tille 2011). Schnabl (2012) reveals how the 1998 Russian default crisis was trans-mitted to Peruvian banks by reduced cross-border lending to that country from global banks. According to Feyen and others (2014), credit growth in many countries is highly sen-sitive to cross-border banking shocks. Cross-border bank fl ows are also more volatile than other types of cross-border fl ows (Levchenko and Mauro 2007) and local lending by foreign affi liates (Buch and Goldberg 2014; De Haas and van Lelyveld 2004; García-Herrero and Martínez Pería 2007; McCauley, McGuire,and von Peter 2010; Peek and Rosengren 2000; Schnabl 2012).
Country-specifi c pull factors—such as macro economic conditions, sound institu-tions, and the nature of the regulatory frame-work—are important drivers of cross-border

GLOBAL FINANCIAL DEVELOPMENT REPORT 2017/2018 C R O S S - B O R D E R L E N D I N G B Y I N T E R N A T I O N A L B A N K S 85
of contagion during the global fi nancial crisis and the sovereign debt crisis in Europe also prompted some regulators around the world to attempt to ring-fence their banking sys-tems (Cerutti and Schmieder 2014; D’Hulster 2014; IMF 2015c).
The rest of this chapter focuses on three important developments that are shaping the present and future of cross-border banking and global banking more generally: the rise of the South, the substitution across markets, and the emergence of fi ntech. It begins by de-scribing the process of integrating the South economies into global fi nancial markets, with particular emphasis on their participation in cross-border bank fl ows. It then uses the ex-ample of the global fi nancial crisis to illus-trate how such a shock can be transmitted across borders and produce changes in the sources of fi nance at the global level, high-lighting some of the problems that arise when countries become fi nancially integrated. And it concludes by documenting how global banks are facing growing competition from new technology companies that are provid-ing alternative types of fi nancial services and pushing transformation in the fi nancial sys-tem as a whole.
THE RISE OF THE SOUTH
Several papers and reports have discussed the growing role of the South in the global bank-ing system.1 Typically, studies have looked at two different types of information: (1) the asset and liability banking positions across economies compiled by the Bank for Inter-national Settlements (BIS) and (2) the cross-border fl ows of syndicated loans provided by private companies. For bank claims, this chapter relies on BIS Locational Banking Sta-tistics data used by Broner and others (2017). These data capture all reported gross cross-border positions between any two economies transacted via the global banking system.2 The syndicated loan fl ows data from Thom-son Reuters’s Securities Data Corporation (SDC) Platinum database consist of direct cross-border lending through which a group
forces behind cross-border fl ows. As the world has become more fi nancially integrated, these global factors have gained importance over time, and cross-border fl ows have become more dependent on global fi nancial and mon-etary policy circumstances, generally linked to conditions in core fi nancial centers (Bruno and Shin 2015a, 2015b). The term global li-quidity, defi ned as ease of funding for global banks, has been used to determine how much global banks are willing to lend abroad (Ce-torelli and Goldberg 2011; Herrmann and Mihaljek 2013; IMF 2014; Landau 2013; Rey 2015). Empirical studies have commonly proxied global liquidity by bank leverage and health conditions (Avdjiev, Kuti, and Takats 2012; Bruno and Shin 2015a; Chui and oth-ers 2010; Düwel, Frey, and Lipponer 2011; Hoggarth, Mahadeva, and Martin 2010; Mc-Guire and Tarashev 2008). Although most studies typically focus on funding conditions in the United States, Cerutti, Claessens, and Ratnovski (2016) fi nd that cross-border bank fl ows are also driven by conditions in other fi nancial centers, in particular the euro area and the United Kingdom.
As the role of push factors has intensifi ed over time, countries have become more vul-nerable to foreign shocks, as witnessed during the global fi nancial crisis. In fact, global fac-tors were the main reasons behind the decline in cross-border fl ows during the crisis, as op-posed to fi nancial and economic conditions in recipient countries (Fratzscher 2012). In particular, the shock to some U.S. banking in-stitutions in 2008 was rapidly transmitted to the balance sheets of other global fi nancial in-stitutions, which reacted by deleveraging and retreating from their international activities. During the postcrisis years, global banks con-tinued to shrink from risk and reduce cross-border activities as regulators imposed new rules, such as Basel III, involving tighter capi-tal and liquidity requirements (the liquidity coverage ratio, LCR, and the net stable fund-ing ratio, NSFR), macroprudential policies, and stricter stress tests, among others (Claes-sens 2016). The realization that cross-border bank operations were an important channel

86 C R O S S - B O R D E R L E N D I N G B Y I N T E R N A T I O N A L B A N K S GLOBAL FINANCIAL DEVELOPMENT REPORT 2017/2018
integration for the average developing econ-omy over time (fi gure 3.1). In addition to the unilateral reduction of formal restrictions on international capital mobility (both on capital infl ows and outfl ows), developing economies have relied on other cooperative initiatives to boost their integration in global fi nan-cial markets. Some examples of such initia-tives are the ASEAN Comprehensive Invest-ment Agreement (ACIA), signed in 2009 by the Association of Southeast Asian Nations (ASEAN), the ASEAN Capital Market Fo-rum (ACMF), established in 2004; and the more than 4,000 bilateral investment treaties signed by South economies between 1990 and 2013.4 These fi nancial liberalization policies have promoted the integration of the South into the global fi nancial scene.5
Partly as a result, South economies have become increasingly connected with the rest of the world in terms of cross-border bank lending. Cross-border bank claims and syndi-cated loans to and from the South expanded the most rapidly from 2002 to 2014 (com-pared with North–North lending).6 Indeed, South–South lending has grown faster than North–North, North–South, and South–North lending. When considering cross-border bank claims, South–South lending grew from representing 5 percent of global claims in 2001 to 9 percent in 2014. As for syndicated loans, South–South lending grew from an average of 2 percent of total world lending in 1996–2001 to 6 percent in 2002–14. However, these shares are still small when compared with the volume of North–North lending, which accounted for 68 percent of world cross-border bank claims in 2014 and an average of 71 percent of world syndicated loans in 2002–14 (fi gure 3.2). Alternative analyses that exclude China and the largest 20 economies in the South re-veal that these trends are not dominated by these economies.7 As the South has gained weight in terms of value (intensive margin), the number of its bilateral fi nancial connec-tions has also expanded (extensive margin). Connections involving South economies have increased in all directions (North–South,
of fi nancial intermediaries provides funds to a single borrower. Recent studies estimate that, on average, syndicated loan exposures repre-sented up to a third of the total cross-border loan claims from 1995 to 2012 (Cerutti, Hale, and Minoiu 2015). However, these dif-ferent data sets are not directly comparable in terms of volume. Bank claims are stocks at a given point in time, whereas syndicated loans data refl ect fl ows based on transaction-level information.3 To offer a more complete pic-ture of the role of the South in the global fi -nancial system, this section provides evidence and discusses studies that use both types of data, which reveal two different but comple-mentary perspectives.
Since the 1990s, many developing econo-mies have undertaken signifi cant efforts to liberalize and expand the scope and depth of their fi nancial systems. A wide range of indicators shows better performance in de jure measures of fi nancial openness and
FIGURE 3.1 Restrictions to Capital Flows: Average across Economies of the South, 1990–2013
Sources: Chinn and Ito 2008; Fernández and others 2016; Kaminsky and Schmukler 2008; Quinn and Toyoda 2008.Note: This fi gure shows the average across economies of the South for several capital account and current account restriction indicators. All the indicators consider restrictions to both capital infl ows and outfl ows. The degree of restrictions is rescaled 0–1, where 0 means fully open and 1 means fully closed. The North comprises the G-7 economies and 15 other Western European economies. The South comprises the economies not included in the North. Offshore fi nancial centers are excluded from the sample.
Quinn and Toyoda 2008Kaminsky and Schmukler 2008
Chinn and Ito 2008Fernández and others 2016
0
0.1
1990 1992 1994 1996 1998 2000 2002 2004 2006 2008 2010 2012
0.2
0.3
0.4
0.5
0.6
0.7
0.8
0.9
1
Valu
e of
indi
cato
r

GLOBAL FINANCIAL DEVELOPMENT REPORT 2017/2018 C R O S S - B O R D E R L E N D I N G B Y I N T E R N A T I O N A L B A N K S 87
South.8 The remaining regions in the South are net capital importers, whereas the North stands as the major counterpart to these fl ows to the South and is thus a net creditor to the rest of the world (fi gure 3.3). Therefore, the EAP region is not a typical South region, and its lending patterns are more similar to those of the North, which could be interpreted as a manifestation of the persistent current ac-count surpluses run over the years by many economies in this region (Didier, Llovet, and Schmukler 2017).
South–North, and South–South), but the new South–South connections have expanded the fastest (map 3.1).
However, the South is not a homogeneous group; notable differences can be found across regions in their inter- and intraregional lend-ing patterns. Regarding interregional lend-ing, there is substantial heterogeneity in the net debtor-creditor positions with respect to the rest of the world. In particular, the East Asia and Pacifi c (EAP) region stands out as the only net capital exporter region in the
FIGURE 3.2 Direction of Cross-Border Bank Lending, Selected Years
Source: Broner and others 2017.Note: This fi gure shows the value of the stocks of cross-border bank claims scaled by worldwide cross-border bank claims and the value of fl ows of syndicated loans scaled by worldwide syndicated loans. Data are aggregated for all economies within a source region to all economies within a receiver region. For cross-border bank claims, end-of-the-year statistics are shown. For syndicated loans, the statistics are calculated year by year and then averaged over time. The North comprises the G-7 economies and 15 other Western European economies. The South comprises the economies not included in the North. Offshore fi nancial centers are excluded from the sample.
a. Cross-border bank claims
b. Cross-border syndicated loan flows
2001
71.65%10.02%
12.99%
5.35%
2014
67.50%13.67%
10.37%
8.46%
2002–14
71.13%
17.06%
6.31%5.51%
1996–2001
76.89%
17.36%
3.67% 2.07%
North–North North–South South–North South–South

88 C R O S S - B O R D E R L E N D I N G B Y I N T E R N A T I O N A L B A N K S GLOBAL FINANCIAL DEVELOPMENT REPORT 2017/2018
a. Cross-border bank claims, 2001 b. Cross-border bank claims, 2014
c. Cross-border syndicated loan fl ows, 1996–2001 d. Cross-border syndicated loan fl ows, 2002–14
Source: Broner and others 2017.Note: The maps show only the connections between South economies. The lines in each map represent the active connections—that is, the country pairs for which the stock or the fl ow is positive. For syndicated loans, the lines in each map represent any connection that was positive during at least one year of the period analyzed. The North comprises the G-7 economies and 15 other Western European economies. The South comprises the economies not included in the North. Offshore fi nancial centers are excluded from the sample.
the region’s fi nancial centers of Hong Kong SAR, China and Singapore. These three EAP economies accounted for 60 percent of EAP intra regional syndicated lending in 2001–14. An extreme case of regional clustering is the North, where intraregional syndicated loans captured about 76 percent of the North’s total cross-border syndicated lending during the same period (fi gure 3.4).
This period of increasing globalization was not monotonic—in fact, it came to a sudden halt during the global fi nancial crisis. A general view is that the crisis put an end to a trend of increasing fi nancial globaliza-tion, leading to a fragmentation of the global banking sector (The Economist 2013a). Economies reacted to the crisis by raising re-strictions to capital mobility to reduce conta-gion (fi gure 3.1). Cross-border bank claims
As for intraregional lending, EAP and MENA are the most fi nancially integrated regions in the South. On the one hand, there are regions such as South Asia (SAR) where intraregional syndicated loans only accounted on average for less than 1 percent of cross-border syndicated loans (intra- and interregional loans) in 2001–14. On the other hand, in the EAP and MENA regions, intraregional syndicated loans accounted on average for 19 and 16 percent of cross-bor-der loans, respectively. In the MENA region, intraregional syndicated loans were driven mainly by the economies in the Gulf Coop-eration Council, which originated about 90 percent of the total syndicated lending within the region in 2001–14 (Cortina, Ismail, and Schmukler 2016).9 In the EAP region, the largest intraregional lenders were China and
MAP 3.1 South–South Lending Connections

GLOBAL FINANCIAL DEVELOPMENT REPORT 2017/2018 C R O S S - B O R D E R L E N D I N G B Y I N T E R N A T I O N A L B A N K S 89
and South–South). Nevertheless, the fastest increase took place in South–South lend-ing, which quickly overtook its precrisis levels—see fi gures 3.5 and 3.6. Specifi cally,
declined from about $36 trillion in 2007 to $32 trillion in 2009, leading to a change in the nature of cross-border banking during the postcrisis period (Claessens 2016; IMF 2015c). The reduction in the exposure of banks in the North to some regions left a gap that has been fi lled in part by banks located in developing economies.
After the retrenchment in cross-border banking activity during the global fi nancial crisis, cross-border lending changed its com-position; in particular, South–South transac-tions grew the fastest, replacing the leading role of North–South lending in the precrisis years. The period before the crisis was char-acterized by fast growth in North–South lending. During 2003–07 North–South bank claims grew at an annual average rate of 19 percent (33 percent for North–South syndi-cated loans). However, the crisis led to a change in the global fi nancial scene. After the retrenchment in bank credit during 2008–09, cross-border lending transactions began to recover in almost all directions (North–North, North–South, South–North,
–100
–80
–60
–40
–20
0
20
40
60
80
100
East Asiaand Pacific
Latin Americaand the
Caribbean
Europe andCentral Asia
Middle Eastand
North Africa
South Asia Sub-SaharanAfrica
North
174
Valu
e, c
onst
ant 2
011
US$
(bill
ions
)
FIGURE 3.3 Average Net Syndicated Loan Outfl ows by Region, 2001–14
Source: SDC Platinum.Note: This graph shows the average value of net syndicated loan outfl ows to the rest of the world for the period 2001–14. Net outfl ows are calculated as the difference between the value of the fl ows that a region sends to the rest of the world and the value of the fl ows that a region receives from the rest of the world. The data do not account for intraregional fl ows. The North comprises the G-7 economies and 15 other Western European economies. The South comprises the economies not included in the North. Offshore fi nancial centers are excluded from the sample.
FIGURE 3.4 Average Share of Intraregional Syndicated Loans of Total Cross-Border Syndicated Loans, by Region, 2001–14
Source: SDC Platinum.Note: This fi gure shows the average share of intraregional cross-border syndicated loan fl ows in a region’s total cross-border syndicated loan fl ows for the period 2001–14. The North comprises the G-7 economies and 15 other Western European economies. The South comprises the economies not included in the North. Offshore fi nancial centers are excluded from the sample.
East Asia and Pacific
Latin America and the Caribbean
Europe and Central Asia
Middle East and North Africa
South Asia
Sub-Saharan Africa
North 76
0 2 4 6 8 10 12 14 16 18 20
Percent
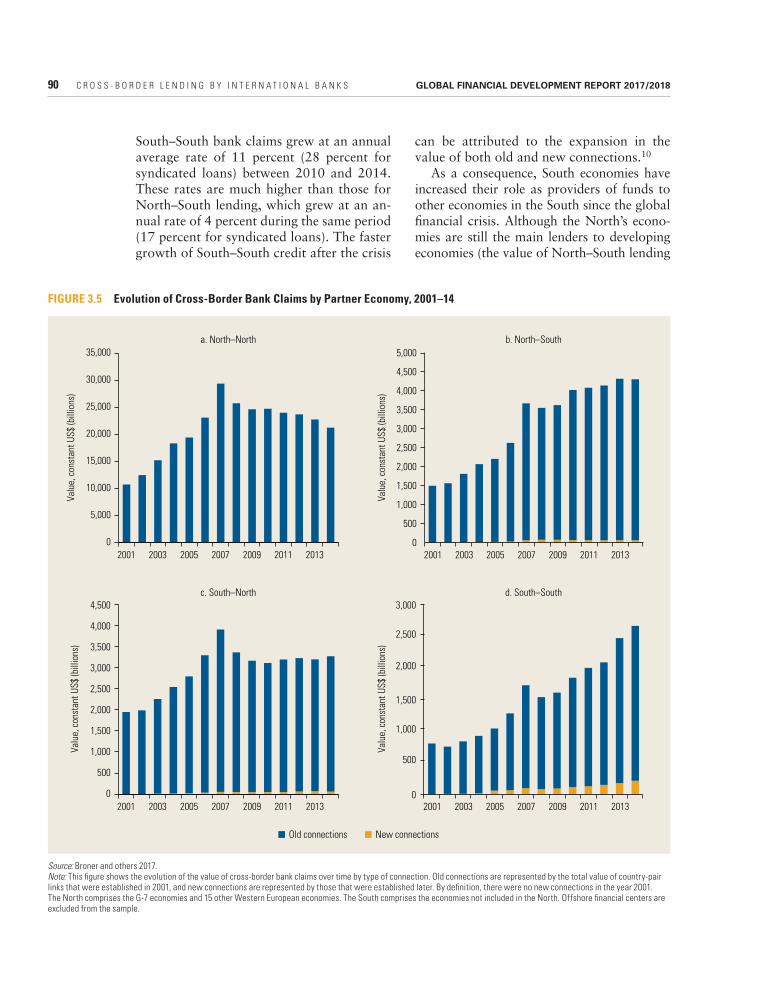
90 C R O S S - B O R D E R L E N D I N G B Y I N T E R N A T I O N A L B A N K S GLOBAL FINANCIAL DEVELOPMENT REPORT 2017/2018
can be attributed to the expansion in the value of both old and new connections.10
As a consequence, South economies have increased their role as providers of funds to other economies in the South since the global fi nancial crisis. Although the North’s econo-mies are still the main lenders to developing economies (the value of North–South lending
South–South bank claims grew at an annual average rate of 11 percent (28 percent for syndicated loans) between 2010 and 2014. These rates are much higher than those for North–South lending, which grew at an an-nual rate of 4 percent during the same period (17 percent for syndicated loans). The faster growth of South–South credit after the crisis
FIGURE 3.5 Evolution of Cross-Border Bank Claims by Partner Economy, 2001–14
Source: Broner and others 2017.Note: This fi gure shows the evolution of the value of cross-border bank claims over time by type of connection. Old connections are represented by the total value of country-pair links that were established in 2001, and new connections are represented by those that were established later. By defi nition, there were no new connections in the year 2001. The North comprises the G-7 economies and 15 other Western European economies. The South comprises the economies not included in the North. Offshore fi nancial centers are excluded from the sample.
a. North–North
c. South–North
b. North–South
d. South–South
0
500
1,000
1,500
2,000
2,500
3,000
3,500
4,000
4,500
5,000
2001 2003 2005 2007 2009 2011 2013
0
500
1,000
1,500
2,000
2,500
3,000
3,500
4,000
4,500
2001 2003 2005 2007 2009 2011 2013
0
5,000
10,000
15,000
20,000
25,000
30,000
35,000
2001 2003 2005 2007 2009 2011 2013
Valu
e, c
onst
ant U
S$ (b
illio
ns)
Valu
e, c
onst
ant U
S$ (b
illio
ns)
Valu
e, c
onst
ant U
S$ (b
illio
ns)
Valu
e, c
onst
ant U
S$ (b
illio
ns)
0
500
1,000
1,500
2,000
2,500
3,000
2001 2003 2005 2007 2009 2011 2013
Old connections New connections

GLOBAL FINANCIAL DEVELOPMENT REPORT 2017/2018 C R O S S - B O R D E R L E N D I N G B Y I N T E R N A T I O N A L B A N K S 91
increased from 31 percent in 2009 to 38 per-cent in 2014. The same pattern is observed for syndicated loans, where the South’s shares grew from 26 percent in 2009 to 36 percent in 2014. However, this trend has been domi-nated by the EAP region, which accounts for the bulk of South–South transactions. The participation of EAP as a lender of syndicated
is still larger than that of South–South lend-ing), their participation in cross-border lend-ing to the South has decreased over time, giving way to economies in the South as providers of funds (fi gure 3.7). This increas-ing trend of the South accelerated after the crisis. The share of South economies in cross-border bank credit channeled to the South
FIGURE 3.6 Evolution of Cross-Border Syndicated Loan Flows by Partner Economy, 1996–2014
Source: Broner and others 2017.Note: This fi gure shows the evolution of the value of syndicated loan fl ows over time by type of connection. Old connections are represented by the total value of country-pair links that were established during the period 1996–2001, and new connections are represented by those that were established later. By defi nition, these were no new connections in the years 1996–2001. The North comprises the G-7 economies and 15 other Western European economies. The South comprises the economies not included in the North. Offshore fi nancial centers are excluded from the sample.
Valu
e, c
onst
ant U
S$ (b
illio
ns)
Valu
e, c
onst
ant U
S$ (b
illio
ns)
Valu
e, c
onst
ant U
S$ (b
illio
ns)
Valu
e, c
onst
ant U
S$ (b
illio
ns)
Old connections New connections
0
200
400
600
800
1,000
1,200
1,400
1,600
1,800
2,000
0
20
40
60
80
100
120
140
160
180
1996 1998 2000 2002 2004 2006 2008 2010 2012 2014
0
100
200
300
400
500
600
0
20
40
60
80
100
120
140
160
180
200
1996 1998 2000 2002 2004 2006 2008 2010 2012 2014
1996 1998 2000 2002 2004 2006 2008 2010 2012 2014 1996 1998 2000 2002 2004 2006 2008 2010 2012 2014
a. North–North
c. South–North
b. North–South
d. South–South

92 C R O S S - B O R D E R L E N D I N G B Y I N T E R N A T I O N A L B A N K S GLOBAL FINANCIAL DEVELOPMENT REPORT 2017/2018
percent, respectively, between the precrisis and postcrisis periods.
The rise of the South in global banking is part of a broader trend involving different types of cross-border fi nancial transactions. Broner and others (2017) document that economies in the South have been gaining market shares in global cross-border port folio investments and foreign direct investment (FDI) as well. During 2001–12, South–South portfolio investments increased from $93 billion to $1,067 billion, and FDI increased from $518 billion to $2,845 billion (box 3.1).
The increasing presence of the South in global fi nancial transactions has been ac-companied by its growing infl uence in in-ternational trade. Although the theoretical literature is inconclusive about the relation-ship between trade and capital fl ows, em-pirical studies seem to support the idea of complementarity between them. A number of researchers have used gravity models to document that country fi nancial investments are strongly biased toward trading partners (Aviat and Coeurdacier 2007; Dailami, Kur-lat, and Lim 2012; Daude and Fratzscher 2008; De Santis and Gerard 2009; Forbes 2010; Lane and Milesi-Ferretti 2008; Portes and Rey 2005). Among the channels relating
loans to South economies after the global fi -nancial crisis more than doubled its precrisis level, originating on average 25 percent of the total cross-border syndicated loans to the South during 2009–14, up from 12 percent during 2002–07.
An important part of the expansion in South–South bank credit since the global fi -nancial crisis has been associated with a trend toward regionalization. Although both inter- and intraregional lending have played a role in the expansion of South–South syndicated lending since the crisis, intraregional lending has dominated this trend. In particular, in-traregional syndicated lending accounted on average for 75 percent of South–South lend-ing during 2010–14, up from 70 percent dur-ing 2003–07. This pattern held across most South regions, except for Latin America and the Caribbean (LAC) and MENA. For ex-ample, EAP’s intraregional syndicated lending accounted for 78 percent of total EAP lend-ing to the South during 2010–14, up from 71 percent during 2003–07.11 The same applies to the Europe and Central Asia (ECA), Sub-Saharan Africa (SSA), and South Asia (SAR) regions, where the share of intraregional syn-dicated lending increased from 81 to 89 per-cent, from 1 to 6 percent, and from 26 to 67
a. Cross-border bank claims, 2001–14 b. Cross-border syndicated loan flows, 1996–2014
0102030405060708090
100
2001 2003 2005 2007 2009 2011 2013
Perc
ent
1996 1998 2000 2002 2004 2006 2008 2010 2012 2014
North South
0102030405060708090
100
Perc
ent
FIGURE 3.7 Share of Lending to the South from the North and the South
Sources: Bank for International Settlements Locational Banking Statistics and SDC Platinum.Note: This fi gure shows the role of economies in the North and South as providers of funds to the South. The North comprises the G-7 economies and 15 other Western European economies. The South comprises the economies not included in the North. Offshore fi nancial centers are excluded from the sample.

GLOBAL FINANCIAL DEVELOPMENT REPORT 2017/2018 C R O S S - B O R D E R L E N D I N G B Y I N T E R N A T I O N A L B A N K S 93
BOX 3.1 The Big Sur: Beyond Banking
In a recent paper, Broner and others (2017) use bilateral data on international investments to docu-ment the importance of South economies in cross-border portfolio investments, bank credit, and for-eign direct investment (FDI). They show that the South has captured an increasingly sizable share of all types of financial transactions. Although the North still accounts for a signifi cant share of international fi nancial activity, the South has been growing faster than the North, in particular South–North and South–South investments. They also fi nd that the expansion of the South, relative to the North, accelerated in the aftermath of the global fi nancial crisis.
The authors argue that the faster expansion of the South in cross-border fi nancial transactions is only partially explained by the faster growth of the South’s gross domestic product (GDP). Results show
that the South still expands faster than the North in general, although at a more moderate rate when investments are scaled by GDP.
The authors report the growth of the South not only in the value of cross-border financial invest-ments but also in the number of fi nancial connec-tions (number of partners). More South economies are becoming connected with each other and with the North.
The patterns found in cross-border bank credit are comparable to those in portfolio holdings and FDI. In particular, the authors report that the share of South–South FDI in the world’s total FDI grew from 8 percent in 2001 to 12 percent in 2012. More impressive was the growth exhibited by South–South cross-border portfolio investments, whose share grew from about 1 percent of total cross-border portfolio holdings in 2001 to 3 percent in 2014 (fi gure B3.1.1).
(box continued next page)
FIGURE B3.1.1 Direction of Foreign Direct Investment and Cross-Border Portfolio Investments, Selected Years
Source: Broner and others 2017.Note: This fi gure shows the value of the stocks of cross-border investments scaled by total cross-border world investments for FDI and portfolio investments. Data are aggregated for all economies within a source region to all economies within a receiver region. End-of-the-year statistics are shown. The North comprises the G-7 economies and 15 other Western European economies. The South comprises the economies not included in the North. Offshore fi nancial centers are excluded from the sample.
71.72%
17.14%
3.34%
a. FDI2001 2012
2001 2014b. Cross-border portfolio investments
7.79%
60.12%22.37%
5.68% 11.83%
87.67%
7.88%
3.51% 0.94%
77.98%
13.20%
5.57%3.25%
North–North North–South South–North South–South

94 C R O S S - B O R D E R L E N D I N G B Y I N T E R N A T I O N A L B A N K S GLOBAL FINANCIAL DEVELOPMENT REPORT 2017/2018
economies are becoming more connected in trade, one should expect a deepening of their fi nancial connections as well. Hanson (2012) and Iapadre and Tajoli (2014) report how developing economies have been capturing an increasing fraction of international trade
cross-border trade and fi nance, there is the role of banks in reducing information asym-metries between trading parties located in different jurisdictions (box 3.2) and the use of trade as collateral to relax borrowing constraints. Thus to the extent that South
BOX 3.1 The Big Sur: Beyond Banking (continued)
Like South–South investments, North–South and South–North investments have presented an upward sloping trend, although they have been growing at a slower pace. Nevertheless, developing economies do not account for much of global fi nancial transactions. The South’s fi nancial investment shares are still small
when compared with those of North–North invest-ments. As a benchmark, North–North investments accounted for 60 percent of global FDI in 2012, fall-ing from 72 percent in 2001, and 78 percent of global cross-border portfolio investments in 2014, falling from about 88 percent in 2001.
BOX 3.2 Bank-Intermediated Trade Finance
Banks facilitate international trade by generating trade credit, providing liquid working capital loans, and reducing risk in payment settlements for import-ers and exporters. Bank-intermediated fi nance sup-ported between $6.5 and $8 trillion of international trade in 2011, or about one-third of the world aggre-gate (CGFS 2014). Within this subset, $2 trillion was intermediated by 21 large global banks participating in the International Chamber of Commerce (ICC) Trade Register—a volume proportionate to their combined asset sizes in the global banking indus-try. Nonbank trade fi nance mostly consists of inter-fi rm credit supplied to factoring companies through open account or cash-in-advance arrangements and receivable discounting. Within the class of fi nancial institutions, banks provide the bulk of trade-related fi nancial services; private insurance companies, for example, covered about $1.7 trillion, or 9 percent, of global merchandise trade in 2011.
Banks finance importers and exporters and reduce their counterparty risks through a multitude of products, which primarily include letters of credit/guarantee, documentary collections, and loans in various forms. A letter of credit, for example, is issued by a bank on the buyer’s behalf as an obliga-tion to pay the exporter upon satisfaction of speci-fi ed terms. More recently, industrial innovations have
enabled banks to automate payments and fi nancing across global supply chains for larger retail and manufacturing companies (ICC 2016), as well as to distribute trade-related exposure through securitiza-tion and loan sales to third-party, nonbank investors (CGFS 2014).
Among regions, there are important differences in the utilization of bank-intermediated trade fi nance. In 2011 the Asia-Pacifi c economies, making up 36 per-cent of global trade in the aggregate, received more than half of bank trade fi nancial fl ows, according to the Committee on the Global Financial System (CGFS 2014). By contrast, European economies, which are more dependent on trade credit insurance, shared a quarter of global bank trade fi nance while generating more than two-fi fths of global trade.a Bank-interme-diated trade fi nance intensity is found to be higher for exports to countries that have lower levels of fi nan-cial development or weaker legal frameworks, or are farther away (Niepmann and Schmidt-Eisenlohr 2013). However, as in any other type of cross-border fl ow, trade fi nance can also be a channel of regula-tory arbitrage in contexts with interest rate or foreign exchange controls or with macroprudential policy differences (Reinhardt and Sowerbutts 2015).
Historically, severe contractions in the supply of trade finance have amplified economic downturns
(box continued next page)

GLOBAL FINANCIAL DEVELOPMENT REPORT 2017/2018 C R O S S - B O R D E R L E N D I N G B Y I N T E R N A T I O N A L B A N K S 95
Sources: International Monetary Fund and national data adapted from CGFS 2014.Note: The gray area indicates 2008:Q2–2009:Q2. The series for Italy includes export and import guarantees, which are off–balance sheet items.
BOX 3.2 Bank-Intermediated Trade Finance (continued)
in emerging markets, notably during the 1997 Asian financial crisis (IMF 2003). At the height of the global fi nancial crisis in 2007–09, trade fi nance fl ows declined sharply in the quarters following 2008:Q3, rebounding quickly as trade regained its pace.b As fi gure B3.2.1 illustrates, banks in China (including Hong Kong SAR, China), India, and the Repub-lic of Korea led the recovery in emerging markets, while in developed economies U.S. banks and their global affi liates overtook the retrenchment of their German and Italian counterparts in the provision of trade fi nance. For the countries for which data are available, statistical analysis indicates that the reduc-tion in the supply of trade fi nance accounted for up to 20 percent of the decrease in global trade during the crisis. This effect was secondary compared with that from weakened real activities and reduced prices (CGFS 2014), but nevertheless enormous economi-cally in view of the $3.6 trillion decline in trade.
The postcrisis resilience of bank-intermediated trade finance could be attributed to three factors. First, the general short span of credits and loans—typically a window of 90–120 days during which merchandise receipt and settlement clearance can be processed—means that banks can adjust trade fi nance exposures relatively quickly, depending on their financial conditions.c Second, banks face an inherently lower default risk in trade finance con-tracts compared with that from other loan products because the merchandise is highly collateralized and transported under standardized procedures. Third, because of the risk levels in trade fi nance contracts, pricing conditions have generally been favorable for banks (CGFS 2014), although most recently this is being eroded by profuse interbank liquidity, intensi-fying competition from new market participants, as well as stricter regulatory compliance requirements (Starnes, Alexander, and Kurdyla 2016).
FIGURE B3.2.1 Bank-Intermediated Trade Finance in Emerging and Advanced Economies: Quarterly Trends, 2005–13
US$
(bill
ions
)
US$
(bill
ions
)
US$
(bill
ions
)
0
100
200
300
400
02005 2006 2007 2008 2009 2010 2011 2012 2013
30
60
90
120
a. Emerging economies
BrazilHong Kong SAR, China
India
Korea, Rep.China (right axis)
0
30
60
90
120b. Advanced economies
ItalySpainAustralia
GermanyFranceUnited States
2005 2006 2007 2008 2009 2010 2011 2012 2013
a. The CGFS (2014) report is based on a combination of data sources, including International Monetary Fund, ICC Trade Registry, SWIFT, and national accounts. The regional share of bank-intermediated trade fi nance is estimated to be between 5 and 10 percent for the Middle East and North America, and about 5 percent for Africa and Latin America.b. Statistics tracking trade fi nance volumes in Australia, Brazil, France, Germany, Hong Kong SAR, China, India, Italy, Republic of Korea, Mexico, Spain, and the United States indicated a more than 50 percent decline, from a quarterly aggregate of $850 billion in 2008:Q3 to less than $400 billion in 2009:Q1.c. Less than 3 percent of bank trade fi nance exposure is medium to long term, according to Dealogic Loanware, a commercial data source.
Sources: International Monetary Fund; and national data adapted from CGFS 2014.Note: The gray area indicates the global fi nancial crisis period. The series for Italy includes export and import guarantees, which are off–balance sheet items.

96 C R O S S - B O R D E R L E N D I N G B Y I N T E R N A T I O N A L B A N K S GLOBAL FINANCIAL DEVELOPMENT REPORT 2017/2018
to save, and their governments were incapa-ble of guaranteeing their survival (Buiter and Sibert 2011).12
Beyond the typical benefi ts of fi nancial integration, South–South banking may pro-mote the fi nancial inclusion of previously un-derserved segments. As with any cross-border fi nancial connection, greater South–South connectivity may allow developing econo-mies to benefi t from fi nancial diversifi cation, more effi cient resource allocation, access to a wider range of investment projects and fund-ing sources, technology spillovers, and better governance.13 It may also promote the de-velopment of the domestic fi nancial systems through increased competition.14 But the recent trends in South–South banking may also foster fi nancial inclusion. Because banks tend to be more familiar with the institutions, language, and culture of economies located within their region, most of South–South credit occurs within regions. Consequently, banks in the South may tend to be better at collecting and managing information when serving small and less informationally trans-parent segments, such as SMEs and house-holds, relative to banks from the North. Furthermore, increasing regionalization may facilitate cross-country regulatory and super-visory coordination, as this tends to be easier to achieve at the regional level.
However, the latest developments in cross-border banking may pose additional risks. Increasing regionalization in the South may limit risk-sharing, which would imply a larger exposure of a country to regional shocks and a faster spread of foreign shocks once they hit one of the countries in the region. More-over, South–South bank connections may generate fi nancial instability stemming from a laxer regulatory and supervisory environ-ment in the South relative to the North. In other words, to the extent that fi nancial in-stitutions in the South are less tightly regu-lated than those in the North, the rise of the South as a provider of cross-border lending can negatively affect the stability of the over-all fi nancial system (Klomp and De Haan 2014). In line with this argument, Claessens and van Horen (2016) and Mehigan (2016)
over time and are changing global trading patterns. In particular, the South’s participa-tion (South–North and South–South transac-tions) in global exports rose from 27 percent in 1990 to 53 percent in 2014. Although the growth of the South is apparent in North–South, South–North, and South–South direc-tions, trade fl ows between developing econ-omies (South–South) are the ones that have increased the fastest. The participation of South–South exports in total world exports rose from 9 percent in 1990 to 31 percent in 2014. A similar expansion, though on a mi-nor scale, has been reported by North–South exports (from 16 percent to 19 percent) and South–North exports (from 18 percent to 22 percent). In stark contrast with these trends, the share of North–North exports fell by 50 percent during the same period.
An important aspect of the rise of the South in international fi nance and trade is as-sociated with the fast growth of its gross do-mestic product (GDP). Since the early 1990s, economies in the South have been gaining space in the global economic landscape. In fact, the GDP of the South, which was 24 percent of global GDP in 1990, almost dou-bled, to about 46 percent in 2014. However, South–South bank lending and fi nancial in-vestments still increased after accounting for the growth in the South’s real economic activ-ity, albeit at a slower pace. In fact, once GDP growth is taken into account, South–South bank claims and FDI are no longer growing faster than North–North and North–South transactions.
The multidimensional nature of the rise of the South in the global economy helps to reduce concerns about a disproportionate growth of its banking system. In other words, the more prominent role of the South in the global banking system seems to be inevitable because of the South’s rapid expansion in real activity and its further diversifi ed fi nancial sector, unlike in, for example, Iceland and Ire-land. The banking systems of these countries grew too fast, and the authorities could not respond with their own resources when the global fi nancial crisis struck. By that time, Ice-land’s and Ireland’s banks had become too big

GLOBAL FINANCIAL DEVELOPMENT REPORT 2017/2018 C R O S S - B O R D E R L E N D I N G B Y I N T E R N A T I O N A L B A N K S 97
cross-border type. In particular, about 43 percent of the funds to high-income countries and 86 percent to developing countries were originated overseas during 1991–2007. Banks in high-income countries were at the forefront of not only the cross-border lending to other high-income borrowers, but also most of the fl ows to developing countries. Western Euro-pean banks alone intermediated about 53 per-cent of the cross-border loans to developing nations. The second-largest lender to devel-oping countries was the United States, which originated about 20 percent of cross-border loans.
However, the global fi nancial crisis hit global banks in the developed world espe-cially hard, and these banks reacted by re-ducing their lending activities worldwide. Specifi cally, the total volume of syndicated loans issued by fi rms in high-income coun-tries declined by about 62 percent from 2007 to 2009 (fi gure 3.8). Developing coun-tries experienced a lower retrenchment in loan fi nancing, with a reduction of about 55 percent during the same period. New loan fi nancing declined relatively more in high-income countries because the banking shock
argue that the regulatory framework prevail-ing in the lender country is correlated with loan growth in the borrower country, fi nding that foreign banks from less regulated coun-tries could amplify credit booms in borrower countries. Because it is not possible for policy makers in the borrower countries to regulate fi nancial institutions in the lender countries, their policy agenda has moved toward the use of macroprudential policies to supervise and manage cross-border credit.
SUBSTITUTION EFFECTS DURING THE GLOBAL FINANCIAL CRISIS
Global banks rapidly expanded their lend-ing activities abroad before the global fi nan-cial crisis, particularly during the 1990s and early 2000s. Between 1991 and 2007, the annual volume of syndicated loan issuances by nonfi nancial corporations increased more than seven times in high-income countries and more than eight times in developing ones (fi gure 3.8).15 Following the general trend of increasing globalization, a signifi cant part of the loan fl ows over this period were of the
FIGURE 3.8 Total Amount Raised in Syndicated Loan Markets by High-Income and Developing Countries, 1991–2014
Source: SDC Platinum.Note: This fi gure displays the aggregate amount raised per year in syndicated loan markets by high-income (panel a) and developing (panel b) countries. It also shows (right axis) the share of the total volume lent in the form of cross-border loans. Only nonfi nancial sector issues are included.
0
10
20
30
40
50
60
70
80
90
100
0
1991
1992
1994
1996
1998
2000
2002
2004
2006
2008
2010
2012
2014
Tota
l loa
ns, 2
011
US$
(bill
ions
)
500
1,000
1,500
2,000
2,500
3,000
3,500
4,000a. High-income countries b. Developing countries
Shar
e of
tota
l (%
)
Tota
l loa
ns, 2
011
US$
(bill
ions
)
Shar
e of
tota
l (%
)
Total syndicated loans (left axis) Cross-border syndicated loans (right axis)
1991
1992
1994
1996
1998
2000
2002
2004
2006
2008
2010
2012
2014
0
10
20
30
40
50
60
70
80
90
100
0
50
100
150
200
250
300
350
400

98 C R O S S - B O R D E R L E N D I N G B Y I N T E R N A T I O N A L B A N K S GLOBAL FINANCIAL DEVELOPMENT REPORT 2017/2018
Although the shock to global banking in high-income economies was largely transmit-ted to the developing world through the col-lapse in cross-border lending, recent research suggests that a larger foreign bank presence in borrowing countries can attenuate the transmission mechanism of these types of shocks (box 3.3).
Partially compensating for the cross-bordercollapse, the issuance of domestic loans in developing countries increased during the crisis. The tightening of lending standards
mainly affected fi nancial institutions located in the global fi nancial centers—the United States and Western Europe. As a result, both domestic and cross-border bank fl ows declined in high-income countries, whereas only cross-border fl ows did so in develop-ing countries. In fact, for cross-border loans alone, developing countries showed a larger decline than high-income countries. Between 2007 and 2009, cross-border loans to high-income countries declined by 64 percent, and to developing countries by 72 percent.
BOX 3.3 Foreign Banks and the International Transmission of Monetary Policy
Since the fi nancial crisis, academics and policy mak-ers have voiced concerns that monetary policies pur-sued by lending countries can have negative spillover effects on the fi nancial stability of emerging markets (Fischer 2014; Rajan 2014; Rey 2015). Consistent with this concern, recent studies have found evidence of the international transmission of monetary policy through its effect on the aggregate supply of cross-border loans. Using a VAR framework, Bruno and Shin (2015a) show that a contractionary shock to U.S. monetary policy leads to a decrease in cross-bor-der bank lending. Studies using microdata on lend-ing similarly fi nd evidence of the international trans-mission of monetary policy to borrowing countries (see, for example, Morais and others, forthcoming). Overall, the picture that emerges from these studies is that international banks are frequently sources of fi nancial instability because they transmit monetary policy shocks to borrowing economies.
Demirgüç-Kunt, Horváth, and Huizinga (2017) provide evidence of the role of foreign banks in the monetary transmission process that qualifi es this pic-ture. Using data on syndicated loans to 124 countries over the period 1995–2015, they fi nd that a greater foreign bank presence in a borrower country reduces the impact of changes in the lender country’s mon-etary policy interest rates on the provision of cross-border loans. Specifi cally, column (1) of table B3.3.1 shows that the volume of cross-border loans is related negatively to the policy interest rate, but positively to an interaction of the policy interest rate with the
foreign bank ownership variable, which measures the fraction of borrower country banking assets that are foreign-owned. This fi nding implies that a reduction in the lender country’s policy interest rate increases the volume of cross-border loans less if the foreign banking presence is greater. As shown in columns (2) and (3) of table B3.3.1, this result is robust to controlling for the borrower country’s level of eco-nomic development, as measured by its gross domes-tic product (GDP) per capita, and alternatively to the borrower country’s level of fi nancial development, as measured by its private credit provision relative to GDP. It is also robust to a range of borrower country and lender country policy variables, including bank regulatory variables.
Foreign bank presence can affect the cross-border loan transmission channel of monetary policy through a lender bank’s own experience and local presence in the borrower country, or alternatively through the role played by other foreign banks in the borrower country, by improving the quantity and quality of information available to potential new borrowers. Demirgüç-Kunt, Horváth, and Huizinga (2017) fi nd evidence that the impact of a foreign bank presence on the transmission of lender country monetary policy through cross-border syndicated loans results not only from the lender bank having a subsidiary in the bor-rower country itself but also from other foreign banks having subsidiaries in the borrower country.
The finding that the impact of lender country interest rate changes on the cross-border loan supply
(box continued next page)

GLOBAL FINANCIAL DEVELOPMENT REPORT 2017/2018 C R O S S - B O R D E R L E N D I N G B Y I N T E R N A T I O N A L B A N K S 99
Source: Demirgüç-Kunt, Horváth, and Huizinga 2017.Note: The dependent variable is volume, which is the natural logarithm of the U.S. dollar amount of a bank’s share of a syndicated loan, aggregated at the borrower-lender-time level. IR is the central bank policy rate or the discount rate in the lender country; foreign-owned banks (borrower) is the fraction of the banking system’s assets in the borrower country that is foreign-owned (in percentage points); GDP per capita (borrower) is the GDP per capita in the borrower country; private credit (borrower) is the private credit relative to GDP in the borrower country; QE is a dummy variable indicating that a quantitative easing program is in place in the lender country; CPI is the annual percentage change in the consumer price index in the lender coun-try; GDP growth is the annual percentage change of real GDP in the lender country; FE = fi xed effects. The sample includes nonfi nancial borrowers. The sample period is from January 1995 to March 2015. Standard errors are clustered at the lender country and borrower country levels and are reported in parentheses.* = 10 percent, ** = 5 percent, *** = 1 percent.
BOX 3.3 Foreign Banks and the International Transmission of Monetary Policy (continued)
of international banks is reduced by foreign bank presence in the borrower country could well refl ect the fact that international banks can mix local and international funding for their loans. Consistent with this, Demirgüç-Kunt, Horváth, and Huizinga (2017) fi nd that the mitigating impact of foreign bank pres-ence on the international transmission of monetary policy to the cross-border loan supply is weaker if the borrower country’s monetary policy interest rate is higher because it is likely to reduce the ability of an international bank to substitute borrower country funding for lender country funding.
The evidence of a mitigating impact of foreign bank presence on the transmission of monetary policy shocks through the international syndicated loan market implies that international banks cannot be characterized simply as sources of credit instabil-ity in borrower countries that transmit international monetary policy changes in the form of international credit supply shocks. It also suggests that countries that restrict foreign bank presence could benefi t from a more stable supply of cross-border credit by allow-ing foreign bank entry.
TABLE B3.3.1 Monetary Policy Interest Rates and the Cross-Border Syndicated Loan Volume
(1) (2) (3)Variable Volume Volume Volume
IR –1.781*** –2.930*** –2.276**
(0.605) (0.716) (0.914)
IR * foreign-owned banks (borrower) 0.0527*** 0.0563*** 0.0435**
(0.0144) (0.0177) (0.0169)
IR * GDP per capita (borrower) 0.0000450*
(0.0000250)
IR * private credit (borrower) 0.0112
(0.00869)
QE –0.0729*** –0.0668*** –0.0743***
(0.0224) (0.0226) (0.0238)
CPI 0.00671 0.00601 0.00476
(0.00449) (0.00407) (0.00401)
GDP growth 0.00286* 0.00279* 0.00327**
(0.00165) (0.00166) (0.00156)
No. of observations 66,276 64,771 60,034
Adjusted R2 0.803 0.802 0.801
Borrower*time FE Yes Yes Yes
Lender FE Yes Yes Yes

100 C R O S S - B O R D E R L E N D I N G B Y I N T E R N A T I O N A L B A N K S GLOBAL FINANCIAL DEVELOPMENT REPORT 2017/2018
2009, which partially compensated for the decline in cross-border infl ows. However, it was mainly in Asian economies that domes-tic lenders seem to have played a compensat-ing role (table 3.1).
Amid the global banking retrenchment during the global fi nancial crisis, the volume of bond issuances experienced an increase worldwide. As the volume of cross-borderloans collapsed during the crisis, bond markets
and the diffi culties in obtaining interna-tional bank fi nance were soon passed on to nonfi nancial corporations, which, in some countries, seem to have reacted by changing their debt market composition. For fi rms in developing countries, a fi rst option was tap-ping domestic banks instead of the reced-ing international ones (fi gure 3.9). Indeed, the aggregate issuance of domestic loans increased by 44 percent between 2007 and
FIGURE 3.9 Volume and Composition of Loan Issuance over Time, 2003–14
Source: SDC Platinum.Note: This fi gure displays the aggregate amount raised per year in domestic and cross-border syndicated loan markets by high-income and developing countries.
Shar
e of
tota
l loa
ns (%
)0
10
20
30
40
50
60
70
80
90
100
0
10
20
30
40
50
60
70
80
90
100
2003 2004 2005 2006 2007 2008 2009 2010 2011 2012 2013 2014
2003 2004 2005 2006 2007 2008 2009 2010 2011 2012 2013 2014
a. High-income countries
Composition
b. Developing countries
Composition
Shar
e of
tota
l loa
ns (%
)
2003 2004 2005 2006 2007 2008 2009 2010 2011 2012 2013 2014
Volume
Volu
me,
201
1 US
$ (b
illio
ns)
0
50
100
150
200
250
300
350
400
02003 2004 2005 2006 2007 2008 2009 2010 2011 2012 2013 2014
500
1,000
1,500
2,000
2,500
3,000
3,500
4,000Volume
Volu
me,
201
1 US
$ (b
illio
ns)
Cross-border loans Domestic loans Total loans

GLOBAL FINANCIAL DEVELOPMENT REPORT 2017/2018 C R O S S - B O R D E R L E N D I N G B Y I N T E R N A T I O N A L B A N K S 101
volume) for the collapse of syndicated loans in high-income and developing countries. Im-portantly, the use of corporate bonds rose in most regions (table 3.1). In this sense, bond markets fulfi lled to some degree the “spare
expanded (fi gure 3.10). In particular, bond issuance increased by 48 percent in high-income countries and by 106 percent in de-veloping countries between 2007 and 2009. This expansion partially compensated (in
TABLE 3.1 Debt Issuance Change during the Global Financial Crisis
Total debt Corporate bonds Syndicated loans
RegionΔ%
total debt
Δ%corporate
bonds
Δ% syndicated
loans
Δ% domestic
bonds
Δ%cross-border bonds
Δ% domestic
loans
Δ%cross-border loans
High-income countries –38 16 –52 7 31 –50 –54
Developing countries –22 56 –48 135 –38 33 –62
East Asia and Pacifi c 10 68 –12 89 0.4 10 –48
Europe and Central Asia –39 44 –55 43 45 –44 –59
Latin America and the Caribbean –34 20 –55 55 –39 –26 –56
Middle East and North Africa –61 –57 –62 59 –64 –44 –65
North America –46 20 –58 9 20 –62 –46
South Asia 26 26 33 158 –78 137 –68
Sub-Saharan Africa –51 –87 –37 –64 –90 –25 –39
Source: SDC Platinum.Note: Table shows the debt issuance change between the global fi nancial crisis (2008–09) and 2007 (peak before the crisis). Each column shows changes within every single market. High-income countries are included in the subgroups according to their geographical location. The region classifi cation is available at https://datahelpdesk.worldbank.org/knowledgebase/articles/906519-world-bank-country-and-lending-groups.
FIGURE 3.10 Composition of Debt Issuance over Time, 2003–14
Source: SDC Platinum.Note: This fi gure displays the share of funds raised through corporate bond and syndicated loan markets over the total amount raised in debt markets by high-income (panel A) and developing countries (panel B).
2003 2004 2005 2006 2007 2008 2009 2010 2011 2012 2013 2014 2003 2004 2005 2006 2007 2008 2009 2010 2011 2012 2013 2014
Corporate bonds Syndicated loans
a. High-income countries
Shar
e of
tota
l deb
t (%
)
0
10
20
30
40
50
60
70
80
90
100
b. Developing countries
Shar
e of
tota
l deb
t (%
)
0
10
20
30
40
50
60
70
80
90
100

102 C R O S S - B O R D E R L E N D I N G B Y I N T E R N A T I O N A L B A N K S GLOBAL FINANCIAL DEVELOPMENT REPORT 2017/2018
of fi rm-level substitution at the global level (beyond the United States) not only between bonds and loans but also between domestic and international markets.
The reported aggregate changes in debt composition during the global fi nancial cri-sis took place at the country and fi rm levels (within fi rms). By using discrete logit models with country and fi rm fi xed effects, Cortina, Didier, and Schmukler (2016) analyze fi rms’ decisions to issue bonds versus syndicated loans in domestic and international markets during crises versus normal times.17 The logit estimates indicate that the issuance of cor-porate bonds relative to syndicated loans in-creased during the crisis within fi rms in both high-income and developing countries. Con-ditional on debt issuance, during the crisis the probability of fi rms issuing bonds to obtain new fi nancing increased by 11.5 percentage points in high-income countries and by 8.9 points in developing countries, for a 12 per-cent and 22 percent increase over the precrisis average, respectively.18 The estimates also in-dicate the increasing use of domestic markets relative to international markets during the crisis, especially in developing countries. The probability of issuing domestic bonds (rela-tive to international bonds) increased by 37 percent with respect to the precrisis average in developing countries. Similarly, fi rms that raised funds in syndicated loan markets dur-ing the crisis saw a fourfold increase in the probability of doing so domestically (rather than internationally). Because different mar-kets provide different types of debt fi nancing, these movements across markets provoked by market-specifi c supply-side shocks directly affect the nature of the new debt fi nancing, such as the debt maturity structure of fi rms and countries (box 3.4).
Although the overall level of lending ac-tivity declined during the global fi nancial crisis, the substitution events seem to have mitigated (at least to some extent) the decline in global banks’ lending. The drying up of bank credit during fi nancial crises has nega-tive effects on investment, employment, and economic growth (Kroszner, Laeven, and Klingebiel 2007). However, if fi rms are able
tire” function advocated for capital markets (Greenspan 1999a, 1999b). However, only very large corporations can access bond mar-kets (Didier, Levine, and Schmukler 2015), and they do it largely through international issuances (Gozzi and others 2015). There-fore, it is not surprising that bond issuance activity increased even in those regions and countries without sophisticated domestic cor-porate bond markets.
It is diffi cult to determine from the aggre-gate data whether the changes in debt compo-sition during the global fi nancial crisis were driven by within-fi rm market substitutions or by a compositional change in the set of fi rms raising new debt. It is also challenging to determine whether such substitutions are caused by shifts in the supply of or demand for capital. For example, Kashyap, Stein, and Wilcox (1993) study relative movements in bank loans and commercial paper to identify the bank lending channel of monetary trans-mission. But, as highlighted by Oliner and Rudebusch (1996), the heterogeneity of fi rms in the aggregate data makes it diffi cult to dis-entangle supply from demand effects. Intend-ing to solve these issues, recent research has analyzed whether fi rms in the United States substitute loans for bond fi nancing during bank crunches, thereby providing evidence of the credit supply transmission channel (Adrian, Colla, and Shin 2013; Becker and Ivashina 2014). This research studies fi rm decisions to issue bonds vis-à-vis loans when they are hit by a credit shock such as the global fi nancial crisis.16 Because issuing fi rms reveal a demand for fi nancing, the focus is on the market choice given this demand. For ex-ample, conditional on positive debt issuance, a within-fi rm switch between syndicated loans and bonds during a bank credit crisis is interpreted as evidence of a negative bank credit supply shock. Building on that type of methodology, Cortina, Didier, and Schmukler (2016) study a wider and more heterogeneous set of fi rms from all around the world. The global dimension of the data allows them to analyze how fi rms react to domestic and external fi nancial crises by moving across markets. Therefore, they provide evidence

GLOBAL FINANCIAL DEVELOPMENT REPORT 2017/2018 C R O S S - B O R D E R L E N D I N G B Y I N T E R N A T I O N A L B A N K S 103
BOX 3.4 Substitution Effects during Crises
In a recent paper, Cortina, Didier, and Schmukler (2016) use issuance data for four different debt mar-kets (domestic and international corporate bonds and syndicated loans) to study (1) how fi rms use dif-ferent markets to borrow at different maturities, (2) how corporate- and country-level maturity depend on which markets and which fi rms are active at each point in time, and (3) whether fi rms switch across different debt markets during market-specifi c crises.
The main fi ndings of the authors are as follows. First, debt composition matters because different markets provide fi nancing at different maturities. In particular, bond markets are, on average, of longer maturity than syndicated loans. For high-income countries, domestic and international bonds are significantly longer term than domestic and inter-national syndicated loans. For developing countries, not only the instrument but also the market location is relevant. For example, the unconditional results show that international syndicated loans are the shortest term, followed by domestic bonds, interna-tional bonds, and domestic syndicated loans. The maturity of debt issuances consistently varies across markets, even after controlling for time-varying, country-specifi c factors and fi rm-level fi xed effects, currency of issuance, and use of the proceeds raised. Thus the results indicate that part of the differences in debt maturity across fi rms and countries lies in differences across types of instrument and market location of the capital raised.
Second, the relative importance of each market for fi rm fi nancing varies over time, with signifi cant compositional effects, especially during market-specifi c crises. For example, when the global fi nancial crisis suddenly hit the banking sector of major high-income countries, both domestic and international syndicated loan markets were affected negatively and fi rms moved toward issuing in domestic and inter-national bond markets. In developing countries, the global fi nancial crisis only affected international syn-dicated loan markets, and fi rms reacted by moving toward domestic markets, issuing both syndicated loans and bonds. An analogous pattern of switches occurs during domestic banking crises. Firms miti-gate the funding shock in the local banking system by moving away from domestic syndicated loans and toward bond and international markets (table B3.4.1).
Third, the time-varying activity in each market and the ensuing changes in debt composition are refl ected in fi rm- and country-level maturities. Dur-ing the global fi nancial crisis, the maturity of debt at issuance declined in individual markets. How-ever, because the hardest-hit markets supplied rela-tively shorter-term maturities, firms’ movements toward less affected markets had a positive impact on the maturity of debt issuances. Consequently, the overall maturity at issuance remained stable both at the aggregate country level as well as for those fi rms able to move across markets. Firms issuing the same type of debt before and in the aftermath of the global fi nancial crisis experienced declining borrow-ing maturities in both high-income and developing countries. Similar patterns take place during domes-tic banking crises, when the overall debt maturity increases, despite declines in the maturity of domes-tic syndicated loans. Thus these switches across mar-kets provide evidence of supply side shocks with sig-nifi cant effects on debt maturity.
Fourth, because larger firms have access to a wider set of debt markets than smaller ones, the composition of fi rms also changes when shocks hit particular markets. For example, as the largest fi rms issued bonds and tapped into international markets, they were the ones capable of moving away from syn-dicated loan markets during the global fi nancial crisis and from local markets during domestic banking cri-ses. Furthermore, in developing countries, as larger fi rms returned home during the global fi nancial cri-sis, they might have crowded out funding for smaller fi rms that rely solely on domestic markets. In both cases, large fi rms gain relative to small ones, prompt-ing a compositional shift at the fi rm level with aggre-gate-level consequences. Overall, access to several markets allows larger fi rms to use them as comple-ments during good times, obtaining different types of fi nancing in each, and as substitutes when condi-tions deteriorate, cushioning the decline in volume in certain markets and in maturity across all individual markets. The fi nancing conditions of smaller fi rms are constrained by the specifi c market they access.
In summary, the results from this report show that although the demand side can be important for maturity as firms choose their optimal financing, the supply side (or type of market) is also relevant.
(box continued next page)
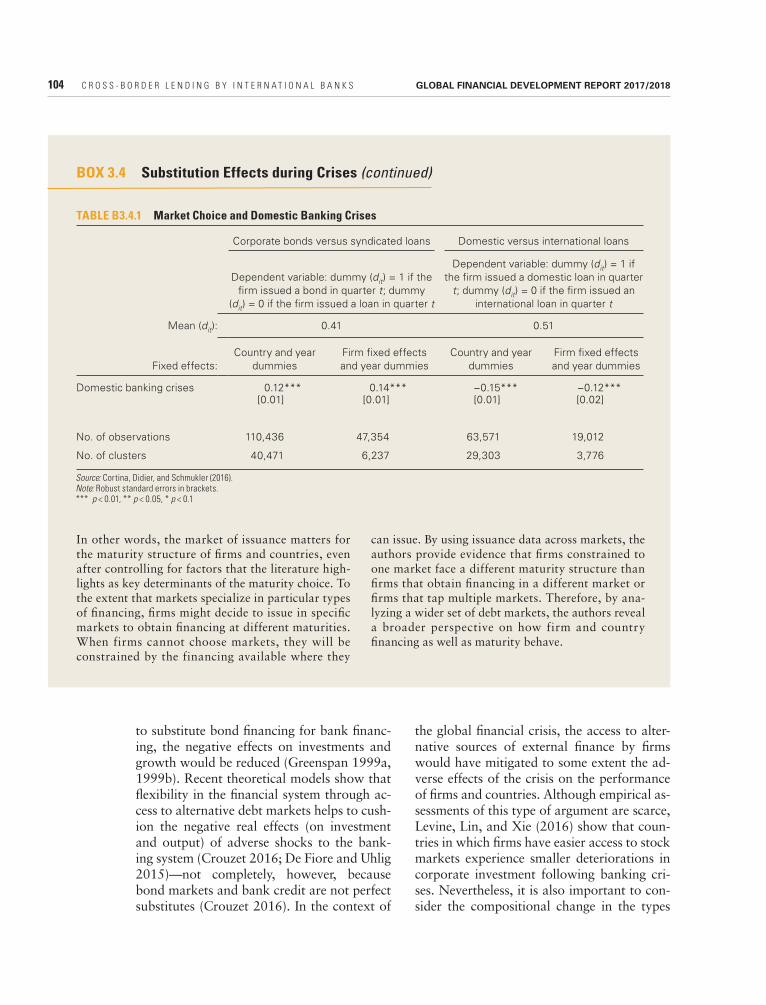
104 C R O S S - B O R D E R L E N D I N G B Y I N T E R N A T I O N A L B A N K S GLOBAL FINANCIAL DEVELOPMENT REPORT 2017/2018
the global fi nancial crisis, the access to alter-native sources of external fi nance by fi rms would have mitigated to some extent the ad-verse effects of the crisis on the performance of fi rms and countries. Although empirical as-sessments of this type of argument are scarce, Levine, Lin, and Xie (2016) show that coun-tries in which fi rms have easier access to stock markets experience smaller deteriorations in corporate investment following banking cri-ses. Nevertheless, it is also important to con-sider the compositional change in the types
to substitute bond fi nancing for bank fi nanc-ing, the negative effects on investments and growth would be reduced (Greenspan 1999a, 1999b). Recent theoretical models show that fl exibility in the fi nancial system through ac-cess to alternative debt markets helps to cush-ion the negative real effects (on investment and output) of adverse shocks to the bank-ing system (Crouzet 2016; De Fiore and Uhlig 2015)—not completely, however, because bond markets and bank credit are not perfect substitutes (Crouzet 2016). In the context of
BOX 3.4 Substitution Effects during Crises (continued)
In other words, the market of issuance matters for the maturity structure of fi rms and countries, even after controlling for factors that the literature high-lights as key determinants of the maturity choice. To the extent that markets specialize in particular types of fi nancing, fi rms might decide to issue in specifi c markets to obtain fi nancing at different maturities. When firms cannot choose markets, they will be constrained by the financing available where they
can issue. By using issuance data across markets, the authors provide evidence that fi rms constrained to one market face a different maturity structure than fi rms that obtain fi nancing in a different market or fi rms that tap multiple markets. Therefore, by ana-lyzing a wider set of debt markets, the authors reveal a broader perspective on how firm and country fi nancing as well as maturity behave.
Source: Cortina, Didier, and Schmukler (2016).Note: Robust standard errors in brackets.*** p < 0.01, ** p < 0.05, * p < 0.1
TABLE B3.4.1 Market Choice and Domestic Banking Crises
Corporate bonds versus syndicated loans Domestic versus international loans
Dependent variable: dummy (dit) = 1 if the fi rm issued a bond in quarter t; dummy
(dit) = 0 if the fi rm issued a loan in quarter t
Dependent variable: dummy (dit) = 1 if the fi rm issued a domestic loan in quarter
t; dummy (dit) = 0 if the fi rm issued an international loan in quarter t
Mean (dit): 0.41 0.51
Fixed effects: Country and year
dummiesFirm fi xed effects and year dummies
Country and year dummies
Firm fi xed effects and year dummies
Domestic banking crises 0.12*** 0.14*** –0.15*** –0.12***[0.01] [0.01] [0.01] [0.02]
No. of observations 110,436 47,354 63,571 19,012
No. of clusters 40,471 6,237 29,303 3,776

GLOBAL FINANCIAL DEVELOPMENT REPORT 2017/2018 C R O S S - B O R D E R L E N D I N G B Y I N T E R N A T I O N A L B A N K S 105
fi nancial crisis continued during the postcrisis years. Regulatory reforms aimed at avoiding systemic risks (higher capital and liquidity re-quirements), combined with the higher com-pliance costs to combat money laundering and the fi nancing of terrorism and to increase transparency, led to a de-risking of global banks from their relatively riskier cross-border activities and a withdrawal from cor-respondent banking relationships (box 3.5). As such, cross-border lending as a share of
of issuers that are tapping each market over time. For example, during domestic crises, only relatively larger fi rms will have access to alternative markets (bonds and international loans). During foreign shocks, large interna-tional fi rms switching to domestic markets can potentially crowd small domestic issu-ers out of the market (Cortina, Didier, and Schmukler 2016).
The shift in the pattern of global fi nancial intermediation that began during the global
BOX 3.5 De-risking in Correspondent Banking
Correspondent banking, in the context of global fi nance, refers to the services provided by a bank (the correspondent) to another fi nancial institution (the respondent) and its clients by extension. Large inter-national banks typically serve as correspondents to settle payments and clear foreign currency transac-tions for local and regional banks that in turn sup-port money transfer operators and other businesses. Correspondent banking connects local economies which would otherwise have limited access to the international fi nancial system, and underpins trade fi nance, remittances, and humanitarian fl ows.
Global banks’ recent retrenchment from corre-spondent relationships has garnered attention from multiple international institutions for its potential downside impact on fi nancial stability and economic development. A joint World Bank-FSB-CPMI survey found that about half of national banking regula-tors, three-fifths of local and regional banks, and three-quarters of large international banks indicated declines in correspondent banking (World Bank 2015a). The retrenchment originated in banks in Canada, Switzerland, the United States, the United Kingdom, and other EU economies. It has affected institutions in the Latin America and the Caribbean, Middle East and North Africa, Sub-Saharan Africa, and Europe and Central Asia regions, particularly those located in offshore centers and jurisdictions at a high risk of illicit fi nancing.a As pointed out by a new IFC survey, the pervasiveness of withdrawal has chal-lenged the ability of respondent banks to serve clients and further develop banking business needed for eco-nomic diversifi cation (Starnes and others 2017).
Although profi tability and risk appetite are critical factors in banks’ commercial decisions, the retrench-ment from correspondent relationships has occurred against a backdrop of more stringent enforcement of the anti–money laundering and combating fi nancing of terrorism (AML-CFT) rules (World Bank 2015a). Because of the ambiguity in regulatory expecta-tions and the unquantifiable potential for reputa-tional impact, many correspondents have chosen to de-risk by restricting or exiting relationships with institutions that are deemed excessively risky (see panel a, fi gure B3.5.1). Wholesale de-risking at the jurisdiction or sector level, independent of the type of customer, refl ects a shift away from case-by-case risk management to risk avoidance (FATF 2014). Humanitarian aid benefi ciaries (World Bank 2016b), small exporters (Starnes, Alexander, and Kurdyla 2016), and nonbank international remittance com-panies (Ramachandran 2016; World Bank 2015b) served by local and regional banks are among the most vulnerable to general de-risking (see panel b, fi gure B3.5.1 for example).
Early evidence points to the need for further research to determine developmental impacts. For example, analyzing SWIFT bank payment informa-tion, the CPMI (2016) found that the number of cor-respondent relationships had fallen during 2011–15, whereas the volume and value of transactions indi-cated that those relationships had increased (panel a, fi gure B3.5.1). This fi nding reveals the growing con-centration and complexity in correspondent banking, consistent with the World Bank-FSB-CPMI survey finding that local and regional banks have gener-
(box continued next page)

106 C R O S S - B O R D E R L E N D I N G B Y I N T E R N A T I O N A L B A N K S GLOBAL FINANCIAL DEVELOPMENT REPORT 2017/2018
issued was 18 percent on average during the precrisis years and 50 percent during the postcrisis ones. Bond fi nance also continued to gain importance during the years follow-ing the crisis. The share of bonds of total debt rose from 33 percent to 42 percent in
total banking assets declined, driven largely by the retrenchment of European banks (IMF 2015c). Moreover, the higher propensity of developing countries to issue domestic loans continued during 2010–14. The share of domestic loans in the total volume of loans
BOX 3.5 De-risking in Correspondent Banking (continued)
ally been successful in fi nding replacement institu-tions or alternative fi nancing channels. Often, this is achieved through nested correspondent relationships at the cost of excluding part of the respondent cus-tomer base, as required by correspondence providers (World Bank 2015a).
Following the large global banks’ withdrawal, this condensation through additional layers of fi nan-cial intermediation carries several risks. In terms of business control, the smaller Tier 2 and 3 correspon-dent banks are often less well positioned to piece together fi nancial intelligence from complex client relationships and process large-volume transactions in a timely fashion (World Bank 2015a). From a
supervisory perspective, it is becoming increasingly challenging to monitor and enforce the financial integrity of layered arrangements because of their complexity and opacity (Ramachandran 2016). Last but not the least, nested relationships are signifi-cantly costlier to establish and service when there is limited coordination in regulatory standards across countries (World Bank 2015b). Hence, a widespread uncontained retrenchment from correspondent bank-ing can threaten progress toward fi nancial stability and inclusive growth, and these trends need to be followed closely. For a rigorous analysis to support the decline in correspondent banking, however, bet-ter data going beyond anecdotal evidence are needed.
a. The withdrawal of correspondent banking can affect local fi nancial systems signifi cantly. For example, the nonoffi cial fi nancial sector in Angola lost access to U.S. dollar clearing in December 2015. Access to U.S. dollar payments was merely sustained through the Banco Nacional de Angola. Monetary authorities have also experienced terminations of correspondent relationships, such as in Belize (IMF 2016).
FIGURE B3.5.1 Correspondent Banking: Recent Developments
Sources: Deutsche Bank and SWIFT Watch, adapted from CPMI (2016) and World Development Indicators (database).Note: In panel a, the series are indexed as 100 times the current values divided by those of January 2011.
–10
–8
–6
–4
–2
0
2
4
6
–50 –40 –30 –20 –10 0 10 20
Chan
ge in
cos
t mar
gin
of re
mitt
ance
s(p
erce
ntag
e po
ints
)
Number of active correspondents, percentage change
90
95
100
105
110
115
120
125
130a. Trends in correspondent payments, 2010–15 b. Correspondent banking and remittance costs, 2012–15
20112010 2012 2013 2014 2015
Inde
x
Active correspondents Transactions Value

GLOBAL FINANCIAL DEVELOPMENT REPORT 2017/2018 C R O S S - B O R D E R L E N D I N G B Y I N T E R N A T I O N A L B A N K S 107
fi nancial conditions for domestic liquidity and credit growth. As the reliance on international bond markets continues to rise with respect to cross-border banking, the locus of risks shifts from banks to nonbank institutions, which may complicate surveillance of the global fi nancial system (IMF 2015c). Moreover, al-though the increasing use of domestic loan markets in developing countries reduces their exposure to global fi nancial shocks, it may increase their vulnerability to domestic and regional banking crises.
The patterns highlighted in this section imply that policy discussions would benefi t from considering other key components of the global fi nancial system, beyond the single focus on cross-border banking. Because there are different markets where corporates obtain new debt fi nancing, it is important to jointly analyze the dynamics across those markets. For example, fi rms can better withstand market-specifi c adverse shocks through their access to alternative sources of external fi nance. Although this section focuses on the role of capital markets as complements of bank fi -nancing during crisis periods, this argument can also be generalized to “good” times and can be a topic for future research. In this way, access to more complete markets may allow fi rms and countries to diversify their fi nancing sources and reduce the risks associated with fi nancial contagion. However, global fi nancial markets are not perfectly integrated, and sev-eral frictions result in different markets pro-viding different types of fi nancing, even for the same fi rm (such as in terms of maturity or currency denomination). As a result, changes in debt market composition over time also ex-pose fi rms and countries to new types of risks. Moreover, despite the fact that debt is the main source of external fi nancing for invest-ment projects, most of the theoretical models of debt market frictions are constrained to a single type of debt, typically bank debt. Al-though this fi nding might be true for small fi rms, it does not hold for relatively large cor-porations, which typically have a broader ac-cess to alternative sources of external fi nance. In this sense, policy initiatives, such as the Capital Markets Union in Europe (European
high-income countries and from 42 percent to 57 percent in developing countries when com-paring pre- and postcrisis years.
The change in debt market composition during and after the global fi nancial crisis re-duced the exposure of borrowing fi rms and countries to global banking conditions, but it increased their exposure to international bond markets. The expansion of corporate borrow-ing in bond markets (and away from banks) since the crisis has been labeled the “second phase of global liquidity” (Shin 2013). Unlike in the fi rst phase, in which global banks mo-nopolized global liquidity, international bond markets are taking the lead during the second phase. Thus, international bond markets have taken on a larger role in the transmission of fi nancial conditions across borders since the crisis. Because a large part of the bond issu-ances has been denominated in U.S. dollars, developing countries have become more ex-posed to movements in U.S. interest rates and exchange rates (McCauley, McGuire, and Su-shko 2015; Shin 2013). Holding large liabili-ties in foreign currency while having assets in local currency can be risky, as demonstrated during the crises in Mexico and Asia in the 1990s.19 But this time, the provision of longer-term issuances by bond markets (relative to bank credit) may be mitigating to some ex-tent the risk of capital fl ow reversals and for-eign currency fi nancing (Cortina, Didier, and Schmukler 2016). This new trend can also affect domestic credit through the so-called carry trade (Bruno and Shin 2017). In this sense, low interest rates in high-income coun-tries would fuel nonfi nancial corporations in developing countries to issue foreign cur-rency bonds and use the proceeds not solely to support real investment but also to serve as savings in the form of cash holdings or other liquid assets, thereby increasing the domestic credit capacity (Acharya and others 2015; Acharya and Vij 2016; IMF 2015b). For ex-ample, Powell (2014) documents a positive correlation between bond issuances by Latin American corporations, corporate deposits in LAC fi nancial institutions, and domestic credit. In this way, nonfi nancial institutions become important conduits of international

108 C R O S S - B O R D E R L E N D I N G B Y I N T E R N A T I O N A L B A N K S GLOBAL FINANCIAL DEVELOPMENT REPORT 2017/2018
scant, according to some estimates at least 4,000 fi ntech fi rms were active in 2015, and over a dozen of them were valued at over $1 billion (The Economist 2015). Meanwhile, this trend is growing very quickly. The global investment in fi ntech was about $22.3 billion in 2015, or more than 12 times the invest-ment amount in 2010 (Accenture 2016). The United States and the United Kingdom ap-pear to be the world leaders in fi ntech invest-ments, although these fi rms operate globally, providing services to developing economies as well. Fintech fi rms in the United States at-tracted most of the investments between 2010 and 2015—about 63 percent of the total. The United Kingdom is the second-largest attractor of investments, absorbing 11 per-cent of the total, but Nordic economies such as Sweden are also becoming leading fi ntech centers globally.20 In terms of growth, Asia has experienced the fastest expansion of fi n-tech in recent years. Investment in Asian fi n-tech companies accounted for 19 percent of the world’s total fi ntech investment in 2015, up from 6 percent in 2010. China captured most of that growth by absorbing about 45 percent of the total investment in that region by 2015 (box 3.6). The role of India was im-portant as well; it accounted for 38 percent of total Asian investment for the same year (Ac-centure 2016). Most of fi ntech funding has been directed at the personal and SME space (lending, payments, and transfers), which has absorbed over 70 percent of the total fi ntech investments to date (Citigroup 2016). Other fi ntech areas such as wealth management and insurance, although smaller in size, have recently been attracting a large share of the global investments (Accenture 2016).
In lending, the emerging online platforms are alternative forms of intermediating credit beyond the traditional credit system. Most of the alternative lending platforms emerged us-ing the so-called peer-to-peer (or P2P) model in the aftermath of the global fi nancial cri-sis, when the availability of traditional bank credit was quite limited.21 This type of lend-ing model allows direct lending from savers to borrowers, avoiding the traditional sys-tem of fi nancial intermediation. However,
Commission 2015), the development of capi-tal markets for SMEs, as well as those initia-tives aimed at developing innovative instru-ments, such as minibonds, and securitization may be important tools to broaden external funding choices for a wider set of fi rms (Bo-rensztein and others 2008; Giovannini and others 2015).
FINTECH AND THE FUTURE OF GLOBAL BANKING
This section provides an overview of some of the latest fi ntech developments and how they are related to global banking. In particular, it describes how fi ntech might provide alter-native sources of external fi nancing, increase competition, push innovation, and introduce new technologies that can potentially dis-intermediate many fi nancial processes such as cross-border payments. Consumers and small and medium-sized enterprises (SMEs) are the segments most affected by innovative fi ntech solutions.
Although there is no consensus on what “fi ntech” means, and it is typically used to de-scribe disruptive technologies in the fi nancial system, this section uses the term in conjunc-tion with the set of tech-driven new compa-nies providing fi nancial services outside the traditional fi nancial sector. The retrenchment and intensifi ed regulation of the traditional banking system after the global fi nancial cri-sis, combined with the greater access to in-formation technology and the wider use of mobile devices, have given a new generation of fi rms outside the traditional banking sec-tor an opportunity to innovate and deliver fi nancial services. These new players, which are still very young (most emerged after the crisis), are bringing new business models and innovations to multiple segments of the fi -nancial world, including lending, payments and transfers, and wealth management. This section covers only the fi rst two segments because they are the areas that most signifi -cantly affect the traditional banking industry.
Global investment in fi ntech companies has expanded very rapidly worldwide. Al-though available data on fi ntech are very

GLOBAL FINANCIAL DEVELOPMENT REPORT 2017/2018 C R O S S - B O R D E R L E N D I N G B Y I N T E R N A T I O N A L B A N K S 109
BOX 3.6 Fintech in China: An Overview
The fi ntech sector has seen extraordinary growth in China in recent years. Despite the general scarcity of offi cial statistics on fi ntech development, China appears to be one of the global leaders in fintech innovation and adoption. Fintech in China attracted $8.8 billion during 2015:Q3–16:Q2 in terms of vol-ume of investment, representing 352 percent of the volume in 2010 (Mittal and Lloyd 2016). In 2016, 30 percent of the fi ntech fi rms valued at more than $1 billion were located in China (panel a, fi gure B3.6.1). In terms of adoption and usage, credit provided by the peer-to-peer (P2P) subsector increased from $4.3 billion in 2013 to $71.4 billion in 2015 (PIIE 2016), and the volume of mobile payments reached $4.4 tril-lion in 2015, accounting for 40 percent of China’s gross domestic product (GDP)—see PBOC (2016).
Payment platforms—which largely derive their user base from thriving e-commerce and social media platforms—by far dominate the fi ntech space in China (panel b, fi gure B3.6.1). Service providers have been able to leverage the large economies of scale thanks to the high level of smartphone penetra-tion. For example, Ant Financial (formerly Alipay), the largest payment service provider, supported 451 million active users in 2015 and processed on aver-age 153 million transactions a day (Alibaba Group 2016).a Notably, 54 percent of the payment volume
in China as of 2016:Q2 was processed by nonbank institutions, as opposed to traditional payment ser-vice providers (Saal, Starnes, and Rehermann 2017). Thanks to their cost-effi ciency, reliability, and ease of use, digital payments have enabled large parts of the cash-based Chinese economy to leapfrog over credit card systems, absorbing fees paid to traditional pay-ment intermediaries in the process.
Flourishing within a similar environment, the fi n-tech lending sector exploited the fi nancial needs of households and small and medium-sized enterprises (SMEs) that were not met by traditional service providers.b P2P platforms have rapidly seized oppor-tunities not taken by traditional intermediaries, designing competitive products in search of custom-ers and profi ts under broadly accommodative regula-tory conditions.
Although P2P lending can improve effi ciency and promote access to underserved segments of SMEs and retail customers, the many platforms operating in China have not been a riskless solution to mitigat-ing the banking industry’s primary focus on state-owned enterprises and well-known borrowers. As consolidation among more than 2,000 platforms accelerated in 2015, a more pronounced regulatory approach to credit limits was adopted to improve sec-toral soundness. By August 2016, several prominent
(box continued next page)
FIGURE B3.6.1 Fintech “Unicorns”: Fintech Firms with a Valuation of over $1 Billion, 2016
Source: Adapted from Visual Capitalist 2016.
148
5
a. Number of firms
United States China Rest of world
0 20 40 60 80 100
Rest of world
United States
China
Sector value, US$ (billions)
b. Valuation by sector
PaymentsLending/financing
InsuranceOther services

110 C R O S S - B O R D E R L E N D I N G B Y I N T E R N A T I O N A L B A N K S GLOBAL FINANCIAL DEVELOPMENT REPORT 2017/2018
data mining to assess credit risk, accelerate lending processes, and lower operating costs. The new digital lending sector is attracting a massive number of entrants. According to Autonomous (2016), in 2006 only two econ-omies were home to digital lenders. By 2016, 67 economies had digital lenders, and over 2,000 players were thought to be operating worldwide (over 200 in the United States).
In payments and transfers, innovative solu-tions are rapidly changing the way consumers engage in fi nancial transactions. Indeed, the payment industry had largely evolved before the latest fi ntech expansion. For example, with the adoption of credit cards in the 1950s and the rise of e-commerce during the 1990s, cash and checks were no longer the main means of transaction in many high-income
the industry has evolved, and the term peer-to-peer has become somewhat inaccurate. Most of the loans include funding from a wide range of investors (including fi nancial institutions and institutional investors). Thus P2P lending can be considered a form of on-line crowdfunding, a term that includes other types of platforms where multiple individuals pool their contributions in a larger fund (Atz and Bholat 2016). Online lending platforms have no retail branches and typically provide faster loan applications and smaller shorter-term loans than traditional credit institutions. These new platforms also involve alterna-tive credit models that help lenders to assess the credit risk of a broader set of borrowers. They replace traditional credit scoring with machine learning and algorithms based on big
BOX 3.6 Fintech in China: An Overview (continued)
exits had triggered further regulation of loan size and custodian requirements for investor funds (CBRC 2016b), aiming to address concerns about potential systemic risk.
Under an innovative approach to promoting SME capital access and facilitating fi nancial sector reforms, Chinese regulatory authorities are allowing several large technology companies to venture into lending services directly. Precluded from brick-and-mortar operations under special banking licenses, this class of online intermediaries collects deposits, assesses creditworthiness via cloud-based and data-driven analytics (using, for example, the borrowers’ marketplace and social network records), and lends using streamlined processes. Being one step closer to the technology sector’s vision of integrated fi nancial services, these intermediaries are able to draw on the accumulated expertise of fi nance as an ecology, pos-sibly leading to further innovations.
Building on domestic experience, large Chinese technology companies are venturing into developing countries such as India, Thailand, the Russian Fed-eration, and Brazil through brownfi eld investments and collaborative efforts (Mittal and Lloyd 2016). However, the fi ntech sector is facing challenges as markets, regulations, and perceptions continue to evolve. Incumbent intermediaries are innovating to bridge gaps in fi nancial access, while retail investors are becoming more informed about the risks and returns of fi ntech products. Because cyber security, AML-CFT (anti–money laundering and combating fi nancing of terrorism), and prudential compliance all remain valid concerns within the current regula-tory approach to the fi ntech sandbox, it helps when both the industry and the regulator are vigilant and proactive about risks in order to maintain an envi-ronment conducive to healthy developments in this promising sector.
a. The comparable value for Visa is 260 million transactions a day globally; and for MasterCard, 180 million.b. Total assets in the Chinese banking system constituted 290 percent of GDP by the end of 2015, according to calculations based on the China Banking Regulatory Commission’s annual report (CBRC 2016a). Credit to households as of 2015 was 39 percent of GDP (BIS Credit to the Non-fi nancial Sector database, 2016). Furthermore, despite contributing to about four-fi fths of urban employment and three-fi fths of national GDP, SMEs as a sector receive less than a quarter of bank loans, in part because of their lack of collateral and fi nancial track records (Mittal and Lloyd 2016).

GLOBAL FINANCIAL DEVELOPMENT REPORT 2017/2018 C R O S S - B O R D E R L E N D I N G B Y I N T E R N A T I O N A L B A N K S 111
recorded on a distributed platform—that is, the database is not stored in a single location but distributed among millions of computers, which replace the traditional trusted interme-diaries by keeping track of old transactions and verifying new ones (fi gure 3.11). Block-chain technology records the transaction his-tory better than any other electronic money or means of payment (Schuh and Shy 2016). Thus this technology upends one of the most important tasks of the traditional fi nancial in-dustry, which is to act as a trusted intermedi-ary for transactions between separated (some-times unknown) entities. In the same way the Internet has revolutionized the diffusion of information, blockchain technology is revolu-tionizing the way in which parties send funds (see, for example, Forbes 2016).
The potential of blockchain technol-ogy goes beyond its uses as a digital form of cash because it can be applied to many other transfer processes, including global bank pay-ments. Blockchain technology provides a new payment infrastructure, so it can disinterme-diate many fi nancial (and nonfi nancial) pro-cesses (“blockchain 2.0”), thereby increasing speed and effi ciency and lowering transac-tion costs. Several global banks and fi nancial institutions are already collaborating with technology companies to further experiment with blockchain. For example, Ripple and R3 are trying to create their own blockchain network for global banks, avoiding clearing-houses and correspondent banks. The Tokyo Stock Exchange, in the collaboration with IBM, is testing systems to record trades for low-transaction markets using blockchain (Adriano and Monroe 2016). The U.S. Nas-daq stock exchange was the fi rst one to incor-porate blockchain services (CoinDesk 2016). Other applications of blockchain are to reg-istries and transactions of other digital assets (such as blockchain-based property registries) and smart contracts, which are self-executing contracts without the third-party interference and without input by lawyers or recourse to the courts (for example, Ethereum). More ef-fi cient arrangement and management of syn-dicated loan contracts could result from the application of smart contracts, and that is one
economies (World Economic Forum 2016b).22 Another likely consequence of the expansion in e-commerce is that the consumer and re-tail payments segment has been the fastest-growing area in terms of innovative solutions and fi ntech new entrants (BNY Mellon 2015). In payments, the most recent innovations have focused on the user experience, leveraging mo-bile devices, and connectivity (front-end pro-cesses), but the existing payment infrastruc-ture remains mostly the same. An example is the use of mobile phones to make payments at a physical location (for example, Apple Pay, Samsung Pay). As for transfers, the cur-rent system is built on several intermediaries, such as automated clearinghouses and inter-mediary banks (corresponding banks), which make the process of value transfer sometimes costly and slow. Innovations in this area make transactions between individuals (and some-times across economies) easier, faster, and cheaper than in the past. For example, mobile money solutions such as M-Pesa make pos-sible peer-to-peer transactions through the use of mobile devices without the need for a bank account. And new business models such as TransferWise and Azimo allow customers to send money across borders by matching trans-actions with other users trying to send fl ows in the opposite direction, thereby avoiding the high fees associated with international trans-fers because the money never really leaves the economy of origin. Perhaps the most impor-tant and disruptive types of innovations are those based on new technologies, most promi-nently the blockchain.
Blockchain is a decentralized payment scheme that does not require a single trusted third party to validate transactions. As the technology behind the bitcoin, the best-known cryptocurrency, blockchain has the potential to disintermediate any type of fi nan-cial transaction.23 The total market value of all bitcoins in circulation by September 2017 was over $60 billion.24 Blockchain is a sys-tem of online exchange that uses powerful encryption to allow peer-to-peer transactions of digital assets without the need for a trusted third party, such as a bank, to clear and settle payments. It consists of a log of transactions

112 C R O S S - B O R D E R L E N D I N G B Y I N T E R N A T I O N A L B A N K S GLOBAL FINANCIAL DEVELOPMENT REPORT 2017/2018
Therefore, in many economies, remittances are a pathway to economic development and fi nancial inclusion. However, the exist-ing cross-border payment banking system is slow (it takes days to settle), and the average cost of transactions is high. New digital inno-vations and the broader use of smartphones and mobile wallets are key to reducing costs and speeding up international transactions. Again, blockchain technology could be es-pecially useful. An example is Rebbit in the Philippines, which builds on blockchain tech-nology to allow users to send remittances to the Philippines with almost no fees. Other companies such as Abra also use blockchain technology for money transfers worldwide.
In fact, innovative digital providers seem to be putting effective pressure on cross-border transfer costs, which have been declining since 2011. The cost of sending remittances fell
application that directly affects global banking activities (World Economic Forum 2016b).
All recent innovations and business mod-els arising from the latest fi ntech develop-ments could also affect remittances. Remit-tances constitute one of the biggest fl ows of funds from the developed to the developing world (excluding China)—larger than offi -cial development aid, FDI fl ows, and corpo-rate investment (private debt and portfolio equity fl ows). According to the World Bank (2016a), the global fl ow of remittances was estimated to exceed $601 billion in 2015. Of that amount, developing economies received an estimated $441 billion. The following de-veloping economies were among the top re-cipients of global remittances as a percentage of GDP in 2015: Tajikistan (42 percent), Ne-pal (29 percent), Moldova (26 percent), Haiti (23 percent), and Honduras (17 percent).
FIGURE 3.11 How Blockchain Works
Sources: Illustration by the GFDR team.
A A
B
A requests a digital transaction to B 1 The transaction is broadcast to the network of “miners”
2 The transaction, along with others, is packaged and recorded as a block 3
The network of miners validates the block of transactions
4 The new block of confirmed transactions is added to the existing blockchain 5
The transaction from A to B is verified and completed 6

GLOBAL FINANCIAL DEVELOPMENT REPORT 2017/2018 C R O S S - B O R D E R L E N D I N G B Y I N T E R N A T I O N A L B A N K S 113
percent in 2011 to 22 percent in 2015 (panel a, fi gure 3.12). Although bank prices have also declined over time, they were still signifi cantly higher than the ones being charged by MTOs by 2015. During that year, the cost of sending remittances through the banking system was 3.2 percentage points higher than the cost of sending them through the traditional MTOs (Western Union, MoneyGram, and Ria) and 5.9 percentage points higher than through
by 1.7 percentage points between 2011 and 2015, from 9.1 percent in 2011 to 7.4 percent in 2015 (panel a, fi gure 3.12). This pattern is explained in part by the fact that banks, which charge very high fees to channel remit-tances, have signifi cantly reduced their market share in the remittances market over the years. The share of remittance transactions handled by banks relative to those handled by money transfer operators (MTOs) declined from 33
a. Average cost of sending remittances
c. Speed of transactions
b. Banks’ share of remittances market
Cost
(% o
f am
ount
sen
t)Pe
rcen
t
Perc
ent
4
5
6
7
8
9
10
11
12
13
14
2011 2012 2013 2014 2015 2016
BanksGlobal average Newer MTOs
Traditional MTOs
0
5
10
15
20
25
30
35
2011 2012 2013 2014 2015 2016
0
10
20
30
40
50
60
70
80
Less than 1 hour Same day Next day 2 days 3–5 days 6 days or more
Banks Traditional MTOs Newer MTOs
FIGURE 3.12 The Remittances Market, 2011–16
Source: Remittance Prices World Wide (database), World Bank. See http://remittanceprices.worldbank.org.Note: Panel a shows the average total cost (as a percentage of the remittance) of sending $200 internationally; panel b shows the banks’ market share of the remittances market; and panel c shows the average speed of transaction by different methods of sending remittances for the period 2011–16. MTO = money transfer operator.

114 C R O S S - B O R D E R L E N D I N G B Y I N T E R N A T I O N A L B A N K S GLOBAL FINANCIAL DEVELOPMENT REPORT 2017/2018
is large, the rapid spread of digital technolo-gies to access fi nancial services holds special potential to overcome the traditional barri-ers and fi nancially include the traditionally excluded segments (Demirgüç-Kunt, Kane, and Laeven 2014).27 For example, mobile money platforms allow unbanked consum-ers, through the use of basic mobile phones, to make and receive payments much faster (in a matter of seconds) and at a lower cost than in the recent past.28 They also provide the in-frastructure and generate the digitalized data that can be used to create and tailor new fi -nancial offerings for the fi nancially excluded. One example is M-Shwari in Kenya, which le-verages the mobile money infrastructure and digital information of M-Pesa to make credit-scoring decisions (CGAP 2015). One of the benefi ts of blockchain technology (see fi gure 3.11) for fi nancial inclusion is its potential to reform and improve property ownership through blockchain registries such as Bitfury, which would generate proof of collateral (an important problem in developing nations) and thus access to credit. Furthermore, because the digital currencies supported by blockchain technology are also a global means of pay-ment by design, their impact goes beyond the fi nancial arena, as they also facilitate inclu-sion in global trade. For example, producers in Africa can meet demand in Europe through the use of online platforms and e-payments. In fact, the economic gains from widespread use of digital fi nance in developing econo-mies would be signifi cant. According to the McKinsey Global Institute (2016), the in-creased productivity and investment that the widespread use of digital fi nance generates could boost the annual GDP of all develop-ing economies by 6 percent by 2025 versus a business-as-usual scenario.
Despite the potential benefi ts, fi ntech ser-vices also pose new types of risks. The lack of safety nets in the business models, misuse of personal data, diffi culties in identifying cus-tomers, and electronic fraud are among the main vulnerabilities of the new digital fi nan-cial practices. For example, P2P lending plat-forms, whose business model is based on loan matching between borrowers and investors
the newer MTOs such as Transfer Wise and Azimo. Because MTOs provide faster trans-action services than banks, they have also al-lowed faster international transactions world-wide (panel c, fi gure 3.12).
Increased competition and effi ciency are among the main contributions that digital in-novators could make to the traditional global fi nancial sector, especially if a signifi cant com-ponent of fi nancial sector growth over the last 40 years has been rent seeking (Zingales 2015). For example, according to Philippon (2015), the unit cost of fi nancial interme-diation in the United States has remained at about 2 percent for the last 130 years, de-spite several fi nancial innovations.25 In other words, the improvements in technology have not been yet transmitted to the end users of fi nancial services. However, such a scenario might change with the entry of new com-petitors, thereby broadening the competitive landscape in terms of number of players, al-ternative products, and business models. The current fi ntech trend is therefore an opportu-nity to alleviate the tension between private and social returns as well as increase the over-all effi ciency of the system (Philippon 2016). Lower costs are achievable not only through increased competition but also through the streamlined processes made possible by the new electronic platforms, which allow the in-novating businesses to offer prices lower than those of the traditional banking services.
The development of fi ntech also promotes fi nancial inclusion. Access to fi nancial ser-vices allows consumers in developing econo-mies to make longer-term consumption and investment decisions.26 Historically, there has been a wide gap between the fi nancial needs of households and businesses in developing economies and the set of fi nancial products available to them. Among the traditional bar-riers of the banking sector faced by this seg-ment have been the high costs relative to the small transaction values involved and the dif-fi culties in identifying and assessing risk. Be-cause mobile phone penetration in develop-ing economies is usually higher than banking penetration (which is often highly underde-veloped), and the share of cash transactions
GLOBAL FINANCIAL DEVELOPMENT REPORT 2017/2018 C R O S S - B O R D E R L E N D I N G B Y I N T E R N A T I O N A L B A N K S 115
prevail. However, excessive regulation might not be desirable, as it may be deadly for fi n-tech start-ups. Understating this, regulators in some economies are developing regulatory sandboxes to manage the transition to a new fi nancial landscape. The aim of this approach is twofold. On the one hand, it allows fi ntech companies to live test their services with real customers while facing a low level of regula-tion during a predefi ned period of time. On the other hand, it helps fi nancial authorities to better understand the functioning of these new services as well as their advantages and risks, ensuring that appropriate consumer protection safeguards are built into the new products and services before they reach the mass market (Financial Conduct Authority 2015). The United Kingdom has launched its sandbox, and other economies, such as Australia, Singapore, and Hong Kong SAR, China, are pursuing similar initiatives (Finan-cial Times 2016a). The sandbox strategy has also been contemplated by U.S. regulators (Wall Street Journal 2016). The new digitally enabled methods could also be used to ad-dress compliance requirements and to moni-tor digital fi nancial services (“regtech”)—see Arner, Barberis, and Buckley (forthcoming) and Financial Times (2016b).
Despite the rapid expansion of fi ntech companies, so far the level of disruption seems to be low. To date, about 1 percent of the con-sumer banking revenue in North America has been disrupted by fi ntech players (Citigroup 2016).30 Moreover, total household and SME lending intermediated by online platforms re-mains small. According to Citigroup (2016), household lending intermediated through P2P platforms remains at less than 1 percent of total retail loans outstanding in the United States and the United Kingdom. Although online credit to SMEs has grown continually since 2008, it represented less than $10 bil-lion in outstanding loans in the United States by 2013, compared with a total of $700 bil-lion in bank credit outstanding for small busi-nesses (Mills and McCarthy 2014).31 More-over, as noted earlier, nonbank MTOs have gained a considerable share of the remittance business. However, the MTO dominating the
(charging fees for that service), do not hold the loans originated in their balance sheets. Therefore, although these fi ntech companies do not bear the default risk, the profi tability of their businesses is highly dependent on the number of loans they intermediate, and thus it might evaporate during economic reces-sions, whereas banks covered by explicit and implicit deposit insurance schemes are better equipped to cope with economic downturns (Demirgüç-Kunt, Kane, and Laeven 2014). Finally, the new credit assessment techniques that the P2P models incorporate into their processes might involve discriminatory sys-tems against borrowers in poorer areas and other vulnerable segments (U.S. Department of the Treasury 2016). As for payments, the anonymity, speed, and global reach of some digital currencies facilitates the funding of il-legal activities. For example, the “Silkroad” was an anonymous e-commerce platform that allowed for the trading of any type of prod-uct (including illegal ones) through the use of Tor (an anonymous browser) and bitcoin (an anonymous form of payment). These are some of the risks that have been identifi ed so far, but there still exist several unknown risks related to the new digital fi nancial providers.
At the center of the policy debate is how this new area of fi nance should be regulated and supervised. For example, lending dis-crimination against some customers, disclo-sure requirements for SMEs, and the shar-ing of customer data, are some of the areas of concern for U.S. regulators brought by the new online platforms (Politico 2016). Recent irregularities in the P2P intermediation pro-cess have also led to calls for stricter regula-tion.29 Moreover, consumer protection and education measures are much needed because many fi ntechs serve segments of more vulner-able customers (some of them are accessing fi nancial services for the fi rst time). Another area of concern is the cross-border activity of the new digital fi nancial services. Although many fi ntech companies operate globally or offer digital products involving multiple econ-omies, fi nancial regulation remains region-specifi c and highly fragmented. Therefore, it is not clear which economy’s laws should
116 C R O S S - B O R D E R L E N D I N G B Y I N T E R N A T I O N A L B A N K S GLOBAL FINANCIAL DEVELOPMENT REPORT 2017/2018
Finally, because a bank account is needed to perform many of the new fi ntech services, it would be hard to imagine fi ntech companies overtaking banks completely and becoming involved in the current accounts niche. There will always be a need for that highly regulated service, which allows households and fi rms to keep their money safe and accessible, and banks seem to be the players best suited to do that.
Despite their small scale, fi ntech fi rms and the newly developed digital technologies in the global fi nancial sector are expected to con-tinue gaining importance over the years, and incumbents are responding with collaborative strategies. Meanwhile, the trend toward digi-talization and technological innovation will likely reshape the global fi nancial sector and the ways in which fi nancial companies inter-act with their customers. For example, some global banks appear to be already shifting their distribution channels from brick-and-mortar operations to nonphysical channels, which will probably be the main channel of interaction between banks and consumers in the future. The proliferation of mobile de-vices and new demographics are two of the driving forces in this development, as well as the new solutions and products that are bet-ter addressing customer needs by increasing accessibility, speed, and convenience. These developments are likely increasing customer expectations for fi nancial services, and banks will fi nd it diffi cult to control all parts of the value chain using traditional business mod-els (Forrester Consulting 2015; PwC 2011). Recognizing this, banks seem to be shifting toward viewing fi ntech companies as partners and enablers rather than disruptors and com-petitors (Economist Intelligence Unit 2015). Incumbent banks are realizing that they need to take advantage of fi ntech capabilities to grow business, retain existing customers, and attract new ones (some of them previ-ously unbanked) in the medium to long runs. Meanwhile, without access to a client base, client trust, capital, licenses, and a robust global infrastructure, the new fi ntech compa-nies will discover that there are limits to their growth. Collaboration between incumbents
nonbank market is Western Union, a tradi-tional player, and yet it is holding about 15 percent of the total market share. This tra-ditional MTO provides more expensive ser-vices than the new initiatives, but it allows the transfer of cash in real time and without the need for bank accounts (a useful feature in developing economies). Meanwhile, the vol-ume of cryptocurrency transactions is rather limited compared with other electronic means (Schuh and Shy 2016), and the potential uses of blockchain for other applications are still in their infancy.
The low level of disruption to date is driven in part by the complementarity of the services provided by many fi ntech providers and traditional banks. In many instances, the new fi ntech companies complement (rather than substitute for) traditional banking, bringing alternative sources of external fi -nance to households and SMEs. For example, a large fraction of the market value in fi ntech has been created within the relatively new e-commerce ecosystem, which includes fi rms such as Alipay in China and Paypal in the United States. So, in that case, it seems like an opportunity lost rather than a loss of ex-isting earnings. Moreover, online lending is an alternative for the types of borrowers usu-ally underserved by traditional banks: SMEs and higher-risk households. This alternative lending method expanded worldwide dur-ing the banking crunch that followed the global fi nancial crisis, which hit small fi rms relatively hard. Since then, SMEs have been less able to secure traditional bank credit, and the new online lenders have opened up new pools of capital for them (Mills and Mc-Carthy 2014). This is of special relevance for households and fi rms in the developing world, where the banking system is often underdeveloped, but also for underserved borrowers in high-income economies. For example, Roure, Pelizzon, and Tasca (2016) fi nd that P2P loans in Germany serve riskier customers than traditional bank loans. Bla-seg and Koetter (2016) show that young fi rms in Germany are more likely to use online equity crowdfunding platforms when their banks are affected by credit crunches.
GLOBAL FINANCIAL DEVELOPMENT REPORT 2017/2018 C R O S S - B O R D E R L E N D I N G B Y I N T E R N A T I O N A L B A N K S 117
4. The ACIA, which came into effect in March 2012, aims to boost cross-border investments across ASEAN economies by establishing a free, open, transparent, and integrated invest-ment regime. The ACMF is a forum compris-ing capital market regulators from Brunei Darussalam, Cambodia, Indonesia, the Lao People’s Democratic Republic, Malaysia, Myanmar, the Philippines, Singapore, Thai-land, and Vietnam. It seeks to achieve greater integration of the region’s capital markets through the harmonization of capital market regulations.
5. Several reports have already highlighted the rising presence of the South in international fi nance, which has accounted for most of the growth in world capital fl ows since the 1990s (Aykut and Goldstein 2006; Aykut and Ratha 2004; Broner and others 2017; de la Torre and others 2015; World Bank 2006, 2011, 2013).
6. With the exception of South–North bank claims, which have expanded at a slower pace than North–North claims.
7. The largest 20 economies in the South are classifi ed according to their GDP in 2014.
8. Interregional lending refers to cross-border transactions with economies outside the region, whereas intraregional lending refers to cross-border transactions with economies inside the region.
9. The Gulf Cooperation Council economies are Bahrain, Kuwait, Oman, Qatar, Saudi Ara-bia, and the United Arab Emirates.
10. For cross-border bank claims, old connec-tions are those country-pair links that were established in 2001, and the new connections are those that were established later. For cross-border syndicated loans, old connec-tions are those country-pair links that were established in the period 1996–2001, and new connections are those that were estab-lished later.
11. Total EAP lending to the South (EAP-South) also includes cross-border intraregional lend-ing (EAP-EAP).
12. For example, the three largest Icelandic banks increased their assets from 100 percent of GDP in 2000 to more than 800 percent by 2007 (Wade and Sigurgeirsdottir 2011).
13. However, increasing regionalization could also constrain the global diffusion of banking technology and practices across economies as well as the effi cient allocation of capital around the world.
and new players is already taking place, and incumbent fi nancial institutions seem to be pouring increasing amount of investments into the fi ntech sector through fi ntech acqui-sitions, fi ntech investment funds, and fi ntech incubators and accelerators (KPMG 2016).
NOTES
1. In the context of this chapter, the “North” comprises Austria, Belgium, Canada, Den-mark, Finland, France, Germany, Greece, Ice-land, Ireland, Italy, Japan, Luxembourg, the Netherlands, Norway, Portugal, San Marino, Spain, Sweden, Switzerland, the United King-dom, and the United States. The “South” includes all other economies not in the North. Throughout this chapter, offshore fi nancial centers are excluded from the analysis.
2. Data on international bank claims consider the asset side and use the liability side to aug-ment incomplete reporting. Countries in the North have reported consistently since the 1980s, implying good coverage of North–North and North–South transactions and reasonable coverage of South–North trans-actions (through the liabilities reported by countries in the North). Reporting of South–South transactions remains relatively sparse, arguably leading to an underestimation of the value of these connections.
Locational banking statistics categorize banks according to the residency principle. For example, the claims that Spanish bank branches and subsidiaries operating in Chile might have in Brazil would be counted as Chilean claims on Brazil, not as Spanish claims on Brazil, as the BIS Consolidated Banking Statistics would report.
3. Because fl ows are more volatile than stocks, syndicated loans are averaged across years, and different time periods are used to describe the trends in cross-border bank claims (2001 versus 2014) and syndicated loans (1996–2001 versus 2002–14).
The value of each syndicated loan is divided equally among the number of lend-ers, splitting each transaction into several loans with a common borrower and different lenders. Data are then aggregated at the bilat-eral country level by summing the value of all transactions from a given source economy to a given recipient economy for every year in the sample.

118 C R O S S - B O R D E R L E N D I N G B Y I N T E R N A T I O N A L B A N K S GLOBAL FINANCIAL DEVELOPMENT REPORT 2017/2018
21. However, the fi rst P2P lending platform was launched in 2005 by Zopa in the United Kingdom.
22. Electronic payments accounted for 68 per-cent of U.S. transactions in 2012 (World Eco-nomic Forum 2016b).
23. The bitcoin system emerged in 2008 in a paper published by Nakamoto (2008), the alias used by the author, whose actual identity is still unknown.
24. See https://blockchain.info. 25. Bazot (2013) fi nds similar results in other
major countries such as France, Germany, and the United Kingdom.
26. See World Bank (2014) and Cull, Ehrbeck, and Holle (2014) for a summary of the research on the economic benefi ts of fi nancial inclusion.
27. According to the Global Findex Database (http://www.worldbank.org/en/programs/globalfi ndex), over 2 billion people are fi nan-cially excluded, but 90 percent of them have access to mobile phones.
28. Mobile payment options are growing more slowly in some high-income markets such as the United States, where the share of cash transactions is much lower (about 14 per-cent of all transactions) and the established electronic payment system (credit and debit cards) is well developed and effi cient (Crowe, Rysman, and Stavins 2010).
29. For example, Lending Club, the largest P2P platform in the United States, which became public in 2014, encountered irregularities in its loan origination and trading processes that caused its shares to plummet and its CEO to resign (Reuters 2016). The failure of several P2P platforms in Asia also led to calls for more regulation (Ecns.cn 2016).
30. According to Citigroup (2016), consumer banking revenue in North America disrupted by fi ntech companies is projected to grow to about 17 percent by 2023.
31. In a recent survey, only about 2 percent of SMEs in the United States reported using nonbank loans (NSBA 2016).
14. One indication of the increased size and sophistication of developing economies’ fi nancial systems is the growing presence of their banks in syndicated lending—syndi-cated loans typically include banks that are relatively reliable and well known.
15. This section is based on transaction-level data on corporate bonds and syndicated loans issued domestically and internationally, con-sidering issuances by both listed and nonlisted fi rms with an original maturity of one year or longer. Classifi cation of corporate bonds as domestic or international was undertaken by comparing the market location of the bond issuance with the issuing fi rm’s nationality. For syndicated loans, the nationality of the banks that participate in the deal is used to distinguish between domestic and cross-border lending. Following the criterion used in the previous section, syndicated loans are divided into tranches according to the num-ber of lenders. Domestic loans are defi ned as those loans in which the nationality of the lender bank is the same as the one of the issu-ing fi rm. Data on fi rms’ capital-raising activ-ity come from the SDC Platinum database.
Financial sector issuances are excluded throughout this section.
16. This approach is similar to the one pioneered by Khwaja and Mian (2008) for fi rms bor-rowing from different banks within a country and addresses the concern about composi-tional changes in the set of fi rms raising debt.
17. See Cortina, Didier, and Schmukler (2016) for details about calculation of the logit regressions.
18. Switching issuers not only changed the com-position between bond and loan issuances after 2008, but also compensated for the decline in syndicated loan fi nancing—that is, for those issuers, the increase in the amount raised through corporate bonds during the crisis years compensated for the decline in their syndicated loan issuances.
19. See Pesenti and Tille (2000) for a review of this topic.
20. See http://www.businessinsider.com/william-garrity-associates-global-fintech-heat-map-2015-9?r=UK&IR=T.

These appendixes present only a small part of the Global Financial Development Database (GFDD), available at http://www.worldbank.org/financialdevelopment. The 2017/2018 Global Financial Development Report is also accompanied by Financial Devel-opment Data Tables, which is a concise online edition of the GFDD for conve-nient reference, available at http://data.worldbank.org/ldbfd. It presents country-by-country and also regional data for a larger set of variables than what are shown here.
This section consists of two appendixes.
Appendix A presents basic economy-by-economy data on fi nancial system character-istics around the world. It also presents aver-ages of the same indicators for peer groups of countries, together with summary maps. It is an update on information from the 2015/2016 Global Financial Development Report.
Appendix B provides additional economy-by-economy information on key aspects of international banking around the world. It is specifi c to the 2017/2018 Global Financial Development Report.
Statistical Appendixes
G L O B A L F I N A N C I A L D E V E L O P M E N T R E P O R T 2 0 1 7 / 2 0 1 8 119
04--App A--119-128.indd 119 09/11/17 12:13 PM


GLOBAL FINANCIAL DEVELOPMENT REPORT 2017/2018 A P P E N D I X A 121
APPENDIX ABASIC DATA ON FINANCIAL SYSTEM CHARACTERISTICS, 2013–15
TABLE A.1 Economies and Their Financial System Characteristics, 2013–15
(appendix continued next page)
Financial institutions Financial markets
Economy
Private credit by deposit
money banks to GDP
(%)
Accountat a formalfi nancial
institution(%, age 15+)
Banklending-depositspread
(%)Bank
Z-score
Stock market capitalization
to GDP(%)
Market capitalization excluding top10 companiesto total market capitalization
(%)
Stockmarket
turnoverratio(%)
Stock pricevolatility
Afghanistan 3.8 9.6 10.8
Albania 37.2 34.7 6.6 15.3
Algeria 17.6 44.7 6.3 21.1
Andorra 22.4
Angola 20.4 32.6 13.0 11.3
Antigua and Barbuda 61.9 7.2 32.2
Argentina 11.7 44.5 3.2 7.3 7.9 30.1 7.3 34.0
Armenia 41.9 17.3 5.1 9.6 1.2 0.8
Aruba 61.5 6.5 24.5
Australia 125.8 98.9 3.1 7.6 87.7 52.8 58.8 12.2
Austria 89.1 96.8 3.4 20.3 24.8 40.7 28.7 18.7
Azerbaijan 28.3 24.4 8.5 2.8 0.1
Bahamas, The 75.5 3.2 16.6
Bahrain 67.5 76.1 4.6 15.5 62.2 27.7 2.2 7.1
Bangladesh 40.1 30.0 2.8 7.8 14.5 65.1 15.2
Barbados 77.5 6.3 13.1 107.3 0.4
Belarus 21.2 67.5 0.2 4.4
Belgium 57.1 97.5 5.2 14.7 72.3 30.2 15.7
Belize 55.4 48.2 7.9 8.1
Benin 21.9 14.1 2.0 10.9
Bermuda 13.7 3.0 15.3
Bhutan 43.0 33.7 9.3 32.7 9.6
Bolivia 42.1 36.5 7.6 9.7 15.9 0.4
Bosnia and Herzegovina 52.5 53.9 3.9 7.8 13.5 9.2
Botswana 30.9 42.9 6.3 10.1 28.5 2.7 3.6
Brazil 66.4 64.0 24.3 10.5 37.2 48.9 72.4 22.7
Brunei Darussalam 34.2 5.2 9.0
Bulgaria 61.8 59.6 6.7 8.9 13.6 5.0 14.3
Burkina Faso 25.8 13.4 3.2 7.4
Burundi 16.5 7.0 8.0 11.6
Cabo Verde 61.8 7.1 23.7
Cambodia 48.3 9.6 10.7
Cameroon 14.6 12.5 10.8 11.2
Canada 126.6 98.0 2.5 14.0 106.0 72.3 64.4 11.1
04--App A--119-128.indd 121 09/11/17 12:13 PM

122 A P P E N D I X A GLOBAL FINANCIAL DEVELOPMENT REPORT 2017/2018
TABLE A.1 Economies and Their Financial System Characteristics, 2013–15 (continued)
Financial institutions Financial markets
Economy
Private credit by deposit
money banks to GDP
(%)
Accountat a formalfi nancial
institution(%, age 15+)
Banklending-depositspread
(%)Bank
Z-score
Stock market capitalization
to GDP(%)
Market capitalization excluding top10 companiesto total market capitalization
(%)
Stockmarket
turnoverratio(%)
Stock pricevolatility
Cayman Islands 17.1 1.0
Central African Republic 13.8 3.3 10.8 7.4
Chad 7.9 8.1 10.8 11.9
Channel Islands 0.1
Chile 75.5 56.2 3.4 7.1 91.8 54.4 12.0 12.6
China 132.4 73.9 2.9 22.7 50.7 81.1 331.6 20.7
Colombia 40.5 35.7 6.8 7.8 46.1 25.8 10.3 14.9
Comoros 23.2 21.7 8.8
Congo, Dem. Rep. 5.4 8.5 15.0 4.6
Congo, Rep. 14.5 14.5 10.8 5.0
Costa Rica 51.0 59.8 11.6 18.2 3.8 1.9 37.9
Côte d’Ivoire 18.7 15.1 1.0 6.6 35.8 3.7
Denmark 178.7 99.9 4.7 13.6 61.2 53.5 16.2
Croatia 68.8 86.8 7.7 4.7 37.0 2.4 9.2
Cuba 14.0
Curaçao 7.8
Cyprus 255.3 88.5 3.3 6.0 12.5 10.7 2.7 45.6
Czech Republic 49.6 81.7 3.9 4.5 17.6 28.1 15.2
Djibouti 29.4 12.3 10.6 16.4
Dominica 54.9 6.1 10.0
Dominican Republic 23.3 48.7 7.7 22.3 0.7
Ecuador 26.3 43.1 9.7 5.1 6.7 2.3 5.9
Egypt, Arab Rep. 25.2 12.3 4.7 18.6 20.3 52.8 28.8 23.7
El Salvador 41.0 27.7 4.6 24.9 34.1 0.6
Equatorial Guinea 9.8 10.8 17.5
Eritrea 12.7 6.3
Estonia 69.3 97.4 4.4 9.3 8.5 9.4 10.7
Ethiopia 17.2 21.8 3.3 7.5
Fiji 58.3 3.7 25.3 10.7 1.6
Finland 92.9 99.9 2.7 10.2 57.2 86.1 16.9
France 94.9 96.7 4.4 19.7 76.9 53.2 18.2
Gabon 14.1 26.4 10.8 10.9
Gambia, The 13.6 12.8 6.3
Georgia 41.0 37.4 3.6 6.2 5.5 0.2
Germany 79.7 98.6 7.0 22.6 46.9 54.5 78.6 17.1
Ghana 16.0 32.9 9.1 7.2 7.5 1.7 8.1
04--App A--119-128.indd 122 09/11/17 12:13 PM

GLOBAL FINANCIAL DEVELOPMENT REPORT 2017/2018 A P P E N D I X A 123
Financial institutions Financial markets
Economy
Private credit by deposit
money banks to GDP
(%)
Accountat a formalfi nancial
institution(%, age 15+)
Banklending-depositspread
(%)Bank
Z-score
Stock market capitalization
to GDP(%)
Market capitalization excluding top10 companiesto total market capitalization
(%)
Stockmarket
turnoverratio(%)
Stock pricevolatility
Gibraltar 31.1
Greece 117.8 84.3 4.3 7.6 26.2 19.9 42.1 37.0
Grenada 67.5 6.9 11.9
Guatemala 31.3 34.6 8.1 21.9 0.8 6.6
Guinea 10.3 5.3 11.9 5.2
Guinea-Bissau 11.9 4.2 4.8
Guyana 35.0 11.9 22.2 18.4 0.3
Haiti 17.4 19.0 8.3 19.2
Honduras 53.0 26.9 9.7 31.8 684.5
Hong Kong SAR, China 211.5 93.7 5.0 17.6 1062.4 66.0 51.3 16.5
Hungary 43.6 72.4 3.0 3.2 13.2 3.4 48.2 18.1
Iceland 102.7 7.2 3.1 16.6 29.1 11.2
India 49.7 46.9 8.9 66.3 71.7 50.9 15.6
Indonesia 30.7 30.5 4.5 4.1 40.9 54.2 24.3 17.1
Iran, Islamic Rep. 48.3 86.0 0.1 41.9 50.7 15.9
Iraq 7.4 10.8 27.6
Ireland 95.3 94.4 2.6 10.0 60.8 8.8 12.6 15.8
Israel 64.7 90.1 3.0 24.7 67.1 42.3 26.4 11.4
Italy 90.5 81.9 4.9 9.9 27.4 38.1 273.5 24.2
Jamaica 28.4 75.9 12.7 8.0 45.2 3.1 11.9
Japan 103.9 96.6 0.8 14.0 86.7 83.1 135.0 20.3
Jordan 69.0 24.9 4.5 33.2 72.7 35.1 13.0 7.9
Kazakhstan 34.1 50.0 2.1 11.7 17.0 5.6 23.6
Kenya 31.0 50.9 7.9 16.5 25.4 7.9 10.7
Korea, Rep. 127.7 93.9 1.7 9.9 89.6 67.0 122.1 12.9
Kosovo 33.0 46.6 9.7
Kuwait 72.5 77.5 2.3 14.7 56.7 23.3 10.2
Kyrgyz Republic 17.3 13.6 20.2 18.6 2.4 3.4
Lao PDR 18.9 26.8 19.6 7.2 17.5
Latvia 54.7 90.0 5.8 4.3 3.7 3.0 14.0
Lebanon 92.8 43.6 1.3 20.8 23.8 4.0 7.1
Lesotho 19.2 18.5 7.6 8.4
Liberia 16.7 18.8 9.5 10.0
Libya 14.5 3.5 30.3
Lithuania 42.0 76.5 4.3 5.6 9.2 4.4 9.0
Luxembourg 90.6 95.6 2.0 34.8 106.5 4.7 0.2 15.7
TABLE A.1 Economies and Their Financial System Characteristics, 2013–15 (continued)
(appendix continued next page)
04--App A--119-128.indd 123 09/11/17 12:13 PM
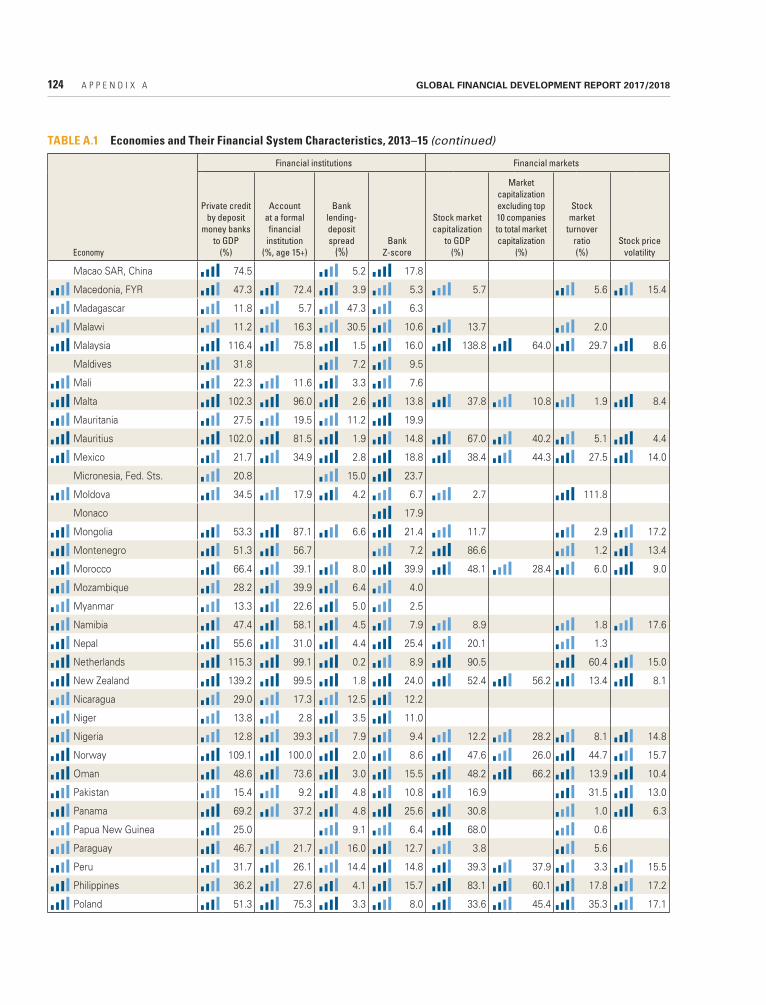
124 A P P E N D I X A GLOBAL FINANCIAL DEVELOPMENT REPORT 2017/2018
TABLE A.1 Economies and Their Financial System Characteristics, 2013–15 (continued)
Financial institutions Financial markets
Economy
Private credit by deposit
money banks to GDP
(%)
Accountat a formalfi nancial
institution(%, age 15+)
Banklending-depositspread
(%)Bank
Z-score
Stock market capitalization
to GDP(%)
Market capitalization excluding top10 companiesto total market capitalization
(%)
Stockmarket
turnoverratio(%)
Stock pricevolatility
Macao SAR, China 74.5 5.2 17.8
Macedonia, FYR 47.3 72.4 3.9 5.3 5.7 5.6 15.4
Madagascar 11.8 5.7 47.3 6.3
Malawi 11.2 16.3 30.5 10.6 13.7 2.0
Malaysia 116.4 75.8 1.5 16.0 138.8 64.0 29.7 8.6
Maldives 31.8 7.2 9.5
Mali 22.3 11.6 3.3 7.6
Malta 102.3 96.0 2.6 13.8 37.8 10.8 1.9 8.4
Mauritania 27.5 19.5 11.2 19.9
Mauritius 102.0 81.5 1.9 14.8 67.0 40.2 5.1 4.4
Mexico 21.7 34.9 2.8 18.8 38.4 44.3 27.5 14.0
Micronesia, Fed. Sts. 20.8 15.0 23.7
Moldova 34.5 17.9 4.2 6.7 2.7 111.8
Monaco 17.9
Mongolia 53.3 87.1 6.6 21.4 11.7 2.9 17.2
Montenegro 51.3 56.7 7.2 86.6 1.2 13.4
Morocco 66.4 39.1 8.0 39.9 48.1 28.4 6.0 9.0
Mozambique 28.2 39.9 6.4 4.0
Myanmar 13.3 22.6 5.0 2.5
Namibia 47.4 58.1 4.5 7.9 8.9 1.8 17.6
Nepal 55.6 31.0 4.4 25.4 20.1 1.3
Netherlands 115.3 99.1 0.2 8.9 90.5 60.4 15.0
New Zealand 139.2 99.5 1.8 24.0 52.4 56.2 13.4 8.1
Nicaragua 29.0 17.3 12.5 12.2
Niger 13.8 2.8 3.5 11.0
Nigeria 12.8 39.3 7.9 9.4 12.2 28.2 8.1 14.8
Norway 109.1 100.0 2.0 8.6 47.6 26.0 44.7 15.7
Oman 48.6 73.6 3.0 15.5 48.2 66.2 13.9 10.4
Pakistan 15.4 9.2 4.8 10.8 16.9 31.5 13.0
Panama 69.2 37.2 4.8 25.6 30.8 1.0 6.3
Papua New Guinea 25.0 9.1 6.4 68.0 0.6
Paraguay 46.7 21.7 16.0 12.7 3.8 5.6
Peru 31.7 26.1 14.4 14.8 39.3 37.9 3.3 15.5
Philippines 36.2 27.6 4.1 15.7 83.1 60.1 17.8 17.2
Poland 51.3 75.3 3.3 8.0 33.6 45.4 35.3 17.1
04--App A--119-128.indd 124 09/11/17 12:13 PM

GLOBAL FINANCIAL DEVELOPMENT REPORT 2017/2018 A P P E N D I X A 125
Financial institutions Financial markets
Economy
Private credit by deposit
money banks to GDP
(%)
Accountat a formalfi nancial
institution(%, age 15+)
Banklending-depositspread
(%)Bank
Z-score
Stock market capitalization
to GDP(%)
Market capitalization excluding top10 companiesto total market capitalization
(%)
Stockmarket
turnoverratio(%)
Stock pricevolatility
Portugal 134.7 85.3 2.8 12.9 29.7 63.5 18.7
Puerto Rico 69.7
Qatar 47.9 65.9 3.4 24.5 86.2 27.6 20.1 12.8
Romania 32.3 55.4 5.4 4.7 10.2 12.3 13.3
Russian Federation 52.2 61.0 5.2 5.2 28.4 38.7 32.3 20.7
Rwanda 18.6 36.4 9.2 6.4
Samoa 41.5 7.1 12.0
San Marino 123.5 9.2
São Tomé and Príncipe 27.6 13.0 2.9
Saudi Arabia 44.8 61.7 14.6 63.2 47.0 100.7 15.8
Senegal 31.4 9.9 1.0 5.4
Serbia 43.9 76.1 8.4 11.4 17.7 4.0 11.0
Seychelles 21.5 9.1 8.7
Sierra Leone 4.7 14.5 12.9 4.9
Singapore 124.4 97.0 5.2 19.8 240.5 72.9 31.2 10.3
Slovak Republic 48.8 78.0 2.0 14.4 4.9 2.3 17.4
Slovenia 61.6 97.2 4.5 2.1 14.6 62.7 7.3 16.4
Solomon Islands 20.4 10.4
Somalia 15.6
South Africa 65.9 63.7 3.3 13.4 245.2 77.2 28.2 13.8
South Sudan 1.4 12.2 8.3
Spain 134.5 96.1 1.8 18.7 73.8 32.2 100.5 21.4
Sri Lanka 26.2 78.0 0.6 11.4 25.7 59.6 9.7 10.3
St. Kitts and Nevis 59.8 5.9 13.6 81.1 0.9
St. Lucia 103.2 6.3 4.8
St. Vincent and the Grenadines 52.3 6.8 15.3
Sudan 8.0 12.5 23.8
Suriname 28.1 5.0 14.9
Swaziland 19.3 28.6 6.6 14.8 6.3 1.7
Sweden 127.9 99.5 2.5 11.9 92.8 74.5 15.8
Switzerland 169.3 98.0 2.7 13.9 213.7 29.2 54.3 14.2
Syrian Arab Republic 20.4 23.3 3.7 10.7
Taiwan, China 90.0 13.3 69.7
Tajikistan 17.0 8.5 19.5 12.0
Tanzania 12.8 18.4 6.2 11.9 4.3 1.6 14.5
(appendix continued next page)
TABLE A.1 Economies and Their Financial System Characteristics, 2013–15 (continued)
04--App A--119-128.indd 125 09/11/17 12:13 PM

126 A P P E N D I X A GLOBAL FINANCIAL DEVELOPMENT REPORT 2017/2018
NOTES
Economy: A territorial entity for which statis-tical data are maintained and provided inter-nationally on a separate and independent basis (not necessarily a state as understood by international law and practice). The term, used interchangeably with country, does not imply political independence or offi cial recognition by the World Bank.
Table layout: The layout of the table fol-lows the 4x2 matrix of financial system
characteristics introduced in the 2013 Global Financial Development Report, with four variables approximating depth, access, effi -ciency, and stability of fi nancial institutions and fi nancial markets, respectively.
Additional data: The table above presents a small fraction of observations in the Global Financial Development Database, accompa-nying this report. For additional variables, historical data, and detailed metadata, see
TABLE A.1 Economies and Their Financial System Characteristics, 2013–15 (continued)
Source: Data from and calculations based on the Global Financial Development Database. For more information, see Cihák and others 2013.Note: Empty cells indicate a lack of data.
Financial institutions Financial markets
Economy
Private credit by deposit
money banks to GDP
(%)
Accountat a formalfi nancial
institution(%, age 15+)
Banklending-depositspread
(%)Bank
Z-score
Stock market capitalization
to GDP(%)
Market capitalization excluding top10 companiesto total market capitalization
(%)
Stockmarket
turnoverratio(%)
Stock pricevolatility
Thailand 111.6 76.3 4.7 3.2 93.5 62.9 81.8 16.4
Timor-Leste 13.2 12.1
Togo 32.5 15.1 2.9 3.1
Tonga 30.0 6.1 4.9
Trinidad and Tobago 32.2 75.9 6.2 25.3 65.2 0.8
Tunisia 71.2 28.9 2.5 23.2 19.4 14.3 7.0
Turkey 60.4 56.9 7.7 26.9 52.4 175.6 23.9
Turkmenistan 1.3 2.6
Tuvalu 10.9
Uganda 12.4 25.3 10.7 10.6 30.7 0.2
Ukraine 55.2 48.9 6.8 5.2 13.1 5.2 30.6
United Arab Emirates 65.2 75.4 4.4 27.2 45.9 23.3 39.7 15.2
United Kingdom 145.9 98.4 2.7 13.6 112.1 69.0 84.9 12.6
United States 49.5 91.7 27.9 139.5 74.6 156.0 12.6
Uruguay 27.9 38.1 9.6 5.5 0.3 0.8
Uzbekistan 34.6 6.7 5.9
Vanuatu 69.5 3.2 9.7
Venezuela, RB 27.9 52.6 2.8 6.8 3.7 0.3 32.5
Vietnam 96.4 27.7 2.8 5.9 23.6 38.7 17.9
West Bank and Gaza 29.0 22.6 17.6 25.1 9.6 10.6
Yemen, Rep. 5.6 5.5 6.8 19.1
Zambia 12.5 28.0 3.7 2.9 13.8 5.7
Zimbabwe 8.0 24.7 3.4 136.5 0.0
04--App A--119-128.indd 126 09/11/17 12:14 PM

GLOBAL FINANCIAL DEVELOPMENT REPORT 2017/2018 A P P E N D I X A 127
the full data set at http://www.worldbank.org/fi nancialdevelopment.
Period covered: The table shows averages of values for 2013–15, where available.
Averaging: Each observation is an arithmetic average of the corresponding variable over 2013–15. When a variable is not reported or not available for a part of this period, the average is calculated using the forwarded value from the most recent observation available.
Visualization: To illustrate where an econ-omy’s observation is in relation to the global distribution of the variable, the table includes four bars on the left of each observation. The four-bar scale is based on the location of the economy in the statistical distribution of the variable in the Global Financial Develop-ment Database: values below the 25th per-centile show only one full bar, values equal to or greater than the 25th and less than the 50th percentile show two full bars, values equal to or greater than the 50th and less than the 75th percentile show three full bars, and values greater than the 75th percentile show four full bars. At the economy level, bars are calculated using winsorized and res-caled values, as described in the 2013 Global Financial Development Report. To prepare for this, the 95th and 5th percentile for each variable for the entire pooled economy-year data set are calculated, and the top and bottom 5 percent of observations are trun-cated. Specifi cally, all observations from the 5th percentile to the minimum are replaced by the value corresponding to the 5th per-centile, and all observations from the 95th percentile to the maximum are replaced by the value corresponding to the 95th percen-tile. To convert all the variables to a 0–100 scale, each score is rescaled by the maximum and the minimum for each indicator. The rescaled indicator can be interpreted as the percent distance between the worst (0) and the best (100) financial development out-come, defined by the 5th and 95th percen-tiles of the original distribution. The four bars on the left of the economy name show
the unweighted arithmetic average of the rescaled variables (dimensions) for each economy. This average is reported only for those economies for which data for 2013–15 are available for at least four variables (dimensions).
Private credit by deposit money banks to GDP (%) measures the domestic private credit to the real sector by deposit money banks as a percentage of local currency GDP. Data on domestic private credit to the real sector by deposit money banks are from the International Financial Statistics (IFS), line FOSAOP/22D, published by the Interna-tional Monetary Fund (IMF). Local currency GDP is also from IFS.
Account at a formal fi nancial institution (%, age 15+) measures the percentage of adults with an account (self or together with some-one else) at a bank, credit union, another financial institution (e.g., cooperative, microfi nance institution), or the post offi ce (if applicable), including adults who report having a debit card. The data are from the Global Financial Inclusion (Global Findex) Database (Demirgüç-Kunt, Klapper, and others 2014).
Bank lending-deposit spread (percentage points) is lending rate minus deposit rate. Lending rate is the rate charged by banks on loans to the private sector, and deposit interest rate is the rate paid by commercial or similar banks for demand, time, or sav-ings deposits. The lending and deposit rates are from IFS lines FILR/60P and FIDR/60L, respectively.
Bank Z-score is calculated as [ROA + (equity /assets)] / (standard deviation of ROA). To approximate the probability that a an econ-omy’s banking system defaults, the indica-tor compares the system’s buffers (returns and capitalization) with the system’s riski-ness (volatility of returns). Return on Assets (ROA), equity, and assets are economy-level aggregate fi gures (calculated from underly-ing bank-by-bank unconsolidated data from Bankscope and Orbis Bank Focus).
04--App A--119-128.indd 127 09/11/17 12:14 PM

128 A P P E N D I X A GLOBAL FINANCIAL DEVELOPMENT REPORT 2017/2018
Stock market capitalization to GDP (%) mea-sures the capitalization of all equity markets as percentage of GDP. Market capitalization (also known as market value) is the share price times the number of shares outstanding. Listed domestic companies are the domesti-cally incorporated companies listed on the economy’s stock exchanges at the end of the year. Listed companies do not include invest-ment companies, mutual funds, or other col-lective investment vehicles. Data are from World Federation of Exchanges (WFE), Stan-dard & Poor’s Global Stock Markets Fact-book, and supplemental Standard & Poor’s data, and are compiled and reported by the World Development Indicators.
Market capitalization excluding top 10 com-panies to total market capitalization (%) measures the ratio of market capitalization outside of the top 10 largest companies to
total market capitalization. The WFE pro-vides data on the exchange level. This vari-able is aggregated up to the economy level by taking a simple average over exchanges.
Stock market turnover ratio (%) is the total value of shares traded during the period divided by the average market capitaliza-tion for the period. Average market capi-talization is calculated as the average of the end-of-period values for the current period and the previous period. Data are from the WFE, Standard & Poor’s Global Stock Mar-kets Factbook, and supplemental Standard & Poor’s data, and are compiled and reported by the World Development Indicators.
Stock price volatility is the 360-day stan-dard deviation of the return on the primary national stock market index. The data are from Bloomberg.
04--App A--119-128.indd 128 09/11/17 12:14 PM

GLOBAL FINANCIAL DEVELOPMENT REPORT 2017/2018 A P P E N D I X A 129
MAP A.1 DEPTH—FINANCIAL INSTITUTIONS
Source: Global Financial Development Database, 2013–15 data.Note: OECD = Organization for Economic Co-operation and Development. Weighted average by current GDP.
TABLE A.1.1 Depth—Financial Institutions
Private credit by deposit money banks to GDP (%)
Number of countries Average Median
Standard deviation Minimum Maximum
Weighted average
World 185 51.4 41.5 41.3 1.4 255.3 83.1By developed/developing economies
Developed economies 56 89.6 76.5 46.1 21.5 255.3 85.9Developing economies 129 34.9 28.4 24.9 1.4 132.4 78.3By income level
High income 56 89.6 76.5 46.1 21.5 255.3 85.9Upper-middle income 50 47.9 45.3 28.7 7.4 132.4 90.1Lower-middle income 50 32.4 29 18.8 5.6 96.4 38.1Low income 29 16.6 13.8 10.9 1.4 55.6 17.1By region
High income: OECD 33 97.5 94.9 36.5 43.6 178.7 86High income: non-OECD 23 78.3 65.2 56.1 21.5 255.3 83East Asia and Pacifi c 18 52 38.9 38 13.2 132.4 120.4Europe and Central Asia 19 40.1 41 13.6 17 61.8 50.6Latin America and the Caribbean 25 42.2 40.5 20.4 11.7 103.2 42.5Middle East and North Africa 13 38.2 29 28.2 5.6 92.8 35South Asia 8 33.2 36 17.5 3.8 55.6 44.7Sub-Saharan Africa 46 21.3 16.2 17.8 1.4 102 26.6
To approximate financial institutions’ depth, this map uses domestic private credit to the real sector by deposit money banks as a percentage of local currency GDP. Data on domestic private credit to the real sector by deposit money banks are from the International Financial Statistics (IFS), line
FOSAOP/22D, published by the International Mon-etary Fund (IMF). Local currency GDP is also from IFS. The four shades of blue in the map are based on the average value of the variable in 2013–15: the darker the blue, the higher the quartile of the statisti-cal distribution of the variable.
05--AppA--Maps--129-136.indd 129 09/11/17 1:31 PM

130 A P P E N D I X A GLOBAL FINANCIAL DEVELOPMENT REPORT 2017/2018
MAP A.2 ACCESS—FINANCIAL INSTITUTIONS
To approximate access to fi nancial institutions, this map uses the percentage of adults (age 15+) who reported having an account at a formal fi nancial insti-tution. The data are taken from the Global Financial
Inclusion (Global Findex) Database. The four shades of blue in the map are based on the value of the vari-able in 2014: the darker the blue, the higher the quar-tile of the statistical distribution of the variable.
Source: Global Financial Development Database, 2014 data.Note: OECD = Organization for Economic Co-operation and Development. Weighted average by total adult population in 2014.
TABLE A.1.2 Access—Financial Institutions
Account at a formal fi nancial institution (%, age 15+)
Number of countries Average Median
Standard deviation Minimum Maximum
Weighted average
World 157 49.8 43.6 31.5 1.3 100 53.7By developed/developing economies
Developed economies 48 87.1 92.7 13.6 38.1 100 91.1Developing economies 109 33.4 28 21.5 1.3 87.1 46.5By income level
High income 48 87.1 92.7 13.6 38.1 100 91.1Upper-middle income 41 49.8 50 19.9 1.3 86 64.8Lower-middle income 42 28 27.2 17 5.5 87.1 36.2Low income 26 16.1 14.8 9.6 2.8 39.9 17.1By regionHigh income: OECD 32 91.8 96.6 10.2 56.2 100 92.5High income: non-OECD 16 77.7 76.3 15 38.1 97 72.2East Asia and Pacifi c 10 45.8 29.1 28.7 9.6 87.1 62Europe and Central Asia 21 42.6 48.9 21.8 1.3 76.1 52Latin America and the Caribbean 19 39.7 36.5 15.8 17.3 75.9 46.5Middle East and North Africa 12 29.5 24.1 22 5.5 86 36.3South Asia 7 34.1 31 23.6 9.2 78 40.7Sub-Saharan Africa 40 23.4 18.5 17.3 2.8 81.5 26.2
05--AppA--Maps--129-136.indd 130 09/11/17 1:31 PM

GLOBAL FINANCIAL DEVELOPMENT REPORT 2017/2018 A P P E N D I X A 131
MAP A.3 EFFICIENCY—FINANCIAL INSTITUTIONS
To approximate effi ciency of fi nancial institutions, this map uses the spread (difference) between lend-ing rate and deposit interest rate. Lending rate is the rate charged by banks on loans to the private sector, and deposit interest rate is the rate paid by commer-cial or similar banks for demand, time, or savings
deposits. The lending and deposit rates are from IFS, lines FILR/60P and FIDR/60L, respectively. The four shades of blue in the map are based on the average value of the variable in 2013–15: the darker the blue, the higher the quartile of the statistical distribution of the variable.
Source: Global Financial Development Database, 2013–15 data.Note: OECD = Organization for Economic Co-operation and Development. Weighted average by total banking assets.
TABLE A.1.3 Effi ciency—Financial Institutions
Bank lending-deposit spread (%)Number of countries Average Median
Standard deviation Minimum Maximum
Weighted average
World 170 6.7 5.2 5.5 0.1 47.3 5.1By developed/developing economies
Developed economies 53 4.1 3.4 2 0.2 9.6 3.8Developing economies 117 7.9 6.8 6.1 0.1 47.3 6.5By income level
High income 53 4.1 3.4 2 0.2 9.6 3.8Upper-middle income 46 6.7 6.2 4.6 0.1 24.3 6.1Lower-middle income 45 7.9 7.1 4.6 0.6 20.2 6.8Low income 26 10 8.5 9.7 1 47.3 7.9By region
High income: OECD 32 3.3 3 1.6 0.2 7.2 3.2High income: non-OECD 21 5.3 5.2 2 2.3 9.6 4.8East Asia and Pacifi c 17 7 5 4.9 1.5 19.6 4.8Europe and Central Asia 15 7.2 5.4 5.5 0.2 20.2 6.1Latin America and the Caribbean 25 8.7 7.7 4.8 2.8 24.3 9.3Middle East & North Africa 11 4.7 4.5 3.1 0.1 10.6 4South Asia 6 4.9 4.6 3.1 0.6 9.3 4.9Sub-Saharan Africa 43 9.1 8 7.9 1 47.3 7.2
05--AppA--Maps--129-136.indd 131 09/11/17 1:31 PM

132 A P P E N D I X A GLOBAL FINANCIAL DEVELOPMENT REPORT 2017/2018
MAP A.4 STABILITY—FINANCIAL INSTITUTIONS
To approximate stability of financial institutions, this map uses the Z-score for commercial banks. The indicator is estimated as follows: [ROA + (equity / assets)] / (standard deviation of ROA). Return on assets (ROA), equity, and assets are economy-level aggregate fi gures (calculated from underlying bank-by-bank unconsolidated data from Bankscope). The
indicator compares the banking system’s buffers (returns and capital) with its riskiness (volatility of returns). The four shades of blue in the map are based on the average value of the variable in 2013–15: the darker the blue, the higher the quartile of the statisti-cal distribution of the variable.
Source: Global Financial Development Database, 2013–15 data.Note: OECD = Organization for Economic Co-operation and Development. Weighted average by total banking assets.
TABLE A.1.4 Stability—Financial Institutions
Bank Z-scoreNumber of countries Average Median
Standard deviation Minimum Maximum
Weighted average
World 192 12.9 10.9 7.7 2.1 39.9 13.7By developed/developing economies
Developed economies 63 14.4 13.7 7.6 2.1 34.8 14Developing economies 129 12.1 10.5 7.6 2.1 39.9 13.4By income level
High income 63 14.4 13.7 7.6 2.1 34.8 14Upper-middle income 52 12.6 10.9 7.6 2.1 33.2 13.4Lower-middle income 49 13.5 10.8 8.4 2.5 39.9 14.8Low income 28 8.7 7.5 4.8 3.1 25.4 9.2By region
High income: OECD 33 13 11.9 7.6 2.1 34.8 13.3High income: non-OECD 30 16 15.1 7.5 4.7 32.2 15.3East Asia and Pacifi c 17 11.9 10.7 7.6 2.5 25.3 12.7Europe and Central Asia 21 7.6 6.7 4.1 2.1 18.6 7.7Latin America and the Caribbean 26 14.6 13.3 7.1 4.8 31.8 14.2Middle East and North Africa 12 23.2 21 8.1 10.7 39.9 24.5South Asia 8 14.7 10.8 9.2 7.8 32.7 15.4Sub-Saharan Africa 45 9.5 8.3 5.1 2.9 23.8 10.4
05--AppA--Maps--129-136.indd 132 09/11/17 1:31 PM

GLOBAL FINANCIAL DEVELOPMENT REPORT 2017/2018 A P P E N D I X A 133
MAP A.5 DEPTH—FINANCIAL MARKETS
To approximate depth of fi nancial markets, this map uses stock market capitalization as percentage of GDP. Market capitalization (also known as market value) is the share price times the number of shares outstand-ing. Listed domestic companies are the domestically incorporated companies listed on the economy’s stock exchanges at the end of the year. Listed companies do not include investment companies, mutual funds, or
other collective investment vehicles. Data are from WFE, Standard & Poor’s Global Stock Markets Fact-book, and supplemental S&P data, and are compiled and reported by the World Development Indicators. The four shades of blue in the map are based on the average value of the variable in 2013–15: the darker the blue, the higher the quartile of the statistical dis-tribution of the variable.
Source: Global Financial Development Database, 2013–15 data.Note: OECD = Organization for Economic Co-operation and Development. Weighted average by current GDP.
TABLE A.1.5 Depth—Financial Markets
Stock market capitalization to GDP (%)Number of countries Average Median
Standard deviation Minimum Maximum
Weighted average
World 117 72.4 38.4 125.3 0.1 1077.7 130.8By developed/developing economies
Developed economies 49 110.8 79.3 154.4 0.3 1077.7 164.3Developing economies 68 44.8 19.7 90.8 0.1 684.5 68.6By income level
High income 49 110.8 79.3 154.4 0.3 1077.7 164.3Upper-middle income 35 42.9 24.6 56.1 0.1 262.7 74.1Lower-middle income 28 47.7 18.1 126.6 0.8 684.5 48.3Low income 5 41.1 20.1 54.2 4.3 136.5 30.3By region
High income: OECD 33 102.3 99.2 63 3.7 231.4 162.1High income: non-OECD 16 128.5 59.5 259.4 0.3 1077.7 207East Asia and Pacifi c 9 73.2 68 60.5 10.7 190.8 90.1Europe and Central Asia 15 16.6 11.7 21.8 0.1 86.6 28.4Latin America and the Caribbean 17 63.1 18.4 161.6 0.7 684.5 50Middle East and North Africa 7 36 25.1 19.6 19.4 72.7 35South Asia 6 26.3 18.5 22.6 9.6 71.2 60.1Sub-Saharan Africa 14 46.7 19.6 71.3 4.3 262.7 90
05--AppA--Maps--129-136.indd 133 09/11/17 1:31 PM

134 A P P E N D I X A GLOBAL FINANCIAL DEVELOPMENT REPORT 2017/2018
MAP A.6 ACCESS—FINANCIAL MARKETS
To approximate access to fi nancial markets, this map uses the ratio of market capitalization excluding the top 10 largest companies to total market capitaliza-tion. The WFE provides data on the exchange level. This variable is aggregated up to the economy level
by taking a simple average over exchanges. The four shades of blue in the map are based on the average value of the variable in 2013–15: the darker the blue, the higher the quartile of the statistical distribution of the variable.
Source: Global Financial Development Database, 2013–15 data.Note: OECD = Organization for Economic Co-operation and Development. Weighted average by stock market capitalization.
TABLE A.1.6 Access—Financial Markets
Market capitalization excluding top 10 companiesto total market capitalization (%)
Number of countries Average Median
Standard deviation Minimum Maximum
Weighted average
World 53 45.7 47 21.1 3.4 83.1 55By developed/developing economies
Developed economies 31 43.8 45.4 23.5 3.4 83.1 54.2Developing economies 22 48.2 49.8 17.4 17 81.1 56.8By income level
High income 31 43.8 45.4 23.5 3.4 83.1 54.2Upper-middle income 15 47.1 44.3 18.2 17 81.1 57.4Lower-middle income 7 50.7 54.2 16.5 28.2 71.7 54.9Low income 0By region
High income: OECD 21 44.6 45.4 23.4 3.4 83.1 47.9High income: non-OECD 10 42.2 37.3 25 10.7 72.9 60East Asia and Pacifi c 5 64.5 62.9 10 54.2 81.1 64.1Europe and Central Asia 3 36 38.7 17.9 17 52.4 40.4Latin America and the Caribbean 5 37.4 37.9 9.6 25.8 48.9 38.1Middle East and North Africa 4 41.8 42.9 11.9 28.4 52.8 38.9South Asia 2 65.7 65.7 8.6 59.6 71.7 68.4Sub-Saharan Africa 3 48.5 40.2 25.5 28.2 77.2 67.7
05--AppA--Maps--129-136.indd 134 09/11/17 1:31 PM

GLOBAL FINANCIAL DEVELOPMENT REPORT 2017/2018 A P P E N D I X A 135
MAP A.7 EFFICIENCY—FINANCIAL MARKETS
To approximate effi ciency of fi nancial markets, this map uses the total value of shares traded during the period divided by the average market capitalization for the period. Average market capitalization is cal-culated as the average of the end-of-period values for the current period and the previous period. Data are from WFE, Standard & Poor’s Global Stock Markets
Factbook, and supplemental S&P data, and is com-piled and reported by the World Development Indi-cators. The four shades of blue in the map are based on the average value of the variable in 2013–15: the darker the blue, the higher the quartile of the statisti-cal distribution of the variable.
Source: Global Financial Development Database, 2013–15 data.Note: OECD = Organization for Economic Co-operation and Development. Weighted average by stock market capitalization.
TABLE A.1.7 Effi ciency—Financial Markets
Stock market turnover ratio (%)Number of countries Average Median
Standard deviation Minimum Maximum
Weighted average
World 116 30.6 9.5 50.5 0 331.6 43.7By developed/developing economies
Developed economies 52 42.2 28.9 50.2 0.1 273.5 51.7Developing economies 64 21.3 5.6 49.2 0 331.6 28.1By income level
High income 52 42.2 28.9 50.2 0.1 273.5 51.7Upper-middle income 32 27.9 5.3 65.3 0.2 331.6 38.1Lower-middle income 27 17.2 6.6 25.1 0.4 111.8 17.2Low income 5 1 1.3 0.9 0 2 0.3By region
High income: OECD 33 57.3 48.2 54.8 0.2 273.5 66.3High income: non-OECD 19 15.8 2.7 25.6 0.1 100.7 36.9East Asia and Pacifi c 9 58.8 24.3 105.4 0.6 331.6 61.6Europe and Central Asia 14 26.4 5.4 51.9 0.2 175.6 28.7Latin America and the Caribbean 15 9.5 3.1 18.7 0.3 72.4 14Middle East and North Africa 7 13.1 13 8.2 4 28.8 12.3South Asia 5 31.7 31.5 26.9 1.3 65.1 35.7Sub-Saharan Africa 14 5 2.4 7.2 0 28.2 12.5
05--AppA--Maps--129-136.indd 135 09/11/17 1:31 PM

136 A P P E N D I X A GLOBAL FINANCIAL DEVELOPMENT REPORT 2017/2018
MAP A.8 STABILITY—FINANCIAL MARKETS
To approximate stability of fi nancial markets, this map uses the 360-day standard deviation of the return on the primary national stock market index. Data are from Bloomberg. The four shades of blue
in the map are based on the average value of the variable in 2013–15: the darker the blue, the higher the quartile of the statistical distribution of the variable.
Source: Global Financial Development Database, 2013–15 data.Note: OECD = Organiza tion for Economic Co-operation and Development. Weighted average by total value of stocks traded.
TABLE A.1.8 Stability—Financial Markets
Stock price volatilityNumber of countries Average Median
Standard deviation Minimum Maximum
Weighted average
World 92 15.5 15.1 7.2 3.6 45.6 15.9By developed/developing economiesDeveloped economies 46 15.6 15.2 6.7 7.1 45.6 15.5Developing economies 46 15.4 14.7 7.7 3.6 37.9 17.2By income level
High income 46 15.6 15.2 6.7 7.1 45.6 15.5Upper-middle income 28 15.7 14.1 8.8 3.6 37.9 17.4Lower-middle income 17 15 15.2 5.9 7 30.6 16Low income 1 14.5 14.5 14.5 14.5 14.5By region
High income: OECD 33 16.1 15.7 5 8.1 37 15.6High income: non-OECD 13 14.3 10.4 9.9 7.1 45.6 15.4East Asia and Pacifi c 8 16.6 17.2 3.5 8.6 20.7 17.4Europe and Central Asia 10 17.5 14.8 6.9 9.2 30.6 22.6Latin America and the Caribbean 10 19.6 15.2 11.6 5.9 37.9 19.2Middle East and North Africa 6 10.9 8.4 6.4 7 23.7 12.3South Asia 4 13.5 14.1 2.4 10.3 15.6 15.1Sub-Saharan Africa 8 10.9 12.2 5.1 3.6 17.6 13.2
05--AppA--Maps--129-136.indd 136 09/11/17 1:31 PM

GLOBAL FINANCIAL DEVELOPMENT REPORT 2017/2018 A P P E N D I X B 137
(appendix continued next page)
APPENDIX B KEY ASPECTS OF INTERNATIONAL BANKING
TABLE B.1 Foreign Penetration and Internationalization of Financial Systems, 2014
Foreign bank penetration Internationalization
Economy
Foreignbank claims
to GDP(%)
Foreignbank local
claim share (%)
Foreignbank asset
share(%)
Foreignbank share
(%)
Foreign developing economy
bank share(%)
Foreign liability
ratio(%)
Foreign developing economy
liability ratio (%)
Foreign host countries
Albania 46.6 78.1 89 85 15
Algeria 5.2 91.6 15 60 27 1.7 0
Andorra 36.5 56.6 3.2 0 1
Angola 12.9 67.0 54 46 8 1
Antigua and Barbuda 29 29
Argentina 6.4 85.2 25 32 8 6
Armenia 8.5 56.8 85 80 33 0.6 0
Australia 29.2 53.4 2 35 13 9.3 0.3 7
Austria 52.4 40.5 26 11 5 2.5 1.5 18
Azerbaijan 4.5 0.01 4 14 14 6.3 0
Bahamas, The 320.6 23.4 55.0 55.0 1
Bahrain 37.8 44.2 52 71 21 27.4 17.3 6
Bangladesh 6.1 66.7 3 3 0 0.9 0.9 1
Barbados 128.4 63.1 100 100 25 3.7 3.7 1
Belarus 3.5 11.0 31 65 45 1
Belgium 81.6 60.2 47 46 4 11.8 0.1 10
Benin 4.7 83.5 98 89 88
Bolivia 1.1 3.0 16 30 30
Bosnia and Herzegovina 42.8 79.8 87 64 18
Botswana 14.7 77.5 78 60 40 7.1 7.1 3
Brazil 18.0 59.9 15 40 3 0.9 0 9
Bulgaria 56.2 83.0 62 65 4 2
Burkina Faso 6.8 79.9 100 100 71 1
Burundi 1.6 0 73 50 25
Cambodia 10.2 68.8 60 61 33
Cameroon 9.0 43.6 76 73 36
Canada 22.5 41.5 3 37 8 21.7 1.2 22
Chile 42.5 74.0 33 41 10 3
China 7.8 37.0 2 20 2 1.3 0.1 12
Colombia 11.7 66.3 15 42 0 0.7 0.6 9
Congo, Dem. Rep. 0.7 25.3 70 83 58
Costa Rica 11.6 60.9 26 21 14 2.9 2.9 1
Croatia 103.8 62.6 90 52 6 1

138 A P P E N D I X B GLOBAL FINANCIAL DEVELOPMENT REPORT 2017/2018
TABLE B.1 Foreign Penetration and Internationalization of Financial Systems, 2014 (continued)
Foreign bank penetration Internationalization
Economy
Foreignbank claims
to GDP(%)
Foreignbank local
claim share (%)
Foreignbank asset
share(%)
Foreignbank share
(%)
Foreign developing economy
bank share(%)
Foreign liability
ratio(%)
Foreign developing economy
liability ratio (%)
Foreign host countries
Cuba 1.0 8.7 0 0 0 1
Cyprus 108.0 33.9 12 63 38 0.3 0 5
Czech Republic 83.2 86.3 85 62 10 2
Côte d’Ivoire 11.9 58.9 100 71 36 8.0 8.0
Denmark 79.8 50.5 18 8 0 3.6 0 8
Dominican Republic 6.6 35.3 8 8 3 1
Ecuador 2.7 23.8 12 22 6 7.2 6.2 3
Egypt, Arab Rep. 8.7 84.3 21 54 13 1.7 0.8 4
El Salvador 18.7 82.4 100 91 64 2
Estonia 79.6 92.9 97 75 13 1
Ethiopia 0.7 0 0 0 0
Finland 69.9 53.0 84 22 0 3
France 38.2 13.5 5 4 0 10.0 0.7 46
Gabon 6.9 11.9 1
Gambia, The 12.4 82.8 1
Georgia 6.7 59.5 64 77 38 2
Germany 33.1 38.4 13 14 0 6.7 0.3 32
Ghana 16.0 31.4 69 63 44 6.2 0
Greece 19.9 6.8 0 0 0 14.9 11.7 13
Guatemala 5.5 34.2 30 53 31 14.3 10.1 3
Haiti 4.0 61.8 0 0 0
Honduras 5.2 14.7 53 53 35 2
Hong Kong SAR, China 236.8 78.8 92 73 27 1.8 1.6 1
Hungary 50.0 67.3 56 80 8 10.6 8.9 7
Iceland 33.2 0.1 0 0 0 6.3 0 1
India 12.9 38.9 3 12 0 0.2 0.1 11
Indonesia 12.7 45.6 27 48 9 1.6 1.5 1
Iran, Islamic Rep. 0.2 0.8 0 0 0 0.5 0 5
Iraq 0.3 17.1 1
Ireland 143.1 22.6 36 85 0 20.0 0 2
Israel 4.7 23.0 0 0 0 10.8 0.2 6
Italy 32.2 47.7 6 12 1 16.1 1.1 26
Jamaica 33.5 67.6 91 75 0 2.0 0 1
Japan 15.8 63.3 1 2 0 3.0 0.5 18
Jordan 9.2 19.8 25 40 20 1.0 0 5

GLOBAL FINANCIAL DEVELOPMENT REPORT 2017/2018 A P P E N D I X B 139
(appendix continued next page)
TABLE B.1 Foreign Penetration and Internationalization of Financial Systems, 2014 (continued)
Foreign bank penetration Internationalization
Economy
Foreignbank claims
to GDP(%)
Foreignbank local
claim share (%)
Foreignbank asset
share(%)
Foreignbank share
(%)
Foreign developing economy
bank share(%)
Foreign liability
ratio(%)
Foreign developing economy
liability ratio (%)
Foreign host countries
Kazakhstan 3.1 30.7 13 33 21 0.2 0.2 5
Kenya 10.1 49.0 36 32 18 0.9 0.9 4
Korea, Rep. 20.3 53.8 7 13 0 1.1 0.7 11
Kuwait 8.8 9.5 7 11 0 10.4 7.7 8
Kyrgyz Republic 0.6 0 79 83 80
Latvia 52.8 89.4 58 55 25 3.2 0 2
Lebanon 10.1 24.6 29 36 18 0.9 0.1 10
Libya 0.3 1.4 0 0 0 4.5 1.8 17
Liechtenstein 72.9 0.3 11.1 0 6
Lithuania 53.7 79.1 91 75 0 14.0 0 1
Luxembourg 743.3 12.4 92 95 3 2.0 0 3
Macedonia, FYR 30.1 80.1 68 67 17
Madagascar 11.9 33.0 100 100 50
Malawi 0.9 0 34 25 25 3
Malaysia 50.4 70.3 17 42 9 6
Mali 1.6 37.4 61 67 63 11
Malta 167.3 36.5 1.1 0 1
Mauritania 6.3 0 4 38 25
Mauritius 60.9 34.2 55 60 33 0.9 0.9 6
Mexico 27.7 78.7 70 37 0 0.5 0 4
Moldova 8.6 64.5 27 50 0
Monaco 2.4 0
Mongolia 6.1 0 7 13 13
Montenegro 25.5 37.9 89 88 25
Morocco 28.5 72.3 19 36 0 7
Mozambique 41.0 83.7 94 85 38
Namibia 2.2 0 52 43 43 5.3 5.3
Nepal 1.4 35.9 11 10 7
Netherlands 67.3 16.9 4 47 17 10.9 0.6 24
New Zealand 157.1 94.9 94 78 0 0.2 0
Nicaragua 4.4 48.9 39 60 40 6
Niger 1.2 0 69 71 67
Nigeria 2.7 19.1 19 28 12 3.4 0.6 12
Norway 42.5 56.4 14 2 0 1.6 0 8
Oman 12.8 53.2 11 17 0 2

140 A P P E N D I X B GLOBAL FINANCIAL DEVELOPMENT REPORT 2017/2018
TABLE B.1 Foreign Penetration and Internationalization of Financial Systems, 2014 (continued)
Foreign bank penetration Internationalization
Economy
Foreignbank claims
to GDP(%)
Foreignbank local
claim share (%)
Foreignbank asset
share(%)
Foreignbank share
(%)
Foreign developing economy
bank share(%)
Foreign liability
ratio(%)
Foreign developing economy
liability ratio (%)
Foreign host countries
Pakistan 3.5 76.9 52 43 5 1.3 0 5
Panama 83.5 10.2 67 69 54 49.9 49.9 3
Paraguay 9.4 77.2 51 64 36 1
Peru 25.7 75.1 51 69 13 2
Philippines 13.0 38.4 1 12 2 3.2 3.0 2
Poland 51.0 79.8 76 76 0 0.1 0.1 2
Portugal 54.6 63.2 23 36 5 0.9 0.7 11
Qatar 16.6 16.7 0 0 0 1.1 0 5
Romania 44.0 66.9 79 82 4 0.6 0 1
Russian Federation 7.5 38.8 8 17 3 8.0 3.5 24
Rwanda 0.6 0 13 50 50
San Marino 41.7 16.2 1
Saudi Arabia 8.5 7.3 0 0 0 0.04 0.04 3
Senegal 18.8 59.1 94 83 56
Serbia 48.7 77.8 75 66 6 3
Seychelles 106.9 14.5 65 40 20
Singapore 125.1 67.5 6 55 5 8
Slovak Republic 69.5 68.4 75 67 7 17.0 0 1
Slovenia 39.2 65.8 25 35 6 3.1 3.1 4
South Africa 29.3 71.5 23 24 4 2.4 1.9 18
Spain 33.6 27.3 2 13 2 33.4 11.4 21
Sri Lanka 9.4 66.4 0 0 0
Sudan 0.2 0 9 21 21
Swaziland 1.9 2.4 100 60 60
Sweden 23.7 11.4 0 1 0 36.6 0.03 11
Switzerland 47.4 31.4 2 20 5 7.9 1.4 22
Syrian Arab Republic 0.8 2.8 2.6 2.6 1
Tanzania 5.7 68.6 47 67 52 1
Thailand 30.4 78.9 7 25 10 0.4 0.4 4
Togo 12.2 1.8 0 17 17 28.2 28.2 15
Trinidad and Tobago 32.5 82.3 57 75 13 1
Tunisia 15.7 64.5 28 47 29
Turkey 27.6 54.3 14 38 11 4.4 0.1 15
Uganda 6.5 41.1 85 83 67
Ukraine 11.3 69.2 28 39 14 7.4 1.0 4
United Arab Emirates 29.1 51.6 1 22 11 0.4 0.4 7

GLOBAL FINANCIAL DEVELOPMENT REPORT 2017/2018 A P P E N D I X B 141
TABLE B.1 Foreign Penetration and Internationalization of Financial Systems, 2014 (continued)
Foreign bank penetration Internationalization
Economy
Foreignbank claims
to GDP(%)
Foreignbank local
claim share (%)
Foreignbank asset
share(%)
Foreignbank share
(%)
Foreign developing economy
bank share(%)
Foreign liability
ratio(%)
Foreign developing economy
liability ratio (%)
Foreign host countries
United Kingdom 82.2 64.3 14 58 18 13.8 1.8 55
United States 31.8 61.8 11 31 0 5.1 0.4 62
Uruguay 22.9 82.8 92 78 26 2
Uzbekistan 1.3 0 6 20 13 1
Venezuela, RB 9.9 86.3 18 27 12 3
Vietnam 17.4 48.6 5 23 10 0.1 0.0 1
Yemen, Rep. 2.3 0 0 0 0
Zambia 8.8 62.7 99 94 56 1
Zimbabwe 4.9 27.8 36 38 23
NOTES
Additional data: The table above presents information from various databases and research papers, including the Bank for International Settlements (BIS) Consolidated Banking Statistics (CBS), World Bank Global Financial Development Database (GFDD), Claessens and van Horen (2015), and Bertay, Demirgüç-Kunt, and Huizinga (2017).
Period covered: The table shows the most recently available data, up to 2014.
Economy: A territorial entity for which statis-tical data are maintained and provided inter-nationally on a separate and independent basis (not necessarily a state as understood by international law and practice). The term, used interchangeably with country, does not imply political independence or offi cial rec-ognition by the World Bank.
Foreign bank claims to GDP (%): Consoli-dated foreign bank claims on a counterparty economy. A bank is foreign if it is headquar-tered outside an economy’s jurisdiction. Con-solidated claims capture worldwide positions by bank offi ces, including foreign subsidiaries and branches and excluding inter-offi ce activ-ity. Bank claims include loans and deposits,
holdings of debt securities, equity securities, participations, derivatives instruments with positive market value, and any other residual on-balance-sheet fi nancial claims. This indi-cator provides an aggregate measure of the size of foreign bank funding for an economy.The data are based on BIS CBS table B4 and World Development Indicators.
Foreign bank local claims share (%): Share of local claims among consolidated foreign bank claims on a counterparty country. Local claims are booked by foreign bank offices inside counterparty economy and can be in either local or foreign currency. This indica-tor provides a measure of the importance of brick and mortar business by foreign banks for an economy, as opposed to its reliance on cross-border foreign funding. The data are based on BIS CBS table B4 and World Devel-opment Indicators.
Foreign bank asset share (%): Percentage of the total banking assets that are held by for-eign banks. A foreign bank is a bank where a majority its shares are owned by foreign-ers. This indicator provides a measure of the importance of foreign bank assets within an economy’s banking system. The data are from

142 A P P E N D I X B GLOBAL FINANCIAL DEVELOPMENT REPORT 2017/2018
the GFDD, using input from Claessens and van Horen (2015). The values represent 2013.
Foreign bank share (%): Percentage of the number of foreign-owned banks to the num-ber of the total banks in an economy. A for-eign bank is a bank where a majority of its shares are owned by foreigners. This indica-tor provides a measure of the presence of for-eign bank offi ces within an economy’s bank-ing system. The data are from the GFDD, using input from Claessens and van Horen (2015). The values represent 2013.
Foreign developing economy bank share (%): Percentage of the number of foreign develop-ing economy–owned banks to the number of the total banks in an economy. A foreign bank is a bank where a majority of its shares are owned by foreigners. This indicator pro-vides a measure of the presence of developing economy banks within a economy’s banking system. The data are from the GFDD, using input from Claessens and van Horen (2015). The values represent 2013.
Foreign liability ratio (%): Percentage of liabilities located in a foreign economy by an economy’s banking system, calculated by aggregating liabilities of majority-owned subsidiaries in foreign countries and dividing
by the total liabilities of the banking system. This indicator provides a proxy measure for the extent of internationalization of an econ-omy’s banking system. The data are com-puted by the Global Financial Development Report team as part of Bertay, Demirgüç-Kunt, and Huizinga (2017).
Foreign developing economy liability ratio (%): Percentage of liabilities located in a for-eign developing economy by economy’s bank-ing system, calculated by aggregating liabili-ties of majority-owned subsidiaries in foreign developing countries and dividing by the total liabilities of the banking system. This indicator provides a proxy measure for the extent of internationalization into developing countries of economy’s banking system. The data are computed by the Global Financial Development Report team as part of Bertay, Demirgüç-Kunt, and Huizinga (2017).
Foreign host countries: Number of foreign host countries for subsidiaries and branches controlled through direct majority ownership by an economy’s banking system. This indi-cator provides a measure for the immediate geographic outreach of an economy’s bank-ing system. The data are from the GFDD, using input from Claessens and van Horen (2015). The values represent 2013.

G L O B A L F I N A N C I A L D E V E L O P M E N T R E P O R T 2 0 1 7 / 2 0 1 8 143
Bibliography
Accenture. 2016. Fintech and the Evolving Land-scape: Landing Points for the Industry. Dublin: Accenture.
Acharya, V. V. 2003. “Is the International Conver-gence of Capital Adequacy Regulation Desir-able?” Journal of Finance 58 (6): 2745–82.
Acharya, V. V., S. G. Cecchetti, J. De Gregorio, S. Kalemli-Ozcan, P. R. Lane, and U. Panizza. 2015. Corporate Debt in Emerging Econo-mies: A Threat to Financial Stability? Washing-ton, DC: Brookings Institution.
Acharya, V. V., and S. Vij. 2016. “Foreign Cur-rency Borrowing of Corporations as Carry Trades: Evidence from India.” NSE-NYU Con-ference on Indian Financial Markets 2016, New York, December 21–22.
Adrian, T., P. Colla, and H. S. Shin. 2013. “Which Financial Frictions? Parsing Evidence from the Financial Crisis of 2007–09.” NBER Macro-economics Annual 2012 (27): 159–214.
Adriano, A., and H. Monroe. 2016. “The Internet of Trust.” Finance and Development 53 (2).
Agenor, P. R. 2003. “Benefi ts and Costs of Inter-national Financial Integration: Theory and Facts.” World Economy 26 (8): 1089–118.
Ahmed, U., T. Beck, C. McDaniel, and S. Schropp. 2015. “Filling the Gap: How Technology Enables Access to Finance for Small-and
Medium-Sized Enterprises.” Innovations 103 (4): 35–48.
Aiyar, S. 2012. “From Financial Crisis to Great Recession: The Role of Globalized Banks.” American Economic Review 102 (3): 225–30.
Aiyar, S., C. W. Calomiris, and T. Wieladek. 2014. “Does Macro Prudential Regulation Leak? Evidence from a UK Policy Experiment.” Jour-nal of Money, Credit and Banking 46 (s1): 181–214.
Albertazzi, U., and M. Bottero. 2014. “Foreign Bank Lending: Evidence from the Global Finan-cial Crisis.” Journal of International Economics 92: S22–35.
Alfaro, L., T. Beck, and C. W. Calomiris. 2015. “Foreign Bank Entry and Entrepreneurship.” Working Paper, Columbia University, New York.
Alibaba Group. 2016. Ant Financial. Investor Day Document: June 2016. San Mateo, CA.
Allen, F., T. Beck, E. Carletti, P. R. Lane, D. Schoenmaker, and W. Wagner. 2011. “Cross-Border Banking in Europe: Implications for Financial Stability and Macroeconomic Poli-cies.” London: Centre for Economic Policy Research.
Allen, F., A. Demirgüç-Kunt, L. F. Klapper, and M. S. Martínez Pería. 2012. “The Foundations of Financial Inclusion: Understanding Ownership

144 B I B L I O G R A P H Y GLOBAL FINANCIAL DEVELOPMENT REPORT 2017/2018
Aykut, D., and D. Ratha. 2004. “South-South FDI Flows: How Big Are They?” Transnational Corporations Journal 13 (1).
Baker, M., and M. Collins. 1999. “Financial Crises and Structural Change in English Commercial Bank Assets, 1860–1913 .” Explorations in Economic History 36 (4): 428–44.
Barajas, A., R. Steiner, and N. Salazar. 2000. “The Impact of Liberalization and Foreign Invest-ment in Colombia’s Financial Sector.” Journal of Development Economics 63 (1): 157–96.
Barth, J. R., G. Caprio, and R. Levine. 2004. “Bank Regulation and Supervision: What Works Best?” Journal of Financial Intermedia-tion 13 (2): 205–48.
———. 2013. “Bank Regulation and Supervision in 180 Countries from 1999 to 2011.” Journal of Financial Economic Policy 5 (2): 111–219.
Basel Committee on Banking Supervision (BCBS). 2016. “Global Systemically Important Banks: Assessment Methodology and the Additional Loss Absorbency Requirement.” November 21. https://www.bis.org/bcbs/gsib/index.htm.
Battilossi, S. 2006. “The Determinants of Banking during the First Globalisation, 1880–1914.” European Review of Economic History 10 (3): 361–88.
Bayraktar, N., and Y. Wang. 2008. “Banking Sec-tor Openness and Economic Growth.” Margin: The Journal of Applied Economic Research 2: 145.
Bazot, G. 2013. “Financial Consumption and the Cost of Finance: Measuring Financial Effi ciency in Europe (1950–2007).” Working paper, Paris School of Economics.
Beck, R., P. Jakubik, and A. Piloiu. 2013. “Non-performing loans: What Matters in Addition to the Economic Cycle?” ECB Working Paper 1515, European Central Bank, Frankfurt.
Beck, T. 2002. “Financial Development and Inter-national Trade: Is There a Link?” Journal of International Economics 57 (1): 107–31.
Beck, T., and M. Brown. 2013. “Foreign Bank Ownership and Household Credit.” Journal of Financial Intermediation 24 (4): 466–86.
Beck, T., and R. Cull. 2013. “Banking in Africa.” Policy Research Working Paper 6684, World Bank, Washington, DC. http://elibrary.world bank.org/doi/pdf/10.1596/1813-9450-6684.
and Use of Formal Accounts.” Policy Research Working Paper 6290, World Bank, Washing-ton, DC.
Álvarez, J. M., J. P. García, and O. Gouveia. 2016. “The Globalization of Banking: How Is Regula-tion Affecting Global Banks?” BBVA Research.
Anginer, D., E. Cerutti, and M. S. Martínez Pería. 2017. “Foreign Bank Subsidiaries’ Default Risk during the Global Crisis: What Factors Help Insulate Affi liates from Their Parents ?” Journal of Financial Intermediation 29: 19–31.
Arena, M., C. Reinhart, and F. Vazquez. 2007. “The Lending Channel in Emerging Econom-ics: Are Foreign Banks Different?” IMF Work-ing Paper 07/48, International Monetary Fund, Washington, DC.
Arner, D. W., J. Barberis, and R. P. Buckley. 2016. “The Evolution of Fintech: A New Paradigm?” Georgetown Journal of International Law 47: 1271–319.
———. Forthcoming. “FinTech, RegTech and the Reconceptualization of Financial Regu-lation.” Northwestern Journal of Interna-tional Law and Business. SSRN: https://ssrn.com/abstract=2847806.
Atz, U., and D. Bhola. 2016. “Peer-to-Peer Lend-ing and Financial Innovation in the United Kingdom.” Staff Working Paper 598, Bank of England, London.
Autonomous. 2016. “Digital Lending: The 100 Billion Dollar Question.” http://www.autonomous.com/fi ntech/af8fe529-c188-46ba-bf25-d25e9596a09d.
Avdjiev, S., Z. Kuti, and E. Takats. 2012. “The Euro Area Crisis and Cross-Border Bank Lend-ing to Emerging Markets.” BIS Quarterly Review (December): 37–47.
Avdjiev, S., R. N. McCauley, and H. S. Shin. 2015. “Breaking Free of the Triple Coincidence in International Finance.” BIS Working Paper 524, Bank for International Settlements, Basel.
Aviat, A., and N. Coeurdacier. 2007. “The Geog-raphy of Trade in Goods and Asset Holdings.” Journal of International Economics 71 (1): 22–51.
Aykut, D., and A. Goldstein. 2006. “Developing Country Multinationals: South-South Invest-ment Comes of Age.” OECD Development Centre Working Paper 257, OECD Publishing, Paris.

GLOBAL FINANCIAL DEVELOPMENT REPORT 2017/2018 B I B L I O G R A P H Y 145
and Bank Performance: A Joint Analysis of the Static, Selection, and Dynamic Effects of Domestic, Foreign, and State Owner-ship.” Journal of Banking & Finance 29 (8): 2179–221.
Berger, A. N., R. DeYoung, H. Genay, and G. F. Udell. 2000. “The Globalization of Financial Institutions: The Evidence from Cross-Border Banking Performance.” Brookings-Wharton Papers on Financial Services 3: 23–158.
Berger, A. N., S. El Ghoul, O. Guedhami, and R. A. Roman. 2016. “Internationalization and bank risk.” Management Science 2017 63 (7): 2283–2301.
Berger, A. N., I. Hasan, and M. Zhou. 2009. “Bank Ownership and Effi ciency in China: What Will Happen in the World’s Largest Nation?” Journal of Banking & Finance 33 (1): 113–30.
Berger, A. N., L. F. Klapper, M. S. M. Peria, and R. Zaidi. 2008. “Bank Ownership Type and Bank-ing Relationships.” Journal of Financial Inter-mediation 17 (1): 37–62.
Berger, A. N., L. F. Klapper, and G. F. Udell. 2001. “The Ability of Banks to Lend to Informa-tionally Opaque Small Businesses.” Journal of Banking and Finance 25 (12): 2127–67.
Berger, A. N., and G. F. Udell. 2006. “A More Complete Conceptual Framework for SME Finance.” Journal of Banking and Finance, 30 (11), 2945–66.
Berlin, Mitchell. 2015. “New Rules for Foreign Banks: What’s at Stake?” Business Review Q 1: 1–10.
Bertay, A. C. 2014. “The Transmission of Real Estate Shocks through Multinational Banks.” Discussion Paper 2014-001, European Banking Center, Tilburg University, The Netherlands.
Bertay, A. C., A. Demirgüç-Kunt, and H. Huiz-inga. 2013. “Do We Need Big Banks? Evidence on Performance, Strategy and Market Disci-pline.” Journal of Financial Intermediation 22 (4): 532–558.
———. 2015. “Bank Ownership and Credit over the Business Cycle: Is Lending by State Banks Less Procyclical?” Journal of Banking and Finance 50: 326–39.
———. 2016. “Should Cross-Border Banking Ben-efi t from the Financial Safety Net?” Journal of Financial Intermediation 27: 51–67.
Beck, T., H. Degryse, R. De Haas, and N. van Horen. 2014. “When Arm’s Length Is Too Far: Relationship Banking over the Business Cycle.” Discussion Paper 2014-042, Center for Economic Research, Tilburg University, The Netherlands. http://www.ebrd.com/downloads/research/economics/workingpapers/wp0169.pdf.
Beck, T., M. Fuchs, D. Singer, and M. Witte. 2014. Making Cross-Border Banking Work for Africa. Washington, DC: World Bank.
Beck, T., V. Ioannidou, and L. Schäfer. 2012. “For-eigners vs. Natives: Bank Lending Technologies and Loan Pricing.” Discussion Paper 2012-014, European Banking Center, Tilburg University, The Netherlands. http://papers.ssrn.com/sol3/papers.cfm?abstract_id=2101037.
Beck, R., P. Jakubik, and A. Piloiu. 2013. “Non-performing loans: What matters in addition to the economic cycle?” ECB Working Paper 1515.
Beck, T., R. Levine, and A. Levkov. 2010. “Big Bad Banks? The Winners and Losers from Bank Deregulation in the United States.” Journal of Finance 65 (5): 1637–67.
Beck, T., and M. S. Martínez Pería. 2010. “Foreign Bank Participation and Outreach: Evidence from Mexico.” Journal of Financial Interme-diation 19 (1): 52–73.
Beck, T., C. Silva-Buston, and W. Wagner. 2015. “Cross-Border Banking Cooperation: From Actual to Optimal Arrangements.” Unpub-lished paper.
Beck, T., R. Todorov, and W. Wagner. 2013. “Supervising Cross-Border Banks: Theory, Evi-dence and Policy.” Economic Policy 28 (73): 5–44.
Beck, T., and W. Wagner. 2016. “Supranational Supervision: How Much and for Whom?” International Journal of Central Banking 12 (2): 221–68.
Becker, B., and V. Ivashina. 2014. “Cyclicality of Credit Supply: Firm-Level Evidence.” Journal of Monetary Economics 62: 76–93.
Behn, M., R. Haselmann, A. Seru, and V. Vig. 2014. “Does Financial Structure Shape Industry Structure? Evidence from Timing of Bank Lib-eralization.” Unpublished paper, London Busi-ness School.
Berger, A. N., G. R. Clarke, R. Cull, L. Klapper, and G. F. Udell. 2005. “Corporate Governance

146 B I B L I O G R A P H Y GLOBAL FINANCIAL DEVELOPMENT REPORT 2017/2018
Bonin, J., and P. Wachtel. 2003. “Financial Sector Development in Transition Economies: Lessons from the First Decade.” Financial Markets, Institutions and Instruments 12 (1): 1–66.
Borensztein, E., K. Cowan, B. Eichengreen, and U. Panizza. 2008. “Building Bond Markets in Latin America.” In Bond Markets in Latin America: On the Verge of a Big Bang? 1–28. Cambridge, MA: MIT Press.
Borio, C., R. McCauley, and P. McGuire. 2012. “Global Credit and Domestic Credit Booms.” BIS Quarterly Review (September): 43–57.
Bremus, F., and C. M. Buch. 2014. “Granularity in Banking and Growth: Does Financial Open-ness matter?” DIW Berlin Discussion Paper 1346. http://papers.ssrn.com/sol3/papers.cfm?abstract_id=2387571.
Broner, F., T. Didier, S. L. Schmukler, and G. Von Peter. 2017. “Global Capital Flows: The Big Sur?” World Bank Working Paper, World Bank.
Brüggemann, B., J. Kleinert, and E. Prieto. 2011. “A Gravity Equation of Bank Loans.” Paper presented at Deutsche Bundesbank Workshop, The Costs and Benefi ts of International Bank-ing, Eltville am Rhein, Germany.
Bruno, V., and R. Hauswald. 2013. “The Real Effect of Foreign Banks.” Review of Finance 18 (5): 1683–716.
Bruno, V., and H. S. Shin. 2015a. “Cross-Border Banking and Global Liquidity.” The Review of Economic Studies 82: 535–64.
———. 2015b. “Capital Flows and the Risk-Taking Channel of Monetary Policy.” Journal of Monetary Economics 71: 119–32.
———. 2017. “Global Dollar Credit and Carry Trades: A Firm-Level Analysis.” Review of Financial Studies 30 (3): 703–49.
Buch, C. M. 2003. “Information or Regulation: What Drives the International Activities of Commercial Banks?” Journal of Money, Credit and Banking 35 (6): 851–69.
Buch, C. M., K. Carstensen, and A. Schertler. 2009. “Macroeconomic Shocks and Banks’ Foreign Assets.” Journal of Money, Credit and Banking 42 (1): 171–88.
Buch, C. M., J. C. Driscoll, and C. Ostergaard. 2010. “Cross-Border Diversifi cation in Bank Asset Portfolios.” International Finance 13 (1): 79–108.
———. 2017. “Are Internationally Active Banks Different? Evidence on Bank Performance and Strategy.” Unpublished paper, World Bank.
Bhattacharya, A., C. K. Lovell, and P. Sahay. 1997. “The Impact of Liberalization on the Produc-tive Effi ciency of Indian Commercial Banks.” European Journal of Operational Research 98 (2): 332–45.
Bircan, C., and R. De Haas. 2015. “The Limits of Lending: Banks and Technology Adoption across Russia.” Discussion paper 2015-011, Center for Economic Research, Tilburg Univer-sity, The Netherlands.
BIS (Bank for International Settlements). 2013. “Global Systemically Important Banks: Updated Assessment Methodology and the Higher Loss Absorbency Requirement.” Basel. http://www.bis.org/publ/bcbs255.pdf.
———. 2015. “Guidelines for Reporting BIS Inter-national Banking Statistics.” Basel. http://www.bis.org/statistics/bankstatsguide.htm.
Blanchard, O. J., M. Griffi ths, and B. Gruss. 2013. “Boom, Bust, Recovery: Forensics of the Lat-via Crisis.” In Brookings Papers on Economic Activity: Fall 2013, edited by D. H. Romer and J. Wolfers, 325–388. Washington, DC: Brook-ings Institute.
Blaseg, D., and M. Koetter. 2016. “Friend or Foe? Crowdfunding versus Credit When Banks Are Stressed.” IWH Discussion Paper, Halle Insti-tute for Economic Research, Halle, Germany.
BNY Mellon. 2015. “Innovation in Payments: The Future Is Fintech.” London. https://www.bnymellon.com/global-assets/pdf/our-thinking/innovation-in-payments-the-future-is-fintech.pdf.
Bolton, Patrick, and Martin Oehmke. 2015. “Bank Resolution and the Structure of Global Banks.” Working paper, Columbia University, New York.
Bonaccorsi di Patti, E., and D. C. Hardy. 2005. “Financial Sector Liberalization, Bank Priva-tization, and Effi ciency: Evidence from Paki-stan.” Journal of Banking and Finance 29 (8): 2381–406.
Bonin, J. P., and D. Louie. Forthcoming. “Did Foreign Banks Stay Committed to Emerging Europe during Recent Financial Crises?” Jour-nal of Comparative Economics.

GLOBAL FINANCIAL DEVELOPMENT REPORT 2017/2018 B I B L I O G R A P H Y 147
Cassis, Y. 2013. “Baring Brothers: A London Mer-chant Bank in Historical and Comparative Per-spective.” Baring Archive Symposium. http://www.baringarchive.org.uk/materials/yousseff_cassis.pdf.
CBRC (China Banking Regulatory Commis-sion). 2016a. “China Banking Regulatory Commission Annual Report 2015.” http://www.cbrc.gov.cn/chinese/home/docView/C41C682055714362AF1C86FEA7486BB5.html (Chinese).
———. 2016b. “Interim Measures for the Business Activities of Online Lending Information Inter-mediary Institutions.” CBRC Order 1, Beijing.
Cerutti, E., S. Claessens, and L. Laeven. 2015. “The Use and Effectiveness of Macroprudential Policies: New Evidence.” Unpublished paper, International Monetary Fund, Washington, DC.
Cerutti, E., S. Claessens, and P. McGuire. 2012. “Systemic Risk in Global Banking: What Can Available Data Tell Us and What More Data Are Needed?” Working Paper 376, Bank for International Settlements, Basel. http://www.bis.org/publ/work376.pdf.
Cerutti, E., S. Claessens, and L. Ratnovski. 2016. “Global Liquidity and Cross-Border Bank Flows.” Economic Policy 32: 81–125.
Cerutti, E., G. Dell’Ariccia, and M. S. M. Pería. 2007. “How Banks Go Abroad: Branches or Subsidiaries?” Journal of Banking and Finance 31 (6): 1669–92.
Cerutti, E., G. Hale, and C. Minoiu. 2015. “Finan-cial Crises and the Composition of Cross-border Lending.” Journal of International Money and Finance 52: 60–81.
Cerutti, E., A. Ilyina, Y. Makarova, and C. Schmieder. 2010. “Bankers without Borders? Implications of Ring-Fencing for European Cross-Border Banks.” International Monetary Fund, Washington, DC.
Cerutti, E., and C. Schmieder. 2014. “Ring Fencing and Consolidated Banks’ Stress Tests.” Journal of Financial Stability 11: 1–12.
Cetorelli, N., and L. S. Goldberg. 2011. “Global Banks and International Shock Transmission: Evidence from the Crisis.” IMF Economic Review 59 (1): 41–76.
———. 2012a. “Liquidity Management of US Global Banks: Internal Capital Markets in the
Buch, C. M., and L. S. Goldberg. 2014. “Interna-tional Banking and Liquidity Risk Transmis-sion: Lessons from Across Countries.” NBER Working Paper 20286, National Bureau of Eco-nomic Research, Cambridge, MA.
———. 2015. “International Banking and Liquid-ity Risk Transmission: Lessons from across Countries.” IMF Economic Review 63 (3): 377–410.
Buch, C. M., C. T. Koch, and M. Koetter. 2011. “Size, Productivity, and International Bank-ing.” Journal of International Economics 85 (2): 329–34.
———. 2012. “Do Banks Benefi t from Internation-alization? Revisiting the Market Power–Risk Nexus.” Review of Finance 17 (4): 1401–35.
———. 2014. “Should I Stay or Should I Go? Bank Productivity and Internationalization Decisions.” Journal of Banking and Finance 42: 266–82.
Buiter, W., and A. Sibert. 2011. “The Icelan-dic Banking Crisis and What to Do About It: The Lender of Last Resort Theory of Optimal Currency Areas.” In Preludes to the Icelandic Financial Crisis, edited by R. Aliber and G. Zoega, 241–75. London: Palgrave Macmillan.
Calvo, G. A., L. Leiderman, and C. Reinhart. 1993. “Capital Infl ows and Real Exchange Rate Appreciation in Latin America: The Role of External Factors.” IMF Staff Papers 40 (1): 108–51.
———. 1996. “Capital Flows to Developing Countries in the 1990s: Causes and Effects.” Journal of Economic Perspectives 10: 123–39.
Calzolari, Giacomo, and Gyongyi Loranth. 2011. “Regulation of Multinational Banks: A Theo-retical Inquiry.” Journal of Financial Interme-diation 20 (2): 178–98.
Carbo-Valverde, S., E. J. Kane, and F. Rodriguez-Fernandez. 2012. “Regulatory Arbitrage in Cross-Border Banking Mergers within the EU.” Journal of Money, Credit and Banking 44 (8): 1609–29.
Carmassi, J., and R. J. Herring. 2015. “The Cor-porate Complexity of Global Systematically Important Banks.” IBEFA 2016 ASSA Session on Banking Risk and Complexity, International Banking, Economics and Finance Association, Atlanta.

148 B I B L I O G R A P H Y GLOBAL FINANCIAL DEVELOPMENT REPORT 2017/2018
-financial-inclusion-and-financial-stability-a-study-of-trade-offs-and-synergies.
Citigroup, 2016. “Digital Disruption: How Fin-Tech Is Forcing Banking to a Tipping Point.” New York.
Claessens, S. 2016. “Global Banking: Recent Developments and Insights from Research.” Review of Finance 21 (4): 1513–55.
Claessens, S., A. Demirgüç-Kunt, and H. Huizinga. 2001. “How Does Foreign Bank Entry Affect Domestic Banking Markets?” Journal of Bank-ing and Finance 25: 891–911.
Claessens, S., O. Hassib, and N. van Horen. 2014. “How Foreign Banks Facilitate Trade in Tran-quil and Crisis Times: Finance or Information.” International Monetary Fund, Washington, DC.
Claessens, S., and L. Laeven. 2004. “What Drives Bank Competition? Some International Evi-dence.” Journal of Money, Credit, and Banking 36 (3): 563–83.
Claessens, S., and N. van Horen. 2007. “Location Decisions of Foreign Banks and Competitive Advantage.” Policy Research Working Paper 4113, World Bank, Washington, DC.
———. 2012. “Being a Foreigner among Domestic Banks: Asset or Liability?” Journal of Banking and Finance 36: 1276–90.
———. 2014a. “Location Decisions of Foreign Banks and Competitor Remoteness.” Journal of Money, Credit and Banking 46 (1): 145–70.
———. 2014b. “Foreign Banks: Trends and Impact.” Journal of Money, Credit and Bank-ing 46 (s1): 295–326.
———. 2015. “The Impact of the Global Financial Crisis on Banking Globalization.” IMF Eco-nomic Review 63 (4): 868–918.
———. 2016. “The Role of Foreign Banks in Local Credit Booms.” The Future of Large, Internationally Active Banks 55: 273.
Claeys, S., and C. Hainz. 2006. “Foreign Banks in Eastern Europe: Mode of Entry and Effects on Bank Interest Rates.” Discussion Paper 95, Governance and the Effi ciency of Economic Systems (GESY), Mannheim, Germany. http://www.sfbtr15.de/uploads/media/95.pdf.
———. 2014. “Modes of Foreign Bank Entry and Effects on Lending Rates: Theory and Evi-dence.” Journal of Comparative Economics 421, 160–77.
Great Recession.” Journal of International Eco-nomics 88 (2): 299–311.
———. 2012b. “Banking Globalization and Mon-etary Transmission.” Journal of Finance 67 (5): 1811–43.
———. 2012c. “Follow the Money: Quantifying Domestic Effects of Foreign Bank Shocks in the Great Recession.” American Economic Review 102 (3): 213–18.
———. 2014. “Measures of Global Bank Com-plexity.” Federal Reserve Bank of New York Economic Policy Review (December): 107–26.
CGAP (Consultative Group to Assist the Poor). 2015. “How M-Shwari Works: The Story So Far.” Washington, DC.
CGFS (Committee on the Global Financial Sys-tem), 2014. “Trade Finance: Developments and Issues.” CGFS Paper 50, Bank for International Settlements, Basel.
Chang, C., I. Hasan, and W. C. Hunter. 1998. “Effi ciency of Multinational Banks: An Empiri-cal Investigation.” Applied Financial Econom-ics 8 (6): 689–96.
Chava, S., and A. Purnanandam. 2011. “The Effect of Banking Crisis on Bank-Dependent Borrowers.” Journal of Financial Economics 99 (1): 116–35.
Chinn, M., and H. Ito. 2006. “What Matters for Financial Development? Capital Controls, Insti-tutions and Interactions.” Journal of Develop-ment Economics 81 (1): 163–92.
———. 2008. “A New Measure of Financial Openness.” Journal of Comparative Policy Analysis 10 (3): 309–22.
Choi, M. J., E. Gutierrez, and M. S. Martínez Pería. 2014. “Dissecting Foreign Bank Lending Behavior during the 2008–2009 Crisis.” Work-ing Paper 2014-7, Bank of Korea, Seoul.
Chui, M. K., D. Domanski, P. Kugler, and J. Shek. 2010. “The Collapse of International Bank Finance during the Crisis: Evidence from Syn-dicated Loan Markets.” BIS Quarterly Review (September).
Čihák, M., D. S. Mare, and M. Melecky. 2016. “The Nexus of Financial Inclusion and Financial Stability: A Study of Trade-offs and Synergies.” Policy Research Working Paper 7722, World Bank, Washington, DC. http://documents.worldbank.org/curated/en/138991467994676130/The-Nexus-of

GLOBAL FINANCIAL DEVELOPMENT REPORT 2017/2018 B I B L I O G R A P H Y 149
———. 2002. “Has Foreign Bank Entry Led to Sounder Banks in Latin America?” Current Issues in Economics and Finance 8 (1): 1–6.
Cull, R., T. Ehrbeck, and N. Holle. 2014. “Finan-cial Inclusion and Development: Recent Impact Evidence.” Focus Note 92, World Bank, Wash-ington, DC. http://documents.worldbank.org/curated/en/269601468153288448/Financial-inclusion-and-development-recent-impact-evidence.
Cull, R., S. Harten, I. Nishida, A. B. Rusu, and G. Bull. 2015. “Benchmarking the Financial Per-formance, Growth, and Outreach of Greenfi eld MFIs in Africa.” Emerging Markets Review 25 (c): 92–124.
Cull, R., and M. S. Martínez Pería. 2010. “For-eign Bank Participation in Developing Coun-tries: What Do We Know about the Drivers and Consequences of This Phenomenon?” Policy Research Working Paper 5398, World Bank, Washington, DC.
———. 2013. “Bank Ownership and Lend-ing Patterns during the 2008–2009 Financial Crisis: Evidence from Latin America and East-ern Europe.” Journal of Banking & Finance 37(12): 4861–78.
Cull, R., M. S. Martínez Pería, and J. Verrier. 2017. Bank Ownership: Trends and Implica-tions. Washington, DC: International Monetary Fund.
Dailami, M., S. Kurlat, and J. Lim. 2012. “Bilat-eral M&A Activity from the Global South.” Policy Research Working Paper 5953, World Bank, Washington, DC.
Danisewicz, P., D. Reinhardt, and R. Sowerbutts. 2015. “On a Tight Leash: Does Bank Organ-isational Structure Matter for Macroprudential Spillovers?” Working Paper 524, Bank of Eng-land, London.
Daude, C., and M. Fratzscher. 2008. “The Pecking Order of Cross-Border Investment.” Journal of International Economics 74 (1): 94–119
De Fiore, F., and H. Uhlig. 2015. “Corporate Debt Structure and the Financial Crisis.” Journal of Money, Credit and Banking 47 (8): 1572–98.
De Haas, R., D. Ferreira, and A. Taci. 2010. “What Determines the Composition of Banks’ Loan Portfolios? Evidence from Transition Countries.” Journal of Banking and Finance 34 (2): 388–98.
Clarke, G., R. Cull, and M. S. Martínez Pería. 2006. “Foreign Bank Participation and Access to Credit across Firms in Developing Coun-tries.” Journal of Comparative Economics 34 (4): 774–95.
Clarke, G., R. Cull, M. S. Martínez Pería, and S. M. Sánchez. 2005. “Bank Lending to Small Businesses in Latin America: Does Bank Origin Matter? Journal of Money, Credit and Banking 83–118.
CoinDesk. 2016. “Nasqad Opens Blockchain Ser-vices to Global Exchange Partners.” May 26. h t t p : / / w w w. c o i n d e s k . c o m / n a s d a q s-blockchain-services-global-exchange/.
Cordero, J. A., 2009. “The IMF’s Stand-by Arrangements and the Economic Downturn in Eastern Europe: The Cases of Hungary, Latvia, and Ukraine.” Center for Economic and Policy Research Report, London.
Cortina, J. J., T. Didier, and S. L. Schmukler. 2016. “How Long Is the Maturity of Corpo-rate Borrowing? Evidence from Bond and Loan Issuances across Markets.” Policy Research Working Paper 7815, World Bank, Washing-ton, DC.
Cortina, J. J., S. Ismail, and S. L. Schmukler. 2016. “Firm Financing and Growth in the Arab Region.” Policy Research Working Paper 7756, World Bank, Washington, DC.
CPMI (Committee on Payments and Market Infra-structures). 2016. “Correspondent Banking.” Bank for International Settlements, Basel.
Crouzet, N. 2016. “Aggregate Implications of Cor-porate Debt Choices.” Working paper, North-western University, Evanston, IL. https://www.scholars.northwestern.edu/en/publications/aggregate-implications-of-corporate-debt-choices.
Crowe, M., M. Rysman, and J. Stavins. 2010. “Mobile Payments in the United States at Retail Point of Sale: Current Market and Future Pros-pects.” Public Policy Discussion Paper 10-2, Federal Reserve Bank of Boston.
Crystal, J. S., G. Dages, and L. Goldberg. 2001. “Does Foreign Ownership Contribute to Sounder Banks? The Latin American Experi-ence.” In Open Doors: Foreign Participation in Emerging Financial Systems, edited by R. E. Litan, P. Masson, and M. Pomerleano. Wash-ington, DC: Brookings Institution Press.

150 B I B L I O G R A P H Y GLOBAL FINANCIAL DEVELOPMENT REPORT 2017/2018
———. 2006a. “Lending Booms and Lending Standards.” Journal of Finance 61 5: 2511–46.
———. 2006b. “Competition among Regulators and Credit Market Integration.” Journal of Financial Economics 79 (2): 401–30.
Demirgüç-Kunt, A., T. Beck, and P. Honohan. 2008. “Finance for All? Policies and Pitfalls in Expanding Access.” World Bank, Washington, DC.
Demirgüç-Kunt, A., and E. Detragiache. 2002. “Does Deposit Insurance Increase Banking System Stability? An Empirical Investiga-tion.” Journal of Monetary Economics 49 (7): 1373–1406.
Demirgüç-Kunt, A., D. D. Evanoff, and G. G., eds. Kaufmann G. G. (Eds.). 2016. The Future of Large, Internationally Active Banks. Vol. 55. World Scientifi c.
Demirgüç-Kunt, A., B. L. Horváth, and H. Huiz-inga. 2017. “Foreign Banks and International Transmission of Monetary Policy: Evidence from the Syndicated Loan Market.” Policy Research Working Paper 7937, World Bank, Washington, DC.
Demirgüç-Kunt, A., and H. Huizinga. 1999. “Determinants of Commercial Bank Interest Margins and Profi tability: Some International Evidence.” World Bank Economic Review 13 (2): 379–408.
———. 2013. “Are Banks Too Big to Fail or Too Big to Save? International Evidence from Equity Prices and CDS Spreads.” Journal of Banking and Finance 37 (3): 875–94.
Demirgüç-Kunt, A., E. Kane, and L. Laeven. 2014. “Deposit Insurance Database.” Policy Research Working Paper 6934, World Bank, Washing-ton, DC.
Demirgüç-Kunt, A., and L. Klapper. 2012. “Measuring Financial Inclusion: The Global Findex Database.” World Bank, Washington, DC.
Demirgüç-Kunt, A., L. Klapper, D. Singer, and P. V. Oudheusden. 2014. “The Global Findex Database 2014: Measuring Financial Inclusion around the World.” Policy Research Working Paper 7255, World Bank, Washington, DC.
Demirgüç-Kunt, A., R. Levine, and H. Min. 1998. “Opening to Foreign Banks: Issues of Stability, Effi ciency, and Growth. In Proceedings of the Bank of Korea Conference on the Implications
De Haas, R., Y. Korniyenko, A. Pivovarsky, and T. Tsankova. 2015. “Taming the Herd? Foreign Banks, the Vienna Initiative and Crisis Trans-mission.” Journal of Financial Intermediation 24 (3): 325–55.
De Haas, R., and N. van Horen. 2013. “Running for the Exit? International Bank Lending during a Financial Crisis.” Review of Financial Studies 26 (1): 244–85.
De Haas, R., and I. van Lelyveld. 2004. “Foreign Bank Penetration and Private Sector Credit in Central and Eastern Europe.” Journal of Emerging Market Finance 3 (2): 125–51.
———. 2006. “Foreign Banks and Credit Stabil-ity in Central and Eastern Europe: A Panel Data Analysis.” Journal of Banking and Finance 30 (7): 1927–52.
———. 2010. “Internal Capital Markets and Lend-ing by Multinational Bank Subsidiaries.” Jour-nal of Financial Intermediation 19 (1): 1–25.
———. 2014. “Multinational Banks and the Global Financial Crisis: Weathering the Perfect Storm?” Journal of Money, Credit and Banking 46 (s1): 333–64.
de la Torre, A., M. S. Martínez Pería, and S. L. Schmukler. 2010. “Bank Involvement with SMEs: Beyond Relationship Lending.” Journal of Banking and Finance 34 (9): 2280–93.
de la Torre, A., T. Didier, A. Ize, D. Lederman, and S. Schmukler, 2015. “Latin America and the Rising South: Changing World, Changing Pri-orities.” World Bank, Washington, DC.
De Roover, R. 1963. “The Rise and Decline of the Medici Bank, 1397–1494.” Harvard Studies in Business History 21.
De Santis, R., and B. Gerard. 2009. “International Portfolio Reallocation: Diversifi cation Benefi ts and European Monetary Union.” European Economic Review 53 (8): 1010–27.
Delis, M. D., I. Hasan, and N. Mylonidis. 2016. “Foreign Bank Ownership and Income Inequal-ity: Empirical Evidence.” Unpublished paper, Fordham University, Bronx, NY, April.
Delis, M. D., S. Kokas, and S. Ongena. 2014. “For-eign Ownership and Market Power in Banking: Evidence from a World Sample.” https://mpra.ub.uni-muenchen.de/55805/.
Dell’Ariccia, G., and R. Marquez. 2004. “Informa-tion and Bank Credit Allocation.” Journal of Financial Economics 72 (1): 185–214.

GLOBAL FINANCIAL DEVELOPMENT REPORT 2017/2018 B I B L I O G R A P H Y 151
Cross-border M&As.” Unpublished working paper, University of Hong Kong.
Duenwald, C. K., N. Gueorguiev, and A. Schaech-ter. 2005. “Too Much of a Good Thing? Credit Booms in Transition Economies: The Cases of Bulgaria, Romania, and Ukraine.” IMF Work-ing Paper WP/05/128, International Monetary Fund, Washington, DC. https://www.imf.org/external/pubs/ft/wp/2005/wp05128.pdf.
Düwel, C., R. Frey, and A. Lipponer. 2011. “Cross-Border Bank Lending, Risk Aversion and the Financial Crisis.” Discussion Paper Series 1: Economic Studies, Deutsche Bundes-bank, Frankfurt.
Earne, J., T. Jansson, A. Koning, and M. Flam-ing. 2014. Greenfi eld MFIs in Sub-Saharan Africa: A Business Model for Advancing Access to Finance. Washington, DC: CGAP and International Finance Corporation. http://documents.worldbank.org/curated/en/244571468191940035/pdf/679970NWP0CGAP00Box385295B00PUBLIC0.pdf.
Ecns.cn. 2016. “Tougher Times for P2P Sector.” February.
Ecobank. 2017. “Performance/Reports.” https://www.ecobank.com/group/investor-relations/key-fi gures/performance.
The Economist. 2013a. “Too Much of a Good Thing.” Special Report on the World Economy, October.
———. 2013b. “In the Cooler: A Court Ruling over an Icelandic Bank Is a Blow to Global Banking.” February 2.
———. 2015. “Why Fintech Won’t Kill Banks.” June.
Economist Intelligence Unit. 2015. “The Disrup-tion of Banking.” October 20.
Eichengreen, B., K. Walsh, and G. Weir. 2014. “Internationalization of the Renminbi: Path-ways, Implications, and Opportunities.” CIFR Research Report, Centre for Interna-tional Finance and Regulation, Sydney, Aus-tralia. http://www.cifr.edu.au/assets/document/CIFR%20Internationalisation%20of%20the%20RMB%20Report%20Final%20web.pdf.
Enoch, C. 2007. “Credit Growth in Central and Eastern Europe.” In Rapid Credit Growth in Central and Eastern Europe, edited by Charles Enoch and Inci Ökter-Robe, 3–12. London: Palgrave Macmillan UK.
of Globalisation of World Financial Markets. Seoul: Bank of Korea.
Demirgüç-Kunt, A., M. S. Martínez Pería, and T. Tressel. 2017. “The Global Financial Crisis and the Capital Structure of Firms: Was the Impact More Severe among SMEs and Non-Listed Firms?” Unpublished paper, World Bank.
Detragiache, E., and P. Gupta. 2006. “Foreign Banks in Emerging Market Crises: Evidence from Malaysia.” Journal of Financial Stability 2 (3): 217–42.
Detragiache, E., Tressel, T., and Gupta, P. 2008. “Foreign Banks in Poor Countries: Theory and Evidence.” Journal of Finance 635: 2123–60.
DeYoung, R., and D. E. Nolle. 1996. “Foreign-Owned Banks in the United States: Earning Market Share or Buying It?” Journal of Money, Credit and Banking 28 (4): 622–36.
D’Hulster, K. 2014. “Ring-Fencing Cross Border Banks: How Is It Done and How Important Is It?” Unpublished paper, World Bank, Washing-ton, DC.
D’Hulster, K., and I., Ötker-Robe. 2015. “Ring-fencing cross-border banks: An effective supervisory response?” Journal of Banking Regulation 16 (3): 169–187.
Diamond, D. W. 1984. “Financial Intermediation and Delegated Monitoring.” Review of Eco-nomic Studies 51 (3): 393–414.
Diamond, D. W., and P. Dybvig. 1983. “Bank Runs, Deposit Insurance, and Liquidity.” Jour-nal of Political Economy 91 (3): 401–19.
Diamond, D. W., and R. G. Rajan. 2001. “Liquid-ity Risk, Liquidity Creation, and Financial Fragility: A Theory of Banking.” Journal of Political Economy 109 (2): 287–327.
Didier, T., R. Levine, and S. L. Schmukler. 2015. “Capital Market Financing, Firm Growth, and Firm Size Distribution.” Policy Research Work-ing Paper 7353, World Bank, Washington, DC.
Didier, T., R. Llovet, and S. L. Schmukler. 2017. “International Financial Integration of East Asia and Pacifi c.” Journal of the Japanese and International Economies 44: 52–66.
Dinc, I. S. 2005. “Politicians and Banks: Political Infl uences on Government-Owned Banks in Emerging Markets.” Journal of Financial Eco-nomics 77 (2): 453–79.
Dong, H., F. M. Song, and L. Tao. 2011. “Reg-ulatory Arbitrage: Evidence from Bank
152 B I B L I O G R A P H Y GLOBAL FINANCIAL DEVELOPMENT REPORT 2017/2018
Analysis with Bank-Level Data from OECD Countries.” In Federal Reserve Bank of Chicago Bank Structure Conference, 226–30, Federal Reserve Bank of Chicago, May 3–5. Chicago.
Forbes. 2016. “How the Blockchain Will Trans-form Everything from Banking to Government to Our Identities.” May 26.
Forbes, K. 2010. “Why Do Foreigners Invest in the United States?” Journal of International Eco-nomics 80 (1): 3–21.
Forbes, K. J., and Warnock, F. E. 2012. “Capital Flow Waves: Surges, Stops, Flight, and Retrenchment.” Journal of International Eco-nomics 88(2): 235–51.
Forrester Consulting. 2015. “Digital Transforma-tion in the Age of the Consumer.” Accenture, Dublin. https://www.accenture.com/ca-en/insight-digital-transformation-age-customer.
Fratzscher, M. 2012. “Capital Flows, Push versus Pull Factors and the Global Financial Crisis.” Journal of International Economics 88 (1): 341–56.
FSB (Financial Stability Board). 2011. Financial Stability Issues in Emerging Market and Devel-oping Economies. Report to the G20 Finance Ministers and Central Bank Governors, November 2, 2011.
———. 2013. Monitoring the Effects of Agreed Regulatory Reforms on Emerging Market and Developing Economies, November 12, 2014.
———. 2015. Thematic Review on Supervisory Frameworks and Approaches for SIBs: Peer Review Report, May 26, 2015.
Fungáčová, Z., R. Herrala, and L. Weill. 2013. “The Infl uence of Bank Ownership on Credit Supply: Evidence from the Recent Financial Crisis.” Emerging Markets Review 15: 136–47.
Galema, R., M. Koetter, and C. Liesegang. 2016. “Lend Global, Fund Local? Price and Funding Cost Margins in Multinational Banking.” Review of Finance 20 (5): 1981–2014.
García-Herrero, A., and M. S. Martínez Pería. 2007. “The Mix of International Banks’ For-eign Claims: Determinants and Implications.” Journal of Banking and Finance 31 (6): 1613–31.
García-Herrero, A., and F. Vázquez. 2013. “Inter-national Diversifi cation Gains and Home Bias
European Commission. 2015. “Building a Capital Markets Union.” Green Paper, Brussels.
Faia, E., and B. Weder di Mauro. 2015. “Cross-border Resolution of Global Banks.” Dis-cussion Paper 11, European Commission, Brussels. http://ec.europa.eu/info/publications/cross-border-resolution-global-banks_en.
Fama, E. F. 1985. “What’s Different about Banks?” Journal of Monetary Economics 15 (1): 29–39.
FATF (Financial Action Task Force). 2014. “FATF Clarifi es Risk-Based Approach: Case-by-Case, Not Wholesale De-Risking.” Paris.
Fernández, A., M. W. Klein, A. Rebucci, M. Schindler, and M. Uribe. 2016. “Capital Con-trol Measures: A New Dataset.” IMF Economic Review 64 (3): 548–74.
Feyen, E., R. Letelier, I. Love, S. Maimbo, and R. Rocha. 2014. “The Impact of Funding Models and Foreign Bank Ownership on Bank Credit Growth: Is Central and Eastern Europe Differ-ent?” World Bank Policy Research Working Paper 6783.
Fiechter, J., M. I. Ötker, A. Ilyina, M. Hsu, M. A. Santos, and J. Surti. 2011. Subsidiaries or Branches: Does One Size Fit All? Washington, DC: International Monetary Fund.
Financial Conduct Authority. 2015. “Regulatory Sandbox.” London, November.
Financial Times. 2016a. “Banks in Charge at Hong Kong’s Sandbox.” September 6. https://www.ft.com/content/38a662ee-740f-11e6-bf48-b372cdb1043a.
———. 2016b. “Market Grows for ‘Regtech,’ or AI for Regulation.” October 14. https://www.ft.com/content/fd80ac50-7383-11e6-bf48-b372cdb1043a
Fischer, M., C. Hainz, J. Rocholl, and S. Steffen. 2014. “Government Guarantees and Bank Risk Taking Incentives.” Research Working Paper, European School of Management and Technol-ogy, Berlin.
Fischer, S. 2014. “The Federal Reserve and the Global Economy.” Speech by Vice Chairman of the Board of Governors of the Federal Reserve System delivered as the Per Jacobson Founda-tion Lecture at the 2014 Annual Meetings of the International Monetary Fund and World Bank Group, Washington, DC.
Focarelli, D., and A. Pozzolo. 2000. “The Determi-nants of Cross-Border Shareholding: An

GLOBAL FINANCIAL DEVELOPMENT REPORT 2017/2018 B I B L I O G R A P H Y 153
Gourinchas, P. O., and O. Jeanne. 2009. “Capital Mobility and Reform.” 2009 Meeting Papers 107, Society for Economic Dynamics, Minneapolis.
Gozzi, J. C., R. Levine, M. S. Martínez Pería, and S. L. Schmukler. 2015. “How Firms Use Domestic and International Corporate Bond Markets.” Journal of Banking and Finance 58: 532–51.
Greenspan, A. 1999a. “Do Effi cient Financial Markets Mitigate Financial Crises?” Speech to Financial Markets Conference of the Federal Reserve Bank of Atlanta, Sea Island, GA.
———. 1999b. “Lessons from the Global Crises.” Speech to World Bank Group and International Monetary Fund, Program of Seminars.
Gulamhussen, M. A., C. Pinheiro, and A. F. Poz-zolo. 2014. “International Diversifi cation and Risk of Multinational Banks: Evidence from the Pre-Crisis Period.” Journal of Financial Stabil-ity 13: 30–43.
Hagendorff, J., I. Hernando, M. J. Nieto, and L. D. Wall. 2012. “What Do Premiums Paid for Bank M&As Refl ect? The Case of the Euro-pean Union.” Journal of Banking and Finance 36 (3): 749–59.
Hale, G., T. Kapan, and C. Minoiu. 2016. “Crisis Transmission in the Global Banking Network.” IMF Working Paper 16/91, International Mon-etary Fund, Washington, DC.
Hanson, G. 2012. “The Rise of Middle Kingdoms: Emerging Economies in Global Trade.” Journal of Economic Perspectives 26 (2): 41–64.
Hasan, I., and W. C. Hunter. 1996. “Effi ciency of Japanese Multinational Banks in the United States.” Research in Finance 14: 157–74.
Havrylchyk, O., and P. E. Jurzyk. 2011. “Profi t-ability of Foreign and Domestic Banks in Cen-tral and Eastern Europe: Does the Mode of Entry Matter?” Economics of Transition 19: 443–72.
Hayden, E., D. Porath, and N. V. Westernhagen. 2007. “Does Diversifi cation Improve the Per-formance of German Banks? Evidence from Individual Bank Loan Portfolios.” Journal of Financial Services Research 32 (3): 123–40.
Herrmann, S., and D. Mihaljek. 2013. “The Deter-minants of Cross-Border Bank Flows to Emerg-ing Markets.” Economics of Transition 21 (3): 479–508.
in Banking.” Journal of Banking and Finance 37 (7): 2560–71.
Gennaioli, N., A. Martin, and S. Rossi. 2014. “Sovereign Default, Domestic Banks, and Financial Institutions.” Journal of Finance 69 (2): 819–66.
Giannettia, M., and S. Ongena. 2012. “‘Lending by Example’: Direct and Indirect Effects of For-eign Banks in Emerging Markets.” Journal of International Economics 86 (1): 167–80.
Giovannini, A., C. Mayer, S. Micossi, C. Di Noia, M. Onado, M. Pagano, and A. Polo. 2015. “Restarting European Long-Term Investment Finance.” Green Paper Discussion Document, Centre for Economic Policy Research, London. http: / /re l t i f .cepr.org/s i tes /default / f i les/RELTIF_Green%20Paper.pdf.
Goldberg, L., B. G. Dages, and D. Kinney. 2000. “Foreign and Domestic Bank Participa-tion in Emerging Markets: Lessons from Mex-ico and Argentina.” NBER Working Paper 7714, National Bureau of Economic Research, Cambridge, MA.
Goldberg, L. G., and. D. Johnson. 1990. “The Determinants of US Banking Activity Abroad.” Journal of International Money and Finance 9 (2): 123–37.
Goldberg, L. S. 2009. “Understanding Banking Sector Globalization.” IMF Staff Papers 561, 171–97.
Goodhart, Charles A. E. 2013. “Global Macroeco-nomic and Financial Supervision: Where Next?” In Globalization in an Age of Crisis: Multilateral Economic Cooperation in the Twenty-First Century, edited by Robert C. Feenstra and Alan M. Taylor, 343–63. Chicago: University of Chicago Press.
Gormley, T. A. 2005. “Banking Competition in Developing Countries: Does Foreign Bank Entry Improve Credit Access?” Department of Economics, Massachusetts Institute of Technol-ogy, Cambridge, MA.
———. 2010. “The Impact of Foreign Bank Entry in Emerging Markets: Evidence from India.” Journal of Financial Intermediation 19 (1): 26–51.
———. 2014. “Costly Information, Entry, and Credit Access.” Journal of Economic Theory 154: 633–67.

154 B I B L I O G R A P H Y GLOBAL FINANCIAL DEVELOPMENT REPORT 2017/2018
International Monetary Fund, Washington, DC. https://www.imf.org/external/pubs/ft/wp/2016/wp1688.pdf.
IMF (International Monetary Fund). 2003. “Trade Finance in Financial Crises: Assessment of Key Issues.” IMF, Washington, DC.
———. 2010. “Resolution of Cross-Border Banks—A Proposed Framework for Enhanced Coordination.” IMF Staff Paper. IMF: Wash-ington, DC.
———. 2014. “Global Liquidity—Issues for Sur-veillance.” IMF Policy Paper, Washington, DC.
———. 2015a. Global Financial Stability Report—Navigating Monetary Policy Chal-lenges and Managing Risks. Washington, DC: IMF.
———. 2015b. “Corporate Leverage in EmergingMarkets: A Concern?” Chapter 3, in Global
Financial Stability Report, 55-91. Washington, DC: IMF.
———. 2015c. “International Banking after the Crisis: Increasingly Local and Safer?” Chapter 2 in Global Financial Stability Report, 55-91. Washington, DC: IMF.
———. 2016. “The Withdrawal of Correspondent Banking Relationships: A Case for Policy Action.” IMF Staff Discussion Note 16/6, Washington, DC.
Independent Evaluation Group (IEG). 2012. The World Bank’s Response to the Global Eco-nomic Crisis: Phase II. Washington, DC: World Bank.
Isik, I., and M. K. Hassan. 2002. “Cost and Profi t Effi ciency of the Turkish Banking Industry: An Empirical Investigation.” Financial Review 37 (2): 257–79.
Jeanneau, S., and M. Micu. 2002. “Determinants of International Bank Lending to Emerging Market Countries.” BIS Working Paper 112, Bank for International Settlements, Basel, Switzerland.
Jeon, B. N., M. P. Olivero, and J. Wu. 2011. “Do Foreign Banks Increase Competition? Evidence from Emerging Asian and Latin American Banking Markets.” Journal of Banking and Finance 35 (4): 856–75.
———. 2013. “Multi national Banking and the International Transmission of Financial Shocks: Evidence from Foreign Bank Subsidiaries.”
Hesse, H., S. Bakhache, and T. Asonuma. 2015. “Is Banks’ Home Bias Good or Bad for Public Debt Sustainability?” IMF Working Paper 15/44, International Monetary Fund, Washing-ton, DC.
Heuchemer, S., S. Kleimeier, and H. Sander. 2009. “The Determinants of Cross-Border Lending in the Euro Zone.” Comparative Economic Stud-ies 51 (4): 467–99.
Hoggarth, G., J. Hooley, and Y. Korniyenko. 2013. “Which Way Do Foreign Branches Sway? Evi-dence from the Recent UK Domestic Credit Cycle.” Financial Stability Paper 22, Bank of England, London.
Hoggarth, G., L. Mahadeva, and J. Martin. 2010. “Understanding International Bank Capital Flows during the Recent Financial Crisis.” Financial Stability Paper 8, Bank of England, London.
Honohan, P., and Beck, T. 2007. Making Finance Work for Africa. Washington, DC: World Bank.
Horváth, B. L., H. Huizinga, and V. Ioannidou. 2015. “Determinants and Valuation Effects of the Home Bias in European Banks’ Sovereign Debt Portfolios.” CEPR Discussion Paper DP10661, Centre for Economic Policy Research, London.
Houston, J. F., C. Lin, and Y. Ma. 2012. “Regula-tory Arbitrage and International Bank Flows.” Journal of Finance 67 (5): 1845–95.
Huang, R. R. 2008. “Evaluating the Real Effect of Bank Branching Deregulation: Comparing Con-tiguous Counties across US State Borders.” Jour-nal of Financial Economics 87 (3): 678–705.
Hughes, J. P., and L. J. Mester. 2013. “Who Said Large Banks Don’t Experience Scale Econo-mies? Evidence from a Risk-Return-Driven Cost Function.” Journal of Financial Interme-diation 22 (4): 559–85.
Iapadre, L., and L. Tajoli. 2014. “Emerging Coun-tries and Trade Regionalization: A Network Analysis.” Journal of Policy Modeling 36 (1): S89–110.
ICC (International Chamber of Commerce). 2016. “Rethinking Trade and Finance: An ICC Pri-vate Sector Development Perspective.” ICC Banking Commission, Paris.
Ichiue, H., and F. Lambert. 2016. “International Banking: An Analysis with New Regulatory Survey Data.” IMF Working Paper WP/16/88,

GLOBAL FINANCIAL DEVELOPMENT REPORT 2017/2018 B I B L I O G R A P H Y 155
Lane, P., and G. M. Milesi-Ferretti. 2008. “Inter-national Investment Patterns.” Review of Eco-nomics and Statistics 90 (3): 538–49.
Lehner, M. 2009. “Entry Mode Choice of Multi-national Banks.” Journal of Banking and Finance 33 (10): 1781–92.
Lehner, M., and M. Schnitzer. 2008. “Entry of For-eign Banks and Their Impact on Host Coun-tries.” Journal of Comparative Economics 36 (3): 430–52.
Levchenko, A. A., and P. Mauro. 2007. “Do Some Form of Financial Flows Help Protect against ‘Sudden Stops’?” World Bank Economic Review 21 (3): 389–412.
Levine, R. 1997. “Financial Development and Eco-nomic Growth: Views and Agenda.” Journal of Economic Literature 35 (2): 688–726.
Levine, R., C. Lin, and W. Xie. 2016. “Spare Tire? Stock Markets, Banking Crises, and Economic Recoveries.” Journal of Financial Economics 120 (1): 81–101.
Lothian, J. R. 2002. “The Internationalization of Money and Finance and the Globalization of Financial Markets.” Journal of International Money and Finance 21 (6): 699–724.
Manova, K. 2013. “Credit Constraints, Heteroge-neous Firms, and International Trade.” Review of Economic Studies 80 (2): 711–44.
Matoušek, R., and A. Taci. 2004. “Effi ciency in Banking: Empirical Evidence from the Czech Republic.” Economics of Planning 37 (3): 225–44.
McGuire, P., and N. A. Tarashev. 2008. “Bank Health and Lending to Emerging Markets.” BIS Quarterly Review (December): 67–80.
McCauley, R. N., P. McGuire, and G. Von Peter. 2010. “The Architecture of Global Banking: From International to Multinational?” BIS Quarterly Review (March): 25–37.
McCauley, R., P. McGuire, and V. Sushko. 2015. “Global Dollar Credit: Links to U.S. Monetary Policy and Leverage.” Economic Policy 30 (82): 187–229.
McKinsey Global Institute. 2016. Digital Finance for All: Powering Inclusive Growth in Emerg-ing Economies. New York: McKinsey Global Institute.
Mehigan, C. 2016. “Foreign Bank Identity: Does It Matter for Credit Growth?” http://dx.doi.org/10.2139/ssrn.2788417.
Journal of Banking and Finance 37 (3): 952–72.
Jeon, B. N., J. Wu, M. Chen, and R. Wang. 2016. “Does Foreign Bank Penetration Affect the Risk of Domestic Banks? Evidence from Emerging Economies.” Unpublished paper. https://ssrn.com/abstract=2843638.
Kalemli-Ozcan, S., E. Papaioannou, and J. L. Pey-dró. 2010. “What Lies Beneath the Euro’s Effect on Financial Integration? Currency Risk, Legal Harmonization, or Trade?” Journal of International Economics 81 (1): 75–88.
Kamil, H., and K. Rai. 2010. “The Global Credit Crunch and Foreign Banks’ Lending to Emerg-ing Markets: Why Did Latin America Fare Bet-ter?” IMF Working Paper 10/102, International Monetary Fund, Washington, DC.
Kaminsky, G. L., and S. L. SchmuklerL. 2008. “Short-Run Pain, Long-Run Gain: Financial Liberalization and Stock Market Cycles.” Review of Finance 12 (2): 253–92.
Karolyi, G. A., and A. G. Taboada. 2015. “Regula-tory Arbitrage and Cross-Border Bank Acquisi-tions.” Journal of Finance 70 (6): 2395–450.
Kashyap, A., J. Stein, and D. Wilcox. 1993. “Mon-etary Policy and Credit Conditions: Evidence from the Composition of External Finance.” American Economic Review 83 (1): 78–98.
Khwaja, A., and A. Mian. 2008. “Tracing the Impact of Bank Liquidity Shocks: Evidence from an Emerging Market.” American Eco-nomic Review 98 (4): 1413–42.
Klomp, J., and J. De Haan, 2014. “Bank Regula-tion, the Quality of Institutions, and Banking Risk in Emerging and Developing Countries: An Empirical Analysis.” Emerging Markets Finance and Trade 50 (6): 19–40.
Kouretas, G., and C. Tsoumas. 2016. “Foreign Bank Presence and Business Regulations.” Jour-nal of Financial Stability 24: 104–116.
KPMG. 2016. “The Pulse of Fintech Q2 2016: Global Analysis of Fintech Venture Funding.” Montreal.
Kroszner, R. S., L. Laeven, and D. Klingebiel. 2007. “Banking Crises, Financial Dependence, and Growth.” Journal of Financial Economics 84: 187–228.
Landau, J. P. 2013. “Global Liquidity: Public and Private.” Unpublished paper.

156 B I B L I O G R A P H Y GLOBAL FINANCIAL DEVELOPMENT REPORT 2017/2018
Sub-Saharan Africa.” IMF RES-SPR Macroeco-nomic Challenges Facing Low-Income Coun-tries Conference Paper, International Monetary Fund, Washington, DC. https://www.imf.org/external/np/seminars/eng/2014/lic/pdf/Moyo.pdf.
Müller, O., and A. Uhde. 2013. “Cross-Border Bank Lending: Empirical Evidence on New Determinants from OECD Banking Markets.” Journal of International Financial Markets Institutions and Money 23: 136–62.
Nakamoto, S. 2008. “Bitcoin: A Peer-to-Peer Elec-tronic Cash System.” https://bitcoin.org/en/bitcoin-paper.
Niepman, F., and T. Schmidt-Eisenlohr. 2013. “International Trade, Risk and the Role of Banks.” Staff Report 633, Federal Reserve Bank of New York.
NSBA (National Small Business Association). 2016. 2016 Mid-Year Economic Report. Wash-ington, DC.
Nyantakyi, E. B., and M. Sy. 2015. “The Banking System in Africa: Main Facts and Challenges.” African Economic Brief, African Development Bank, Abidjan, Nigeria. https://www.afdb.org/fi leadmin/uploads/afdb/Documents/Knowledge/AEB_Vol_6_Issue_5_2015_The_Banking_Sys tem_in_Afr i ca__Main_Fact s_and_Challenges-10_2015.pdf.
Oliner, S., and G. C. Rudebusch. 1996. “Monetary Policy and Credit Conditions: Evidence from the Composition of External Finance: Com-ment.” American Economic Review 86 (1): 300–09.
Ongena, S., A. Popov, and N. van Horen. 2016. “The Invisible Hand of the Government: ‘Moral Suasion’ during the European Sovereign Debt Crisis.” DNB Working Paper 505, De Nederlandsche Bank, Amsterdam.
Ongena, S., A. Popov, and G. F. Udell. 2013. “‘When the Cat’s Away the Mice Will Play’: Does Regulation at Home Affect Bank Risk-Taking Abroad?” Journal of Financial Econom-ics 108 (3): 727–50.
Ongena, S., S. Qi, and F. Qin. 2014. “The Impact of Foreign Bank Presence on Foreign Direct Investment in China.” China and World Econ-omy 23 (4): 40–59.
Papaioannou, E. 2009. “What Drives International Financial Flows? Politics, Institutions and
Mian, A. 2003. “Foreign, Private Domestic, and Government Banks: New Evidence from Emerging Markets.” Journal of Banking and Finance 27 (7): 1219–410.
———. 2006. “Distance Constraints: The Limits of Foreign Lending in Poor Economies.” Jour-nal of Finance 61 (3): 1465–505.
Micco, A., U. Panizza, and M. Yañez. 2007. “Bank Ownership and Performance: Does Politics Matter? Journal of Banking and Finance 31 (1): 219–41.
Mihaljek, D. 2011. “How Have External Factors Affected Monetary Policy in the EMEs? The Infl uence of External Factors on Monetary Pol-icy Frameworks and Operations.” BIS Papers 57: 1–9.
Milesi-Ferretti, G. M., and C. Tille. 2011. “The Great Retrenchment: International Capital Flows during the Global Financial Crisis.” Eco-nomic Policy 26 (66): 289–346.
Miller, S. R., and A. Parkhe. 2002. “Is There a Lia-bility of Foreignness in Global Banking? An Empirical Test of Banks’ X Effi ciency.” Strate-gic Management Journal 23 (1): 55–75.
Mills, K., and B. McCarthy. 2014. “The State of Small Business Lending: Credit Access during the Recovery and How Technology May Change the Game.” Working Paper 15-004, Harvard Business School, Cambridge, MA.
Mittal, S., and J. Lloyd. 2016. “The Rise of Fin-tech in China: Redefi ning Financial Services.” Collaborative Report by DBS (Development Bank of Singapore) and EY (Ernst & Young).
Morais, B., J. L. Peydró, Jessica Roldan and C. Ruiz Ortega. Forthcoming. “The International Bank Lending Channel of Monetary Policy Rates and Quantitative Easing: Credit Supply, Reach-for-Yield, and Real Effects.” Journal of Finance.
Morgan, D. P., B. Rime, and P. E. Strahan. 2004. “Bank Integration and State Business Cycles.” Quarterly Journal of Economics 119 (4): 1555–84
Morrison, A. D., and L. White. 2009. “Leveling Playing Fields in International Financial Regu-lation.” Journal of Finance 64 (3): 1099–142.
Moyo, J., B. Nandwa, D. E. Council, J. Oduor, and A. Simpasa. 2014. “Financial Sector Reforms, Competition and Banking System Stability in

GLOBAL FINANCIAL DEVELOPMENT REPORT 2017/2018 B I B L I O G R A P H Y 157
PwC (PricewaterhouseCoopers). 2011. “The New Digital Tipping Point.” https://www.pwc. com/gx / en /bank ing - cap i t a l -marke t s/publications/assets/pdf/pwc-new-digital-tipping-point.pdf.
———. 2016. “Review and Outlook of China’s Banking Industry in 2015.” Banking Newslet-ter, April 30, 2016. http://www.pwccn.com/webmedia/doc/635987551331759799_banking_newsletter_2015.pdf.
Quinn, D. P., and A. M. Toyoda. 2008. “Does Capital Account Liberalization Lead to Growth?” Review of Financial Studies 21 (3): 1403–49.
Rabobank. 2015. “Financial Inclusion and Rural Development 2015.” Rabo Development Impact Report, Utrecht.
Rajan, R. 2014. “Competitive Monetary Easing: Is It Yesterday Once More?” Speech, Brookings Institution, Washington, DC, April 10.
Ramachandran, V. 2016. “Mitigating the Effects of De-Risking in Emerging Markets in Order to Preserve Remittance Flows.” EMCompass Note 22, International Finance Corporation, Washington, DC.
Reinhart, C. M., and K. S. Rogoff. 2008. “This Time Is Different: A Panoramic View of Eight Centuries of Financial Crises.” NBER Working Paper w13882, National Bureau of Economic Research, Cambridge, MA. http://www.nber.org/papers/w13882.
Reinhardt, D., and R. Sowerbutts. 2015. “Regula-tory Arbitrage in Action: Evidence from Bank-ing Flows and Macroprudential Policy.” Staff Working Paper 546, Bank of England, London.
Reuters. 2013. ‘Doom Loop’ Tying European Banks and Governments Reinforced. December 16. http://uk.reuters.com/article/uk-eu-banks-idUKBRE9BF13O20131216.
———. 2014. Global Equity Capital Markets Review: Managing Underwriters. http://dmi.thomsonreuters.com/Content/Files/4Q2013_Thomson_Reuters_Equity_Capital_Markets_Review.pdf.
———. 2016. Lending Club CEO Resigns after Internal Probe, Shares Plummet. May 9, 2016.
Rey, H. 2015. “Dilemma Not Trilemma: The Global Cycle and Monetary Policy Indepen-dence.” NBER Working Paper No. 21162.
Other Determinants.” Journal of Development Economics 88 (2): 269–81.
PBOC (People’s Bank of China). 2016. “China Pay-ment System Development Report.” Beijing.
Peek, J., and E. S. Rosengren. 1997. “The Interna-tional Transmission of Financial Shocks: The Case of Japan.” American Economic Review 87 (4): 495–505.
———. 2000. “Collateral Damage: Effects of the Japanese Bank Crisis on Real Activity in the United States.” American Economic Review 90 (1): 30–45.
Peek, J., E. S. Rosengren, and F. Kasirye. 1999. “The Poor Performance of Foreign Bank Sub-sidiaries: Were the Problems Acquired or Created?” Journal of Banking and Finance 23 (2): 579–604.
Pesenti, P., and C. Tille. 2000. “The Economics of Currency Crises and Contagion: An Introduc-tion.” Federal Reserve Bank of New York Eco-nomic Policy Review 6: 3–16.
Philippon, T. 2015. “Has the US Finance Industry Become Less Effi cient? On the Theory and Measurement of Financial Intermediation.” American Economic Review 105 (4): 1408–38.
———. 2016. “The FinTech Opportunity.” NBER Working Paper 22476, National Bureau of Economic Research, Cambridge, MA.
PIIE (Peterson Institute for International Econom-ics). 2016. Peering into China’s Growing Peer-to-Peer Lending Market. China Economic Watch, P2P Series. Washington, DC: PIIE.
Poelhekke, S. 2015. “Do Global Banks Facilitate Foreign Direct Investment?” European Eco-nomic Review 76: 25–46.
Politico. 2016. “Can Washington Control High-Tech Lending?” September 28, 2016.
Popov, A., and G. F. Udell. 2012. “Cross-Border Banking, Credit Access, and the Financial Crisis.” Journal of International Economics 87 (1): 147–61.
Portes, R., and H. Rey. 2005. “The Determinants of Cross-Border Equity Flows.” Journal of International Economics 65 (2): 269–96.
Powell, A. 2014. “Global Recovery and Monetary Normalization: Escaping a Chronicle Fore-told?” In Latin American and Caribbean Mac-roeconomic Report (chapter 4). Washington, DC: Inter-American Development Bank.

158 B I B L I O G R A P H Y GLOBAL FINANCIAL DEVELOPMENT REPORT 2017/2018
Starnes, S., A. J. Alexander, and M. Kurdyla. 2016. “De-Risking by Banks in Emerging Markets—Effects and Responses for Trade.” EMCompass Note 24, International Finance Corporation, Washington, DC.
Starnes, S., M. Kurdyla, A. Prakash, A. Volk, and S. Wang, 2017. “Impact of De-Risking: Emerg-ing Market Banks’ Capacity to Serve Clients and Countries.” Unpublished report, IFC.
Temesvary, J. 2015a. “Foreign Activities of US Banks since 1997: The Roles of Regulations and Market Conditions in Crises and Normal Times.” Journal of International Money and Finance 56: 202–22.
———. 2015b. “The Role of Regulatory Arbitrage in US Banks’ International Flows: Bank-Level Evidence.” https://ssrn.com/abstract=2585464 or http://dx.doi.org/10.2139/ssrn.2585464.
U.S. Department of the Treasury. 2016. “Opportu-nities and Challenges in Online Marketplace Lending.” Washington, DC.
van Horen, N. 2007. “Foreign Banking in Devel-oping Countries: Origin Matters.” Emerging Markets Review 8 (2): 81–105.
Viñals, José, Ceyla Pazarbasioglu, Jay Surti, Aditya Narain, Michaela Erbenova, and Julian Chow. 2013. “Creating a Safer Financial System: Will the Volcker, Vickers, and Liikanen Structural Measures Help.” IMF Staff Discussion Note SDN/13/4, International Monetary Fund, Washington, DC.
Visual Capitalist. 2016. “27 Fintech Unicorns, and Where They Were Born.” September 7.
Wade, R., and S. Sigurgeirsdottir. 2011. “Iceland’s Rise, Fall, Stabilization and Beyond.” Cam-bridge Journal of Economics 36 (1): 127–44.
Wagner, C. 2012. “From Boom to Bust: How Dif-ferent Has Microfi nance Been from Traditional Banking?” Development Policy Review 30 (2): 187–210.
Wall Street Journal. 2016. “U.S. House Bill Aims to Set Up Sandbox for Fintech Innovation.” September 22.
Weill, L. 2003. “Banking Effi ciency in Transition Economies.” Economics of Transition 11 (3): 569–92.
Weisbrot, M., and J. Montecino. 2010. “The IMF and Economic Recovery: Is Fund Policy Con-tributing to Downside Risks?” Center for Eco-nomic and Policy Research Report, London.
National Bureau of Economic Research, Cam-bridge, MA.
Roure, C., L. Pelizzon, and P. Tasca. 2016. “How Does P2P Lending Fit into the Consumer Credit Market.” Discussion Paper 30/2016, Deutsche Bundesbank, Frankfurt.
Roussakis, E. N. 1997. “Global Banking: Origins and Evolution.” Revista de Administração de Empresas 37 (4): 45–53.
Saal, M., S. Starnes, and T. Rehermann. 2017. “The Challenges and Opportunities for Emerg-ing Markets Banks from the Digitalization of Financial Services.” Unpublished paper.
Schindler, M. 2009. “Measuring Financial Integra-tion: A New Data Set.” IMF Staff Papers 56 (1): 222–38.
Schnabl, P. 2012. “The International Transmission of Bank Liquidity Shocks: Evidence from an Emerging Market.” Journal of Finance 67 (3): 897–932.
Schoenmaker, D. 2013. Governance of Interna-tional Banking: The Financial Trilemma. Oxford: Oxford University Press.
Schuh, S., and O. Shy. 2016. “U.S. Consumers’ Adoption and Use of Bitcoin and Other Virtual Currencies.” Working paper, Federal Reserve Bank of Boston.
Sensarma, R. 2006. “Are Foreign Banks Always the Best? Comparison of State-Owned, Private and Foreign Banks in India.” Economic Model-ling 23 (4): 717–35.
Seth, R., D. E. Nolle, and S. K. Mohanty. 1998. “Do Banks Follow Their Customers Abroad?” Financial Markets, Institutions, and Instru-ments 7 (4): 1–25.
Shin, H. S. 2013. “The Second Phase of Global Liquidity and Its Impact on Emerging Econo-mies.” Keynote address at Asia Economic Pol-icy Conference, Federal Reserve Bank of San Francisco, November 7.
Siregar, R., and K. M. Choy. 2010. “Determinants of International Bank Lending from the Devel-oped World to East Asia.” IMF Staff Papers 57 (2): 484–516.
Škarica, B. 2014. “Determinants of Non-Perform-ing Loans in Central and Eastern European Countries.” Financial Theory and Practice 38 (1): 38-59.
Smith, R. C., I. Walter, and G. DeLong. 2012. Global Banking. Oxford: Oxford University Press.
GLOBAL FINANCIAL DEVELOPMENT REPORT 2017/2018 B I B L I O G R A P H Y 159
Technology-Enabled Innovation on Financial Stability.” Geneva.
Wu, H. L., C. H. Chen, and M. H. Lin. 2007. “The Effect of Foreign Bank Entry on the Opera-tional Performance of Commercial Banks in the Chinese Transitional Economy.” Post-Commu-nist Economies 19 (3): 343–57.
Wu, J., H. Lim, and B. N. Jeon. 2016. “The Impact of Foreign Banks on Monetary Policy Transmis-sion during the Global Financial Crisis of 2008–2009: Evidence from Korea.” Emerging Markets Finance and Trade 52 (7): 1574–86.
Wu, J., A. C. Luca, and B. N. Jeon. 2011. “Foreign Bank Penetration and the Lending Channel in Emerging Economies: Evidence from Bank-Level Panel Data.” Journal of International Money and Finance 30 (6): 1128–56.
Yamori, N. 1998. “A Note on the Location Choice of Multinational Banks: The Case of Japanese Financial Institutions.” Journal of Banking and Finance 22 (1): 109–20.
Zeissler, A., T. Piontek, and A. Metrick. 2015. “Ireland and Iceland in Crisis C: Iceland’s Landsbanki Icesave.” No. 57246, Yale School of Management YPFS Cases, Yale School of Management, New Haven, CT
Zhu, M. 2012. “The Impact of Foreign Bank Entry in Emerging Markets: Knowledge Spillovers or Competitive Pressure?” CCP Working Paper 12-4, Centre for Competition Policy, University of East Anglia, Norwich, U.K.
Zingales, L. 2015. “Presidential Address: Does Finance Benefi t Society?” Journal of Finance 70 (4): 1327–63 .
Wiggins, R. Z., N. Tente, and A. Metrick. 2014. “European Banking Union C: Cross Border Resolution-Fortis Group.” Yale Program on Financial Stability Case Study 2014-5C-V1, New Haven, CT, November.
World Bank. 2006. Global Development Finance: The Development Potential of Surging Capital Flows. Washington, DC: World Bank.
———. 2011. Global Development Horizons 2011: Multipolarity—The New Global Econ-omy. Washington, DC: World Bank.
———. 2013. Global Development Horizons: Capital for the Future—Saving and Investment in an Interdependent World. Washington, DC: World Bank.
———. 2014. Global Financial Development Report: Financial Inclusion. Washington, DC: World Bank.
———. 2015a. “Report on the G20 Survey on De-Risking Activities in the Remittance Market.” Working paper, Washington, DC.
———. 2015b. “Withdrawal from Correspondent Banking: Where, Why, and What to Do About It.” Working paper, Washington, DC.
———. 2016a. “Migration and Remittances Fact-book, 2016.” Washington, DC.
———. 2016b. “Stakeholder Dialogue on De-Risking: Findings and Recommendations.” Washington, DC.
World Economic Forum. 2016a. “The Future of Financial Infrastructure. An Ambitious Look at How Blockchain Can Reshape Financial Ser-vices.” Cologny, Switzerland.
———. 2016b. “The Role of Financial Services in Society: Understanding the Impact of

ECO-AUDIT
Environmental Benefi ts Statement
The World Bank Group is committed to reducing its environmental footprint. In support of this commitment, we leverage electronic publishing options and print-on-demand technology, which is located in regional hubs worldwide. Together, these initiatives enable print runs to be lowered and shipping distances decreased, resulting in reduced paper consumption, chemical use, greenhouse gas emissions, and waste.
We follow the recommended standards for paper use set by the Green Press Initiative. The majority of our books are printed on Forest Stewardship Council (FSC)–certifi ed paper, with nearly all containing 50–100 percent recycled content. The recycled fi ber in our book paper is either unbleached or bleached using totally chlorine-free (TCF), processed chlorine–free (PCF), or enhanced elemental chlorine–free (EECF) processes.
More information about the Bank’s environmental philosophy can be found at http://www.worldbank.org/corporateresponsibility.
