bank of sierra leone
TRANSCRIPT


Bank of Sierra Leone
Annual Report
and
Statement of Accounts
for year ended 31st December 2011

Contents
A. Annual Report 2011
1. Review of the Economy 12. Real Sector Development 53. Fiscal Operations 164. Monetary Developments 225. External Developments 256. Supervision of commercial Banks and Other Financial Institutions 327. Payments System Development in sierra Leone 408. Foreign Exchange Management 429. External Debt Management 4810. Monetary Operations 5011. Financial Market Developments 5112. Sierra Leone’s Performance under the West African 54
Monetary Zone’s (WAMZ) Convergence Criteria13. Internal Audit 5614. Human Resources Developments 5615. Directors of the Board 58
B. Statement of Accounts
1. Financial Position and Operating Results for year ended 31st December 2011 61-692. General Information 703. Report of the Directors 713. Independent Auditor's Report 754. Statement of Financial Position 765. Statement of Comprehensive Income 77-786. Statement of Changes in Equity 79-807. Statement of Cash Flows 818. Notes to the Financial Statements 82-128
1
ANNUAL REPORT AND STATEMENT OF ACCOUNTS
A. ANNUAL REPORT 2011
1.01.01.01.01.0 Review of the EconomyReview of the EconomyReview of the EconomyReview of the EconomyReview of the Economy
Macroeconomic performance in Sierra Leone during 2011improved significantly compared to 2010,the second half of which was characterised by expansionary fiscal and monetary policies due to thescaling up of government investment in infrastructure development. The turnaround in the country’seconomic performance was achieved through implementation of prudent macroeconomic policy measuresincluding tight fiscal and monetary policies adopted by the authorities as a strategy to correct theimbalances of the previous year. Under the IMF supported Extended Credit Facility (ECF) programme,fiscal policy was tightened by limiting domestic financing of the budget deficit (bank and non-bank) to1 percent of GDP compared to the programme target of 1.9 percent of GDP. Enhanced revenueperformance was therefore the key driver in financing the fiscal deficit to support government’sinfrastructure development spending during the period. This was combined with prudent expenditurerationalization measures. On account of the tight monetary policy, a limit was set on the annual flow ofdirect credit from the Bank of Sierra Leone to government to 5 percent of the actual domestic revenuein the previous year. The Bank purchased government securities for monetary policy purposes only inthe secondary market. Real GDP growth during the review period was estimated at 5.3 percent,compared to a growth rate of 5.0 percent in 2010. The growth in GDP during the year was drivenlargely by continuing investment in mining, agriculture and food security, basic infrastructure, electricitygeneration and services. Annual inflation as measured by the year-on-year change in Consumer PriceIndex declined from 17.84 percent in December 2010 to 16.64 percent in December 2011. Inflationperformance during the review period was driven in part, by external supply shocks and domesticpolicies to ensure full pass-through of international prices of petroleum products and food commoditiesto the domestic economy. Private sector lending by commercial banks expanded during the reportingperiod.
During the review period, the Government of Sierra Leone continued to benefit from its internationaldevelopment partners in the form of Budgetary and Non-Budgetary external inflows to support thecountry’s economic programmes. Non-Budgetary support took the form of either Balance of Paymentsdisbursements or Development Project/Programme support channelled to the various sectors of theeconomy. In December 2011, the Executive Board of the International Monetary Fund approved theimmediate disbursement of SDR8.8million (US$13.8million) to Sierra Leone, being balance of paymentssupport, following the satisfactory conclusion of the second and third reviews of the country’s performanceunder the three year IMF supported Extended Credit Facility (ECF) programme which was approvedby the Fund’s Executive Board in June 2010. Total disbursement under the arrangement is currentlySDR17.76mn (about US$27.6mn). In concluding the reviews, the Board granted waivers for thecountry’s non-compliance with the performance criteria on net domestic bank credit to Governmentand net domestic assets of the Central Bank as at end 2010, as well as for the continuous non-observanceof the ceiling requirement on non-concessionary external debts. Additionally, the Board accepted theadjustments on the performance criteria on net domestic bank credit to the central bank, net domesticassets of the central bank and gross foreign exchange reserves of the central bank, as a reflection of theenvisaged changes in fiscal and monetary policies.

2
BANK OF SIERRA LEONE
Agriculture continues to attract substantial donor support from the country’s development partners as apriority sector for enhancing growth, food security and poverty reduction. During the period, the WorldBank and the Government of Japan approved grants in the sum of US$42 million for two projects[West Africa Agricultural Productivity Program (WAAPP) and Rural Private Sector Development Project(RPSDP)] to boost production and trade in agricultural produce in the country. In another developmentduring the year, the Sierra Leonean Parliament ratified a non-project grant of ¥900mn for economicco-operation from the Japanese Government, as well as a US$72mn grant from the International Fundfor Agricultural Development (IFAD). Of the latter, US$50mn was in support of the Small FarmersCommercialization Programme under the Global Agricultural and Food Security Programme andUS$22mn as assistance to the West African Agricultural Productivity Programme.
Performance in the agriculture sub-sector was largely driven by the priority status the Government hasaccorded it as a key vehicle for delivering growth, food security and poverty reduction. It was also dueto the substantial support the sector received from the country’s international development partners.Agricultural development strategy in 2011 took the form of implementation of a number of agriculturalprogrammes/projects including the Small-Holder Commercialization Programme, which seeks to increasemarketable surpluses and incomes of small holders. The National Sustainable Agricultural DevelopmentProgramme (NSADP), also seeks to boost agricultural output through the provision of subsidizedinputs and machinery as well as training of a large number of farmers. Consequently, in line with theincentives created by the increase in world market prices of commodity during the year, the volume ofboth coffee and cocoa exported in 2011 increased by 17.82 percent and 18.81 percent respectively.Total production of coffee beans rose by 26.87 percent in 2011 relative to production in 2010. Outputof cocoa, on the other hand, declined by 8.65 percent during the same period.
The mining sub-sector remained a key driver of economic activity in 2011, mainly due to the discoveryof large deposits of iron ore in Northern Sierra Leone and the commencement of operations of twonew foreign owned iron ore mining companies – the African Minerals Ltd and the London MiningCompany Ltd. The African Minerals Limited Company (AML), on 11th August 2011 signed the finalagreements with its Chinese counterpart, Shandong Iron and Steel Group (SISG), that would lead tothe investment of an additional US$1.5 billion towards the development of phase II of the Tonkolili ironore project in the country. The Sierra Rutile Mining Company also paid thirteen million Euros (•13mn)to the government, as part amortization of its subsidiary loan obtained from the Government of SierraLeone in 2005, to restart mining activity. Sierra Leone qualified for a US$15.7 million grant under theAfrican Development Bank’s (AfDB) Fragile States Facility, to finance the second Economic GovernanceReform Program (EGRF), which aims at strengthening public financial management and revenuegovernance in the mining and energy sectors.
Total output of diamonds fell by 18.8 percent to 355.28 thousand carats in the reporting year, attributableto weak international demand resulting from the recent global economic crisis in the Euro-zone. Similarly,output of gold declined by 15.1 percent, in spite of the incentives created by the increase in worldmarket price of the minerals. This phenomenon could be partly attributable to low activity in goldmining during the review period. The value of total mineral exports in 2011 amounted to US$240.73mn,which was 20.0 percent higher than the US$200.65mn recorded in 2010, largely due to increases inthe export values of diamonds, bauxite, illmenite and zircon. During the reporting year, an estimatedvolume of 137 thousand metric tons of iron ore concentrates, valued at US$15.3mn was exported forthe first time in more than three (3) decades.

3
ANNUAL REPORT AND STATEMENT OF ACCOUNTS
In the Telecommunications sector, Parliament ratified a long term concessional loan agreement forUS$15.314 million between the Government of Sierra Leone and the Export Bank of China, to fundthe Sierra Leone Dedicated Security Information System Project. The project aims at improving thenational telecom and security systems in the country. The seventeen thousand miles Fibre-Optic CableNetwork, under the Africa Coast to Europe (ACE) Project, landed in Freetown in October, 2011. Theproject which is financed mainly by the World Bank and the Islamic Development Bank is expected toimprove Sierra Leone’s broad band capacity and enhance private and public sector information andcommunication needs, as well as facilitate the country’s transformation from its currently limited satellitesystem of communication to a high-speed modern cable communications system.
During the review period, Parliament also ratified the Credit Reference Act 2010, which supports thecollection of vital credit information on individuals and business entities, in an effort to address theproblem of information asymmetry, and ensure increased flow of credit to the private sector.
Real sector outturn during the period was mixed, with the agriculture sector and mining sub-sectorexhibiting significant improvements over the preceding year’s performance, while the manufacturingsub-sector continued to remain largely sluggish.
In the energy sub-sector, overall electricity generation in 2011 improved compared to the previousyear. This development was largely attributable to the growth in electricity generation powered mainlyby the Bumbuna hydroelectric dam. Total units of electricity generated in 2011 recorded 175.67 millionkilowatt hours (kwh), indicating a growth rate of 3.07 percent compared to 170.43 million kilowatthours (kwh) in 2010. This went to support the increased scale of mining activities in the country.
On May 1 2011, the Government introduced the metric system of measurement for marketing ofpetroleum products with the litre now representing the unit of measurement in place of gallons.Simultaneously, the pump prices of petroleum products were revised upwards by 17 percent to reflecta full pass-through of international petroleum prices there by reducing the growing subsidies in thebudget. The pump price of petroleum products were initially set at five thousand Leones (Le5,000) alitre before it was subsequently revised downwards to Le4,500 per litre on 27th May 2011. Also,during the year, the ten percent (10%) import duty on rice was temporarily suspended to cushion theimpact of high global market prices of rice on domestic consumption. The foregoing developments hadserious implications for inflation performance in Sierra Leone in 2011. As measured by the year-on-year changes in national Consumer Price Index (CPI) inflation fell from 17.84 percent in December2010 to 16.64 percent in December 2011 and continued to remain in double digits throughout thereporting year, due to a combination of factors ranging from supply shocks attributable to hikes indomestic and international prices of food and fuel, the part removal of Government’s subsidy on petroleumproducts and the continued depreciation of the Leone against the United States Dollar.
Outturn of fiscal operations in 2011 was a deficit of Le667.46bn, representing 6.97 percent of GrossDomestic Product (GDP), which was in breach of the benchmark of 4.0 percent of GDP or less (< 4%of GDP) as prescribed under the West African Monetary Zone (WAMZ). The deficit was also aboveboth the budget target of Le375.27bn (3.92% of GDP) for the year and the preceding year’s deficit ofLe523.52bn (6.89% of GDP). The expansion in the deficit, relative to both periods was on account ofthe marked increase in total outlays during the review period.

4
BANK OF SIERRA LEONE
The Bank of Sierra Leone continued to maintain a tight monetary policy stance during the reportingperiod through strict enforcement of the limit on direct financing of government deficit and active OpenMarket Operations (OMO). The objective was to neutralize the impact of expansionary fiscal policyarising from government expenditures on infrastructure development, particularly in the area of energysupply, health and roads construction. To further enhance monetary policy management, the Bank ofSierra Leone also introduced the Monetary Policy Rate (MPR) in February 2011, to signal its monetarypolicy stance and benchmark for other market rates with a view to anchor inflation expectation. Monetaryaggregates were expansionary in the review period, with Broad Money (M2) and Reserve Money(RM) expanding by 21.61 percent and 12.97 percent, respectively. However, the growth rates of M2and RM at end December 2011 were lower than the corresponding growth rates of 32.73 percent and34.61 percent recorded respectively at end December 2010. Also, M2 and RM breached their respectiveceiling targets of 13.75 percent and 3.94 percent respectively, at end December 2011.
In the financial sector, the total number of commercial banks operating in the country remained unchangedat 13 as at end December 2011. However, the total number of commercial bank branches in thecountry increased from 80 at end December 2010 to 86 at end December 2011. Consequently, theratio of bank branches to population moderately improved during the review period to reflect progressin the financial inclusion programme. Most commercial banks operating in the country recorded profits,enhanced resource mobilization and expanded capital levels during the year. The banks also increasedtheir lending operations during the period under review as well as reduced their non-performing loansfrom 15.61 percent at end December 2010 to 15.08 percent at end December 2011.
Developments in the foreign exchange market in 2011 indicated that with the increase in supply offoreign exchange from the commercial banks, demand pressures on the exchange rate somewhat easedespecially with the Bank of Sierra Leone complementing the supply through its weekly foreign exchangeauction. However, the increases in world market prices of petroleum products and other imported foodcommodities, which partly accounted for the rise in the general level of domestic prices and the double-digit inflation rate, partly explained the moderate depreciation of the Leone against major world currencies.Consequently, all the foreign exchange channels recorded slight depreciation of the Leone against theUS Dollar during the review period. The annual average official exchange rate of the Leone to theUnited States Dollar depreciated by 9.33 percent from Le3,978.09/US$1 in 2010 to Le4,349.16/US$1 in December 2011. Meanwhile, the average monthly exchange rate of the Leone against the USDollar in the parallel market reached a high of Le4,425.85/US$1 in December 2011 compared toLe4,082.88/US$1 in December 2010, reflecting an 8.40 percent depreciation. Hence, the spreadbetween the official and the parallel market rates narrowed by 1.76 percent to Le 76.69/US$1 inDecember 2011 from Le104.79/US$1 in December 2010.
External sector developments revealed unfavourable trade performance, with the annual trade deficitmore than doubling in 2011 compared to the preceding year. The trade deficit moved from US$429.94mnin 2010 to US$1,336.85mn in 2011, on account of a surge in import payments in respect of miningrelated capital goods and machineries, which significantly outweighed export receipts during the reportingperiod. Gross external reserves of the Bank of Sierra Leone stood at US$376.79mn as at end December2011, indicating an improvement of US$31.99 (9.28%) on the US$344.80mn recorded at end December2010. In spite of the growth in gross reserves in the reporting period, its cover of imports of goods andservices decreased to 2.4 months of import in 2011, compared to 4.5 months of import cover recordedin 2010. This was on account of higher imports to support domestic growth, particularly in the miningsector.

5
ANNUAL REPORT AND STATEMENT OF ACCOUNTS
Sierra Leone’s performance under the WAMZ Convergence Criteria at end December 2011 indicatedthat the country satisfied only one out of the four primary criteria (central bank financing of fiscal deficitas a percentage of the previous year’s tax revenue) and one out of the six secondary criteria (PublicInvestment from Domestic Receipts of not less than 20.0%). The country continued to breach thecriterion on single digit inflation, though the national year-on-year inflation rate declined from 17.84percent at end December 2010 to 16.64 percent end December 2011.
2.0 Real Sector DevelopmentsIn spite of the disruptions caused by the global food and fuel price hikes during the period, real sectorperformance in 2011 continued to show signs of steady progress. Real Gross Domestic Product (GDP)is projected to grow by 5.3 percent during the year, up from 5.0 percent in 2010. The growth in realGDP is driven mainly by government investments in infrastructure as well as the positive contributionsderived from agricultural, mining and services sectors.
The Government continued to emphasise the agriculture sector as a vehicle, consistent with its agendafor food security and poverty reduction. During the year, the agriculture sector benefited from increasedsupport for the farming programs in Sierra Leone. The World Bank approved the sum of US$42million as grant to boost agricultural production in the country. Addax Bioenergy, a wholly-ownedsubsidiary of the Geneva-based Addax and Oryx Group Limited (AOG), embarked on a 10,000-hectare sugar-cane plantation project in Makeni, Northern Sierra Leone which is expected to commenceproduction of ethanol by 2013. In another development during the year, independent cooperatives ofcocoa producers were established in the three Eastern Districts in Sierra Leone with a view to pooltogether cocoa beans for export. The cooperative network is expected to increase price sensitivityamong indigenous cocoa farmers and generate competition with bigger companies, leading to higherprices and increased incomes.
The mining sub-sector, currently dominated by diamond mining activity, remained the main driver toeconomic growth in Sierra Leone and a major source of Government revenue. During the year underreview, the World Bank and the United Kingdom Department for International Development (UK/DFID) jointly contributed the sum of US$8 million in assistance towards the enhancement of neededcapacity of Sierra Leoneans to formulate and negotiate mining contract agreements, as well as toaugment revenue collection, particularly in areas that had not originally been recognized under a previousproject because of resource constraints. The blasting at the site of the iron ore mines in Ferengbeyavillage, Tonkolili District took place on the 27th January 2011, symbolising the official commencementof iron-ore mining by the African Minerals Mining Company. The year also witnessed the commissioningof the Tonkolili Phase I project, which commenced the export of iron ore from Sierra Leone in November2011. The first shipment of iron ore in more than 30 years amounting to 40,000 tonnes was successfullymade to China on 22nd November 2011 by the African Minerals Mining Company. In June 2011 ajoint-venture agreement was signed between the Sierra Leone Exploration and Mining Company Ltd.(SLEMCO) and an Indian-based company (ABG Shipyard), to mine bauxite in the Port Loko Districtin Northern Sierra Leone. The reserves deposit of bauxite in Port Loko and parts of the KambiaDistrict is estimated at 321 metric tons.
In the energy sector, government’s emphasis, as outlined in the 2011 budget, is on improving thedistribution and transmission network in Freetown as well as restoring electricity in all District HeadquarterTowns, including the use of solar technology to provide electricity supply to remote rural areas. In

6
BANK OF SIERRA LEONE
Table 1
Jan-Dec '10 Jan-Jun'11 Jul-Dec'11 Jan-Dec '111 2 3 4 5 6
Minerals Diamonds 000' carats 437.55 210.21 145.07 355.28 Bauxite 000' M tons 1,087.19 788.89 668.61 1,457.51 Rutile 000' M tons 68.20 27.15 40.82 67.97 Ilmenite 000' M tons 18.21 4.79 9.78 14.58 Gold 000' Ounces 8.69 3.08 2.20 5.28 Zircon 000' M tons - 4.64 3.72 8.35 Iron Ore 000' M tons - - 137.91 137.91
AgricultureCoffee M tons 2.99 3.60 0.19 3.79 Cocoa M tons 19.70 11.59 6.41 18.00
Manufactured GoodsBeer and Stout 000' Cartons 795.48 433.28 499.64 932.93 Maltina 000' Cartons 203.42 152.48 141.86 294.33 Acetylene 000' cu.ft 201.68 103.16 95.42 198.57 Oxygen 000' cu.ft 273.66 137.95 129.41 267.36 Confectionery 000' lbs 2,947.87 1,758.84 1,710.68 3,469.52 Common Soap 000' M tons 416.90 153.76 326.65 480.40 Soft drinks 000' crates 1,962.08 994.90 886.25 1,881.15 Paint 000' gals 225.23 107.77 96.10 203.86 Cement 000' M tons 307.21 162.95 147.95 310.90 Flour 000' M tons 9.63 6.80 7.32 14.12
ServicesElectricity GW/hrUnit Generated GW/hr 170.43 79.04 96.60 175.64 Industrial Consumption GW/hr 25.01 15.83 16.10 31.93 Domestic Consumption GW/hr 48.17 12.02 8.96 20.99 Commercial Consumption GW/hr 44.75 8.02 5.97 13.99 Government Consumption GW/hr 11.52 6.57 4.88 11.45
Production
Sources: Manufacturing Establishments

7
ANNUAL REPORT AND STATEMENT OF ACCOUNTS
pursuit of this, a Memorandum of Understanding was signed between the Government and a USenergy company, Joule Africa, to expand the capacity of the Bumbuna hydropower generation from50 mw to 400 mw over the next six years. The project is expected to deliver on full power generationby 2017. Progress was also recorded in the area of renewable energy, with the commencement ofconstruction work in November 2011 by Addax Bioenergy (a local subsidiary of the Geneva-basedAddax and Oryx) on the first ethanol refinery and biomass fuel powered plant in the Northern city ofMakeni. The African Development Bank (AfDB) in April 2011 approved a •25 million private sectorloan to finance the Addax Bioenergy Sierra Leone (ABSL) project. In a related development duringthe year, the African Minerals Limited signed a Memorandum of Understanding with China CommunicationConstruction Company (CCCC), for the construction of subsidiary hydroelectric power generationfacilities at the Tonkolili iron ore project, to complement the government’s efforts at expanding theBumbuna hydro-electric power generation facilities.
During the year, the communication sector benefited from further boost, as the country secured its firstfibre optic connection to the outside world in October 2011 with the landing of the Africa Coast toEurope (ACE) submarine cable in Freetown. The World Bank is expected to provide $30 milliontowards funding Sierra Leone’s connection to the cable offshore.
The transport sector was significantly enhanced in June 2011, with the commissioning of fourteen (14)brand new buses, procured by the Melian Tours Company, a private business concern, to complementgovernment’s efforts at improving public transportation. The Government of Sierra Leone, through theMinistry of Trade and Industry, in collaboration with the Ministry of Transport and Aviation, the NationalCommission for Privatization, and the Sierra Leone Road Transport Corporation (SLRTC), procuredforty (40) buses from the Republic of India to ease the problem of transportation countrywide. Thefirst batch of ten of these buses landed at the Queen Elizabeth II Quay during the fourth quarter of2011, while the remaining are expected early in 2012.
Infrastructure development, particularly road construction, remains high on the Government’s agendain 2011. In this regard, a number of major road projects were completed during the review period,linking the capital to the provincial towns. Construction of major highways and suburban roads in themain urban centres of Freetown, Bo, Kenema and Makeni, as well as feeder roads linking the productiveareas in the provinces, were significantly rehabilitated during the reporting year. Simultaneously,reconstruction and rehabilitation work at the Lungi International Airport, especially on the terminals andtarmac continued to progress throughout 2011.
The national year-on-year inflation rate declined from 17.84 percent at end December 2010 to 16.64percent at end December 2011 and remained in double digits throughout 2011. Annual average inflationrate in 2011 was 16.06 percent compared to 16.77 percent in 2010.The increase in the rate wasmainly driven by high global food and fuel prices, exchange rate depreciation and growth in moneysupply during the year.
2.1 AgricultureAgriculture remains government’s top priority sector, largely on account of the desire to achieve the firstMillennium Development Goal (MDG1) of reducing poverty and hunger by 2015. In line with thisobjective, the Government’s Agenda for Change emphasised increased output and productivity in theagriculture and fisheries sectors as one of the four key priorities. Consequently, an amount of Le22.4

8
BANK OF SIERRA LEONE
billion was allocated to the Ministry of Agriculture, Forestry and Food Security (MAFFS) in the 2011budget, in respect of recurrent spending. Of this total, Le14.3 billion was channelled towards promotingactivities geared towards enhancing food security. Furthermore, using resources from the World Bank,the European Union, the African Development Bank, IFAD, Japan and other international donors, thegovernment established a US$400 million project under the “Small-Holder Commercialization Program”with the aim of boosting agricultural productivity and incomes of smallholders. An amount of Le13.5billion was transferred to local councils for agricultural activities. Additionally, Le94.2 billion was allocatedfrom the capital budget to the agriculture sector, including Le26.3 billion to facilitate the expansion ofthe Small-Holder Commercialization Programme. Furthermore, the government continued to implementthe National Sustainable Agricultural Development Programme (NSADP) during the period, includingthe provision of subsidized inputs, machinery and training to an additional 20,000 farmers, as well asthe construction of additional Agricultural Business Centres under the Small-Holder CommercializationProgramme. To further enhance performance in the agriculture sector, the World Bank and theGovernment of Japan approved grants in the sum of US$42 million for two projects [West AfricaAgricultural Productivity Program (WAAPP) and Rural Private Sector Development Project(RPSDP)] to boost production and trade in agricultural produce in the country. The grant agreementfor WAPP was signed on June 1, 2011 between the Government of Sierra Leone and the World Bank.
2 0 0 9 2 0 1 0 2 0 1 1M a iz e 4 4 , 4 6 0 5 1 , 3 8 8 5 3 , 9 5 7
C a s s a va 2 , 8 1 4 , 5 7 6 3 , 2 5 0 , 0 4 4 3 , 4 1 2 , 5 4 5
S w e e t P o ta to 1 7 6 , 9 6 9 2 0 6 , 1 8 9 2 1 6 , 4 9 9
G ro u n d n u t 7 0 , 0 4 9 8 1 , 4 5 7 8 5 , 5 3 0
S O U R C E : M i n i s tr y o f A g r i c u l tu r e a n d F o o d S e c u r i ty
C R O P
T a b le 2P ro d u c tio n o f M a jo r F o o d C ro p s (2 0 0 9 - 2 0 1 1 )
0
500,000
1,000,000
1,500,000
2,000,000
2,500,000
3,000,000
3,500,000
2009 2010 2011
Metric Tons
Year
Chart 1 - Production of Major Food Crops (2009 - 2011 )
Maize
Cassava
Sweet Potato
Groundnut

9
ANNUAL REPORT AND STATEMENT OF ACCOUNTS
The WAPP is a regional project covering Sierra Leone, Togo, Benin, Niger, Liberia and The Gambia,with a total budget of $120 million (of which $22 million is meant for Sierra Leone). The funds areexpected to generate social and economic benefits for an estimated 200,000 agricultural producersand other value chain actors, with the specific targets of increasing rice and cassava production, giventhe very low rice yield levels in the country. The development objective of the RPSDP is to increaseproduction of selected agricultural commodities by 20 percent and sales by 10 percent throughimprovements in efficiencies along the value chain for targeted beneficiaries. The additional financing forthe RPSDP is expected to improve access to markets through rehabilitation and maintenance of feederroads, supporting cocoa marketing and strengthening farmer-based organisations in the country.
2.1.1 Agricultural ProductionEstimates from the Ministry of Agriculture, Forestry and Food Security (MAFFS) indicated an overallincrease in agricultural production during the reporting period compared to 2010, propelled largely bythe implementation of various agricultural policies and programmes.
2.1.2 Crop ProductionProduction of rice was estimated at 1,078,005 metric tons in 2011, compared to 1,026,671 metrictons in 2010, reflecting a 5 percent increase. This development was largely attributable to the increasein the acreage under cultivation and the intensity of cultivation, in response to expanding domesticdemand.
Cassava crop production also increased to 3,412,545 metric tons in 2011 from 3,250,044 metric tonsin 2010, while output of maize increased from 51,388 metric tons in 2010 to 53,957 metric tons. Totalharvest of sweet potatoes rose from 206,189 metric tons in 2010 to 216,499 metric tons in the yearunder review, ground nut production recorded 85,530 metric tons in 2011, from 81,457 metric tons in2010, indicating a growth of 5.00 percent over the year.
The annual production of the country’s two major traditional export crops, namely cocoa and coffee,showed mixed performance in 2011. The total volume of coffee produced in the review period was3.79 thousand metric tons, representing 26.87 percent increase over the preceding year’s total of 2.99thousand metric tons. On the other hand, cocoa production totalled 18 thousand metric tons in 2011,representing 8.65 percent decline, compared to the 19.70 thousand metric tons in the preceding year.The fall in cocoa output was attributed to lower producer prices offered to farmers. Half yearlyperformance showed that both crops recorded higher output during the first half of the reporting periodcompared to the second half. Coffee output was 3.6 thousand metric tons in the first half and only 0.19thousand metric tons in the second half; while cocoa production recorded 11.59 thousand metric tonsin the first half and 6.41 thousand metric tons in the second half. The increase in coffee output waspartly in response to the increase in world market price in 2011, which created incentives for increasedproduction and export. The increase in output was also partly explained by the growing demand forcoffee in the emerging markets, coupled with the resilience of coffee consumption during the currenteconomic crisis. As a result of the first half being an on-season for harvesting of the beans, productionof both crops were higher in the first half relative to the second half of 2011.

10
BANK OF SIERRA LEONE
2.2 ManufacturingPerformance in the manufacturing sub-sector in 2011 was also varied. While increases were observedin the output levels of some industries, others recorded lower output levels relative to the 2010 outputlevels. The yearly production levels for flour and Maltina drink registered the highest production growthrates at 46.62 percent and 44.69 percent respectively, explained by increased demand against thebackdrop of increased availability of raw materials. The volume of beer and stout produced in 2011reflected an increase of 17.28 percent to 932.93 thousand cartons, compared to 795.48 thousandcartons in 2010. This was due to a reduction in importation of foreign brands. Output of confectionerygrew by 17.7 percent to 3,469.52 thousand pounds, moving from 2,947.87 thousand pounds in 2010.Total volume of common soap produced during the period also grew by 15.23 percent to 480.4thousand metric tons. Cement production also recorded a marginal increase of 1.2 percent to 310.9thousand metric tons. The increases in output of these items were generally attributed to a generalincrease in domestic demand, among other things, coupled with the availability of material inputs andincreased electricity supply. In contrast however, declines were recorded in the output levels of otherproducts during the year, due mainly to increased competition from imported products and increasedcost of inputs. Output of soft drinks fell by 4.12 percent to 1,881.15 thousand crates in the year, duelargely to a shift in taste. Production of acetylene and oxygen gas dropped marginally by 1.54 percentand 2.3 percent to 198.57 thousand cubic feet and 267.36 thousand cubic feet respectively over theyear, as a result of intermittent scarcity of raw materials during the period. Paint production alsocontracted by 9.49 percent to 203.86 thousand gallons, notwithstanding the expansion in constructionactivities. This was due to the importation of a large volume of various brands of paint product duringthe period, in anticipation of the festive season in December. On the whole, movements in output levelswere indicative of a generally improved performance in the manufacturing sub-sector during 2011.
On a half-yearly basis, with the exception of beer and stout, common soap and flour which outputincreased throughout the year, output levels of most manufactured items were lower in the second halfof the year due to competition with imported brands.
2.3 MiningOutput in the mining sub-sector contracted in 2011, in-spite of the commencement of iron-ore miningoperations during the year. Output levels for almost all the minerals recorded decreases in the reviewperiod compared to their levels in 2010, with the exception of bauxite, which recorded an increase of34.06 percent.
Table 3
Gold Diamond Bauxite Rutile Ilmenite Zircon Iron Ore(000' ounces) (000' Carat) (000' M tons) (000' M tons) (000' M tons) (000' M tons) (000' M tons)
2007 6,816.59 603,698.18 1,169,036.08 82,805.00 15,750.00 - -2008 6,152.69 371,285.31 954,370.01 78,908.00 17,258.00 - -2009 5,356.46 400,371.72 742,817.00 63,864.00 15,201.00 - -2010 8,690.22 437,552.04 1,089,131.00 68,198.00 18,206.00 - -2011 5,284.15 355,278.40 1,457,506.66 67,970.00 14,576.00 8,354.00 137,905.00
SOURCE: Government Diamond Department
Year
Mineral Production (2007 - 2011)
11
ANNUAL REPORT AND STATEMENT OF ACCOUNTS
Output of diamonds shipped during the year, as recorded by the Gold and Diamond Department(GDD), totalled 355.28 thousand carats, showing a decline by18.8 percent compared to last year. Ofthe total volume shipped, industrial diamonds accounted for 134.24 thousand carats, while gem diamondsaccounted for 215.97 thousand carats. Production of diamonds increased to 210.21 thousand caratsin the first half of 2011 but dropped to 145.07 thousand carats in the second half. This developmentwas consistent with the trend in world market prices, following the European economic crisis. Productionof bauxite expanded by 34.06 percent over the year to 1,457.51 thousand metric tons in 2011. Totaloutput of rutile and ilmenite (a bye-product of rutile) dropped slightly by 0.33 percent to 67.97 thousandmetric tons and 19.94 percent to 14.58 thousand metric tons respectively over the period, on accountof the transfer of the dredging plant to a new area of the current ore body (the Lanti deposits). Outputof rutile was higher in the second half of the year relative to the first, as a result of the movement ofdredging operations to a higher grade area. Similarly, output of gold slumped by 39.19 percent to 5.28thousand ounces in the reporting period, in-spite of the increases in the average world market price ofgold from US$1,224.57/oz in 2010 to US$1,568.23/oz in 2011. The substantial drop in gold productionwas attributed to a reduction in the number of players engaged in the mining of the mineral. Productionof Zircon commenced during the year, recording a total of 8.35 thousand metric tons, while productionof iron ore, which also commenced during the period after more than thirty years of cessation, totalled137.91 thousand metric tons. Although the sector’s overall production performance in 2011 was low,growth prospects remain high, against the backdrop of reactivation of full scale iron ore mining and theanticipated increase in investment.
2.4 Services
2.4.1 ConstructionA vital indicator in assessing performance in the construction sub-sector is the level of production andconsumption of cement. In 2011, cement output increased to 310.9 thousand metric tons from 307.21
T a b l e 4
2 0 0 8 2 0 0 9 2 0 1 0 2 0 1 1
R e s i d e n t i a l 1 9 0 9 1 8 3 9 1 4 1 1 1 1 0 0
C o m m e r c i a l 6 3 1 3 1 1 9 9 3 4 4
W a l l F e n c e 1 7 5 1 7 6 1 4 4 1 6 8
S c h o o l s 7 2 3 1 9
C h u r c h e s 7 1 5 8 1 0
M o s q u e s 3 6 2 7
H o s p i t a l s 2 2 1 5
H o a r d i n g s 0 2 0 9
T o t a l 2 1 6 6 2 1 7 3 1 7 6 8 1 6 6 2
S O U R C E : M i n i s t r y o f L a n d s a n d C o u n t r y P l a n n i n g
B u i l d i n g P e r m i t s i s s u e d f o r F r e e t o w n a n d G r e a t e r F r e e t o w n
12
BANK OF SIERRA LEONE
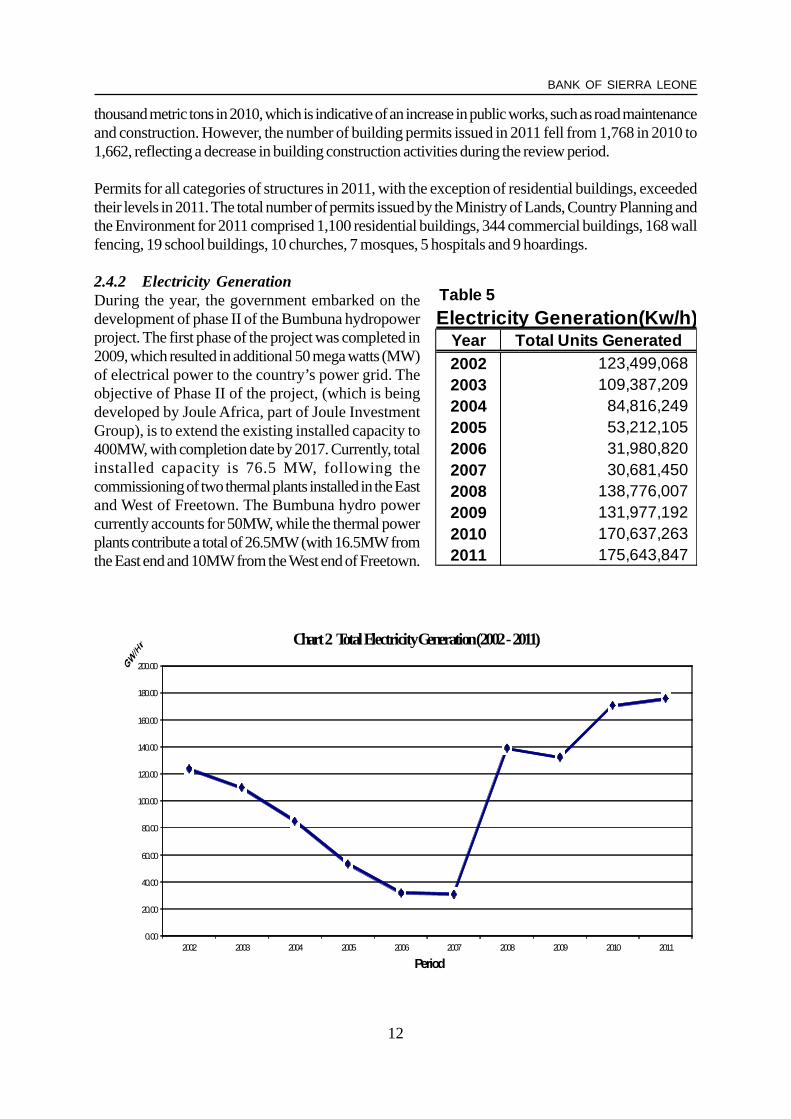
thousand metric tons in 2010, which is indicative of an increase in public works, such as road maintenanceand construction. However, the number of building permits issued in 2011 fell from 1,768 in 2010 to1,662, reflecting a decrease in building construction activities during the review period.
Permits for all categories of structures in 2011, with the exception of residential buildings, exceededtheir levels in 2011. The total number of permits issued by the Ministry of Lands, Country Planning andthe Environment for 2011 comprised 1,100 residential buildings, 344 commercial buildings, 168 wallfencing, 19 school buildings, 10 churches, 7 mosques, 5 hospitals and 9 hoardings.
2.4.2 Electricity GenerationDuring the year, the government embarked on thedevelopment of phase II of the Bumbuna hydropowerproject. The first phase of the project was completed in2009, which resulted in additional 50 mega watts (MW)of electrical power to the country’s power grid. Theobjective of Phase II of the project, (which is beingdeveloped by Joule Africa, part of Joule InvestmentGroup), is to extend the existing installed capacity to400MW, with completion date by 2017. Currently, totalinstalled capacity is 76.5 MW, following thecommissioning of two thermal plants installed in the Eastand West of Freetown. The Bumbuna hydro powercurrently accounts for 50MW, while the thermal powerplants contribute a total of 26.5MW (with 16.5MW fromthe East end and 10MW from the West end of Freetown.
0.00
20.00
40.00
60.00
80.00
100.00
120.00
140.00
160.00
180.00
200.00
2002 2003 2004 2005 2006 2007 2008 2009 2010 2011
Period
Chart 2 Total Electricity Generation (2002 -2011)
Table 5
Year Total Units Generated2002 123,499,068 2003 109,387,209 2004 84,816,249 2005 53,212,105 2006 31,980,820 2007 30,681,450 2008 138,776,007 2009 131,977,192 2010 170,637,263 2011 175,643,847
Electricity Generation(Kw/h)

13
ANNUAL REPORT AND STATEMENT OF ACCOUNTS
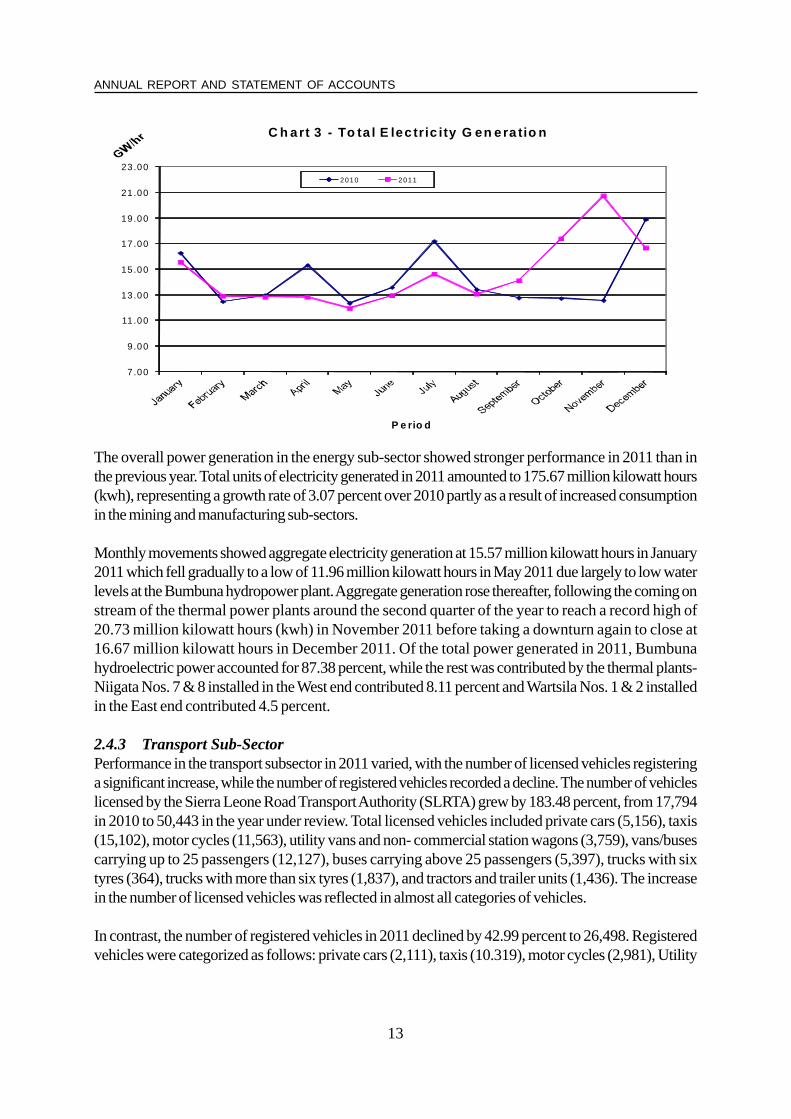
The overall power generation in the energy sub-sector showed stronger performance in 2011 than inthe previous year. Total units of electricity generated in 2011 amounted to 175.67 million kilowatt hours(kwh), representing a growth rate of 3.07 percent over 2010 partly as a result of increased consumptionin the mining and manufacturing sub-sectors.
Monthly movements showed aggregate electricity generation at 15.57 million kilowatt hours in January2011 which fell gradually to a low of 11.96 million kilowatt hours in May 2011 due largely to low waterlevels at the Bumbuna hydropower plant. Aggregate generation rose thereafter, following the coming onstream of the thermal power plants around the second quarter of the year to reach a record high of20.73 million kilowatt hours (kwh) in November 2011 before taking a downturn again to close at16.67 million kilowatt hours in December 2011. Of the total power generated in 2011, Bumbunahydroelectric power accounted for 87.38 percent, while the rest was contributed by the thermal plants-Niigata Nos. 7 & 8 installed in the West end contributed 8.11 percent and Wartsila Nos. 1 & 2 installedin the East end contributed 4.5 percent.
2.4.3 Transport Sub-SectorPerformance in the transport subsector in 2011 varied, with the number of licensed vehicles registeringa significant increase, while the number of registered vehicles recorded a decline. The number of vehicleslicensed by the Sierra Leone Road Transport Authority (SLRTA) grew by 183.48 percent, from 17,794in 2010 to 50,443 in the year under review. Total licensed vehicles included private cars (5,156), taxis(15,102), motor cycles (11,563), utility vans and non- commercial station wagons (3,759), vans/busescarrying up to 25 passengers (12,127), buses carrying above 25 passengers (5,397), trucks with sixtyres (364), trucks with more than six tyres (1,837), and tractors and trailer units (1,436). The increasein the number of licensed vehicles was reflected in almost all categories of vehicles.
In contrast, the number of registered vehicles in 2011 declined by 42.99 percent to 26,498. Registeredvehicles were categorized as follows: private cars (2,111), taxis (10.319), motor cycles (2,981), Utility
7 .00
9 .00
11 .00
13 .00
15 .00
17 .00
19 .00
21 .00
23 .00
P e rio d
C h art 3 - To ta l E lec tr ic i ty G en e ra tio n
2010 2011

14
BANK OF SIERRA LEONE
vans & station wagons (1,411), vans/buses up to 25 passengers (4,274), buses with more than 25passengers (2,800), trucks with six tyres (249), trucks with more than six tyres (1,529) and tractors& trailer units (824). The drop in total registration was mainly reflected in the registration of privatecars, motor cycle, utility vans & station wagons, and vans & buses up to 25 passengers.
2.4.4 CommunicationsThe communications sub-sector expanded further, with mobile telecommunication experiencing increasedcompetition within the Global System for Mobile (GSM) networks. Of the six (6) GSM operatorslicensed to do business in the country (Airtel, Africell, Comium, Intergroup Telecoms, Ambitel andRawabi Dubai), only three (Africell, Airtel and Comium) were operational in 2011. The number oflicensed major internet service providers as of 2011 stood at 18 (eighteen), of which 3 (three) are yetto commence service delivery to the public. The number of Frequency Modulation (FM) broadcastingradio stations totalled 66, including international media houses, the national broadcaster and commercial,community and religious radio stations. The number of SIM card registration surged from 1,752,607in 2010 to 3,039,522 in 2011, with the wire line (fixed phone) showing a decline from 24,000 in 2010to 10,000 in 2011.
Following the landing of the first ever fibre optic cable in the country in 2011, further boost is anticipatedfor the sector. This is expected to reduce general public expenditures on communication, as the countrycurrently depends entirely on satellite networks for international telephone connections with broadbandservices, which have remained extremely expensive.
2.4.5 TourismThe tourism sub-sector experienced a gradual upturn in 2011, evidenced by the increased investment inthe sub-sector especially by indigenous Sierra Leoneans, in the area of newly constructed and refurbishedhotels and guesthouses throughout the country. Official statistics from the Ministry of Tourism indicatethat during 2011, over 600 hotel rooms were added to the existing 3,700 stock of various classes, andabout 400 seats of restaurant facilities were provided country wide. Tourist/visitor arrivals via the LungiInternational Airport for 2011 numbered 52,442 accounting for 53 percent of the total passengerarrival of 99,181 through the airport during the year. The total also represents a 68 percent increase intourist/visit arrival over 2010, partly influenced by the stability and increased confidence in Sierra Leoneas a tourist destination by the international community. The classification of tourist arrivals by country oforigin for the period January-December 2011, indicated that 29.85 percent came from Africa, 10.22percent from Asia, 19.97 percent from America, 26.33 percent from Europe, 6.65 percent from theMiddle East and 6.99 percent from Australia & Oceania.
Analyzed by purpose of visit, tourist arrivals on holidays accounted for 21.25 percent, those on visitto friends and relatives accounted for18.08 percent, while those on businesses comprised 35.24percent, on conferences 10.18 percent and “others” 15.25 percent.
2.5 Inflation DevelopmentsHeadline consumer price inflation remained in double digits throughout the year, driven partly by domesticfactors and largely by the spikes in international prices of fuel and food. From 13.52 percent in January2011, the headline inflation rate rose to 14.92 percent in March 2011, increasing further to15.42percent in April 2011 and reached a high of 17.82 percent in May 2011. The trend was reflective of theupward revision of fuel prices and its accompanying effects on food prices and transport costs.

15
ANNUAL REPORT AND STATEMENT OF ACCOUNTS
The year also witnessed the country’s migration (on 1st May 2011) from the imperial system ofmeasurement to the metric system, in line with international standards. At the same time, the pump priceof petroleum products was increased to Le5,000 a litre to reflect the full pass-through of increases inthe world prices for the products during the year. This development immediately prompted a generalincrease in prices of goods and services. As a result, the pump price was later revised to Le4,500 alitre, in order to mitigate the effect on general prices of the increase in the cost of fuel, while the 10percent subsidy on rice imports was temporarily suspended to cushion the effect of rising world market
Table 6
CPIYear-on-year %
ChangeMonthly %
ChangeCPI
Year-on-year % Change
Monthly % Change
January 157.69 13.53 0.34 157.78 14.69 0.23February 162.17 13.88 2.84 162.53 13.93 3.01March 165.28 14.91 1.92 165.09 14.50 1.58April 167.37 15.43 1.26 166.88 14.60 1.08May 171.27 17.82 2.33 171.26 17.25 2.62June 172.16 16.79 0.52 171.47 15.22 0.12July 174.39 16.82 1.29 174.67 15.94 1.87August 176.35 16.40 1.12 176.96 16.30 1.31September 177.94 15.70 0.90 178.13 14.82 0.66October 180.11 17.15 1.22 181.62 17.41 1.96November 180.80 17.24 0.38 182.89 18.05 0.70December 183.31 16.64 1.39 185.58 17.89 1.47Source: Statistics Sierra Leone
PERIODNATIONAL WESTERN AREA
Inflation Rates 2011
10.00
12.00
14.00
16.00
18.00
20.00Inf. Rate
Period
Chart - 4 Inflation Rates - Western Area (Yr-on -Yr) -2011
16
BANK OF SIERRA LEONE
prices of rice on the poor. Inflation pressures subsequently eased, though marginally, with the year onyear inflation rate reaching 15.7 percent in September 2011. It however increased thereafter to 17.24percent in November, due to global pressures from rising commodity prices, before settling at 16.64percent in December 2011. This represented moderation in general price increase by 1.2 percentagepoints. The annual average inflation rate also declined from 16.77 percent in 2010 to 16.06 percent in2011.
3.0 Fiscal OperationsThe 2011 Government Budget and Statement of Economic and Financial Policies had as its theme:“Scaling up infrastructure investment to support higher economic growth and widen opportunitiesfor job creation and income generation”. True to the theme, the budget focused on public expenditureon projects with potential material benefits to the nation, including construction of trunk and feederroads, supply of electricity and clean water, enhancing agricultural output and food security and providingquality healthcare and educational services.
The strategic objective for 2011 was to enhance economic growth, develop and transform the socialsector, while maintaining macroeconomic stability. The global economic and financial challenges wereviewed as opportunities to search for and adopt innovative and bold interventions to accelerate thecountry’s exit from acute poverty. Consistent with this outlook, the budget stipulated programmesintended to create fiscal space for accelerated capital and social spending by broadening the tax base,containing non-priority spending and raising public sector efficiency, especially in project selection andimplementation.
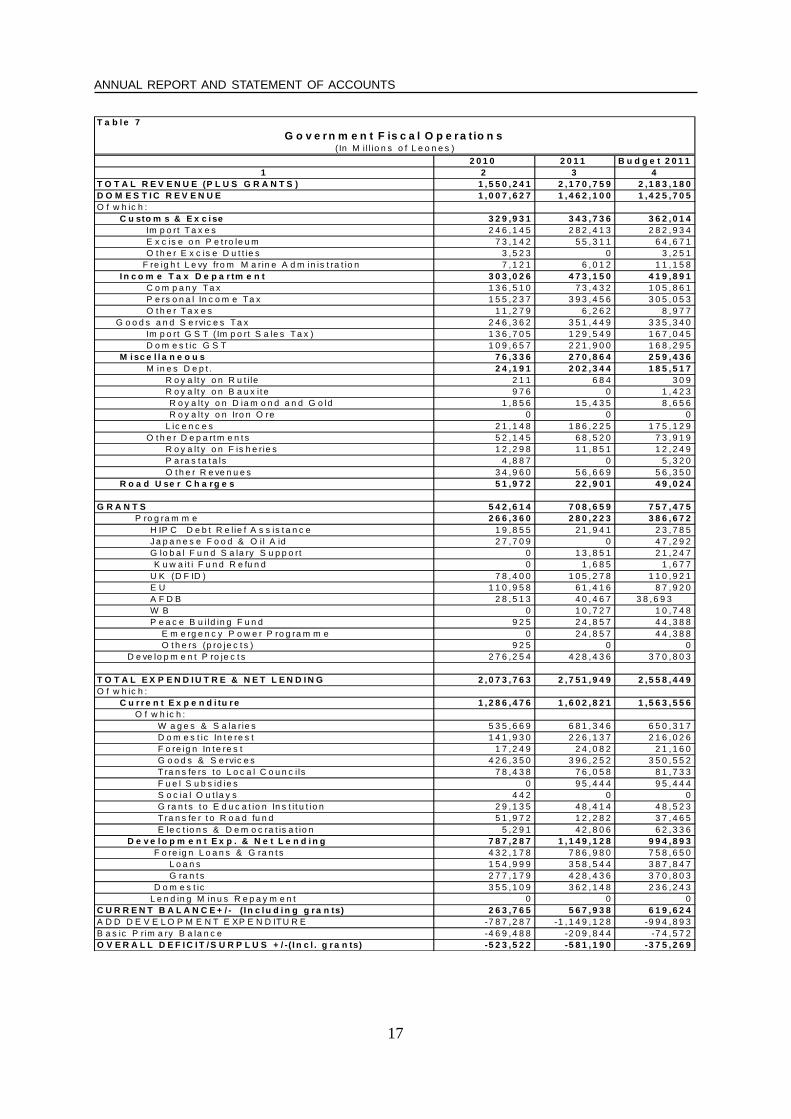
The budget outturn for the year 2011 was an overall deficit of Le581.19bn, translating to 6.44 percentof Gross Domestic Product (GDP), compared to the budgeted deficit of Le375.27bn (3.92% of GDP)for the year and the preceding year’s deficit of Le523.52bn (6.89% of GDP). The higher thanprogrammed outturn in the fiscal deficit was attributed to a shortfall in revenue mobilisation and thelower than budgeted foreign inflows to finance aggregate spending for the year.
Total revenue and grants in 2011 amounted to Le2,170.76bn (24.06% of GDP), marginally lower(0.57%) than the budgeted figure of Le2,183.18bn but 40.03 percent higher than the preceding year’stotal of Le1,550.24bn. The increase in revenue receipts over the year was explained by the strongperformance in domestic revenue mobilisation and the disbursement of foreign grants during the period,compared to the preceding year. The shortfall in the budget estimate for the year was entirely in relationto external receipts as domestic revenue was well above its target.
Against the budget target of Le1,425.71bn, actual domestic revenue in 2011 at Le1,462.10bn (16.2%of GDP) was 2.55 percent higher as well as 45.10 percent above the preceding year’s receipts. Thisperformance was a reflection of improved revenue mobilization effort, coupled with strengthened internalcontrols in revenue collection by the Sierra Leone National Revenue Authority. Consequently, theannual contribution of domestic revenue to total revenue and grants improved to 67.35 percent in 2011from 65.0 percent in 2010.
Collections from customs and excise duties amounted to Le343.74bn (3.81% of GDP) for the periodunder review, representing 23.51 percent of domestic revenue. It was also 4.18 percent above the2010 level of Le329.93bn. The total was however 5.05 percent short of its budgeted target of Le362.01bn.

17
ANNUAL REPORT AND STATEMENT OF ACCOUNTS
T a b l e 7
2 0 1 0 2 0 1 1 B u d g e t 2 0 1 11 2 3 4
T O T A L R E V E N U E (P L U S G R A N T S ) 1 , 5 5 0 , 2 4 1 2 , 1 7 0 , 7 5 9 2 ,1 8 3 , 1 8 0D O M E S T I C R E V E N U E 1 , 0 0 7 , 6 2 7 1 , 4 6 2 , 1 0 0 1 ,4 2 5 , 7 0 5O f w h ic h : C u sto m s & E x c i se 3 2 9 ,9 3 1 3 4 3 , 7 3 6 3 6 2 , 0 1 4 Im p o rt T a x e s 2 4 6 ,1 4 5 2 8 2 , 4 1 3 2 8 2 , 9 3 4 E x c is e o n P e t ro le u m 7 3 ,1 4 2 5 5 , 3 1 1 6 4 , 6 7 1 O t h e r E x c is e D u t t ie s 3 ,5 2 3 0 3 , 2 5 1 F re ig h t L e vy fro m M a rin e A d m in is t ra t io n 7 ,1 2 1 6 , 0 1 2 1 1 , 1 5 8 I n c o m e T a x D e p a r tm e n t 3 0 3 ,0 2 6 4 7 3 , 1 5 0 4 1 9 , 8 9 1 C o m p a n y T a x 1 3 6 ,5 1 0 7 3 , 4 3 2 1 0 5 , 8 6 1 P e rs o n a l In c o m e Ta x 1 5 5 ,2 3 7 3 9 3 , 4 5 6 3 0 5 , 0 5 3 O t h e r T a x e s 1 1 ,2 7 9 6 , 2 6 2 8 , 9 7 7 G o o d s a n d S e rvic e s T a x 2 4 6 ,3 6 2 3 5 1 , 4 4 9 3 3 5 , 3 4 0 Im p o rt G S T ( Im p o rt S a le s T a x ) 1 3 6 ,7 0 5 1 2 9 , 5 4 9 1 6 7 , 0 4 5 D o m e s t ic G S T 1 0 9 ,6 5 7 2 2 1 , 9 0 0 1 6 8 , 2 9 5 M i sc e l l a n e o u s 7 6 ,3 3 6 2 7 0 , 8 6 4 2 5 9 , 4 3 6 M in e s D e p t . 2 4 ,1 9 1 2 0 2 , 3 4 4 1 8 5 , 5 1 7 R o y a l t y o n R u t i le 2 1 1 6 8 4 3 0 9 R o y a l t y o n B a u x i t e 9 7 6 0 1 , 4 2 3 R o y a l t y o n D ia m o n d a n d G o ld 1 ,8 5 6 1 5 , 4 3 5 8 , 6 5 6 R o y a l t y o n Iro n O re 0 0 0 L ic e n c e s 2 1 ,1 4 8 1 8 6 , 2 2 5 1 7 5 , 1 2 9 O t h e r D e p a rt m e n t s 5 2 ,1 4 5 6 8 , 5 2 0 7 3 , 9 1 9 R o y a l t y o n F is h e r ie s 1 2 ,2 9 8 1 1 , 8 5 1 1 2 , 2 4 9 P a ra s t a t a ls 4 ,8 8 7 0 5 , 3 2 0 O t h e r R e ve n u e s 3 4 ,9 6 0 5 6 , 6 6 9 5 6 , 3 5 0 R o a d U se r C h a rg e s 5 1 ,9 7 2 2 2 , 9 0 1 4 9 , 0 2 4
G R A N T S 5 4 2 ,6 1 4 7 0 8 , 6 5 9 7 5 7 , 4 7 5 P ro g ra m m e 2 6 6 ,3 6 0 2 8 0 , 2 2 3 3 8 6 , 6 7 2 H IP C D e b t R e l ie f A s s is t a n c e 1 9 ,8 5 5 2 1 , 9 4 1 2 3 , 7 8 5 J a p a n e s e F o o d & O i l A id 2 7 ,7 0 9 0 4 7 , 2 9 2 G lo b a l F u n d S a la ry S u p p o rt 0 1 3 , 8 5 1 2 1 , 2 4 7 K u w a i t i F u n d R e fu n d 0 1 , 6 8 5 1 , 6 7 7 U K (D F ID ) 7 8 ,4 0 0 1 0 5 , 2 7 8 1 1 0 , 9 2 1 E U 1 1 0 ,9 5 8 6 1 , 4 1 6 8 7 , 9 2 0 A F D B 2 8 ,5 1 3 4 0 , 4 6 7 3 8 , 6 9 3 W B 0 1 0 , 7 2 7 1 0 , 7 4 8 P e a c e B u i ld in g F u n d 9 2 5 2 4 , 8 5 7 4 4 , 3 8 8 E m e rg e n c y P o w e r P ro g ra m m e 0 2 4 , 8 5 7 4 4 , 3 8 8 O t h e rs (p ro je c t s ) 9 2 5 0 0 D e ve lo p m e n t P ro je c t s 2 7 6 ,2 5 4 4 2 8 , 4 3 6 3 7 0 , 8 0 3
T O T A L E X P E N D I U T R E & N E T L E N D I N G 2 , 0 7 3 , 7 6 3 2 , 7 5 1 , 9 4 9 2 ,5 5 8 , 4 4 9O f w h ic h : C u r r e n t E x p e n d i tu r e 1 , 2 8 6 , 4 7 6 1 , 6 0 2 , 8 2 1 1 ,5 6 3 , 5 5 6 O f w h ic h : W a g e s & S a la r ie s 5 3 5 ,6 6 9 6 8 1 , 3 4 6 6 5 0 , 3 1 7 D o m e s t ic In t e re s t 1 4 1 ,9 3 0 2 2 6 , 1 3 7 2 1 6 , 0 2 6 F o re ig n In t e re s t 1 7 ,2 4 9 2 4 , 0 8 2 2 1 , 1 6 0 G o o d s & S e rvic e s 4 2 6 ,3 5 0 3 9 6 , 2 5 2 3 5 0 , 5 5 2 T ra n s fe rs t o L o c a l C o u n c i ls 7 8 ,4 3 8 7 6 , 0 5 8 8 1 , 7 3 3 F u e l S u b s id ie s 0 9 5 , 4 4 4 9 5 , 4 4 4 S o c ia l O u t la y s 4 4 2 0 0 G ra n t s t o E d u c a t io n In s t i t u t io n 2 9 ,1 3 5 4 8 , 4 1 4 4 8 , 5 2 3 T ra n s fe r t o R o a d fu n d 5 1 ,9 7 2 1 2 , 2 8 2 3 7 , 4 6 5 E le c t io n s & D e m o c ra t is a t io n 5 ,2 9 1 4 2 , 8 0 6 6 2 , 3 3 6 D e v e l o p m e n t E x p . & N e t L e n d i n g 7 8 7 ,2 8 7 1 , 1 4 9 , 1 2 8 9 9 4 , 8 9 3 F o re ig n L o a n s & G ra n t s 4 3 2 ,1 7 8 7 8 6 , 9 8 0 7 5 8 , 6 5 0 L o a n s 1 5 4 ,9 9 9 3 5 8 , 5 4 4 3 8 7 , 8 4 7 G ra n t s 2 7 7 ,1 7 9 4 2 8 , 4 3 6 3 7 0 , 8 0 3 D o m e s t ic 3 5 5 ,1 0 9 3 6 2 , 1 4 8 2 3 6 , 2 4 3 L e n d in g M in u s R e p a y m e n t 0 0 0C U R R E N T B A L A N C E + / - ( I n c l u d i n g g ra n ts) 2 6 3 ,7 6 5 5 6 7 , 9 3 8 6 1 9 , 6 2 4A D D D E V E L O P M E N T E XP E N D ITU R E -7 8 7 ,2 8 7 -1 , 1 4 9 , 1 2 8 -9 9 4 , 8 9 3B a s ic P r im a ry B a la n c e -4 6 9 ,4 8 8 -2 0 9 , 8 4 4 -7 4 , 5 7 2O V E R A L L D E F I C I T / S U R P L U S + / -( I n c l . g r a n ts) -5 2 3 ,5 2 2 -5 8 1 , 1 9 0 -3 7 5 , 2 6 9
G o v e r n m e n t F is c a l O p e r a t io n s( In M i l l io n s o f L e o n e s )

18
BANK OF SIERRA LEONE
The shortfall in revenue from customs and excise vis-a-vis its target was on account of the lower thanbudgeted receipts from petroleum and freight levy under the Marine Administration category, coupledwith the granting of tax concessions and duty waivers. The three categories of exemptions which maybe considered major sources of revenue leakages are (i) institutional exemptions for pre-definedinstitutions and categories of people such as diplomatic missions, members of parliament and religiousinstitutions; (ii) exemptions granted to investors and (iii) discretionary exemptions granted by the Ministryof Finance. Excise on petroleum products shrank by 24.38 percent to Le55.31bn and was 14.47percent below the target of Le64.67bn, partly due to delays by oil companies in the payment of exciseduties and road user charges. Receipts of Le6.01bn on freight levies from Maritime Administration alsofell short of its budgeted target.
Income tax receipts grew by 56.14 percent to Le473.15bn (5.24% of GDP) over the year and alsoexceeded the budget estimate of Le419.89bn by 12.68 percent. The growth in income tax receiptswas mainly explained by the exceptional performance in personal income tax receipts, which amountedto Le393.46bn, thereby outpacing the budgeted amount of Le305.05bn by 28.98 percent and showinga 153.46 percent increase relative to the total of Le155.24bn in 2010. In contrast, collections fromcompany tax dropped by a significant 46.21 percent to Le73.43bn and were also 30.63 percent belowthe budget estimate of Le105.86bn. The contribution of income tax receipts to domestic revenue increasedfrom 30.07 percent in 2010 to 32.36 percent in 2011.
Table 7 contd…
2010 2011 Budget 2011FIN AN C ING 523,522 581,190 375,269
D omestic 446,161 154,859 151,029Of which: B ank F inancing 454,657 66,597 73,649 Bank of S ierra Leone 391,625 9,917 -102,733 Commercial Banks 63,032 56,680 176,382
Non-Bank F inancing -8,496 54,121 43,239 P rivatisation R eceipts 0 34,141 34,141
External 161,725 304,630 334,015Of which: Loans 222,486 358,544 387,847 P roject 154,999 358,544 387,847 P rogramme 67,487 0 0 Amortisation -60,761 -53,914 -53,832 Debt Relief 0 0 0Others* -84,364 121,701 -109,775* Others inc lude resheduling/w rite off,
financ ing gap, pr iva tisa tion net & unaccounted a m ounts
Source: Budget Bureau, MOF
(in Millions of Leones)Government F iscal Operations

19
ANNUAL REPORT AND STATEMENT OF ACCOUNTS
Total collections of Le351.45bn (3.89% of GDP) from Goods and Services Tax (GST) in the periodunder review indicated a rise by 42.66 percent over the 2010 position and exceeded the budget targetof Le335.34bn by 4.8 percent. The contribution of GST to domestic revenue was 24.04 percent,falling slightly by 0.41 percentage point compared to 2010. Of the total receipts from GST, ImportGST (Import sales Tax) accounted for Le129.55bn (36.86%), while Domestic GST contributedLe221.9bn (63.14%). Receipts from domestic GST were however higher than receipts from importsales tax, a reflection of more imports than exports during the year. The strong performance in overallrevenue generation for the year was the result of increased efficiency in the monitoring and implementationof a number of reforms by the NRA under its modernization plan, such as the roll-out of theASYCUDA++ in customs operations and the establishment of a Domestic Tax Department and amicro tax payer regime.
Wages and Salaries32.98%
Foreign Interest1.35%
Domestic Interest14.62%
Goods and Services30.23%
Grants to Educational Institutions
2.30%
Transfer to Road Fund0.38%
Elections2.73%
Transfers to Local Councils4.79%
Chart 6 -Composition of Government Recurrent Expend iture -2011
Customs & Excise31%
Income Tax Department
43%
Miscellaneous25%
Road User Charges
1%
Chart 5 - Composition of Government Revenue - 2011
20
BANK OF SIERRA LEONE
Total tax revenue in 2011 amounted to Le1,168.34bn (12.95% of GDP), exceeding the total ofLe879.32bn in 2010. The improved performance in tax revenue generation was attributed to increasedeconomic activities, improved tax administration and stricter enforcement of tax legislations to enhancecompliance. Notwithstanding the impressive performance, the tax revenue ratio of 12.95 percent ofGDP was significantly below the criterion of at least 20 percent stipulated by the West African MonetaryZone.
Collections from “miscellaneous sources” amounting Le270.86bn (3.00 % of GDP) more than doubledthe amount collected in 2010, and was also 4.40 percent above the budgeted amount of Le259.44bn.The improved performance in miscellaneous revenue relative to the budget estimate was in part drivenby the receipt of signature bonuses from petroleum exploration activities and payroll taxes by miningcompanies. Of the total amount, collections from Mining royalties and Licenses amounted to Le202.34bn(2.24 % of GDP), which was 9.07 percent in excess of the projected amount of Le185.52bn. Collectionsby other Government departments totalled Le68.52bn was below the budgeted amount of Le73.92bnby 7.30 percent. On the other hand, road user charges and vehicle licenses dropped by 55.94 percentover the year to Le22.90bn in 2011 and were also 53.29 percent short of the budget estimate ofLe49.02bn.
External grants of Le708.66bn (8.85 % of GDP) disbursed during the year represented an increase of30.60 percent compared to corresponding receipts in 2010 but was however 6.44 percent short of theanticipated total disbursement of Le757.48bn for the year. This was largely due to non receipt ofprogrammed inflows for the year. External grants received during the year comprised budgetary supportof Le280.22bn and project grants of Le428.44bn for developmental activities. The amount for budgetarysupport reflected a 5.20 percent increase over the year but was 27.53 percent short of the budgettarget of Le386.67bn; while developmental project grants rose by 55.09 percent over the year andalso exceeded the budget target of Le370.8bn by 15.54 percent. Grants for budgetary support were inrespect of HIPC Debt Relief Assistance (Le21.94bn), support from Global Fund (Le13.85 bn), UKDFID (Le105.28bn), the European Union (Le61.42bn), the African Development Bank (Le40.47bn),the World Bank (Le10.73bn) and Peace Building Fund (Le24.86bn). The overall performance ofexternal grants for the year was boosted mainly by increased grants for development projects.
Total expenditure and net lending targeted at Le2,558.45bn for 2011 amounted to Le2,751.95bn(30.50% of GDP), thereby breaching the ceiling by 7.56 percent and exceeding the 2010 outlays by32.70 percent. Recurrent expenditure of Le1,602.82bn (17.76 % of GDP) reflected a 24.59 percentgrowth while exceeding the Le1,563.56 ceiling by 2.51 percent. Development expenditure and netlending grew by 45.96 percent to Le1,149.13bn and also exceeded the ceiling of Le994.89bn by15.50 percent. The higher than budgeted recurrent expenditure was attributed to overruns on the wagebill, amortisation on domestic debts, fuel subsidies and expenses on goods and services. Of the totalincrease on recurrent spending for the period, the wage bill reflected an increase by 27.20 percent toLe681.35bn, 4.77 percent above the targeted ceiling of Le650.32bn. The higher wage bill was partlya reflection of the commencement of the new multi-year pay reform for teachers as well as other publicservants, including the military, police, health sector workers and civil servants.
Total interest payments on public debts increased by 57.19 percent to Le250.22bn, of which domesticinterest payments recorded at Le226.14bn, represented an increase by 59.33 percent relative to thepreceding year and also 4.68 percent above the budget ceiling of Le216.03bn. The increase in domesticinterest was in part explained by increases in interest rates on short and medium term treasury bills, and

21
ANNUAL REPORT AND STATEMENT OF ACCOUNTS
partly by the payment of interest on the accumulated Ways and Means Advances at the end of the year.Foreign interest payments of Le24.08bn was up on the 2010 position by 39.61 percent and slightlyexceeded the ceiling by 13.81 percent, due to the depreciation of the local currency against majorforeign currencies.
Non-salary, non-interest recurrent expenditures totalled to Le671.26bn in 2011, thereby exceeding thepreceding year’s total of Le591.63bn by 13.46 percent and was however below the budget estimateof Le676.05bn by 0.71 percent. Of the non-salary & wages category, non-interest bearing recurrentexpenditure of Le76.06bn was in respect of transfers to Local Councils, while Le396.25bn was forexpenses on goods and services. Government’s contribution to the Election and Democratisation processamounted to Le42.81bn, while fuel subsidies paid to oil marketers intended to alleviate the effects ofthe full pass through of higher international oil prices on the domestic pump prices amounted to Le95.44bn and grants to educational institutions was recorded at Le48.41bn.
Capital expenditure rose by 47.15 percent from Le787.29bn in 2010 to Le1,149.13bn (12.73% ofGDP) in 2011 and breached the budget ceiling of Le994.89bn by 15.50 percent. As a share ofaggregate expenditure and net lending for the year, capital expenditure accounted for 41.76 percentcompared to 37.96 percent in 2010. The increase in capital expenditure was entirely on account of the82.10 percent increase to Le786.98bn in expenditure funded by foreign loans and grants. Expenditurefunded by foreign loans totalled Le358.54bn, while that funded by foreign grants totalled Le428.44bn.Domestic Development Expenditure experienced a significant over-spending of Le125.91bn or 53.3percent over the budgeted estimate of Le236.24bn, on account of greater than anticipated spending onroad projects, rehabilitation of the Lungi Airport and strengthening of the district health care services.Expenditure on projects funded by foreign loans was 7.56 percent below the budget of Le387.85bnand those funded by foreign grants were 15.54 percent above the budget of Le370.80bn. Out of theLe786.98bn disbursed, Le170.14bn was disbursed on unbudgeted projects and the remaining amountwas disbursed on projects that were included in the budget. Out of the Le170.14bn disbursed onunbudgeted projects, 80 percent were grants and 20 percent loans. Major donors in respect of foreigndevelopment loans and grants that were unbudgeted were International Fund for Agricultural Development(Le41.30bn), the World Bank (Le35.54bn), UK/DFID (Le33.00bn), Kuwait Fund for ArabDevelopment (Le12.90bn), European Commission (Le12.03bn), African Development Bank(Le10.38bn), Arab Bank for Economic Development in Africa (Le8.87bn), Islamic Development Bank(Le7.03bn), OPEC Fund for International Development (Le4.03bn), Saudi Fund (Le3.36bn) andECOWAS Bank for International Development (Le1.71bn).
The overall fiscal balance resulted in a deficit of Le581.19bn (6.44% of GDP), compared to a deficit ofLe523.52bn (6.1% of GDP) in 2010, and a budget deficit of Le375.27bn. Financing of the budgetdeficit was from both external and domestic sources, with external source being the dominant. Financingfrom net external sources amounted to Le304.63bn (3.38% of GDP), 8.8 percent lower than thebudget estimate of Le334.02bn but 88.36 percent higher than the preceding year’s external financing.Domestic financing of the deficit was Le154.86bn (1.72% of GDP), 2.54 percent higher than thebudget estimate of Le151.03bn but 65.29 percent below that of 2010. Domestic financing includedbank financing of Le66.6bn, of which Bank of Sierra Leone’s contribution was Le9.92bn and commercialbanks’ was Le56.68bn. The non-bank sector contributed Le54.12bn, and financing through privatisationreceipts (i.e. proceeds from the privatisation of the Ports Authority Container Terminal) totalled Le34.14bn.

22
BANK OF SIERRA LEONE
4.0 Monetary Developments
The focus of monetary policy in 2011 was to achieve price stability consistent with general macroeconomicgrowth while maintaining monetary and financial stability. In line with these objectives, the Bank ofSierra Leone continued to conduct monetary policy management within the framework of monetarytargeting, with Reserve Money (RM) being the Bank’s operating target and Broad Money its intermediatetarget.
To enhance monetary policy management, BSL introduced the Monetary Policy Rate (MPR) in February2011, to signal the BSL monetary policy stance and anchor other money market rates around theMPR. The MPR guides open market operations, with active repurchase operations complemented byweekly foreign exchange auction. These complementary instruments enable the Bank to smooth outvolatility of liquidity in the inter-bank market. Informed by the liquidity conditions in the interbankmarket and other macroeconomic and financial indicators, the MPR was periodically reviewed tosignal the Bank’s monetary policy stance to the market.
Monetary policy management was however challenged by fiscal outcomes arising from growth inexpenditure on development projects namely, energy supply, health and road construction projects,financed by domestic and foreign borrowing as well as donor support. As a result of this fiscal injectionand BSL purchases of foreign exchange from the banks, liquidity surged in the financial system duringthe period under review. In addition, demand for money to meet current transaction needs of the publicduring the festive season in the latter part of the year, led to an increase in Currency in Circulation. BSLon its part was unable to adequately sterilize the excess liquidity and bring monetary aggregates withintarget, which culminated in the growth of key monetary aggregates above their indicative programbenchmarks.
0
500000
1000000
1500000
2000000
2500000
3000000
2010Q42011Q1
Q2Q3
Q4
(LeMn)
Period
Chart 7. Composition of Money Supply (M2)
Time, Savings and Foreign Currency Deposits (BSL)Savings DepositsTime DepositsForeign Currency DepositsDemand Deposits

23
ANNUAL REPORT AND STATEMENT OF ACCOUNTS
Tab le 8
Dec-10 Mar-1 1 Jun-11 S ep-11 Dec-1 11 2 3 4 5 6
Res erve Money 760,898 725,045 741,909 787,326 859,604 B road Money 2,236,534 2,348,558 2,528,578 2,551,955 2,719,741 B road Money* 1,577,937 1,589,730 1,718,196 1,775,242 1,868,262 Narrow Money 1,048,055 1,053,296 1,128,497 1,164,644 1,209,324 C u rrency in C ircu la t io n 557,262 549,675 572,424 575,492 641,832 Deman d Deposits 490,794 503,622 556,073 589,152 567,492 Quas i Money 1,188,478 1,295,261 1,400,081 1,387,311 1,510,417 Fo re ign C u rrency Dep osits 658,597 758,827 810,382 776,714 851,479 Time Dep osits 112,242 103,876 123,780 122,611 138,734 Saving s Dep osits 412,525 427,978 457,236 484,084 515,694 Other Depo sits 3,062 2,527 6,631 1,855 2,468 Time Sa vin gs a nd Fo reig n C urren cy d eposits(BSL) 2,052 2,052 2,051 2,048 2,041 Net Fore ig n As s ets 1,644,505 1,808,982 1,826,933 1,891,616 2,053,006 B ank of S ierra Leone 959,024 1,027,181 985,518 1,056,487 1,117,856 Assets 1,458,987 1,549,107 1,486,341 1,566,486 1,661,061 Lia b il i t ies 499,963 521,926 500,824 509,999 543,205 Commercial B ank s 685,481 781,801 841,416 835,128 935,150 Assets 703,456 797,414 857,237 850,950 949,227 Lia b il i t ies 17,975 15,613 15,822 15,822 14,077 Domes tic Credit 1,739,468 1,790,825 1,863,188 1,940,430 1,932,431 Claims on Central Govt. Net 872,802 850,107 935,392 952,845 879,751 o f wh ich : B S L 574,069 568,807 574,925 595,821 585,498 To ta l C la im s 704,307 588,306 606,387 619,962 601,222 Govern men t Secu rit ies Issued o bo BSL - - - - - Treasu ry B il ls 149,389 125,318 82,895 71,269 132,435 Treasu ry Bond s 20,592 26,071 24,960 13,727 11,009 Ways an d M ean s Advan ces 177,694 - - 37,199 26,886 2 01 0 Wa ys a nd M ea ns Ad van ces S to ck A/C - 77,516 77,516 77,516 - S DR Brid ge Lo an - S DR B ridge Loan64,292 64,292 - BS L losses fo r co nversion 10,390 13,120 9,740 8,305 6,998 S to ck o f N N N IB 81,801 81,801 81,801 81,801 81,801 BS L Ho ld ing s o f 3 -Yea r M ed iu m Term Bo nd 77,516 5 YR Bo nd s fo r Recap ita l iza tion 264,430 264,430 264,430 264,430 264,430 Govern men t Dep artmen ts 12 51 753 1,423 147 Dep o sits 130,238 19,499 31,461 24,141 15,723 Treasu ry Inco me an d Exp en d itu re(net) 2 2,373 7,193 2 2 Depa rtmen ta l Acco un ts 16,717 16,607 23,749 23,619 15,201 HIPC (M DRI) 113,512 512 512 512 512 B lock ed Acco un t 8 8 8 8 8 K enema Bra nch Deposits - - - - - Commercial B ank s 298,734 281,300 360,467 357,024 294,253 To ta l C la im s 476,127 482,844 545,029 547,073 533,460 Trea su ry B i l ls 458,226 459,097 511,214 508,487 491,773 Trea su ry Bea rer Bon ds - 557 14,948 14,948 15,448 Lo an s an d Ad va nces 17,901 23,190 18,868 23,638 26,238 Dep o sits 177,393 201,544 184,563 190,049 239,207 Dema nd Depo sits 109,140 130,043 100,909 126,140 182,039 Sa vin gs Accou n ts 20,645 13,231 14,635 13,580 15,073 Time Depo sits 47,608 58,270 69,019 50,329 42,095 Claims on Non Financial Publ ic S ector 54,025 41,956 42,475 48,479 53,507 Claims on Pr ivate S ector 790,395 873,384 860,843 903,911 963,142 o f w hich Commercial B ank s 783,523 860,585 849,200 894,091 955,897 Claims on Non-B ank ing Ins t. 22,246 25,377 24,478 35,196 36,031 Other Items (Net) 1,147,439 1,251,249 1,161,543 1,280,091 1,265,697 * Exclu d es F o reig n Cu rren cy D epo sits a t th e Co m m ercia l B a nks
So urce: Ban k o f Sierra L eo n e an d D ep o sit M o ney Ban ks
M on e ta ry S u rvey (M illio n Leo nes )

24
BANK OF SIERRA LEONE
Despite the expansionary movement in key monetary aggregates above their 2011 targets, their growthrates were lower compared to those recorded in 2010. This was due to the introduction of the MPRand tighter monetary policy stance of the Central Bank, coupled with continuous macroeconomic policymanagement coordination.
During 2011, Broad Money (M2) recorded a growth rate of 21.61 percent and was in breach of the2011 target of 13.75 percent. However, the growth in M2 was lower compared to the correspondinggrowth rate of 32.73 percent for 2010.
The expansion in M2 was due to the increase in both Net Foreign Assets (NFA) and Net DomesticAssets (NDA). NFA grew by 24.84 percent compared to the projected drop of 7.92 percent. Theincrease in NFA stemmed from a range of inflows including budgetary support inflows, expatriate taxpayments by mining companies and increases in commercial banks’ claims on overseas banks. NDArose by 17.66 percent as against a growth target of 23.97 percent for end December 2011. Thegrowth in NDA was a result of an increase in credit to the private sector by commercial banks to pre-finance developmental projects.
RM registered an annual growth rate of 12.97 percent, significantly above the 2011 projection of 3.94percent but lower when compared to the corresponding growth rate of 34.61 percent in 2010. Theexpansion in RM was reflected in all its components, with Currency Issued, Bankers’ Deposits andPrivate Sector Deposits increasing by 12.03 percent, 20.76 percent and 10.08 percent respectively, atend-December 2011.
T ab le 9
De c-10 M a r-11 Ju n -11 S e p -11 De c-112 3 4 5 6
Treasury Bills (3-months) 24.54 26.39 23.38 23.25 23.42
Treasury Bills (6-months) 28.35 32.48 30.4 29.27 29.55
Treasury Bills (1-Year) 28.98 29.91 25.53 25.84 28.63
Treasury Bonds (1-year) 22.50 20.00 18.67 18.00 20.00
Savings^ 6.19 6.35 6.62 6.42 6.42
1 M onth 8.40 9.23 9.28 9.16 9.16
3 M onths^ 8.90 9.55 10.07 9.75 9.75
6 M onths^ 9.33 10.12 10.6 10.39 10.39
9 M onths^ 9.25 9.58 10.5 10.25 10.25
12 M onths^ 10.55 11.54 12.06 11.91 11.91
Lending ( P rime ) 21-28 21-28 21 -28 21-29 21-29
N ational Inflation Rate* 17.84 14.92 16.79 15.7 16.64
* Th e b a se yea r w a s rev ised fro m 2 0 0 3 to 2 0 0 7 .
Av e ra g e In te re s t ra te s (P e rc e n t)
1

25
ANNUAL REPORT AND STATEMENT OF ACCOUNTS
Net Claims on Government by the banking system grew over the period, albeit by a marginal 0.80percent compared to the corresponding growth rate of 96.26 percent reported for the same period in2010. The slowdown in the growth rate was due to tighter monetary policy stance and the enforcementof government borrowing limit from the Central Bank (BSL), coupled with prudent policy measuresadopted by the fiscal authorities.
The marginal increase in net claims on government by the banking system was driven by the increase of1.99 percent in net claims on government by BSL, (compared to a growth rate of 106.40% as at endDecember 2010) which was however moderated by the 1.50 percent decrease in net claims ongovernment by the commercial banks. The increase in net claims on government by BSL was mainly onaccount of the drawdown in government deposits in the amount of Le114.52 bn during 2011, whichwas more than the decrease of Le103.09bn in treasury security holdings by BSL.
Net Claims on Government by commercial banks declined on account of a significant build-up ofgovernment deposits amounting to Le61.81bn, which outweighed the increase in the total holdings ofGovernment securities and loans and advances (Le57.33bn) to public entities.
Credit to the private sector by commercial banks grew by Le172.37bn (22.0%) from Le783.52bnrecorded as at end- December 2010 to Le955.90bn as at end-December 2011, lower than the 31.89percent recorded in 2010. This development was in part, due to the establishment and operationalisationof a credit reference bureau during the period and the aggressive loan recovery measures adopted bybanks to reduce the Non-Performing Loan (NPL) and ensure financial stability. The main beneficiarieswere the Construction sub-sector, accounting for 31.47 percent of the change in total credit, followedby Commerce and Finance (30.00%) and Agriculture, Forestry and Fisheries (8.86 %).
The interest rate on treasury securities exhibited mixed trends. The average annual yield on the 3months and 12 months Treasury Bills declined by 112 and 35 basis points from 24.54 percent and28.98 percent in 2010 to 23.42 percent and 28.63 percent in 2011, respectively. The interest rate onthe 12 months Treasury Bonds decreased by 250 basis points to 20.00 percent in December 2011,from 22.50 percent in December 2010. However, the annual yield on the 6 months Treasury Billsincreased by 120 basis points from 28.35 percent in December 2010 to 29.55 percent in December2011. The period also witnessed an increase in the commercial banks’ average interest rates. Thus theinterest rate on Savings Deposits and the 1 month, 3 months, 6 months, 9 months and 12 months TimeDeposits increased by 23, 76, 85, 106, 100 and 136 basis points to 6.42 percent, 9.16 percent, 9.75percent, 10.39 percent, 10.25 percent and 11.91 percent, respectively over the year. The overdraftlending rate at the Deposit Money Banks slightly increased from a range of 21-28 percent in December2010 to a range of 21-29 percent in December 2011.
5.0 External DevelopmentsInternational TradeThe global trading environment in 2011 was impacted by the sovereign debt crisis in the euro zone andfiscal developments in the US economy. According to the World Trade Organization (WTO), worldtrade slowed down in 2011 due to widespread fall in demand, a shortage of trade financing and anincrease in protectionist measures. In-spite of these conditions, the Sierra Leonean economy remainedvirtually unaffected in 2011 as the country does not have strong linkages to the global financial markets.

26
BANK OF SIERRA LEONE
Table 10
Jan - Dec'10 Jan-Jun'11 Jul-Dec'11 Jan - Dec'111 2 3 4 5
Merchandise Imports 771,168.6 730,673.4 985,884.2 1,716,557.6
Food of which 104,895.6 103,673.5 142,210.0 245,883.5 Rice 71,662.5 39,689.9 45,036.6 84,726.5 Beverages and Tobacco 19,487.8 12,798.2 20,343.2 33,141.5 Crude Materials 13,267.7 8,118.8 10,350.8 18,469.6 Mineral Fuels and Lubricants of Which 172,539.4 145,636.3 130,121.9 275,758.2 Fuel 145,889.7 133,362.2 110,341.4 243,703.7 Animal and Vegetable Oils 9,435.2 4,311.9 5,318.1 9,629.9 Chemicals 43,838.3 13,352.8 53,686.6 67,039.4 Manufactured Goods 110,536.9 87,936.8 87,779.8 175,716.6 Machinery and Transport Equipment 248,699.6 281,590.2 474,672.2 756,262.4 Other Imports 48,468.1 73,254.9 61,401.6 134,656.5 Merchandise Exports 341,226.4 174,282.4 175,426.9 349,709.4
Mineral Exports 200,649.6 109,647.4 131,086.3 240,733.7 Diamonds 113,514.7 67,470.1 62,296.1 129,766.2 Buaxite 31,061.0 18,348.2 20,649.8 38,998.0 Rutile 40,567.2 14,936.4 19,500.1 34,436.6 Gold 9,295.8 3,475.1 3,804.9 7,280.0 Ilmenite 2,653.1 1,541.1 2,900.6 4,441.7 Iron Ore - - 15,357.1 15,357.1 Zircom 3,557.7 3,876.4 6,577.8 10,454.2 Agricultural Exports 38,900.0 32,344.6 14,434.8 46,779.4 Coffee 1,698.2 1,564.5 436.3 2,000.8 Cocoa 37,051.2 30,515.3 13,506.6 44,022.0 Piassava - 10.1 - 10.1 Fish and Shrimps 150.6 254.7 491.9 746.6 Others 78,231.1 20,085.1 8,912.2 28,997.3 Re-exports 23,445.7 12,205.3 20,993.6 33,199.0 Trade Balance (429,942.2) (556,391) (810,457) (1,366,848.2) Foreign Reserves ($mn) 345.22 344.59 376.79 376.79 Sources: Customs and Excise Department, and Gold & Diamond Department
International Trade and Reserves (US$'000)

27
ANNUAL REPORT AND STATEMENT OF ACCOUNTS
Diamonds63%Coffee
0.98%
Cocoa22%
Others14%
Chart 8. Composition of Exports 2011
Food17% Beverages and
Tobacco2%
Crude Materials1%
Mineral Fuels and Lubricants
19%
Animal and Vegetable oils1%
Machinery and Transport Equipment
51%
Other Imports9%
Chart 9. Composition of Imports 2011
-600000
-400000
-200000
0
200000
400000
600000
800000
Q 1 Q 2 Q 3 Q 4
T h o u san d Do lla rs
Perio d s
Chart 10 . Ex te rna l T rade - 2011
To tal E x p o rts To tal Im p o rts T rad e B alanc e

28
BANK OF SIERRA LEONE
Thus, merchandise trade increased by US$953.87mn (86%) to US$2,066.27mn in the review period.The trade deficit however more than doubled to US$1,336.85mn in 2011 from US$429.94mn in 2010owing to the relatively larger expansion in import payments compared to the increase in export receipts.
Total merchandise exports in 2011 amounted to US$349.71mn, indicating a marginal increase whencompared to the US$341.23mn recorded in 2010. Sierra Leone’s exports remain dominated by themineral sector, which accounted for 68.84 percent of total export earnings. Initiatives by the Governmentto diversify exports are yet to come to fruition as the contributions of these sectors, especially theagricultural sector, to overall exports remained very low. In 2011, the dominance of the mineral sectorwas further reinforced by the shipment of a total volume of 137,883 metric tons of iron ore worthUS$15.36mn. Earnings from mineral exports amounted to US$240.73mn, 19.98 percent higher thanthe US$200.65mn recorded in 2010. Diamonds continued to dominate mineral exports, accounting for53.90 percent of receipts from mineral exports and 37.11 percent of total export earnings. Earningsfrom diamond exports which recorded US$129.77mn for the review period reflected a 14.32 percentincrease compared to US$113.51mn in the preceding year. The composition of diamond exports duringthe review period comprised 215.97 thousand carats of gem stones valued at US$117.38mn and134.24 thousand carats of industrial diamonds worth US$12.39mn. The observed buoyancy in thediamond sub-sector could be attributed to price effects as volumes declined during the reporting period.During the year, an aggregate of 1,421.77 thousand metric tons of bauxite worth US$39.00mn and amaiden consignment of 13,025.47 metric tons of Zircom worth US$10.45mn were exported. Exportreceipts from ilmenite amounted to US$4.44mn in 2011, reflecting an increase of 67.41 percent comparedto US$2.65mn recorded in the preceding period. This was due principally to price effects as thevolume exported declined from 21.19 thousand metric tons in 2010 to 19.09 thousand metric tons in2011. Export earnings from gold and rutile showed a similar pattern, registering a decline of 43.52percent and 36.38 percent in their volumes, respectively.
The outlook to the agricultural sub-sector remains promising, as earnings from this sub-sector duringthe period expanded by 20.26 percent, contributing 13.38 percent to total export earnings in 2011, compared
190.00
210.00
230.00
250.00
270.00
290.00
310.00
330.00
350.00
Jan Feb Mar Apr May Jun Jul Aug Sept OctNov Dec
US $ Million
Period
Chart 11Gross International Reserves
2010
2011

29
ANNUAL REPORT AND STATEMENT OF ACCOUNTS
to 11.40 percent in 2010. The increase was reflected in all the sub categories of agricultural exports.Exports of coffee increased to 3.79 thousand metric tons valued at US$2.00mn, from 2.70 thousandmetric tons valued at US$1.70mn in 2010, while cocoa exports increased to 18.00 thousand metrictons valued at US$44.02mn, from 16.07 thousand metric tons valued at US$37.05mn in the precedingyear. The export value of ‘fish and shrimps’ also increased significantly to US$0.75mn during thereview period, from US$0.15mn in 2010. Export of piassava was resumed during the year following along period of stagnation, at a value of US$10 thousand. Earnings from “other exports” (a compositecategory comprising ginger root, sawn timber, assorted plastic wares, audio cassettes and compactdiscs), declined by 62.93 percent to US$29.00mn, from US$78.23mn in 2010, while the total value ofre-exports increased by a significant 41.60 percent to record US$33.20mn. The significant drop in thetotal value of ‘other exports’ over the year was explained by the huge reduction in the volume andhence value of assorted plastic water tanks exported in the reporting period.
The total import bill for the year 2011 aggregated at US$1,716.56mn, more than doubled (123%)relative to US$771.17mn recorded in 2010. The increase in import payments was reflected in allimport categories, with notable growth in ‘‘Machinery and Transport equipment’’ to support the growingmining sector. Import payments for “Machinery and Transport Equipment” which accounted for 44.06percent of the total import bill, increased from US$248.70mn in 2010 to US$756.26mn in 2011. Thebill for import of consumer goods, which accounted for 16.82 per cent of total imports increased toUS$288.65mn as compared with the corresponding value of US$133.82mn for 2010. The increasewas reflected in all consumer goods sub categories, with the import bills for “food” recording thehighest growth (134.41%). The import bills for the ‘‘beverages and tobacco’’ and ‘‘animal and vegetableoils’’ categories increased by 70.06 percent and 2.06 percent respectively, over the period. There wasalso an increase of 18.23 percent in payments for imported rice. The increase could be attributed torice importers taking advantage of government’s incentive of zero rate duty on rice imports, aimed atmitigating the pass-through effect of international rice price. This was reflected in the increase in thevolume of rice imports during the review to 155,407.41 metric tons in 2011, from 136,103.06 metrictons in 2010. The increase in the import value of petroleum products was on account of the 67.05percent expansion in the import bill for fuel from US$145.89mn in 2010 to US$243.70mn in thereporting period, accounting for about 88.38 percent of the total import bill for petroleum products.The higher import bill for fuel was partly due to a hike in the price of petroleum products associatedwith the socio-political unrest in some Northern African states (Arab spring) during the year as well asthe increased demand for fuel by emerging economies. During the year, the price of crude oil reachedUS$116.24 per barrel. Notable increases were also recorded in the total volume of fuel imports from186,958.91 metric tons in 2010 to 242,102.97 in the review year, driven by increased domestic economicactivities in the mining and construction sectors. Import payments for intermediary goods increased toUS$85.51mn, about 49.74 percent higher than the level recorded in 2010. This development wasprompted by the increases of 52.92 percent and 39.21 percent in the import bills for both “chemicals”and “crude materials”, respectively. Payments for the import of “manufactured goods”, increasedsignificantly to US$310.37mn during the year from US$159.00mn in 2010.
5.1 Sectoral Utilization of Foreign ExchangeTotal sales in the weekly foreign exchange auction market recorded US$41.17mn in 2011, compared to totalsales of US$47.75mn in the preceding year. The decline was reflected in allocations for all categories,except rice imports which increased by US$6.43mn (35.59%) to US$24.51mn, representing 59.53 percentof the total foreign exchange utilization over the period. Allocation to oil companies decreased by US$9.19mn

30
BANK OF SIERRA LEONE
31-Dec-11 31-Dec-10 31-Dec-092 3 4
Total Assets 2,982,385,253 2,441,665,854 1,962,400,033Average Total Assets 2,737,858,722 2,070,289,748 1,739,364,375Loans and Advances(Gross) 1,072,303,947 874,704,758 658,966,802Bad Debt Provision (79,848,373) (44,175,809) (27,659,920) Interest in suspense (53,308,475) (48,150,625) (36,022,691) Loans and advances(Net) 939,147,099 782,378,324 595,284,191Investment-TB, TBB, OFI* 549,301,193 466,883,912 348,997,473Fixed Assets 198,724,857 184,477,137 185,020,316
Local Deposits:- 1,315,870,573 1,075,536,005 909,706,7 76 Demand 635,805,010 510,509,862 410,921,409 Savings 499,532,679 419,636,190 329,335,123 Time 180,532,884 145,389,953 169,450,244
Other Deposits 13,849,179Foreign Deposits 956,022,036 739,227,833 495,002,644Deposits with Financial Institutions 17,486,578 10,93 8,982 29,191,147
Capital:- Paid-up 320,935,735 297,505,596 267,807,117 Statutory & Other Reserves 77,069,742 46,361,276 40,200,650 Retained Earnings 72,785,153 (42,971,502) (13,705, 452) Current profit 65,523,506 43,039,636 7,559,663 Primary Capital 312,569,178 305,534,048 294,302,315 Revaluation Reserves 49,698,741 45,441,612 42,950,613 Capital Base 417,702,289 420,944,803 368,284,969 Total Risk Weighted Assets 1,549,583,541 2,665,925,308 1,084,200,091 Capital Adequacy Ratio 26.96 15.79 33.97 Surplus/(Shortfall)% 11.96 0.79 18.97 Surplus/(Shortfall):Le 185,264,758 215,552,381 199,689,173 Average Shareholders' Fund 420,390,979 355,821,750 277,658,614* TB - Treasury Bills TBB - Treasury Bearer Bonds OFI - Other Financial Institution
Table 11
1
Commercial Banks Operating in Sierra LeonePrudential Indicators (Unaudited)
(In Thousand Leones)

31
ANNUAL REPORT AND STATEMENT OF ACCOUNTS
31-Dec-11 31-Dec-10 31-Dec-092 3 4
Asset Quality Performing Loans 910,637,648 738,187,379 550,003,352 Non-Performing Loans 161,666,299 136,517,379 108,963,450 Loan Loss Provisions (79,848,373) 44,175,809 27,659,920 Non- Performing as a % of Total Advances 15.08 15.61 16.54 Loan Loss Provisions as a % of Non-Performing 49.39 32.36 25.38Profitability : Pre-Tax Profits 103,385,715 70,304,87 6 26,978,746 Post Tax Profits 65,523,506 43,039,637 10,610,815 Return on Assets 3.78 3.40 1.55 Return on Equity Funds 15.59 12.10 3.82Liquidity:Liquid Assets 718,568,925 631,098,910 485,47 4,029 Cash 65,688,929 74,249,651 65,516,954 Current Account with BSL 116,710,249 94,596,770 59,261,134 Treasury Bills 491,773,314 460,471,058 346,153,105 Placement with Discount Houses 835,583 1,781,431 14,542,836 Treasury Bearer Bonds 43,560,850 0 0Cash Ratio 13.86 15.70 13.72Overall Liquidity Ratio 54.61 58.68 53.37Surplus/(Shortfall) (%) 24.94 29.18 24.33Surplus/(Shortfall) (Le) 328,233,808 313,889,737 221,348,392
Foreign Assets: 1,038,678,458 711,461,554 555,726,776 Foreign Currency(cash) 121,477,546 43,918,520 75,948,511 Balance with Other Banks abroad 894,544,125 659,468,332 470,950,665 Foreign Other Assets 22,656,787 8,074,702 8,827,600
Foreign Liabilities: 1,012,752,977 776,339,085 516,752 ,291 Foreign Deposits 956,022,036 739,227,833 495,002,644
Foreign Other liabilities 3,903,867 37,111,252 16,838,452 Foreign Cash Marginal 52,827,074 3,613,588 4,911,195NET FOREIGN POSITION: Assets- Liabilities (6,442,043) (64,877,531) 38,974,485
Table 11 Contd
1
Commercial Banks Operating in Sierra LeonePrudential Indicators (Unaudited)
(In Thousand Leones)
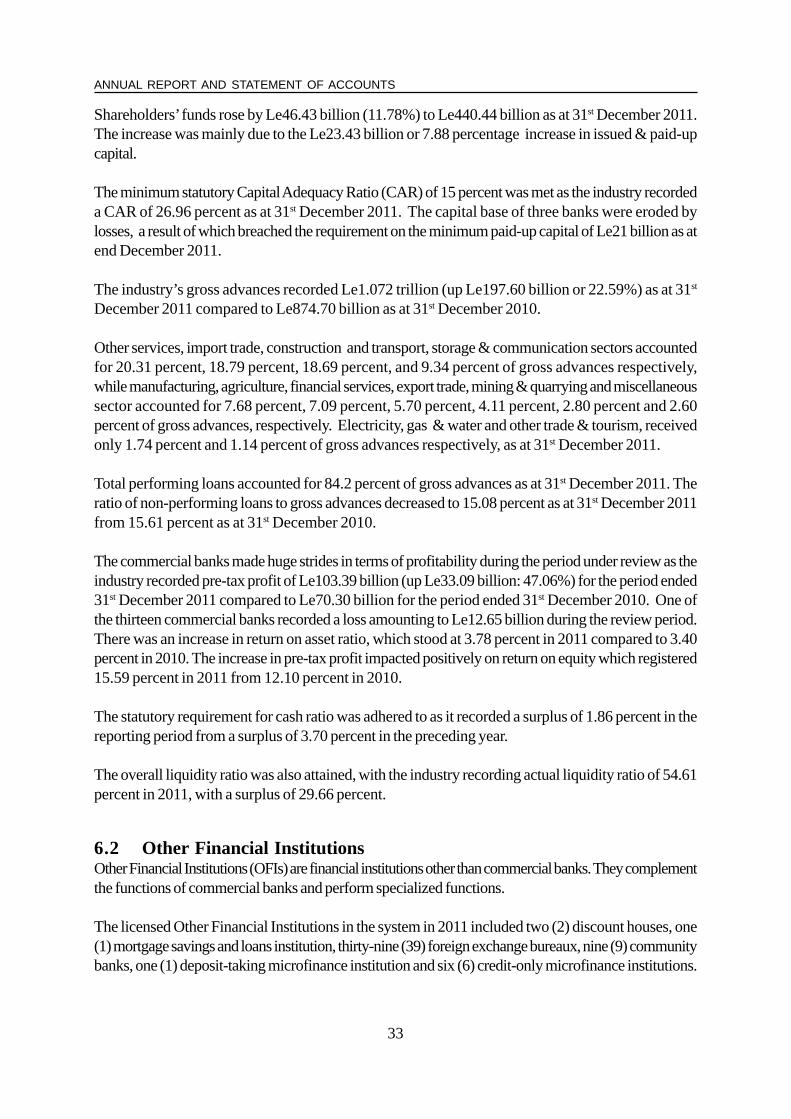
32
BANK OF SIERRA LEONE
to US$10.18mn in the current year, from US$19.37mn utilized in the preceding period. Allocations tothe Manufacturing Industries and General Imports categories totalled US$3.84mn and US$2.65mn in theperiod, accounting for 9.32 percent and 6.42 percent of the total foreign exchange utilization, respectively.
6.0 Supervision of Commercial Banks and Other Financial Institutions6.1 Commercial BanksThe asset base of the banking industry increased by Le540.72bn (22.15%) to Le2.98 trillion as at 31st
December 2011. The growth was driven mainly by the Le216.79bn (29.33%) increase in foreigndeposits to Le956.02 billion and the Le240.33bn (22.35%) growth in local deposits to Le1.32 trillionas at 31st December 2011. Demand Deposits increased by Le125.03bn (24.54%) to Le635.81bn,Saving Deposits by Le79.09bn (19.04%) to Le499.53bn and Time Deposits by Le35.14bn (24.17%)to Le180.53bn at the end of the review period.
Table 12
Rokel Commercial Bank 11 11 12 6 - 1 1 1 - 1 1 - 1 - - - - - 12
Sierra Leone Commercial Bank 11 12 13 5 1 1 1 - 1 1 1 - 1 - - - 1 - 13
Standard Chartered Bank Ltd 3 3 3 2 - 1 - - - - - - - - - - - - 3
Union Trust Bank Ltd 7 8 9 3 - 1 - - 1 1 1 - - 1 - - - 1 9
Guaranty Trust Bank Ltd 7 7 10 5 - 1 - - - 1 1 - 1 - - 1 - - 10
First International Bank Ltd 14 18 16 7 1 1 - - - 1 1 1 1 1 1 - 1 16
International Commercial Bank 2 2 2 2 - - - - - - - - - - - - - - 2
EcoBank 7 7 7 4 1 - - - - 1 - - 1 - - - - - 7
Access Bank 3 4 4 3 - - - - - - - - 1 - - - - - 4
United Bank for Africa 3 3 3 3 - - - - - - - - - - - - - - 3
Skye Bank 1 1 1 1 - - - - - - - - - - - - - - 1
Zenith Bank 1 3 5 3 - - - - - 1 - - - - 1 - - - 5
Bank PHB 1 1 2 2 - - - - - - - - - - - - - - 2
Grand Total 71 80 87 46 3 6 2 1 2 7 5 1 6 2 2 1 2 1 87
No. of
Branches
2010 Wate
rloo
Pujeh
unNjal
a
Magbu
rak
aPe
pel
Commercial Banks operating in Sierra Leone (31 st December 2011)
Kono
Kailah
un
Kambia
Total
F/tow
nBo
No. of
Branches
2011Mak
eni
Port
Loko
Lung
i
Moyam
ba
Kenem
aBANK
No. of
Branches
2009
Table 13
BanksCurrent Account (Local)
Current Account (Foreign)
Savings Account (Local)
Savings Account (Foreign)
Time Account (Local)
Time Account (Foreign)
Total
SCB 1,476 1,368 7,400 - 176 - 10,420RCB 16,608 3,673 90,464 - 173 - 110,918SLCB 28,966 2,519 94,076 - 109 - 125,670UTB 6,939 861 45,761 - 48 4 53,613GTB 13,372 2,462 40,669 98 103 - 56,704FIB 13,725 1,315 34,989 1,404 395 - 51,828ICB 840 200 5,078 4 51 - 6,173ECO 18,849 48 35,727 62 845 - 55,531AB 2,084 776 5,482 - 63 - 8,405UBA 4,288 940 11,727 - 219 - 17,174SKYE 1,034 - 1,985 196 7 - 3,222ZENITH 2,407 1,077 3,755 - 65 - 7,304BANK PHB 1,766 305 4,470 - 1 - 6,542
TOTAL 112,354 15,544 381,583 1,764 2,255 4 513,504
Number of Accounts at Commercial Banks (31 st December 2011) ['000]
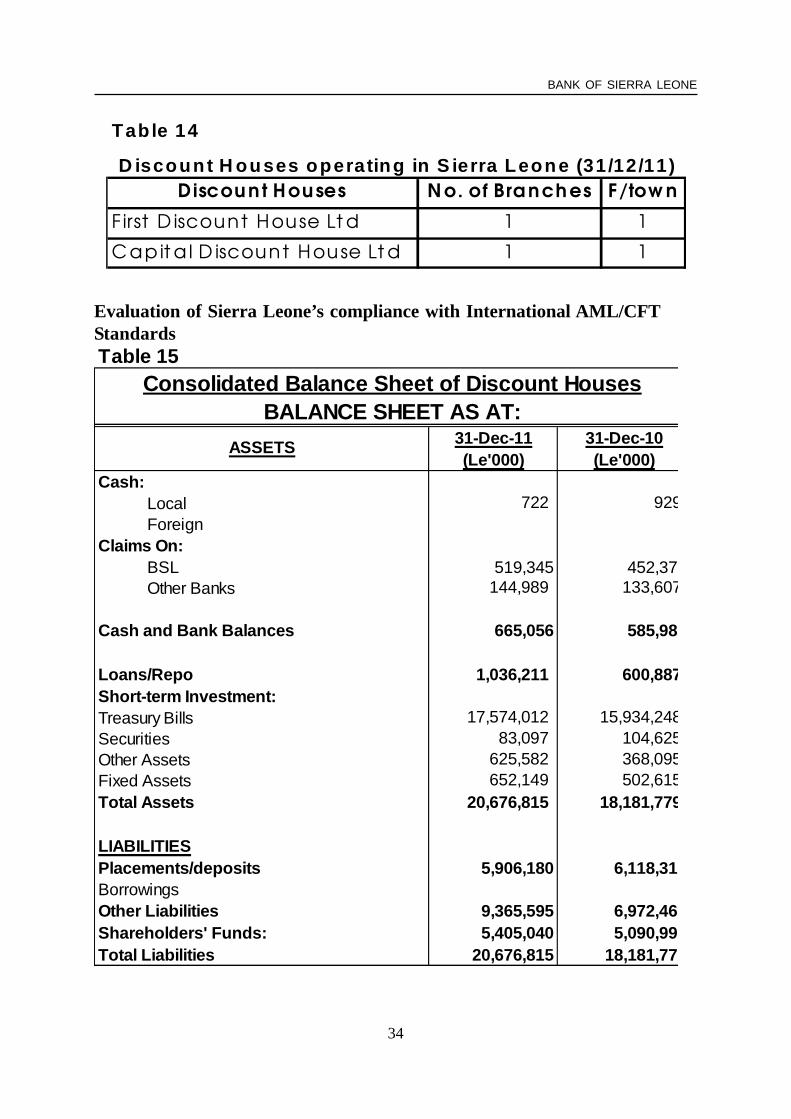
33
ANNUAL REPORT AND STATEMENT OF ACCOUNTS
Shareholders’ funds rose by Le46.43 billion (11.78%) to Le440.44 billion as at 31st December 2011.The increase was mainly due to the Le23.43 billion or 7.88 percentage increase in issued & paid-upcapital.
The minimum statutory Capital Adequacy Ratio (CAR) of 15 percent was met as the industry recordeda CAR of 26.96 percent as at 31st December 2011. The capital base of three banks were eroded bylosses, a result of which breached the requirement on the minimum paid-up capital of Le21 billion as atend December 2011.
The industry’s gross advances recorded Le1.072 trillion (up Le197.60 billion or 22.59%) as at 31st
December 2011 compared to Le874.70 billion as at 31st December 2010.
Other services, import trade, construction and transport, storage & communication sectors accountedfor 20.31 percent, 18.79 percent, 18.69 percent, and 9.34 percent of gross advances respectively,while manufacturing, agriculture, financial services, export trade, mining & quarrying and miscellaneoussector accounted for 7.68 percent, 7.09 percent, 5.70 percent, 4.11 percent, 2.80 percent and 2.60percent of gross advances, respectively. Electricity, gas & water and other trade & tourism, receivedonly 1.74 percent and 1.14 percent of gross advances respectively, as at 31st December 2011.
Total performing loans accounted for 84.2 percent of gross advances as at 31st December 2011. Theratio of non-performing loans to gross advances decreased to 15.08 percent as at 31st December 2011from 15.61 percent as at 31st December 2010.
The commercial banks made huge strides in terms of profitability during the period under review as theindustry recorded pre-tax profit of Le103.39 billion (up Le33.09 billion: 47.06%) for the period ended31st December 2011 compared to Le70.30 billion for the period ended 31st December 2010. One ofthe thirteen commercial banks recorded a loss amounting to Le12.65 billion during the review period.There was an increase in return on asset ratio, which stood at 3.78 percent in 2011 compared to 3.40percent in 2010. The increase in pre-tax profit impacted positively on return on equity which registered15.59 percent in 2011 from 12.10 percent in 2010.
The statutory requirement for cash ratio was adhered to as it recorded a surplus of 1.86 percent in thereporting period from a surplus of 3.70 percent in the preceding year.
The overall liquidity ratio was also attained, with the industry recording actual liquidity ratio of 54.61percent in 2011, with a surplus of 29.66 percent.
6.2 Other Financial InstitutionsOther Financial Institutions (OFIs) are financial institutions other than commercial banks. They complementthe functions of commercial banks and perform specialized functions.
The licensed Other Financial Institutions in the system in 2011 included two (2) discount houses, one(1) mortgage savings and loans institution, thirty-nine (39) foreign exchange bureaux, nine (9) communitybanks, one (1) deposit-taking microfinance institution and six (6) credit-only microfinance institutions.

34
BANK OF SIERRA LEONE
Evaluation of Sierra Leone’s compliance with International AML/CFTStandards
Tab le 14
Discou n t Houses N o. of Bra nch es F/tow n
F irst D iscount House Lt d 1 1
C apit a l D iscount House Lt d 1 1
D iscoun t H ouses operating in S ierra Leone (31/12/11 )
Table 15
31-Dec-11 31-Dec-10(Le'000) (Le'000)
Cash: Local 722 929 ForeignClaims On: BSL 519,345 452,378 Other Banks 144,989 133,607
Cash and Bank Balances 665,056 585,985
Loans/Repo 1,036,211 600,887 Short-term Investment:Treasury Bills 17,574,012 15,934,248 Securities 83,097 104,625 Other Assets 625,582 368,095 Fixed Assets 652,149 502,615 Total Assets 20,676,815 18,181,779
LIABILITIESPlacements/deposits 5,906,180 6,118,315BorrowingsOther Liabilities 9,365,595 6,972,468Shareholders' Funds: 5,405,040 5,090,996Total Liabilities 20,676,815 18,181,779
Consolidated Balance Sheet of Discount HousesBALANCE SHEET AS AT:
ASSETS
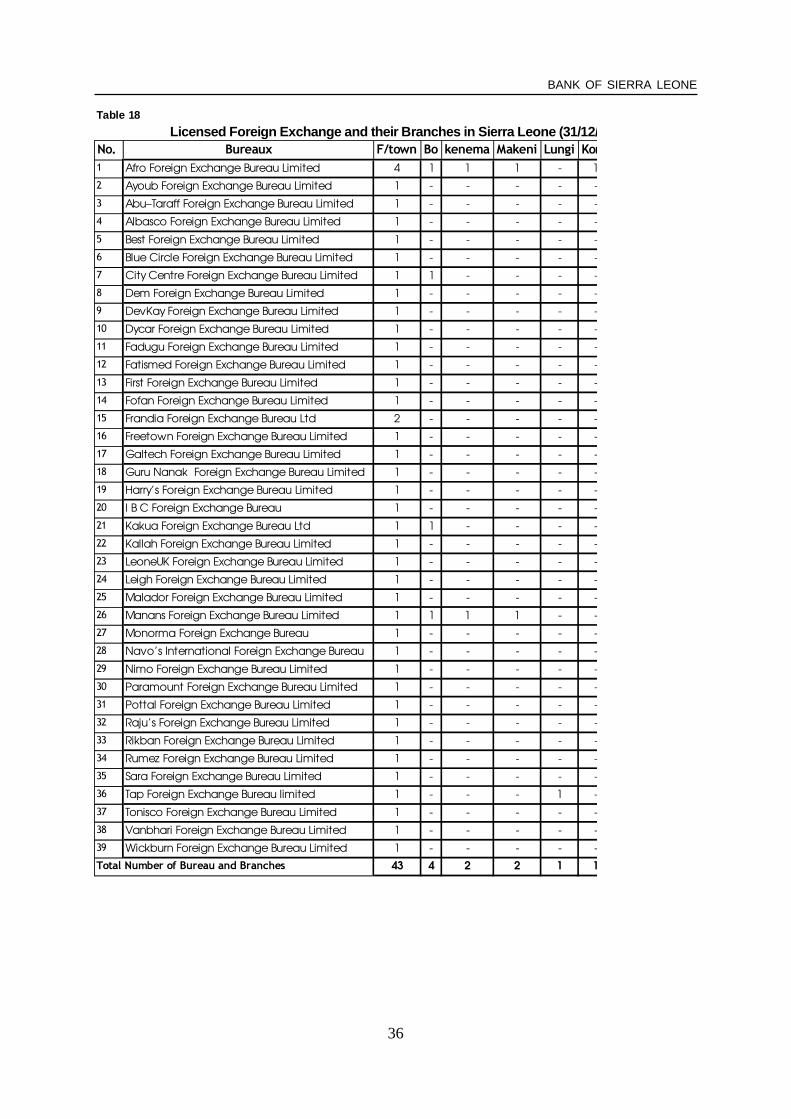
35
ANNUAL REPORT AND STATEMENT OF ACCOUNTS
6.3 Evaluation of Sierra Leone’s compliance with International Anti-Money Laundering/Countering the Financing of Terrorism (AML/CFT)
The fifth follow-up report on compliance with international standards on AML/CFT was presented atthe GIABA 16th Technical Commission/plenary meetings held in Lome, Togo in November 2011. Theplenary noted that a considerable number of actions required to be taken to rectify the deficiencies incompliance with key international standards are dependent on the enactment of the AML/CFT bill.Sierra Leone is yet to pass the AML/CFT Bill into law.
Table 16
Credit-only No. of Branches Address
Brac Microfinance(SL) Limited 42 28 Old Lumley Road, Off Spur Road, Wilberforce,
Freetown
A Call to Business Trading(SL) Limited 1 8 Road, off Gooding Drive, Babadorie-Lumley
Finance Salone 11 c/o Union Trust Bank
Salone Microfinance Trust Limited 5 13 Azzolini Highway, Makeni
Counterpart in Community Development and
Microfinance Company Limited
1 350 Bai Bureh Road, Calaba
Grassroots Gender Empowerment Movement 2 57 John Street, Freetown
Credit-only Microfinance Institution with certificate issued by the Bank of Sierra Leone as at 31st December 2011
T ab le 17
B ank N o . o f B ranc hes Lo c a tio n
M a ra m p a -M a sim era C om m u n it y
Ba n k
1 Lu n sa r
Y on i C om m u n it y Ba n k 1 M ile 91
Seg b w em a C om m u n it y Ba n k 1 Seg b w em a
M a t t ru C om m u n it y Ba n k 1 M a t t ru
Jon gZ im m i C om m u n it y Ba n k 1 Z im m i
Ka b a la C om m u n it y Ba n k 1 Ka b a la
Pen d em b u C om m u n it y Ba n k 1 Pen d em b u
N im iya m a C om m u n it y Ba n k 1 N im iya m a ,
Kon oSa n d or C om m u n it y Ba n k 1 Sa n d or,
Kon o
C o m m u n ity B a n k s o p e ra tin g in S ie r ra L e o n e (3 1 /1 2 /1 1 )

36
BANK OF SIERRA LEONE
Table 18
No. Bureaux F/town Bo kenema Makeni Lungi Kono Kabala Total
1 Afro Foreign Exchange Bureau Limited 4 1 1 1 - 1
2 Ayoub Foreign Exchange Bureau Limited 1 - - - - -
3 Abu–Taraff Foreign Exchange Bureau Limited 1 - - - - -
4 Albasco Foreign Exchange Bureau Limited 1 - - - - -
5 Best Foreign Exchange Bureau Limited 1 - - - - -
6 Blue Circle Foreign Exchange Bureau Limited 1 - - - - -
7 City Centre Foreign Exchange Bureau Limited 1 1 - - - -
8 Dem Foreign Exchange Bureau Limited 1 - - - - -
9 DevKay Foreign Exchange Bureau Limited 1 - - - - -
10 Dycar Foreign Exchange Bureau Limited 1 - - - - -
11 Fadugu Foreign Exchange Bureau Limited 1 - - - - -
12 Fatismed Foreign Exchange Bureau Limited 1 - - - - -
13 First Foreign Exchange Bureau Limited 1 - - - - -
14 Fofan Foreign Exchange Bureau Limited 1 - - - - -
15 Frandia Foreign Exchange Bureau Ltd 2 - - - - -
16 Freetown Foreign Exchange Bureau Limited 1 - - - - -
17 Galtech Foreign Exchange Bureau Limited 1 - - - - -
18 Guru Nanak Foreign Exchange Bureau Limited 1 - - - - -
19 Harry’s Foreign Exchange Bureau Limited 1 - - - - -
20 I B C Foreign Exchange Bureau 1 - - - - -
21 Kakua Foreign Exchange Bureau Ltd 1 1 - - - -
22 Kallah Foreign Exchange Bureau Limited 1 - - - - -
23 LeoneUK Foreign Exchange Bureau Limited 1 - - - - -
24 Leigh Foreign Exchange Bureau Limited 1 - - - - -
25 Malador Foreign Exchange Bureau Limited 1 - - - - -
26 Manans Foreign Exchange Bureau Limited 1 1 1 1 - -
27 Monorma Foreign Exchange Bureau 1 - - - - -
28 Navo’s International Foreign Exchange Bureau
Limited
1 - - - - -
29 Nimo Foreign Exchange Bureau Limited 1 - - - - -
30 Paramount Foreign Exchange Bureau Limited 1 - - - - -
31 Pottal Foreign Exchange Bureau Limited 1 - - - - -
32 Raju’s Foreign Exchange Bureau Limited 1 - - - - -
33 Rikban Foreign Exchange Bureau Limited 1 - - - - -
34 Rumez Foreign Exchange Bureau Limited 1 - - - - -
35 Sara Foreign Exchange Bureau Limited 1 - - - - -
36 Tap Foreign Exchange Bureau limited 1 - - - 1 -
37 Tonisco Foreign Exchange Bureau Limited 1 - - - - -
38 Vanbhari Foreign Exchange Bureau Limited 1 - - - - -
39 Wickburn Foreign Exchange Bureau Limited 1 - - - - -
43 4 2 2 1 1Total Number of Bureau and Branches
Licensed Foreign Exchange and their Branches in Sie rra Leone (31/12/11)

37
ANNUAL REPORT AND STATEMENT OF ACCOUNTS
A pre-legislative conference was held on the 16th December 2011, to discuss the AML/CFT Bill,together with the Banking and Bank of Sierra Leone Bills. The essence of the conference was toenhance the understanding of parliamentarians on key provisions of the Bills to ensure the smoothpassage into law.
6.4 Credit Reference BureauThe financial sector of Sierra Leone is dominated by thirteen (13) commercial banks that have beenpivotal in extending credit and promoting private sector development. As an engine for economic growth,the private sector requires an investment environment and suitable financial services that address thediverse needs of potential investors. However, the provision of financial services by commercial banksis partly constrained by the lack of timely and reliable information on the credit profile of potentialborrowers. This has, in part, contributed to the high non-performing loans, high interest rate chargedon loans and advances and subsequent adoption of stringent collateral requirements for lending. Anincrease in the amount of non-performing loans could undermine the profitability of banks and hencetheir capital base, which in turn also limits their potential to extend credit to the private sector. Evidencesuggests that there are habitual bad debtors who maintain facilities accross the various lending institutionswhile some obtain new loans to refinance their non-performing credit.
In view of the above, the Credit Reference Bill was enacted in April 2011 and the Bureau startedoperation in May 2011.
The Credit Reference Bureau collects credit information from all the commercial banks to populate itsdatabase and searches the database when a credit request is filed. From May 2011 to December2011, the Credit Reference Bureau issued two thousand eight hundred and two (2,802) credit reportson individuals and businesses. One thousand eight hundred and fifty five (1,855) credit reports wereissued on individuals, while nine hundred and forty seven (947) credit reports were issued on businessesfrom May to December 2011.
6.5 Licensing of Financial InstitutionsThe Bank of Sierra Leone continued to play its oversight role, aimed at achieving a sound and stablefinancial system. The licences of Rokel Commercial Bank (SL) Limited and the Sierra Leone CommercialBank Limited were renewed for a period of five (5) years each in 2011, while the license of the FirstDiscount House (SL) Limited was renewed for a period of two (2) years. The current license of theCapital Discount House (SL) Limited remains valid until 2014. Also in 2011, licence was granted to the Bank for Innovation and Partnership Microfinance Limited, toundertake deposit-taking microfinance business, while ITASCAP (SL) Limited and Pennarth Greeneand Company Limited were licensed to act as Fund Managers and Issuing House respectively, in theSierra Leone Stock Exchange.
The period also marked the deepening of the use of electronic products in the Sierra Leonean Market.Ecobank (SL) Limited was granted approval to act as settlement account holder for Airtel Moneyproduct, while Skye Bank (SL) Limited was granted approval to introduce “Flitcash” extra (African PaymentService) money transfer payment. Also during the review period, United Bank for Africa (SL) Limited was

38
BANK OF SIERRA LEONE
granted approval to operate UBA “DOM PLUS” Account- a non-interest earning foreign savingsaccount and HFC Mortgage and Savings Company (SL) Limited was granted approval to operate acheque based system called HFC Super Account.
Furthermore, in a bid to enhance economic activities in the country and at the same time bring financialservices to the doorsteps of the Sierra Leonean public, the Bank of Sierra Leone approved the openingof additional branches to the following commercial banks during the review period: Sierra LeoneCommercial Bank (SL) Limited, at Kadgibs Plaza, Kissy in the Western Area, Guaranty Trust Bank(SL) Limited, at Leone Oil, Bai Bureh Road, Kissy, and Main Motor Road, Brookfields, in the WesternArea, Pepel in the Northern Province and Bank PHB (SL)Limited at No. 20 Kissy Road, Freetown,in the Western Area. As a result, the total branch network increased (by 5) from eighty-one (81) asat 31st December 2010 to eighty-seven (87) as at 31st December 2011,
The Bank of Sierra Leone continues to encourage partnership between domestic and foreign banks,with the Sierra Leone Commercial Bank (SL) Limited entering into an agreement with the Africa Export-Import Bank (AFREXIMBANK) for total loan facilities of US$8,000,000 (eight million dollars) involvingUS$5,000,000 (five million dollars) Revolving Trade Finance Line of Credit Facility and US$3,000,000(three million dollars) Remittance-Backed Term Loan Facility. Also, Rokel Commercial Bank (SL)Limited was granted approval to enter into an agreement with AFREXIMBANK for loan facilities ofUS$3mn (three million dollars) Revolving Trade Finance Line of Credit Facility.
6.6 Legal and Regulatory FrameworkThe Banking Act 2011 was enacted in December, 2011. Also, guidelines for Other Deposit-TakingInstitutions and Finance Leasing Institutions were issued during the review period.
6.7 The Capital MarketThe Sierra Leone Stock Exchange Company Limited which was formally launched on 17th July 2009,is still in its infancy with only one company listed. The slow development of the stock exchange could beattributed to the slow implementation of the privatisation drive and to some extent the poor sensitisationof the public about the existence and activities of the stock exchange.
The smooth operation of the Stock Exchange and the Capital Market in general hinges on appropriatenessof the legal and regulatory framework. The enactment of the Other Financial Services Amended Act of2007 empowered the Central Bank to undertake the regulation and supervision of the Stock Exchangetill the Securities and Exchange Commission (SEC) is established.
For the SEC to be established, the following instruments must be put in place: -
• The Securities Act• The Collective Investment Act
Both the Securities and the Collective Investment Bills had been drafted, perused by stakeholders andsent to The Law Officers Department for the enactment process to commence.

39
ANNUAL REPORT AND STATEMENT OF ACCOUNTS
6.7.1 Current PlayersAs at 31st December 2011, there were two licensed dealing members namely; the two Discount Houses,one listed company, one issuing house (Pennarth Greene) and one fund manager (ITASCAP).
6.7.2 Trading SessionsSince its establishment, the Stock Exchange has undertaken one hundred and ten (110) trading sessionswith a total volume of 46.85 million units of Rokel Commercial Bank, valued at Le289.92 million, whilethe total volume demanded for the same period was 59.22 million units valued at Le355.60 million.
There was excess demand for Rokel Commercial Bank shares as total shares demanded exceededtotal shares offered. Thus the price of Rokel shares increased in the fourth quarter of 2011.
6.8 Status of the Financial Sector Development Plan (FSDP) - 2011The World Bank Board in 2011 approved a Financial Sector Development Plan Support grant ofUS$4 million to fund activities of the Financial Sector Development Plan. Two major components to befinanced from this grant proceeds are:
n Enhancing access to Financial Services - This component will support activities that improveefficiency in financial intermediation; reduce transaction costs of money transfer and expandaccess to financial services
n Building Financial Sector Reform and Oversight Capacity of the Bank of Sierra LeoneThis component will strengthen the Bank of Sierra Leone’s capacity to supervise the growingfinancial sector effectively, lead the financial sector reform process and develop its organisationalcapacity to undertake its key functions within the Sierra Leone financial sector.
Q uantity (‘M n)
Amount (Le ‘M n)
Q uantity (‘M n)
Amount (Le ‘M n)
I 26.93 156.72 34 .51 196 .77
I I 5.05 26.89 3 .65 19 .48I II 3.44 20.13 8 .71 51 .99IV 12.77 90.63 13 .68 96 .82
Ye ar 48 .18 294.38 60 .56 365 .06
Q uarte rS hare s O ffe re d (S upplie d)
S hare s B ide d fo r (D e mande d)
Table -19 Trading Pos ition o f R ok e l S hare s by Q uarte rs in 2011

40
BANK OF SIERRA LEONE
The Government of Sierra Leone received a grant of US$1.3 million from the African DevelopmentBank under the Fragile States Facilities to support implementation of the FSDP and this amount willmainly focus on strengthening the Central Bank. The following departments will benefit from this grantproceeds:
Ø Governor’s OfficeØ Research DepartmentØ Internal Audit DepartmentØ Secretary’s DepartmentØ Banking Supervision Department
Other development partners that have expressed support through either financial or technical assistancefor individual projects are GDC, KFW, CORDAID, AFDB, IFAD, UNCDF, UNDP & IFC.
The following activities are already in progress:-
Activity Funded by
Installation of components and implementationof the payments systems project AfDB
Restructuring of existing community banks,establishing new community banks andFinancial Service Associations IFAD
7.0 Payments System Development in Sierra LeoneSierra Leone has made significant progress in its payments system modernisation to facilitate the speedyand efficient processing of financial transactions, increased availability of reliable data and theimplementation of monetary policy.
Under the WAMZ Payments System Development Project, progress in 2011 is as follows:
a) Automated Cheque Processing/Automated Clearing House (ACP/ACH)♦ MICR encoded cheques for the Bank of Sierra Leone and commercial banks were validated
in line with the WAMZ Cheque Standard.♦ Both hardware and software equipment with respect to the implementation of the ACP/ACH
have been installed awaiting deployment.♦ Hands on training conducted for the Clearing House and participating banks including the Bank
of Sierra Leone Project Implementation Team
b) Core Banking Application (CBA)♦ The Solution Provider for the CBA conducted scoping studies on the Banking Application as
well as the General Ledger.♦ Both hardware and software equipment delivered and installed at the premises of the Bank and
are awaiting User Acceptance Testing (UAT).

41
ANNUAL REPORT AND STATEMENT OF ACCOUNTS
♦ End Users and Project Implementation Team members trained both on the Functional and theTechnical aspects of the interfacing.
♦ Scoping studies conducted in preparedness for the Sunsystems General Ledger and Temenos24 hours (T24) core Banking Application interfacing.
c) Real Time Gross Settlement System (RTGS)/Scriptless Securities Settlement (SSS)♦ Both hardware and software equipment delivered and installed at the premises of the Bank.♦ A Technical Assessment Programme (TAP) on the current SWIFT Infrastructure as the messaging
platform of the future RTGS conducted. This included the training of commercial banks andBank of Sierra Leone staff on both technical and functional aspects of the SWIFT platform.
d) Infrastructure UpgradeLot1 (Network Upgrade & Reconfiguration).n All items for this Lot deliveredn Installation in the Server Room (Main Site) completedn Cut-over from the old server room to the main site partially completedn Erection of VSAT mast completed.
Lot 2 (Internet and MAN)n Customer premise equipment (Radio Antennae) installed for all the banks. Testing links
completed
Lot 3 – (IT Room Security & Energy Upgrade)n Renovation of the Server Room (Main Site) completed.
e) State of preparedness
♦ Eleven (11) commercial banks have confirmed that the configuration of their equipment is complete.
7.1 The core challenges facing the payments system presently are:
♦ Sensitization of the public on payments system reform.
♦ Training of operational and IT staff on the functionalities of the various project components andother related systems.
♦ Facilitation of the efficient deployment of the WAMZ Payments System components in SierraLeone by December 2012.
♦ Exercising the oversight function to promote safety and efficiency in payment and settlementsystems in line with the BIS core principles.

42
BANK OF SIERRA LEONE
8.0 Foreign Exchange Management
8.1 Foreign Exchange AssetsGross external reserves position of the Bank of Sierra Leone as at end December 2011 wasUS$376.79mn, above the US$344.80mn target. This showed an increase in the reserves position byU$31.99mn or 9.28 percent, compared to the 2010 position. The favorable position was largely dueto increased receipts from the oil and mining companies and purchases of foreign exchange fromcommercial banks, which were not initially programmed.
During the review period, the foreign exchange cash flow was supported mainly by inflows from theInternational Monetary Fund, African Development Bank, UK/Department for InternationalDevelopment, European Union and receipts from the mining and oil companies in the sums ofUS$13.65mn, US$9.33mn, GBP15.00mn (US$23.59mn), Euro10.80mn (US$14.09mn) andUS$49.59mn, respectively. Of the total US$58.18m programmed to fund the foreign exchange auction,only US$41.18mn was utilised. Debt service payments were met as and when payments fell due.
8.1.1 InflowsTotal actual inflows recorded for the period January to December, 2011 amounted to US$159.96mnagainst a projection of US$166.04mn, reflecting a shortfall of US$6.08mn (3.66%). The shortfall canbe attributed to the unrealized programme disbursements from the European Union and the Governmentof Japan. Inflows recorded for the period under review were as follows:
8.1.2Receipts from exports and other Government revenuesReceipts from exports contributed US$10.41mn (6.51%) of the total inflows of US$159.96mn. Thebulk of the receipts from exports was mainly realised from tax receipts from diamond license fees ofUS$4.59mn and diamond exporters’ tax of US$4.26mn. Other Government foreign receipts includedUS$12.84mn received from African Minerals in respect of expatriate tax (PAYE), US$3.52m fromLondon Mining Company in respect of PAYE, US$33.58mn from Petroleum Resources in respect ofsignature bonuses, US$8.0mn as privatisation receipts and “other revenues” of US$2.85mn.
8.1.3Donor DisbursementsProjected donor disbursements for 2011 accounted for about 53.35 percent (US$88.58mn) of thetotal projected inflows of US$166.04mn. Major receipts realized amounted to US$67.36mn, of whichUS$23.59mn was disbursed by UK/Department for International Development under the UnitedKingdom/Sierra Leone budgetary support and Child/Maternal Health care project, US$2.5mn by theInternational Development Association as reimbursement under the West African RegionalCommunication and Infrastructural programme, US$9.33mn from the African Development Bank,Euro10.80mn (US$14.09mn) from the European Union, US$13.65mn from IMF, US$3.42mn asforeign exchange purchases from IDA and US$0.49mn from IDB. The amount of US$11mn expectedfrom Japan was not realised as programmed.
8.2 OutflowsTotal foreign exchange outflows increased by 2.09 percent from US$123.68mn in 2010 toUS$126.27mn in 2011. Outflows included mainly payments for goods and services, foreign exchangeauction funds and debt service payments to external creditors. The increase in expenditure in 2011 ascompared to 2010 was mainly as a result of an increase in debt service payments. Notwithstanding the

43
ANNUAL REPORT AND STATEMENT OF ACCOUNTS
reduction in the weekly offer amounts in the foreign exchange auction, the bulk of outflows during thereview period were in respect of payments under the foreign exchange auction (US$41.18mn).Government’s infrastructural projects (roads and energy) totaled US$30.58 mn, while payments toembassies/missions accounted for US$12.04 mn, other Government expenditures, US$9.39 mn, printingof currency, US$3.76 mn, and debt service payments, US$22.77 mn.
8.3 Investment ActivitiesActual revenue realized from external investment for the period January to December, 2011 was Le5.55bn,29.51 percent above the budgeted amount of Le4.28bn. The favorable performance in the reviewperiod was attributed to a combination of factors including the depreciation of the Leone against theBank’s investing currencies such as the United States Dollar, Pound Sterling, Euro and the SpecialDrawing Rights (SDR). Le5.55 bn was realized from external investment in 2011, representing a 68.69percent increase on the Le3.29bn recorded for 2010. This was due mainly to the improvement in theinterest rate return on the Bank’s investment currencies in 2011.
8.4 Foreign Currency ManagementThe Bank of Sierra Leone’s policy objective for currency management continues to be the holding ofreserves in currencies to match the SDR and to meet short term liquidity for payments in respect ofgoods and services, debt service and private sector support. Holdings of foreign currencies by theBank of Sierra Leone as at end December, 2011 were as follows; 47.46 percent in SDRs, 37.52percent in United States Dollars, 10.28 percent in Pound Sterling, 4.51 percent in Euro and 0.23percent in Japanese Yen.
8.5 Foreign Exchange ManagementDuring the period January to December 2011, the Bank continued to face significant challenges as aresult of Government’s increased expenditure mainly on infrastructural projects, which required substantialforeign exchange component. The increase in high-powered money impacted on the exchange rate,leading to the depreciation of the Leone over the period. There was significant increase in receipts fromdiamond exports and migrant remittances in 2011 as compared to 2010. The volume of transactionsduring the review period also increased significantly, including the auction offer amount which wasincreased from US$0.04mn to US$1.00mn in March 2011. The volume of transactions is measured bytotal purchases and sales of US Dollar in the foreign exchange market, including the foreign exchangeauction.
8.5.1 Foreign Exchange FlowsThe flow of foreign exchange increased significantly in 2011. Total amount traded in the foreign exchangemarket during the review period was USD1,091.23mn, 22.25 percent higher than the total amount ofUSD892.66mn traded in 2010. Total monthly foreign exchange transactions in the market moved fromUS$72.09mn in January 2011 to US$103.68mn in December 2011, representing an increase of 43.82percent.
8.5.2 Purchase of Foreign Exchange by Commercial BanksTotal purchases for 2011 increased by 26.80 percent to US$488.74mn as compared with the total ofUS$385.45mn for the same period last year. The average monthly purchase for 2011 was US$40.73mn,whereas the average monthly purchase for 2010 was US$32.12mn. The increased inflows were largelyattributed to receipts from the mining and agricultural sectors, as well as remittances from abroad.

44
BANK OF SIERRA LEONE
8.5.3 Purchase of Foreign Exchange by Foreign Exchange BureauTotal purchases by foreign exchange bureaux increased by 138.83 percent to USD41.46mn in 2011,compared with the total amount of US$17.36mn recorded in 2010. The monthly average purchase byforeign exchange bureaux in 2011 was USD3.46mn, compared with USD1.45mn for 2010. The increasewas mainly as a result of the overall improvement in the reporting regime instituted by the Bank and therobust supervision of bureaux.
8.6 Receipts from Diamond ExportsReceipts from diamond exports amounted to US$129.77mn in 2011; an increase of 14.32 percent,compared with the total amount of US$113.51mn recorded in 2010. Foreign exchange returns receivedfrom commercial banks indicated that a significant amount of these receipts came through the bankingsystem. There were also indications that export proceeds from agricultural products and scrap metalswere being repatriated through the banking system.
8.7 Migrant’ s RemittancesTotal migrant remittances between January and December 2011 increased to US$60.87mn, showingan increase by 37.28 percent when compared to the total of US$44.34m in 2010.
8.8 Sales of Foreign Exchange by Commercial BanksTotal sale of foreign exchange by commercial banks in 2011 increased by 13.19 percent to US$480.93mnin comparison with the total of US$424.90mn for 2010. The average monthly sale for 2011 isUS$40.08mn, whereas the average monthly sale for 2010 was US$35.41mn.
8.9 Sales of Foreign Exchange by Foreign Exchange BureauxTotal sales by foreign exchange bureaux increased by 129.54 percent to USD38.93mn in 2011 relativeto the total amount of US$16.96mn recorded in 2010. The monthly average sales by foreign exchangebureaux increased from USD1.41M in 2010 to USD3.24M in 2011.
Major non-oil and oil importers continued to access foreign exchange mainly from the commercialbanks and through the BSL weekly foreign exchange auction. Total foreign exchange sold to oil companiesby commercial banks during the review period was US$93.31mn and total amount sold to rice importerswas US$77.72mn.
8.10 Exchange Rate MovementThe stability of the exchange rate in 2011 was challenged by the growth in Reserve Money. The increasein domestic credit to government from the Central Bank and the subsequent increase in high-poweredmoney exerted considerable pressure on the exchange rate during the review period. Thatnotwithstanding, the exchange rate was relatively stable over the last two months of 2011. Consequently,the yearly average exchange rates in all the market segments depreciated in 2011, compared to 2010.The BSL average mid-rate of the Leone against the United States Dollar, as well as the commercialbanks, bureaux and the parallel market rates depreciated by 9.23 percent, 9.30 percent, 8.11 percentand 8.57 percent from Le3,984.36/US$1, Le3,982.28/US$1, Le4,021.83/US$1 and Le4,078.49/US$1 in 2010 to Le4,352.12/US$1, Le4,352.37/US$1, Le4,347.78/US$1 and Le4,427.94/US$1in 2011. The yearly average auction rate depreciated by 10.18 percent from Le3,977.55/US$1 toLe4,382.12/US$1, in the period under review.

45
ANNUAL REPORT AND STATEMENT OF ACCOUNTS
JA N - D EC JA N - D EC2011 2010
IN F L O W S :-O f w h ich 159 .87 142.11R e ce ip ts fro m e x p o rts 10 .61 9 .43 R u t ile 0 .09 0 .21 B aux ite 0 .75 1 .00 D iam ond L ic ens e fees 4.59 3 .11 D iam ond E x porte rs Inc om e Tax 4 .26 3 .00 F is h ing R oy a lty /L ic ens e 0.93 2 .11M arit im e A dm in is t ra t ion 0 .19 0 .64O the r G ovt 6 .21 4 .11O the rs 2 .86 1 .25R evenue fo r In fras truc tu ra l P ro j. 0 .00 1 .52A fric an M ine ra l M in ing C o . 12 .84 6 .25London M in ing 3.52 -P et ro leum R es ourc es 33.58 -Trans ac t ions w ith C om m erc ia l B ank s 14.80 0 .20P riva t iz a t ion 8 .00 -A id D isb u rse m e n t/B O P S u p p o rt 67 .25 118.71 IM F 13.65 42.82 A F D B (E R R P 4) 9 .33 7 .05 U K /D F ID 23.59 20.25 W orld B ank 0.00 16.76 W B Loan (fib re op t ic R efund) 2 .50 0 .00 E U 14.09 27.47 ID A /W orld B ank 3.61 2 .91 ID B 0.49 1 .45 H IP C F lo w R e l ie f 0 .00 -N e w S D R A l lo ca tio n 0 .00 -
O U T F L O W S :-O f w h ich 126 .27 123.68P a ym e n ts fo r G o o d s a n d S e rv ice s 103 .50 109.56 E m bas s y /M is s ions 12.04 11.58 B S L 2.50 1 .23 S ta b i l iza tio n & C o o p e ra tio n Fu n d 0.00 - C a p ita l S u b s c r ip tio n to W AC B 0.00 - P rin t ing o f C urrenc y 3.76 - G overnm en t Trave l 2 .38 2 .81 O ther G ove rnm en t 9 .39 11.73N ew In fras truc tu re P ro jec ts (R oads ) 17 .24 9 .12G o v In fra s tru c tu re P ro je c ts (En e rg y & W a te r ) 13.34 6 .87 S ubs c rip t ion to In t l. O rgan is a t ions 1 .18 1 .95 E lec t ric it y S upport 0 .00 16.18 P riva te S ec tor S uppo rt 41 .18 47.61 H IP C R e la ted Im ports 0 .50 0 .48D e b t S e rv ice a fte r d e b t re l ie f 2 2 .7 7 1 4 .1 2
IM F 5 .1 2 2 .4 4W orld B ank 1 .2 6 0 .9 8A F D B 0 .7 8 0 .7 4IF A D 0 .0 1 0 .2 6E C /E IB 0 -O ther m u lt ila te ra ls and b ila te ra ls 6 .6 3 4 .1 4P aris C lub C red ito rs 0 -O P E C (C IP A rrangem ent ) 1 .9 7 1 .5 7
O ther C om m erc ia l D ebt 7 4 C learing o f A rrea rs (E E C /E IB e tc ) 0 -
T ab le 20B an k o f S ie r ra L e o n e F o re ig n E xch an g e C ash F lo w (in U S $ M n )

46
BANK OF SIERRA LEONE
The rates in the various segments moved as follows;
8.10.1 Period Movement (Jan – Dec 11)The Le/US$1 official mid-rate depreciated by 4.28 percent from Le 4198.01/US$1 as at endDecember 2010 to Le4377.71/US$1 as at end December 2011. During the same period in 2010,the official Le/US$1 depreciated by 8.88 percent from Le3855.68/US$1 to Le4198.01/US$1.
The commercial bank’s weighted average mid-rate depreciated by 4.35 percent from Le4189.09/US$1 as at end December 2010 to Le/US$4371.28/US$1 as at end December 2011. During thesame period in 2010, the commercial bank’s weighted average mid-rate depreciated by 8.76percent from Le3851.83/US$1 to Le4189.09/US$1.
The parallel market mid rate depreciated by 2.95 percent from Le4315.00/US$1 as at endDecember 2010 to Le4442.50/US$1 as at end December 2011. During the same period in 2010,the parallel market rate depreciated by 7.81 percent from Le4002.50/US$1 to Le4315.00/US$1.
8.10.2 Monthly Average MovementsThe BSL monthly average mid rate depreciated by 5.50 percent from Le4184.09/US$1 as at endDecember 2010 to Le4375.54/US$1 as at end December 2011, while the monthly averagecommercial banks’ rate depreciated by 5.15 percent from Le4188.06/US$1 as at end December2010 to Le4372.95/US$1 as at end December 2011.
The foreign exchange auction rate depreciated by 2.92 percent from Le4291.50/US$1 as at endDecember 2010 to Le4381.10/US$1 as at end December 2011.
4100
4150
4200
4250
4300
4350
4400
4450
4500
4550Le/US$ rate
Period
Chart 12Monthly Average Exchange rate trend 2011
Auction rate BSL Mid-rate C/banks Mid-rate Bureaux Mid-rate Parallel Mid-rate

47
ANNUAL REPORT AND STATEMENT OF ACCOUNTS
8.11 Exchange Control RegulationsThe Bank continued to maintain restrictions on capital account transactions. However since the repealof Section 10 of the Exchange Control Act, the need to obtain exchange control approval from theBank of Sierra Leone for the registration of companies no longer exists. The remaining restrictions onthe capital account are under review.
8.12 Foreign Exchange AuctionThe Bank of Sierra Leone continued to conduct its weekly foreign exchange auction, in a bid to improvemarket-based allocation of foreign exchange in a competitive, transparent and consistent manner. Theforeign exchange auction was guided by the need for absorbing foreign financed budget spending andreducing short term volatility. The growth in imports has not been matched by a corresponding growthin exports, thereby exerting pressure on the limited supply of foreign exchange and consequently theexchange rate. During 2011, the BSL sold a total amount of US$41.17mn to supplement the foreignexchange market; a 14.22 percent reduction from the US$47.99mn offered in 2010.
8.12.1 Analysis of Auction Performance January-December 2011During the period January to December 2011, a total of US$42.70mn was put on offer and US$41.17mnwas sold in the weekly foreign exchange auctions held at the Bank of Sierra Leone. The Auction offeramount was increased from US$0.4mn in March 2011 to US$1.0mn by end December 2011 as aresult of the demand pressure in the first half of 2011. The auction rate depreciated cumulatively by1.17 percent from Le4,299.00/US$1 in January 2011 to Le4,356.77/US$1 by end December 2011.
Industries 4,482.89 3,835.00 9.32 -14.45General Merchandise 5,822.20 2,645.00 6.42 -54.57Oil Companies 19,368.51 10,180.00 24.73 -47.44Rice 18,076.40 24,509.00 59.53 35.59Tota l 47,750.00 41,169.00 100
Sector
T able 22
Sectoral Distribution of Auction Funds (US$'000)
2010 2011% of Total
amount in 2011% Change in
2011
2010 2011 % Change
Amount Offered 50,600.00 42,700.00 (15.61)
Amount Demanded 70,602.14 48,009.00 (32.00)
Amount Supplied 47,750.00 41,169.00 (13.78)
Table 21
Amount Offered, Demanded and Supplied in Foreign Exchange Auction
(Thousand Dollars)

48
BANK OF SIERRA LEONE
There was a decrease in the amounts offered, demanded and supplied in 2011 as compared to 2010.This may be attributed to the increased purchases by commercial banks during the year and the need tocomply with the programme target on reserves and the reduced demand for auction funds in the secondhalf of the year.
8.12.2 Sectoral Distribution of Auction FundsIn 2011, over 50 percent of the auction funds were sold to the rice importers. This was followed by theoil companies with 24.72 percent and “general merchandise”, which includes “other imported goods”,accounted for only 6.42 percent. The industry sector only accounted for 0.93 percent in 2011.
There was no sale of foreign exchange to the auction by the public during the period under review.
The foreign exchange auction has helped to stabilize the Leone/US$ exchange rate, even though itaccounts for only 3 percent of the volume of foreign exchange in the market. However, its effectivenessis guided by the need to absorb foreign financed budget by complementing monetary policy.
9.0 External Debt ManagementSierra Leone’s total disbursed and outstanding official long-term debt, including principal arrears as atend December 2011 stood at US$836.5 million (appendix2) as compared to US$778.1 million as at end
T a b le 2 3
D e c . 2 0 1 1% o f
T o t a l B a l .D e c . 2 0 1 0
% o f T o t a l B a l .
U . S . D o lla r s 1 4 0 . 8 3 7 . 5 2 1 1 7 . 9 7 3 4 . 5 6P o u n d S te r lin g 3 8 . 5 8 1 0 . 2 8 2 3 . 1 6 6 . 7 8E u r o 1 6 . 9 4 4 . 5 1 1 5 . 2 3 4 . 4 6J a p a n e s e Y e n 0 . 8 6 0 . 2 3 0 . 8 5 0 . 2 5S D R s 1 7 8 . 1 6 4 7 . 4 6 1 8 4 . 1 8 5 3 . 9 5T o t a l B a la n c e 3 7 5 . 3 7 1 0 0 3 4 1 . 3 9 1 0 0D o n o r f u n d sU . S . D o lla r s 1 . 4 2 1 0 0 3 . 4 1 1 0 0
C u r r e n c y M a n a g e m e n t
-
5,000.00
10,000.00
15,000.00
20,000.00
25,000.00
2010
2011
C hart 13Secto ral D is tr ibution o f Auctio n F un ds(U S$'000)
Industries G eneral M erchandise O il Com panies Rice

49
ANNUAL REPORT AND STATEMENT OF ACCOUNTS
December 2010. The marginal increase of 7.51 percent was mainly as a result of disbursements receivedfrom the International Development Association (IDA), International Monetary Fund, Exim Bank ofIndia and the African Development Bank, which more than outweighed the principal repayments madeduring the period. Multilateral creditors accounted for 62.40 percent of the total disbursed outstandingdebt, followed by commercial creditors, which accounted for 27.6 percent. Bilateral creditors accountedfor only 10 percent of the total external debt.
Consistent with the HIPC Initiative, the Government continued to promptly service its external debts asthey fall due. Total disbursements received from external creditors during the period amounted toUS$73.0mn. Of this amount, US$31.88mn was from the IDA; US$20.71mn from India Exim Bank;
Table 24
Chinese Yuan 114,343 72,352,652 3.60 114,343 79,415,603 3.49EURO 10,452 58,278,545 2.90 12,477 70,537,330 3.10British Pound - - 0.00 - - 0.00Japanese Yen 921 47,270,254 2.35 921 51,846 0.00Kuwaiti Dinar 2,498 37,236,063 1.86 3,034 47,642,126 2.09Saudi Riyal 38,936 43,594,320 2.17 45,390 52,984,590 2.33United States Dollar 86,978 365,134,381 18.19 110,364 483,142,069 21.23Special Drawing Rights 184,447 1,192,533,149 59.41 201,760 1,351,769,737 59.39Islamic Dinar 29,519 190,851,707 9.51 28,421 190,417,344 8.37
Total 2,007,251,071 100 2,275,960,645 100Source: External Debt Policy Section
Disbursed Outstanding Debt, including Principal Arrears as at End December 2011
classified by currency of l iability ('000)
Currency % of totaltotal debt in Ledebt in Foreign
Currency% of totaltotal debt in Le
debt in Foreign
Currency
Dec. 2010 Dec. 2011
2 0 1 0 2 0 1 1B i la t e ra l : 6 7 . 2 0 8 4 . 0 0O th e r B ila te r a l 6 7 .2 0 8 4 . 0 0
M u l t i la t e r a l ( N e t a m o u n t )A fr ic a n D e v e lo p m e n t B a n k /F u n d 7 6 .4 0 8 1 . 3 0W o r ld B a n k ( I B R D /I D A ) 1 5 4 .6 0 1 8 7 . 9 0I n te r n a t io n a l M o n e ta r y F u n d 1 0 6 .1 0 1 2 0 . 6 0O th e r M u lt ila te r a l 1 4 2 .3 0 1 3 4 . 7 0T o ta l M u lt ila te r a l 4 7 9 .4 0 5 2 4 . 5 0
O t h e r C o m m e r c ia l 2 0 . 4 0 1 9 . 9 0C o m m e r c ia l & S h o r t- T e r m D e b t 2 1 1 .1 0 2 0 8 . 1 0
G r a n d T o t a l 7 7 8 .1 0 8 3 6 . 5 0S o u r c e : E x t e r n a l D e b t P o l ic y S e c t io n , B S L
D e b t S e rv ic e p a y m e n t m a d e in U S $ M nT a b le 2 5

50
BANK OF SIERRA LEONE
US$7.54mn from ADF, and the residual of US$12.87mn was from BADEA, Kuwait Fund, IFAD,IDB, Saudi Fund and OPEC under various projects.
9.1 Currency CompositionThe Special Drawing Rights and the US Dollar constitute the major currencies that dominate SierraLeone’s debt. They account for 59.39 percent and 21.23 percent respectively, as at end December2011. Loans from IDA and IMF are mainly denominated in SDRs, which accounted for the highpercentage of the total debts. The Islamic Dinars, which accounts for 8.37 percent, represents the thirdmajor currency that dominates Sierra Leone’s debt.
9.2 Debt Indicators and Debt Service PaymentDebt service payments increased from US$13.05mn in 2010 to US$22.37mn in 2011. This increasewas mainly as a result of the commencement of principal repayments especially to the IMF and paymentsmade to commercial creditors. HIPC debt relief savings increased by 17.51 percent from US$3.14mnin 2010 toUS$3.69mn in 2011. This reflects debt service relief from EEC and IFAD respectively. Theratio of debt stock to exports declined to 41.8 percent as a result of the increase in exports during theperiod under review.
Sierra Leone’s debt situation is at a moderate risk of debt stress, as evident by the recent annual debtsustainability analysis report by the Ministry of Finance and Economic Development (MOFED). TheGovernment seeks to maintain prudent borrowing policies and to adhere to its commitments to avoidnon-concessional external borrowing and maintaining long term debt sustainability.
10.0 Monetary OperationsAt the start of 2011, monetary operations were faced with a lot of challenges due to the liquidity over-hang caused by fiscal expansion to finance infrastructural development projects, which resulted to theaccumulation of huge Ways & Means Advances by end 2010. The Ways & Means stock equivalent toLe178.58bn, transferred into a special account on the Bank of Sierra Leone books, was converted to
P r i n c i p a l I n te r e s t P r i n c i p a l I n te r e s tA r r e a r s A r r e a r s A r r e a r s A r r e a r s
T o ta l E x te r n a l D e b t 2 3 9 . 9 3 . 5 2 3 6 . 4 3 . 5 T o t a l C o m m e rc ia l O b l ig a t io n s 2 1 1 . 1 - 2 0 8 . 1 - & S h o r t -T e rm D e b t 1 /T o t a l L o n g -T e rm D e b t , 2 8 . 8 3 . 5 2 8 . 3 3 . 5 o f w h ic h : M u l t i l a t e r a l - - - - W o r ld B a n k G ro u p - - - - IM F - - - - O t h e rs O f f i c i a l B i l a te r a l 8 . 4 - 8 . 4 - P a r i s C l u b - - - - O t h e rs 2 / 8 . 4 - 8 . 4 - O t h e r C r e d i t o r s 2 0 . 4 3 . 5 1 9 . 9 3 . 5 E x e c u t i ve O u t c o m e 2 0 . 0 3 . 5 1 9 . 5 3 . 5 C h a t e l e t In ve s t m e n t L t d 0 . 4 - 0 . 4 - 1/ C h i n a , M o r o c c o , K u w a i t & S a u d i F u n d
T a b l e 2 6
D E C . 2 0 1 0 D E C . 2 0 1 1P r in c ip a l & In t e r e s t A r r e a r s a s a t e n d D e c -2 0 1 1 (U S $ M n )

51
ANNUAL REPORT AND STATEMENT OF ACCOUNTS
tradable securities and sold to the market during the weekly T-Bills auctions. The fiscal accommodationby the end of 2010 accelerated the growth in Reserve Money, which spilled over to Q1, 2011. Notingthe impact of high powered money on the economy, the authorities took a tight monetary stance in Q1,2011 to keep Reserve Money within target and restrain the inflationary pressure. The drive to absorbthe excess liquidity in the economy continued in Q2, 2011.
By Q3 of 2011, challenges were noted in the fiscal sector arising from the mismatch between fiscalreceipts and expenditure, coupled with the fact that BSL was not allowed to participate in the primaryauctions. At the beginning of Q4, there was liquidity squeeze in the banking system, which limitedbanks’ ability to roll-over maturing T-Bills which were redeemed by Government. As a result of theredemptions vis-à-vis fiscal challenges faced by Government, an agreement was reached with the Fundin November 2011 to allow BSL to roll-over its maturities up to end 2011.
In line with the Fund programme, BSL initially did not participate in the primary market auctions and itsmaturities at the auctions were either sold or redeemed. As a result, BSL holdings of securities, whichstood at Le169,890.30mn (19.34%) at the start of Q1, declined steadily to Le84,984.85mn (9.52%)by end-Q3 of 2011. However, it picked up in Q4, attaining the level of Le143,443.80mn (15.02%) byend-December 2011, influenced by the outright purchase of treasury bills by BSL in the secondarymarket.
The utilisation of Ways & Means Advances was kept within the borrowing limit of 5 percent of previousyear’s domestic revenue. As at 31 December 2011, outstanding Ways & Means Advances wasLe26,886.03mn, which according to the BSL Act 2011, was converted to 91-day T-Bills and held bythe Bank, to be sold to the market.
The 91-day T-Bills average annual yield at 23.42 percent was lower than the 24.54 percent recordedin 2010. Average annual yield on the 182-day T-Bills was 29.55 percent in 2011, which was higherthan the 28.35 percent recorded in 2010, whilst that on the 364-day T-Bills was 28.63 percent whichwas lower than the 28.98 percent attained last year. The nominal interest rate on T-Bonds, which was22.50 percent in 2010 declined to 20.00 percent in 2011.
Total outstanding Government securities rose by 8.72 percent over the period from Le878,719.80mnend-December 2010 to Le955,301.00mn end-December 2011. The holdings of commercial banksand Non-Bank Public, increased by 14.93 percent and 24.82 percent from Le474,244.80mn andLe181,082.40mn to Le545,039.50mn and Le226,020.55mn, respectively. BSL holdings of outstandingsecurities which was Le169,890.30mn by end of 2010, reduced to Le143,443.80mn as end December2011.
11.0 Financial Market Developments
11.1 Activities in 2011
With a view to enhancing financial inclusion, the Bank has been actively involved in initiatives tofacilitate access to finance especially in the rural areas which constitute mostly the informal andsignificant proportion of the economy. In addition to the increase in the number of banks from five inthe year 2000 to thirteen, the Bank of Sierra Leone has encouraged the growth of a number ofmicrofinance institutions (MFIs), Financial Services Associations (FSAs), the opening of new branches

52
BANK OF SIERRA LEONE
Source: Policy and Domestic Debt Division, BankingStock of Government securities outstanding by holders for end 2007
of commercial banks, and the introduction of more products, in a bid to improve rural financialintermediation. Bank of Sierra Leone is also encouraging the linkage banking as part of its strategyin facilitating access to finance.
In developing a vibrant micro finance sub sector, the Bank in collaboration with stakeholdersrevised and approved a National Micro Finance Policy which recognizes the existing informalinstitutions and brings them within the supervisory purview of the Central Bank. The NationalMicrofinance Policy harmonizes opening standards and provides a strategic platform forevaluation of microfinance institutions and promote appropriate supervision and adoption ofbest practice that will aid in developing a long term sustainable microfinance sector.
T a b le 27
2010 2011 C h an g e91-D AY S T B s 291,303.65 204,435.75 -86,867.90B S L 27,024.60 16,641.50 -10,383.10C O M. B ANK S 172,627.95 99,803.40 -72,824.55Non-B ank P ub lic 78,277.15 85,090.85 6,813.70NAS S IT 13,373.95 2,900.00 -10,473.95
182-D AY S T B s 249,222.35 365,148.15 115,925.80B S L 15,008.55 50,062.60 35,054.05C O M. B ANK S 212,546.75 257,804.10 45,257.35Non-B ank P ub lic 9,613.95 48,884.30 39,270.35NAS S IT 12,053.10 8,397.15 -3,655.95
364-D AY S 230,527.35 276,794.10 46,266.75B S L 107,355.55 65,731.05 -41,624.50C O M. B ANK S 89,070.10 171,983.65 82,913.55Non-B ank P ub lic 6,116.45 9,579.40 3,462.95NAS S IT 27,985.25 29,500.00 1,514.75
T B O N D 107,666.45 108,923.00 1,256.55B S L 20,591.60 11,008.65 -9,582.95C O M. B ANK S - 15,448.35Non-B ank P ub lic 87,074.85 82,466.00 -4,608.85NAS S IT
T O T AL 878,719.80 955,301.00 76,581.20B S L 169,980.30 143,443.80 -26,536.50C O M. B ANK S 474,244.80 545,039.50 70,794.70Non-B ank P ub lic 181,082.40 226,020.55 44,938.15NAS S IT 53,412.30 40,797.15 -12,615.15
(in Million Leones )S to ck o f G o v e rn me n t se cu r it ie s o u ts tan d in g b y H o ld e rs
Stock of Government securities outstanding by holders for end 2007

53
ANNUAL REPORT AND STATEMENT OF ACCOUNTS
In a bid to broaden microfinance and rural credit delivery, the Bank of Sierra Leone, under theFSDP, is working with the Microfinance Investment and Technical Assistance Facility (MITAF)to support the development of a competitive and sustainable inclusive microfinance sector thatprovides access to financial services to poor and low-income people in general and micro andsmall businesses in particular with a special focus on rural areas.
The Bank is also working with the International Fund for Agricultural Development (IFAD) toadminister and monitor the refinance funds and execute the establishment of seven CommunityBanks and thirty Financial Services Associations to enhance rural financial intermediation inaddition to the six pilot community banks established by Bank of Sierra Leone and three othersestablished by IFAD.
In ensuring proper monitoring and supervision of Community Banks, the Bank of Sierra Leonehad approved the IFAD Business Plan for the setting up of a Technical Assistance Agency (TAA)to undertake first level of supervision of Community Banks and Financial Services Associations(FSAs). The TAA which is a specialised unit is charged with the responsibilities of internal auditing,monitoring and evaluation, staff recruitment, training and evaluation and product development.The TAA also provides non banking support services to the CBs and FSAs aimed at improvingtheir operational efficiency and effectiveness.
Numerous micro-finance schemes are also being implemented with a view to promote small-scaleenterprises and informal sector activities in manufacturing, trade and services. Going forward, theBank of Sierra Leone is encouraging potential investors in the banking sector to diversify from retailbanking into other forms of banking in order to give customers increased and improved options.
11.2 BSL activities to promote market development in 2011The BSL was actively involved in initiatives to enhance access to finance especially in the ruralareas which constitute mostly the informal sector.
Through the partnership between the Bank and IFAD, the Rural Finance and CommunityImprovement Programme (RFCIP) was established to improve access to rural finance in theagricultural sector through mobilization of domestic funds and provision of linkages with thecommercial banks and financial institutions. Under the programme, distressed community bankswere restructured and in addition, 3 other Community Banks (CBs) and 26 Financial ServicesAssociations (FSAs) were set up in the rural areas.
The Bank in collaboration with stakeholders has encouraged the growth of microfinanceinstitutions. To this end, the revised National Micro Finance Policy was approved in 2011. Theobjectives of this policy are as follows:
· Establishing a framework within which microfinance initiatives will develop;· Outlining the principles that will guide operations of the system;

54
BANK OF SIERRA LEONE
· Serving as a guide for coordinated interventions by the respective participants in themicrofinance system; and
· Describing the roles of the stakeholders and the tools to be applied to facilitate thedevelopment of the sub-sector.
The Bank, in facilitating financial inclusion has been supportive of the developments of mobiletelephone-based banking, Automated Teller Machines, money transfers, linkage banking andthe downscaling of some commercial banks’ activities into microfinance, thus introducing newconcepts/products and more competition.
The Bank has also encouraged the promotion of financial literacy campaign as it is becomingincreasingly apparent that addressing financial inclusion will require a holistic approach on thepart of the commercial banks, community banks and microfinance institutions (MFIs) in creatingthe awareness of their financial products and services.
12.0 Sierra Leone’s Performance under the West African Monetar y Zone’s(WAMZ) Convergence CriteriaAn assessment of Sierra Leone’s performance under the WAMZ convergence criteria indicated that inthe year 2011, the country satisfied only one of the four primary criteria. The primary criterion met wascentral bank financing of fiscal deficit as a percentage of previous year’s tax revenue of notmore than 10 percent. Only one of the six secondary criteria namely, Public Investment from DomesticReceipts ratio to GDP was met. In the primary criteria category, both the inflation and the fiscal deficitcriteria were missed.
12.1 PRIMAR Y CRITERIA12.1.1 InflationSierra Leone’s inflationary pressures continued in the review period, with the year on year inflation rateremaining in double digits of 16.64 percent at end-December 2011, although slightly lower, comparedto 17.84 percent in December 2010. The country therefore missed the WAMZ single digit criterion oninflation. The high level of inflation was reflective of a number of factors including the pass-through ofhigh international prices for food and fuel, withdrawal of subsidies from fuel and domestic supply shocksdue to high government outlays.
12.1.2 Fiscal Deficit/GDP RatioAchieving this criterion continued to be elusive in the review period, with fiscal deficit excluding grantsexpanding to 14.20 percent in December 2011, compared to the WAMZ’ s threshold of not more than4.0 percent. The expansion in fiscal deficit was due to greater than anticipated outlays on all expenditurecategories, especially wages and salaries, interest on domestic and external debts and increased spendingon infrastructural projects.
12.1.3 Central Bank Financing of Fiscal DeficitSierra Leone was compliant with the WAMZ criterion on the ratio of central bank financing of the fiscaldeficit to GDP not exceeding 10.00 percent. The improved performance on this criterion resulted from the

55
ANNUAL REPORT AND STATEMENT OF ACCOUNTS
non-participation of the Bank in the primary market, coupled with the sale of treasury bills holdings inthe Bank’s portfolio. The Bank of Sierra Leone ensured that the ceiling on net domestic bank credit togovernment was strictly observed throughout 2011.
12.1.4 Gross External Reserves/Months of Import CoverGross external reserves as at end December 2011 was US$376.79mn, representing an increase of19.4 percent on the end December 2010 position of US$345.22mn. Notwithstanding the increase inreserves however, the total translated to 2.4 months of import cover, thus in breach of the WAMZbenchmark of 3 months of import cover. The non-compliance with this criterion was attributed to theproportionately larger increase in imports within the review period, relative to the increase in reserves.
12.2 SECONDARY CRITERIA12.2.1 Tax Revenue/GDP RatioDespite the Government efforts in enhancing revenue mobilisation and rationalising public expenditure, thecriterion on tax revenue as a percentage of GDP continued to pose a challenge for the authorities. Thecountry however recorded sustained improvement on this criterion, with the ratio increasing from 8.8percent in 2009 to 10.3 percent in 2010 and 12.13 percent in 2011. However, following the authorities’effort at enhancing revenue mobilization through the implementation of the National Revenue Authority’s
Table 28
Criteria Target 2008 2009 2010 2011
Inflation (end period) Single digit 13.21% 12.22% 17.84% 16.64%
Fiscal Deficit/GDP%
(excl. grants)
Less than or
equal to 4%15.00% 9.88% 12.50% 14.20%
Central Bank
F inancing/ Previous
years tax revenue
Less than or
equal to 10%0 18.70% 27.90% 15.93%
Criteria Target 2008 2009 2010 2011
Domestic Arrears 0 n.a n.a n.a n.a
Tax revenue/GDP
ratio
Greater than or
equal to 20%13.0% 9.8% 10.3% 12.13%
Salary Mass/Total
Tax revenue
Less than or
equal to 35%59.3% 64.5% 60.92% 58.57%
Public Investment
from Domestic
receipts
Greater than or
equal to 20%13.20% 16.51% 14.38% 28.0%
Real Interest Rate Greater than 0 -6.70% -5.97% -11.59% -10.14%
Exchange rate Stable +/-15% 15.77% 33.55% 38.97% 41.45%
(Secondary Criteria)
2.4
Status of Convergence(Primary Criteria)
Gross External
Reserves (Months of
imports)
Greater than or
equal to 3
months
4.0 5.8 4.5

56
BANK OF SIERRA LEONE
(NRA) modernization plan and measures to reduce the high level of tax exemption and discretionaryduty waivers, tax revenue as a percentage of GDP is expected to increase significantly in 2012.
12.2.1 Salary Mass/Total Tax RevenueWith respect to the salary mass/tax revenue criterion, Sierra Leone’s performance improved slightlybut remained above the WAMZ’ s benchmark of 35 percent. The wage bill contracted to 58.57 percentin the review period from 60.92 percent in 2010. This performance was due to improved revenueperformance, which partly offset the increase in recurrent expenditure during the period.
12.2.2 Public Investment from Domestic ReceiptsSierra Leone continued to meet this criterion in the review period, with the public investment fromdomestic receipts posting 27.95 percent. Capital expenditure increased by 47.15 percent in the reviewperiod, due to the outlays on infrastructure projects.
12.2.3 Real Interest RateMeeting this criterion has remained elusive for the country since 2003 due to the high level of inflation inthe face of a constant low savings rate of 6.50 percent. Inflation was 16.64 percent as against a savingsrate of 6.5 percent. Although inflation remained high, domestic savings rates have not responded to themarket fundamentals.
12.2.4 Nominal Exchange Rate StabilityThe exchange rate of the Leone depreciated against the central parity rate under the WAMZ ExchangeRate Mechanism by 41.4 percent, thus missing the criterion of +/- 15.0 percent. The pressure on theexchange market remained strong, in-spite of the Central Bank weekly foreign exchange auction systemduring the review period.
13.0 Internal AuditAs part of its strategic plan for organizational independence, professionalism and capacity building, theBank upgraded the internal audit function to a departmental status with the deployment of a substantiveDirector, Internal Audit in January 2011.
In 2011, the Internal Audit Department, together with other practicing Internal Auditors in otherorganizations commenced work on the facilitation of the establishment of a Local Chapter of the Instituteof Internal Auditors, meant to professionalise internal auditing in Sierra Leone.
14.0 Human Resources Developments14.1 Staff strengthIn 2011, the Bank continued with its Restructuring Exercise and the main focus was the modernizationand professionalization of the Bank, with a view to retaining capable and competent staff. The Banktherefore recruited professional staff from external sources, whilst internally, existing staff who haveimproved their technical skills and who possessed the relevant experience were promoted through acompetitive interview process.
Total staff strength as at end December 2011 was 495, reflecting a decrease of 26 (5.25%) from 521at end December 2010.

57
ANNUAL REPORT AND STATEMENT OF ACCOUNTS
The variance in staff strength was recorded mainly in the Management, Sub-Professional and Othercadres categories. Staff strength in the Management cadre recorded a decrease of 3 (three), from 9(nine) to 6 (six) as at end December 2011, due to the retirement of 3 (three) Heads of Department.
The staff strength in the Professional cadre remained unchanged at 230 (two hundred and thirty) , albeitthere were severances, additions and promotions within this cadre during the year. The number of staffin the Sub-Professional cadre decreased by 20 (twenty) from 136 (one hundred and thirty-six) as atend December 2010 to 116 (one hundred and sixteen) as at end December 2011 within this cadre.
Staff strength in the “other” cadres decreased by 7 (seven) from 124 (one hundred and twenty-four) asat end December 2010 to 117 (one hundred and seventeen) as at end December 2011. The decreasewas the result of the severance of 4 (four) members of staff.
The total male staff strength was 354 (three hundred and fifty-four) as at end December 2011. Of thistotal, 7 (seven) were Fixed Term Employees. The proportion of male staff including Fixed TermEmployees to total staff strength was recorded at 71.52 percent as at 31st December 2011.
Total female staff as at end December 2011 was 141 (one hundred and forty-one). Out of this total, 19(nineteen) were Fixed Term Employees. The proportion of female staff strength to total staff strengthincluding Fixed Term Employees was recorded at 28.48 percent.
The Fixed-Term Employees accounted for 26 or 5.25 percent from 495 at end December 2011 and5.18 percent or 27 from 521 as at end December 2010. There was a decrease of 1(one) in the Fixed-Term Employee cadre.
0
50
100
150
200
250
ManagementProfessional
Sub-professional OthersContract Staff
Number of Staff per category
Various Categories
Chart 14Breakdown of Staff per Category as at end 2011
58
BANK OF SIERRA LEONE
14.2 SeveranceA total of 28 (twenty-eight) members of staff severed from the service of the Bank as shown below:
Resignation 7Retirement 11Deceased 4Retirement on Medical Grounds 2Voluntary Retirement -End of Fixed Term 1Termination 3Dismissal -Position declared vacant -Total 28
14.3 TrainingThe Bank continued to provide opportunities both locally and overseas to enhance the capacity of staff,as well as strengthen them to perform their responsibilities efficiently. During the period under review,training requests were processed based on the specific needs of the Departments/Units and the Bank.In order to enable the Bank meet its current/future challenges and effectively carry out its core functions,the Banking Supervision, Financial Markets and Research Departments were further strengthened asmost staff in these departments benefited from relevant training programmes overseas to enhance capacity.
It is worth noting that training was also undertaken to build the capacity of staff for the implementationof the Payments System programme that will ensure soundness and stability in the financial sector.
Moreover, invitations for participation in several overseas short courses, mostly organised by the WestAfrican Institute for Financial and Economic Management (WAIFEM) were received and processedfor the participation of staff Bank wide. Nominations were also processed for training programmesorganised locally by institutions such as West Africa Bankers Association (WABA), National PublicProcurement Authority (NPPA) and ITASCAP. Cresmet Brokers and Business Consultants incollaboration with the General Services Department, also organised an In-service training programmeon Insurance.
As the Bank continued to support staff in developing their career in the Bank, seven (7) staff who werepursuing degree courses locally on Bank sponsorship completed their respective programmes duringthe year.
15.0 Directors of the BoardThe Board of Directors consists of the Governor (Chairman), Deputy Governor and five Non-ExecutiveDirectors, all of whom are appointed by the President in pursuant of the provisions of the Bank ofSierra Leone Act 2011.
The Governor and Deputy Governor are appointed for a term of five (5) years and shall be eligible forre-appointment for another term of five (5) years only.

59
ANNUAL REPORT AND STATEMENT OF ACCOUNTS
The Non-Executive Directors are appointed for a term of three (3) years and shall be eligible for re-appointment for another term of three (3) years only.
15.1 Legislative Changes Relevant to the BankIn 2011, the following pieces of legislation were enacted:
A. The Credit Reference Act 2011B. The Bank of Sierra Leone Act 2011C. The Banking Act 2011
The Bank is currently reviewing the Anti-Money Laundering Act 2005, which is intended to be repealedand replaced by the Anti-Money Laundering and Combating of Financing of Terrorism Act.
15.2 Bank of Sierra Leone Charity Trust FundThe Charity Trust Fund was established by the Bank of Sierra Leone on 1st August 2005. It is intendedto serve deserving students who achieve academic excellence in the pursuit of their academic/scholasticendeavours at the Secondary School level. The Charity is managed by an independent Board ofdistinguished members in their chosen profession, who act as Trustees of the Fund.
15.3 The Board of Trustees currently comprises the following members:Professor J A S Redwood-Sawyerr - ChairmanMr A Conteh - MemberDr Christiana Thorpe - “Mr M I Amara - “Mr Tom Lee - “
NoteThe Board, which was established on 4th August 2005, was inaugurated on 6th August 2005 withthe following main responsibilities, among others:
To promote the advancement of education in Sierra Leone.
To support and subscribe to any charitable or public object and any institution or societyfor the promotion of education in Sierra Leone.
During the Governor’s Annual Dinner held at the Bank of Sierra Leone Recreation Complex, Kingtom,Freetown on 28th January 2011, two new beneficiaries of the Charity were recognized and presentedwith cheques to cover tuition, lodging, books and maintenance.
The proud beneficiaries were Ms. Kumba Seddu and Mr. Sallieu Jalloh The former scored the highestin the WASSC Examinations from the Annie Walsh Memorial School and the latter the second highest,from the Albert Academy School.

Financial S tatement sfor the year ended 31st December 201 1

61
ANNUAL REPORT AND STATEMENT OF ACCOUNTS
THE BANK'S FINANCIAL POSITION AND OPERATING RESULTS AND DRAFTFINANCIAL STATEMENTS FOR THE YEAR ENDED 31ST DECEMBER, 2011
BACKGROUND
The Bank continues to prepare its annual accounts in line with the International Financial ReportingStandards (IFRS) and current best practice.
Although the Bank had adopted IFRS as its Financial Reporting Framework since 2007, it had notimplemented the Framework in full due to the requirements of the BSL Act 2000 which required thatRevaluation Gains and Losses are taken directly into reserves rather than through the Income Statement.Whilst this treatment is consistent with the operations of a central bank, it did not satisfy the requirementsof IAS 21-The Effect of Changes in Foreign Exchange Rates.
The Financial Year 2010 Accounts were qualified because:
l The BSL Act 2000 did not allow the treatment of revaluation gains/losses in accordance with IAS21-The Effects of Changes in Foreign Exchange Rates as mentioned above.
l The Employee Benefit Scheme had not been actuarially valued in accordance with IAS 19-Employee Benefits.
The Bank of Sierra Leone Act 2000 was replaced by the Bank of Sierra Leone Act 2011 whichlegally adopted IFRS as the Bank's Financial Reporting Framework and specified that revaluationgains and losses should be accounted for in accordance with IAS 21-The Effects of Changes inForeign Exchange Rates. An actuary was also employed during the year to determine the DefinedBenefit Obligations Liability of the Bank for the Financial Years 2010, 2011 and 2012.
Since the treatment of the revaluation gains and losses had not been consistent with IFRS for a longtime and the determination of Defined Benefit Obligations Liability of the Bank for Financial Year 2010was also carried out, there was a need to restate the prior year i.e. financial year 2010 as required byIAS 8 - Accounting Policies, Changes in Accounting Estimates and Errors. This was carried outby the Auditors and resulted in a revised net profit of SLL 256.61 billion for FY 2010 which is vastlydifferent from the original loss of SLL23.34 billion that was reported last year. Please see an analysisof this overleaf.

62
BANK OF SIERRA LEONE
Restatement of Prior Period Financial Statements
Restated OriginalIn thousands of Leones 2011 2010 2010
Interest and similar income 86,072,286 66,136,705 66,136,705Interest expenses and similar charges(3,057,307) (2,165,179) (2,165,179)
Net interest income 83,014,979 63,971,526 63,971,526
Fees and commission income 29,802 31,815 31,815Fees and commission expense
Net fee and commission income 29,802 31,815 31,815
Net exchange (loss)/gain (72,940,987) 288,627,979 1,950,742
Other income 834,597 2,424,968 2,424,968
Operating income 10,938,391 355,056,288 68,379,051
Impairment loss on loans and advances(38,898) (7,902) (7,902)
Personnel expense (36,510,497) (40,301,788) (33,576,707)
Currency (5,454,691) (36,536,574) (36,536,574)
Depreciation and amortisation (3,096,857) (2,405,829) (2,405,829)
Other expenses (17,443,005) (19,196,724) (19,196,724)
(Loss)/profit for the year (51,605,557) 256,607,471 (23,344,685)
Reconciliation of Profit/(Loss) 2011 2010
(Loss)/profit for the year as per Audited Accounts (51,605,557) 256,607,471
Less:Unrealised Revaluation (loss)/gains (76,932,519) 286,677,237
Prior period effect of IAS 19 (6,725,081
Profit/(Loss)for the year as per Management Accounts 25,326,962 (23,344,685)
Impact of IAS 21
Impact of IAS 19

63
ANNUAL REPORT AND STATEMENT OF ACCOUNTS
1. STATEMENT OF FINANCIAL POSITION
The Bank's overall financial performance improved with total assets increasing slightly by0.64% from SLL2.23 trillion in 2010 to SLL2.24 trillion as at 31st December, 2011.
The composition of total assets is depicted in the table below and the two pie charts thatfollow:
RestatedIn thousands of Leones 2011 2010 2009
Assets
Cash and cash equivalents 872,579,690 678,567,070 678,567,070
International Monetary Fund Related Asset 742,880,838 831,314,280 573,654,590
Loans and advances 38,101,206 198,789,921 17,437,122
Investment in equity 16,696,261 17,550,941 15,973,581
Investment securities 494,574,547 435,094,849 365,185,994
Property, plant and equipment 58,739,776 59,177,854 46,311,444
Other assets 19,085,555 7,794,820 55,994,568
Total asset s 2,242,657,873 2,228,289,735 1,645,240,616

64
BANK OF SIERRA LEONE
AssetsThe graph below shows the comparative analysis of the different categories of assetsover the two year period.

65
ANNUAL REPORT AND STATEMENT OF ACCOUNTS
Cash and Cash Equivalents with Foreign Banks which contributed the most to total assetsincreased by 28.60% from SLL678.57 billion in 2010 to SLL872.58 billion in 2011.International Monetary Fund (IMF) Related Assets, reported on a net basis (IMF Quotaless Securities and IMF No.1 Account balances plus SDR Holdings) decreased by 10.63%from SLL831.31 billion in 2010 to SLL742.88 billion in 2011. Also the Bank's ForeignInvestments in Equity decreased by 4.87%.
Loans and Advances reduced significantly due to a sharp drop in Ways and MeansAdvances to Government of SLL177.69 billion in a Stock Account in 2010 to SLL26.89billion in 2011. Staff Loans increased slightly from SLL4.14 billion to SLL4.20 billion asat 30th December, 2011. The Reverse REPO Account dropped from SLL9.81 billion tonil in 2011.
The Bank's Investment Securities increased by 13.67% from SLL435.09 billion in 2010to SLL494.57 billion in 2011. The 5-year Medium Term Bonds remained the samereflecting the non conversion of Non-Negotiable, Non-interest Bearing Securities. Howevera new set of bonds (the 3-year Medium Term Bonds) was created as agreed with theMinistry of Finance and Economic Development to convert the remaining Stock of the2010 Ways and Advances of SLL77.52 billion to Negotiable Securities. The Bank'sHoldings of Government Securities (Treasury Bills and Bonds) decreased by 11.63% fromSLL155.09 billion to SLL137.06 billion in 2011.
The total value of Other Assets (that is Non-Financial Assets including the value of goldstock and inventory items) increased by 144.84% from SLL7.79 billion in 2010 toSLL19.09 billion in 2011 mainly due to a sharp increase in Items in Transit (from SLL125.54million in 2010 to SLL16.45 billion in 2011). Such an increase can be traced to an increasein Supplies and Materials in Transit which resulted from the Bank's request for reprinting ofresized notes to replace the depleted stock in the vaults.
Deferred Currency Issue Expenses decreased significantly from SLL6.46 billion in 2010to SLL 1.09 billion in 2011 as a result of a depletion of stock of notes in the vaults becauseof huge capital expenditures in the economy which led to an increase in the Currency inCirculation.
Gold Stock increased by 15.37% from SLL530.64 million as at 31st December, 2010 toSLL612.20 million in 2011.
The Bank's Property, Plant and Equipment dropped slightly from SLL59.18 billion in 2010to SLL58.74 billion in 2011 as a result of a drop in all the assets categories with theexception of the Office Furniture and Equipment category which increased by SLL2.22billion .

66
BANK OF SIERRA LEONE
Liabilities
The graph below shows the comparative analysis of the different categories of liabilitiesover the two year period.
Total Liabilities increased marginally by 2.82% from SLL2.10 trillion in 2010 to SLL2.16 trillion in 2011.
IMF Special Drawing Rights (SDRs) Allocation increased from SLL1.12 trillion in 2010to SLL1.20 trillion in 2011 mainly because IMF Special Drawing Rights (SDRs) increasedby 3.63% from SLL643.35 billion in 2010 to SLL666.68 billion as at 31st in 2011 andDisbursements under the IMF Poverty Reduction and Growth Facility (PRGF) alsoincreased by 11.55% from SLL474.32 billion in 2010 to SLL529.10 billion in 2011.
Total Non-Financial Liabilities increased by 12.04% mainly due to an increase in Currencyin Circulation from SLL631.59 billion as at 2010 to SLL707.61 billion in 2011.
Deposits from Commercial and Community banks increased by 22.74% from SLL91.69billion in 2010 to SLL112.53 billion in 2011. Accrued Charges and Other Liabilitiesincreased by 28.59%. Government Deposits dropped sharply by 88.10% from SLL130.20billion in 2010 to SLL15.49 billion in 2011.
ReservesTotal Reserves reduced during the period from net tot al positive reserves of SLL125.71billion in 2010 to net tot al positive reserves of SLL77.50 billion in 2011. Thisunfavourable position resulted mainly from the charging of all revaluation gains/losses tothe Statement of Comprehensive Income instead of the Revaluation Reserves in compliancewith IAS 21.

67
ANNUAL REPORT AND STATEMENT OF ACCOUNTS
2. STATEMENT OF COMPREHENSIVE INCOME
Operating IncomeTotal operating income amounting to SLL10.94 billion represented a sharp dropfrom amount of SLL355.06 billion generated in the reinstated 2010 which includedthe sum of SLL139.44 billion in respect of revaluation gains transferred fromRevaluation Reserves to income. Also the Net Operating Loss of SLL51.60 billionis a marked contrast from the net profit of SLL 256.61 billion in the restated 2010position (2010 original (- 23,345).
This is depicted in the table and graph overleaf:
Description Restated 2010 2011 2010 Original
Operating Income 10,938 355,056 68,379
(Loss)/profit for the year (51,606) 256,607 (23,345)
Interest and similar income increased by 30.15% from SLL66.14 billion in 2010to SLL86.07 billio n in 2011. The favourable performance of this income line waslargely attributed to income of SLL54.99 billion from Investment Securitiesrepresenting a 32.11% increase from 2010 (SLL41.62 billion) . Income of SLL25.2billion realised from the 5-Year Medium Term Bonds constituted 55.13% of thetotal income from investment securities.
Interest income from Loans and Advances (to Government) amounting to SLL24.64billion was the next major source of income. This income arising mainly from theutilization of the Ways and Means Advances Facility by Government increased by21.88% from SLL20.22 billion in 2010 to SLL24.64 billion in 2011.

68
BANK OF SIERRA LEONE
The total income of SLL4.95 billion accruing from Foreign Currency Investments was5.75% of total interest income from Financial Assets. This income represented a rise of50.70% when compared with the amount of SLL3.28 billion generated in 2010.
Net exchange (loss)/gains decreased from SLL288.63 billion in the 2010 reinstatedposition to a negative amount of SLL72.94 billion as a result of net revaluation loss ofSLL76.93 billion in 2011. This was due to the gradual strengthening of the leone duringthe year (Exchange loss on the SDR Holdings amounted to SLL 119 billion ).
The table below and graph below shows the comparative analysis of the different categoriesof revenue over the two year period.
All figures in SLL M
Description 2011 2010 Change PercentageChange
Foreign investment 4,949 3,284 1,665 50.7%
Loans and advances 24,640 20,217 4,423 21.9%
Cash and short term funds 1,494 1,013 482 47.6%
Investment securities 54,989 41,623 13,366 32.1%
Fee and commission income 30 32 (2) -6.3%
Net exchange (loss)/gains -72,941 288,628 (361,569) -125.3%
Other income 835 2,425 (1,590) -65.6%

69
ANNUAL REPORT AND STATEMENT OF ACCOUNTS
Operating Expenses
Total operating expenses decreased by 36.50% from SLL98.45 billion in the restated2010 position to SLL62.54 billion in 2011.
Personnel costs amounting to SLL36.51 billion was the major item of expenditure duringthe period, accounting for 58.41% of total operating expenses and representing a 9.40%decrease over the amount spent in 2010.
Other Expenses (including Directors remuneration, audit fees, legal and professional fees,electricity, insurance, passages and overseas allowances and repairs and maintenance)decreased by 9.13% over the amount incurred in 2010 while Depreciation increased by28.72%. SLL38.90 million was provided to cover impairment loss on loans and advancesto Community banks.
Currency costs dropped sharply from SLL36.54 billion in 2010 to SLL5.45 billion in2011.
Net Operating Loss
The Net Operating Loss of SLL51.60 billion has been treated in accordance with therequirements of Sections 13(3) of the Bank of Sierra Leone Act 2011.
3. Equity
Total equity dropped from SLL125.71 billion in 2010 to SLL77.50 billion in 2011 dueto a fall in the total profit (net of revaluation gains and operating loss) realised for the year.
Budget Performance for year 2011
70
BANK OF SIERRA LEONE
General information
Board of directors : Mr. Sheku S. Sesay - GovernorMs. Andrina R. Coker- Deputy GovernorDr Morie K. ManyehDr Sandy A. BockarieMr. Dalton F. ShearsMr. Harold HancilesMrs. Marian KamaraMr. Sorie N. Dumbuya
Registered office : 30 Siaka Stevens StreetFreetown
Solicitor : Renner-Thomas & Co.Adele Chambers15 Lamina Sankoh StreetFreetown
Secretary of the board: Mr. Henry E.P Musah
Auditors : KPMGChartered AccountantsBicentenary House17 Wallace Johnson StreetFreetownSierra Leone

71
ANNUAL REPORT AND STATEMENT OF ACCOUNTS
Report of the directors
The directors have pleasure in submitting their report to the Government of Sierra Leone together withthe audited financial statements for the year ended 31 December 2011.
Principal activity
The principal activity of the Bank is to:
(a) formulate and implement monetary policy, financial regulation and prudential standards;
(b) act as banker, adviser and fiscal agent of the Government;
(c) formulate and implement the foreign exchange policy of Sierra Leone;
(d) conduct foreign-exchange operations;
(e) own, hold and maintain the official international reserves including the reserves of gold
(f) issue and manage the currency of Sierra Leone;
(g) establish, promote, license and oversee sound and efficient payment and securities settlementsystems;
(h) license, register, regulate and supervise financial institutions as specified in the Bank of SierraLeone Act or any other enactment and;
(i) act as a depository for funds from international organizations.
Director's responsibility statement
The Bank's Directors are responsible for the preparation and fair presentation of the financial statements,comprising the statement of financial position as at 31 December 2011 and the statements ofcomprehensive income, changes in equity and cash flows for the year then ended, and the notes to thefinancial statements, which include a summary of significant accounting policies and other explanatorynotes, in accordance with International Financial Reporting Standards, and in the manner required bythe Bank of Sierra Leone Act 2011 and for such internal control as the directors determine is necessaryto enable the preparation of financial statements that are free from material misstatement, whether due tofraud or error .
The Directors have made an assessment of the Bank's ability to continue as a going concern and have noreason to believe the business will not be a going concern in the year ahead.
Share capital
Details of the Bank's share capital are shown in note 28 to these financial statements.
Results for the year and appropriation
Loss for the year was Le 51.6 billion. (2010: profit of Le 256.6 billion restated). No appropriation ismade as required by Section 13 of the Bank of Sierra Leone Act 2011 as the Bank incurred a net loss.

72
BANK OF SIERRA LEONE
Report of the directors (continued)
Audit Committee
The Audit Committee comprising non-executive directors is responsible for oversight function over theaudit mechanism, internal control system and financial reporting system. The Audit committee meetsquarterly to review and monitor the implementation of recommendations in the internal audit reports,external auditors' management letters and other oversight reports like the IMF Safeguards AssessmentReports.
Monetary Policy Committee
The Monetary Policy Committee is the highest policy making body in the Bank on monetary policymatters. Chaired by the Governor of the Bank, this committee meets monthly to review developmentsin the economy and their implications for monetary management. It takes decisions on the level of thekey policy rate of the Bank, the Monetary Policy Rate (MPR) to signal to the market the stance anddirection of the Bank's Monetary Policy in seeking to achieve the primary objective of price stability.
Banking Supervision Technical Committee
This committee is responsible to direct and deliberate on the operations of all financial institutions.
Foreign Assets Committee
The Foreign Assets Committee meets quarterly and has responsibility to deliberate on issues relating toforeign assets of the Bank, review exchange control regulations relating to capital account transactions,monitor and maintain the external reserves to safeguard the internal value of the legal currency, andformulate policies that support monetary and exchange rate management.
Project Monitoring Committee
The Project Monitoring Committee is responsible to monitor ongoing projects implemented by theBank and make appropriate recommendations to management and board of directors.
Property and equipment
Details of the Bank's property and equipment are shown in notes 20 to these financial statements.
Employment of disabled people
The Bank does not discriminate against a qualified individual with disability with regards to recruitment,advancement, training, compensation, discharge or other terms, conditions or privileges of employment.

73
ANNUAL REPORT AND STATEMENT OF ACCOUNTS
Report of the directors (continued)
Health, safety and welfare at work
The Bank has retained the services of a medical doctor for all employees of the Bank and a conduciveoffice environment is maintained for staff and visitors, with adequate lighting and ventilation.
There is an approved training schedule for the bank and staff are trained both locally and internationallyin various areas to improve their skills and knowledge.
Employee involvement and training
There are various forums where the staff meet and discuss issues that relate to them and their progressat the work place, these include unit meetings, and regular general meetings.
There is an approved training schedule for staff and the Bank also has a staff performance appraisalprocess through which staffs are appraised and promotions and /or increments are made.
Directors and their interest
The following were directors of the Bank as at 31 December 2011:
Mr. Sheku S. Sesay - Governor (appointed 1 July 2009) - Chairman
Ms. Andrina R. Coker - Deputy Governor (appointed 6 October 2008)
Dr Morie K. Manyeh - Director (Up to 21 April 2011)
Dr Sandy A. Bockarie - Director (re-appointed 22 April, 2011)
Mr. Dalton F. Shears - Director (re-appointed 22 April 2011)
Mr. Harold Hanciles - Director (re-appointed 22 April 2011)
Mrs. Marian Kamara - Director (re-appointed 29 April,2011)
Mr. Sorie N. Dumbuya- Director (appointed 7 June 2011)
The Governor and Deputy Governor were appointed on 1 July 2009 and 6 October 2008 respectivelyand in accordance with section 15(2) of the Bank of Sierra Leone Act 2011, they shall hold office fora term of five years each and shall be eligible for reappointment for another term only.
The other directors are to hold offices for three years each and shall be eligible for re-appointment.
No director had during the year or has a material interest in any contract or arrangement of significanceto which the Bank was or is a party.

74
BANK OF SIERRA LEONE
Report of the directors (continued)
Auditors
The auditors have expressed their willingness to remain in office.
The auditors, KPMG were appointed by the Auditor-General on 29 December 2010 to conduct theaudit of the financial statements for the year ended 31 December 2011.
Approval of the financial statements
The financial statements were approved by the board of directors on .................…….....………..2012
…………………………………… ……………………...……………… Governor Deputy Governor
…………………………………… …………………………………...… Director Director
…………………………………… Secretary

75
ANNUAL REPORT AND STATEMENT OF ACCOUNTS
Independent auditor's report to the Government of Sierra Leone
We have audited the accompanying financial statements of Bank Sierra Leone which comprise thestatement of financial position as at 31 December 2011, and the statements of comprehensive income,changes in equity and cash flows for the year then ended, and the notes to the financial statements whichinclude a summary of significant accounting policies and other explanatory notes, as set out on pages 8to 60.
Directors' responsibility for the financial statements
The Bank's Directors are responsible for the preparation and fair presentation of these financial statementsin accordance with International Financial Reporting Standards and the requirements of the Bank ofSierra Leone Act 2011, and for such internal control as the directors determine is necessary to enablethe preparation of financial statements that are free from material misstatement, whether due to fraud orerror.
Auditor's responsibility
Our responsibility is to express an opinion on these financial statements based on our audit. We conductedour audit in accordance with International Standards on Auditing. Those standards require that wecomply with ethical requirements and plan and perform the audit to obtain reasonable assurance whetherthe financial statements are free of material misstatement.
An audit involves performing procedures to obtain audit evidence about the amounts and disclosures inthe financial statements. The procedures selected depend on the auditors' judgement including theassessment of risks of material misstatement of the financial statements whether due to fraud or error.In making those risk assessments we consider internal control relevant to the entity's preparation andfair presentation of the financial statements in order to design audit procedures that are appropriate inthe circumstances but not for the purpose of expressing an opinion on the effectiveness of the entity'sinternal control.
An audit also includes evaluating the appropriateness of the accounting policies used and thereasonableness of accounting estimates made by the directors, as well as evaluating the overall financialstatement presentation.
We believe that the audit evidence we have obtained is sufficient and appropriate to provide a basis forour opinion.
Opinion
In our opinion the financial statement give a true and fair view of the financial position of Bank of SierraLeone as at 31 December 2011, and of its financial performance and cash flows for the year then endedin accordance with International Financial Reporting Standards and the requirements of the Bank ofSierra Leone Act 2011.
Freetown Chartered Accountants
Date:

76
BANK OF SIERRA LEONE
Statement of financial position as at 31 December
RestatedIn thousands of Leones Note 2011 2010 2009Assets
Cash and cash equivalents 15 872,579,690 678,567,070 570,683,317 International Monetary Fund Related Asset 16 742,880,838 831,314,280 573,654,590Loans and advances 17 38,101,206 198,789,921 17,437,122Investment in equity 18 16,696,261 17,550,941 15,973,581Investment securities 19 494,574, 547 435,094,849 365,185,994Property, plant and equipment 20 58,739,776 59,177,854 46,311,444Other assets 21 19,085,555 7,794,820 55,994,568
Total assets 2,242,657,873 2,228,289,735 1,645,240,616
Liabilities
International Monetary Fund SpecialDrawing Rights allocation 22 1,195,774,358 1,117,669,718 693,348,450Deposits from Government 23 15,489,277 130,203,850 338,746,493Deposits from Banks 24 112,532,271 91,687,549 49,544,719Deposit from others 25 38,948,083 29,436,819 30,384,663Other liabilities 26 792,448,061 725,778,786 834,809,157End of service benefit 27 9,967,414 7,801,147 437,754
Total liabilities 2,165,159,464 2,102,577,869 1,947,271,236
EquityShare capital 28 50,000,000 50,000,000 50,000,000General reserve 29(a) (5,294,510) 42,918,947 (237,587,132)Other reserves 29(b) 32,792,919 32,792,919 (114,443,488)
Total equity attributable toequity holders of the Bank 77,498,409 125,711,866 (302,030,620)
Total liabilities and equity 2,242,657,873 2,228,289,735 1,645,230,616
These financial statements were approved by the Board of Directors on 2012
……………………………………………….... ) Governor)))
……………………………………………….... ) Deputy Governor)))
……………………………………………….... ) Directors)))
……………………………………………….... )
The notes on pages 82 to 128 are an integral part of these financial statements

77
ANNUAL REPORT AND STATEMENT OF ACCOUNTS
Statement of comprehensive incomefor the year ended 31 December
RestatedIn thousands of Leones Note 2011 2010
Interest and similar income 7 86,072,286 66,136,705 Interest expenses and similar charges 7 (3,057,307) (2,165,179)
Net interest income 83,014,979 63,971,526
Fees and commission income 8 29,802 31,815Fees and commission expense 8 - -
Net fee and commission income 29,802 31,815
Net exchange (loss)/gain 9 (72,940,987) 288,627,979
Other income 10 834,597 2,424,968
Operating income 10,938,391 355,056,288
Impairment loss on loans and advances17(a) (38,898) (7,902) Personnel expense 11 (36,510,497) (40,301,788) Currency 12 (5,454,691) (36,536,574) Depreciation and amortisation 20 (3,096,857) (2,405,829) Other expenses 13 (17,443,005) (19,196,724)
(Loss)/profit for the year 14 (51,605,557) 256,607,471
Other comprehensive income
Fair value reserve (non negotiable non interestbearing securities):
Net change in fair value - 161,930,000
Net amount transferred to profit or loss - -
Other comprehensive income for the year - 161,930,000
Total comprehensive income for the year (51,605,557) 418,537,471
The notes on pages 82 to 128 are an integral part of these financial statements

78
BANK OF SIERRA LEONE
Statement of comprehensive income (continued)
Restated
In thousands of Leones Note 2011 2010
Loss attributable to:
Equity holders of the Bank (51,605,557) 256,607,471
Loss for the year (51,605,557) 256,607,471
Total comprehensive incomeattributable to:
Equity holders of the Bank (51,605,557) 418,537,471
Total comprehensive income for the year (51,605,557) 418,537,471
These financial statements were approved by the Board of Directors on 2012
………………………………………………...) Governor)))
…………………………………………....…....) Deputy Governor)))
………………………………………….......….) Directors)))
………………………………………….......….)
The notes on pages 82 to 128 are an integral part of these financial statements

79
AN
NU
AL R
EP
OR
T A
ND
STA
TE
ME
NT
OF
AC
CO
UN
TS
Statement of changes in equityfor the year ended 31 December 2011
RestatedIn thousands of Leones Foreign Property Restated
Share exchange revaluation General Othercapital reserve reserve reserves reserves Total
Balance at 1 January 2010 50,000,000 (147,236,407) 32,792,919 (237,587,132) - (302,030,620)Transfer to general reserves - 147,236,407 - (147,236,407) - -Total comprehensive income for the yearNet loss for the year as previously stated - - - (23,344,685) - (23,344,685)Revaluation gain for the year - 286,677,237 - - - 286,677,237Transfer to income statement - (286,677,237) - 286,677,237 - -Loss on sale of marketable securities - - - (6,364,985) - (6,364,985)End of service benefits understated in previous years - - - (6,725,087) - (6,725,081)Securities for prior year losses - - - 15,570,000 - 15,570,000
Other comprehensive incomeFair value reserve (non interest bearing securities)Net change in fair value - - - 161,930,000 - 161,930,000
Total other comprehensive income for the year - - - 161,930,000 - 161,930,000
Other transfersTransfer to foreign exchange reserve - - - - - -
_Total transfers - - - - - -
Total comprehensive income and other transfers - - - - - -
Paid up capital - - - - - -Deposit for shares - - - - - -
Total contribution by and distributors owners - - - - - -
Balance at 31 December 2010 (restated) 50,000,000 - 32,792,919 42,918,947 - 125,711,866
The notes on pages 82 to 128 are in integral part of these financial statements

80
BA
NK
OF
SIE
RR
A LE
ON
EStatement of changes in equity (continued)for the year ended 31 December 2011
In thousands of Leones Foreign PropertyShare exchange revaluation General Other
capital reserve reserve reserves reserves Total
Balance at 1 January 2011 50,000,000 - 32,792,919 42,918,947 - 125,711,866Total comprehensive income for the year (restated)Net loss for the year - - - (51,605,557) - (51,605,557)Revaluation gain for the year - - - - - -Profit on sale of marketable securities - - - 3,392,100 - 3,392,100Securities for prior year losses - - - - - -Other comprehensive incomeFair value reserve (non interest bearing securities) - - - - - - Net change in fair value - - - - - -Net amount transferred to profit or loss - - - - - -
Total other comprehensive income for the year - - - - - -
Other transfersTransfer to foreign exchange reserve - - - - - -
Total transfers - - - - - -
Total comprehensive income and other transfers - - - (48,212,182) - (48,212,182)
Paid up capital - - - - - -Deposit for shares - - - - - -
Total contribution by and distributors owners - - - - - -
Balance at 31 December 2011 50,000,000 - 32,792,919 (5,294,510) - 77,498,409
The notes on pages 82 to 128 are an integral part of these financial statements

81
ANNUAL REPORT AND STATEMENT OF ACCOUNTS
Statement of cash flowsfor the year ended 31 December
In thousands of Leones Note 2011 2010
Cash flows from operating activities
Loss for the year (51,605,557) 256,607,471Adjustment for:
Depreciation and amortisation 20 3,096,857 2,405,829Impairment losses on loans and advances 38,898 7,902Net interest income 17(a) (83,014,979) (63,971,526)Fixed asset write-off 70,606 -Impairment of property, plant and equipment - 809,029
(131,414,175) 195,858,705Changes in loans and advances 160,649,817 (181,360,701)Changes in other assets (11,290,735) 48,199,748Changes in government deposit (114,714,573) (208,542,643)Changes in other deposits 30,355,986 41,194,986Changes in other liabilities 66,669,275 (109,030,371)Changes in end of service benefit 2,166,267 7,363,393
2,421,862 (206,316,883)Interest received 7 86,072,286 66,136,705Interest paid 7 (3,057,307) (2,165,179)
Net cash generated from/(utilised in) operating activities 85,436,841 (142,345,357)
Cash flows from investing activities
Purchase of Investment Securities (59,479,698) (69,908,855)Medium term bond disposal/(acquisition) 854,680 (1,577,360)Acquisition of property and equipment (2,729,385) (16,081,268)Proceeds from the sale property and equipment - -
Net cash used in investing activities (61,354,403) (87,567,483)
Cash flows from financing activities
Net change in funds from the IMF 166,538,082 166,661,578Net movement in reserves 3,392,100 171,135,015
Net cash from financing activities 169,930,182 337,796,593
Net increase in cash and cash equivalents 194,012,620 107,883,753Cash and cash equivalents at 1 January 678,567,070 570,683,317Effect of foreign exchange rate changes on cashand cash equivalent held or due in foreign currency - -
Cash and cash equivalent at 31 December 15 872,579,690 678,567,070
The notes on pages 82 to 128 are an integral part of these financial statements

82
BANK OF SIERRA LEONE
Notes to the financial statements
1. Reporting entity
The Bank of Sierra Leone is domiciled in Sierra Leone and wholly owned by the Governmentof Sierra Leone. The address of the Bank's registered office is 30 Siaka Stevens Street Freetown.The Bank is primarily established to foster the liquidity, solvency and proper functioning of astable market-based financial system and to license and supervise institutions that engage in thebusiness of receiving money deposits or other repayable funds from the public and extendingcredits for their own account, including bureaux of exchange and foreign exchange dealers.
2. Basis of preparation
(a) Statement of compliance
The financial statements have been prepared in accordance with International FinancialReporting Standards (IFRS), as issued by the International Accounting Standards Board(IASB)
(b) Basis of measurement
The financial statements have been prepared on the historical cost basis except foravailable for sale financial assets measured at fair value.
(c) Functional and presentation currency
These financial statements are presented in Leones, which is the Bank's functionalcurrency. All financial information presented in Leones has been rounded to the nearestthousand.
(d) Use of estimates and judgments
The preparation of financial statements in conformity with IFRSs requires managementto make judgements, estimates and assumptions that affect the application of accountingpolicies and the reported amounts of assets, liabilities, income and expenses. Actualresults may differ from these estimates.
Estimates and underlying assumptions are reviewed on an ongoing basis. Revisions toaccounting estimates are recognised in the period in which the estimates are revised ifthe revision affects only that period, or in the period of the revision and future periods,if the revision affects both current and future periods.
Information about significant areas of estimation uncertainty and critical judgements inapplying accounting policies that have the most significant effect on the amountsrecognised in the financial statements is included in note 5.

83
ANNUAL REPORT AND STATEMENT OF ACCOUNTS
Notes to the financial statements (continued)
2. Basis of preparation
In particular information about assumption and estimation uncertainties that have a significantrisk of resulting in a material adjustment within the next financial year are included in the followingnotes:
Note 3g (vi), L and 17 - Measurement of the recoverableamount of receivables
Note 3(q) and 27 - Measurement of employee benefitsNote 3(o), 3(p), 26 and 30 - Provision and contingencies
3. Significant accounting policies
The accounting policies set out below have been applied consistently to all periods presented inthese financial statements by the Bank.
Certain comparative amounts have been reclassified to conform with the current year'spresentation.
(a) Foreign currency
Transactions in foreign currencies are translated to the functional currency of the Bank at exchangerates at the dates of the transactions. Monetary assets and liabilities denominated in foreigncurrencies at the reported date are retranslated to the functional currency at the exchange rateat that date. The foreign currency gain or loss on monetary items is the difference betweenamortised cost in the functional currency at the beginning of the period, adjusted for effectiveinterest and payments during the period and the amortised cost in foreign currency translated atthe exchange rate at the end of the period.
Non monetary assets and liabilities denominated in foreign currencies that are measured at fairvalue are retranslated to the functional currency at the exchange rate at the date that the fairvalue was determined. Foreign currency differences arising as retranslation are recognised inthe profit and loss account as required by the Bank of Sierra Leone Act 2011, except fordifferences arising on the retranslation of available-for-sale equity instruments.
(b) Interest
Interest income and expenses are recognized in the income statement for all interest-bearinginstruments on an accrual basis, using the effective interest rate method.
The recognition of interest ceases when the payment of interest or principals is in doubt. Interestis included in income thereafter, only when it is received.
The effective interest rate is the rate that exactly discounts the estimated future cash paymentsand receipts through the expected life of the financial asset or liability (or, which appropriate, ashorter period) to the carrying amount of the financial asset or

84
BANK OF SIERRA LEONE
Notes to the financial statements (continued)
3. Significant accounting policies (continued)
Interest (continued)
liability. The effective interest rate is established on initial recognition of the financial asset andliability and is not revised subsequently.
The calculation of the effective interest rate includes all fees and interest paid or received,transaction costs, and discounts or premiums that are an integral part of the effective interestrate.
Transaction costs are incremental costs that are directly attributable to the acquisition, issue ordisposal of a financial asset or liability.
Interest income and expenses presented in the income statement include interest on financialassets and liabilities at amortised cost on an effective interest rate basis.
Interest income and expense on all trading assets and liabilities are considered to be incidentalto the Bank's trading operations and are presented together with all other changes in the fairvalue of trading assets and liabilities in net trading income.
(c) Fees and commissions
Fees and commissions income and expenses that are integral to the effective interest rateon a financial asset or liability are included in the measurement of the effective interestrate.
Other fees and commission income, including account servicing fees, investmentmanagement fees sales commission, placement fees and syndication fees, are recognisedas the related services are performed.
Other fees and commission expense relates mainly to transaction and service fees, whichare expensed as the services are received.
(d) Net exchange gains/losses
Net exchange gains/losses comprises gains less losses related to conversion of foreignmonetary assets and liabilities and includes all realised and unrealised fair value changes,interest, and foreign exchange differences.

85
ANNUAL REPORT AND STATEMENT OF ACCOUNTS
Notes to the financial statements (continued)
3. Significant accounting policies (continued)
(e) Lease payments made
Payments made under operating leases are recognised in profit or loss on a straight linebasis over the term of the lease. Lease incentives received are recognised as an integralpart of the total lease expense, over the term of the lease.
Minimum lease payments made under finance leases are apportioned between the financeexpense and the reduction of the outstanding liability. The finance expense is allocatedto each period during the lease term so as to produce a constant periodic rate of intereston the remaining balance of the liability. Contingent lease payments are accounted forby revising the minimum lease payments over the remaining term of the lease when thelease adjustment is confirmed.
(f) Income tax expense
In accordance with section 70 (3) of the Bank of Sierra Leone Act 2011, the profits ofthe Bank are not liable to Income Tax, or any other tax.
(g) Financial assets and liabilities
(i) Recognition
The Bank initially recognises loans and advances and deposits on the date thatthey are originated. All other financial assets and liabilities including assets andliabilities designated at fair value through profit or loss are initially recognised onthe trade date at which the Bank becomes a party to the contractual provisionsin the instrument.
(ii) Derecognition
The Bank derecognises a financial asset when the contractual rights to the cashflows from the asset expire, or it transfers the right to receive the contractualcash flows on the financial asset in a transaction in which substantially all therisks and rewards of ownership of the financial assets are transferred. Anyinterest in transferred financial assets that is created or retained by the Bank isrecognised as a separate asset or liability.
The Bank derecognises a financial liability when its contractual obligations aredischarged or cancelled or expire.
The Bank enters into transactions whereby it transfers assets recognised on itsbalance sheet, but retains either all risk and rewards of the transferred assets ora portion of them. If all or substantially all risks and rewards are retained, thenthe transferred assets are not derecognised from the balance sheet. Transfers ofassets with retentions of all or substantially all risks and rewards include, forexample securities lending and repurchase transaction.

86
BANK OF SIERRA LEONE
Notes to the financial statements (continued)
3. Significant accounting policies (continued)
Financial assets and liabilities (continued)
When assets are sold to a third party with a concurrent total rate of return swap on the transferredassets, the transaction is accounted for as a secured financing transaction similar to repurchasetransactions. In transactions where the Bank neither retains nor transfers substantially all therisks, and rewards of ownership of a financial asset it derecognises the assets if control over theasset is lost.
The rights and obligations retained in the transfer are recognised separately as assets and liabilitiesas appropriate. In transfers where control over the asset is retained, the Bank continues torecognise the asset to the extent of its continuing involvement, determined by the extent to whichit is exposed to changes in the value of the transferred asset.
In certain circumstances the Bank retains rights to service a transferred financial asset for a fee.The transferred asset is derecognised in its entirety if it meets the derecognition criteria. An assetor liability is recognised for the servicing rights, depending on whether the servicing fee is morethan adequate to cover servicing expenses (asset) or is less than adequate for performing theservicing (liability).
(iii) Offsetting
Financial assets and liabilities are set off and the net amount presented in the statementof financial position when, and only when the Bank has a legal right to set off the amountsand intends either to settle on a net basis or to realise the asset and settle the liabilitysimultaneously.
Income and expenses are presented on a net basis only when permitted by the accountingstandards, or for gains and losses arising from a group of similar transactions such as inthe Bank's trading activity.
(iv) Amortised cost measurement
The amortised cost of a financial asset or liability is the amount at which the financialasset or liability is measured at initial recognition, minus principal repayments, plus orminus the cumulative amortisation using the effective interest method of any differencesbetween the initial amount recognised and the maturity amount minus any reduction forimpairment.

87
ANNUAL REPORT AND STATEMENT OF ACCOUNTS
Notes to the financial statements (continued)
3. Significant accounting policies (continued)
Financial assets and liabilities (continued)
(v) Fair value measurement
The determination of fair value of financial assets and financial liabilities is based onquoted market prices or dealer price quotation for financial instruments traded in activemarkets. For all other financial instruments, fair value is determined by using valuationtechniques. Valuation techniques include the net present value techniques, the discountedcash flow method, comparison to similar instruments for which market observable pricesexist, and valuation models. The Bank uses widely recognised valuation models fordetermining the fair value of common and more simple financial instruments likeinterest rate and currency swaps. For these financial instruments, inputs into models aremarket observable.
For more complex instruments, the Bank uses probability models which usually aredeveloped from recognised valuation models. Some or all of the inputs to these modelsmay not be market observable, and are derived from market prices or rates or areestimated based on assumptions. When entering into a transaction, the financialinstrument is recognised initially at the transaction price which is the best indication offair value, although the value obtained from the valuation model may differ from thetransaction price. This initial difference usually an increase, in the fair value indicatedby valuation techniques is recognised in income depending upon the individual facts andcircumstances of each transaction and not later than when the market data becomesobservable.
The value produced by a model or other valuation technique is adjusted to allow for anumber of factors as appropriate, because valuation techniques cannot appropriatelyreflect all factors market participants take into account when entering into a transaction.
Valuation adjustments are recorded to allow for model risks, bid risk spreads, liquidityprices, as well as other factors. Management believes that these valuation adjustmentsare necessary and appropriate to fairly state financial instruments carried at fair valueon the balance sheet.
(vi) Identification and measurement of impairment
At each financial position date the Bank assesses whether there is objective evidencethat financial assets not carried at fair value through profit or loss are impaired. Financialassets are impaired when objective evidence demonstrates that a loss event has occurredafter the initial recognition of the asset, and that the loss event has an impact on thefuture cash flows on the asset that can be estimated reliably.

88
BANK OF SIERRA LEONE
Notes to the financial statements (continued)
3. Significant accounting policies (continued)
Financial assets and liabilities (continued)
Identification and measurement of impairment
The Bank considers evidence of impairment at both a specific asset and collectivelevel. All individually significant financial assets are assessed for specific impairment.All significant assets found not to be specifically impaired are then collectively assessedfor any impairment that has been incurred but not yet identified. Assets that are notindividually significant are then collectively assessed for impairment by grouping togetherfinancial assets (carried at amortised cost) with similar risk characteristics.
Impairment losses on assets carried at amortised cost are recognised in statement ofcomprehensive income and reflected in an allowance account against loans and advances.
When a subsequent event causes the amount of impairment loss to decrease, theimpairment loss is reversed through the statement of comprehensive income.
However, any significant recovery in the fair value of an impaired available-for-saleequity security is recognised directly in equity. Changes in impairment provisionattributable to time value are reflected as a component of interest income.
(h) Cash and cash equivalents
Cash and cash equivalents include notes and coins on hand and balances with otherforeign central Banks and highly liquid financial assets with original maturities of lessthan three months, which are subject to insignificant risk of changes in their value andare used by the Bank in the management of its short-term commitments.
Cash and cash equivalents are carried at amortised cost in the balance sheet.
(i) Loans and advances
Loans and advances are non-derivative financial assets with fixed or determinablepayments that are not quoted in an active market and that the Bank does not intend tosell immediately or in the near term
When the Bank is the lessor in a lease agreement that transfers substantially all of therisks and rewards incidental to ownership of an asset to the lessee, the arrangement ispresented within loans and advances.
Loans and advances are initially measured at fair value plus incremental direct transactioncosts, and subsequently at their amortised cost using the effective interest method.

89
ANNUAL REPORT AND STATEMENT OF ACCOUNTS
Notes to the financial statements (continued)
3. Significant accounting policies (continued)
(j) Investment securities
Investment securities are initially measured at fair value plus incremental direct transactioncosts and subsequently accounted for depending on their classification as either held-to-maturity, fair value through profit or loss, or available-for-sale.
(i) Held-to-maturity
Held-to-maturity investments are non-derivative assets with fixed ordeterminable payments and fixed maturity that the Bank has the positive intentand ability to hold to maturity, and which are not designated at fair value throughprofit or loss or available-for-sale.
Held-to-maturity investments are carried at amortised cost using the effectiveinterest method. Any sale or reclassification of a significant amount of held-to-maturity investments not close to their maturity would result in the reclassificationof all held-to-maturity investments as available-for-sale, and prevent the Bankfrom classifying investment securities as held-to-maturity for the current andthe following two financial years.
(ii) Available-for-sale
Available-for-sale investments are non-derivative investments that are notdesignated as another category of financial assets. Unquoted equity securitieswhose fair value cannot be reliably measured are carried at cost. All otheravailable-for-sale investments are carried at fair value.
Interest income is recognised in profit or loss using the effective interest method.Foreign exchange gains or losses on available-for-sale debt security investmentsare recognised in profit or loss.
Other fair value changes are recognised directly in equity until the investment issold or impaired and the balance in equity is recognised in profit or loss.

90
BANK OF SIERRA LEONE
Notes to the financial statements (continued)
3. Significant accounting policies (continued)
(k) Property and equipment
(i) Recognition and measurement
All property, plant and equipment are stated at cost less accumulated depreciation andaccumulated impairment losses.
Cost includes expenditures that are directly attributable to the acquisition of the asset.Purchase software that is integral to the functionality of the related equipment is capitalizedas part of that equipment.
When parts of an item of property or equipment have different useful lives, they areaccounted for as separate items (major components) of property and equipment.
(ii) Subsequent costs
Subsequent costs are included in the asset's carrying amount or are recognised as aseparate asset as appropriate, only when it is probable that future economic benefitsassociated with the items will flow to the Bank and the cost of the items can be measuredreliably. All other repairs and maintenance are charged to the income statement duringthe financial period in which they are incurred. Major improvements are capitalised
(iii) Depreciation
Freehold premises are depreciated over a maximum of fifty years. For leaseholdproperties, where the unexpired lease term is more than fifty years, depreciation ischarged over fifty years. Where the unexpired lease term is less than fifty years, thevalue of the leasehold property is amortised over the periods appropriate to the relevantlease terms on a straight line basis.
Motor vehicles, equipment and fixtures and fittings are depreciated on a straight linebasis over its estimated useful life, principally between 3 and 8 years.
The assets' residual values and useful lives are reviewed and adjusted, if appropriate ateach balance sheet date. Gains and losses on disposals are determined by comparingproceeds with carrying amount. These are included in the income statement.

91
ANNUAL REPORT AND STATEMENT OF ACCOUNTS
3. Significant accounting policies (continued)
(l) Leased assets - Lessee
Leases in terms of which the Bank assumes substantially all the risks and rewards ofownership are classified as finance leases. Upon initial recognition the leased asset ismeasured at an amount equal to the lower of its fair value and the present value of theminimum lease payments. Subsequent to initial recognition, the asset is accounted forin accordance with the accounting policy applicable to that asset. Other leases areoperating leases and they are not recognised on the Bank's balance sheet.
(m) Impairment of non-financial assets
The carrying amounts of the Bank's non-financial assets, are reviewed at each reportingdate to determine whether there is any indication of impairment. If any such indicationexists then the asset's recoverable amount is estimated.
An impairment loss is recognised if the carrying amount of an asset or its cash-generatingunit exceeds its recoverable amount. A cash-generating unit is the smallest identifiableasset group that generates cash flows that largely are independent from other assetsand groups. Impairment losses are recognised in profit or loss. Impairment lossesrecognised in respect of cash-generating units are allocated first to reduce the carryingamount of any goodwill allocated to the units and then to reduce the carrying amount ofthe other assets in the unit on a pro rata basis.
The recoverable amount of an asset or cash-generating unit is the greater of its value inuse and its fair value less costs to sell. In assessing value in use, the estimated futurecash flows are discounted to their present value using a pre-tax discount rate that reflectscurrent market assessments of the time value of money and the risks specific to theasset.
Impairment losses recognised in prior periods are assessed at each reporting date forany indications that the loss has decreased or no longer exists. An impairment loss isreversed if there has been a change in the estimates used to determine the recoverableamount. An impairment loss is reversed only to the extent that the asset's carryingamount does not exceed the carrying amount that would have been determined, net ofdepreciation or amortisation, if no impairment loss had been recognised.
(n) Deposits
Deposits are initially measured at fair value, with fair value plus transaction costs, andsubsequently measured at their amortised cost using the effective interest method.

92
BANK OF SIERRA LEONE
Notes to the financial statements (continued)
3. Significant accounting policies (continued)
(o) Provisions
A provision is recognised if, as a result of a past event, the Bank has a present legal orconstructive obligation that can be estimated reliably, and it is probable that an outflowof economic benefits will be required to settle the obligation. Provisions are determinedby discounting the expected future cash flows at a pre-tax rate that reflects currentmarket assessments of the time value of money and, where appropriate, the risks specificto the liability.
A provision for restructuring is recognised when the Bank has approved a detailed andformal restructuring plan, and the restructuring either has commenced or has beenannounced publicly. Future operating costs are not provided for.
A provision for onerous contracts is recognised when the expected benefits to be derivedby the Bank from are lower than the unavoidable cost of meeting its obligations underthe contract. The provision is measured at the present value of the lower of the expectedcost of terminating the contract and the expected net cost of continuing with the contract.Before a provision is established, the Bank recognises any impairment loss on the assetsassociated with that contract.
(p) Financial guarantees
Financial guarantees are contracts that require the Bank to make specified payments toreimburse the holder for a loss it incurs because a specified debtor fails to make paymentwhen due in accordance with the terms of a debt instrument.
All financial guarantee liabilities are disclosed by way of notes in the financial statementsand are only included in other liabilities if the liability has crystalised or becomes probablethat it will crystalise.
(q) Employee benefits
(i) Short term benefits
Short term employee benefit obligations are measured on an undiscounted basis andare expensed as the related services provided.
A provision is recognised for the amount expected to be paid under short term cashbonus or profit sharing plans if the Bank has a present legal and constructive obligationto pay this amount as a result of past service provided by the employee, and the obligationcan be reliably estimated.

93
ANNUAL REPORT AND STATEMENT OF ACCOUNTS
Notes to the financial statements (continued)
3. Significant accounting policies (continued)
Employee benefits (continued
(ii) Defined contribution plan
The Bank contributes towards a defined contribution plan. The plan is funded throughpayments to the National Social Security and Insurance Trust (NASSIT). This definedcontribution plan is a Pension Scheme under which the Bank pays fixed contributionsinto a separate entity. The Bank has no legal or constructive obligations to pay furthercontributions if the Scheme does not hold sufficient assets to pay all employees thebenefit relating to employee service in the current and prior periods and has no furtherpayment obligations once the contributions have been paid. The contributions areexpensed as an employee benefits expense when due.
(iii) Defined benefit plan
The bank provides end of service benefits to its retirees. The entitlement to these benefitsis conditional on the completion of a minimum service period. End of service benefit is apost-employment benefit plan. The liability recognised in the statement of financial positionis the present value of the end of service benefits obligation at the financial position date,together with adjustments for actuarial gains or losses and past service costs. The presentvalue of the obligation is determined by discounting the estimated future cash outflowstaking into account average service period and salary increases and using interest ratesof Government treasury bonds that are denominated in Leones, the currency in whichthe obligation will be paid and that matures in one year's time. The calculation is performedby actuary using the projected unit credit method.
The bank recognises all actuarial gains and losses from end of service benefits in profitor loss.
(iii) Termination benefits
Termination benefits are payable when employment is terminated by the Bank beforethe normal retirement date, or whenever an employee accepts voluntary redundancy inexchange for these benefits. The Bank recognises termination benefits when it isdemonstrably committed to either: terminating the employment of current employeesaccording to a detailed formal plan without possibility of withdrawal; or providingtermination benefits as a result of an offer made to encourage voluntary redundancy.Benefits falling due more than 12 months after the balance sheet date are discounted topresent value.

94
BANK OF SIERRA LEONE
Notes to the financial statements (continued)
3. Significant accounting policies (continued)
(r) Share capital and reserves
(i) Share capital
The Bank classifies capital instruments as financial liabilities as equity instrumentsin accordance with the substance of the contractual terms of the instrument.Sections 10(1) and 81 of the Bank of Sierra Leone Act 2011 require that theminimum paid up capital of the Bank must be Le 125bn, to be subscribedwithin five years from commencement of the Act (that is commencing from 24November 2011). The capital has not been fully subscribed.
ii) Share issue costs
Incremental costs directly attributable to the issue of an equity instrument arededucted from the initial measurement of the equity instruments.
(s) New standards and interpretations not yet adopted
A number of new standards, amendments to standards and interpretations are not yeteffective for the period ended 31 December 2011, and have not been applied in preparingthese financial statements. The new standards, amendments and interpretations will beapplied if relevant to the Bank at their respective effective dates. These include thefollowing:
Standardsamendmentsand Effectiveinterpretations Description date
Financial Instruments 2009 and 2010IFRS 9 (2009 and 2010) is the first standardissued as part of a wider project to replace IAS 39.IFRS 9 retains but simplifies the mixedmeasurementmodel and established two primary measurementcategories for financial assets: amortised cost and fairvalue.
The basis of classification depends on the entity'sbusiness model and the contractual cash flowcharacteristics of the financial asset.
The standard will not have any impact as the Bank'sinvestment securities have usually being reported atamortised cost.
1 January2015
IFRS 9

95
ANNUAL REPORT AND STATEMENT OF ACCOUNTS
Notes to the financial statements (continued)
3. Significant accounting policies (continued)
New standards and interpretations not yet adopted (continued)
Standardsamendmentsand Effectiveinterpretations Description date
IFRS 10 IFRS 10 Consolidated Financial Statementsestablishes principles for the presentation andpreparation of consolidated financial statementswhen an entity controls one or more other entities.The IFRS supersedes IAS 27 Consolidated andSeparate Financial Statements and SIC-12Consolidation-Special Purpose Entities.
This standard is not expected to have any impacton the financial statements of the bank as the bankdoes not have any subsidiaries.
IFRS 11 Joint ArrangementsIFRS 11 Joint Arrangements establishes principlesfor financial reporting by parties to a jointarrangement. The IFRS supersedes IAS 31Interests in Joint Ventures and SIC-13 JointlyControlled Entities-Non-Monetary Contributions byVenturers.
This standard is not expected to have any impacton the financial statements of the bank as the bankdoes not have any joint arrangements.
1 January2013
1 January2013

96
BANK OF SIERRA LEONE
Notes to the financial statements (continued)
3. Significant accounting policies (continued)
New standards and interpretations not yet adopted (continued)
Standardsamendmentsandinterpretations Description
IFRS 12 IFRS 12 Disclosure of Interests in Other Entities appliesto entities that have an interest in a subsidiary, a jointarrangement, an associate or an unconsolidated structuredentity.
This standard is not expected to have any impact on thefinancial statements of the bank as the bank does nothave any interests in other entities.
IFRS 13 Fair value measurement
Financial Reporting Standard 13 Fair Value Measurement(IFRS 13):
(a) defines fair value;
(b) sets out in a single IFRS a framework for measuringfair value; and
(c) requires disclosures about fair value measurements.
The IFRS applies to IFRSs that require or permit fairvalue measurements or disclosures about fair valuemeasurements (and measurements, such as fair value lesscosts to sell, based on fair value or disclosures aboutthose measurements), except in specified circumstances.
The IFRS explains how to measure fair value for financialreporting. It does not require fair value measurements inaddition to those already required or permitted by otherIFRSs and is not intended to establish valuation standardsor affect valuation practices outside financial reporting.
This standard is not expected to have any impact on thefinancial statements of the bank as most of the bank'sfinancial instruments are carried at amortised cost.
1January2013
EffectiveDate
1 January2013

97
ANNUAL REPORT AND STATEMENT OF ACCOUNTS
Notes to the financial statements (continued)
3. Significant accounting policies (continued)
New standards and interpretations not yet adopted (continued)
Standardsamendmentsand Effectiveinterpretation Description Datenot yet adopted
IAS 19 Employee benefits (Revised 2011)
IAS 19 was amended in June 2011, which alsoresulted in amendments to other IFRSs, an entity shallapply these amendments when it applies IAS 19 asamended.
IAS 27 Separate Financial Statements (Amended 2011)
IAS 27 Separate Financial Statements containsaccounting and disclosure requirements forinvestments in subsidiaries, joint ventures andassociates when an entity prepares separate financialstatements.
The Standard requires an entity preparing separatefinancial statements to account for those investmentsat cost or in accordance with IFRS 9 FinancialInstruments.
This standard is not expected to have any impact onthe financial statements of the bank as the bank hasno investment in subsidiaries, joint ventures andassociates.
IAS 28 Investments in Associates and Joint Ventures(Amended 2011)
International Accounting Standard 28 Investments inAssociates and Joint Ventures (IAS 28) prescribesthe accounting for investments in associates and setsout the requirements for the application of the equitymethod when accounting for investments in associatesand joint ventures.
This standard is not expected to have any impact onthe financial statements of the bank as the bank hasno investment in associates.
1 January2013
1 January2013
1 January2013

98
BANK OF SIERRA LEONE
Notes to the financial statements (continued)
3. Significant accounting policies (continued)
New standards and interpretations not yet adopted (continued)
Standardsamendmentsand Effectiveinterpretation Description datenot yet adopted
Amendment to Presentation of Items of Other Comprehensive IncomeIAS 1 (OCI)
The main change resulting from the amendments was arequirement for entities to group items presented in OCIon the basis of whether they are potentially reclassifiableto profit or loss subsequently (reclassificationadjustments). The amendments did not address whichitems are presented in OCI.
Amendment to Deferred Tax: Recovery of Underlying AssetsIAS 12 The amendments provide a practical approach for
measuring deferred tax liabilities and deferred tax assetswhen investment property is measured using the fairvalue model in IAS 40 Investment Property.
This standard is not expected to have any impact on thefinancial statements of the bank as the bank does nothave any investment property.
Amendment to Offsetting Financial Assets and Financial LiabilitiesIAS 32
This amendment deals with the criterion that an entity'currently has a legally enforceable right to set off therecognised amounts.
Amendment to Disclosure - Offsetting Financial Assets and FinancialIFRS 7 Liabilities
This amendments to IFRS 7, issued in December 2011,amended the required disclosures to include informationthat will enable users of an entity's financial statementsto evaluate the effect or potential effect of nettingarrangements, including rights of set-off associated withthe entity's recognised financial assets and recognisedfinancial liabilities, on the entity's financial position.
1July 2012
1January2012
1January2014
1January2013

99
ANNUAL REPORT AND STATEMENT OF ACCOUNTS
Notes to the financial statements (continued)
3. Significant accounting policies (continued)
New standards and interpretations not yet adopted (continued)
New Standardsandinterpretations Effectivenot yet adopted Description date
IFRIC 20 This Interpretation applies to waste removal costsStripping Costs that are incurred in surface mining activity during thein theProduction production phase of the mine ('production strippingPhase of a in the costs'). This Interpretation addresses theSurface Mine following issues:
(a) recognition of production stripping costs as an asset;
(b) initial measurement of the strippingactivity asset; and
(c) subsequent measurement of the strippingactivity asset.
This is not expected to have any impact on thebank as the bank is not engaged in miningactivities
(t) Comparatives
Where necessary comparative figures have been adjusted to conform to changes inpresentation in the current year.
1 July 2015

100
BANK OF SIERRA LEONE
Notes to the financial statements (continued)
4. Financial risk management
(a) Introduction and overview
The Bank has exposure to the following risks from its use of financial instruments:
l Credit riskl Liquidity riskl Market risksl Operational risks
This note presents information about the Bank's exposure to each of the above risks,the Bank's objectives, policies and processes for measuring and managing risk, and theBank's management of capital.
Risk management framework
The Bank's management seeks to ensure that strong and effective risk management andcontrol systems are in place for assessing, monitoring and managing risk exposure.Specialist staff conducts the Bank's local currency, foreign currency reserve management,and foreign exchange dealing operations in accordance with a clearly defined riskmanagement framework, delegated functions and limits set by the Governor.
The Bank is subject to an annual external audit for which the Auditor General takesresponsibility either by conducting the audit or appointing an auditor as prescribed inSection 59 of the Bank of Sierra Leone Act 2011. Auditing arrangements are overseenby an Audit Committee of the Board which meets regularly to monitor the financialreporting and audit functions within the Bank. The committee reviews the internal auditfunction and when necessary, should have direct access to the External Auditor. Thecommittee reports to the Board of Directors on its activities.
Risk management policies are established to identify and analyse the risks faced by theBank, to set appropriate risk limits and controls, and to monitor risks and adherence tomarket conditions, products and services offered. The Bank, through its training andmanagement standards and procedures, aims to develop a disciplined and constructivecontrol environment, in which all employees understand their roles and obligations.
The Audit Committee of the Board is responsible for monitoring the adequacy of theaccounting and other records and internal control systems. Its other functions includereviewing the internal audit and management reports.
(b) Credit risk
Credit risk is the risk of financial loss to the Bank if counterparty to a financial instrumentfails to meet its contractual obligations, and arises principally from the investments inforeign debt securities and short to medium term cash deposits.

101
ANNUAL REPORT AND STATEMENT OF ACCOUNTS
Notes to the financial statements (continued)
4. Financial risk management (continued)
Credit risk (continued)
Management of credit risk
The Bank minimizes exposure to credit risk related to investment made in foreign debt securitiesand short term deposits by establishing limits on investments with different credit quality. Creditquality is evaluated on the basis of the ratings set by the International rating agencies. The bulkof the funds is placed with triple "A" rated Banks (i.e. Central Banks and other internationalfinancial institutions such as BIS and IMF) as approved by the Foreign Asset Committee (FAC),Management and the Board. For risk management purposes, credit risk arising on tradingsecurities is managed independently, but reported as a component of market risk exposure.
The maximum loss that the Bank would suffer as a result of a security issuer defaulting is thevalue reported in the statement of financial position.
RestatedConcentration analysis 2011 2010
Assets
United States Dollars 642,435,510 541,165,855Euro 74,170,523 61,863,744Pound sterling 168,946,669 87,688,219SDR 742,880,838 831,728,688Leones and others 614,224,333 705,843,229
Total 2,242,657,873 2,228,289,735
Liabilities
United States Dollars 49,068,157 58,986,794Euro - 1,870,361Pound sterling - -SDR 1,195,774,357 1,117,669,718Leones & others 920,316,950 924,050,996
Total 2,165,159,464 2,102,577,869

102
BANK OF SIERRA LEONE
Notes to the financial statements (continued)
4. Financial risk management (continued)
Credit risk (continued)
Management of credit risk
Credit exposure by Credit Rating
The following table represents the Bank's financial assets based on Standard and Poor's creditrating of the issuer. AAA is the highest quality rating possible and indicates that the entity has anextremely strong capacity and A is an upper medium grade, indicating a strong capacity to payinterest and principal. BBB is the lowest investment grade rating, indicating a medium capacityto pay interest and principal. N/R indicated that the entity has not been rated by Standard andPoor's.
Credit rating 2011 % of FA 2010 % of FACash balances with centralbanks AAA 559,134,598 25.8% 508,427,380 23.5%Other cash balances AA 313,445,092 14.5% 170,141,040 7.9%International MonetaryFund assets NR 742,880,838 34.3% 831,314,280 38.5%Loans and advances to Bank NR 38,101,206 1.8% 198,789,921 9.2%Investment in equity NR 16,696,260 0.8% 17,550,941 0.8%Investment securities NR 494,574,547 22.8% 435,094,849 20.1%
2,164,832,541 100% 2,161,318,411 100%
(c) Liquidity risk
Liquidity risk is the risk that the Bank may not be able to accommodate decreases inliabilities or fund decrease in assets in full at the time that a commitment or transaction isdue for settlement. In the case of the Bank, this risk is not relevant to domestic assetsand liabilities because of the ability of the Bank to create Leones when required. However,the Bank does face liquidity risk in respect of foreign assets and liabilities.
Management of liquidity risk
The Bank manages its foreign's liquidity risks through the appropriate structuring of itsforeign investment portfolios to ensure that the maturity profile of foreign assets sufficientlymatch those of foreign commitments. This is monitored and managed on a daily basis.In addition, the foreign investment portfolio of the Bank includes sufficient short-term,highly liquid investment instruments.
The table below analyses the financial liabilities into relevant maturity groupings basedon the remaining period at balance sheet date to contractual maturity date.
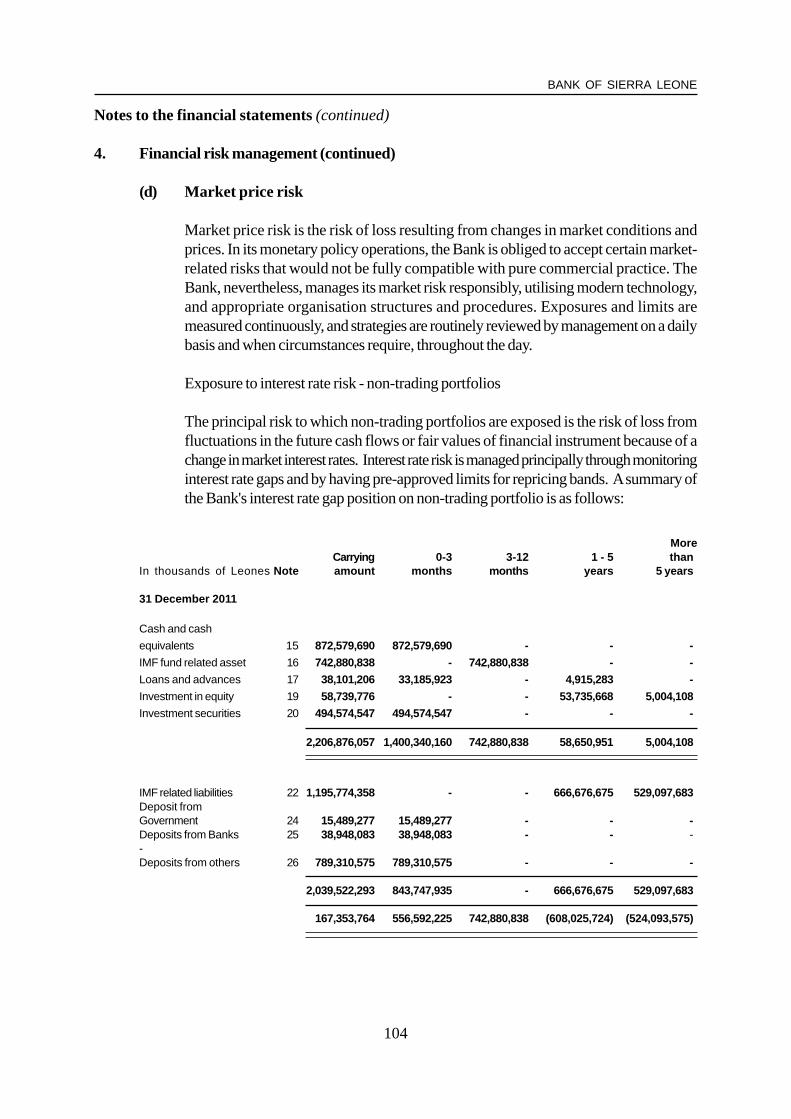
103
AN
NU
AL R
EP
OR
T A
ND
STA
TE
ME
NT
OF
AC
CO
UN
TS
Notes to the financial statements (continued)
4. Financial risk management (continued)
Liquidity risk (continued)
Residual contractual maturities of financial liabilities
In thousands of Leones Up to 1 1 to 3 3 months 1 to 5 Over fiveNotes month months to 1 year years 5 years Total
31 December 2011
Non-derivative liabilities
IMF Special drawing rights allocation 22 - - - 666,676,675 529,097,6831,195,774,358Deposits from Government 23 15,489,277 - - - - 15,489,277Deposit from Banks 24 112,532,271 - - - - 112,532,271Deposit from others 25 38,948,083 - - - - 38,948,083Other liabilities 26 714,173,244 - - 29,206,661 49,068,156 792,448,061End of service benefit 27 - - - 9,967,414 - 9,967,414
881,142,875 - - 705,850,750 578,165,8392,165,159,464
31 December 2010
Non-derivative liabilities
IMF Special drawing rights allocation 22 - - - 474,322,135 643,347,583 1,117,669,718Deposits from Government 23 130,203,850 - - - 130,203,850Deposit from Banks 24 91,687,549 - - - 91,687,549Deposit from others 25 29,436,819 - - - 29,436,819Other liabilities 26 636,616,123 - - 28,178,431 60,984,232 725,778,786End of service benefit 27 - - - 7,801,147 - 7,801,147
887,944,341 - - 510,310,713 704,331,8152,102,577,869

104
BANK OF SIERRA LEONE
Notes to the financial statements (continued)
4. Financial risk management (continued)
(d) Market price risk
Market price risk is the risk of loss resulting from changes in market conditions andprices. In its monetary policy operations, the Bank is obliged to accept certain market-related risks that would not be fully compatible with pure commercial practice. TheBank, nevertheless, manages its market risk responsibly, utilising modern technology,and appropriate organisation structures and procedures. Exposures and limits aremeasured continuously, and strategies are routinely reviewed by management on a dailybasis and when circumstances require, throughout the day.
Exposure to interest rate risk - non-trading portfolios
The principal risk to which non-trading portfolios are exposed is the risk of loss fromfluctuations in the future cash flows or fair values of financial instrument because of achange in market interest rates. Interest rate risk is managed principally through monitoringinterest rate gaps and by having pre-approved limits for repricing bands. A summary ofthe Bank's interest rate gap position on non-trading portfolio is as follows:
More Carrying 0-3 3-12 1 - 5 than
In thousands of Leones Note amount months months years 5 years
31 December 201 1
Cash and cash
equivalents 15 872,579,690 872,579,690 - - -
IMF fund related asset 16 742,880,838 - 742,880,838 - -
Loans and advances 17 38,101,206 33,185,923 - 4,915,283 -
Investment in equity 19 58,739,776 - - 53,735,668 5,004,108
Investment securities 20 494,574,547 494,574,547 - - -
2,206,876,057 1,400,340,160 742,880,838 58,650,951 5,004,108
IMF related liabilities 22 1,195,774,358 - - 666,676,675 529,097,683Deposit fromGovernment 24 15,489,277 15,489,277 - - -Deposits from Banks 25 38,948,083 38,948,083 - - --Deposits from others 26 789,310,575 789,310,575 - - -
2,039,522,293 843,747,935 - 666,676,675 529,097,683
167,353,764 556,592,225 742,880,838 (608,025,724) (524,093,575)

105
ANNUAL REPORT AND STATEMENT OF ACCOUNTS
Notes to the financial statements (continued)
4. Financial risk management (continued)
Market risk (continued)
More Carrying 0-3 3-12 1 - 5 than
In thousands of Leones Note amount months months years 5 years
31 December 2010
Cash and cashequivalents 15 678,567,070 678,532,456 - 34,614 -IMF fund related asset 16 831,314,280 - 831,314,280 - -Loans and advances 17 198,789,921 193,835,740 - 4,954,181 -Investment in equity 19 17,550,941 - - 15,293,720 2,257,221Investment securities 20 435,094,849 435,094,849 - - -
2,161,317,061 1,307,463,045 831,314,280 20,282,515 2,257,221
IMF related liabilities 23 1,117,669,718 - - 474,322,135 643,347,583Deposit fromGovernment 24 130,203,850 130,203,850 - - -Deposits from Banks 25 91,687,549 91,687,549 -Deposits from others 26 29,436,819 29,436,819 - - -
1,368,997,936 251,328,218 - 474,322,135 643,347,583
792,319,1251,056,134,827 831,314,280 (454,039,620) (641,090,362)
Sensitivity of projected net interest income (Interest rate sensitivity analysis)
200 bp (2%) 200bp (2%)Increase Decrease
In thousand of Leones 2011 2011
Interest income impact 1,721,445 (1,721,445)Interest expense impact (61,146) 61,146
Net impact 1,660,299 (1,660,299)

106
BANK OF SIERRA LEONE
Notes to the financial statements (continued)
4. Financial risk management (continued)
Market risk (continued)
200 bp (2%) 200bp (2%)Increase Decrease
In thousand of Leones 2010 2010
Interest income impact 1,328,266 (1,328,266)Interest expense impact (43,304) 43,304
________ _________Net impact 1,284,962 (1,284,962)
======= ========The expected impact on net interest income have been based on a +/- two percent swing ininterest rates that may occur during the ensuing year. The computation considered interestincome on cash and short term funds, investment securities and loans and advances; and interestexpense all of which are deemed susceptible to interest rate change.
Sensitivity of reported equity to interest rate movement
200 bp (2%) 200bp (2%)Increase Decrease
In thousand of Leones 2011 2011
Net (after tax) interestImpact on retained earnings 1,162,209 (1,161,209)
======= ========
In thousand of Leones 2010 2010
Net (after tax) interestImpact on retained earnings 899,473 (899,473)
======= =======
e. Currency risk
The Bank takes on exposure to effects of fluctuations in the prevailing foreign currencyexchange rates on its financial position and cash flows. Basic guidelines for the managementof Bank's international reserves are set by the Board of the bank and reviewed on aquarterly basis; the guidance prescribe the currency structure, average term of depositsand a selection of foreign banks.

107
ANNUAL REPORT AND STATEMENT OF ACCOUNTS
Notes to the financial statements (continued)
4. Financial risk management (continued)
Currency risk (continued)
The table below summarises the Bank's exposure to foreign currency exchange rate risk at 31December 2011. Included in the table are the Bank's assets and liabilities at carrying amounts,categorised by currency.
Concentrations of assets, liabilities and off balance sheet items
In thousands ofLeones
GBP Euro US$ SDR Other TotalCash and balances withthe banks 168,915,353 74,154,720 625,727,630 - 3,781,987 872,579,690IMF Assets - - - 742,880,838 - 742,880,838Loans and advances - - - - 38,101,206 38,101,206Investment in equity - - 16,696,261 - 16,696,261Investment in securities - - - - 494,574,547 494,574,547Property, plantand equipment - - - - 58,739,776 58,739,776Other assets 31,316 15,803 11,620 291,986 18,734,830 19,085,555
Total assets 168,946,669 74,170,523 642,435,511 743,172,824 613,932,346 2,242,657,873
LiabilitiesIMF drawing rightsallocation - - - 1,195,774,358 - 1,195,774,358Deposit fromGovernment - - - - 15,489,277 15,489,277Deposit fromBanks - - - - 112,532,271 112,532,271Deposit fromothers - - - - 38,948,083 38,948,083
Other liability - - 49,068,156 - 743,379,905 792,448,061End of service benefit - - - - 9,967,414 9,967,414Total Liabilities - - 49,068,1561,195,774,358 920,316,950 2,165,159,464
Net on-balancesheet position 168,946,669 74,170,523 593,367,355(452,601,534) (306,384,604) 77,498,409
Credit commitments
At 31 December 2010Total assets 87,682,963 61,859,825 541,136,295 831,314,280 706,296,372 2,228,289,735
Total liabilities - 1,870,360 58,986,794 1,117,669,718 924,050,997 2,102,577,869Net on-balancesheet position 87,682,963 59,989,465 482,149,501 (286,355,438) (217,754,625) 125,711,866

108
BANK OF SIERRA LEONE
Notes to the financial statements (continued)
4. Financial risk management (continued)Currency risk (continued)Foreign currency sensitivity analysisConcentration of Leone equivalent of foreign currency denominated assets and liabilities.
2011
In thousands of Leones USD GBP EUR SDR Total
Assets
Cash and balancewith the banks 62,572,763 16,891,535 7,415,472 - 86,879,770IMF assets - - - 74,288,083 74,288,083Investment in equity 1,669,621 - - - 1,669,621
Total assets 64,242,384 16,891,535 7,415,472 74,288,083 162,837,474
Liabilities
IMF drawings - - - 119,577,436 119,577,436Other liabilities 4,906,816 - - - 4,906,816
Total liabilities 4,906,816 - - 119,577,436 124,484,252
Net-on-balancesheet position 59,335,568 16,891,535 7,415,472 (45,289,353) 38,353,222
2010
In thousands of Leones USD GBP EUR SDR Total
Assets
Cash and balancewith the banks 52,546,181 725 841 - 52,547,747IMF assets - - - 83,131,428 83,131,428Investment in equity 1,567,449 - - - 1,567,449
_Total assets 54,113,630 725 841 83,131,428 137,246,624
Liabilities
IMF drawings - - - 111,766,972 111,766,972Other liabilities 5,898,679 - 187,036 - 6,085,715
Total liabilities 5,898,679 - 187,036 111,766,972 117,852,687
Net-on-balancesheet position 48,214,951 725 (186,195) (28,635,544) 19,393,937
The above sensitivity analysis has been based on change in US Dollar exchange rate against theLeone. The Leone has been relatively stable for the past couple of years, but may well depreciateor strengthen against the dollar by a margin of 10 percent.

109
ANNUAL REPORT AND STATEMENT OF ACCOUNTS
Notes to the financial statements (continued)
4. Financial risk management (continued)
f. Operational risks
Operational risk is the risk of direct or indirect loss arising from a wide variety of causesassociated with the Bank's processes, personnel, technology and infrastructure, andfrom external factors other than credit, market and liquidity risks such as those arisingfrom legal and regulatory requirements and generally accepted standards of corporatebehaviour. Operational risks arise from all of the Bank's operations.
The Bank's objective is to manage operational risk so as to balance the avoidance offinancial losses and damage to the Bank's reputation with overall cost effectiveness andto avoid control procedures that restrict initiative and creativity.
The primary responsibility for the development and implementation of controls to addressoperational risk is assigned to senior management within the Bank. This responsibility issupported by the development of overall Bank standards for the management ofoperational risk in the following areas:
l Requirements for appropriate segregation of duties, including the independentauthorisation of transactions;
l Requirements for the reconciliation and monitoring of transactions;
l Compliance with regulatory and other legal requirements;
l Documentation of controls and procedures;
l Requirements for the periodic assessment of operational risks faced, and theadequacy of controls and procedures to address the risk identified;
l Requirements for the reporting of operational losses and proposed remedialaction;
l Development of contingency plans;
l Training and professional development;
l Ethical and business standards;
l Risk mitigation, including insurance where this is effective.
Compliance with the Bank standards is maintained by the Internal Audit Department.

110
BANK OF SIERRA LEONE
Notes to the financial statements (continued)
5. Use of estimates and judgements
These disclosures supplement the commentary on financial risk management.
Key sources of estimation uncertainty
Allowances for credit losses
Assets accounted for at amortised cost are evaluated for impairment on a basis described inthe accounting policy.
The specific counterparty component of the total allowances for impairment applies to claimsevaluated individually for impairment and is based upon management's best estimate of thepotential loss that may be incurred given their knowledge of the customer and the history of theaccount. In estimating these cash flows, management makes judgements about a counter party'sfinancial situation. Each impaired asset is assessed on its merits, and estimate of cash flowsconsidered recoverable.
Collectively assessed impairment allowances cover credit losses inherent in portfolios of claimswith similar economic characteristics.
Determining fair values
The determination of fair value for financial assets and liabilities for which there is no observablemarket price requires the use of valuation techniques as described in the accounting policy.For financial instruments that trade infrequently and have little price transparency, fair value isless objective, and requires varying degrees of judgments depending on liquidity, concentration,uncertainty of market factors, pricing assumptions and other risks affecting the specific instrument.
Critical accounting judgements made in applying the Bank's accounting policies include:
Financial asset and liability classification
The Bank's accounting policies provide scope for assets and liabilities to be designated oninception into different accounting categories in certain circumstances and in classifying financialassets as available for sale, the Bank has determined that it meets the description as set out inthe accounting policy.
6. Segment reporting
The Bank did not maintain and operate separate business segments during the year. Thus, thepresentation of segmented information is not considered informative.

111
ANNUAL REPORT AND STATEMENT OF ACCOUNTS
Notes to the financial statements (continued)
7. Net interest income
In thousands of Leones 2011 2010
Interest and similar income
Foreign investment 4,949,275 3,284,313Loans and advances 24,639,640 20,216,610Cash and short term funds 1,494,458 1,012,541Investment securities 54,988,913 41,623,241
86,072,286 66,136,705
Interest expenses and similar charges
In thousands of Leones 2011 2010
IMF interest and charges 2,957,202 2,085,441Others 100,105 79,738
3,057,307 2,165,179
Net interest income 83,014,979 63,971,526
8. Net fee and commission income
In thousands of Leones 2011 2010
Fee and commission income
Credit related fees and commission 28,615 29,834Trade finance and other fees 1,187 1,981
29,802 31,815
Fees and commission expense
Fees and commission expense - -
- -
Net fees and commission income 29,802 31,815
9. Net exchange (loss)/gainsRestated
In thousands of Leones 2011 2010
Foreign exchange gains 3,991,533 1,950,742Revaluation (loss)/gains (76,932,519) 286,677,237
(72,940,987) 288,627,979
Revaluation gains and losses relate to exchange differences arising from the revaluation of theBank's monetary assets and liabilities in foreign currencies, as a result of changes in the exchangerate for the Leones.

112
BANK OF SIERRA LEONE
Notes to the financial statements (continued)
10. Other income
In thousands of Leones 2011 2010
Rent received 68,090 52,176Sundry receipts 574,172 2,372,792Loss on sale of fixed asset (2) -Income on revaluation repo operation - -Grant income 45,000 -Interest income on GOSL SDR 147,337 -
834,597 2,424,968
11. Personnel expenses
RestatedIn thousands of Leones 2011 2010
Salaries and wages 29,045,066 28,892,526Social Security 1,809,257 1,597,216End of service benefit 4,540,053 8,648,122Others 1,116,121 1,163,924
36,510,497 40,301,788
12. Currency
In thousands of Leones 2011 2010
Currency management 89,471 205,052Currency Issue expenses 5,365,220 36,331,522
5,454,691 36,536,574
13. Other expenses
In thousands of Leones 2011 2010
Occupancy cost 366,161 311,958Directors remuneration 1,306,496 1,347,054Audit fees 190,000 160,000Legal and professional fees 2,385,034 2,457,565 Advertisement 255,985 138,230Electricity 2,345,196 2,201,535Insurance 1,006,771 1,578,036Passage and overseas allowances 1,359,332 1,418,277Repairs and maintenance 422,817 375,795Write-off of property, plant and equipment - 809,028Other 7,805,213 8,399,246
17,443,005 19,196,724

113
ANNUAL REPORT AND STATEMENT OF ACCOUNTS
Notes to the financial statements (continued)
14. Loss for the year
The loss for the year has been stated after charging:
In thousands of Leones 2011 2010
Depreciation and amortisation 3,096,857 2,405,829Directors remuneration 1,306,496 1,347,054Audit fees 190,000 160,000
15. Cash and cash equivalents
In thousands of Leones 2011 2010
Cash and balances with Banks 203,520,580 170,139,689Balance with other Central Banks 559,134,597 205,183,419 Placement with banks 109,924,513 303,243,962
Cash and balances with Banks 872,579,690 678,567,070
16. International Monetar y Fund Related Assets
In thousands of Leones 2011 2010
IMF Quota subscription 694,778,593 670,466,128Securities account (67,390,261) (67,390,261) IMF No.1 Account (664,396,257) (544,971,185)
(37,007,925) 58,104,682SDR Holdings 779,888,763 773,209,598
742,880,838 831,314,280
Sierra Leone's interest in the International Monetary Fund is presented on a net basis asthere is a legal right of set off between its membership accounts.

114
BANK OF SIERRA LEONE
Notes to the financial statements (continued)
17. Loans and advances
In thousands of Leones 2011 2010
Loans and advances to Banks (Note 17a) 4,915,283 4,954,181Loans and advances to Governmentand others (Note 17b) 33,185,923 193,835,740
38,101,206 198,789,921
17a Loans and advances to Banks
In thousands of Leones 2011 2010
Loans and advances to Banks 5,187,083 5,187,083Less impairment allowances (271,800) (232,902)
4,915,283 4,954,181
Impairment allowances
Balance at 1 January 232,902 225,000Impairment loss for the year 38,898 7,902
Balance at 31 December 271,800 232,902
17b. Loans and advances to Government and others
(i) Analysis by type
In thousands of Leone 2011 2010
Government of Sierra Leone (Ways and Means stock) 26,886,030 177,693,764Staff 4,196,634 4,140,004Reverse REPO Account - 9,810,446Others (Note 17 iv) 2,103,259 2,191,526
Gross loans and advances 33,185,923 193,835,740Less: allowances for losses onloans and advances - -
33,185,923 193,835,740

115
ANNUAL REPORT AND STATEMENT OF ACCOUNTS
Notes to the financial statements (continued)
17. Loans and advances (continued)
17b. Loans and advances to Government and others (continued)
(ii) Allowances for impairment
In thousands of Leones 2011 2010
Specific allowances for impairmentBalance at 1 January - -Impairment loss for the year - -
________ _______Balance at 31 December - -
________ _______Collective allowance for impairmentBalance at 1 January - -Impairment loss for the year - -
________ ________
Balance at 31 December - -________ ________
Total allowances for impairment - -
(iii) Advances to Government of Sierra Leone
In thousands of Leones 2011 2010
Ways and Means Advances brought forward 177,693,764 -Advances during the year 456,587,229 850,358,094Receipts during the year (607,394,963) (672,664,330)
Ways and Means Advances Carried forward 26,886,030 177,693,764
Under the provisions of Section 56(5) of the Bank of Sierra Leone Act, 2011, the limitof the Ways and Means Advances that the Bank can grant to the Government shall notexceed five percent of the Government's actual revenue in the previous year's budget.
In thousands of Leones 2011 2010
Ways and Means Advances 26,886,030 177,693,764Treasury and eligible bills - 435,094,849
26,886,030 612,788,613Less: Government deposits - (130,203,850) Capital account - (50,000,000)
Net debit to Government of Sierra Leone 26,886,030 432,584,763

116
BANK OF SIERRA LEONE
Notes to the financial statements (continued)
17. Loans and advances (continued)
17b. Loans and advances to Government and others (continued)
(iii) Advances to Government of Sierra Leone (continued)
In thousands of Leones 2011 2010
Government actual revenue in previous year1,007,634,000 746,460,000
5% thereof 50,381,700 37,323,000
(Deficit)/excess in Government lending (23,495,670) 395,261,763
The Directors report deficit in lendings to the Government of Sierra Leone as at 31December 2011 of Le 23,495,567 (2010: excess of Le 395,261,763)
(iv) Others
This include advances given to contractors amounting to Le 1.5 billion and a long termliability to the Sierra Leone stock exchange (Le 1billion).
18. Investment in equity
In thousands of Leones 2011 2010
AfreximBank Capital Investment 5,004,108 4,798,695AfreximBank Dividend Investment 397,151 380,774BSL CON-WAMA credit Guarantee fund - 1,423,303WAMA 11,295,002 10,948,169
16,696,261 17,550,941
19. Investment securities
In thousands of Leones 2011 2010
Investment securities at fair valuethrough profit or loss - -Held to maturity investment securities 494,574,547 435,094,849Available for sale investment securities - -
494,574,547 435,094,849

117
ANNUAL REPORT AND STATEMENT OF ACCOUNTS
Notes to the financial statements (continued)
19. Investment securities (continued)
Held to maturity investment securities
In thousands of Leones 2011 2010
Five year medium term bonds 280,000,000 280,000,000Treasury bills held for monetary policy 16,523,641 26,070,233Treasury bond held for monetary policy 11,008,650 20,591,600One year treasury bills 54,561,285 87,373,585182 days treasury bills 46,429,846 13,329,720Others 8,535,125 7,729,711BSL Holding 3rd year medium term bond 77,516,000 -Non negotiable interest bearing securities 81,801,429 81,801,429Less: Fair value adjustment on nonnegotiable, non interest bearing securities (81,801,429) (81,801,429)
494,574,547 435,094,849
Fair value reserve:
At 1 January 81,801,429 243,731,429Reduction of fair value adjustment - (161,930,000)
81,801,429 81,801,429
Under Section 44(2) and 7(2) of the repealed Bank of Sierra Leone (Amendment) Act 1970,the Minister of Finance and the Financial Secretary, on behalf of the Government issued on 24June 1994 and 25 May 2000 non-negotiable, non-interest bearing securities with no fixedredemption date. As these securities have no interest rate and no fixed redemption date inaccordance with International Accounting Standards they have been discounted to net presentvalue date based on projected cash flows. This valuation results in a zero value.

118
BA
NK
OF
SIE
RR
A LE
ON
ENotes to the financial statements (continued)
20. Property plant and equipment
In thousands of Leones Motor Office furniture Plant and Work-inPremises vehicle equipment machinery progress Total
Balance at 1 January 2010 50,344,950 5,520,846 10,451,048 4,340,281 - 70,657,125Additions during the year 9,384,836 9,000 3,803,382 78,694 2,805,356 16,081,268Impairment of asset (809,029) - - - - (809,029)
Balance at 31 December 2010 58,920,757 5,529,846 14,254,430 4,418,975 2,805,356 85,929,364
Balance at 1 January 2011 58,920,757 5,529,846 14,254,430 4,418,975 2,805,356 85,929,364Additions during the year - 45,000 935,476 - 1,748,909 2,729,385Impairment of asset 31,407 - 2,326,909 5,500 (2,363,816) -Write-off - - - - (70,606) (70,606)Disposal - (7,875) - - - (7,875)
Balance at 31 December 2011 58,952,164 5,566,971 17,516,815 4,424,475 2,119,843 88,580,268
Depreciation
Balance at 31December 2010 8,195,578 3,810,192 9,758,329 2,581,582 - 24,345,681Depreciation for the year 1,020,014 585,005 493,525 307,285 - 2,405,829
Balance at 31December 2010 9,215,592 4,395,197 10,251,854 2,888,867 - 26,751,510
Balance at 1 January 2011 9,215,592 4,395,197 10,251,854 2,888,867 - 26,751,510Depreciation for the year 1,173,709 562,740 1,037,708 322,700 - 3,096,857Disposal - (7,875) - - - (7,875)
Balance at 31December 2011 10,389,301 4,950,062 11,289,562 3,211,567 - 29,840,492
Carrying amount:
As at 31 December 2010 49,705,165 1,134,649 4,002,576 1,530,108 2,805,356 59,177,854
At 31 December 2011 48,562,863 616,909 6,227,253 1,212,908 2,119,843 58,739,776
Work in progress represents amount spent on renovation of the Governor’s residence and furnitures for Tokeh Resource Center.

119
ANNUAL REPORT AND STATEMENT OF ACCOUNTS
Notes to the financial statements (continued)
21. Other assets
In thousands of Leones 2011 2010
Gold stock 612,203 530,635Items in transit 16,446,189 125,541Other consumables 306,684 469,086Prepayment 531,252 102,496Interest receivable 69,431 109,065Deferred currency issue expense 1,092,777 6,457,997WAMZ Payment Systems Fund 27,019 -Deferred Govt security certificate 141,719 141,719Less:Allowances for impairment (141,719) (141,719)
19,085,555 7,794,820
Allowances for impairment:
At 1 January (141,719) -Impairment charge for the year - 141,719
(141,719) 141,719
22. International Monetary Fund Specialdrawing rights allocation
In thousands of Leones 2011 2010
IMF Special Drawing Rights 666,676,675 643,347,583IMF Poverty Reduction and Growth Facility 529,097,683 474,322,135
1,195,774,358 1,117,669,718
This relates to amount due to the International Monetary Fund (IMF) for amounts of SDR'sallocated to the Bank for transactions with IMF and to support programs, strengthen balanceof payments position and a foster durable growth, leading to higher living standards and areduction in poverty.
23. Deposit from Government
In thousands of Leones 2011 2010
Government special deposits/accounts 15,489,277 130,203,850
15,489,277 130,203,850

120
BANK OF SIERRA LEONE
Notes to the financial statements (continued)
24. Deposit from Banks
In thousands of Leones 2011 2010
Commercial Bank's reserve account 104,974,940 86,888,920Rural and community bank's reserve accounts 7,346,529 4,587,827Others 210,802 210,802
112,532,271 91,687,549
25. Deposits from Others
In thousands of Leones 2011 2010
Other deposits 38,948,083 29,436,819
38,948,083 29,436,819
26. Other liabilities
In thousands of Leones 2011 2010
Financial liabilitiesOther foreign currency financial liabilities (26a) 49,068,156 60,906,376Accrued charges and other liabilities (26b) 6,562,676 5,103,636
55,630,832 66,010,012
Non-Financial liabilitiesCurrency in circulation (26c) 707,610,568 631,590,343Provision for revaluation of pipeline liabilities (26d) 29,206,661 28,178,431
736,817,229 659,768,774
792,448,061 725,778,786
26a. Other foreign currency financial liabilities
In thousands of Leones 2011 2010
Foreign payment 2,819,120 8,303,703Sierra Rutile/GoSL Loan 3,184,189 3,043,724Bank of China US$ clearing 36,839,176 35,326,970WAMA ECOWAS travellers' cheques 11,798 11,798
WAMA ECOWAS travellers' cheques clearing (1,169) (1,169)Commission of European committee - 40,760WAMA settlement - -OFID Debt Relief imprest account 6,215,042 14,180,590
49,068,156 60,906,376

121
ANNUAL REPORT AND STATEMENT OF ACCOUNTS
Notes to the financial statements (continued)
26b. Accrued charges and other liabilities
In thousands of Leones 2011 2010
Accrued expenses 6,293,288 4,853,589P.S. Bond in circulation 449 449Retention monies 207,463 224,761Trade and sundry creditors 61,476 24,837
6,562,676 5,103,636
26c. Currency in circulation
In thousands of Leones 2011 2010
Notes 698,040,595 622,422,094Coins 9,569,973 9,168,249
Balance at 31 December 707,610,568 631,590,343
The liability for notes and coin issued is the net liability after offsetting notes and coin held by theBank of Sierra Leone as cash on hand, because cash held by the bank does not representcurrency in circulation.
26d. Provision for revaluation of pipeline liabilities
In thousands of Leones 2011 2010
Balance at January 28,178,431 291,192,731Revaluation loss/(gain) 1,028,230 (263,014,300)Disbursement - -
Balance at 31 December 29,206,661 28,178,431
The provision for revaluation of pipelines is a contingency provision in respect of pipelinedeposits. This relates to the purported obligation of the Bank to settle liabilities to commercialBanks in relation to money they deposited in Leones on behalf of importers in exchange for theBank settling their foreign currency obligation. The liability as stated reflects the currency Leonevalue of identifiable currency liabilities to a number of commercial banks with respect to foreigncurrency obligations that were not settled by the bank.

122
BANK OF SIERRA LEONE
Notes to the financial statements (continued)
27. End of service benefitRestated
In thousands of Leones 2011 2010
Change in liability
Balance at 1 January as previously stated - 437,754Service cost in 2010 - 638,312Understatement in 2010 now booked in - 6,725,081
Balance at 1 January 2010 (restated) - 7,801,147
Balance at 1 January 2011 7,801,147 -Service cost 1,647,484 -Interest cost 1,132,586 -Actuarial gain (135,346) -Benefits paid (including riskbenefits payments) (478,457) -
Balance at 31 December 9,967,414 7,801,147
(b) Change in plan assets
Balance at 1 January - -Actual return - -
Expected returns at 31 December - -
Contribution by participants - -Member - -Employer 478,457 -Benefits paid (478,457) -
Closing balance - -
In thousands of Leones 2011 2010
(c) Funding level
Projected benefit obligation 9,967,414 7,801,147Plan assets - -
Net obligation reported in thestatement of financial position 9,967,414 7,801,147

123
ANNUAL REPORT AND STATEMENT OF ACCOUNTS
Notes to the financial statements (continued)
27. End of service benefit (continued)
(d) Income statement Restated
In United States Dollars 2011 2010
Service cost 1,647,484 -
Interest cost 1,132,586 -Expected return on plan asset - -Curtailment (gain)/loss - -Settlement (gains)/loss - -Actuarial (gains)/losses during the year (135,346) -
Amount recognised in income statement 2,644,724 -
Capitalised cost
Service cost 1,647,484 -Interest cost 1,132,586 -
Expected return on plan asset - -Expected loss recognised - -Actual gain (135,346) -
Total employee benefits cost 2,644,724
Reconciliation of financial position
Opening value 7,801,147 -Employee benefits 2,644,724 -Expense recognised in profit and loss (478,457) -
Benefits paid - -
Amount recognised in income statement - -
Capitalised cost - -
Closing value 9,967,444 -
(e) Key valuation assumptions2011 2010
Discount rate 15.00% 15.00%Salary increase 15.00% 15.00%General inflation rate 13.00% 13.00%
In prior period, end of service benefits in the form of defined benefit plan was notdetermined in accordance with an actuarial valuation method by an actuarial valuator asrequired by IAS 19, employee benefits, and all the required disclosures by IAS 19 in thecircumstances were not presented and it was impracticable to qualify the effects onthose financial statements.
The Bank has now taken steps to actuarially value the defined benefit plan in 2011 andall the necessary disclosures as required by IAS 19 have now been included in thesefinancial statements.

124
BANK OF SIERRA LEONE
Notes to the financial statements (continued)
28. Share capital
In thousands of Leones 2011 2010
Authorised:100,000,000 100,000,000
Issued and fully paidBalance at January and 31 December 50,000,000 50,000,000
Section 10(1) and 81 of the Bank of Sierra Leone Act 2011 require the Bank of Sierra Leone tomaintain a minimum paid up capital of Le 125 billion, which is to be subscribed within five yearsfrom the commencement of the Bank of Sierra Leone Act (that is 24 November 2011). As at 31December 2011 the present paid up capital has been fully subscribed and is held exclusively bythe Government of Sierra Leone.
29. Reserves and retained earningsRestated
In thousands of Leones 2011 2010
General reserves (a) (5,294,510) 42,918,947Other reserves (b) 32,792,919 32,792,919
Total reserves as at 31 December 27,497,660 75,711,866
(a) General reserve
RestatedIn thousands of Leones 2011 2010
Balance at start of the year as restated 42,918,947 (237,587,132)Transfer from other reserves - (147,236,407)Net loss for the year (51,605,557) -Net loss for 2010 as previously stated - (23,344,685)Foreign exchange gain in 2010 - 286,677,237End of service benefit understated in 2010 - (6,725,081)
Net profit for the year (restated) - 256,607,471Net loss for the year (51,605,557) -Profit/(Loss) on sale of marketable securities 3,392,100 (6,364,985)Fair value reserve - 161,930,000
Securities for prior year losses - 15,570,000
Balance at 31 December (5,294,510) 42,918,947
Under Section 14(1) subject to section 81 of the Act, where the audited annual financialstatements of the Bank, the value of its assets falls below the sum of its liabilities, itsunimpaired issued capital and general reserves, the Board, on the advice of the externalauditors of the Bank, shall assess the situation and prepare a report on the causes andextent of the shortfall within a period of not more than thirty days. In the event that theBoard approves the report, the Bank shall request the Minister for a capital contributionby the Government to remedy the deficit and upon receipt of this request the Governmentshall, within a period of not more than thirty calendar days, transfer to the Bank the necessaryamount in currency or in negotiable debt instruments with a specified maturity issued atmarket-related interest rates, as determined by the Board.

125
ANNUAL REPORT AND STATEMENT OF ACCOUNTS
Notes to the financial statements (continued)
29. Reserves and retained earnings (continued)
As at 31 December 2011, the total value of the assets of the Bank exceeds the sum of itsliabilities, unimpaired issued capital and general reserves.
(b) Other reservesRestated
In thousands of Leones 2011 2010
Foreign exchange revaluation reserves (i) - -
Property revaluation reserve (ii) 32,792,919 32,792,919
Balance at 31 December 32,792,919 32,792,919
(i) Foreign exchange revaluation reservesRestated
In thousands of Leones 2011 2010
Balance at start of the year aspreviously stated - (147,236,407)
Transferred to general reserve - 147,236,407
Foreign exchange revaluation gainas previously stated - 286,677,237Transfer to income statement for 2010 - (286,677,237)
Balance at 31 December (restated - -
In the past the Bank has been recognising gains and losses arising from any changes in valuationof the Bank's assets and liabilities in, or denominated in, gold or foreign currencies, specialdrawing rights or Euros as a result of changes in the exchange rate for the Leone or of anychange in the values, parties or exchange rates of such assets with respect to the Leones, in aspecial account called the revaluation reserve account which is not in compliance with IAS 21,the effects of changes in foreign exchange rates, which requires such exchange differencesarising on the settlement or translation of such monetary items to be recognised in profit or lossin the period in which they arise.
The Bank has now taken steps to rectify these and all exchange gains and losses for the yearare recognised in the profit or loss statement to comply with IAS 21.
All exchange losses/gains for prior period (pre 2010) have been transferred to general reserve/retained earnings account in order to comply with IAS 8 accounting policies and changes inaccounting estimates and errors.
(ii) Property revaluation reserves
In thousands of Leones 2011 2010
Balance at start of the year and end ofthe year 32,792,919 32,792,919
Balance at 31 December 32,792,919 32,792,919

126
BANK OF SIERRA LEONE
Notes to the financial statements (continued)
29. Reserves and retained earnings (continued)
Property revaluation reserves (continued)
The Bank maintains a property revaluation reserve to which is transferred revaluation gains onrevaluing its properties
30 Contingencies and commitments
30a. Contingent Liabilities
In thousands of Leones 2011 2010
Guarantees and Endorsement 157,222,671 164,735,939Promissory notes 11,053,682 1,163,939
168,276,353 165,899,878
30b. Capital commitments
In thousands of Leones 2011 2010
Capital expenditure 4,176,987 4,102,331African Export Import Bank 4,201,601 3,358,408
8,379,588 7,460,739
30c. Pending law suits, legal proceedings and claims
The Bank has pending litigations against it in relation to three former employees who are claimingdamages for wrongful dismissal, upward revision of pension and payment of terminal benefitsand other allowances. However, the Bank has appealed against the judgements and the mattersare presently at the Court of Appeal. In the event that the appeals are not successful, the Bankwould be liable to pay an amount not less than Le1.63billion excluding interest at the rate of35% per annum and solicitor's costs.
31. Related parties
Parent and ultimate controlling party
Although the Bank is an autonomous entity, the Government of Sierra Leone being the solesubscriber to the share capital of the Bank, is in principle the owner of the Bank. The Bankcontinued to act as the banker and adviser to, and fiscal agent of, the Government of SierraLeone as laid down in statutes. In the course of executing these duties, the Bank facilitatespayments to the Government's suppliers and creditors, and extends credit facilities to theGovernment.
As at 31 December 2011, total net advances to the Government was Le 26.9 billion (2010:Le 432.6 billion).

127
ANNUAL REPORT AND STATEMENT OF ACCOUNTS
Notes to the financial statements (continued)
31. Related parties (continued)
The Board of Directors (including the Governor and Deputy Governor) received remunerationamounting to Le 1.30 billion (2010: Le 1.38 billion). The Governors benefited from rentallowance and vehicles for official and domestic purposes. Board members did not benefitfrom any loan during the period under review. No amount (2010: Le 35.80 million) wascontributed to the National Social Security and Insurance Trust Scheme (NASSIT) on behalfof the Governors as they are both above the required age.
Senior management received remuneration of Le 2.16 billion (2010: Le 1.13 billion) and benefitedfrom official vehicles. Outstanding loans to senior management totalled Le 22.67 million (2010:Le 63.66 million). A total of Le 131.85million (2010: Le108.09 million) was contributed ontheir behalf to NASSIT.
Deposits from Government totalled Le 15 billion (2010: Le 131 billion).
32. Retrospective restatement for 2010 results
In 2010, the Bank recognised gains and losses arising from the revaluation of foreign assets andliabilities into a special account called the revaluation reserve accounts in the statement offinancial position instead of accounting for this in the statement of comprehensive income tocomply with IAS 21 (the effect of changes in foreign exchange rates). Also, in 2010, end ofservice benefits recognised in the statement of financial position was not actuarially valuedleading to an understatement of the said amount.
The foreign exchange gains or losses should have been recognised in the statement ofcomprehensive income and the end of service benefits actuarially valued.
The comparative figures for foreign exchange revaluation reserves and end of service benefitshave been restated to account for this change. The effect of the restatement on these financialstatements is summarised below.
There is no effect in 2011.Effect on
In thousands of Leones 2010
Increase in personnel expenses (6,725,081)Increase in foreign exchange revaluation reserve 286,677,237
Increase in operating result 279,952,156
Increase in employee benefits 6,725,081Decrease in other reserves (286,677,237)
Decrease in general reserves (279,952,156)

128
BANK OF SIERRA LEONE
Notes to the financial statements (continued)
33. Post balance sheet events
Events subsequent to the statement of financial position date are reflected only to the extentthey relate directly to the financial statements and their effect is material.
A new Bank of Sierra Leone Act 2011 was enacted and in accordance with section 9 of thisAct, the minimum authorised share capital of the Bank should be two hundred and fifty billionLeones. This may also be altered by the Board of Directors after consultation with theGovernment.
Also section 10 of this new Bank of Sierra Leone Act requires the Bank to have a minimumpaid-up capital one hundred and twenty five billion Leones which may also be altered by theBoard of Directors after consultation with the Government.
Section 81 of the Banking Act 2011 prescribed that the issued share capital of one hundredand twenty five billion Leones should be subscribed within five years of the coming into operationsof this Act.
Modalities are currently being put in place by the Bank to achieve these minimum share capitallimits as prescribed by the Bank of Sierra Leone Act 2011.