bank of scotland plc annual report and accounts for … · 2013-12-30 · bank of scotland plc...
TRANSCRIPT

BANK OF SCOTLAND plc
ANNUAL REPORT AND ACCOUNTS
FOR THE PERIOD ENDED 31 DECEMBER 2007
Company number: SC 327000

Contents
Business and Financial Review 1
Risk Management 8
Directors’ Report 20
Statement of Directors’ Responsibilities in Respect of the Annual Report and the Financial Statements 31
Independent Auditors’ Report to the Members of Bank of Scotland 32
Consolidated Income Statement 33
Consolidated Balance Sheet 34
Consolidated Statement of Recognised Income and Expense 36
Consolidated Cash Flow Statement 36
Bank Balance Sheet 38
Bank Statement of Recognised Income and Expense 39
Bank Cash Flow Statement 40
Notes to the Accounts 41
Internet
Visit our website at www.bankofscotland.co.uk
Head Office
The Mound, Edinburgh, EH1 1YZ
Telephone: 0870 600 5000

1
Business and Financial Review
Introduction
The Directors are pleased to present the Business and Financial Review for the Bank of Scotland plc ( the "Bank") for the period to 31 December 2007. The Bank is a directly held subsidiary of HBOS plc and part of the HBOS Group ("HBOS Group"). The results of the Bank together with its subsidiaries are consolidated and reported as the Bank of Scotland plc group ("group"). On 17 September 2007, in accordance with the provisions of the HBOS Group Reorganisation Act 2006 ("the Act"), the Governor and Company of the Bank of Scotland registered as a public limited company under the Companies Act and changed its name to Bank of Scotland plc. On the same day, under the Act, the business activities, assets (including investments in subsidiaries) and liabilities of CAPITAL BANK plc and HBOS Treasury Services plc, (subsidiaries of the Governor and Company of the Bank of Scotland), and Halifax plc, (a subsidiary of HBOS plc), transferred to Bank of Scotland plc.
Basis of Preparation These are the first published Accounts of Bank of Scotland plc covering the period from 17 September 2007 to 31 December 2007. As explained in the Accounting Policies merger accounting has been adopted for 2007 with the result that these Accounts are presented as if the Bank had been in existence for the full year. The 2006 comparatives in the Business and Financial Review below have been prepared on a pro forma basis to match the basis of preparation for the 2007 financials. The Group and Divisional financial information included in the Business and Financial Review has been prepared on a consolidated basis. In March 2007 the HBOS Group announced a divisional reorganisation under which the Group's European Corporate business became part of Corporate division moving from International division. The HBOS Group reports through the following divisions: Retail, Corporate, International, Insurance & Investment, Treasury & Asset Management and Group Items. The Bank of Scotland group reports through the same divisional structure. The majority of the HBOS Group's Insurance & Investment and Asset Management activities lie outwith the group. The activities of Insurance and Investment, and Group Items are not individually material to the group and are reported together as "Other activities "in the Business and Financial Review.
Profit before taxation is analysed as follows:
Year ended 31 December Pro forma 2007 2006 £m £m
Retail 2,040 2,292 Corporate 2,411 1,766 International 630 773 Treasury 217 288 Other activities (346) (185)
Profit before taxation 4,952 4,934
Retail
Retail provides financial services to its customers through a broad distribution base ranging from branches to direct mail, telephone and internet services. Retail’s range of multi-branded products includes personal and business banking services providing mortgages, savings, bank accounts, personal loans and credit cards.
The Retail strategy offers customers easy to understand, competitively priced and straightforward products which, combined with a rigourous approach to cost control and risk management, enables them to convert carefully selected growth in sales into long term growth in shareholder value.
Year ended 31 December Pro forma 2007 2006 £m £m
Net interest income 4,216 4,220 Non-interest income 1,309 1,324
Net operating income 5,525 5,544 Operating expenses (2,247) (2,205)
Operating profit before provisions 3,278 3,339 Impairment losses on loans and advances (1,294) (1,097) Impairment losses on investment securities (22) Share of (losses)/profits of associates and jointly controlled entities (9) 2 Non-operating income 87 48
Profit before taxation 2,040 2,292
Retail profits decreased by 11% to £2,040m, primarily due to higher impairment losses.

2
Business and Financial Review (continued)
Prospects
In 2008, a slowing UK economy and the effects of the dislocation in financial markets are expected to contribute to a moderation in the markets for UK credit based products, and a substantial increase in competition for retail deposits. House price inflation is expected to be zero in 2008. Housing transactions are likely to fall from the levels seen in 2007, although the higher the level of product cessations expected in 2008 will continue to under-pin the re-mortgage market. The underlying fundamentals of the housing market remain strong and we do not expect a serious downturn in the housing and mortgage markets. In this environment, we will continue to favour profitable mortgage lending over market share with a selective approach to the trade-off between volume, margin and credit risk.
We expect to continue to build upon the strong performances of both the Savings and Banking businesses. In Savings, our multi-brand, multi-channel franchise and status as the number one savings business in the UK give us an important advantage in a tougher overall funding environment.
While new mortgage pricing is more favourable, this is offset by higher funding costs which are likely to exert some downward pressure on margins.
Given the subdued condition of the consumer credit market, higher levels of indebtedness and affordability stretch, we will maintain our cautious approach to growth in Credit Cards and Unsecured Personal Loans. The slowing UK economy will put pressure on unsecured borrowers and consequently we expect further reductions in the level of unsecured impairment losses to be gradual.
The ongoing investigations into bank charges and payment protection insurance may both lead to changes in pricing structures in those markets, however following the conclusion of these investigations we will have more certainty on the regulatory environment and will be able to plan accordingly.
Our more cautious approach to credit risk and tight control of costs in recent years means that we are well positioned to trade effectively through more difficult conditions, and our strong customer franchise and multi-brand sales and distribution capability provide a long term source of competitive advantage.
Corporate
Year ended 31 December Pro forma 2007 2006 £m £m
Net interest income 2,161 1,994 Non-interest income 2,513 1,756
Net operating income 4,674 3,750 Operating expenses (1,856) (1,641)
Operating profit before provisions 2,818 2,109 Impairment losses on loans and advances (602) (429) Impairment losses on investment securities (37) (69) Share of profits of associates and jointly controlled entities 232 155
Profit before taxation 2,411 1,766
Profit before taxation in Corporate increased by 37% to £2,411m as a result of lending growth, increased profits from associates and jointly controlled entities and strong non-interest income streams.
Prospects
The dislocation in financial markets is expected to continue to shape our UK and European markets in 2008 and reduce the supply of corporate credit. As a result, asset margins have increased recently but asset growth will be slower.
In 2007 we took advantage of excellent market conditions, particularly in the first half year, to realise substantial gains from our investment portfolio. Such opportunities are likely to be much more restricted in 2008 and, currently, we expect a significantly lower level of investment realisations.
The corporate sector in the UK remains relatively under geared and companies are generally well placed to service increased debt costs. Our commercial property portfolio is expected to continue to perform relatively well, partially reflecting our preference for incremental growth in Europe. In an environment where commercial property prices are expected to remain under pressure our primary focus on cash flow based property transactions, with collateral valuations as support, will continue to drive our risk based decisions.
The tough economic climate is likely to see a rising trend in impairments, but we expect this to lead to only a modest increase in the impairment losses in 2008.
Overall, we anticipate slower asset growth in 2008 and a higher proportion of originated assets will be held on the balance sheet than in previous periods, where the sell down market has been more active.
International
International comprises three distinct geographical businesses. HBOS Australia provides retail, commercial, corporate, asset finance and insurance & investment products. In Ireland, Bank of Scotland (Ireland) focuses on providing banking solutions to business banking customers and during 2007 has developed into a full service retail bank. Europe & North America includes the group’s retail, corporate and insurance & investment businesses in those regions.

3
Business and Financial Review (continued)
We aim to grow our International profile by taking the successful UK strategy and deploying it in international markets in which we have experience of operating.
Year ended 31 December Pro forma 2007 2006 £m £m
Net interest income 1,105 1,125 Non-interest income 289 234
Net operating income 1,394 1,359 Operating expenses (665) (557)
Operating profit before provisions 729 802 Impairment losses on loans and advances` (116) (212) Impairment losses on investment securities (1) (2) Share of profits of associates and jointly controlled entities 18 5 Non operating income 180
Profit before taxation 630 773
Profit before taxation in International decreased by 18% to £630m. On 7 December 2006, the 64.5% financial investment in Drive Financial Services (‘Drive’), the sub-prime auto finance receivables business based in Texas was sold. The sale of the investment in Drive realised a gain on disposal of £180m, excluding this gain on sale would result in an increase of 6%.
Prospects
We continue to pursue a strategy of targeted organic growth across our European and North American businesses by seeking to expand into new markets, while increasing the depth of our presence and relationships in our existing markets by developing our product range, increasing our range of specialist sectors and broadening our distribution reach.
In our European retail businesses, BoSNL and BHH, the slowing economic outlook is expected to lead to a moderation in demand for credit. However, our branch network in Spain will provide us with increased capacity to develop this business prudently.
In North America, our expanding network of loan offices will position us for further growth opportunities. Our regional banking partnership initiative will continue to complement our established corporate lending business.
We operate in established, affluent and accessible markets which, in spite of current market volatility, are forecast to maintain robust long-term growth and which suit BoS products and risk appetite. The continued attractiveness of the economic, political and fiscal conditions in our markets will play a major role in the pace of our expansion, as will our ability to attract high quality talented colleagues. With our current low market penetrations the scale of the opportunity is substantial.
Treasury
The Treasury function focuses on performing three core functions; funding and managing the liquidity position of the HBOS Group, providing financial services to the HBOS Group and its customers and generating income. Of these, funding and managing liquidity is the most important function and will take priority over the other functions. Treasury’s strategy is to provide treasury services to support the growth of the HBOS Group’s business and deliver treasury products to the HBOS Group’s customers.
Year ended 31 December Pro forma 2007 2006 £m £m
Net interest income 144 201 Non-interest income 273 243
Net operating income 417 444 Operating expenses (200) (156)
Profit before taxation 217 288
Prospects
The primary focus of our Treasury operations is to manage the Group's funding and liquidity. The dislocation in financial markets which commenced in the second half of 2007 is expected to continue to be a feature of financial markets, particularly the term markets, in 2008. In recent years, prior to the dislocation in financial markets, we have lengthened the maturity profile of our wholesale funding and diversified the types and sources of such funding. This has enabled us to operate effectively in difficult financial markets and will give us the flexibility to source funds in 2008, at appropriate prices, consistent with our business requirements. As term markets recover, we will continue to ensure that the profile of the funding portfolio is appropriate for our longer term business plans.
Treasury profits were affected by negative fair value adjustments to debt securities in 2007. We expect these adjustments to both the income statement and balance sheet to reverse out over time as markets recover and/or the debt securities reach maturity.
We will continue to be selective in issuing commercial paper at appropriate spreads from our ABCP Conduits Grampian and Landale or fund the

4
Business and Financial Review (continued)
Conduits via the repo markets or our own liquidity lines as appropriate.
Treasury also provides services to the Group and to the Group's customers. We continue to invest in our capabilities to deliver a top quality service and performance. Access to Group customers, product innovation and our strong standing in the market underpins our confidence in our business model. Our cautious approach to products and services remains unaltered.
Other activities
Other activities combine the activities of the Insurance & Investment and Group Items divisions which are not individually material to the group.
Year ended 31 December Pro forma 2007 2006 £m £m
Net interest income 20 Non-interest income 339 355
Net operating income 339 375 Operating expenses (685) (560)
Profit before taxation (346) (185)
HBOS's Insurance & Investment operations are primarily transacted in entities outside of the BoS group and are limited to sales activities within the banking network. Group Items carries out the head office and central activities of the group.
Other activities has an underlying loss of £346m as a result of increased operating expenses due to implementation costs of our cost efficiency programme. Asset quality remains high and no credit provisions were required in the period.
Overview of Results
Group Items comprise costs incurred in the management of the group as a whole.
Group net interest income in the year has risen 1% to £7,626m.
Year ended 31 December Pro forma 2007 2006 £m £m
Interest receivable 36,354 28,144 Interest payable (28,728) (20,584)
Net interest income 7,626 7,560
Non-interest income grew 21% to £4,723m for the year compared with £3,912m for the year to 31 December 2006.
Year ended 31 December Pro forma 2007 2006 £m £m
Net fees and commission income 1,964 1,847 Operating lease rental income 1,321 1,043 Net trading income 185 279 Profit on sale of investments 668 326 Other operating income 585 417
Non-interest income 4,723 3,912
5
Business and Financial Review (continued)
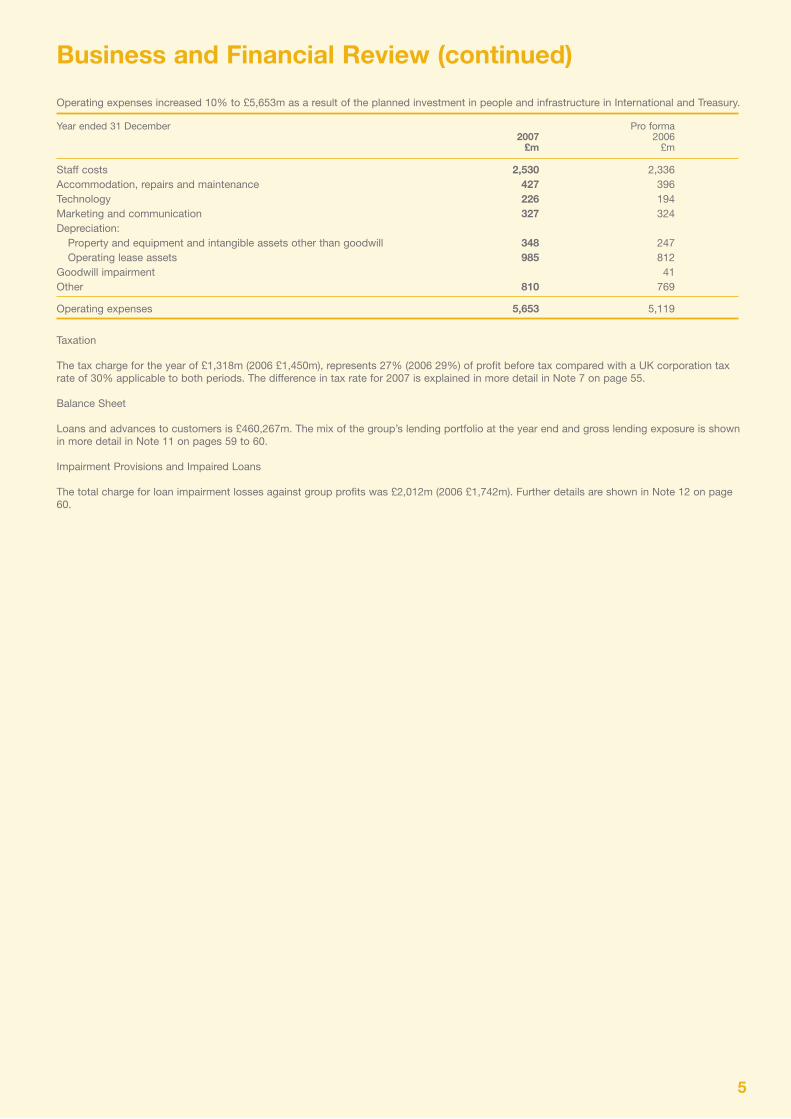
Operating expenses increased 10% to £5,653m as a result of the planned investment in people and infrastructure in International and Treasury.
Year ended 31 December Pro forma 2007 2006 £m £m
Staff costs 2,530 2,336 Accommodation, repairs and maintenance 427 396 Technology 226 194 Marketing and communication 327 324 Depreciation: Property and equipment and intangible assets other than goodwill 348 247 Operating lease assets 985 812 Goodwill impairment 41 Other 810 769
Operating expenses 5,653 5,119
Taxation
The tax charge for the year of £1,318m (2006 £1,450m), represents 27% (2006 29%) of profit before tax compared with a UK corporation tax rate of 30% applicable to both periods. The difference in tax rate for 2007 is explained in more detail in Note 7 on page 55.
Balance Sheet
Loans and advances to customers is £460,267m. The mix of the group’s lending portfolio at the year end and gross lending exposure is shown in more detail in Note 11 on pages 59 to 60.
Impairment Provisions and Impaired Loans
The total charge for loan impairment losses against group profits was £2,012m (2006 £1,742m). Further details are shown in Note 12 on page 60.
6
Business and Financial Review (continued)
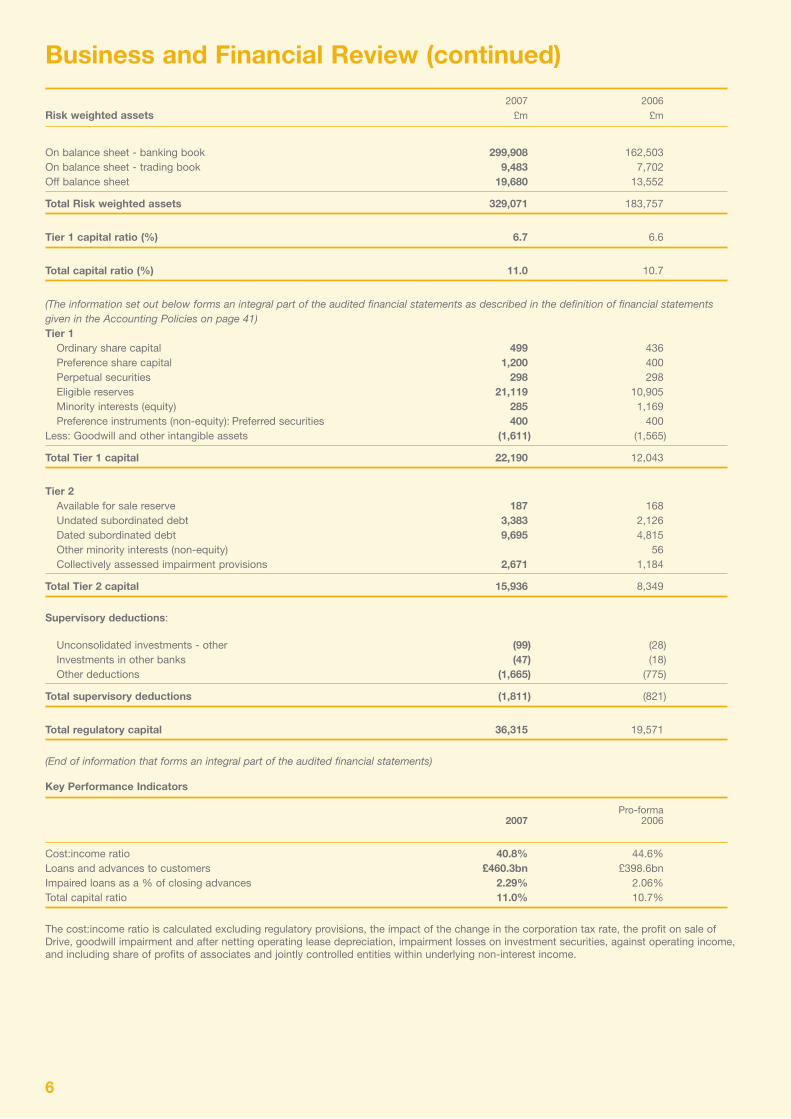
2007 2006
Risk weighted assets £m £m
On balance sheet - banking book 299,908 162,503 On balance sheet - trading book 9,483 7,702 Off balance sheet 19,680 13,552
Total Risk weighted assets 329,071 183,757
Tier 1 capital ratio (%) 6.7 6.6
Total capital ratio (%) 11.0 10.7
(The information set out below forms an integral part of the audited financial statements as described in the definition of financial statements given in the Accounting Policies on page 41) Tier 1 Ordinary share capital 499 436 Preference share capital 1,200 400 Perpetual securities 298 298 Eligible reserves 21,119 10,905 Minority interests (equity) 285 1,169 Preference instruments (non-equity): Preferred securities 400 400 Less: Goodwill and other intangible assets (1,611) (1,565)
Total Tier 1 capital 22,190 12,043
Tier 2 Available for sale reserve 187 168 Undated subordinated debt 3,383 2,126 Dated subordinated debt 9,695 4,815 Other minority interests (non-equity) 56 Collectively assessed impairment provisions 2,671 1,184
Total Tier 2 capital 15,936 8,349
Supervisory deductions:
Unconsolidated investments - other (99) (28) Investments in other banks (47) (18) Other deductions (1,665) (775)
Total supervisory deductions (1,811) (821)
Total regulatory capital 36,315 19,571
(End of information that forms an integral part of the audited financial statements) Key Performance Indicators
Pro-forma 2007 2006
Cost:income ratio 40.8% 44.6% Loans and advances to customers £460.3bn £398.6bn Impaired loans as a % of closing advances 2.29% 2.06% Total capital ratio 11.0% 10.7%
The cost:income ratio is calculated excluding regulatory provisions, the impact of the change in the corporation tax rate, the profit on sale of Drive, goodwill impairment and after netting operating lease depreciation, impairment losses on investment securities, against operating income, and including share of profits of associates and jointly controlled entities within underlying non-interest income.

7
Business and Financial Review (continued)
Our credentials in respect of tight cost control are now well established. Our aim is to continue to control costs whilst at the same time increasing income and further reducing our cost:income ratio.
Future Developments
Corporate will continue to sharpen their focus on core markets to enhance their depth of knowledge and experience. By concentrating on these markets, Corporate will continue to develop long term relationships with their chosen customers. Retail will continue to look for growth opportunities across all principal business activities. International is looking to expand into new markets and increase their depth of presence and relationships in current markets. Treasury's primary focus is to deliver a top quality service and performance to the Group and its clients and will continue to invest in its capabilities to do so.

8
Risk Management
IntroductionRisk management within the Bank of Scotland group is part of the overall framework that is applied across the HBOS Group ("Group"). The following report is in relation to the HBOS Group overall. Identification, measurement and management of risk is a strategic priority for HBOS. The HBOS Board which is also the Bank's Board has established a comprehensive framework covering accountability, oversight, measurement and reporting to maintain high standards of risk management throughout the Group.
Key risks and uncertainties facing the GroupThe key risks and uncertainties faced by the Group, which we believe could cause our actual results to differ materially from expected results, are set out below. These factors should not be regarded as a complete and comprehensive statement of all potential risks and uncertainties.
Each of the Divisions faces key risks and uncertainties in the execution of their strategy. These are set out in the divisional sections of the Business Review where they can be read in conjunction with the Division’s strategy, and financial and operating performance.
The Group’s earnings are affected by general economic conditions in the markets in which we operate The Group’s earnings could be affected by deterioration in economic conditions in the UK, where the majority of the Group’s earnings are generated, as well as in the other economies in which we operate. In particular, significantly higher UK unemployment and/or interest rates may reduce borrowers’ ability to repay loans and may cause house prices to fall materially thereby reducing the collateral value on many of our loans. An economic downturn may also reduce demand for many of our products. To mitigate we have developed a diversified business model that operates in many different markets and cycles (including, but not limited to, mortgages, savings, corporate, SME, insurance and investment) both in the UK and increasingly in our chosen overseas markets.
Changes in financial markets may restrict the availability or increase the cost of funding to the Group. Such changes could impact on the margins we are able to achieve or constrain the growth in businesses. To mitigate this we have developed a well diversified funding and depositor base and would seek to pass on increased cost of funds where appropriate.
Future earnings growth and shareholder value creation depend on the Group’s strategic decisions Significant resources are devoted to the formulation and implementation of our strategy. If elements of the strategy do not deliver as planned, either as a result of internal factors such as poor implementation associated with strategic change, or external factors, such as competitor actions, the Group’s earnings may grow more slowly or decline.
The financial performance of the Group is affected by borrowers ability and willingness to repay amounts lent by the GroupThis is known as credit risk and more information about how we manage credit risk and our credit exposures is set out on pages 10 to 12.
The Group may be unable to meet its financial obligations as they fall due or is unable to raise sufficient funds to take full advantage of growth opportunitiesThis is known as liquidity risk. Further information about our approach to managing liquidity risk is explained on pages 15 to 17.
The financial performance of the Group is affected by changes in external market factors such as interest rates, foreign exchange rates, commodity and equity prices and the potential for customers to act in a manner which is inconsistent with business, pricing and hedging assumptionsThis is referred to as market risk. Further information about our management of, and exposure to, market risk is set out on pages 12 to 15.
The Group may have insufficient capital resources to meet the regulatory minimum requirements, to finance growth, or to support its credit ratingCapital discipline is a key element of the Group’s strategy. Capital is a scarce resource and our task is to deploy it to achieve sustainable returns and add value for our shareholders. The financial performance of the Group may affect the ability to generate sufficient capital. This, together with a reduction in the availability of capital from the capital markets, may affect the Group’s ability to meet the capital requirements of regulators or to have an acceptable capital structure to support the existing credit ratings. The Group’s approach to the management of capital is set out on pages 18 to 19.
Operational risks exist in the normal course of the Group’s business. In a large organisation with many different processes, IT systems and colleagues, there is a risk that operational losses can result.Examples of the sources of such risks include fraud, systems reliability, human error, failure of key suppliers, IT security, change management, operational outsourcing and failure to comply with legislation or regulation. Further information about the management of operational risk is set out on page 17.
The Group's business and earnings can be affected by changes in financial services laws and regulations in each of the locations in which it operatesAny significant regulatory changes could affect how the group conducts business and its financial performance. Regulatory risk is explained in detail on page 18.
9
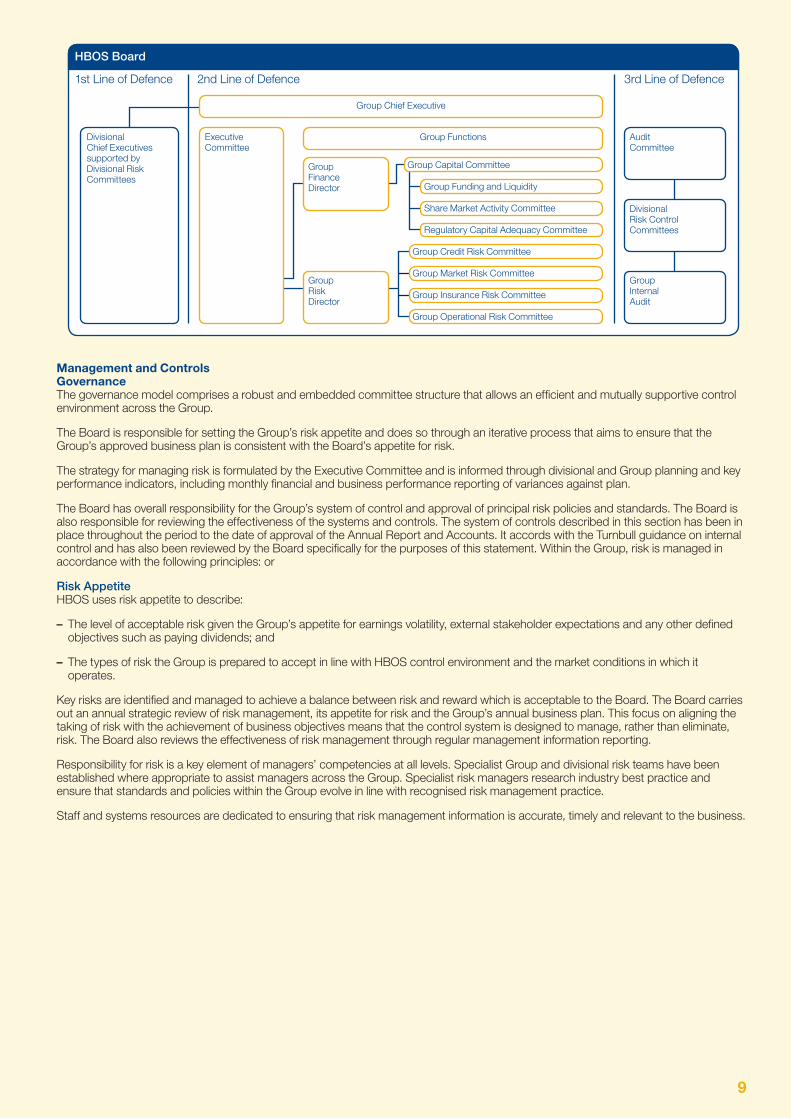
Management and Controls GovernanceThe governance model comprises a robust and embedded committee structure that allows an efficient and mutually supportive control environment across the Group.
The Board is responsible for setting the Group’s risk appetite and does so through an iterative process that aims to ensure that the Group’s approved business plan is consistent with the Board’s appetite for risk.
The strategy for managing risk is formulated by the Executive Committee and is informed through divisional and Group planning and key performance indicators, including monthly financial and business performance reporting of variances against plan.
The Board has overall responsibility for the Group’s system of control and approval of principal risk policies and standards. The Board is also responsible for reviewing the effectiveness of the systems and controls. The system of controls described in this section has been in place throughout the period to the date of approval of the Annual Report and Accounts. It accords with the Turnbull guidance on internal control and has also been reviewed by the Board specifically for the purposes of this statement. Within the Group, risk is managed in accordance with the following principles: or
Risk AppetiteHBOS uses risk appetite to describe:
The level of acceptable risk given the Group’s appetite for earnings volatility, external stakeholder expectations and any other defined –objectives such as paying dividends; and
The types of risk the Group is prepared to accept in line with HBOS control environment and the market conditions in which it –operates.
Key risks are identified and managed to achieve a balance between risk and reward which is acceptable to the Board. The Board carries out an annual strategic review of risk management, its appetite for risk and the Group’s annual business plan. This focus on aligning the taking of risk with the achievement of business objectives means that the control system is designed to manage, rather than eliminate, risk. The Board also reviews the effectiveness of risk management through regular management information reporting.
Responsibility for risk is a key element of managers’ competencies at all levels. Specialist Group and divisional risk teams have been established where appropriate to assist managers across the Group. Specialist risk managers research industry best practice and ensure that standards and policies within the Group evolve in line with recognised risk management practice.
Staff and systems resources are dedicated to ensuring that risk management information is accurate, timely and relevant to the business.
1st Line of Defence 2nd Line of Defence 3rd Line of Defence
Group Chief Executive
Audit Committee
Group Finance Director
Group Risk Director
Group Capital Committee
Group Funding and Liquidity
Share Market Activity Committee
Regulatory Capital Adequacy Committee
Group Credit Risk Committee
Group Market Risk Committee
Group Insurance Risk Committee
Group Operational Risk Committee
Divisional Risk Control Committees
Group Internal Audit
Executive Committee
Group FunctionsDivisional Chief Executives supported by Divisional Risk Committees
HBOS Board

10
The Risk Management FrameworkHBOS allocates specific roles in the management of risk to executives and senior managers and to the Board and Executive Committees. This is undertaken within an overall framework and strategy established by the Board. The model is based on the concept of ‘three lines of defence’, as shown in the table below.
Divisional management has primary responsibility for identifying and evaluating significant risks to the business and for designing and operating suitable controls. Internal and external risks are assessed, including economic factors, control breakdowns, disruption of information systems, competition and regulatory requirements.
The four Group Executive Risk Committees - Group Credit Risk Committee, Group Market Risk Committee, Group Insurance Risk Committee and Group Operational Risk Committee develop the policies and parameters within which Divisions are required to manage risk. The Committees provide central oversight by reviewing and challenging the work of the Divisions’ own risk committees and considering the application of appropriate risk management techniques.
The specialist Group Risk function, reporting to the Group Risk Director, supports these Committees. Its responsibilities are:
to recommend Group policies, standards and limits; –
to monitor compliance with those policies, standards –and limits;
to provide leadership in the development and implementation of risk management techniques; and –
to aggregate risks arising in the Divisions and to monitor the overall Group position independently from the Divisions’ own analysis. –
Consideration of capital, liquidity and balance sheet management is undertaken on an integrated basis. All capital and funding related activities are the responsibility of the Group Capital Committee, supported by three sub-committees, which focus on the core aspects of overall Group requirements. The Group Capital Committee is chaired by the Group Finance Director and operates under delegated authority from the Board to oversee and manage the Group’s Balance Sheet and Capital in accordance with the Board approved Group Business plan and within regulatory ratios.
In judging the effectiveness of the Group’s controls, the Board reviews the reports of the Audit Committee and management.
Certain responsibilities are delegated to the Audit Committee including ensuring that there is regular review of the adequacy and efficiency of internal control procedures. This role provides independent and objective assurance that there is an appropriate control structure throughout the Group.
The Audit Committee, supported by Divisional Risk Control Committees, obtains assurance about the internal control and risk management environment through regular reports from Group Functions (including Group Risk and Group Finance) and Group Internal Audit. It also considers external auditors’ reports.
Management of Key RisksThe Group is committed to developing its risk management techniques and methodologies, both to maintain high standards of risk management practice and to fulfil the requirements of UK and international regulators.
(The information set out below up to and including the table entitled 'Wholesale funding - residual maturity' forms an integral part of the audited financial statements as described in the accounting policies section of the Accounts on page 41).
Credit RiskCredit Risk is the risk of financial loss from counterparty’s failure to settle financial obligations as they fall due. The Group Credit Risk Committee, one of the Executive Risk Committees, is chaired by the Group Risk Director and comprises senior executives from across the business divisions and Group Risk and Group Finance functions. It meets monthly and reviews the Group’s lending portfolio, approves material credit models and Group credit standards, limits and divisional credit risk policies. The Group Credit Risk Policy Statement is approved by the Board on an annual basis. The Group Credit Risk Committee also assists the Board in formulating the Group’s credit risk appetite in respect of key products and sectors.
Group Credit, a specialist support function within Group Risk, provides centralised expertise in the area of credit risk measurement and management techniques. In addition to reporting on the performance of each divisional portfolio to the Group Credit Risk Committee, Group Credit exercises independent oversight over the effectiveness of credit risk management arrangements and adherence to approved policies, standards and limits.
Day to day management of credit risk is undertaken by specialist credit teams working within each Division in compliance with policies approved by the Board. Typically functions undertaken by these teams include credit sanctioning, portfolio management and management of high risk and defaulted accounts and credit risk model build and governance.
1st Line of Defence RISK MANAGEMENT • Divisional CEOs • Strategy • Divisional Risk Specialists • Performance • Divisional Risk Committees • Risk control2nd Line of Defence RISK OVERSIGHT • Group Chief Executive • Executive Committee • Centralised policy management • Group Functions (inc. Group Risk • Independent oversight of risk and Group Finance) • Executive Risk Committees3rd Line of Defence RISK ASSURANCE • Audit Committee • Independent assurance • Divisional Risk Control Committees • Group Internal Audit

11
To mitigate credit risk, a wide range of policies and techniques are used across the Group:
For retail portfolios use is made of credit scoring software for new applications. In addition, behavioural scoring is used to provide an –assessment of the conduct of a customer’s accounts in granting extensions to, and setting limits for, existing facilities. Affordability is a vitally important measure and is reviewed in combination with either application and/or behavioural scores. Small business customers may be rated using scorecards in a similar manner to retail customers.
For corporate portfolios a full independent credit assessment of the financial strength of each potential transaction and/or customer –is undertaken, awarding an internal risk rating which is reviewed regularly. The same approach is also used for larger SME (small to medium enterprise) customers.
Within Treasury Division (Treasury), which handles the Group's banking and sovereign related exposures, as well as the Group's –structured credit bond (ABS) portfolio held for liquidity and proprietary purposes, focused credit risk policies are established and reviewed by Group Wholesale Credit Risk Committee (GWCC), a sub-committee of the Group Credit Risk Committee. Basel II Advanced IRB compliant models are used to rate banking and sovereign counterparties. Structured credit bonds are reviewed individually by an independent credit function prior to purchase and an internal rating is applied to all exposures. The rating assessment is commensurate with, and often more stringent than, those of the external credit rating agencies. Additional thresholds and limits are applied by rating and asset class and, as part of an ongoing portfolio review process, thorough surveillance is performed covering each bond holding, supplemented by stress analyses conducted on a periodic basis.
An additional measure within the credit risk framework is the establishment of product, industrial sector and country limits to avoid excessive concentrations of risk. Material portfolios, such as mortgages, have approved sub-sector limits to ensure that they remain within plan and tolerance for risk. All such limits are set and monitored by the Group Credit Risk Committee.
Standards have been established across the Group for the management of credit risk. All Divisions are committed to continuously improving credit risk management. There continues to be investment in the development of credit risk rating tools, including enhancements to the portfolio risk measurement systems and in governance arrangements to support operations within the terms of the Basel II Accord. These include principles for development, validation and performance monitoring of credit risk models. The approval process for credit models is dependant upon materiality, with all models impacting the regulatory capital calculation requiring approval by the Group Credit Risk Committee and those deemed material to the Group being approved by the Group Capital Committee.
Internal reporting has developed further in response to the introduction of improved rating tools. Senior Management across the Group are now capable of assessing the risk profile in terms of Probability of Default and Expected Loss and will do so under the Basel II environment going forward.
Financial instruments subject to credit risk The table below sets out the group’s exposure to credit risk relating to financial instruments before taking account of collateral and other security. A full reconciliation between the group’s consolidated balance sheet and financial instruments subject to credit risk is set out in Note 30 to the Accounts on pages 82 to 84.
Financial Financial instruments instruments subject subject to credit risk to credit risk As at As at 31.12.2007 31.12.2006 £m £m
Loans and advances to customers 460,267 215,255Financial assets held for trading 54,681 49,139Debt securities 48,833 43,077Other financial assets 22,335 137,471 586,116 444,942Contingent liabilities and commitments 106,318 54,722Total 692,434 499,664
Loans and advance to customers Loans and advances to customers are managed on a divisional basis. Information about the credit quality of loans and advances to customers is set out on pages 1-3 in the Business Review and in Note 30 to the Accounts on pages 82 to 84.
Financial assets held for tradingManagement of credit risk within Treasury portfolios relies on obtaining detailed knowledge and understanding of the assets and issuers it deals with. As described above, a full credit analysis is undertaken and, based upon that, an internal rating is derived which helps to establish a credit appetite for the issuer or asset intended to be acquired.
As Treasury manages the liquidity of the HBOS Group, its mandate is to maintain a high quality credit portfolio. In addition to the credit process mentioned above, it also actively uses portfolio techniques to manage and monitor the quality of its portfolios, and to avoid concentration risk.
This includes the use of rating based thresholds, established portfolio level thresholds, asset class limits and sub-limits. There are also rules governing the types of assets that can be held within Treasury’s Liquidity portfolios, Trading and Banking books and for individual (ABS) tranche sizes. There are also limits controlling the maximum weighted average life of assets.
Financial assets held for trading Financial assets held for trading are almost exclusively investment grade investments with 99% (2006 99%) of inter-bank and structured investment portfolios rated ‘A’ or above based on an internal credit ratings scale that is, in general, aligned with the ratings scales of the major credit ratings agencies (Moody’s, S&P and Fitch).

12
As at As at 31.12.2007 31.12.2006 % %
AAA 51.5 51.9AA 34.4 30.6A 13.7 17.0Below A 0.4 0.5
Debt securities Debt securities are primarily held within the Treasury or Corporate Divisions and are almost exclusively invested in investment grade counterparties with 96% (2006 93%) of debt securities rated ‘A’ or above, again based on our internal rating scale.
As at As at 31.12.2007 31.12.2006 % %
AAA 60.4 69.4AA 23.6 18.5A 12.5 5.6Below A 3.5 6.5
The AAA proportion of the portfolio fell during 2007 due to two factors (i) a reduction in Sovereign assets and (ii) an increase in the size of the portfolio comprising mainly AA and A assets, thereby reducing the AAA proportion.
Other Financial AssetsOther financial assets include cash and balances at central banks, items in the course of collection, derivative assets, loans and advances to banks and sundry financial assets.
Market RiskMarket risk is defined as the potential loss in value or earnings of the organisation arising from:
changes in external market factors such as interest rates (interest rate risk), foreign exchange rates (foreign exchange –risk), commodities and equities; and
the potential for customers to act in a manner which is inconsistent with business, pricing and hedging assumptions – .
The objectives of the Group’s market risk framework are to ensure that:
market risk is taken only in accordance with the Board’s appetite for such risk; –
such risk is within the Group’s financial capability, management understanding and staff competence; –
the Group complies with all regulatory requirements relating to the taking of market risk; and –
the quality of the Group’s profits is appropriately managed and its reputation safeguarded. –
Risk appetite is set by the Board which allocates responsibility for oversight and management of market risk to the Group Market Risk Committee, an Executive Risk Committee chaired by the Group Risk Director.
The Group devotes resources to ensuring that market risk is comprehensively captured, accurately modelled and reported, and effectively managed. Trading and non-trading portfolios are managed at various organisational levels, from the HBOS Group overall, down to specific business areas. Market risk measurement and management methods are designed to meet or exceed industry standards, and the tools used facilitate internal market risk management and reporting.
Market risk is controlled across the Group by setting limits using a range of measurement methodologies. The principal methodologies are Net Interest Income (‘NII’) sensitivity and Market Value (‘MV’) sensitivity for banking books and Value-at-Risk (‘VaR’) for trading books. All are supplemented by scenario analysis which is performed in order to estimate the potential economic loss that could arise from extreme, but plausible stress events.
Detailed market risk framework documents and limit structures have been developed for each Division. These are tailored to the specific market risk characteristics and business objectives of each Division. Each divisional policy requires appropriate divisional sanction, and is then forwarded to the Group Market Risk Committee for approval on at least an annual basis.
Market risk – principally interest rate, inflation and equity – also arises from the Group’s defined benefit pensions obligations. These sensitivities are regularly measured and are reported to the Group Market Risk Committee every month.
Interest Rate Risk (Non-Trading)A key market risk faced by the Group in its non-trading book is interest rate risk. This arises where the Group’s financial assets and liabilities have interest rates set under different bases or reset at different times.
The principal Board limit for structural interest rate risk is expressed in terms of potential volatility of net interest income in adverse market conditions. Risk exposure is monitored using the following measures:
Net Interest Income sensitivity – This methodology comprises an analysis of the Group’s current interest rate risk position overlaid with –behavioural assessment and re-pricing assumptions of planned future activity. The change to forecast NII is calculated with reference to a set of defined parallel interest rate shocks which measure how much current projections would alter over a 12 month period.
Market Value sensitivity – This methodology considers all re-pricing mismatches in the current balance sheet including those beyond –the time horizon of the NII measure. It is also calculated with reference to a set of defined parallel interest rate shocks.
13
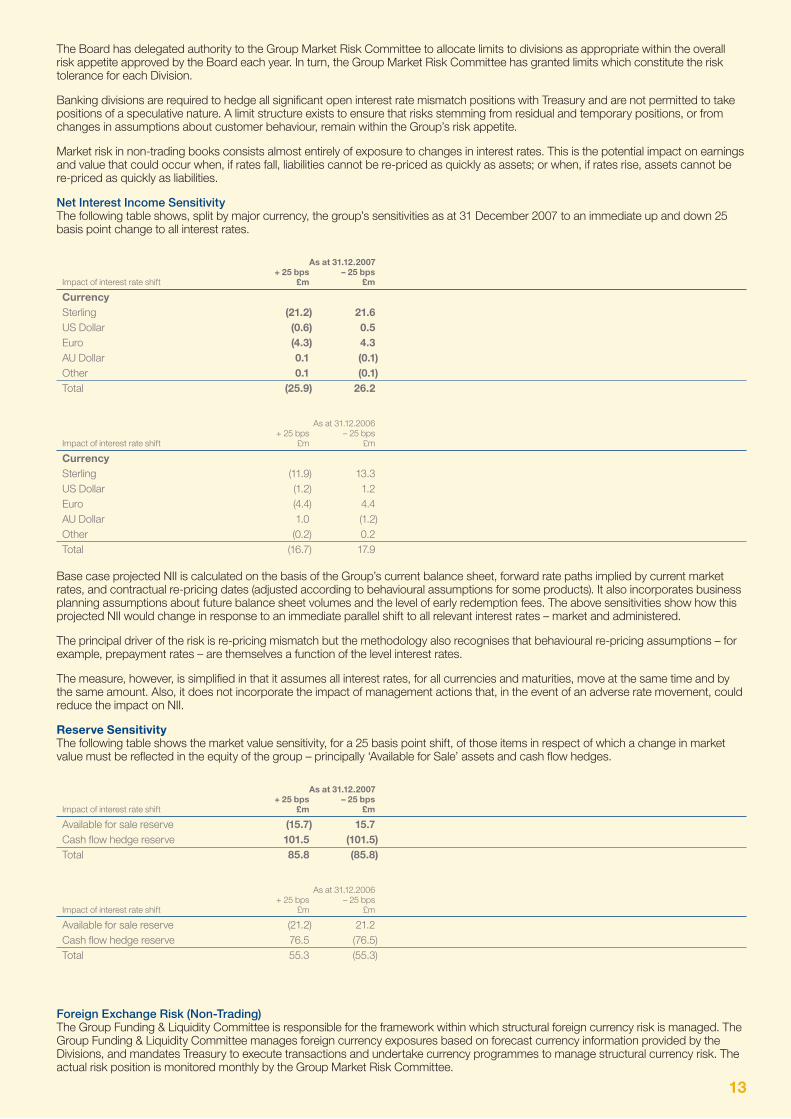
The Board has delegated authority to the Group Market Risk Committee to allocate limits to divisions as appropriate within the overall risk appetite approved by the Board each year. In turn, the Group Market Risk Committee has granted limits which constitute the risk tolerance for each Division.
Banking divisions are required to hedge all significant open interest rate mismatch positions with Treasury and are not permitted to take positions of a speculative nature. A limit structure exists to ensure that risks stemming from residual and temporary positions, or from changes in assumptions about customer behaviour, remain within the Group’s risk appetite.
Market risk in non-trading books consists almost entirely of exposure to changes in interest rates. This is the potential impact on earnings and value that could occur when, if rates fall, liabilities cannot be re-priced as quickly as assets; or when, if rates rise, assets cannot be re-priced as quickly as liabilities.
Net Interest Income SensitivityThe following table shows, split by major currency, the group’s sensitivities as at 31 December 2007 to an immediate up and down 25 basis point change to all interest rates.
As at 31.12.2007 + 25 bps – 25 bps Impact of interest rate shift £m £m
Currency Sterling (21.2) 21.6 US Dollar (0.6) 0.5 Euro (4.3) 4.3 AU Dollar 0.1 (0.1) Other 0.1 (0.1)Total (25.9) 26.2
As at 31.12.2006 + 25 bps – 25 bps Impact of interest rate shift £m £m
Currency Sterling (11.9) 13.3 US Dollar (1.2) 1.2 Euro (4.4) 4.4 AU Dollar 1.0 (1.2) Other (0.2) 0.2 Total (16.7) 17.9
Base case projected NII is calculated on the basis of the Group’s current balance sheet, forward rate paths implied by current market rates, and contractual re-pricing dates (adjusted according to behavioural assumptions for some products). It also incorporates business planning assumptions about future balance sheet volumes and the level of early redemption fees. The above sensitivities show how this projected NII would change in response to an immediate parallel shift to all relevant interest rates – market and administered.
The principal driver of the risk is re-pricing mismatch but the methodology also recognises that behavioural re-pricing assumptions – for example, prepayment rates – are themselves a function of the level interest rates.
The measure, however, is simplified in that it assumes all interest rates, for all currencies and maturities, move at the same time and by the same amount. Also, it does not incorporate the impact of management actions that, in the event of an adverse rate movement, could reduce the impact on NII.
Reserve SensitivityThe following table shows the market value sensitivity, for a 25 basis point shift, of those items in respect of which a change in market value must be reflected in the equity of the group – principally ‘Available for Sale’ assets and cash flow hedges.
As at 31.12.2007 + 25 bps – 25 bps Impact of interest rate shift £m £m
Available for sale reserve (15.7) 15.7Cash flow hedge reserve 101.5 (101.5)Total 85.8 (85.8)
As at 31.12.2006 + 25 bps – 25 bps Impact of interest rate shift £m £m
Available for sale reserve (21.2) 21.2Cash flow hedge reserve 76.5 (76.5)Total 55.3 (55.3)
Foreign Exchange Risk (Non-Trading)The Group Funding & Liquidity Committee is responsible for the framework within which structural foreign currency risk is managed. The Group Funding & Liquidity Committee manages foreign currency exposures based on forecast currency information provided by the Divisions, and mandates Treasury to execute transactions and undertake currency programmes to manage structural currency risk. The actual risk position is monitored monthly by the Group Market Risk Committee.
14
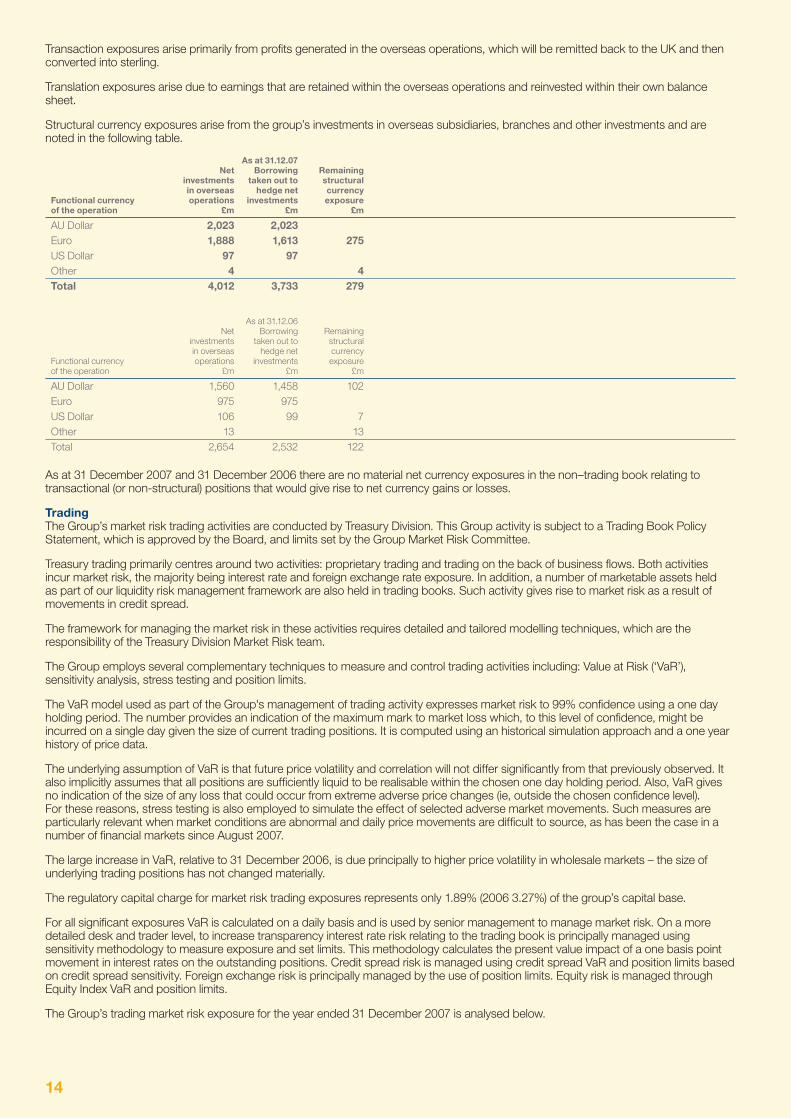
Transaction exposures arise primarily from profits generated in the overseas operations, which will be remitted back to the UK and then converted into sterling.
Translation exposures arise due to earnings that are retained within the overseas operations and reinvested within their own balance sheet.
Structural currency exposures arise from the group’s investments in overseas subsidiaries, branches and other investments and are noted in the following table.
As at 31.12.07 Net Borrowing Remaining investments taken out to structural in overseas hedge net currency Functional currency operations investments exposure of the operation £m £m £m
AU Dollar 2,023 2,023 Euro 1,888 1,613 275US Dollar 97 97 Other 4 4Total 4,012 3,733 279
As at 31.12.06 Net Borrowing Remaining investments taken out to structural in overseas hedge net currency Functional currency operations investments exposure of the operation £m £m £m
AU Dollar 1,560 1,458 102Euro 975 975 US Dollar 106 99 7Other 13 13Total 2,654 2,532 122
As at 31 December 2007 and 31 December 2006 there are no material net currency exposures in the non–trading book relating to transactional (or non-structural) positions that would give rise to net currency gains or losses.
Trading The Group’s market risk trading activities are conducted by Treasury Division. This Group activity is subject to a Trading Book Policy Statement, which is approved by the Board, and limits set by the Group Market Risk Committee.
Treasury trading primarily centres around two activities: proprietary trading and trading on the back of business flows. Both activities incur market risk, the majority being interest rate and foreign exchange rate exposure. In addition, a number of marketable assets held as part of our liquidity risk management framework are also held in trading books. Such activity gives rise to market risk as a result of movements in credit spread.
The framework for managing the market risk in these activities requires detailed and tailored modelling techniques, which are the responsibility of the Treasury Division Market Risk team.
The Group employs several complementary techniques to measure and control trading activities including: Value at Risk (‘VaR’), sensitivity analysis, stress testing and position limits.
The VaR model used as part of the Group's management of trading activity expresses market risk to 99% confidence using a one day holding period. The number provides an indication of the maximum mark to market loss which, to this level of confidence, might be incurred on a single day given the size of current trading positions. It is computed using an historical simulation approach and a one year history of price data.
The underlying assumption of VaR is that future price volatility and correlation will not differ significantly from that previously observed. It also implicitly assumes that all positions are sufficiently liquid to be realisable within the chosen one day holding period. Also, VaR gives no indication of the size of any loss that could occur from extreme adverse price changes (ie, outside the chosen confidence level). For these reasons, stress testing is also employed to simulate the effect of selected adverse market movements. Such measures are particularly relevant when market conditions are abnormal and daily price movements are difficult to source, as has been the case in a number of financial markets since August 2007.
The large increase in VaR, relative to 31 December 2006, is due principally to higher price volatility in wholesale markets – the size of underlying trading positions has not changed materially.
The regulatory capital charge for market risk trading exposures represents only 1.89% (2006 3.27%) of the group’s capital base.
For all significant exposures VaR is calculated on a daily basis and is used by senior management to manage market risk. On a more detailed desk and trader level, to increase transparency interest rate risk relating to the trading book is principally managed using sensitivity methodology to measure exposure and set limits. This methodology calculates the present value impact of a one basis point movement in interest rates on the outstanding positions. Credit spread risk is managed using credit spread VaR and position limits based on credit spread sensitivity. Foreign exchange risk is principally managed by the use of position limits. Equity risk is managed through Equity Index VaR and position limits.
The Group’s trading market risk exposure for the year ended 31 December 2007 is analysed below.
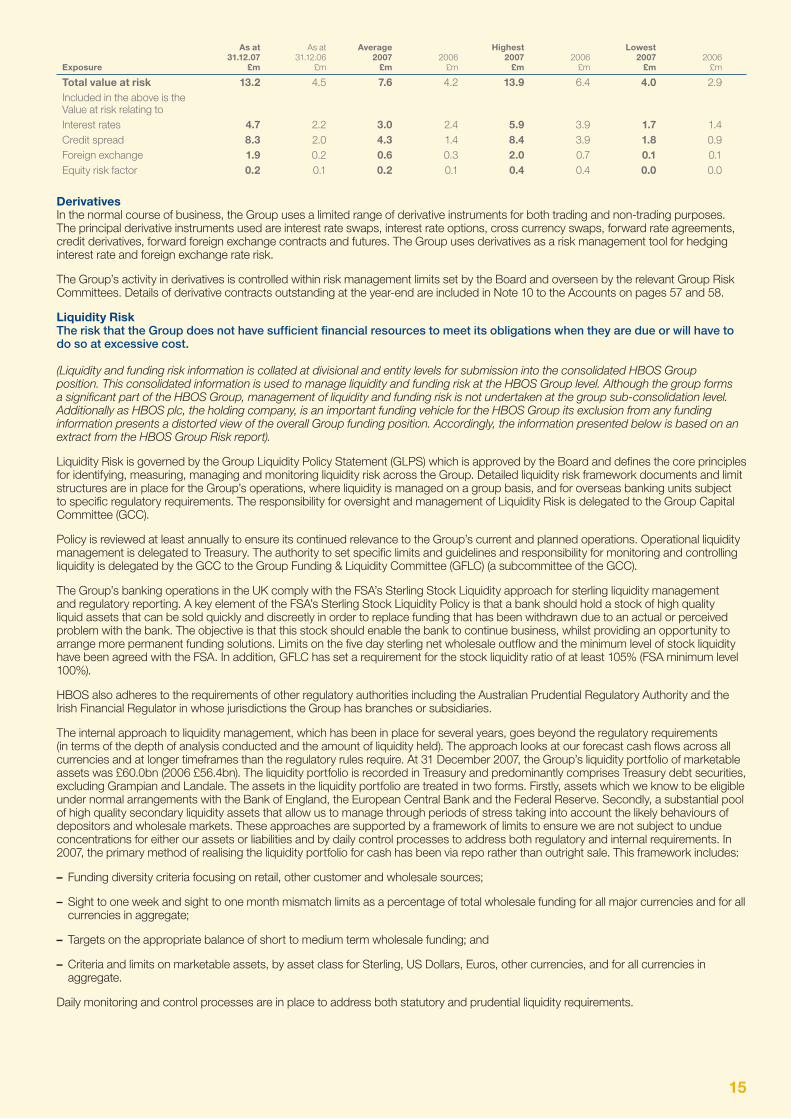
15
As at As at Average Highest Lowest 31.12.07 31.12.06 2007 2006 2007 2006 2007 2006 Exposure £m £m £m £m £m £m £m £m
Total value at risk 13.2 4.5 7.6 4.2 13.9 6.4 4.0 2.9Included in the above is the Value at risk relating toInterest rates 4.7 2.2 3.0 2.4 5.9 3.9 1.7 1.4Credit spread 8.3 2.0 4.3 1.4 8.4 3.9 1.8 0.9Foreign exchange 1.9 0.2 0.6 0.3 2.0 0.7 0.1 0.1Equity risk factor 0.2 0.1 0.2 0.1 0.4 0.4 0.0 0.0
DerivativesIn the normal course of business, the Group uses a limited range of derivative instruments for both trading and non-trading purposes. The principal derivative instruments used are interest rate swaps, interest rate options, cross currency swaps, forward rate agreements, credit derivatives, forward foreign exchange contracts and futures. The Group uses derivatives as a risk management tool for hedging interest rate and foreign exchange rate risk.
The Group’s activity in derivatives is controlled within risk management limits set by the Board and overseen by the relevant Group Risk Committees. Details of derivative contracts outstanding at the year-end are included in Note 10 to the Accounts on pages 57 and 58.
Liquidity RiskThe risk that the Group does not have sufficient financial resources to meet its obligations when they are due or will have to do so at excessive cost.
(Liquidity and funding risk information is collated at divisional and entity levels for submission into the consolidated HBOS Group position. This consolidated information is used to manage liquidity and funding risk at the HBOS Group level. Although the group forms a significant part of the HBOS Group, management of liquidity and funding risk is not undertaken at the group sub-consolidation level. Additionally as HBOS plc, the holding company, is an important funding vehicle for the HBOS Group its exclusion from any funding information presents a distorted view of the overall Group funding position. Accordingly, the information presented below is based on an extract from the HBOS Group Risk report).
Liquidity Risk is governed by the Group Liquidity Policy Statement (GLPS) which is approved by the Board and defines the core principles for identifying, measuring, managing and monitoring liquidity risk across the Group. Detailed liquidity risk framework documents and limit structures are in place for the Group’s operations, where liquidity is managed on a group basis, and for overseas banking units subject to specific regulatory requirements. The responsibility for oversight and management of Liquidity Risk is delegated to the Group Capital Committee (GCC).
Policy is reviewed at least annually to ensure its continued relevance to the Group’s current and planned operations. Operational liquidity management is delegated to Treasury. The authority to set specific limits and guidelines and responsibility for monitoring and controlling liquidity is delegated by the GCC to the Group Funding & Liquidity Committee (GFLC) (a subcommittee of the GCC).
The Group’s banking operations in the UK comply with the FSA’s Sterling Stock Liquidity approach for sterling liquidity management and regulatory reporting. A key element of the FSA’s Sterling Stock Liquidity Policy is that a bank should hold a stock of high quality liquid assets that can be sold quickly and discreetly in order to replace funding that has been withdrawn due to an actual or perceived problem with the bank. The objective is that this stock should enable the bank to continue business, whilst providing an opportunity to arrange more permanent funding solutions. Limits on the five day sterling net wholesale outflow and the minimum level of stock liquidity have been agreed with the FSA. In addition, GFLC has set a requirement for the stock liquidity ratio of at least 105% (FSA minimum level 100%).
HBOS also adheres to the requirements of other regulatory authorities including the Australian Prudential Regulatory Authority and the Irish Financial Regulator in whose jurisdictions the Group has branches or subsidiaries.
The internal approach to liquidity management, which has been in place for several years, goes beyond the regulatory requirements (in terms of the depth of analysis conducted and the amount of liquidity held). The approach looks at our forecast cash flows across all currencies and at longer timeframes than the regulatory rules require. At 31 December 2007, the Group’s liquidity portfolio of marketable assets was £60.0bn (2006 £56.4bn). The liquidity portfolio is recorded in Treasury and predominantly comprises Treasury debt securities, excluding Grampian and Landale. The assets in the liquidity portfolio are treated in two forms. Firstly, assets which we know to be eligible under normal arrangements with the Bank of England, the European Central Bank and the Federal Reserve. Secondly, a substantial pool of high quality secondary liquidity assets that allow us to manage through periods of stress taking into account the likely behaviours of depositors and wholesale markets. These approaches are supported by a framework of limits to ensure we are not subject to undue concentrations for either our assets or liabilities and by daily control processes to address both regulatory and internal requirements. In 2007, the primary method of realising the liquidity portfolio for cash has been via repo rather than outright sale. This framework includes:
Funding diversity criteria focusing on retail, other customer and wholesale sources; –
Sight to one week and sight to one month mismatch limits as a percentage of total wholesale funding for all major currencies and for all –currencies in aggregate;
Targets on the appropriate balance of short to medium term wholesale funding; and –
Criteria and limits on marketable assets, by asset class for Sterling, US Dollars, Euros, other currencies, and for all currencies in –aggregate.
Daily monitoring and control processes are in place to address both statutory and prudential liquidity requirements.

16
In addition to day to day prudential limits, the liquidity framework has two other important components.
Firstly, HBOS ‘stress tests’ its potential cash flow mismatch position under various scenarios on an ongoing basis, with formal Group reporting at least monthly, in compliance with FSA regulations. The cash flow mismatch position considers on balance sheet cash flows, commitments received and granted, and material derivative cash flows. Specifically, commitments granted include the pipeline of new business awaiting completion as well as other standby or revolving credit facilities. Behavioural adjustments are developed evaluating how the cash flow position might change under each stress scenario to derive a stressed cash flow position.
Scenarios are based on varying degrees of stress and cover both HBOS name specific and systemic difficulties. The scenarios and the assumptions are reviewed at least annually to gain assurance they continue to be relevant to the nature of the business.
An example of a name specific scenario we model is a substantial fall in our credit rating. In such a scenario we assess the likely impact on customer deposits and assume the wholesale markets would be closed to us. Our approach is to hold substantial liquidity assets which would provide sufficient time for management to take appropriate mitigating actions. We also model the impact of systemic events across the banking sector. Typically the impact of these is less severe as wholesale markets normally continue to provide some funding and concerted central bank action would be expected to address such market dislocation.
The results of the stress testing are presented monthly to the GFLC. A formal strategic review is presented to the HBOS plc Board at least annually.
Secondly, the Group has a Liquidity Contingency Plan embedded within the Group Liquidity Policy Statement which has been designed to identify emerging liquidity concerns at an early stage, so that action can be taken to avoid a more serious crisis developing. This is achieved through the use of Early Warning Indicators (EWIs).
Clear guidelines are set out for the management escalation process in the event of EWIs triggering and the actions to be taken (short and medium term) should such an event take place. Responsibilities for communication with various external parties and contact details of key personnel are also clearly stated.
In response to the market dislocation in the second half of 2007, the GCC has increased the frequency of its meetings and Treasury has introduced additional metrics which are monitored daily and tailored to prevailing market conditions.
FundingCustomer deposit growth and the supply of wholesale funding to HBOS have remained strong during the dislocation in global financial markets in the latter part of 2007. The position for the HBOS Group is:
As at As at 31.12.07 31.12.06 £bn £bn
Loans and advances to customers 430.0 376.8Customer accounts 243.2 211.9Customer lending less customer accounts 186.8 164.9Customer accounts as a % of loans and advances to customers 56.6% 56.2%
The wholesale funding capacity of the Group is dependant upon factors such as the strength of the balance sheet, earnings, asset quality, ratings and market position. GFLC assesses the Group funding mix to ensure that adequate diversity is maintained. It is Group policy to manage its balance sheet profile to ensure customer deposits sourced outside Treasury represents a significant component of overall funding, and GFLC directs and coordinates the activities of the Divisions in raising liabilities from a range of sources.
In order to strengthen the Group’s funding position, HBOS has over the last few years diversified its funding sources and lengthened its maturity profile of market sensitive funding. This has been achieved through:
Widening the wholesale investor base and product set; –
Building and maintaining a large securitisation programme; –
Accessing the covered bond market; –
Utilising the geographic diversity of New York and Sydney as funding hubs of the Group; and –
Extending our Medium Term Note programmes. –
During 2007 the Group’s wholesale funding sources were well diversified by instrument, currency and by maturity as shown in the tables on the following page. The tables are prepared on the basis that ‘retail’ is defined using the current statutory definition, i.e. administered rate products. Wholesale funding, when issued in a foreign currency but swapped into sterling, is included at the swap exchanged amount. Wholesale funding is shown excluding any repo activity and the funding raised in the names of the conduits.
During the second half of 2007, with the increased cost of term funding we chose to reduce our term issuance and utilise our significant available capacity in money markets.
However, covered bonds and securitisation issues continue to be important funding sources for the Group with outstandings as at the end of December 2007 of £69.6bn, an increase of £5.2bn during 2007. In addition, issuance of CDs rose to £63.1bn compared with £42.5bn at the end of 2006. As at the end of December 2007, £113.9bn of wholesale funding had a maturity over one year compared with £109.8bn at the end of 2006.

17
ConduitsHBOS sponsors two conduits, Grampian and Landale, which are special purpose vehicles that invest in highly rated assets and fund via the Asset Backed Commercial Paper ('ABCP') market. At 31 December 2007, investments held by the Grampian totalled £18.6bn. Grampian is, and always has been, fully consolidated into our balance sheet. We also consolidated £0.6bn of assets held by Landale. Grampian is a long established, high grade credit investment vehicle that invests in diversified Asset Backed Securities of which over 99.9% are rated AAA by S&P and Aaa by Moody's. Grampian has a liquidity line in place with HBOS which covers all of the assets and programme wide credit enhancement is also provided by HBOS. Landale holds both assets originated from our own balance sheet and third party banks and therefore the former, but not the latter, are consolidated into our balance sheet.
In the latter half of 2007, due to the disruption in the ABCP market, there have been occasions when Grampian and Landale (in respect of assets backed by HBOS liquidity lines) have declined to issue ABCP given the unattractiveness of the spreads and maturities available.At these times we therefore funded the conduits, on a temporary basis, through the ABCP market. At 31 December 2007, HBOS has provided funding to the Grampian and Landale conduits of £8.1bn.
Retail and Wholesale Funding sources As at As at 31.12.07 31.12.06 Instrument £bn % £bn %
Bank Deposits 32.9 6.7 27.9 6.6Deposits from Customers 27.8 5.6 17.1 4.0Certificates of Deposit 63.1 12.8 42.5 10.0MTNs issued 42.8 8.7 41.5 9.7Covered Bonds 23.7 4.8 17.2 4.0Commercial Paper 16.9 3.4 17.3 4.1Securitisation 45.9 9.3 47.2 11.1Subordinated Debt 20.0 4.1 15.4 3.6Other 4.9 0.9 4.9 1.1 Total Wholesale 278.0 56.3 231.0 54.2Retail 215.4 43.7 194.8 45.8Total Group Funding 493.4 100.0 425.8 100.0
As at As at 31.12.07 31.12.06 Wholesale funding – Currency £bn % £bn %
US dollar 104.5 37.6 87.2 37.7Euro 79.0 28.4 65.3 28.3Sterling 69.7 25.1 60.7 26.3Other 24.8 8.9 17.8 7.7Total Wholesale Funding 278.0 100.0 231.0 100.0
As at As at 31.12.07 31.12.06 Wholesale funding – Residual Maturity £bn % £bn %
Less than one year 164.1 59.0 121.2 52.5One to two years 21.6 7.8 19.3 8.4Two to five years 46.3 16.7 46.5 20.1More than 5 years 46.0 16.5 44.0 19.0Total Wholesale Funding 278.0 100.0 231.0 100.0
(End of extract of HBOS Group liquidity and funding risk information.)
(End of information that forms an integral part of the audited financial statements).
Operational RiskOperational risk exists in the normal conduct of business. Examples of potential sources of operational risk include fraud, system reliability, human error, failure of key suppliers, IT security, business continuity, change management, operational outsourcing and failure to comply with legislation or regulation. The Board has approved an Operational Risk Policy that establishes the framework for managing operational risk. The main components of the Operational Risk Framework include risk and control assessment, internal loss reporting, capture of risk event information, key risk indicator monitoring and evaluation of external events.
The Group Operational Risk Committee is one of the four Executive Risk Committees chaired by the Group Risk Director. It is attended by senior executives from the Divisions and Group specialist areas. The committee considers the management of issues and exposures, recommends the appropriate capital requirement, approves policies and standards and provides oversight of the operational risk communities.
A key enhancement to our infrastructure has been to focus on the explicit risk management of specialist areas that underpin the HBOS Operational Risk Framework. All specialist functions have clear roles defined to help lead the identification, management and measurement of risks relevant to their areas across the Group. The Group Operational Risk function co-ordinates the specialist areas, designs and maintains Group-wide risk systems and undertakes the detailed modelling required to assess risk exposure.
18
Regulatory RiskThe Financial Services Authority is the main regulator for HBOS, although the Group’s international businesses in the USA, Australia and Ireland are subject to direct scrutiny from the US Federal Reserve, APRA and The Financial Regulator respectively.
HBOS understands that consumers have an ever-increasing choice of supplier and product and are more demanding of financial services providers. Consumer lobby groups have also become more active on their behalf. The Group’s Customer Contract, which was approved by the Board in November 2005, sets out principles for doing business and is HBOS’s flagship response to the FSA’s Treating Customers Fairly initiative, supported by ongoing development of procedures across the Group. The objective is to meet the requirements of our shareholders through meeting the needs of our customers.
HBOS is alert to the wider, cumulative picture of regulatory change and utilises centralised expertise in the area of regulatory and legal compliance, specifically to:
Identify and assess the impact of, respond to and where possible influence the direction of regulatory developments on behalf of –HBOS;
Lead the development and monitoring of the application of specific Group-wide policies and standards; and, –
Oversee the management, support and co-ordination of the liaison and interaction with HBOS regulatory stakeholders across all its –international businesses.
The impact of regulatory change is reported across all Executive Risk Committees with specific reference to the discipline affected and at Group level to Audit Committee and the Board.
(The information set out below up to and including the paragraph on movements in Tier 1 capital and the capital structure overleaf forms an integral part of the audited financial statements as described in the Accounting Policies section in the Accounts on page 41).
Capital ManagementIt is HBOS’s policy to maintain a strong capital base to support the development of its business and to meet regulatory capital requirements at all times.
HBOS recognises the impact on shareholder returns of the level of equity capital employed and seeks to maintain a prudent balance between the advantages and flexibility afforded by a strong capital position and the higher returns on equity possible with greater leverage.
The Group’s capital is managed via the Board through the Group Business Plan, with the objective of maintaining both the optimal amount of capital and the most appropriate mix between the different components of capital. The day to day management of the Group’s capital is delegated to the Group Capital Committee.
The Group’s policy is to issue capital in a range of different forms and also from diverse sources to spread the investor base. HBOS plc raises the non-equity Tier 1 capital and subordinated debt for all the Group’s businesses, with the exception of Clerical Medical which is permitted to raise capital separately as part of the overall Group capital plan to spread the investor base for subordinated debt.
The principal forms of capital are included in the following balances on the consolidated balance sheet:
-called up share capital,
-share premium account,
- other reserves,
- retained earnings, and
- other borrowed funds.
Capital also includes collective impairment allowances held in respect of loans and advances.
Capital RequirementsThe FSA supervises HBOS on a consolidated basis and, as such, receives information on the capital adequacy of, and sets capital requirements for, HBOS as a whole. Individual banking and insurance subsidiaries are directly regulated by either the FSA or their local supervisors, who set their capital adequacy requirements.
In implementing the EU’s Banking Consolidation Directive (Basel I), the FSA requires each bank and banking group to maintain an individually prescribed ratio of total capital to risk-weighted assets, taking into account both balance sheet assets and off-balance sheet transactions.
The Group must at all times monitor and demonstrate compliance with the regulatory capital requirements of the FSA. The Group has in place processes and controls to monitor the Group's capital adequacy and no breached were reported to the FSA during the year. HBOS’s capital is divided into two tiers:
Tier 1 capital comprises shareholders’ funds, innovative Tier 1 securities and minority interests, after adjusting for items reflected in –shareholders’ funds which are treated differently for the purposes of capital adequacy. The book values of goodwill and intangible assets are deducted in arriving at Tier 1 capital.
Tier 2 capital comprises qualifying subordinated loan capital, collective impairment allowances, and unrealised gains arising on the fair –valuation of equities held as available for sale.
Various limits are applied to elements of the capital base. The amount of innovative Tier 1 securities cannot exceed 15 per cent of overall Tier 1 capital, qualifying Tier 2 capital cannot exceed Tier 1 capital, and qualifying dated subordinated loan capital may not exceed 50
19
per cent of Tier 1 capital. There are also limitations on the amount of collective impairment allowances which may be included as part of Tier 2 capital. From the total of Tier 1 and Tier 2 capital the carrying amounts of unconsolidated investments (e.g. insurance company investments), investments in the capital of banks and certain regulatory items are deducted.
The Capital structure of the group is given in the Business and Financial Review on page 6.
(End of information that forms an integral part of the audited financial statements.)
Risk weighted assets are categorised as either trading book or banking book and risk weighted assets are determined accordingly. Banking book risk weighted assets are measure by means of a hierarchy of risk weightings classified according to the nature of each asset and counterparty, taking into account any eligible collateral or guarantees. Banking book off-balance sheet items giving rise to credit, foreign exchange or interest rate risk are assigned weights appropriate to the category of the counterparty, taking into account any eligible collateral or guarantees. trading book risk weighted assets are determined by taking into account market-related risks such as foreign exchange, interest rate and equity position risks and counterparty risk.
Basel IIFinancial Services Authority (FSA) GENPRU and BIPRU rules were adopted into the Prudential Sourcebook for Banks, Building Societies and Investment Firms with effect from 1st January 2007. This legislative process converted the European Capital Requirements Directive and, therefore, the Basel II Capital Accord, into UK regulation that applies to HBOS.
HBOS elected to adopt transitional arrangements in 2007 and remain on the Basel I rules to determine minimum regulatory capital requirements.
The primary goal of our Basel II programme has always been to optimise the way we do business through an improved risk management capability. This is integral to our strategy of targeted growth within our overarching objectives of delivering sustainable income streams and generating added shareholder value.
Basel II is structured around three “pillars”: minimum capital requirements, supervisory review process and market discipline. The supervisory objectives that form Basel II are to promote safety and soundness in the financial system and maintain at least the overall level of capital within the system, enhance competitive equality; and constitute a more comprehensive approach to addressing risks; and focus on internationally active banks.
Pillar One determines the minimum capital requirements and for HBOS this is divided into two approaches to determining credit risk regulatory capital requirement, with increasing complexity and sophistication.
Standardised approach. This requires banks to use external credit ratings to determine risk weightings for rated counterparties and –groups other counterparties into broad categories and applying standardised risk weightings to these categories.
Advanced Internal Ratings approach. Banks use their own internal assessment of both the probability of default, the exposure at –default and loss given default.
Basel II also introduces capital requirements for operational risk comprising three levels of increasing sophistication. One level calculates a capital charge based on gross revenues, a second uses three defined percentages based on gross revenues in eight business lines and finally an Advanced Measurement Approach based on the bank’s own analysis of potential loss based on operational risk data.
HBOS has FSA approval to use the Advanced Internal Ratings Based Approach (Credit Risk) and Advanced Measurement Approach (Operational Risk ) for capital determination purposes with effect from 1 January 2008.
Pillar Two is the supervisory review of a bank’s internal assessment of the appropriate level of regulatory capital to hold, consistent with its risk profile and strategy. The FSA has conducted its annual supervisory review and evaluation process and issued under Pillar Two Individual Capital Guidance to HBOS.
Pillar Three is the appropriate disclosure of risk exposures and risk assessment processes of each firm. Pillar Three recognises that market discipline has the potential to reinforce capital regulation and other supervisory efforts to promote safety and soundness in banks and financial systems. It is our intention to publish full disclosures under Pillar Three as required by BIPRU rules as at 31 December 2008. This is in line with emerging UK and EU consensus that the first disclosures for banks adopting advanced approaches from 1 January 2008 will be published based on year end 2008 data.
HBOS continues to promote a prudent and responsible approach to the management of capital. Management and the Board’s view of future requirements will continue to be the main determinant of total capital holdings.

20
Directors' Report
The Directors have pleasure in presenting the Annual Report and Accounts for the period ended 31 December 2007.
Principal Activities
The principal activity of the group is the provision of financial services. A list of the main subsidiary undertakings, and the nature of their business, is given in Note 15 to the accounts on page 64.
On 17 September 2007, in accordance with the provisions of the HBOS Group Reorganisation Act 2006 ("the Act"), the Governor and Company of the Bank of Scotland registered as a public limited company under the Companies Act and changed its name to Bank of Scotland plc ('the Bank'). On the same day, under the Act, the business activities, assets (including investments in subsidiaries) and liabilities of CAPITAL BANK plc and HBOS Treasury Services plc (subsidiaries of the Governor and Company of the Bank of Scotland), and Halifax plc (a subsidiary of HBOS plc) transferred to Bank of Scotland plc. All subsequent transactions after this date are those of the Bank. In accordance with the merger accounting principles explained in the Accounting Policies the financial statements are presented as if the merger took place on 1 January 2007. The 2006 comparatives are those of the Governor and Company of the Bank of Scotland.
Business Review
The Companies Act 1985 requires the Directors’ Report to include a Business Review of the Bank of Scotland plc, giving a fair review of the business of the group and a description of the principal risks and uncertainties facing the group. These are reviewed in the Business and Financial Review on pages 1 to 7 and the Risk Management report on pages 8 to 19. The information in both of these sections, which fulfil the requirements of the Business Review, is incorporated into this Directors’ Report by reference.
Results and Dividends
The profit before taxation for the year ended 31 December 2007 amounted to £4,952m (2006 - £3,021m).
An interim dividend of £622m was paid in 2007. The final dividend of £1,050m in respect of the year ended 31 December 2006 was paid in March 2007. The Directors recommend payment of a final dividend of £1,205m in respect of the year ended 31 December 2007.
Directors
The current executive Directors are: Peter Cummings, Jo Dawson, Phil Hodkinson, Andy Hornby, Colin Matthew, Dan Watkins, Mike Ellis, Philip Gore-Randall. Non-executive Directors: Richard Cousins, Charles Dunstone, Sir Ron Garrick, Anthony Hobson, Karen Jones, Coline McConville, Kate Nealon, John E Mack and Dennis Stevenson (Chairman).
Sir Brian Ivory and David Shearer stepped down from the Board on 25 April 2007. Benny Higgins resigned as an Executive Director on 10 August 2007 but remained employed until 31 December 2007. Phil Hodkinson stepped down from the Board on 31 December 2007.
Richard Cousins was appointed as a Non-executive Director on 1 March 2007 and John E Mack was appointed as a Non-executive Director on 1 May 2007.
Dan Watkins was appointed an Executive Director on 5 September 2007; Philip Gore-Randall was appointed as an Executive Director on 15 September 2007 and Mike Ellis was appointed as an Executive Director on 25 September 2007.
Employees
The principal employer for UK based employees is HBOS plc. The Group is a ‘two-tick’ employer actively seeking applications for employment from disabled people and guaranteeing an interview where disabled applicants meet the essential criteria for the role being applied for. In the event of an existing colleague becoming disabled, HBOS works with external specialists to ensure that all possible reasonable adjustments are made to allow the colleague to continue in their existing role. If, after making all possible adjustments, a colleague is not able to continue in their current role, HBOS will look at suitable alternative roles within the Group. Training and career development opportunities are open to all colleagues, including disabled colleagues, and Group policies are designed with inclusion of disabled colleagues in mind.
Payment Policy
The Bank’s suppliers are paid through HBOS plc’s centralised Accounts Payable department. For the forthcoming period the group’s policy for the payment of suppliers will be as follows:
– Payment terms are agreed at the start of the relationship with the supplier and are only changed by agreement;
– Standard payment terms to suppliers of goods and services is 30 days from receipt of a correct invoice for satisfactory goods or services which have been ordered and received, unless other terms are agreed in a contract;
– Payment is made in accordance with the agreed terms or in accordance with the law if no agreement has been made; and
– Suppliers are advised without delay when an invoice is contested and disputes are settled as quickly as possible.
Trade creditors outstanding at 31 December 2007 represented 20 days of purchases.
Charitable and Other Donations
Charitable donations by the group in the UK during the year amounted to £nil.
Share Capital
Full details of the movements in the issued share capital during the year are provided in Note 24 to the Accounts on page 74.

21
Directors' Report (continued)
Corporate Governance and Directors’ Remuneration
The HBOS Group follows the principles of good governance set out in the Combined Code. No separate report on the corporate governance or Directors’ remuneration is presented here as full details are contained in the Report and Accounts of HBOS plc, the Bank’s ultimate parent undertaking.
Going Concern
The Directors are satisfied that the group has adequate resources to continue in business for the foreseeable future and consequently the going concern basis continues to be appropriate in preparing the accounts.
Properties
The Directors are of the opinion that the current market value of the group’s properties are not significantly different from the amount at which they are included in the Balance Sheet.
Auditors
A resolution to re-appoint KPMG Audit Plc as auditors will be put to shareholders at the forthcoming Annual General Meeting. The Directors who held office at the date of approval of this Directors’ Report confirm that, so far as they each are aware, there is no relevant audit information of which the company’s auditors are unaware and each Director has taken all the steps that they ought to have taken as a Director to make themselves aware of any relevant audit information and to establish that the company’s auditors are aware of that information.
On behalf of the Board
H F Baines
Company Secretary
26 February 2008

22
Directors' Report (continued)
Directors Share Interests
1. Shares
The beneficial interests of the Directors and their immediate families in the ordinary shares of HBOS plc are set out below:
Table 1 Number of shares at Number of shares at 31 December 2007 31 December 2006 or date of appointment if later or date of appointment if later :
Chairman Dennis Stevenson 406,892 267,794 Executive Directors Peter Cummings 131,407 88,791 Jo Dawson 106,654 52,485 Mike Ellis 350,545 350,506 Philip Gore-Randall Phil Hodkinson 347,723 263,094 Andy Hornby 608,031 535,379 Colin Matthew 361,844 356,930 Dan Watkins 63,251 62,802
Non-Executive Directors Richard Cousins 5,644 2,144 Charles Dunstone 100,000 100,000 Sir Ron Garrick 33,002 23,980 Anthony Hobson 7,500 7,500 Karen Jones 10,255 10,000 John E Mack 6,000 Coline McConville 10,910 5,320 Kate Nealon 12,879 12,879
Note 1:
Certain Executive Directors will or may receive further interests in the ordinary shares of the Group arising out of the short term incentive plans and long term incentive plans as set out in tables 2, 3, 4, 5 and 6.
Note 2:
As at 26 February 2008, the date of approval of this Annual Report and Accounts, no Director had any interest in the preference shares of the Group or in the loan or share capital of any Group undertaking at the beginning, or during, or at the end of the financial year. No options to subscribe for shares in other Group companies are granted to Directors of the Group.
Note 3:
There has been no change in the share interest as set out in table 1 between the end of the financial year and 26 February 2008, the date of approval of this Annual Report and Accounts, other than set out in note 3 to table 5.
2. Short Term Incentive Plans - HBOS Executive Directors
All Executive Directors, excluding Philip Gore-Randall, who did not join the Group until 2007, have conditional entitlements to shares arising from sharekicker. Where the annual incentives for 2003 and/or 2004 and/or 2005 were taken in shares and these shares are retained in trust for three years, additional shares may also be transferred to the Directors. Details of these shares are set out in table 2.
All Executive Directors, excluding Mike Ellis and Philip Gore-Randall, who did not join the Group until 2007, have performance contingent entitlements to shares arising from the HBOS EPS performance based long term incentive arrangements. The number of additional shares released to participants under this plan will depend on HBOS's annualised growth in EPS in excess of the retail prices index. Where the annual incentive for 2006 was taken in shares and these shares are retained in trust for three years, additional performance shares may also be transferred to the Directors. Details of these shares are set out in table 2.
All Executive Directors, excluding Mike Ellis and Philip Gore-Randall, who did not join the Group until 2007, had the option to switch share awards effective from March 2005 and March 2006 from the sharekicker arrangements to the HBOS EPS performance based long term incentive arrangements. All relevant Executive Directors chose to do so.
The basic and additional shares shown over which vested in 2007 are also included in table 1.
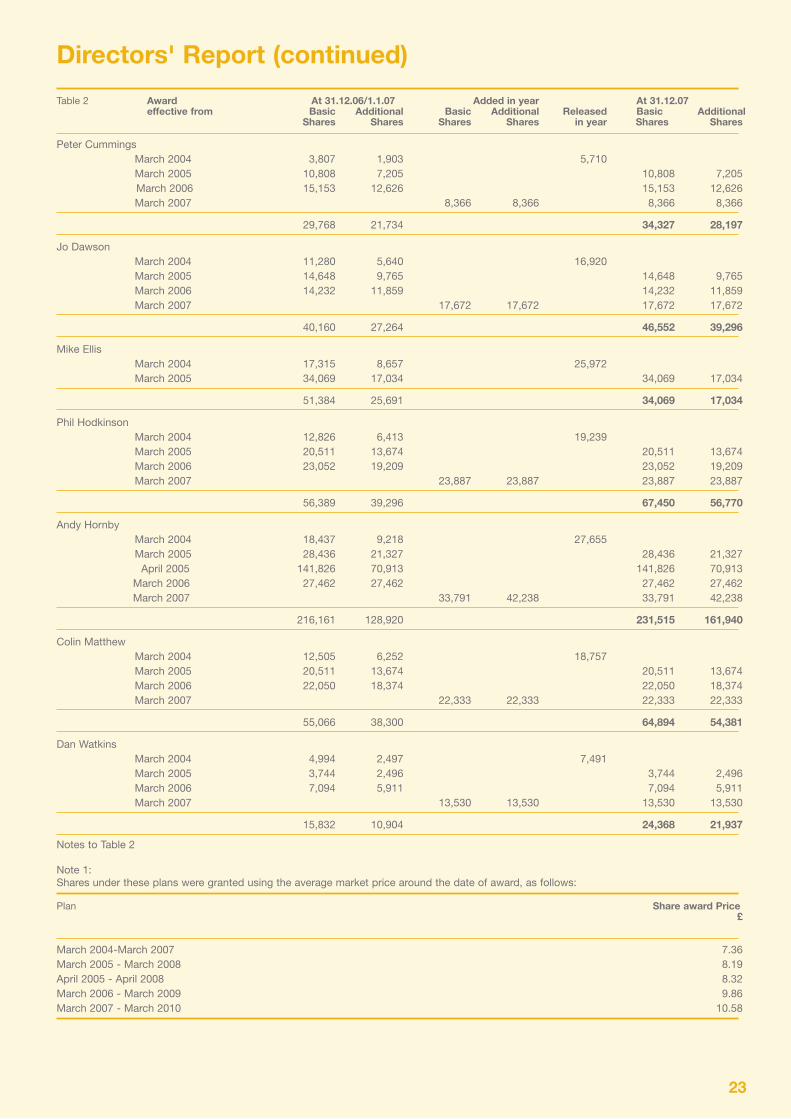
23
Directors' Report (continued)
Table 2 Award At 31.12.06/1.1.07 Added in year At 31.12.07 effective from Basic Additional Basic Additional Released Basic Additional Shares Shares Shares Shares in year Shares Shares
Peter Cummings March 2004 3,807 1,903 5,710 March 2005 10,808 7,205 10,808 7,205 March 2006 15,153 12,626 15,153 12,626 March 2007 8,366 8,366 8,366 8,366
29,768 21,734 34,327 28,197
Jo Dawson March 2004 11,280 5,640 16,920 March 2005 14,648 9,765 14,648 9,765 March 2006 14,232 11,859 14,232 11,859 March 2007 17,672 17,672 17,672 17,672
40,160 27,264 46,552 39,296
Mike Ellis March 2004 17,315 8,657 25,972 March 2005 34,069 17,034 34,069 17,034
51,384 25,691 34,069 17,034
Phil Hodkinson March 2004 12,826 6,413 19,239 March 2005 20,511 13,674 20,511 13,674 March 2006 23,052 19,209 23,052 19,209 March 2007 23,887 23,887 23,887 23,887
56,389 39,296 67,450 56,770
Andy Hornby March 2004 18,437 9,218 27,655 March 2005 28,436 21,327 28,436 21,327 April 2005 141,826 70,913 141,826 70,913 March 2006 27,462 27,462 27,462 27,462 March 2007 33,791 42,238 33,791 42,238
216,161 128,920 231,515 161,940
Colin Matthew March 2004 12,505 6,252 18,757 March 2005 20,511 13,674 20,511 13,674 March 2006 22,050 18,374 22,050 18,374 March 2007 22,333 22,333 22,333 22,333
55,066 38,300 64,894 54,381
Dan Watkins March 2004 4,994 2,497 7,491 March 2005 3,744 2,496 3,744 2,496 March 2006 7,094 5,911 7,094 5,911 March 2007 13,530 13,530 13,530 13,530
15,832 10,904 24,368 21,937
Notes to Table 2
Note 1: Shares under these plans were granted using the average market price around the date of award, as follows:
Plan Share award Price £
March 2004-March 2007 7.36 March 2005 - March 2008 8.19 April 2005 - April 2008 8.32 March 2006 - March 2009 9.86 March 2007 - March 2010 10.58

24
Directors' Report (continued)
Note 2: Shares will be released after three years, subject to the basic shares still being held and subject to the participant still being in the Group’s employment at that time or being a qualifying leaver. For awards effective from March 2005 and/or March 2006 and/or March 2007, where additional shares are contingent (in full or in part) on HBOS EPS performance, the 'on target' additional share award is shown in the table.
Note 3: The performance period for the March 2005 award ended on 31 December 2007. HBOS's EPS growth, in excess of the retail prices index, over the relevant performance period, was equivalent to 5.71%p.a, so an additional share award of 65.06% (72.99% in the case of the Chief Executive) of the basic award will be released to award recipients in March 2008.
Note 4: Because the basic shares are the participant's entitlements, they are shown net of each participant’s original income tax and National Insurance liability. The additional incentive shares are shown in a like manner although in practice the number of additional shares is grossed-up to take into account the associated income tax and National Insurance payable by the participant. Those released in 2007 represented the basic shares purchased by the Director’s own annual cash incentive in March 2004 plus the additional shares arising as a result of sharekicker. The closing market price of the Group’s ordinary shares on the date of release was £10.81.
3.Long-term Incentive Plan and Special Long-term Bonus Plan - HBOS Executive Directors and Chairman Details of the shares which have been conditionally awarded to Executive Directors and the Chairman under the plans are set out below. The performance conditions relating to these conditional awards are set out in the notes below the table (see next page).

25
Directors' Report (continued)
Table 3 Grant At 31 Granted (G) or Added as Dividend Vested At effective Dec 06 Lapsed (L) a result of reinvestment in year 31 Dec 07 from in year superior shares performance
Peter Cummings January 2003 18,750 18,750 January 2004 27,894 4,260 4,069 36,223 January 2005 23,809 23,809 January 2006 51,203 51,203 January 2007 67,855 (G) 67,855
121,656 161,617
Jo Dawson January 2004 25,569 3,905 3,730 33,204 January 2005 27,380 27,380 January 2006 39,285 39,285 January 2007 59,522 (G) 59,522
92,234 126,187
Mike Ellis January 2004 75,313 11,503 10,987 97,803 January 2007 20,114 (G) 20,114
75,313 20,114
Philip Gore-Randall January 2007 18,718 (G) 18,718
18,718
Phil Hodkinson January 2004 55,788 8,521 8,139 72,448 January 2005 52,380 52,380 January 2006 58,883 58,883 January 2007 73,212 (G) 73,212
167,051 184,475
Andy Hornby January 2004 80,195 12,249 11,700 104,144 January 2005 72,619 72,619 January 2006 70,148 70,148 January 2007 103,568 (G) 103,568
222,962 246,335
Colin Matthew January 2004 54,393 8,308 7,935 70,636 January 2005 52,380 52,380 January 2006 56,323 56,323 January 2007 68,450 (G) 68,450
163,096 177,153
Dennis Stevenson January 2004 73,221 10,480 12,106 95,807 January 2005 65,476 65,476 January 2006 58,883 58,883 January 2007 60,714 (G) 60,714
197,580 185,073
Dan Watkins January 2004 15,275 2,333 2,228 19,836 January 2005 21,428 21,428 January 2006 18,433 18,433 January 2007 41,163 (G) 41,163
55,136 81,024

26
Directors' Report (continued)
Notes to Table 3
Note 1: Shares under these plans were granted using the average market price in the ten business days ending at the previous year, as follows:
Plan and performance period Share grant price £
Jan 03 - Dec 05/07 6.40 Jan 04 - Dec 06 7.17 Jan 05 - Dec 07 8.40 Jan 06 - Dec08 9.77 Jan 07 - Dec 09 11.20
Note 2: The 30,425 shares awarded to Benny Higgins in May 2006, on terms set out in last year's report, were released to him on 8 January 2008 under the terms of his leaving arrangements. The closing market price of the Group's ordinary shares on the date of release was £6.97.
Note 3: Awards are not pensionable.
Note 4: The performance period for the January 2004 grant ended on 31 December 2006. HBOS’s TSR over the performance period exceeded the weighted average of the comparator group by 3.40% p.a. so 113.33% of share grants were released to grant recipients. The shares granted in January 2004 vested on 28 February 2007. The closing market price of the Group’s ordinary shares on that date was £10.81. In addition, dividend reinvestment shares have been released to grant recipients as set out in the table and as provided for under the rules of the plans. The dividend reinvestment shares are the additional shares which would have accrued on the overall share grants actually released had dividends due during the performance period been reinvested in shares.
Note 5: As explained in last year’s report, for the 2003 grants, all participants could choose to take any shares released after three years based on the three-year performance outcome or could continue to participate in the plan for a further two years and take shares at that point based on the better of the three-year and the five-year performance outcomes. This design feature sought to motivate participants continually to sustain strong performance, or to improve lesser performance, for their benefit and the benefit of shareholders. This feature does not apply for the 2004 grants and does not apply for any grants in subsequent years, to reflect the preference on ‘retesting’ expressed by most major institutional investors. With the exception of Peter Cummings, all Executive Directors chose to take their 2003 grants in 2006 based on the three year performance outcome.
Note 6:
Subject to performance, the shares granted under the long term plan effective from January 2005 will be released to most individuals shortly after the three-year anniversary of the grant date, in March 2008.
Note 7:
In the case of the Chairman, it is not possible to include him in the standard Long-term Incentive Plan. Nor is it possible to include him in such an arrangement where the grant is denominated in shares. He is therefore included as the sole participant in the Special Long-term Bonus Plan where the grants are awards of notional shares. He will become entitled to the cash value of any notional shares on vesting but has agreed that this value will, subject to any withholdings for income tax or National Insurance, be applied in acquiring HBOS shares on his behalf.
Note 8:
The number of shares to be released to participants is dependent on the HBOS Group’s annualised TSR over a three year period, compared to the annualised weighted average TSR of a basket of comparator companies over an equivalent period. For the grant effective from January 2003, a five year period can also apply. This basket of companies comprises:
- for the January 2003 and 2004 grants: Abbey National, Aviva, Barclays, Legal & General, Lloyds TSB, Prudential, Royal & Sun Alliance and Royal Bank of Scotland, but with Abbey National replaced by Alliance & Leicester, Bradford & Bingley and Northern Rock with effect from 1 July 2004. The Committee decided to remove Abbey National from the comparator group, in respect of the January 2003 and 2004 grants, effective from the end of June 2004 (immediately before bid activity started) and replace it with Alliance & Leicester, Bradford & Bingley and Northern Rock effective from the start of July 2004;
- for the January 2005 and subsequent grants: Alliance & Leicester, Aviva, Barclays, Bradford & Bingley, Legal & General, Lloyds TSB, Northern Rock, Prudential, Royal & Sun Alliance and Royal Bank of Scotland. The weighting of this basket was amended with effect from January 2007 to better match the business profile of the HBOS Group. This amendment applies to all future awards and to outstanding awards for performance from 1 January 2007 onwards.
Shares have been or will be released as follows:
Group's relative TSR performance Amount released as a % of share grant
0% p.a. (or below) 0 +3% p.a. 100* +6% p.a. (or above) 200

27
Directors' Report (continued)
Intermediate positions are determined by interpolation.
* Shown as granted in the table 3.
Note 9:
The performance period for the January 2005 grant ended on 31 December 2007. HBOS’s TSR over the performance period fell short of the weighted average of the comparator group by 2.63% p.a., so no share grants will be released to grant recipients in March 2008.
The performance period for the January 2006 grant does not end until 31 December 2008. So far, HBOS’s TSR over the two year elapsed period falls short of the weighted average of the comparator group by 12.99%.
The performance period for the January 2007 grant does not end until 31 December 2009. So far, HBOS's TSR over one year elapsed period falls short of the weighted average of the comparator group by 8.76%.
Note 10: An additional deferred incentive payable to Peter Cummings to recognise and respond to market practice in his divisional specialism was £1,320,000. This award will vest shortly after 31 December 2010 and will be payable to him in shares, which will be purchased at the prevailing market price at that time.
4. Long-term Incentive Plan - Share Options
HBOS Executive Directors are not awarded executive share options.
The share options under the Bank of Scotland plans are exercisable in accordance with the rules of the plans, all performance targets having been satisfied, as set out in last year’s report.
No further share options have been, or can be, granted under these plans.
Details of the options outstanding under these plans in respect of Executive Directors are set out below:
Table 4 Option effective At 31 Dec 2006/ Granted (G) Share from 1 Jan 2007 exercised (E) option or lapsed (L) price in year £ Exercisable
Colin Matthew October 1997 28,000 28,000(E) 5.3533 October 1998 5,223 5,223(E) 5.7433 October 1998 29,777 29,777(E) 5.8350 May 2000 40,000 40,000(E) 5.5150 October 2000 40,000 40,000(E) 6.1000
143,000
Notes to Table 4
Note 1: On 28 March 2007, Colin Matthew exercised options over 28,000 shares granted effective from October 1997 and 35,000 shares granted effective from October 1998; and on 29 May 2007, exercised 40,000 shares granted effective from May 2000 and 40,000 granted effective from October 2000. The closing market price of the Group's ordinary shares on these dates of exercise were £10.46 and £10.68 respectively. The aggregate gain on exercise was £695,141.
Note 2: Jo Dawson and Dan Watkins have share options under the HBOS all-employee plan which were granted before they were appointed Executive Directors or to Level 9 or Level 8. Jo Dawson has options over 3,727 shares granted effective from April 2002 at an option price of £7.512. These are exercisable between 1 January 2008 and 14 April 2008. Dan Watkins has options over 5,192 shares granted effective from March 2004 at an option price of £7.125. These are exercisable between 1 January 2008 and 15 March 2010. There are no performance conditions.
5. Sharesave Plan
The sharesave plan is available to all UK based Group colleagues.
The plan allows colleagues to save a fixed amount of money on a monthly basis. At the end of a pre-determined period, of three, five or seven years, colleagues have the right, if they so choose, to use the funds accumulated to purchase shares in the Group at a fixed price, based on a market price or an average market price determined around the invitation date and discounted by up to 20%. There are no performance conditions.
Certain Executive Directors have taken up membership of the plan and the projected numbers of shares which they would be entitled to purchase at the end of the relevant pre-determined periods are set out over:
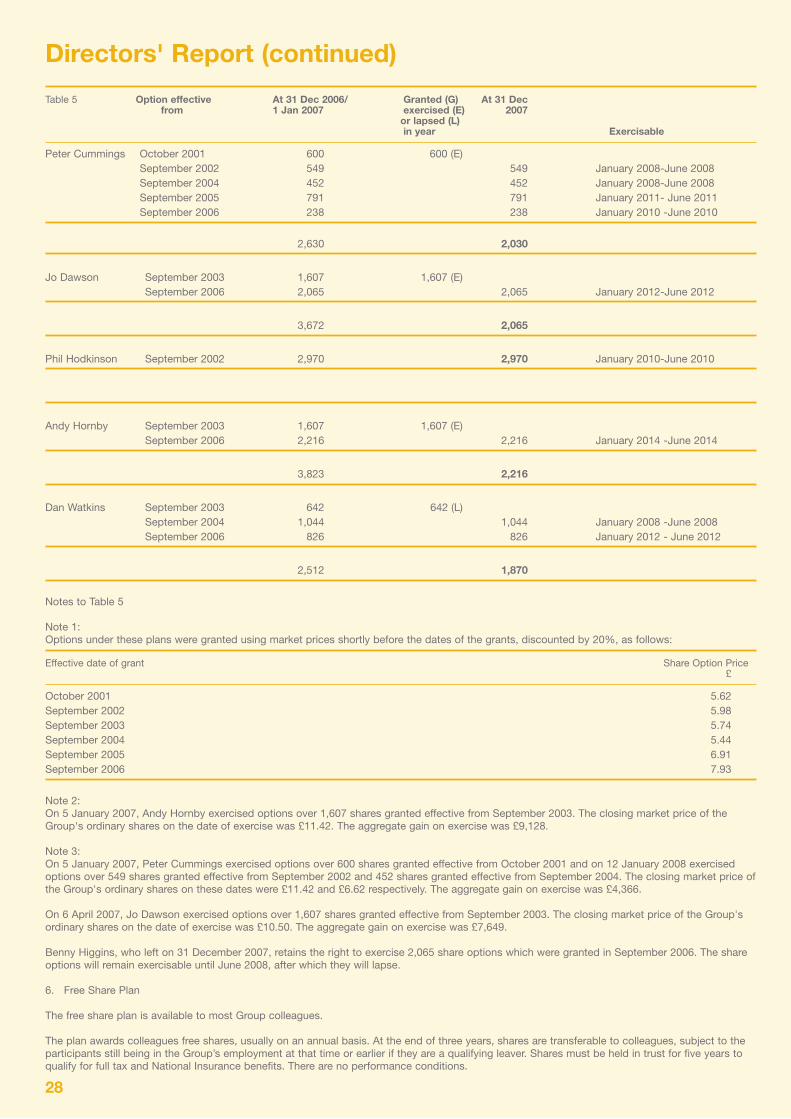
28
Directors' Report (continued)
Table 5 Option effective At 31 Dec 2006/ Granted (G) At 31 Dec from 1 Jan 2007 exercised (E) 2007 or lapsed (L) in year Exercisable
Peter Cummings October 2001 600 600 (E) September 2002 549 549 January 2008-June 2008 September 2004 452 452 January 2008-June 2008 September 2005 791 791 January 2011- June 2011 September 2006 238 238 January 2010 -June 2010
2,630 2,030
Jo Dawson September 2003 1,607 1,607 (E) September 2006 2,065 2,065 January 2012-June 2012
3,672 2,065
Phil Hodkinson September 2002 2,970 2,970 January 2010-June 2010
Andy Hornby September 2003 1,607 1,607 (E) September 2006 2,216 2,216 January 2014 -June 2014
3,823 2,216
Dan Watkins September 2003 642 642 (L) September 2004 1,044 1,044 January 2008 -June 2008 September 2006 826 826 January 2012 - June 2012
2,512 1,870
Notes to Table 5
Note 1: Options under these plans were granted using market prices shortly before the dates of the grants, discounted by 20%, as follows:
Effective date of grant Share Option Price £
October 2001 5.62 September 2002 5.98 September 2003 5.74 September 2004 5.44 September 2005 6.91 September 2006 7.93
Note 2: On 5 January 2007, Andy Hornby exercised options over 1,607 shares granted effective from September 2003. The closing market price of the Group's ordinary shares on the date of exercise was £11.42. The aggregate gain on exercise was £9,128.
Note 3: On 5 January 2007, Peter Cummings exercised options over 600 shares granted effective from October 2001 and on 12 January 2008 exercised options over 549 shares granted effective from September 2002 and 452 shares granted effective from September 2004. The closing market price of the Group's ordinary shares on these dates were £11.42 and £6.62 respectively. The aggregate gain on exercise was £4,366.
On 6 April 2007, Jo Dawson exercised options over 1,607 shares granted effective from September 2003. The closing market price of the Group's ordinary shares on the date of exercise was £10.50. The aggregate gain on exercise was £7,649.
Benny Higgins, who left on 31 December 2007, retains the right to exercise 2,065 share options which were granted in September 2006. The share options will remain exercisable until June 2008, after which they will lapse.
6. Free Share Plan
The free share plan is available to most Group colleagues.
The plan awards colleagues free shares, usually on an annual basis. At the end of three years, shares are transferable to colleagues, subject to the participants still being in the Group’s employment at that time or earlier if they are a qualifying leaver. Shares must be held in trust for five years to qualify for full tax and National Insurance benefits. There are no performance conditions.

29
Directors' Report (continued)
All Executive Directors, with the exception of Mike Ellis and Philip Gore-Randall who were appointed after the qualifying date, have taken up membership of the plan and the projected number of shares which they would be entitled to at the end of the relevant period are set out below:
Table 6 Grant effective At 31 Dec 2006/ Awarded (A) Dividend At 31 Dec Releasable from 1 Jan 2007 Released (R) reinvestment 2007 or Forfeit (F) shares in year acquired in year
Peter Cummings August 2005 347 15 362 August 2008 August 2006 311 14 325 August 2009 August 2007 317 (A) 5 322 August 2010
658 1,009
Jo Dawson August 2005 347 15 362 August 2008 August 2006 311 14 325 August 2009 August 2007 317 (A) 5 322 August 2010
658 1,009
Phil Hodkinson August 2005 347 15 362 August 2008 August 2006 311 14 325 August 2009 August 2007 317 (A) 5 322 August 2010
658 1,009
Andy Hornby August 2005 347 15 362 August 2008 August 2006 311 14 325 August 2009 August 2007 317 (A) 5 322 August 2010
658 1,009
Colin Matthew August 2005 347 15 362 August 2008 August 2006 311 14 325 August 2009 August 2007 317 (A) 5 322 August 2010
658 1,009
Dan Watkins August 2005 347 15 362 August 2008 August 2006 311 14 325 August 2009 August 2007 317 (A) 5 322 August 2010
658 1,009
Notes to Table 6
Note 1:
Shares were awarded at £9.10, £9.74 and £9.45 in August 2005, August 2006 and August 2007 respectively being the middle market price of the Group’s ordinary shares on the days immediately preceding the dates of the awards.
Note 2:
Participants in this plan have an interest in dividends on the free shares (in the form of dividend shares) as and when they become due. Dividends were paid on 14 May 2007 and 8 October 2007 and were reinvested in shares. The closing market price of the Group’s ordinary shares on these dates was £10.77 and £9.56 respectively. Dividend reinvestment shares are required to be held for three years from the dates of payment.
Note 3:
On 8 February 2008, 648 shares were released from the trust on behalf of Benny Higgins who left on 31 December 2007. The closing market price of the Group’s ordinary shares on the date of release was £6.58. He has no remaining shares under the plan.
7. Interest in Shares under Trusts
Certain Executive Directors, together with certain other colleagues, are deemed to have or have had an interest or a potential interest as potential discretionary beneficiaries under:

30
Directors' Report (continued)- the Group’s Employee Share Ownership Trusts. As such, they were each treated as at 31 December 2007 as being interested in the 9,701,897 ordinary shares (31 December 2006 - 5,405,010 ordinary shares) held by the trustees of these Trusts. The shares held in the Trusts will be used to satisfy share awards under short term and long term incentive plans. The relevant Executive Directors’ specific individual interests are shown in tables 2 and 3;
- the Group’s Qualifying Employee Share Ownership Trust. As such, they were each treated as at 31 December 2007 as being interested in the 88,301 ordinary shares (31 December 2006 - 1,697,350 ordinary shares) held by the trustee of this Trust. The shares held in the Trust will be used to satisfy entitlements of colleagues arising on the exercise of options under the Sharesave Plan. The relevant Executive Directors’ specific individual interests are shown in table 5; and
- the Group’s Share Incentive Plan Trust. As such, they were each treated as at 31 December 2007 as being interested in the 20,087,238 ordinary shares (31 December 2006 - 12,964,303 ordinary shares) held by the trustees of this Trust. The shares held in the Trust will be used to satisfy share awards under the Free Share and Sharebuy Plans. The relevant Executive Directors’ specific individual interests are shown in table 6.
In cases where the beneficiaries of the Group's Employee Share Ownership Trusts do not have the right to direct the trustees how to vote on shares held in the Trusts, the trustees may vote in a way they see fit.
All of the Group’s share plans empower new issue shares to be allotted to satisfy share requirements. The Group’s past practice has generally been to purchase shares in the market in relation to the plans described in Sections 2, 3 and 6 and to issue new shares in relation to the plans described in Sections 4 and 5 and the Group’s all-employee share option scheme. This practice was reviewed in 2007, and as a consequence, purchased shares were also used to a large extent to satisfy awards in relation to the plan described in Section 5 and the Group’s all-employee share option scheme. New issue shares were used to satisfy awards made under the plan described in Section 6. The method by which share plan requirements are satisfied will again be reviewed in 2008 and any changes to the 2007 practice will be set out in next year's report.
8. General
The closing market price of the Group’s ordinary shares at 31 December 2007 was £7.35. The closing market price of the Group’s ordinary shares at 31 December 2006 was £11.32. The range during the year was £7.13 to £11.67.
Other than as set out in this report, there has been no change in the Directors' interests in shares or options granted by the Group between the end of the financial year and 26 February 2008, the date of approval of this Annual Report and Accounts.

31
Statement of Directors’ responsibilities in respect of the Annual Report and the financial statements
The Directors are responsible for preparing the Annual Report and the group and parent company ("Bank") financial statements in accordance with applicable law and regulations.
Company law requires the Directors to prepare group and Bank company financial statements for each financial year. They are required to prepare the group financial statements in accordance with International Financial Reporting Standards (‘IFRS’) as adopted by the EU and have elected to prepare the Bank financial statements on the same basis.
The group and Bank financial statements are required by law and IFRS as adopted by the EU to fairly present the financial position of the group and the Bank and the performance for that period; the Companies Act 1985 provides in relation to such financial statements that references in the relevant part of that Act to financial statements giving a true and fair view are references to their achieving a fair presentation.
In preparing each of the group and Bank financial statements, the Directors are required to:
- select suitable accounting policies and then apply them consistently;
- make judgements and estimates that are reasonable and prudent;
- state whether they have been prepared in accordance with IFRS as adopted by the EU; and
- prepare the financial statements on the going concern basis unless it is inappropriate to presume that the group and the Bank will continue in business.
The Directors are responsible for keeping proper accounting records that disclose with reasonable accuracy at any time the financial position of the parent company and enable them to ensure that its financial statements comply with the Companies Act 1985. They have general responsibility for taking such steps as are reasonably open to them to safeguard the assets of the group and to prevent and detect fraud and other irregularities.
Under applicable law and regulations, the Directors are also responsible for preparing a Directors’ Report and Business Review.

32
Independent auditors’ report to the members of Bank of Scotland plc
We have audited the consolidated and Bank financial statements (the ‘financial statements’) of the Bank of Scotland plc for the year ended 31 December 2007 which comprise consolidated Income Statement, the consolidated and Bank Balance Sheets, the consolidated and Bank Cash Flow Statements, the consolidated and Bank Statements of Recognised Income and Expense and the related notes. The financial statements have been prepared under the accounting policies set out therein.
This report is made solely to the Bank’s members, as a body, in accordance with section 235 of the Companies Act 1985. Our audit work has been undertaken so that we might state to the Bank’s members those matters we are required to state to them in an auditor’s report and for no other purpose. To the fullest extent permitted by law, we do not accept or assume responsibility to anyone other than the Bank and the Bank’s members as a body, for our audit work, for this report, or for the opinions we have formed.
Respective responsibilities of directors and auditors
The Directors’ responsibilities for preparing the Annual Report, Directors’ Report and the financial statements in accordance with applicable law and International Financial Reporting Standards (IFRSs) as adopted by the EU are set out in the Statement of Directors’ Responsibilities on page 31.
Our responsibility is to audit the financial statements in accordance with relevant legal and regulatory requirements and International Standards on Auditing (UK and Ireland).
We report to you our opinion as to whether the financial statements give a true and fair view and are properly prepared in accordance with the Companies Act 1985. We also report to you if, in our opinion, the information given in the Directors’ Report is consistent with the financial statements. The information given in the Directors’ Report includes that specific information presented in the Annual Report that is cross referred from the Business Review section of the Directors’ Report.
In addition we report to you if, in our opinion, the Bank has not kept proper accounting records, if we have not received all the information and explanations we require for our audit, or if information specified by law regarding Directors’ remuneration and other transactions is not disclosed.
We read the other information contained in the Annual Report and consider whether it is consistent with the audited financial statements. We consider the implications for our report if we become aware of any apparent misstatements or material inconsistencies with the financial statements. Our responsibilities do not extend to any other information.
Basis of audit opinion
We conducted our audit in accordance with International Standards on Auditing (UK and Ireland) issued by the Auditing Practices Board. An audit includes examination, on a test basis, of evidence relevant to the amounts and disclosures in the financial statements. It also includes an assessment of the significant estimates and judgments made by the directors in the preparation of the financial statements, and of whether the accounting policies are appropriate to the group’s and Bank’s circumstances, consistently applied and adequately disclosed.
We planned and performed our audit so as to obtain all the information and explanations which we considered necessary in order to provide us with sufficient evidence to give reasonable assurance that the financial statements are free from material misstatement, whether caused by fraud or other irregularity or error. In forming our opinion we also evaluated the overall adequacy of the presentation of information in the financial statements.
Opinion
In our opinion:
- the consolidated financial statements give a true and fair view, in accordance with IFRSs as adopted by the EU, of the state of the group’s affairs as at 31 December 2007 and of its profit for the year then ended;
- the Bank financial statements give a true and fair view, in accordance with IFRSs as adopted by the EU as applied in accordance with the provisions of the Companies Act 1985, of the state of the Bank’s affairs as at 31 December 2007;
- the financial statements have been properly prepared in accordance with the Companies Act 1985, and as regards the group financial statements , Article 4 of the IAS Regulation; and
- the information given in the Directors’ Report is consistent with the financial statements.
KPMG Audit Plc
Chartered Accountants
Registered Auditor
Edinburgh
26 February 2008

33
Consolidated Income Statement For the year ended 31 December 2007
2007 2006 Notes £m £m
Interest income 36,354 22,645Interest expense (28,728) (18,522)
Net interest income 1 7,626 4,123Fees and commission income 2,360 894Fees and commission expense (396) (157)Net earned premiums on insurance contracts 245 21Net trading income 1 185 290 Net investment income related to insurance and investment business 37 Other operating income 2,292 1,049
Net operating income (continuing operations) 1 12,349 6,220Change in investment contract liabilities (7) (11)Net claims incurred on insurance contracts (105) (2)Net change in insurance contract liabilities (21) (6)Administrative expenses 2 (4,187) (1,869)Depreciation and amortisation Intangible assets other than goodwill 16 (130) (36) Property and equipment 17 (218) (59) Operating lease assets 19 (985) (501)
(1,333) (596)Goodwill impairment 16 (41)
Operating expenses (5,653) (2,525)Impairment losses on loans and advances 12 (2,012) (944)Impairment losses on investment securities (60) (71)
Operating profit (continuing operations) 4,624 2,680Share of profits of jointly controlled entities 14 241 139Share of profits of associates 14 13Non-operating income 1 87 189
Profit before taxation 6 4,952 3,021Tax on profit 7 (1,318) (801)
Profit after taxation 3,634 2,220Profit of disposal group held for sale 9 4 5
Profit for the year 3,638 2,225
Attributable to:Parent company shareholders 3,608 2,189Minority interests 30 36
3,638 2,225
The comparative figures are those of the Governor and Company of Bank of Scotland as published in the 2006 Annual Report and Accounts.
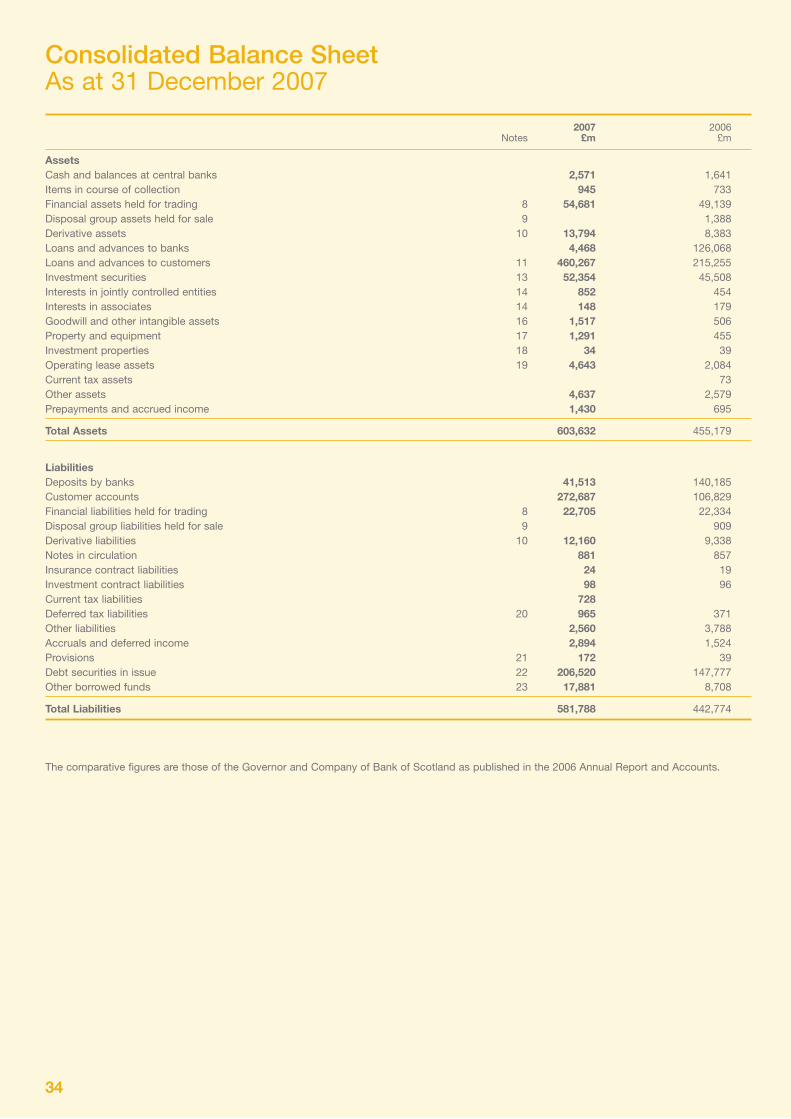
34
Consolidated Balance Sheet As at 31 December 2007
2007 2006 Notes £m £m
AssetsCash and balances at central banks 2,571 1,641Items in course of collection 945 733Financial assets held for trading 8 54,681 49,139Disposal group assets held for sale 9 1,388Derivative assets 10 13,794 8,383Loans and advances to banks 4,468 126,068Loans and advances to customers 11 460,267 215,255Investment securities 13 52,354 45,508Interests in jointly controlled entities 14 852 454Interests in associates 14 148 179 Goodwill and other intangible assets 16 1,517 506Property and equipment 17 1,291 455Investment properties 18 34 39Operating lease assets 19 4,643 2,084Current tax assets 73Other assets 4,637 2,579Prepayments and accrued income 1,430 695
Total Assets 603,632 455,179
LiabilitiesDeposits by banks 41,513 140,185Customer accounts 272,687 106,829Financial liabilities held for trading 8 22,705 22,334Disposal group liabilities held for sale 9 909Derivative liabilities 10 12,160 9,338Notes in circulation 881 857Insurance contract liabilities 24 19Investment contract liabilities 98 96Current tax liabilities 728 Deferred tax liabilities 20 965 371Other liabilities 2,560 3,788Accruals and deferred income 2,894 1,524Provisions 21 172 39Debt securities in issue 22 206,520 147,777Other borrowed funds 23 17,881 8,708
Total Liabilities 581,788 442,774
The comparative figures are those of the Governor and Company of Bank of Scotland as published in the 2006 Annual Report and Accounts.
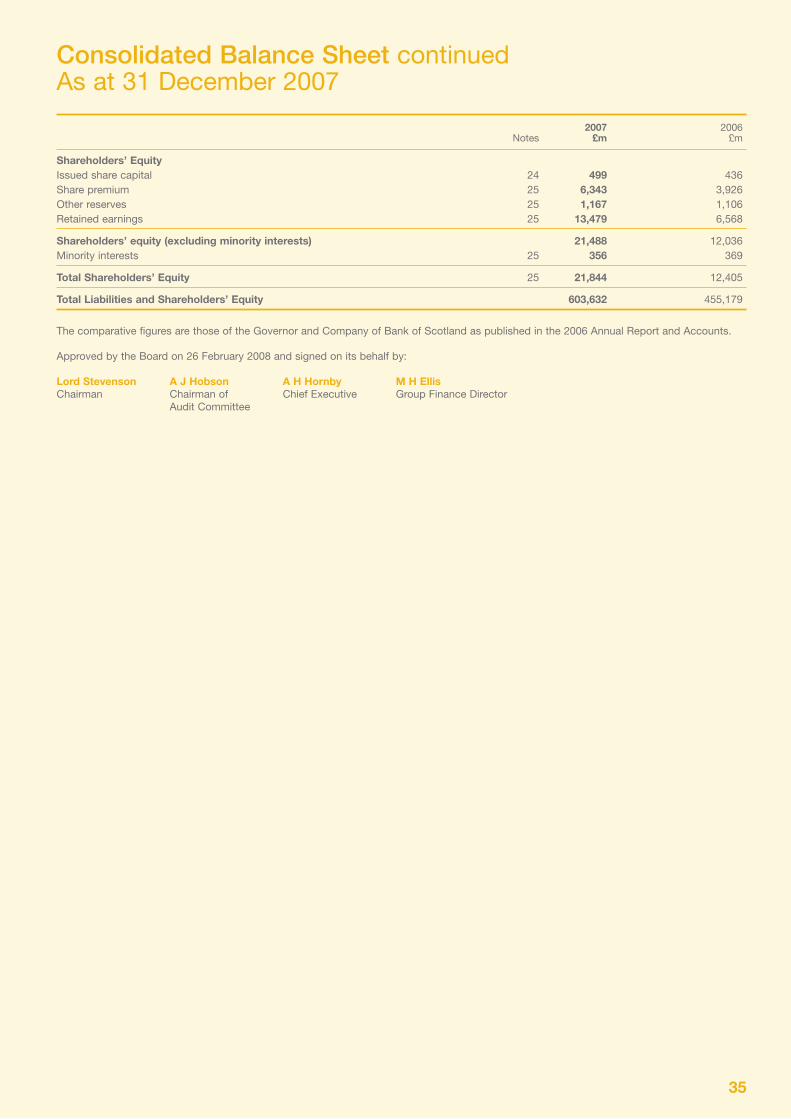
35
Consolidated Balance Sheet continuedAs at 31 December 2007
2007 2006 Notes £m £m
Shareholders’ EquityIssued share capital 24 499 436Share premium 25 6,343 3,926Other reserves 25 1,167 1,106Retained earnings 25 13,479 6,568
Shareholders’ equity (excluding minority interests) 21,488 12,036Minority interests 25 356 369
Total Shareholders’ Equity 25 21,844 12,405
Total Liabilities and Shareholders’ Equity 603,632 455,179
The comparative figures are those of the Governor and Company of Bank of Scotland as published in the 2006 Annual Report and Accounts.
Approved by the Board on 26 February 2008 and signed on its behalf by:
Lord Stevenson A J Hobson A H Hornby M H Ellis Chairman Chairman of Chief Executive Group Finance Director Audit Committee

36
Consolidated Statement of Recognised Income and ExpenseFor the year ended 31 December 2007
2007 2006 £m £m
Net actuarial gain from defined benefit plans (net of tax) 71Capital contribution 515Tax relief on share plans 25Foreign exchange translation 8 (33)Available for sale investments: Net change in fair value (net of tax) (336) 186 Net gains transferred to the income statement (net of tax) (184) (163)Cash flow hedges: Effective portion of changes in fair value taken to equity (net of tax) (216) 187 Net (gains)/losses transferred to the income statement (net of tax) (292) 86
Net (expense)/income recognised directly in equity (1,020) 874Profit for the year 3,638 2,225
Total recognised income and expense 2,618 3,099
Attributable to: Parent company shareholders 2,576 3,063 Minority interests 42 36
2,618 3,099
The comparative figures are those of the Governor and Company of Bank of Scotland as published in the 2006 Annual Report and Accounts.
Consolidated Cash Flow Statement For the year ended 31 December 2007
2007 2006 £m £m
Profit before taxation 4,952 3,021Adjustments for: Impairment losses on loans and advances 2,012 944Depreciation and amortisation 1,333 596Goodwill impairment 41Interest on other borrowed funds 915 499Cash contribution for defined benefit schemes (228)Movement in derivatives held for trading (2,276) 2,159Exchange differences (1,430) 3,625Other non cash items (914) 29Net change in operating assets (80,748) (83,552)Net change in operating liabilities 67,606 80,438
Net cash flows from operating activities before tax (8,550) 7,572Income taxes paid (792) (889)
Cash flows from operating activities (9,342) 6,683Cash flows from investing activities (240) (217)Cash flows from financing activities 4,516 130
Net decrease in cash and cash equivalents (5,066) 6,596Transfer in under HBOS Reorganisation (27,265) Opening cash and cash equivalents 33,826 27,230
Closing cash and cash equivalents 1,495 33,826
The comparative figures are those of the Governor and Company of Bank of Scotland as published in the 2006 Annual Report and Accounts.

37
Consolidated Cash Flow Statement continuedFor the year ended 31 December 2007
Analysis of Cash and Cash Equivalents
2007 2006 £m £m
Cash and balances at central banks repayable on demand 1,060 1,631Loans and advances to banks repayable with an original maturity of less than three months 435 32,195
Closing cash and cash equivalents 1,495 33,826
Investing Activities
2007 2006 £m £m
Sale of other intangible assets 33 5Purchase of other intangible assets (242) (92)Sale of property and equipment 180 32Purchase of property and equipment (297) (67)Sale of investment properties 52 2Investment in subsidiaries (28) (77)Disposal of subsidiaries 115 87Investment in jointly controlled entities and associates (371) (198)Disposal of jointly controlled entities and associates 176 22Dividends received from jointly controlled entities 132 57Dividends received from associates 10 12
Cash flows from investing activities (240) (217)
Financing Activities
2007 2006 £m £m
Issue of shares 2,480 1,001Issue of other borrowed funds 5,156 1,478Repayments of other borrowed funds (598) (726)Minority interest acquired 98 365Minority interest disposed (32)Equity dividends paid (1,672) (1,425)Dividends paid to minority shareholders in subsidiary undertakings (43) (29)Interest on other borrowed funds relating to servicing of finance (905) (502)
Cash flows from financing activities 4,516 130
The comparative figures are those of the Governor and Company of Bank of Scotland as published in the 2006 Annual Report and Accounts.

38
Bank Balance SheetAs at 31 December 2007
2007 2006 Notes £m £m
AssetsCash and balances at central banks 1,294 1,059 Items in course of collection 890 667 Financial assets held for trading 52,169 Derivative assets 10 12,134 47Loans and advances to banks 25,831 53,154Loans and advances to customers 11 453,590 120,693Investment securities 13 27,020 397 Interests in jointly controlled entities 14 103 2Interests in associates 14 67Interests in group undertakings 15 3,273 2,493Goodwill and other intangible fixed assets 16 783 174Property and equipment 17 1,108 270 Current tax assets 146Deferred tax assets 20 152 205 Other assets 4,393 328Prepayments and accrued income 1,292 507
Total Assets 584,032 180,209
Liabilities Deposits by banks 47,321 92,194Customer accounts 316,849 68,674 Financial liabilities held for trading 22,145 Derivative liabilities 10 10,546 55Notes in circulation 881 857Current tax liabilities 544 Other liabilities 1,735 392Accruals and deferred income 1,654 756Provisions 21 135 3Debt securities in issue 22 149,188 1,046Other borrowed funds 23 14,855 7,427
Total Liabilities 565,853 171,404 Shareholders’ Equity Issued share capital 24 499 436Share premium 25 6,343 3,926Other reserves 25 1,296 571Retained earnings 25 10,041 3,872
Total Shareholders' equity 18,179 8,805
Total Liabilities and Shareholders’ Equity 584,032 180,209
The comparative figures are those of the Governor and Company of Bank of Scotland as published in the 2006 Annual Report and Accounts.
By virtue of the exemption contained within Section 230 of the Companies Act 1985, the income statement of the Bank is not presented. Of the profit attributable to shareholders £2,420m (2006 £1,818m) is dealt with in the accounts of the Bank.
Approved by the Board on 26 February 2008 and signed on its behalf by:
Lord Stevenson A J Hobson A H Hornby M H Ellis Chairman Chairman of Chief Executive Group Finance Director Audit Committee
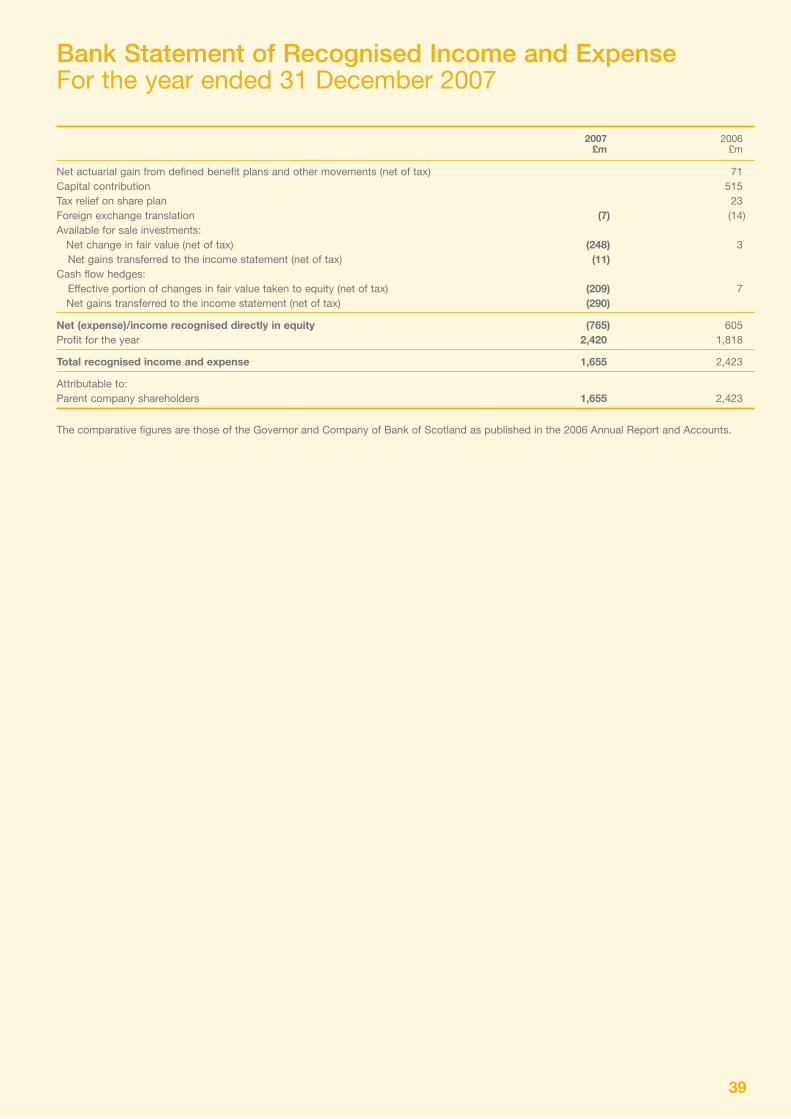
39
Bank Statement of Recognised Income and ExpenseFor the year ended 31 December 2007
2007 2006 £m £m
Net actuarial gain from defined benefit plans and other movements (net of tax) 71Capital contribution 515Tax relief on share plan 23Foreign exchange translation (7) (14)Available for sale investments: Net change in fair value (net of tax) (248) 3 Net gains transferred to the income statement (net of tax) (11) Cash flow hedges: Effective portion of changes in fair value taken to equity (net of tax) (209) 7 Net gains transferred to the income statement (net of tax) (290)
Net (expense)/income recognised directly in equity (765) 605Profit for the year 2,420 1,818
Total recognised income and expense 1,655 2,423
Attributable to: Parent company shareholders 1,655 2,423
The comparative figures are those of the Governor and Company of Bank of Scotland as published in the 2006 Annual Report and Accounts.

40
Bank Cash Flow StatementFor the year ended 31 December 2007
2007 2006 £m £m
Profit before taxation 3,452 2,303Adjustments for: Impairment losses on loans and advances 1,867 621Depreciation and amortisation 296 58Interest on other borrowed funds 784 391Cash contribution to defined benefit pension schemes (228) Dividends received from subsidiaries (707)Exchange differences (728) (161)Movements in derivatives held for trading (1,385) Other non-cash items (678) 259Net change in operating assets (106,229) (17,444)Net change in operating liabilities 76,703 23,367
Net cash flows from operating activities before tax (26,625) 9,166Income taxes paid (588) (696)
Cash flows from operating activities (27,213) 8,470Cash flows from investing activities 178 (78)Cash flows from financing activities 2,479 (56)
Net (decrease)/increase in cash and cash equivalents (24,556) 8,336Transfer in under HBOS Reorganisation (28,084) Opening cash and cash equivalents 53,331 44,995
Closing cash and cash equivalents 691 53,331
Analysis of Cash and Cash Equivalents
2007 2006 £m £m
Cash and balances at central banks 636 292Loans and advances to banks with an original maturity of less than three months 55 53,039
Closing cash and cash equivalents 691 53,331
Investing Activities
2007 2006 £m £m
Sale of other intangible assets 9 Purchase of other intangible assets (160) (53)Sale of property and equipment 116 12Purchase of property and equipment (255) (37)Investment in subsidiary undertakings (210) Investment in jointly controlled entities and associates (36) Disposal of jointly controlled entities and associates 7 Dividends received from subsidiaries 707
Cash flows from investing activities 178 (78)
Financing Activities
2007 2006 £m £m
Issue of ordinary stock 2,480 1,001Issue of other borrowed funds 3,020 1,000Repayments of other borrowed funds (565) (237)Equity dividends paid (1,672) (1,425)Interest on other borrowed funds relating to servicing of finance (784) (395)
Cash flows from financing activities 2,479 (56)
The comparative figures are those of the Governor and Company of Bank of Scotland as published in the 2006 Annual Report and Accounts.
41
Notes to the AccountsAccounting Policies
Financial StatementsThe financial statements comprise the Consolidated Income Statement and the Consolidated and Bank Balance Sheets, Cash Flow Statements and Statements of Recognised Income and Expense together with the related Notes to the Accounts. The notes include information contained in the Business Review on pages 1 to 7 and in the Risk Report on pages 8 to 19 that are cross-referenced into the financial statements. These disclosures are required under IAS 1 'Presentation of Financial Statements' relating to the management of capital and IFRS 7 'Financial Instruments: Disclosures' relating to the nature of risks and their management. These disclosures form an integral part of the financial statements and are prefaced as such on the respective pages.
Statement of complianceThe financial statements have been prepared in accordance with International Financial Reporting Standards ('IFRS') and interpretations issued by the International Financial Reporting Interpretations Committee ('IFRIC') as adopted by the European Union. The group has not utilised the 'carve-out' provisions in respect of full fair value and portfolio hedging of core deposits in IAS 39 'Financial Instruments: Recognition and Measurement' as adopted by the European Union, the financial statements comply with International Financial Reporting Standards ('IFRS'). The standards applied by the group and Bank are those endorsed by the European Union and effective at the date the consolidated IFRS financial statements are approved by the Board.
The financial statements also comply with the relevant provisions of Part VII of the Companies Act 1985, as amended by the Companies Act 1985 (International Accounting Standards and Other Accounting Amendments) Regulations 2004.
On 17 September 2007, in accordance with the provisions of the HBOS Group Reorganisation Act 2006 (" the Act"), the Governor and Company of the Bank of Scotland registered as a public limited company under the Companies Act and changed its name to Bank of Scotland plc. On the same day, under the Act, the business activities, assets (including investments in subsidiaries) and liabilities of CAPITAL BANK plc and HBOS Treasury Services plc, (subsidiaries of the Governor and Company of the Bank of Scotland), and Halifax plc, (a subsidiary of HBOS plc), transferred to Bank of Scotland plc. IFRS does not have a specific accounting policy that covers group reconstructions. Accordingly, the Bank has adopted merger accounting with effect from 1 January 2007 in preparing these financial statements. This follows the accounting treatment prescribed in the Act for accounting in the year in which the transfer becomes effective. It is also consistent with accounting for group reconstructions under UK generally accepted accounting principals, which the group has considered in the absence of specific IFRS guidance.
Merger accounting involves the transfer of assets and liabilities from the transferor to the Bank at their carrying value. They are treated as if they had always been assets and liabilities of the Bank and transactions that have occurred during the year and prior to the date of the transfer in the transferor bank are reported as these of the Bank. On transfer a statutory reserve is created representing the difference in the carrying value of the assets and liabilities transferred. Subsequently, this reserve has been reallocated to minority interests, available for sale, cash flow hedge reserve to mirror the previous accounting treatment of the underlying transactions in the transferor. A transfer from the statutory reserve to retained earnings is also made to reflect the amount of distributable reserves previously held in the transferor in accordance with the provisions of the HBOS Group Reorganisation Act 2006.
The statutory comparatives for 2006 are the audited financial statements for the Governor and Company of the Bank of Scotland that were published in the Bank's last Annual Report and Accounts.
Basis of preparationThe financial statements have been prepared under the historical cost basis, except that the following assets and liabilities are stated at their fair values: derivatives, financial instruments held for trading, financial instruments designated at fair value through the income statement, financial instruments classified as available for sale and investment properties.
IFRS Applied in 2007The following IFRS standards and International Financial Reporting Interpretations Committee (‘IFRIC’) interpretations have been applied in 2007: IFRS 7 ‘Financial Instruments: Disclosures’, the amendment to IAS 1 ‘Presentation of Financial Statements’ on capital disclosure, IFRIC 7 ‘Applying the Restatement Approach under IAS 29 Financial Reporting in Hyperinflationary Economies’, IFRIC 8 ‘Scope of IFRS 2 Share-based Payment’, IFRIC 9 ‘Reassessment of Embedded Derivatives’ and IFRIC 10 ‘Interim Financial Reporting and Impairment’. There is no material financial impact arising from the application of these standards and interpretations. The financial statements have been updated to include new disclosures arising from these standards and interpretations.
IFRS Not Yet AppliedThe following standards and interpretations have been adopted by the European Union but are not effective for the year ended 31 December 2007 and have not been applied in preparing the financial statements:
IFRS 8 ‘Operating Segments’ which is applicable for periods commencing on or after 1 January 2009. The application of this standard in 2007 would not have had any financial impact. During 2008 the group will be assessing the standard against its business model and the disclosures will be revised accordingly in the 2009 financial statements.
IFRIC 11 ‘Group and Treasury Share Transactions’ which is effective for periods commencing on or after 1 March 2007. The application of this interpretation in 2007 would not have affected the financial statements because the interpretation deals with accounting for share-based payments at subsidiary level. No material adjustment arises since these costs are recharged from the parent company HBOS plc.
In the Group and Bank the following standards and interpretations have not yet been adopted by the European Union, are not effective for the year ended 31 December 2007 and have not been applied in preparing the financial statements. Where appropriate disclosures will be revised in the financial statements in the year in which the standard or interpretation becomes applicable.
IAS 1 ‘Presentation of Financial Statements’ which is effective for periods commencing on or after 1 January 2009. The application of this revised standard in 2007 would not have had any financial impact on the financial statements. It will impact the presentation and format of the primary statements and notes and these disclosures will be revised accordingly in the 2009 financial statements.
42
Revised IAS 23 ‘Borrowing Costs’ which is applicable to borrowing costs related to qualifying assets for which the commencement date for capitalisation is on or after 1 January 2009. The application of this revised standard in 2007 would not have had a material impact on the financial statements.
IFRIC 12 ‘Service Concession Arrangements’ which is effective for periods commencing on or after 1 January 2008. The application of this interpretation in 2007 would not have had a material impact on the financial statements.
IFRIC 13 ‘Customer Loyalty Programmes’ which is effective for periods commencing on or after 1 July 2008. The application of this interpretation in 2007 would not have had a material impact on the financial statements.
IFRIC 14 ‘Defined Benefit Assets and Minimum Funding Requirements’ which is effective for periods commencing on or after 1 January 2008. The application of this interpretation in 2007 would not have affected the financial statements as the Group's defined benefit schemes are sponsored by HBOS plc.
The following standards have been issued during 2008, have not been endorsed by the European Union, are not effective for the year ended 31 December 2007 and have not been applied in preparing the financial statements:
IFRS 2 ‘Share-based Payments’ amendment on ‘Vesting Conditions and Cancellations’ which is effective for periods commencing on or after 1 January 2009.
Revised IFRS 3 ‘Business Combinations (2008)’ and revised IAS 27 ‘Consolidated and Separate Financial Statements (2008)’ are effective for periods commencing on or after 1 July 2009.
Amendments to IAS 32 'Financial Instruments: Presentation' and IAS 1 'Presentation of Financial Statements' - Puttable Financial Instruments and Obligations Arising on Liquidation are effective for periods commencing on or after 1 January 2009.
The group has been monitoring the progress of these revised standards through the discussion papers and exposure drafts issued and will assess their impact on the financial statements of the group during 2008.
The accounting policies below have been consistently applied to all periods presented in these financial statements. Certain comparative amounts have been reclassified to conform to the current year’s presentation.
Basis of Consolidation The consolidated financial statements include the results of the Bank and its subsidiary undertakings, together with the group’s interests in associates and jointly controlled entities.
The financial statements of entities controlled by the group are consolidated in the group financial statements commencing on the date control is obtained until the date control ceases. Control is defined as being where the group has power, directly or indirectly, to govern the financial and operating policies of such entities so as to obtain benefits from its activities. In assessing control, potential voting rights that presently are exercisable or convertible are taken into account. When assessing whether or not a special purpose entity (‘SPE’) that has been sponsored by the group should be consolidated or not, the group considers the indicators of control that are included in the Standing Interpretations Committee (‘SIC’) Interpretation 12 ‘Consolidation – Special Purpose Entities’ and if these are met the SPE is included in the consolidation.
All intra-group balances, transactions, income and expenses are eliminated on consolidation.
Recognition and Derecognition of Financial Assets and LiabilitiesThe group recognises loans and advances to customers and banks, deposits by banks, customer accounts, debt securities in issue, other borrowed funds and other financial assets and liabilities upon origination.
The group derecognises a financial asset when the contractual rights to the cash flows from the asset expire or it transfers the right to receive the contractual cash flows on the financial asset in a transaction in which substantially all the risks and rewards of ownership of the financial asset are transferred. Any interest in the transferred financial asset that is created or retained by the group is recognised as a separate asset.
The group derecognises a financial liability when its contractual obligations are discharged or cancelled or expire.
DerivativesDerivatives are measured at fair value and initially recognised on the date the contract is entered into. Where the fair value of a derivative is positive, it is carried as a derivative asset and where negative as a derivative liability. The gain or loss from changes in fair value is taken to net trading income, except for interest from derivatives used for economic hedging purposes that do not qualify for hedge accounting treatment which is taken to net interest income, insurance and investment related derivatives which are taken to net investment income related to insurance and investment business or when cash flow hedge accounting is employed.
Hedge accounting allows one financial instrument, generally a derivative such as a swap, to be designated as a hedge of another financial instrument such as a loan or deposit or a portfolio of the same. At inception of the hedge relationship formal documentation must be drawn up specifying the hedging strategy, the component transactions and the methodology that will be used to measure effectiveness.
Monitoring of hedge effectiveness is undertaken continually. A hedge is regarded as effective if the change in fair value or cash flows of the hedge instrument and the hedged item are negatively correlated within a range of 80% to 125%, either for the period since effectiveness was last tested or cumulatively since inception.
The group uses three hedge accounting methods.
Firstly, fair value hedge accounting offsets the change in the fair value of the hedging instrument against the change in the fair value of the hedged item in respect of the risk being hedged. The hedged item is adjusted for the fair value of the risk being hedged irrespective of its financial instrument classification. These changes in fair value are recognised in the income statement through net trading income. Adjustments made to the carrying amount of the hedged item for fair value hedges will be amortised on an effective interest rate basis over the remaining expected life in line with the presentation of the underlying hedged item. If the hedge is highly effective the net impact on the income statement is minimised.

43
Secondly, cash flow hedge accounting matches the cash flows of hedged items against the corresponding cash flow of the hedging derivative. The effective part of any gain or loss on a hedging instrument is recognised directly in equity in the cash flow hedge reserve and the hedged item is accounted for in accordance with the policy for that financial instrument. Any ineffective portion of the hedging instrument’s fair value is recognised immediately in the income statement through net trading income. The amount deferred in reserves remains until the designated transaction occurs at which time it is released and accounted for in the income statement in line with the treatment of the hedged item. Where the hedge relationship subsequently proves ineffective, or where the hedged item is settled early or is terminated, the associated gains and losses that were recognised directly in reserves are reclassified to the income statement through net trading income. Where the hedging instrument expires or is terminated before the forecast transaction occurs, the associated gains and losses recognised in reserves remain deferred until the forecast transaction occurs.
Thirdly, hedging of net investments in foreign operations is discussed within the foreign currencies accounting policy.
A derivative may be embedded in another financial instrument, known as the host contract. Where the economic characteristics and risks of an embedded derivative are not closely related to those of the host contract, the embedded derivative is separated from the host and held on balance sheet at fair value, except for those instruments that have been designated at fair value through the income statement where the derivative is not separated from the host instrument. Changes in fair value are taken to the income statement, through net trading income, and the host contract is accounted for in accordance with the policy for that class of financial instrument.
If quoted or market values are not available then derivative fair values are determined using valuation techniques that are consistent with techniques commonly used by market participants to price these instruments. These techniques include discounted cash flow analysis and other pricing models. The fair values calculated from these models are regularly compared with prices obtained in actual market transactions to ensure reliability. In all material instances these techniques use only observable market data.
Loans and AdvancesLoans and advances held for trading principally consist of reverse repurchase agreements, are carried at fair value and are classified as financial assets held for trading. Gains, losses and related income are taken to net trading income as they arise.
All other loans and advances are classified as loans and receivables. They are initially recognised at the draw down date at the fair value on the commitment date plus directly attributable incremental transaction costs. They are subsequently carried at amortised cost using the effective interest method less provision for impairment.
The fair value of loans and advances to customers is measured at the commitment date and calculated by discounting anticipate cash flows, including interest, at current market rate of interest. The fair value of floating rate loans and advances and overnight deposits is considered by the group to be equal to the carrying value as these loans and advances are accounted for at current interest rates and credit risk is assessed in the impairment review. The fair value of fixed interest bearing accounts is based on cash flows discounted using current money market interest rates for debts with similar maturity and credit risk characteristics.
Loans and advances that are performing in accordance with the underlying contract are classified as neither past due nor impaired. If a customer fails to make a payment that is contractually due the loan is classified as past due. If subsequently all contractually due payments are made the loan reverts to its neither past due nor impaired status.
The group assesses impairment individually for financial assets that are significant and individually or collectively for assets that are not significant. The estimation involved in these impairment assessments is considered a critical accounting estimate.
Individual impairment is identified at a counterparty specific level following objective evidence that a financial asset is impaired. This may be after an interest or principal payment is missed, when a banking covenant is breached or when the counterparty is experiencing significant financial difficulties including cash flow problems. Objective evidence may also arise from wider economic and financial market indicators including factors that pertain to a particular industry sector or local economy. The present value of estimated cash flows recoverable is determined after taking into account any security held. The amount of any impairment is calculated by comparing the present value of the cash flows discounted at the loan’s original effective interest rate with the carrying value. If impaired, the carrying value is adjusted and the difference charged to the income statement.
The written down value of the impaired loan is compounded back to the net realisable balance over time using the original effective interest rate. This is reported through interest income in the income statement and represents the unwinding of the discount.
A write-off is made when all or part of a claim is deemed uncollectable or forgiven. Write-offs are charged against previously established provisions for impairment or directly to the income statement.
In circumstances where an asset has been individually assessed for impairment and no objective evidence of impairment exists, then it will be subject to a collective assessment.
Collective impairment is identified for groups of assets that share similar risk characteristics. Collective impairment is assessed using a methodology based on existing risk conditions or events that have a strong correlation with a tendency to default.
Loans and advances that are subject to collective impairment provisioning are deemed to be impaired loans where interest or capital payments are past due by more than three months.
Loans and advances that are past due or impaired may have the terms and conditions renegotiated. Loans and advances are classified as renegotiated if they fulfill the definition of a troubled debt restructuring. When the renegotiated contract becomes effective the loan is subsequently classified as past due, impaired or neither past due nor impaired according to its performance under the renegotiated terms.
Loans and advances to customers include advances that are subject to non-returnable finance arrangements following securitisation of portfolios of mortgages and other advances. The principal benefits of these advances are acquired by special purpose securitisation entities that fund their purchase primarily through the issue of debt securities in issue.
SyndicationsSyndication activity is undertaken as part of the group’s credit risk management strategy. The group considers that loan commitments and subsequent draw down form one contract. The loan is recognised at the date of the draw down and initial fair value is measured at the commitment date. Loans pending syndication are classified as loans and receivables and derecognised upon sell down when the risks and rewards are transferred to a third party.
44
Finance Leases and Operating LeasesAssets leased to customers that transfer substantially all the risks and rewards incidental to ownership to the customer are classified as finance leases. Together with instalment credit agreements, they are recorded at an amount equal to the net investment in the lease, less any provisions for impairment, within loans and advances to customers.
The difference between the gross receivable and the present value of the receivable is recognised as unearned finance income. Lease income is recognised over the term of the lease using the net investment method, which reflects a constant periodic rate of return on the net investment.
All other assets leased to customers are classified as operating leases. These assets are separately disclosed in the balance sheet and are recorded at cost less accumulated depreciation, which is calculated on a straight-line basis. Operating lease rentals are recognised in operating income on a straight-line basis over the lease term. Operating lease assets are reviewed for impairment when there is an indication of impairment.
Investment SecuritiesInvestment securities held for trading are classified as financial assets held for trading and are carried at fair value. Gains, losses and related income are taken to net trading income as they arise. Investment securities designated at fair value through the income statement are carried at fair value. Gains, losses and related income are taken to other operating income as they arise, except for those related to insurance and investment business which are taken to net investment income related to insurance and investment business.
Debt securities other than those held for trading or designated at fair value and for which there is no active market at inception are classified as loans and receivables. They are initially recognised at fair value plus directly related incremental transaction costs and are subsequently carried on the balance sheet at amortised cost using the effective interest rate method less provision for impairment.
All other investment securities are classified as available for sale. They are initially recognised at fair value plus directly related incremental transaction costs and are subsequently carried on the balance sheet at fair value. Unrealised gains or losses arise from changes in the fair values and are recognised directly in equity in the available for sale reserve, except for impairment losses or foreign exchange gains or losses related to debt securities, which are recognised immediately in the income statement in impairment on investment securities or other operating income respectively. Income on debt securities is recognised on an effective interest rate basis and taken to interest income through the income statement. Income from equity shares is credited to other operating income, with income on listed equity shares being credited on the ex-dividend date and income on unlisted equity shares being credited on an equivalent basis. On sale or maturity, previously unrealised gains and losses are recognised in other operating income.
Impairment losses on available for sale equity instruments are not reversed through the income statement. Any increase in the fair value of an available for sale equity instrument after an impairment loss has been recognised is treated as a revaluation and recognised directly in equity. An impairment loss on an available for sale debt instrument is reversed through the income statement, if there is evidence that the increase in fair value is due to an event that occurred after the impairment loss was recognised.
The fair value of investment securities trading in active markets is based on market prices or broker/dealer valuations. Where quoted prices on instruments are not readily and regularly available from a recognised broker, dealer or pricing service, or available prices do not represent regular transactions in the market, the fair value is estimated. These estimates use quoted market prices for securities with similar credit, maturity and yield characteristics or similar valuation models. Asset-backed securities ('ABS') not traded in an active market are valued using valuation models that include non-market observable inputs. These models use observed issuance prices, benchmarking methodology and modelled market correlations. For each asset class within the portfolio, the implied spread arrived at by using this methodology is applied to the securities within that asset class. Additional assessments are then made for possible deterioration in credit risk for each individual security.
The group uses settlement date accounting when recording the purchase and sale of investment securities, with the exception of those held for trading for which trade date accounting is used.
Jointly Controlled Entities and AssociatesJointly controlled entities are entities over which the group has joint control under a contractual arrangement with other parties.
Associates are entities over which the group has significant influence, but not control over the financial and operating policies. Significant influence is the power to participate in the financial and operating policy decisions of the entity but is not control over those policies.
The attributable shares of results of associates and jointly controlled entities, generally based on audited accounts, are included in the consolidated financial statements using the equity method of accounting. The share of any losses is restricted to a level that reflects an obligation to fund such losses.
GoodwillThe excess of the cost of a business combination over the interest in the net fair value of the identifiable assets, liabilities and contingent liabilities at the date of acquisition of a business is capitalised as goodwill. The goodwill is allocated to the cash-generating units or groups of cash-generating units that are expected to benefit from the acquisitions concerned. In most cases, the cash-generating units represent the business acquired.
After initial recognition, goodwill is measured at cost less any accumulated impairment losses. Cash-generating units to which goodwill is allocated are subject to a semi-annual impairment review at 31 March and 30 September and whenever there is an indication that the unit may be impaired, by comparing the value in use with the carrying value. When this indicates that the carrying value of goodwill is not recoverable, it is irrevocably written down through the income statement by the amount of any impaired loss identified. Further details of the calculation are given in the critical accounting estimates and in Note 16. IFRS 3 ‘Business Combinations’ has not been applied retrospectively to business combinations that occurred before 1 January 2004.
SoftwareCosts associated with the development of software for internal use, subject to de minimis limits, are capitalised if the software is technically feasible and the group has both the intent and sufficient resources to complete the development. Costs are only capitalised if the asset can be reliably measured and will generate future economic benefits to the group either through sale or use.
Only costs that are directly attributable to bringing the asset into working condition for its intended use are capitalised. These costs include

45
all directly attributable costs necessary to create, produce and prepare the asset to be capable of operating in a manner intended by management. Other development expenditure is recognised in the income statement as an expense as incurred.
Capitalised development expenditure and purchased software is stated at cost less accumulated amortisation and impairment losses. Once the software is ready for use, the capitalised costs are amortised over their expected lives, generally four years. Capitalised software is assessed for impairment where there is an indication of impairment. Where impairment exists, the carrying amount of the asset is reduced to its recoverable amount and the impairment loss recognised in the income statement. The amortisation charge for the asset is then adjusted to reflect the asset’s revised carrying amount.
Subsequent expenditure is only capitalised when it increases the future economic benefits embodied in the specific asset to which it relates.
Property and EquipmentProperty and equipment is stated at cost less accumulated depreciation and impairment losses.
Freehold land is not depreciated. Freehold and leasehold property, other than freehold investment properties, is stated at cost and depreciated over fifty years or the length of the lease term if shorter. Improvements to leasehold properties are stated at cost and are depreciated in equal instalments over the lesser of the remaining life of the lease or eight years. Premiums are amortised over the period of the lease.
The cost of equipment, which includes fixtures and fittings, vehicles and computer hardware, less estimated residual value, is written off in equal instalments over the expected lives of the assets, generally between three and eight years.
Subsequent costs are included in the asset’s carrying amount, only when it is probable that future economic benefits associated with the item will flow to the group and the cost of the item can be measured reliably.
Property and equipment is assessed for impairment where there is an indication of impairment. Where impairment exists, the carrying amount of the asset is reduced to its recoverable amount and the impairment loss recognised in the income statement. The depreciation charge for the asset is then adjusted to reflect the asset’s revised carrying amount.
Investment PropertiesInvestment properties, which are defined as properties held either to earn rental income or for capital appreciation or both, are initially recognised at cost and are fair valued annually. Any gains or losses arising from a change in the fair value are recognised in the income statement in the period that they occur through other operating income, except for those relating to insurance and investment business, which are taken through net investment income related to insurance and investment business. Investment properties are not depreciated.
Investments in SubsidiariesInvestments in subsidiaries are included in the Bank's financial statements and comprise equity investments in, and capital contributions to subsidiary entities. These are carried at cost less impairment provisions. At each reporting date an assessment is undertaken to determine if there is any indication of impairment. This assessment can include reviewing factors such as the solvency, profitability and cash flows generated by the subsidiary. If there is an indication of impairment, an estimate of the recoverable amount is made. If the carrying value exceeds the recoverable amount then a provision for impairment is made to reduce the carrying value to the recoverable amount.
Disposal GroupAssets and liabilities of a disposal group are classified as held for sale where the carrying amount will be recovered principally through a sale transaction as opposed to continuing use. This applies where the assets and liabilities are available for sale in their present condition, subject only to the terms that are usual and customary for the sale of such assets and liabilities, and when a sale is highly probable and expected to complete within one year of being classified as a disposal group. Disposal groups are measured at the lower of carrying amount and fair value less costs to sell.
Deposits by Banks and Customer AccountsDeposits by banks and customer accounts held for trading are classified as financial liabilities held for trading and are carried at fair value. Gains, losses and related income are taken to net trading income as they arise. All other customer accounts and deposits by banks are held at amortised cost using the effective interest rate method.
The fair value of customer deposits with no stated maturity date is the amount repayable on demand. The estimated fair value of fixed interest bearing deposits and other borrowings with no quoted market price is calculated using a cash flow model discounted using interest rates for debts with similar maturity.
Repurchase Agreements Debt securities sold subject to repurchase agreements are retained within the balance sheet where the group retains substantially all of the risks and rewards of ownership. Funds received under these arrangements are included within deposits by banks, customer accounts or financial liabilities held for trading. Conversely, debt securities acquired under commitments to resell are not recognised in the balance sheet as debt securities where substantially all the risks and rewards do not pass to the group. In this case, the purchase price is included within loans and advances to banks, loans and advances to customers, or financial assets held for trading. The difference between sale and repurchase prices for such transactions is reflected in the income statement over the lives of the transactions, within interest payable or interest receivable as appropriate.
Post Retirement SchemesThe Bank is a participating employer in both a defined contribution pension scheme and a defined benefit pension scheme based upon final pensionable pay, operated by HBOS plc, the HBOS Final Salary Pension Scheme (HBOS FSPS). The HBOS FSPS was formed on 3 July 2006 following the merger of the Bank of Scotland 1976 Scheme and the Halifax Retirement Fund (HRF), in both of which the Bank was previously a participating employer, with two other schemes in the HBOS Group.
Because the Bank is unable to identify its share of the scheme assets and liabilities on a consistent and reasonable basis, as permitted by IAS 19 'Employee benefits' the HBOS FSPS has been accounted for, in these financial statements, as if the scheme was a defined contribution scheme.
TaxationIncome tax on the profit or loss for the year comprises current and deferred tax. Income tax is recognised in the income statement except to

46
the extent that it relates to items recognised directly in equity, in which case it is recognised in equity. The tax charge is analysed between tax that is payable in respect of policyholder returns and tax that is payable on shareholders’ equity returns. This allocation is based on an assessment of the effective rate of tax that is applicable to shareholders’ equity for the year.
Deferred tax is provided using the balance sheet liability method, providing for temporary differences between the carrying amounts of assets and liabilities for financial reporting purposes and the amounts used for taxation purposes. The following differences are not provided: goodwill not deductible for tax purposes, the initial recognition of assets and liabilities that affects neither accounting nor taxable profit and differences relating to investments in subsidiaries to the extent that they will probably not reverse in the foreseeable future. The amount of deferred tax provided is based on the expected manner of realisation or settlement of the carrying amount of assets and liabilities, based on tax rates that are enacted or substantially enacted at the balance sheet date.
ProvisionsThe group recognises a provision if there is a present obligation either as a consequence of a legal or constructive obligation resulting from a past event. To recognise this it should be probable that an outflow of economic resources, that can be reliably measured, will be required to settle the obligation. Provisions are measured as the discounted expected future cash flows taking account of the risks and uncertainties associated with the specific liability where appropriate.
A constructive obligation is only deemed to exist in respect of restructuring provisions once a detailed restructuring plan has been formally approved and the plan has been announced publicly or work on the restructure has commenced.
As explained under critical accounting judgements, if the group assesses that a constructive obligation for a regulatory provision exists then a provision is established. Where the provisioning criteria are met, the group makes provision for the estimated cost of making redress payments to customers in respect of past product sales where the sales processes have been deficient. To calculate the provision, the group estimates the number of cases requiring redress and the average cost per case. These are dependent upon, inter alia, the volume of claims, the actions of regulators and, as appropriate, the performance of investments. As progress is made in settling claims, if necessary, the group revises its judgements and estimates based on the emerging trends.
Regulatory provisions held in respect of customer remediation where a legal obligation exists or the group considers that a constructive obligation exists are set out in Note 21.
Debt Securities in IssueDebt securities in issue held for trading are classified as financial liabilities held for trading and are carried at fair value. Gains, losses and related income are taken to net trading income as they arise. Debt securities in issue designated at fair value through the income statement are carried at fair value. Gains, losses and related income are taken to other operating income as they arise, except for those related to insurance and investment business which are taken to net investment income related to insurance and investment business. All other debt securities in issue are held at amortised cost. They are initially recognised at fair value plus directly related incremental transaction costs and are subsequently carried on the balance sheet at amortised cost using the effective interest rate method.
Fair values are calculated based on quoted market prices. Where quoted market prices are not available, a cash flow model is used, discounted using an appropriate current yield curve for the remaining term to maturity.
Other Borrowed FundsOther borrowed funds comprises preference shares that are classified as debt, preferred securities and subordinated liabilities, all of which are held at amortised cost, using the effective interest rate method.
Preference shares are classified as debt where they are redeemable on a specific date, or at the option of the shareholders, or if dividend payments are not discretionary. Dividends on preference shares classified as debt are recognised in the income statement through interest expense.
Preferred securities issued at or close to market values are classified as debt where they are redeemable on a specific date or at the option of the holders, or if interest payments are not discretionary. The interest payable on such securities is recognised in the income statement through interest expense.
Subordinated liabilities consist of dated and undated loan capital. The interest payable is recognised in the income statement through interest expense.
NettingThe group nets loans, deposits and derivative transactions covered by master agreements and when there is a legal right of offset and where simultaneous or net settlement is permitted under the terms of the relevant agreement and where there is the intention and ability to settle on a net or simultaneous basis.
Foreign CurrenciesThe financial statements are presented in sterling which is the Bank's functional and presentation currency.
Foreign currency transactions are translated into sterling at the exchange rate prevailing at the date of the transaction.
Monetary assets and liabilities are translated at the closing rate at the date of the balance sheet. Exchange differences arising are recognised in the income statement except for differences arising from net investment hedges and derivatives related to cash flow hedges which are recognised directly in equity.
Non-monetary assets and liabilities carried at historical cost are translated using the historical exchange rate.
Non-monetary assets and liabilities carried at fair value are translated at exchange rates on the date the fair value is determined. Exchange differences arising are recognised in the income statement except those relating to available for sale financial assets (equity investments), which are recognised directly in reserves.
The results and financial position of all group entities that have a functional currency different from sterling are translated into sterling as follows:
assets and liabilities for each balance sheet presented are translated at the closing rate at the date of the balance sheet; –
47
goodwill and fair value adjustments arising on the acquisition of a foreign entity are treated as assets and liabilities of the foreign entity and –translated at the closing rate; and
income and expenses are translated at the average exchange rates for the period (unless this is not a reasonable approximation of the –cumulative effect of the rates prevailing on the transaction dates, in which case income and expenses are translated at the dates of the transactions).
All resulting exchange differences are recognised as a separate component of other reserves within equity.
On consolidation, exchange differences arising from the translation of the net investment in foreign operations, and of borrowings and other currency instruments designated as hedges of such investments, are taken to equity where the hedge is deemed to be effective. When a foreign operation is sold, such exchange differences are recognised in the income statement as part of the gain or loss on sale. The ineffective portion of any net investment hedge is recognised in the income statement immediately.
Cumulative translation differences for all foreign operations are deemed to be zero at 1 January 2004. Any gain or loss on the subsequent disposal of a foreign operation will exclude translation differences that arose before 1 January 2004, but include later translation differences.
Cash and Cash EquivalentsCash and cash equivalents are held for the purpose of meeting short term cash commitments rather than investing or other purposes. Cash and cash equivalents consist of cash and balances at central banks that are freely available, and loans and advances to banks with an original maturity of three months or less excluding financial assets that are held for trading purposes.
Effective Interest RateRevenue on financial instruments classified as loans and receivables, available for sale, or financial liabilities at amortised cost, is recognised on an effective interest rate basis. This calculation takes into account interest received or paid and fees and commissions paid or received that are integral to the yield as well as incremental transaction costs. The effective interest rate is the rate that discounts the expected future cash flows over the expected life of the financial instrument or, where appropriate, a shorter period, to the net carrying amount of the financial instrument at initial recognition. These calculations are undertaken on a portfolio basis other than in respect of significant balances, relating principally to larger corporate customers, which are assessed individually. In applying the portfolio basis, the group makes use of various statistical modelling techniques which are specific to different portfolios in estimating the expected cash flows from early redemptions and related fees to the extent that these are applicable. In calculating the effective interest rates of individually significant balances the group takes into account a number of relevant considerations to estimate the cash flows from early redemptions, including previous experience of customer behaviour, credit scoring of the customer and anticipated future market conditions at the date of acquisition. The estimation of early redemption cash flows and their impact on the expected life is considered under critical accounting estimates.
Fees and Commission Fees and commission income and expense is recognised in the income statement as the related service is provided except those that are integral to the effective interest rate calculations or to investment contract deferred origination costs.
Fees and commission recognised in the income statement include service fees, agency and management fees, transaction fees, guarantee fees, letter of credit fees, asset management fees and non-utilisation fees.
Fees and commission included in the effective interest rate calculation are those that are incremental and directly attributable to the origination of the product and which are integral to the yield of the product. These include arrangement fees, incentives such as cash backs, intermediary fees and commissions, high loan to value fees and procurement fees.
GuaranteesFinancial guarantees are contracts that require the group to make specified payments to reimburse the holder for a loss it incurs because a specified debtor fails to make payment when due in accordance with the terms of a debt instrument.
Intra-group financial guarantee contracts in the Bank financial statements are accounted for as general insurance contracts. This practice also applies to any new intra-group financial guarantees written.
Loan CommitmentsProvision is made for undrawn loan commitments which have become onerous.

48
Critical Accounting JudgementsThe preparation of the financial statements necessarily requires the exercise of judgement both in the application of accounting policies which are set out on pages 41 to 49. These judgements are continually reviewed and evaluated based on historical experience and other factors. The principal critical accounting judgements made by the group that have a material financial impact on the financial statements are as follows:
Designation of Financial InstrumentsThe group has classified its financial instruments in accordance with IAS 39 ‘Financial Instruments: Recognition and Measurement’. In some instances the classification is prescribed whilst in others the group is able to exercise judgement in determining the classification as follows:
Non-derivative financial assets, other than those held for trading, where there is no active market and which have fixed or determinable –payments are classified as ‘loans and receivables’;
The group’s ‘trading’ portfolio is classified as ‘held for trading’. The group exercises judgement in determining which financial –instruments form part of its trading book. This is determined at acquisition by the purpose for which the instrument is acquired and the business area that acquires it;
Derivative instruments are automatically classified as ‘at fair value through the income statement’ unless they form part of a qualifying –hedging relationship. The Group’s accounting policy for hedge accounting is described under the policy for derivatives;
Instruments that are deemed by the group on initial recognition to eliminate a measurement mismatch or where they contain an –embedded derivative which is not separated from the host contract are designated ‘at fair value through the income statement’. In addition portfolios of assets, liabilities or both that are managed and the performance evaluated on a fair value basis in accordance with a documented risk or investment management strategy are designated ‘at fair value through the income statement’;
In addition the venture capital exemption is taken for investments where significant influence or joint control is present and the investing –area operates as a venture capital business. These investments are designated 'at fair value through the income statement'. This policy is applied consistently across the group’s portfolios. Judgement is applied when determining whether or not a business area operates as a venture capital business. The judgement is based on consideration of whether, in particular, the primary business activity is investing for current income, capital appreciation or both; whether the investment activities are clearly and objectively distinct from any other activities of the group; and whether the investee operates as a separate business autonomous from the group;
The group has chosen not to designate any financial assets as ‘held to maturity’; –
All other financial assets are automatically classified as ‘available for sale’; and –
All other financial liabilities are automatically classified as ‘at amortised cost’. –
The accounting treatment of these financial instruments is set out in the relevant accounting policy.
Impairment of Available for Sale InvestmentsThe group has considered the fall in fair values of investments classified as available for sale to ascertain whether any impairment has occurred. Impairment is recognised when there is objective evidence that a specific financial asset is impaired. Evidence may include a debt issuer failing to make an interest or principal repayment or breaching a covenant within the security’s terms and conditions or a significant or prolonged decline in the fair value of an equity instrument below its cost. Except when a default event has occurred, the determination of whether or not objective evidence of impairment is present requires the exercise of critical accounting judgement by the group.
Unarranged Overdraft Charges The group’s accounting policy in respect of regulatory provisions is given in the section on provisions. In the absence of a legal obligation, judgement is necessary in determining the existence of a constructive obligation. In respect of the claims made for retail banking fee refunds the judgement of the group is that there is no constructive obligation pending the outcome of the legal case. The contingent liability in respect of 'ex-gratia' refunds of unarranged overdraft charges is explained in Note 28.
SyndicationsAs explained in the accounting policy on syndications the group has elected to treat loans and advances pending syndication as loans and receivables rather than account for them as trading assets. Accordingly these are initially recognised at the draw down date at the fair value plus directly attributable incremental transaction costs as at the commitment date.
Critical Accounting EstimatesThe preparation of the financial statements requires the group to make estimations where uncertainty exists. The principal critical accounting estimates made by the group are considered below. Disclosures about estimates and the related assumptions are also included in the appropriate Note.
Fair ValuesThe designation of financial instruments for measurement purposes is set out under the critical accounting judgements above and the valuation methodologies for financial instruments are set out in the appropriate accounting policies.
Derivatives and other financial instruments designated as at fair value through the income statement or available for sale are recognised at fair value.
As explained in the accounting policy on investment securities, asset backed securities ('ABS') not traded in an active market are valued using valuation models that include non-market observable inputs. These models use observed issuance prices, benchmarking methodology and modelled market correlations. For each asset class within the ABS portfolio, the implied spread arrived at by using this methodology is applied to the securities within that asset class. Additional assessments are then made on possible deterioration in credit risk for each individual security.
At 31 December 2007, the value of ABS measured using models with non-market observable inputs comprised investment securities of £5,404m (2006 £nil) within financial assets held for trading and £12,386m (2006 £nil) within assets classified as available for sale.

49
During the year, a £78m pre-tax negative fair value adjustment was recognised in the income statement, within net trading income, on ABS that were valued using models with non-market observable inputs (2006 £nil). In addition to this post-tax negative fair value adjustment of £158m (2006 £nil) on ABS classified as available for sale was recognised in equity reserves.
For ABS asset valuations using non-market observable inputs, the effect of a one basis point move in credit spreads would result in a pre-tax movement of £2m for ABS assets classified as held for trading and a post-tax movement of £4m, recognised in equity reserves, on assets classified as available for sale.
The use of non-market observable inputs in the valuation models will diminish as and when activity returns to these markets.
Impairment Losses on Loans and Advances Impairment loss calculations involve the estimation of future cash flows of loans and advances based on observable data at the balance sheet date and historical loss experience for assets with similar credit risk characteristics. These calculations are undertaken on a portfolio basis other than in respect of significant balances, relating principally to larger corporate customers, which are assessed individually. In applying the portfolio basis the Group makes use of various statistical modelling techniques which are specific to different portfolio types. In calculating individual impairment provisions the Group takes account of a number of relevant considerations including historical experience, future prospects of the customer, value of collateral held and reliability of information.
Effective Interest Rate As described in the accounting policy for effective interest rate, the group uses statistical and mathematical models to calculate the effective yield for loans and advances. The group applies judgement when determining the expected life of these loans. The underlying products usually allow the customer to make early repayment before the contractual maturity date. In estimating the expected life of the loan, the group takes into account a number of relevant considerations when the asset is initially recognised to estimate the cash flows from early redemptions including the type of product, previous experience of customer behaviour, credit scoring of the customer and anticipated future market conditions. After initial recognition the cash flows from early redemptions are not reassessed in the effective interest rate calculation in the light of actual experience. If the estimated life of the Retail portfolio were to increase or decrease by one month then the carrying value of the Retail portfolio would increase or decrease by £18m respectively.
Goodwill Goodwill arises on the acquisition of companies and other businesses. As explained in the accounting policy for goodwill it is subject to a six monthly impairment review by comparing the value in use with the carrying value. When this indicates that the carrying value is not recoverable it is written down through the income statement as goodwill impairment.
The value in use calculation uses cash flow projections based upon the five year business plan with cash flows thereafter being extrapolated using growth rates in the range of 2.25% to 2.50% reflecting the long term nature of the businesses concerned and the long term trend in growth rate of the respective economy. The pre-tax discount rates used in discounting the projected cash flows are in the range of 10% to 12.2% reflecting the perceived risk within those businesses. As at 31 December 2007 the carrying value of goodwill held on the balance sheet is £1,041m (2006 £342m) as shown in Note 16. The aggregate headroom between the value in use and carrying value of goodwill plus net assets of the businesses is sufficiently large that changes in growth and discount rates, after allowing for the current credit conditions, would have no material impact on the goodwill impairment charge.

50
Notes to the Accounts continued1. Income
2007 2006 £m £m
Included within net interest income are the following:Interest income on financial instruments not designated at fair value through the income statement 36,173 22,645Interest expense on financial instruments not designated at fair value through the income statement 28,465 18,450 Net trading income comprises:Equity and commodity instruments and related derivatives 92 20Interest bearing securities and related derivatives 58 166Foreign exchange and related derivatives 72 91 Fair value hedges: Net gains/(losses) from hedging instruments 1,180 (2,674) Net (losses)/gains from hedged items (1,216) 2,688 Cash flow hedge ineffectiveness recognised (1) (1)
185 290
Included within net operating income are the following: Cash flow hedges: Net gains/(losses) released from equity into income 417 (123)
Financial instruments at fair value through the income statement: Net gains and losses from designated financial instruments 320 70
Available for sale financial instruments: Dividend income 291 25 Net realised gains on sale 263 233
Financial instruments designated as loans and receivables: Net realised gains on sale 1 1
Non-operating income comprises:Profit on the part disposal of Rightmove plc 59 Profit on the sale and leaseback of certain branch premises 28 Profit on the sale of Retail Financial Services Ltd 9Profit on the sale of Drive Financial Service LP 180
87 189
2. Administrative Expenses
2007 2006 £m £m
Administrative expenses include: Charge in respect of 'ex-gratia' refunds of unarranged overdraft charges (Note 28) 122
Administrative expenses also include:Colleague costs (Note 3) 2,530 1,162Accommodation, repairs and maintenance 427 135Technology 226 44Marketing and communication 327 136

51
Notes to the Accountscontinued
3. ColleaguesHBOS refers to its employees as colleagues. Most UK based colleagues are contractually employed by HBOS plc, the ultimate parent company. All expenses related to the employment of colleagues for whom the Bank gains the benefit of their employment are recharged by HBOS to the Bank. Consequently, the Bank has no employees.
2007 2006 Number Number
The average number of colleagues recharged during the year is:Full time 53,526 20,486Part time 15,521 3,797
69,047 24,283
The aggregate remuneration recharged to the group is included within administrative expenses and comprises:
2007 2006 £m £m
Wages and salaries 2,030 893Social security costs 195 98Other pension costs 198 134Expense arising from share-based payments 107 37
2,530 1,162
The expense arising from share-based payment arrangements does not include £12m (2006 £18m) in relation to National Insurance and income tax costs that are borne by the group.
4. Directors’ RemunerationThe Directors of the Bank during the year were also Directors of HBOS plc, the parent company of the Bank. No Director received emoluments for qualifying services to the Bank in the year ended 31 December 2007 or for the comparative period. Full details of the Directors' remuneration are disclosed in the 2007 HBOS plc Annual Report and Accounts within the "Report of the Board in relation to remuneration policy and practice".
5. Auditors’ RemunerationThe aggregate remuneration of KPMG Audit Plc and its associates for audit and other services (excluding value added taxes) included within administrative expenses is analysed below:
2007 2006 Total Total £m £m
Statutory audit of the Bank and BoS consolidation 1.7 0.7
Fees payable for other services:Audit of the Bank's subsidiaries and associates 2.9 2.4 Other services pursuant to legislation 0.7 Tax services (compliance and advisory) 0.7 0.9Services relating to information technology 0.1 0.3 Services relating to corporate finance transactions 0.3 0.4 Other services 0.4 0.4
Total other services 5.1 4.4
6.8 5.1
In respect of the Bank, fees in respect of the statutory audit were £1.6m (2006 £50,000) and other fees amounted to £0.1m (2006 £0.1m).
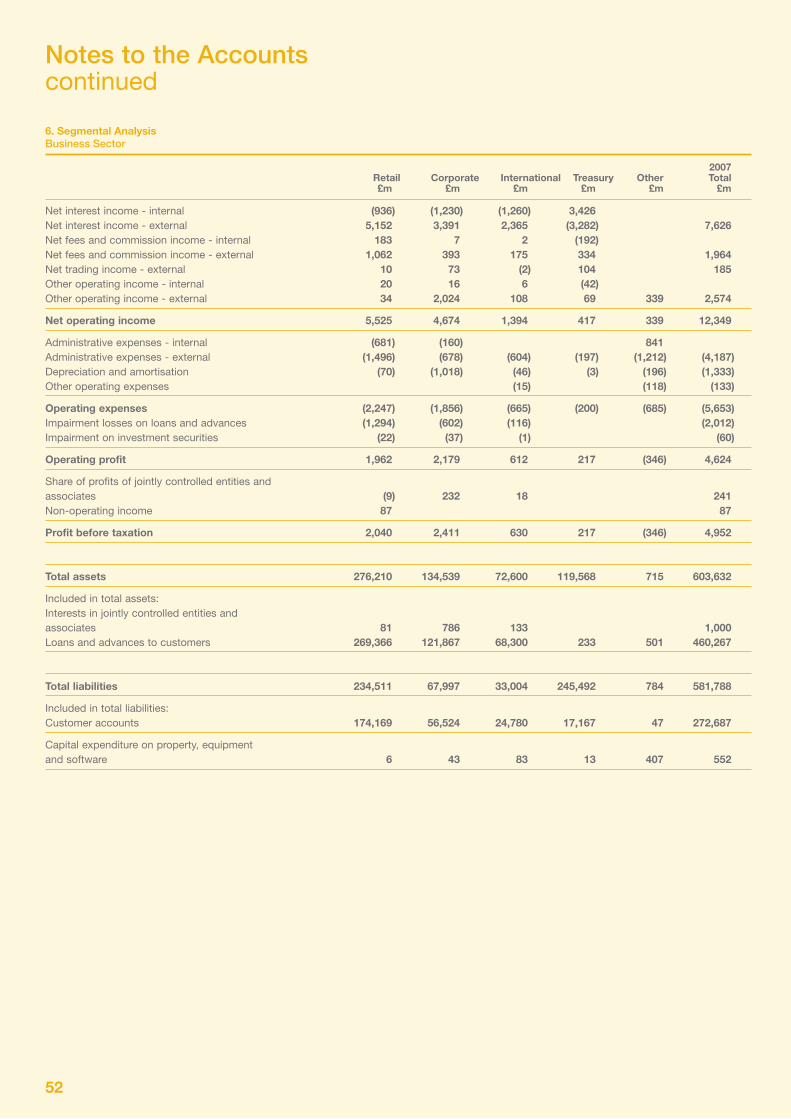
52
Notes to the Accountscontinued
6. Segmental Analysis Business Sector
2007 Retail Corporate International Treasury Other Total £m £m £m £m £m £m
Net interest income - internal (936) (1,230) (1,260) 3,426 Net interest income - external 5,152 3,391 2,365 (3,282) 7,626Net fees and commission income - internal 183 7 2 (192) Net fees and commission income - external 1,062 393 175 334 1,964Net trading income - external 10 73 (2) 104 185Other operating income - internal 20 16 6 (42) Other operating income - external 34 2,024 108 69 339 2,574
Net operating income 5,525 4,674 1,394 417 339 12,349
Administrative expenses - internal (681) (160) 841 Administrative expenses - external (1,496) (678) (604) (197) (1,212) (4,187) Depreciation and amortisation (70) (1,018) (46) (3) (196) (1,333)Other operating expenses (15) (118) (133)
Operating expenses (2,247) (1,856) (665) (200) (685) (5,653)Impairment losses on loans and advances (1,294) (602) (116) (2,012)Impairment on investment securities (22) (37) (1) (60)
Operating profit 1,962 2,179 612 217 (346) 4,624
Share of profits of jointly controlled entities and associates (9) 232 18 241Non-operating income 87 87
Profit before taxation 2,040 2,411 630 217 (346) 4,952
Total assets 276,210 134,539 72,600 119,568 715 603,632
Included in total assets: Interests in jointly controlled entities and associates 81 786 133 1,000 Loans and advances to customers 269,366 121,867 68,300 233 501 460,267
Total liabilities 234,511 67,997 33,004 245,492 784 581,788
Included in total liabilities: Customer accounts 174,169 56,524 24,780 17,167 47 272,687
Capital expenditure on property, equipment and software 6 43 83 13 407 552

53
Notes to the Accountscontinued
6. Segmental Analysis continuedBusiness Sector
2006 Retail Corporate International (b) Treasury Other Total £m £m £m £m £m £m
Net interest income - internal (421) (515) (1,144) 2,080 Net Interest income - external 1,258 2,372 2,372 (1,879) 4,123Net fees and commission income - external 273 328 150 (25) 11 737Net trading income - external 25 2 263 290Other operating income - external 23 915 127 5 1,070
Net operating income 1,133 3,125 1,507 444 11 6,220
Administrative expenses - external (363) (693) (526) (154) (133) (1,869) Depreciation and amortisation (15) (512) (41) (3) (25) (596)Goodwill impairment (41) (41)Other operating expenses (19) (19)
Operating expenses (378) (1,246) (586) (157) (158) (2,525)Impairment losses on loans and advances (303) (424) (217) (944)Impairment on investment securities (69) (2) (71)
Operating profit 452 1,386 702 287 (147) 2,680
Share of profits of jointly controlled entities and associates 148 4 152Non-operating income 9 180 189
Profit before taxation 461 1,534 886 287 (147) 3,021
Total assets (a) 56,544 92,262 57,386 248,985 2 455,179
Included in total assets:Interests in jointly controlled entities and associates 47 535 51 633 Loans and advances to customers 59,029 96,717 59,509 215,255
Total liabilities (a) 54,697 86,561 54,140 247,374 2 442,774
Included in total liabilities: Customer accounts 29,904 47,325 29,600 106,829
Capital expenditure on property, equipment and software 1 62 1 95 159
(a) The total assets and total liabilities of Corporate include £1,388m and £909m respectively being the assets and liabilities of the disposal group.
(b) International division includes the income and expenses of Drive which was disposed of during 2006.
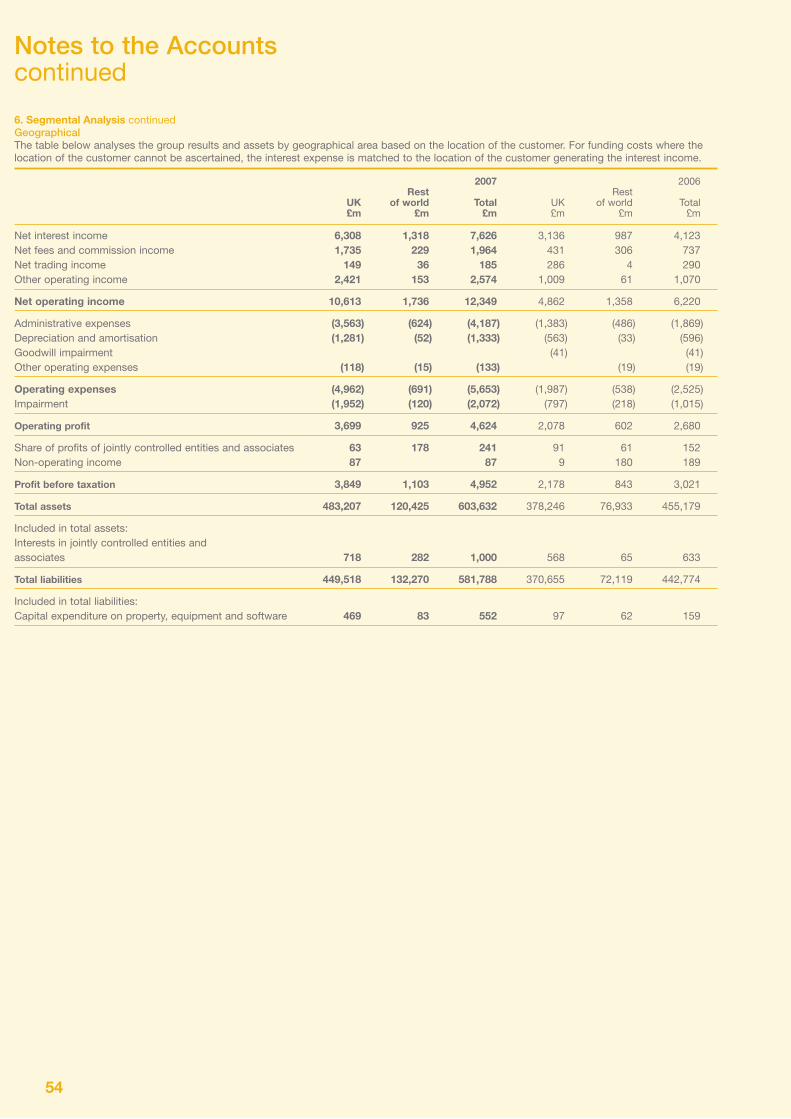
54
Notes to the Accountscontinued
6. Segmental Analysis continuedGeographicalThe table below analyses the group results and assets by geographical area based on the location of the customer. For funding costs where the location of the customer cannot be ascertained, the interest expense is matched to the location of the customer generating the interest income.
2007 2006 Rest Rest UK of world Total UK of world Total £m £m £m £m £m £m
Net interest income 6,308 1,318 7,626 3,136 987 4,123Net fees and commission income 1,735 229 1,964 431 306 737Net trading income 149 36 185 286 4 290Other operating income 2,421 153 2,574 1,009 61 1,070
Net operating income 10,613 1,736 12,349 4,862 1,358 6,220
Administrative expenses (3,563) (624) (4,187) (1,383) (486) (1,869)Depreciation and amortisation (1,281) (52) (1,333) (563) (33) (596)Goodwill impairment (41) (41)Other operating expenses (118) (15) (133) (19) (19)
Operating expenses (4,962) (691) (5,653) (1,987) (538) (2,525)Impairment (1,952) (120) (2,072) (797) (218) (1,015)
Operating profit 3,699 925 4,624 2,078 602 2,680
Share of profits of jointly controlled entities and associates 63 178 241 91 61 152Non-operating income 87 87 9 180 189
Profit before taxation 3,849 1,103 4,952 2,178 843 3,021
Total assets 483,207 120,425 603,632 378,246 76,933 455,179
Included in total assets:Interests in jointly controlled entities and associates 718 282 1,000 568 65 633
Total liabilities 449,518 132,270 581,788 370,655 72,119 442,774
Included in total liabilities: Capital expenditure on property, equipment and software 469 83 552 97 62 159

55
Notes to the Accountscontinued
7. Taxation
2007 2006 £m £m
Current taxCorporation tax charge at 30% 1,104 597Relief for overseas taxation (65) (51)Overseas taxation 236 166
1,275 712Deferred tax (Note 20) 43 89
Total income tax on profit 1,318 801
The effective tax rate for the year is 26.62% (2006 26.51%) lower than the standard rate of corporation tax in the UK (30%). The differences are explained below:
2007 2006 £m £m
Profit before taxation 4,952 3,021Profit multiplied by the standard rate of corporation tax in the UK of 30% (2006 30%) 1,486 906Effects of: Changes in rates of corporation tax on deferred tax assets and liabilities (76) (Income not chargeable)/Expenses not deductible for tax purposes (22) (4)Net effect of differing tax rates overseas 6 2Book gains covered by tax exemptions/indexation (86) (87)Impairment on investment securities 16 23Adjustments in respect of previous periods 2 (22)Other (8) (17)
Total income tax on profit 1,318 801
Current tax credit recognised directly in equityRelating to share plans (23) (6)Relating to available for sale investments (117) (10)
(140) (16)
Deferred tax (credit)/charge recognised directly in equityRelating to share plans 59 (19)Relating to available for sale investments (65) 20Relating to cash flow hedges (218) 114Relating to post employment benefit obligations 30 Relating to other 1 Relating to change in rate of UK corporation tax (5)
(228) 145
In addition there is £2m (2006 £nil) recognised in equity relating to changes in the rates of corporation tax.

56
Notes to the Accountscontinued
8. Financial Instruments Held for TradingFinancial assets and liabilities held for trading (other than derivatives) are as follows:
Group Bank 2007 2006 2007 2006 £m £m £m £m
Financial assets held for tradingDebt securities 36,723 34,885 34,326Loans and advances to banks 11,601 11,870 11,532 Loans and advances to customers 6,357 2,379 6,311Other assets 5
Total 54,681 49,139 52,169
Financial liabilities held for tradingDebt securities in issue 301 376 Deposits by banks 8,989 10,014 8,989Customer accounts 13,247 11,551 12,988Other liabilities 168 393 168
Total 22,705 22,334 22,145
9. Disposal GroupThe assets and liabilities of the disposal group were acquired in 2006 with a view to subsequent disposal. They comprise of the Mother Topco Limited group of companies, that includes McCarthy & Stone plc, a UK provider of retirement homes in which the group had a 58.3% equity interest at 31 December 2006. The assets and liabilities were sold during 2007 and within twelve months of the acquisition date. As the disposal was made at the values at which the group was held at 31 December 2006 no additional profit arose in 2007 that is attributable to the shareholders of the HBOS Group.
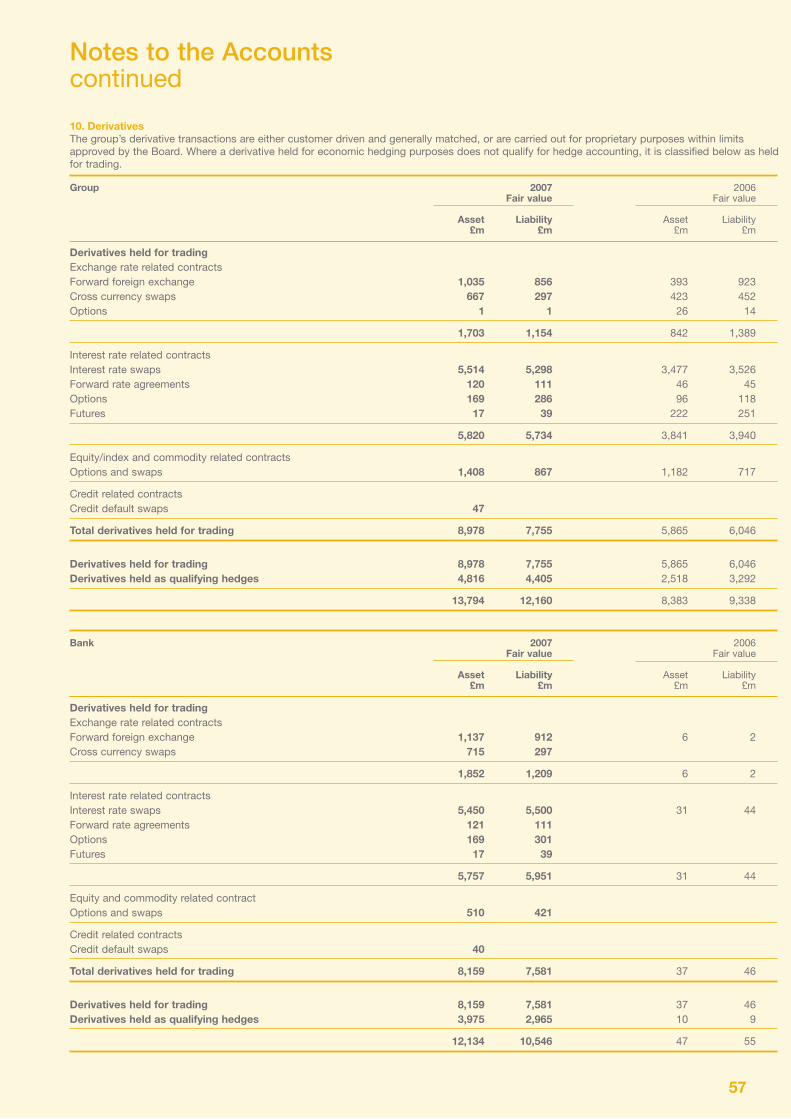
57
Notes to the Accountscontinued
10. DerivativesThe group’s derivative transactions are either customer driven and generally matched, or are carried out for proprietary purposes within limits approved by the Board. Where a derivative held for economic hedging purposes does not qualify for hedge accounting, it is classified below as held for trading. Group 2007 2006 Fair value Fair value Asset Liability Asset Liability £m £m £m £m
Derivatives held for tradingExchange rate related contracts Forward foreign exchange 1,035 856 393 923 Cross currency swaps 667 297 423 452Options 1 1 26 14
1,703 1,154 842 1,389
Interest rate related contractsInterest rate swaps 5,514 5,298 3,477 3,526Forward rate agreements 120 111 46 45Options 169 286 96 118Futures 17 39 222 251
5,820 5,734 3,841 3,940
Equity/index and commodity related contractsOptions and swaps 1,408 867 1,182 717
Credit related contracts Credit default swaps 47
Total derivatives held for trading 8,978 7,755 5,865 6,046
Derivatives held for trading 8,978 7,755 5,865 6,046 Derivatives held as qualifying hedges 4,816 4,405 2,518 3,292
13,794 12,160 8,383 9,338
Bank 2007 2006 Fair value Fair value Asset Liability Asset Liability £m £m £m £m
Derivatives held for tradingExchange rate related contracts Forward foreign exchange 1,137 912 6 2 Cross currency swaps 715 297
1,852 1,209 6 2
Interest rate related contracts Interest rate swaps 5,450 5,500 31 44 Forward rate agreements 121 111 Options 169 301 Futures 17 39
5,757 5,951 31 44
Equity and commodity related contract Options and swaps 510 421
Credit related contracts Credit default swaps 40
Total derivatives held for trading 8,159 7,581 37 46
Derivatives held for trading 8,159 7,581 37 46 Derivatives held as qualifying hedges 3,975 2,965 10 9
12,134 10,546 47 55

58
Notes to the Accountscontinued
10. Derivatives continuedThe group uses interest rate swaps, forward foreign exchange contracts and other derivative instruments to hedge and reduce the interest rate and currency exposures that are inherent in any banking business. The hedge accounting strategy adopted by the group is to utilise a combination of the macro cash flow, micro fair value and net investment hedge approaches.
The group has entered into derivative contracts for qualifying hedges as noted below:
Group 2007 2006 Fair value Fair value Asset Liability Asset Liability £m £m £m £m
Derivatives held as qualifying hedgesDerivatives designated as fair value hedges:Interest rate swaps 739 583 595 535Forward foreign exchange 27 7Cross currency swaps 1,728 1,836 201 990Options 4
2,467 2,446 796 1,536
Derivatives designated as cash flow hedges:Interest rate swaps 1,558 1,801 1,643 1,121Forward rate agreements 10 4 20 19 Cross currency swaps 756 139 14 605Futures 25 15 45 11
2,349 1,959 1,722 1,756
Total derivatives held as qualifying hedges 4,816 4,405 2,518 3,292
Bank 2007 2006 Fair value Fair value Asset Liability Asset Liability £m £m £m £m
Derivatives held for as qualifying hedgesDerivatives designated as fair value hedges:Interest rate swaps 776 586Forward foreign exchange 27Cross currency swaps 926 382
1,702 995
Derivatives designated as cash flow hedges:Interest rate swaps 1,558 1,802 Forward rate agreements 17 14 10 9 Cross currency swaps 673 139 Futures 25 15
2,273 1,970 10 9
Total derivatives held as qualifying hedges 3,975 2,965 10 9

59
Notes to the Accountscontinued
11. Loans and Advances to Customers
Group Bank 2007 2006 2007 2006 £m £m £m £m
Retail secured lending 235,849 39,062 223,429 29,421 Retail unsecured lending 19,831 8,885 19,831 6,494 Corporate, International and Treasury 207,960 168,869 213,327 85,926
Gross loans and advances to customers 463,640 216,816 456,587 121,841Impairment losses on loans and advances (Note12) (3,373) (1,561) (2,997) (1,148)
Net loans and advances to customers 460,267 215,255 453,590 120,693
The group’s lending exposure before impairment provisions and before taking account of collateral is analysed below:
2007 2006 £m £m
Agriculture, forestry and fishing 647 1,405Energy 1,269 2,125Manufacturing industry 4,332 5,805Construction and property 35,099 39,653Hotels, restaurants and wholesale and retail trade 8,620 12,955Transport, storage and communication 4,834 4,976Financial 34,572 40,925Other services 25,749 19,623Individuals Home mortgages 235,771 39,062 Other personal lending 22,229 8,885Non-UK residents 90,518 41,402
463,640 216,816
Group Bank 2007 2006 2007 2006 £m £m £m £m
Loans and advances that are neither past due nor impaired 442,307 204,890 437,755 112,124 Loans and advances that are past due but not impaired 10,786 7,434 9,591 6,380 Impaired loans (Note 30) 10,547 4,492 9,241 3,337
463,640 216,816 456,587 121,841
Loans and advances to customers include advances that are securitised under the group's securitisation programmes the majority of which have been sold by the Bank to bankruptcy remote special purpose entities, funded by the issue of debt on terms whereby some of the risks and rewards of the portfolio are retained by the subsidiary. Accordingly, all these advances are retained on the group’s balance sheet with the commercial paper included within debt securities in issue (Note 22).
The group's principal securitisation programmes and the type of loans and advances securitised are as follows:
Programme Type of loan 2007 2006 £m £m
Permanent UK residential mortgages 31,577 Mound UK residential mortgages 4,545 5,692Swan Australian residential mortgages 2,726 1,756Candide Dutch residential mortgages 2,491 2,683Prominent Commercial loans 1,101 798 Pendeford UK residential mortgages 2,508 Covered Bonds UK residential mortgages 34,704 Social Housing Covered Bonds UK residential mortgages 2,362 2,362Melrose Commercial loans 750 817Other Uk residential loans 104 927
82,868 15,035

60
Notes to the Accountscontinued
11. Loans and Advances to Customers continuedIn addition to the programmes above loans and advances totalling £14,089m and (2006 £6,629m) relating to UK residential mortgages have been securitised using credit default swaps. Group loans and advances to customers include finance leases analysed as follows:
2007 2006 £m £m
Gross investment in finance receivables: Within one year 3,151 2,863Between one and five years 5,051 4,037More than five years 4,211 889
12,413 7,789Less: unearned finance income (3,118) (1,257)
Present value of minimum lease payments 9,295 6,532
Analysed as:Within one year 2,616 2,476Between one and five years 4,004 3,397More than five years 2,675 659
Finance lease receivables 9,295 6,532
At 31 December 2007 total unguaranteed residual values accrued to the benefit of the group amounted to £20m (2006 £24m). At 31 December 2007,total accumulated allowance for uncollectable minimum lease payments receivable amounted to £65m (2006 £31m). The group's principal leasing activities are in property leasing and instalment credit and are transacted through its subsidiaries.
12. Impairment Provisions and Losses on Loans and Advances
Group Bank 2007 2006 2007 2006 £m £m £m £m
At 1 January 1,561 1,637 1,148 1,227 Transfer in under the HBOS Group Reorganisation 1,528 1,643 New impairment provisions less releases 2,111 986 1,950 647Amounts written off (1,726) (934) (1,606) (685)Acquisitions 1Disposal of subsidiary undertakings (65) (17) Discount unwind/interest income on impaired loans and advances to customers (129) (46) (123) (42)Foreign exchange translation 28 (17) 2
At 31 December 3,373 1,561 2,997 1,148
Retail home mortgages 330 105 284 65 Retail unsecured lending 1,919 488 1,919 446 Corporate and International 1,124 968 794 637
Impairment losses 3,373 1,561 2,997 1,148
New impairment provisions less releases 2,111 986 1,950 647Recoveries of amounts previously written off (99) (42) (83) (26)
Net charge to income statement 2,012 944 1,867 621

61
Notes to the Accountscontinued
13. Investment Securities
Group 2007 At fair value Available Loans and Total through the for sale receivables income statement Listed £m £m £m £m
Debt securities 639 31,944 32,583 Equity shares 10 261 271
Total listed 649 32,205 32,854
UnlistedDebt securities 151 14,833 1,266 16,250Equity shares 308 2,942 3,250
Total unlisted 459 17,775 1,266 19,500
Total 1,108 49,980 1,266 52,354
Comprising:Debt securities 790 46,777 1,266 48,833Equity shares 318 3,203 3,521
Group 2006 At fair value Available Loans and Total through for sale receivables the income statement Listed £m £m £m £m
Debt securities 26,779 26,779Equity shares 51 51
Total listed 26,830 26,830
UnlistedDebt securities 31 15,774 493 16,298Equity shares 172 2,208 2,380
Total unlisted 203 17,982 493 18,678
Total 203 44,812 493 45,508
Comprising:Debt securities 31 42,553 493 43,077Equity shares 172 2,259 2,431
Investment securities held at fair value through the income statement and as available for sale are recorded at fair value. The fair value movement during the year was £65m (2006 £29m) and a loss of £517m (2006 a gain of £136m) respectively. Within the fair value movement for available for sale is a loss of £105m (2006 loss of £136m) relating to assets subject to fair value hedging which is included in net trading income.
In keeping with normal market practice, the group enters into securities lending transactions and repurchase agreements, whereby cash and securities are temporarily received or transferred as collateral. Debt securities with a value of £13,707m (2006 £2,989m) were subject to agreement to repurchase, where the transferee obtains the right to pledge or sell the asset they receive. Debt securities also include securities pledged as collateral as part of securities lending transactions amounting to £11,918m (2006 £11,818m).
Debt securities include asset backed securities of £18,563m (2006 £19,017m) which are held in the group's Grampian conduit. This is a series of bankruptcy remote special purpose entities ('SPEs') that are funded by the issue of commercial paper and banking facilities. The commercial paper is included within debt securities in issue (Note 22). As some of the rewards and risks of the portfolio are retained by the group, including the provision of liquidity facilities by the Bank to the conduit, the assets and liabilities of the conduit are consolidated as part of the group. The group also has a smaller conduit, Landale, of which three of the five SPEs are consolidated. These hold debt securities of £604m (2006 £271m) which are included in the total of available for sale investments. Details of the Landale SPEs that are not consolidated by the group are given in Note 33. There are no impairment provisions held in respect of the group's investment securities.
Securities held as collateral as stock borrowed or under reverse repurchase agreements amounted to £39,975m (2006 £33,773m). These are not recognised as assets and are therefore not included above. Of this amount the group had resold or repledged £28,817m (2006 £25,309m) as collateral for its own transactions.

62
Notes to the Accountscontinued
13. Investment Securities continued
Bank 2007 2006 At fair value Available Loans and Total Total through the for sale receivables income statement £m £m £m £m £m
Listed
Debt securities 292 20,327 20,619 Equity shares 8 8
Total 292 20,335 20,627
Unlisted
Debt securities 113 5,231 7 5,351 374Equity shares 1,042 1,042 23
Total unlisted 113 6,273 7 6,393 397
Total 405 26,608 7 27,020 397
Comprising:Debt securities 405 25,558 7 25,970 374Equity shares 1,050 1,050 23
Investment securities held at fair value through the income statement and as available for sale are recorded at fair value. The fair value movement during the year was a loss of £2m (2006 £nil) and a loss of £490m (2006 £12m) respectively. Investment securities held as loans and receivables are held at amortised cost.
14. Interests in Jointly Controlled Entities and Associates
Interests in jointly controlled entities Acquired Equity Share of Goodwill Group Bank book value adjustments net carrying cost of assets value investment £m £m £m £m £m £m
At 1 January 2007 398 54 452 2 454 2 Transfer in under the HBOS Group Reorganisation 39 (34) 5 3 8 5Acquisitions and subscriptions of capital 262 262 262 36Exchange translation 4 4 4 Transfer to associates (3) 4 1 1 Transfer from associates 63 15 78 78 63Disposals (64) (64) (64) (3)Profit after tax 241 241 241 Dividends paid (132) (132) (132)
At 31 December 2007 699 148 847 5 852 103
The transfer from associates to jointly controlled entities is in respect of the group's interest in Sainsbury's Bank plc, following the acquisition on 8 February 2007 of an additional 5% interest taking the group's shareholding to 50%.
The following amounts are included in the group’s share of jointly controlled entities noted above:
Profit Current Non-current Current Non-current Equity after tax assets assets liabilities liabilities £m £m £m £m £m £m
2007 241 5,589 4,757 (4,691) (4,803) 8522006 139 3,433 4,799 (4,041) (3,737) 454
The group’s unrecognised share of losses for the year was £22m (2006 £36m). For entities making losses, subsequent profits earned are not recognised until previously unrecognised losses are extinguished. The group's unrecognised share of losses net of unrecognised profits on a cumulative basis is £68m (2006 £82m).

63
Notes to the Accountscontinued
14. Interests in Jointly Controlled Entities and Associates continued
Interests in associates Group Bank Acquired Equity carrying cost of book value adjustments value investment £m £m £m £m
At 1 January 2007 123 56 179 67 Transfer in under the HBOS Group Reorganisation 1 1 2 Acquisitions and subscriptions of capital 109 109 Transfer to jointly controlled entities (63) (15) (78) (63)Transfer from jointly controlled entities 3 (4) (1) Disposals (40) (13) (53) (4)Dividends paid (10) (10)
At 31 December 2007 133 15 148
The following amounts are included in the group’s share of associated undertakings noted above:
Profit Assets Liabilities Equity after tax £m £m £m £m
2007 1,651 (1,503) 1482006 13 3,280 (3,101) 179
The group’s unrecognised share of losses for the year was £5m (2006 £nil). For entities making losses, subsequent profits earned are not recognised until previously unrecognised losses are extinguished. The group's unrecognised share of losses net of unrecognised profits on a cumulative basis is £4m (2006 £nil).
The group's main jointly controlled entities and associates in operation at 31 December 2007 are as follows:
Nature of Issued Group’s Statutory Principal business share interest accounts area of capital made up to operations
Jointly controlled entitiesAA Personal Finance Limited Finance ordinary 3,000,002 50% December 2007 UKNFU Mutual Finance Limited Finance ordinary 500,002 50% December 2007 UKGreen Property Investment Fund 1 plc Investment ordinary 48,768,400 50% June 2007 IrelandSainsbury's Bank plc Banking ordinary 140,000,000 50% December 2007 UK Associates Rightmove plc Property website ordinary 129,399,978 13% December 2007 UK
All the interests in jointly controlled entities and associates are incorporated in the UK and are held by subsidiaries. Rightmove plc is listed on the London Stock Exchange and the group's interest had a market valuation of £76m at 31 December 2007. The group reduced its holding in Rightmove plc from 22% to 13% during the year (Note 1) and continues to consider the investment as an associate as a result of the influence arising from the group's representation on the Board. All other interests are unlisted. All interests in jointly controlled entities and associates are held by subsidiaries. Where entities have accounts that are drawn up to a date other than 31 December management accounts are used when accounting for them by the group.
15. Investments in SubsidiariesInvestments in subsidiaries comprise investments in equity shares carried at cost. There are no impairment provisions in respect of investments in subsidiaries.
Banks Others Total £m £m £m
At 1 January 2007 863 1,630 2,493 Transfer in under HBOS Group Reorganisation (815) 1,385 570Subscriptions of capital 210 210
At 31 December 2007 48 3,225 3,273
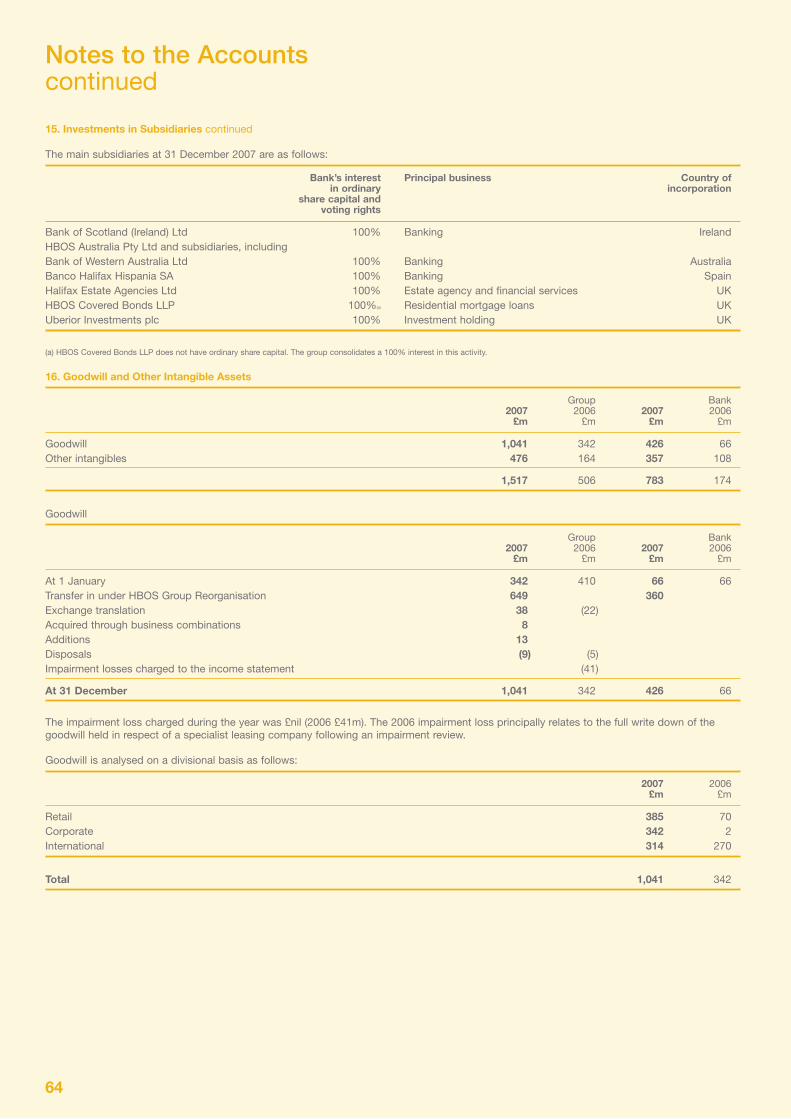
64
Notes to the Accountscontinued
15. Investments in Subsidiaries continued
The main subsidiaries at 31 December 2007 are as follows:
Bank’s interest Principal business Country of in ordinary incorporation share capital and voting rights
Bank of Scotland (Ireland) Ltd 100% Banking IrelandHBOS Australia Pty Ltd and subsidiaries, includingBank of Western Australia Ltd 100% Banking AustraliaBanco Halifax Hispania SA 100% Banking Spain Halifax Estate Agencies Ltd 100% Estate agency and financial services UK HBOS Covered Bonds LLP 100%(a) Residential mortgage loans UK Uberior Investments plc 100% Investment holding UK
(a) HBOS Covered Bonds LLP does not have ordinary share capital. The group consolidates a 100% interest in this activity.
16. Goodwill and Other Intangible Assets
Group Bank 2007 2006 2007 2006 £m £m £m £m
Goodwill 1,041 342 426 66Other intangibles 476 164 357 108
1,517 506 783 174
Goodwill
Group Bank 2007 2006 2007 2006 £m £m £m £m
At 1 January 342 410 66 66 Transfer in under HBOS Group Reorganisation 649 360 Exchange translation 38 (22) Acquired through business combinations 8 Additions 13 Disposals (9) (5) Impairment losses charged to the income statement (41)
At 31 December 1,041 342 426 66
The impairment loss charged during the year was £nil (2006 £41m). The 2006 impairment loss principally relates to the full write down of the goodwill held in respect of a specialist leasing company following an impairment review.
Goodwill is analysed on a divisional basis as follows:
2007 2006 £m £m
Retail 385 70Corporate 342 2International 314 270
Total 1,041 342

65
Notes to the Accountscontinued
16. Goodwill and Other Intangible Assets continued
Other intangible assets
Group 2007 2006 Purchased Software Total Purchased Software Total value of and other value of and other in-force intangible in-force intangible investment assets investment assets contracts contracts £m £m £m £m £m £m
CostAt 1 January 2 359 361 2 277 279 Transfer in under HBOS Group Reorganisation 574 574 Exchange translation 34 34 (3) (3)Acquired through business combination 7 7 Additions 242 242 92 92Disposals (29) (29) (7) (7)
At 31 December 2 1,187 1,189 2 359 361
Amortisation At 1 January 197 197 168 168 Transfer in under HBOS Group Reorganisation 359 359 Exchange translation 32 32 (5) (5)Amortisation for the year 130 130 36 36Disposals (5) (5) (2) (2)
At 31 December 713 713 197 197
Carrying value At 1 January 2 162 164 2 109 111At 31 December 2 474 476 2 162 164
Software
Bank 2007 2006 £m £m
CostAt 1 January 270 217 Transfer in under HBOS Group Reorganisation 506 Additions 162 53Disposals (9)
At 31 December 929 270
Amortisation At 1 January 162 136 Transfer in under HBOS Group Reorganisation 306 Amortisation for the year 102 26Additions 2
At 31 December 572 162
Carrying value At 1 January 108 81At 31 December 357 108
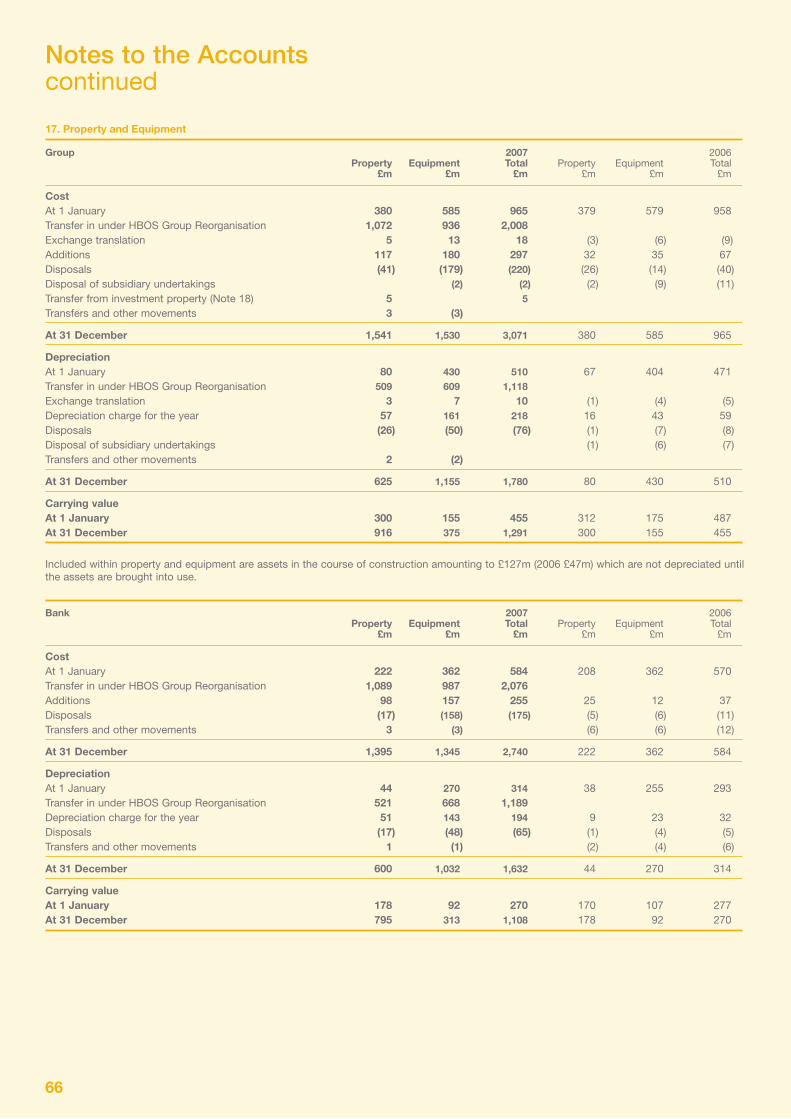
66
Notes to the Accountscontinued
17. Property and Equipment
Group 2007 2006 Property Equipment Total Property Equipment Total £m £m £m £m £m £m
CostAt 1 January 380 585 965 379 579 958Transfer in under HBOS Group Reorganisation 1,072 936 2,008 Exchange translation 5 13 18 (3) (6) (9)Additions 117 180 297 32 35 67Disposals (41) (179) (220) (26) (14) (40)Disposal of subsidiary undertakings (2) (2) (2) (9) (11)Transfer from investment property (Note 18) 5 5 Transfers and other movements 3 (3)
At 31 December 1,541 1,530 3,071 380 585 965
DepreciationAt 1 January 80 430 510 67 404 471 Transfer in under HBOS Group Reorganisation 509 609 1,118 Exchange translation 3 7 10 (1) (4) (5)Depreciation charge for the year 57 161 218 16 43 59Disposals (26) (50) (76) (1) (7) (8)Disposal of subsidiary undertakings (1) (6) (7) Transfers and other movements 2 (2)
At 31 December 625 1,155 1,780 80 430 510
Carrying value At 1 January 300 155 455 312 175 487At 31 December 916 375 1,291 300 155 455
Included within property and equipment are assets in the course of construction amounting to £127m (2006 £47m) which are not depreciated until the assets are brought into use.
Bank 2007 2006 Property Equipment Total Property Equipment Total £m £m £m £m £m £m
CostAt 1 January 222 362 584 208 362 570 Transfer in under HBOS Group Reorganisation 1,089 987 2,076 Additions 98 157 255 25 12 37Disposals (17) (158) (175) (5) (6) (11)Transfers and other movements 3 (3) (6) (6) (12)
At 31 December 1,395 1,345 2,740 222 362 584
DepreciationAt 1 January 44 270 314 38 255 293 Transfer in under HBOS Group Reorganisation 521 668 1,189 Depreciation charge for the year 51 143 194 9 23 32Disposals (17) (48) (65) (1) (4) (5)Transfers and other movements 1 (1) (2) (4) (6)
At 31 December 600 1,032 1,632 44 270 314
Carrying value At 1 January 178 92 270 170 107 277At 31 December 795 313 1,108 178 92 270

67
Notes to the Accountscontinued
18. Investment Properties
2007 2006 £m £m
At 1 January 39 37 Transfer in under HBOS Group Reorganisation 54 Disposals (52) (2)Fair value movement (2) 4 Group transfers (Note 17) (5)
At 31 December 34 39
Investment properties are carried at their fair value as determined by independent qualified surveyors having recent experience in the location and category of the property being valued. Fair values were determined having regard to recent market transactions for similar properties.
Rental income and expenses in respect of the above properties amounted to £1m and £nil respectively (2006 £2m and £nil respectively).
19. Operating Lease AssetsAssets leased to customers include the following amounts in respect of operating lease assets:
2007 2006 Cost Depreciation Carrying Cost Depreciation Carrying value value £m £m £m £m £m £m
At 1 January 3,293 (1,209) 2,084 2,936 (1,052) 1,884 Transfer in under HBOS Group Reorganisation 2,871 (274) 2,597 Exchange translation (28) 30 2 (3) (1) (4)Additions 1,785 1,785 1,400 1,400Disposals (1,438) 598 (840) (1,040) 345 (695)Depreciation charge for the year (985) (985) (501) (501)
At 31 December 6,483 (1,840) 4,643 3,293 (1,209) 2,084
Future minimum lease payments under non-cancellable operating leases are due to be received in the following periods:
2007 2006 £m £m
Not later than one year 864 633Later than one year and not later than five years 1,920 627Later than five years 689 32
3,473 1,292

68
Notes to the Accountscontinued
20. Deferred Tax
Group Bank 2007 2006 2007 2006 £m £m £m £m
Deferred tax liabilities 1,300 699 202 31Deferred tax assets (335) (328) (354) (236)
Net position 965 371 (152) (205)
At 31 December 2007 a deferred tax liability of £171m (2006 £155m) relating to investments in subsidiaries has not been recognised because the Bank controls whether or not the liability will be incurred and it is satisfied that it will not be incurred in the foreseeable future.
As a result of the Finance Act 2007, the main UK corporation tax rate will reduce from 30% to 28% in April 2008. UK deferred tax balances that are not expected to have been realised by April 2008 have been restated at the rate of 28%. The movement in the net position is as follows:
Group Bank 2007 2006 2007 2006 £m £m £m £m
At 1 January 371 (119) (205) (464) Transfer in under HBOS Group Reorganisation 786 113 Charge to income for the year (Note 7) 119 89 79 26 Change in rate of corporation tax recognised in income (76) 9 Change in rate of corporation tax recognised in equity (5) 3Transfer to current tax 37 Charge to equity for the year (223) 145 (149) 14Other movements* (7) 219 (2) 219
At 31 December 965 371 (152) (205)
* The other movement in 2006 relates primarily to the deferred tax asset on the Retirement Benefit Plans which were transferred to HBOS plc during that year.
Deferred tax liabilities
Group 2007 EIR Capital Available Cash flow Other Total allowances for sale hedges investments £m £m £m £m £m £m
At 1 January 362 97 177 63 699 Transfer in under HBOS Group Reorganisation 121 749 (8) 5 35 902(Credit)/charge to income for the year (19) 39 (2) (24) (6) (Credit)/charge to equity for the year (65) (182) 59 (188) Change in rate of corporation tax recognised in income (7) (76) (10) (93) Change in rate of corporation tax recognised in equity (7) (7)Other movements 3 (7) (3) (7)
At 31 December 98 1,067 15 120 1,300
Deferred tax assets
Group Employee Provisions Effective Cash flow Other 2007 benefits interest rate hedges Total adjustment £m £m £m £m £m £m
At 1 January (10) (162) (49) (107) (328) Transfer in under HBOS Group Reorganisation (13) (40) 49 (112) (116)Charge to income for the year 3 25 97 125(Credit)/charge to equity for the year (36) 1 (35) Change in rate of corporation tax recognised in income 1 9 7 17Change in rate of corporation tax recognised in equity 2 2
At 31 December (19) (168) (34) (114) (335)
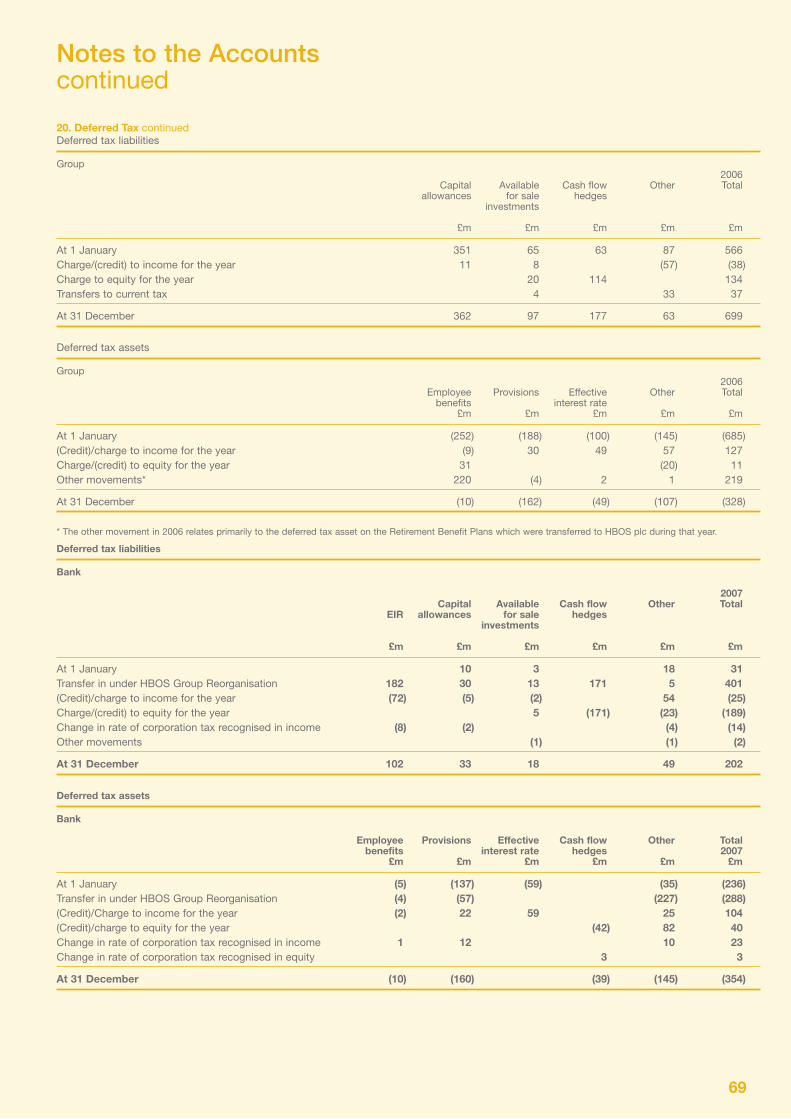
69
Notes to the Accountscontinued
20. Deferred Tax continuedDeferred tax liabilities
Group 2006 Capital Available Cash flow Other Total allowances for sale hedges investments £m £m £m £m £m
At 1 January 351 65 63 87 566Charge/(credit) to income for the year 11 8 (57) (38)Charge to equity for the year 20 114 134Transfers to current tax 4 33 37
At 31 December 362 97 177 63 699
Deferred tax assets
Group 2006 Employee Provisions Effective Other Total benefits interest rate £m £m £m £m £m
At 1 January (252) (188) (100) (145) (685)(Credit)/charge to income for the year (9) 30 49 57 127 Charge/(credit) to equity for the year 31 (20) 11 Other movements* 220 (4) 2 1 219
At 31 December (10) (162) (49) (107) (328)
* The other movement in 2006 relates primarily to the deferred tax asset on the Retirement Benefit Plans which were transferred to HBOS plc during that year.
Deferred tax liabilities
Bank 2007 Capital Available Cash flow Other Total EIR allowances for sale hedges investments £m £m £m £m £m £m
At 1 January 10 3 18 31 Transfer in under HBOS Group Reorganisation 182 30 13 171 5 401 (Credit)/charge to income for the year (72) (5) (2) 54 (25) Charge/(credit) to equity for the year 5 (171) (23) (189) Change in rate of corporation tax recognised in income (8) (2) (4) (14) Other movements (1) (1) (2)
At 31 December 102 33 18 49 202
Deferred tax assets
Bank Employee Provisions Effective Cash flow Other Total benefits interest rate hedges 2007 £m £m £m £m £m £m
At 1 January (5) (137) (59) (35) (236) Transfer in under HBOS Group Reorganisation (4) (57) (227) (288) (Credit)/Charge to income for the year (2) 22 59 25 104 (Credit)/charge to equity for the year (42) 82 40 Change in rate of corporation tax recognised in income 1 12 10 23Change in rate of corporation tax recognised in equity 3 3
At 31 December (10) (160) (39) (145) (354)

70
Notes to the Accountscontinued
20. Deferred Tax continued
Deferred tax liabilities
Bank 2006 Capital Available Other Total allowances for sale investments £m £m £m £m
At 1 January (1) 2 21 22Charge/(credit) to income for the year 11 (3) 8Charge to equity for the year 1 1
At 31 December 10 3 18 31
Deferred tax assets
Bank 2006 Employee Provisions Effective Other Total benefits interest rate adjustment £m £m £m £m £m
At 1 January (247) (128) (93) (18) (486)(Credit)/charge to income for the year (7) (9) 34 18Charge/(credit) to equity for the year 30 (17) 13 Other movements 219 219
At 31 December (5) (137) (59) (35) (236)
21. Provisions
Group Bank Regulatory Other Total Regulatory Other Total provisions provisions provisions provisions £m £m £m £m £m £m
At 1 January 2007 39 39 3 3 Transfer in under HBOS Group Reorganisation 131 26 157 131 25 156Exchange translation 3 3 Additional provision in the year 122 17 139 122 2 124Utilised in year (147) (19) (166) (147) (1) (148)
At 31 December 2007 106 66 172 106 29 135
Regulatory provisions are established when a legal or constructive obligation exists and represents the estimated cost of making redress payments to customers in respect of past product sales where sales processes have been deficient. Other provisions include property related costs in respect of surplus leased space that amounted to £25m (2006 £23m) for the group at the year end and provisions for long term and annual leave.

71
Notes to the Accountscontinued
22. Debt Securities in Issue
Group Bank 2007 2006 2007 2006 £m £m £m £m
Bonds and medium term notes 73,818 58,589 69,123 1,046 Other debt securities 132,702 89,188 80,065
206,520 147,777 149,188 1,046
The group issues debt securities principally from special purpose entities that are secured against loans and advances, debt securities and certain other assets of the group. At 31 December 2007 such debt securities in issue amounted to £57,716m (2006 £30,106m) of which £11,954m (2006 £19,010) is issued by the Grampian conduit and £137m (2006 £835m) by the Landale conduit. In addition, the Group has issued £24,780m (2006 £16,826m) of covered bonds. Debt securities in issue measured at amortised cost include £38,036m (2006 £39,181m) of securities subject to fair value hedge designation, such as debt securities relating to securitisation and covered bonds, the carrying value of which has been adjusted to reflect the fair value of the risk being hedged.
23. Other Borrowed Funds Group Bank 2007 2006 2007 2006 £m £m £m £m
Preferred securities 2,417 720 Preference shares 1,227 412 1,227 412Subordinated liabilities: Dated 10,485 5,086 9,522 4,204Undated 3,752 2,490 4,106 2,811
17,881 8,708 14,855 7,427
Preferred securities Group 2007 2006 £m £m
£250m preferred securities 250 250£150m preferred securities 150 150£4m preferred securities 4£285m junior perpetual securities 285£2bn 6.0064/6.0895% Fixed Rate Perpetual Securities 2,000 Fortrose preference shares 2 Newburgh preference shares 2 £4m preference shares 4£3m preference shares 3 £1m preference shares 1US$45m preference shares 23 Accrued interest 13
2,417 720
On 21 June 2007 Fortrose Investments Ltd, a subsidiary, issued £2,000m of 6.0064/6.0895% Fixed Rate Perpetual Securities. Interest is payable two monthly in arrears, and the step up in rate occurs in March 2008.
During 2006 Castlemill Investments Ltd, a subsidiary, issued £285m of Junior Perpetual Preferred Securities and other subsidiaries issued Preferred Securities totalling £12m and US$45m, all of which were redeemed during 2007.

72
Notes to the Accountscontinued
23. Other Borrowed Funds continued
Preference shares Group Bank 2007 2006 2007 2006 £m £m £m £m
£300m 9 1/4% Non-cumulative Irredeemable £1 preference shares 300 300 300 300£100m 9 3/4% Non-cumulative Irredeemable £1 preference shares 100 100 100 100£800m 6 1/8% Non-cumulative preference share 800 800 Accrued interest 27 12 27 12
1,227 412 1,227 412
Dated subordinated liabilities Group Bank 2007 2006 2007 2006 £m £m £m £m
€500m 5.50% Instruments 2009 367 335 367 335€650m 4.75% Subordinated Bonds 2009 * 477 477 US$500m Notes 2010 249 254 249 254US$150m Notes 2011 75 76 75 76€12.8m 6.25% Instruments 2012 9 9 €325m 6.125% Notes 2013 239 218 239 218€1,000m Subordinated Callable Fixed/Floating Rate Instruments 2013 734 671 734 671£250m 6.375% Instruments 2019 250 250 250 250€750m 5.5% Notes 2012 551 503 551 503US$450m Subordinated Floating Rate Notes 2012 229 229 A$75m Callable Notes 2012 30US$1,000m 4.25% Subordinated Guaranteed Notes 2013 499 509 £330m Floating Rate Subordinated Notes 2013 330 330 330 330£300m Floating Rate Subordinated Notes 2013 300 300 300 300£700m Floating Rate Subordinated Notes 2013 700 700 700 700£300m Floating Rate Subordinated Notes 2013 300 300 300 300 £250m 11% Subordinated Bonds 2014 * 250 250 A$200m instruments 2014 88 81A$125m instruments 2015 55 50 A$200m instruments 2016 88 81 A$200m instruments 2016 88 81£150m 10.5% Subordinated Bonds 2018 * 150 150 £500m 9.375% Subordinated Bonds 2021* 500 500 £520m Floating Rate Subordinated Notes 2013 520 520 £300m Floating Rate Subordinated Notes 2013 * 300 300 £300m Floating Rate Subordinated Notes 2013 * 300 300 £270m Floating Rate Subordinated Notes 2013 * 270 270 £500m Floating Rate Subordinated Notes 2013 500 500 £2,000 Floating Rate Subordinated Notes 2013 2,000 2,000 A$300m Floating Rate Subordinated Notes 2017 131 Fair value hedge adjustments 28 36 28 Unamortised premiums, discounts and issue costs (1) (8) (1) (8)Accrued interest 138 51 133 46
10,485 5,086 9,522 4,204
* Transferred in under the HBOS Group Reorganisation Act 2006
During 2007 the Bank issued floating rate subordinated notes at par to its parent HBOS plc, as follows:
On 28 February 2007, £520m floating rate subordinated notes were issued by the Bank, at par, to its parent undertaking HBOS plc. The notes bear interest at the three month LIBOR rate plus 76 basis points.
On 26 August 2007, A$300m floating rate subordinated notes were issued by a subsidiary of the Bank, at par, to its ultimate parent undertaking HBOS plc. These instruments bear interest at the three month Australian Bank Bill rate plus 76 basis points.
On 31 October 2007, £500m floating rate subordinated notes were issued by the Bank, at par, to its parent undertaking HBOS plc. The notes bear interest at the three month LIBOR rate plus 76 basis points.
On 31 December 2007, £2bn floating rate subordinated notes were issued by the Bank, at par, to its parent undertaking HBOS plc. The notes bear interest at the three month LIBOR rate plus 76 basis points.

73
Notes to the Accountscontinued
23. Other Borrowed Funds continuedNo repayment, for whatever reason, of dated subordinated liabilities prior to its stated maturity and no purchase by the relevant entity of its subordinated debt may be made without the consent of the Financial Services Authority. On a winding up of the Bank or subsidiary, the claims of the holders of dated loan capital shall be subordinated in right of payment to the claims of all depositors and creditors of the Bank or subsidiary other than creditors whose claims are expressed to rank pari passu with, or junior to, the claims of the holders of the dated loan capital.
Undated subordinated liabilities Group Bank 2007 2006 2007 2006 £m £m £m £m
US$300m Reset Notes 153 153£200m Perpetual Notes 200 200 200 200£300m Perpetual Regulatory Tier 1 Securities 300 300 300 300€500m Instruments 367 335 367 335US$250m Floating Rate Primary Capital Notes 125 127 125 127£150m Instruments 150 150 150 150JPY 17bn Instruments 76 73 76 73£100m Instruments 100 100 100 100 JPY 9bn Instruments 40 38£300m Instruments 300 300 300 300£250m Perpetual Preferred Notes 250 250 £150m Perpetual Preferred Notes 150 150 £150m Floating Rate Subordinated Notes 150 150 150 150£500m Floating Rate Subordinated Notes 500 500 500 500£100m 12% Perpetual Subordinated Bonds * 100 100 £100m 8.75% Perpetual Subordinated Bonds * 100 100 £75m 13.625% Perpetual Subordinated Bonds* 75 75 £50m 9.375% Perpetual Subordinated Bonds * 50 50 £500m Floating Rate Subordinated Notes * 500 500 £300m Floating Rate Subordinated Notes * 300 300 £250m Floating Rate Subordinated Notes* 250 250 Fair value hedge adjustments 43 44 33 Unamortised premiums, discounts and issue costs (5) (3) (5) (3)Accrued interest 31 23 35 26
3,752 2,490 4,106 2,811
* Transferred in under the HBOS Group Reorganisation Act 2006
No exercise of any redemption option or purchase by the relevant entity of any of its undated subordinated liabilities may be made without the consent of the Financial Services Authority. On a winding up of the Bank or subsidiary, the claims of the holders of undated loan capital shall be subordinated in right of payment to the claims of all depositors and creditors of the Bank or subsidiary other than creditors whose claims are expressed to rank pari passu with, or junior to, the claims of the holders of the undated loan capital. The undated loan capital is junior in point of subordination to the dated loan capital referred to above.

74
Notes to the Accountscontinued
24. Share Capital
Allotted, called up and fully paid Ordinary shares £m
At 1 January 2006 410Shares issued 26
At 31 December 2006 436Shares issued 63
At 31 December 2007 499
Issued Share CapitalDuring February 2007, 42 million ordinary shares were issued at £11.30 each, in June 2007, 45 million ordinary shares were issued at £11.00 each and in October 2007,167 million ordinary shares were issued at £9.00 each.
Authorised Share CapitalAt 31 December 2007 the authorised share capital comprised:
Ordinary shares2,085 million ordinary shares of 25 pence each (2006 1,785 million).
Preference shares150,000 7.754%, non-cumulative perpetual preference shares of £10 each (2006 150,000), 250,000 8.117% non-cumulative perpetual preference shares of £10 each (2006 250,000), 375,000,000 9.25% non-cumulative irredeemable preference shares of £1 each (2006 375,000,000), 125,000,000 9.75% non-cumulative irredeemable preference shares of £1 each (2006 125,000,000).
The terms of some of the preference shares when issued are such that these shares are classified as other borrowed funds rather than as issued share capital.

75
Notes to the Accountscontinued
25. Shareholders’ Equity
Group Other reserves
Share Share Cash flow Available Other Retained Minority Total capital premium hedge for sale reserves (a) earnings interests reserve reserve (b) £m £m £m £m £m £m £m £m
At 1 January 2006 410 2,951 143 181 4 5,708 79 9,476Foreign exchange translation (33) (33)Net actuarial losses from defined benefit plans (net of tax) 71 71Capital contribution 515 515Tax relief on share plans 25 25Available for sale investments: Net change in fair value 186 186 Net gains transferred to income statement (163) (163)Cash flow hedges: Effective portion of changes in fair value taken to equity 187 187 Net losses transferred to income statement 86 86Profit for the year 2,189 36 2,225
Total recognised income and expense 273 23 482 2,285 36 3,099Dividends paid (1,425) (29) (1,454)Issue of new shares 26 975 76 1,077Other net movements in minority interests 207 207
At 31 December 2006 and 1 January 2007 436 3,926 416 204 486 6,568 369 12,405
Foreign exchange translation 2 (6) 12 8
Available for sale investments: Net change in fair value (336) (336) Net gains transferred to income statement (184) (184)Cash flow hedges: Effective portion of changes in fair value taken to equity (216) (216) Net gains transferred to income statement (292) (292)Profit for the year 3,608 30 3,638
Total recognised income and expense (508) (518) (6) 3,608 42 2,618Transfer in under HBOS Group Reorganisation 7 1 1,085 5,011 15 6,119Dividends paid (Note 27) (1,672) (43) (1,715)Issue of new shares (Note 24) 63 2,417 98 2,578Disposal of subsidiaries (125) (125)Movements in share-based compensation reserve (36) (36)
At 31 December 2007 499 6,343 (85) (313) 1,565 13,479 356 21,844
(a) Other reserves principally include the merger reserve of £494m arising from the combination of Halifax and Bank of Scotland in 2001 and the merger reserve of £612m arising under the
HBOS Group Reorganisation. The cumulative balance for exchange translation at 31 December 2007 is £(28)m (2006 £(32)m)
(b) The available for sale reserve is comprised of £(450m) (2006 £33m) in respect of treasury assets and £137m (2006 £170m) in respect of corporate and other investments.

76
Notes to the Accountscontinued
25. Shareholders’ Equity continued
Bank Other reserves
Share Share Cash flow Available Other Retained Total capital premium hedge for sale reserves (a) earnings reserve reserve (b) £m £m £m £m £m £m £m
At 1 January 2006 410 2,951 (7) 4 62 3,386 6,806Foreign exchange translation (13) (1) (14)Net actuarial loss from defined benefit plans (net of tax) 71 71Capital contribution 515 515Tax relief on share plans 23 23Available for sale investments: Net change in fair value 3 3Cash flow hedges: Effective portion of changes in fair value taken to equity 7 7Profit for the year 1,818 1,818
Total recognised income and expense 7 3 502 1,911 2,423Dividends paid (Note 27) (1,425) (1,425)Issue of new shares 26 975 1,001
At 31 December 2006 and 1 January 2007 436 3,926 7 564 3,872 8,805
Foreign exchange translation (7) (7) Available for sale investments: Net change in fair value (248) (248) Net gains transferred to income statement (11) (11)Cash flow hedges: Effective portion of changes in fair value taken to equity (209) (209) Net losses transferred to income statement (290) (290)Profit for the year 2,420 2,420
Total recognised income and expense (499) (259) (7) 2,420 1,655 Transfer in under HBOS Group Reorganisation 386 18 1,086 5,457 6,947Dividends paid (Note 27) (1,672) (1,672)Issue of new shares (Note 24) 63 2,417 2,480Movements share-based compensation reserve (36) (36)
At 31 December 2007 499 6,343 (113) (234) 1,643 10,041 18,179
(a) Other reserves principally include the merger reserve of £494m arising from the combination of Halifax and Bank of Scotland in 2001 and the merger reserve of £612m arising under the
HBOS Group Reorganisation. The cumulative balance for exchange translation at 31 December 2007 is £(28)m (2006 £(32)m)
(b) The available for sale reserve is comprised of £(450m) (2006 £33m) in respect of treasury assets and £137m (2006 £170m) in respect of corporate and other investments.
26. Capital ManagementThe group's approach to managing capital is set out on pages 8 to 19 of the 'Risk Management' report. As the Bank is regulated at both a solo-consolidated and consolidated levels these principles apply to both the Bank and group.

77
Notes to the Accountscontinued
27. DividendsOrdinary dividends are charged to reserves only when the Bank has a contractual obligation to pay. The following dividends have been charged to retained earnings during the year:
Group and Bank 2007 2006 £m £m
Ordinary share dividends2005 final dividend 4672006 interim dividend 958 2006 final dividend 1,050 2007 interim dividend 622
1,672 1,425
28. Contingent Liabilities and Commitments
Group Bank 2007 2006 2007 2006 £m £m £m £m
Contingent liabilitiesAcceptances and endorsements 43 62 37 53Guarantees and irrevocable letters of credit 6,491 4,837 10,124 54,066
6,534 4,899 10,161 54,119
Commitments
Short term trade related transactions 115 120 86 105Undrawn formal standby facilities, credit lines and other commitments to lend with a maturity:Up to and including one year 68,253 28,196 71,620 19,295Over one year 31,416 21,507 26,384 17,118
99,784 49,823 98,090 36,518
Included above in the Bank's disclosures are guarantees to subsidiaries of £4,288m (2006 £49,768m) and commitments to subsidiaries of £12,851m (2006 £81m).
The contractual amounts above indicate the volume of business outstanding at the year end and do not reflect the underlying credit and other risks, which are significantly lower as some facilities will not be drawn down and some facilities that are drawn will be supported by collateral. Further de-tails of assets pledged as collateral security are given in Note 13 for investment securities and Note 11 for loans and advances to customers.

78
Notes to the Accountscontinued
28 Contingent Liabilities and Commitments continuedWhere the group or Bank is a lessee the future minimum lease payments under non-cancellable operating leases are due to be paid in the following periods:
Group Bank 2007 2006 2007 2006 £m £m £m £m
Not later than one year 170 64 124 32 Later than one year and not later than five years 627 262 453 122 Later than five years 1,205 534 751 254
2,002 860 1,328 408
Where the group is a lessee the future obligations payable under finance leases are as follows:
Group 2007 2006 £m £m
Not later than one year 1 1 Later than one year and not later than five years 1
Commitments in respect of capital expenditure on property and equipment that is authorised but not provided for in the accounts, for which contracts have been entered into amount to £21m (2006 £11m). Commitments for which contracts have been placed in relation to operating leased assets amount to £11m (2006 £9m).
On 27 July 2007 it was announced that the Bank, along with seven other major UK current account providers, had reached agreement with the Office of Fair Trading to start legal proceedings in the High Court of England and Wales for a declaration (or declarations) to resolve legal uncertainties concerning the fairness and lawfulness of unapproved overdraft charges (the "test case"). It was also announced that the Bank and those other providers will seek a stay of all current and potential future Court proceedings which are brought against them in the UK concerning these charges and have obtained the consent of the Financial Services Ombudsman not to proceed with consideration of the merits of any complaints concerning these charges that are referred to him prior to the resolution of the test case. By virtue of a waiver granted by the Financial Services Authority of its complaints handling rules, the Bank (and other banks, including the banks party to the test case) will not be dealing with or resolving customer complaints on unapproved overdraft charges while the test case is running. A definitive outcome of the test case is unlikely to be known for at least 12 months. Given the very early stage of these proceedings and the uncertainty as to their outcome, it is not practicable at this time to estimate any potential financial effect.
Prior to the announcement above the group refunded certain unapproved overdraft charges on an ex-gratia basis as shown in Note 2. The group's consideration of the current position is outlined in the critical accounting judgement in respect of regulatory provisions.
HBOS is engaged in various other litigation in the UK and overseas arising out of its normal business activities. HBOS considers that none of these actions is material and has not disclosed any contingent liability in respect of these actions because it is not practicable to do so.
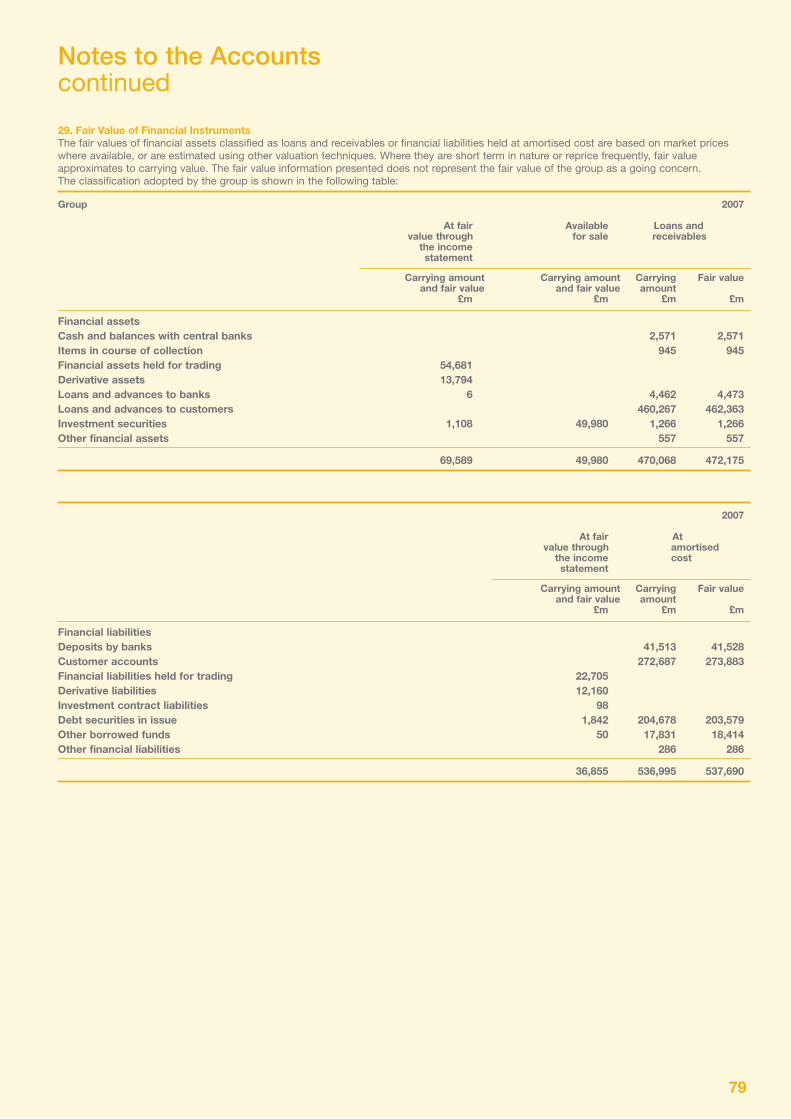
79
Notes to the Accountscontinued
29. Fair Value of Financial Instruments The fair values of financial assets classified as loans and receivables or financial liabilities held at amortised cost are based on market prices where available, or are estimated using other valuation techniques. Where they are short term in nature or reprice frequently, fair value approximates to carrying value. The fair value information presented does not represent the fair value of the group as a going concern. The classification adopted by the group is shown in the following table:
Group 2007 At fair Available Loans and value through for sale receivables the income statement
Carrying amount Carrying amount Carrying Fair value and fair value and fair value amount £m £m £m £m
Financial assetsCash and balances with central banks 2,571 2,571Items in course of collection 945 945Financial assets held for trading 54,681 Derivative assets 13,794 Loans and advances to banks 6 4,462 4,473Loans and advances to customers 460,267 462,363Investment securities 1,108 49,980 1,266 1,266Other financial assets 557 557
69,589 49,980 470,068 472,175
2007 At fair At value through amortised the income cost statement
Carrying amount Carrying Fair value and fair value amount £m £m £m
Financial liabilitiesDeposits by banks 41,513 41,528Customer accounts 272,687 273,883Financial liabilities held for trading 22,705 Derivative liabilities 12,160 Investment contract liabilities 98 Debt securities in issue 1,842 204,678 203,579Other borrowed funds 50 17,831 18,414Other financial liabilities 286 286
36,855 536,995 537,690

80
Notes to the Accountscontinued
29. Fair Value of Financial Instruments continued
Group 2006 At fair Available Loans and value through for sale receivables the income statement
Carrying amount Carrying amount Carrying Fair value and fair value and fair value amount £m £m £m £m
Financial assetsCash and balances with central banks 1,641 1,641Items in course of collection 733 733Financial assets held for trading 49,139 Derivative assets 8,383 Loans and advances to banks 126,068 126,043Loans and advances to customers 215,255 215,591Investment securities 203 44,812 493 493Other financial assets 646 629
57,725 44,812 344,836 345,130
2006 At fair At value through amortised the income cost statement
Carrying amount Carrying Fair value and fair value amount £m £m £m
Financial liabilitiesDeposits by banks 140,185 140,089Customer accounts 106,829 106,838Financial liabilities held for trading 22,334 Derivative liabilities 9,338 Investment contract liabilities 96 Debt securities in issue 3,260 144,517 144,174Other borrowed funds 48 8,660 8,790Other financial liabilities 1,067 968
35,076 401,258 400,859
Bank 2007 At fair Available Loans and value through for sale receivables the income statement
Carrying amount Carrying amount Carrying Fair value and fair value and fair value amount £m £m £m £m
Financial assetsCash and balances with central banks 1,294 1,294Items in course of collection 890 890Financial assets held for trading 52,169 Derivative assets 12,134 Loans and advances to banks 25,831 25,834Loans and advances to customers 453,590 455,319Investment securities 405 26,608 7 7Other financial assets 2,235 2,235
64,708 26,608 483,847 485,579

81
Notes to the Accountscontinued
29. Fair Value of Financial Instruments continued
Bank 2007 At fair At value through amortised the income cost statement
Carrying amount Carrying Fair value and fair value amount £m £m £m
Financial liabilitiesDeposits by banks 47,321 47,338Customer accounts 316,849 317,903Financial liabilities held for trading 22,145 Derivative liabilities 10,546 Investment contract liabilities Debt securities in issue 149,188 148,306Other borrowed funds 14,855 15,469Other financial liabilities 103 103
32,691 528,316 529,119
Bank 2006 At fair Available Loans and value through for sale receivables the income statement
Carrying amount Carrying amount Carrying Fair value and fair value and fair value amount
£m £m £m £m
Financial assets Cash and balances with central banks 1,059 1,059Items in course of collection 667 667Financial assets held for trading Derivative assets 47 Loans and advances to banks 53,154 53,154Loans and advances to customers 120,693 120,693Investment securities 397 Other financial assets 66 66
47 397 175,639 175,639
2006 At fair At value through amortised the income cost statement
Carrying amount Carrying Fair value and fair value amount £m £m £m
Financial liabilitiesDeposits by banks 92,194 92,194Customer accounts 68,674 68,685Financial liabilities held for trading Derivative liabilities 55 Investment contract liabilities Debt securities in issue 1,046 1,046Other borrowed funds 7,427 7,427Other financial liabilities 131 131
55 169,472 169,483

82
Notes to the Accountscontinued
29. Fair Value of Financial Instruments continuedThe valuation methodologies for financial instruments recognised at fair value basis are set out in the appropriate accounting policies. The basis for calculating the fair value of financial instruments carried at amortised cost is set out below.
Loans and advances to banks, loans and advances to customers, deposits by banks and customer accounts are not regularly traded and so market prices are not available. Fair value is estimated by discounting anticipated contractual cash flows at a current market rate of interest. Current market rates are estimated by discounting anticipated contractual cashflows at a current market rate of interest and certain portfolios of loans are also impacted by a significant change in credit spread. Current market rates are estimated by reference to the rates at which similar products are advanced by the group and market. For loans and deposits with variable interest rates or fixed rates which are re-priced within a short period, the carrying value represents fair value. For debt securities in issue and other borrowed funds carried at amortised cost, the fair values which have been derived using quoted prices where available, broker valuations and where these are not available, cash flow models, adjusted for credit spreads where appropriate.
These calculations do not necessarily represent the fair value that could be obtained for the portfolios if they were sold at 31 December 2007. The exit price for such portfolios in a wholesale market would be subject to negotiation with a buyer and, for the financial assets, would take account of factors including credit risk, loan to collateral ratios, liquidity, contractual terms, historic default rates and age of the portfolio. These factors and others would in combination be the basis of valuation of the portfolios. All such drivers of valuation interact and there is no certainty that any single factor would have a greater impact on the portfolio valuation than others.
For loans and deposits with variable interest rates or fixed rates which are re-priced within a short period, the carrying value represents fair value. For loans with fixed rates which do not re-price in the short term, the carrying values have been adjusted to reflect current interest rates using discounted cash flow models.
For debt securities in issue and other borrowed funds carried at amortised cost, the fair values have been derived using quoted prices where available, broker valuations and where these are not available, cash flow models adjusted for credit spreads where appropriate.
Yield curves are used within the calculations that take into account credit conditions where appropriate.
30. Credit RiskThe HBOS Group's approach to managing credit risk is set out on pages 10 to 12 of the "Risk Management" report which includes some dis-closures under IFRS 7 ' Financial Instruments: Disclosures'. The table below sets out the group's and Bank's exposure to credit risk relating to financial instruments. Group Bank 2007 2006 2007 2006 £m £m £m £m
AssetsCash and balances at central banks 2,571 1,641 1,294 1,059 Items in the course of collection 945 733 890 667 Financial assets held for trading 54,681 49,139 52,169 Derivative assets 13,794 8,383 12,134 47 Loans and advances to banks 4,468 126,068 25,831 53,154 Loans and advances to customers 460,267 215,255 453,590 120,693 Debt securities 48,833 43,077 25,970 374 Other financial assets (excluding equity shares) 557 646 1,930 328
586,116 444,942 573,808 176,322 Contingent liabilities and commitments 106,318 54,722 108,251 90,637
Total 692,434 499,664 682,059 266,959
Financial Assets Held for TradingFinancial assets held for trading are almost exclusively invested in investment grade investments with 99% (2006 99%) of inter-bank and structured investment portfolios rated 'A' or above based on internal credit ratings. An analysis of financial assets held for trading is given in Note 8.
Derivative AssetsDerivative assets are primarily traded with investment grade counterparties with 83% (2006 92%) of derivatives rated A or above based on internal credit ratings. An analysis of derivative assets is given in Note 10.
Loans and advances to banksLoans and advances to banks are primarily invested with investment grade banks of which 75% (2006 98%) have a credit rating of 'A' or above based on internal credit ratings.
Loans and advances to customersLoans and advances to customers are managed on a divisional basis. A divisional analysis of advances to customers is set out in Note 11 and an analysis of loans and advances is given in Note 11. Disclosures under IFRS7 'Financial Instruments: Disclosures' in respect of the credit quality of loans and advances is given in the divisional sections of the Business Review prefaced as being an integral part of the financial statements as follows; Retail pages 1 to 2, Corporate page 2 and International on pages 2 to 3.
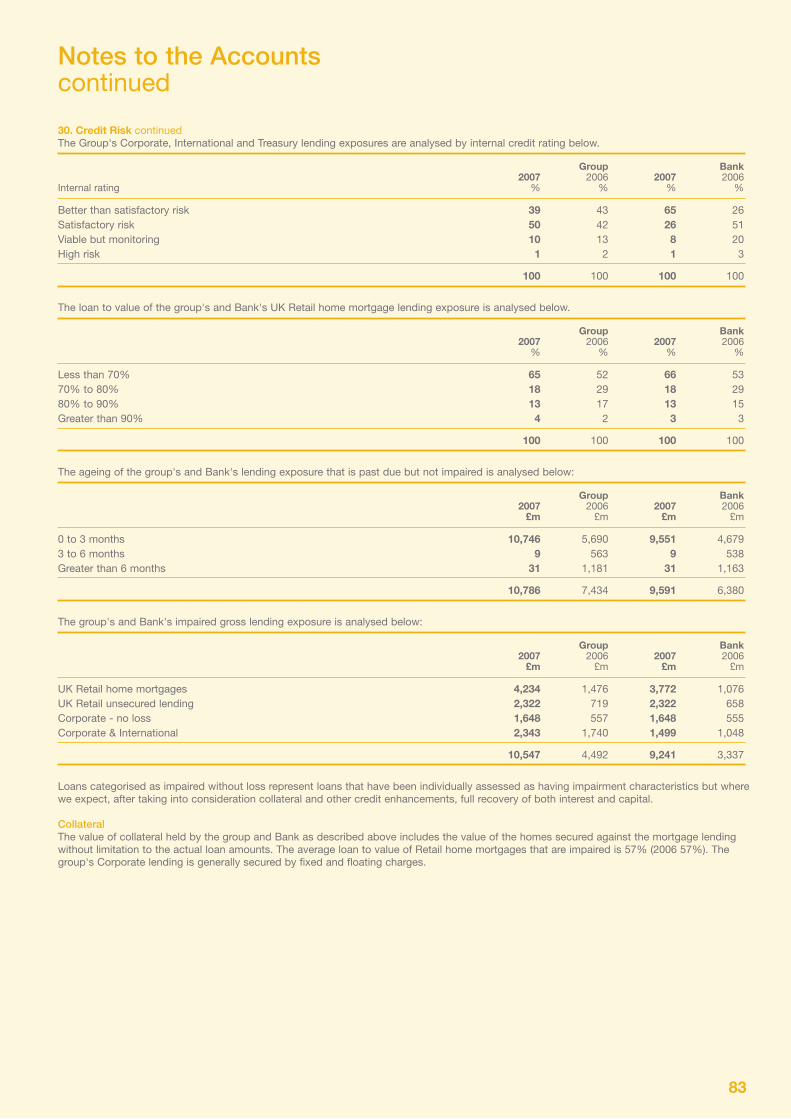
83
Notes to the Accountscontinued
30. Credit Risk continuedThe Group's Corporate, International and Treasury lending exposures are analysed by internal credit rating below.
Group Bank 2007 2006 2007 2006 Internal rating % % % %
Better than satisfactory risk 39 43 65 26 Satisfactory risk 50 42 26 51 Viable but monitoring 10 13 8 20 High risk 1 2 1 3
100 100 100 100
The loan to value of the group's and Bank's UK Retail home mortgage lending exposure is analysed below.
Group Bank 2007 2006 2007 2006 % % % %
Less than 70% 65 52 66 53 70% to 80% 18 29 18 29 80% to 90% 13 17 13 15 Greater than 90% 4 2 3 3
100 100 100 100
The ageing of the group's and Bank's lending exposure that is past due but not impaired is analysed below:
Group Bank 2007 2006 2007 2006 £m £m £m £m
0 to 3 months 10,746 5,690 9,551 4,679 3 to 6 months 9 563 9 538 Greater than 6 months 31 1,181 31 1,163
10,786 7,434 9,591 6,380
The group's and Bank's impaired gross lending exposure is analysed below:
Group Bank 2007 2006 2007 2006 £m £m £m £m
UK Retail home mortgages 4,234 1,476 3,772 1,076 UK Retail unsecured lending 2,322 719 2,322 658 Corporate - no loss 1,648 557 1,648 555 Corporate & International 2,343 1,740 1,499 1,048
10,547 4,492 9,241 3,337
Loans categorised as impaired without loss represent loans that have been individually assessed as having impairment characteristics but where we expect, after taking into consideration collateral and other credit enhancements, full recovery of both interest and capital.
CollateralThe value of collateral held by the group and Bank as described above includes the value of the homes secured against the mortgage lending without limitation to the actual loan amounts. The average loan to value of Retail home mortgages that are impaired is 57% (2006 57%). The group's Corporate lending is generally secured by fixed and floating charges.

84
Notes to the Accountscontinued
30. Credit Risk continuedDebt securitiesDebt securities are primarily held within the Treasury & Asset Management and Corporate divisions and are almost exclusively issued by investment grade counterparties with 96% (2006 93%) of debt securities rated 'A' or above based on internal credit ratings.
Contingent liabilities and commitmentsContingent liabilities and commitments are analysed in Note 28. This amount reflects the outstanding business at the year end and reflects the maximum credit exposure that could be drawn down. Some facilities will not be drawn down or may be only partially utilised.
31. Market RiskDisclosures under IFRS 7 'Financial Instruments : Disclosures' in respect of the Bank and group as well as the HBOS Group's approach to managing market risk is set out on page 12 of the "Risk Management" report. The tables below set out the group's sensitivity to market risk through exposure to the trading book and non-trading financial instruments.
The table below sets out by major currency the sensitivity (before tax) of the group's and Bank's NII over one year to an immediate 25 basis points ('bps') shift to all interest rates as at the balance sheet date. The table excludes the sensitivity to insurance contracts and investment contracts which are not material.
As at 31 December Group Bank 2007 2006 2007 2006 +25bps -25bps +25bps -25bps +25bps -25bps +25bps -25bps Impact of interest rate shift £m £m £m £m £m £m £m £m
CurrencySterling (21.2) 21.6 (11.9) 13.3 (21.2) 21.7 (8.4) 8.9 US Dollar (0.6) 0.5 (1.2) 1.2 (0.7) 0.6 (0.1) 0.1 Euro (4.3) 4.3 (4.4) 4.4 (5.2) 5.2 (3.1) 3.1 AU Dollar 0.1 (0.1) 1.0 (1.2) (2.3) 2.3 (2.3) 2.4 Other 0.1 (0.1) (0.2) 0.2 0.1 (0.1)
(25.9) 26.2 (16.7) 17.9 (29.3) 29.7 (13.9) 14.5
Base case projected NII is calculated on the basis of the group's and Bank's current balance sheet, with forward rate paths implied by current market rates, and contractual (or behaviourally adjusted) re-pricing dates. It also incorporates corporate planning assumptions about future balance sheet volumes. The sensitivities show how this projected NII would change in response to an immediate parallel shift to all relevant interest rates - market and administered.
The principal driver of the risk is re-pricing mismatch but the methodology also recognises that behavioural re-pricing assumptions, for example prepayment rates, are themselves a function of the level of interest rates.
The measure, however, is simplified in that it assumes all interest rates, for all currencies and maturities, move at the same time and by the same amount. Also, it does not recognise the impact of management actions that, in the event of an adverse movement, could reduce the impact on NII.
In addition to the net interest sensitivity, the group's and Bank's net equity is also exposed to movements in the fair value of available for sale investment securities and cash flow hedging derivatives.
Non-Trading Currency ExposureStructural currency exposures arise from the Group's investments in overseas subsidiaries, branches and other investments and are noted in the table below.
2007 2006 Net Borrowing Remaining Net Borrowing Remaining investments taken out to structural investments taken out to structural in overseas hedge net currency in overseas hedge net currency operations investments exposure operations investments exposure Functional currency of the operation £m £m £m £m £m £m
Australian Dollar 2,023 1,811 212 1,560 1,458 102 Euro 1,352 1,299 53 975 975 US Dollar 97 97 106 99 7 Other 4 4 13 13
3,476 3,207 269 2,654 2,532 122
At 31 December 2007 and 31 December 2006 there are no material net currency exposures in the non-trading book relating to transactional (or non-structural) positions that would give rise to net currency gains or losses. Additional information on the group's foreign exchange risk is set out on page 14 of the 'Risk Management' report.

85
Notes to the Accountscontinued
31.Market Risk continued The table below sets out the sensitivity before tax of the group's and Bank's available for sale and cash flow hedge reserves to an immediate 25 bps shift to all interest rates as at the balance sheet date.
As at 31 December Group Bank 2007 2006 2007 2006 +25bps -25bps +25bps -25bps +25bps -25bps +25bps -25bps Impact of interest rate shift £m £m £m £m £m £m £m £m
Available for sale (15.7) 15.7 (21.2) 21.2 (13.7) 13.7 Cash flow hedge reserve 101.5 (101.5) 76.5 (76.5) 104.2 (104.2) 5.6 (5.6)
Total 85.8 (85.8) 55.3 (55.3) 90.5 (90.5) 5.6 (5.6)
32. Liquidity RiskThe HBOS Group's approach to managing liquidity risk is set out on pages 15 to 16 of the "Risk Management" report.
The tables below set out the contractual cash flows attaching to the group's and Bank's financial liabilities. Certain long dated financial liabilities allow for the early termination at the option of the group. Where the terms of these instruments have been designed to economically compel the group to early settle the earlier settlement date has been applied. For undated instruments the earlier of 20 years or expected date of maturity has been applied. The analysis of insurance contract liabilities is based on the expected timing of discounted amounts recognised at the balance sheet date. In addition to the cash flows detailed below, the group and Bank are exposed to potential cash outflows from commitments and contingencies as set out in Note 28.
Group 2007 Up to 1 1 to 3 3 to 12 1 to 5 Over 5 month months months years years Liabilities £m £m £m £m £m
Deposits by banks 23,563 12,413 4,369 629 673 Customer accounts 194,728 19,975 26,811 21,090 25,923 Financial liabilities held for trading 9,119 5,556 6,540 242 Derivative liabilities are analysed as follows:
Gross settled derivatives - outflows 20,581 21,997 15,723 39,253 15,802 Gross settled derivatives - inflows (20,562) (22,105) (15,471) (38,558) (15,104)
Gross settled derivatives - net flows 19 (108) 252 695 698 Net settled derivative liabilities 286 516 1,355 4,144 (400)
305 408 1,607 4,839 298Investment contract liabilities 98Debt securities in issue 26,990 48,086 42,900 75,693 36,843 Other borrowed funds 49 370 1,883 7,874 26,836 Other financial liabilities 286
255,040 86,808 84,110 110,367 90,671
Group 2006 Up to 1 1 to 3 3 to 12 1 to 5 Over 5 month months months years years
Liabilities £m £m £m £m £m
Deposits by banks 39,713 35,155 87,570 1,952 396 Customer accounts 68,065 12,436 4,997 10,889 20,951 Financial liabilities held for trading 7,918 5,630 7,699 248 119 Derivative liabilities are analysed as follows:
Gross settled derivatives - outflows 16,222 33,416 24,326 41,471 34,739 Gross settled derivatives - inflows (15,892) (33,093) (23,728) (40,116) (34,653)
Gross settled derivatives - net flows 330 323 598 1,355 86 Net settled derivative liabilities 1,372 692 1,791 3,512 4,946
1,702 1,015 2,389 4,867 5,032 Insurance contract liabilities 19 Debt securities in issue 15,247 49,908 29,441 41,372 26,505 Other borrowed funds 1 95 964 3,437 9,333 Other financial liabilities 646
133,311 104,239 133,060 62,765 62,336

86
Notes to the Accountscontinued
32.Liquidity Risk continued
The tables below set out by maturity the contractual cash flows attaching to the Bank's financial liabilities.
Bank 2007 Up to 1 1 to 3 3 to 12 1 to 5 Over 5 month months months years years Liabilities £m £m £m £m £m
Deposits by banks 26,612 14,914 5,283 2,260 759 Customer accounts 185,148 16,032 30,282 83,681 68,744 Financial liabilities held for trading 8,648 5,478 6,525 242 Derivative liabilities are analysed as follows:Gross settled derivatives - outflows 19,897 22,966 13,464 18,063 7,396 Gross settled derivatives - inflows (19,923) (23,189) (13,456) (18,095) (7,513)
Gross settled derivatives - net flows (26) (223) 8 (32) (117) Net settled derivative liabilities 194 371 1,370 4,178 (17)
168 148 1,378 4,146 (134)Debt securities in issue 21,536 40,627 35,902 37,951 27,798 Other borrowed funds 28 342 1,753 7,149 23,148 Other financial liabilities 103
242,243 77,541 81,123 135,429 120,315
Bank 2006 Up to 1 1 to 3 3 to 12 1 to 5 Over 5 month months months years years
Liabilities £m £m £m £m £m
Deposits by banks 2,046 50,389 42,103 31 25 Customer accounts 61,319 6,463 887 80 Derivative liabilities are analysed as follows:Gross settled derivatives - outflows 10 35 66 Gross settled derivatives - inflows (1) (6) (27) (46)
Gross settled derivatives - net flows (1) 4 8 20 Net settled derivative liabilities 13 16 36
12 20 44 20Debt securities in issue 48 12 1,027 Other borrowed funds 88 915 3,207 7,854 Other financial liabilities 131
63,496 57,000 43,937 4,389 7,899
In the 2006 table above, inter-company term balances between the Bank and the transferor banks are deemed to settle on 17 September 2007, the date of the merger of the banks under the HBOS Group Reorganisation Act 2006.
33. Special Purpose EntitiesThe Group sponsors special purpose entities ('SPEs') that are used in its securitisation and funding programmes. The principal securitisation programmes are listed in Note 11. In addition, the Group sponsors two conduit programmes, Grampian and Landale, which invest in asset-backed securities funded by commercial paper or through banking facilities. Details of the assets secured under these conduit programmes are given in Note 13.
Two of the Landale SPEs are not consolidated by the Group. One is the central funding company for the conduit that obtains funding and lends it to the purchasing companies. The second is a purchasing company that has acquired floating rate notes issued under the Group's Mortgage securitisation programmes and which is supported by liquidity lines that are provided by third-party banks. These entities are not consolidated as there are insufficient indicators of control, in particular as the credit risk relating to the assets held by the entities and the liquidity risks are not borne by the group. If these two entities were consolidated by the group the financial impact would be minimal.

87
Notes to the Accountscontinued
34. Related Party TransactionsThe ultimate parent of the group is HBOS plc. A number of banking transactions are entered into with its subsidiaries in the normal course of business. These include loans, deposits and foreign currency transactions. The interest received and paid was £1,554m (2006 £8,789m) and £1,904m (2006 £2,176m) respectively. HBOS plc is the principal employer of the group and staff costs amounting to £2,190m (2006 £885m) were recharged to the group.
In the year ended 31 December 2007, the group provided both administration and processing services to Sainsbury's Bank plc. The amount in respect of administration and processing services payable to the group during the year is £42m (2006 £34m), of which £18m (2006 £14m) is outstanding at the year end. Sainsbury's Bank plc also has balances with the group and Bank within loans and advances to banks and deposits by banks. Balances with the group and Bank within loans and advances to banks are £726m (2006 nil). Balances with the group within deposits by banks are £3,430m (2006 £943m) and balances with the Bank within deposits by banks are £3,430m (2006 £16m).
Included within balances of the group and Bank are the following amounts relating to jointly controlled entities and associated undertakings:
Group Bank 2007 2006 2007 2006 £m £m £m £m
Loans and advances to customers 11,373 10,115 11,186 6,605Customer accounts 521 304 521 304
Included within balances of the group and Bank are the following amounts relating to fellow subsidiary undertakings:
Group Bank 2007 2006 2007 2006 £m £m £m £m
Loans and advances to banks 119,017 9,885Loans and advances to customers 30,258 35,342 29,760 150 Deposits by banks 110,368 8,737 Customer accounts 29,578 20,815 29,554 29,366
Included within balances of the Bank are the following amounts relating to its own subsidiaries:
2007 2006 £m £m
Loans and advances to banks 21,798 71,270Loans and advances to customers 60,434 3,017 Deposits by banks 10,315 107,882 Customer accounts 8,022 47,413
35. Transactions with Key Management Personnel
For the purposes of IAS 24 'Related Party Disclosures', key management personnel comprise members of the Bank of Scotland Board, the Company Secretary and, as the senior executive committee of the group, the HBOS Executive Committee.
Key management personnel and other colleagues, as well as receiving salary, incentives, shares, pensions and other benefits are entitled to enter into product transactions with HBOS plc and its subsidiaries. These transactions are generally in the form of banking, savings, mortgage, loan, insurance, assurance and investment products. Any product offerings that are received on beneficial terms compared to the terms received by customers and which give rise to taxable benefits in kind are declared to HM Revenue & Customs and taxed accordingly.

88
Notes to the Accountscontinued
35. Transactions with Key Management Personnel continued
Key management personnel and members of their close families have undertaken transactions with HBOS plc and its subsidiaries, jointly controlled entities and associated undertakings in the normal course of business, details of which are given below:
Mortgages, credit cards and term loans
Number of key management personnel £’000
At 1 January 2006 4 2,458Interest charged 2 7Amounts repaid during the year 3 144Upon resignation 5 (449)
At 31 December 2006 5 2,160Amounts advanced during the year 6 2,892Interest charged 8 271Amounts repaid during the year 11 (2,036)Upon resignation 3 (1,460)
At 31 December 2007 7 1,827
Bank, cheque or current accounts
Number Credit Debit Net of key balances balances balances management personnel £’000 £’000 £’000
At 1 January 2006 7 992 (77) 915Net movement during the year 10 6,353 (940) 5,413
At 31 December 2006 9 7,345 (1,017) 6,328Net movement during the year 15 (575) (419) (994)Upon resignation 3 (129) 1,236 1,107
At 31 December 2007 12 6,641 (200) 6,441
Savings and deposit accounts
Number of key management personnel £’000
At 1 January 2006 2 917Amounts deposited during the year 2 306Amounts withdrawn during the year 2 (752)
At 31 December 2006 2 471Upon appointment 2 1,550Amounts deposited during the year 9 5,952Interest credited 7 114Amounts withdrawn during the year 7 (2,393)Upon resignation 1 (32)
At 31 December 2007 10 5,662
89
Notes to the Accountscontinued
35. Transactions with Key Management Personnel continued
Life assurance and investment contracts
Number of key management personnel £’000
At 1 January 2006 1 1,833Other movements including investment returns 1 1,851
Total sum insured/value of investment at 31 December 2006 1 3,684Upon appointment 1 622Premiums paid/amounts invested during the year 4 1,705Other movements including investment returns 4 (1,978)
Total sum insured/value of investment at 31 December 2007 5 4,033
The following disclosures are presented in line with the Companies Act 1985 as amended by the Companies Act 2006.
The number of directors, together with their connected persons, who had transactions and balances with banking activities in the Group were as follows:
Number of 2007 Number of 2006 directors £000 directors £000
Loans 6 1,440 7 4,420 Quasi-loans and credit cards 6 14 7 27
36. Ultimate Parent UndertakingHBOS plc is the ultimate parent undertaking of Bank of Scotland plc. Copies of the Annual Report and Accounts of HBOS plc may be obtained from its head office at The Mound, Edinburgh, EH1 1YZ.

90

91