bank of mauritius - bom.mu · the bank of mauritius publishes the inflation report twice a year as...
TRANSCRIPT
Inflation Report
OCTOBER 2014
BANK OF MAURITIUS
i
INFLATION REPORT | OCTOBER 2013 SECTION
B A N K O F M AU R I T I U S
INFLATION REPORT
October 2014
The Inflation Report was prepared by a team from the Economic Analysis and Publications Division (EAPD), the Economic Research Division (ERD), the Statistics Division (STAT), the Middle Office and Risk Division (MO&R), and the Financial Markets Operations Division (FMOD).
The team comprised Dr P. Ashok Kumar Aubeeluck, Mr K. Ramnauth, Ms N. Mihdidin and Mr F. Sooklall from EAPD; Mr J. Bissessur, Mr N. Kowlessur and Ms M. Bhurtha from ERD; Mr V. Punchoo, Ms P. Lo Tiap Kwong, Mr C. Ellapah, Mr S. Jugoo and Ms F. Atchia from STAT; Ms M. Heerah-Pampusa and Mr S. Sharma from the MO&R and Mr J. Pandoo, S. Ramnarainsing and Mr N. Daworaz from FMOD. The Report was prepared under the direction of Dr Gonzalo Pastor, Director of Economic Research. The Report includes comments from Dr J. L. Roberts, Consulting Editor.
The Publications Review Committee of the Bank of Mauritius cleared the Report for publication.
All rights reserved. Reproduction for educational and non-commercial purposes is permitted provided that the source is acknowledged. The Bank of Mauritius would appreciate receiving a copy of any publication that uses this Report as a source. No use may be made of this Report for resale or for any other commercial purpose whatsoever without prior permission in writing from the Bank of Mauritius.
The Bank of Mauritius publishes this Report for general information only, and not to serve as financial or other advice. Whilst we take every precaution to ensure the information in the Report is accurate, the Bank of Mauritius shall not be liable to any person where the information in the Report is not correct or complete, nor for any assessments or opinions contained in this Report.
The Report is available in PDF format on the Bank’s website at https://www.bom.mu under the menu item Research and Publications. The Bank of Mauritius welcomes any comments or suggestions on this publication, which may be sent to [email protected].
Inflation Report October 2014
© Bank of Mauritius 2014
ISSN 1694-2531
TABLE OF CONTENTSINFLATION REPORT | OCTOBER 2014
CONTENTS
Preface i
1 Summary 1
2 International Economy 5
3 Domestic Economy 11
4 Public Finance 17
5 Balance of Payments 23
6 Monetary Policy 31
7 Inflation: Recent Developments and Outlook under the Baseline Scenario 41
8 Inflation Outlook: Balance of Risks against the Baseline Scenario 45
9 Concluding Remarks 47
List of Tables, Charts and Boxes 48
List of Acronyms 50
Glossary 52

PREFACE
The Bank of Mauritius publishes the Inflation Report twice a year as required by Section 33(2) of the Bank of Mauritius Act 2004. The Bank normally releases the Report in April and October. The Report includes the macroeconomic projections underpinning monetary policy decisions by the Monetary Policy Committee (MPC) as well as the risk factors that could make these projections deviate from the baseline macroeconomic scenario.
To maintain price stability, as mandated by section 4 of the Bank of Mauritius Act 2004, the MPC undertakes monetary policy decisions taking into account the orderly and balanced economic development of Mauritius.
The Monetary Policy Committee meets (in principle) every three months to decide on the level of the Key Repo Rate and the Bank of Mauritius regulates the supply of reserve money, through its Open Market Operations such that short term money market rates move, in principle, close to the Key Repo Rate.1
The MPC decides on the level of the Key Repo Rate based on an analysis of inflation projections and their determinants from within and outside the domestic economy. This takes into account inflationary factors beyond the control of the local authorities, such as global growth and volatility of international commodity prices that could lead to temporary deviations from the desired inflation path. At the same time, the Key Repo Rate affects the inflation rate through a number of channels and with different time lags.
The Bank of Mauritius also implements a number of policies to safeguard financial stability and ensure a robust transmission mechanism for monetary policy. Foreign exchange intervention seeks to reduce excessive exchange rate volatility and to build up official international reserves to address potential negative shocks affecting the economy. In addition, the Bank uses other instruments, such as the Cash Reserve Ratio Requirement, to affect the level of liquidity in the economy and foster a smooth provision of bank credit to the private sector.
INFLATION REPORT | OCTOBER 2014 PREFACE
1 Bank of Mauritius, Communique, A New Framework for the Conduct of Monetary Policy by the Bank of Mauritius, dated 13 December 2006.
i


1
INFLATION REPORT | OCTOBER 2014 SUMMARY
Monetary Policy
Since the April 2014 Inflation Report, the KRR has remained unchanged at 4.65 per cent due to the balance of external and internal risks affecting the outlook for growth and inflation. The international environment remains volatile, but favourable in terms of trends in international prices for food and energy, which have been declining in the recent past. The output gap has remained negative, with output growth below potential, while weak growth of final consumption and investment has been exerting limited demand-side inflationary pressures. Supply side factors affecting the inflation outlook also remain limited at this stage.
The Bank of Mauritius has continued to address the problem of excess liquidity using its monetary policy instruments and it has pursued strong policy coordination with the Ministry of Finance and Economic Development (MOFED). First, the Bank has continued open market operations using BoM securities so that the stock of BoM securities has increased significantly, from Rs16.7 billion to Rs24.0 billion, during the first half of 2014 as the monetary authorities sought to sterilise the impact of sizeable foreign exchange intervention during the period. Second, the BoM increased the cash reserve ratio on rupee deposits from 8.0 per cent to 9.0 per cent in May 2014. Third, policy coordination between the Bank of Mauritius and the MOFED is on-going to address the excess liquidity problem. Notably, the government has frontloaded the issue of its medium and long-term securities scheduled for this year to support the mopping up strategy. There is also agreement that co-operation in setting an explicit inflation target would effectively anchor inflation expectations, while acknowledging that other economic considerations, such as the orderly and balanced economic development, should be taken into account in monetary policy-making.
Short-term interest rates remain affected by the excess liquidity prevailing in the banking system, despite efforts by the fiscal and monetary authorities to address the problem. Indeed, the gap between the KRR and key short-term interest rates (i.e., the yields on Treasury Bills and the interbank rate) has widened since the beginning of the year,
notwithstanding the sizeable issue of Bank of Mauritius securities and frontloading of government papers. The decline in short-term interest rates has coincided with a period of substantial BoM intervention in the domestic foreign exchange market that led to an increase in official reserves from about US$3,491 million by the end of December 2013 to US$4,052 million by the end of August 2014. Private sector credit growth has also remained subdued during the period.
International Economy
Global growth remains weak and uneven. This is evidenced by the renewed threats of recession and very low inflation in the Eurozone, persistent economic and financial weaknesses in some large emerging economies that may have reduced their potential output growth, and dampening confidence associated with geopolitical tensions in Russia and Ukraine. However, there are bright spots, with India sustaining rapid growth in exports and investment, and with continued growth in the US, Canada, Sweden, Norway, and the UK remaining rather solid. According to the October 2014 World Economic Outlook Update, global growth is expected to accelerate from 3.3 per cent in 2014 to 3.8 per cent in 2015.
Domestic Economy
During the first half of 2014, the domestic economy expanded at rates that were marginally higher than those achieved in the first half of 2013 with rapid growth of the services sector. The average real GDP growth rate for the first half of 2014 was 3.7 per cent, up from 3.6 per cent in the first half of 2013. Growth reflected brisk activity in the services sector, especially in public administration, accommodation and food service, financial and insurance, and other services. The secondary sector registered positive growth, although the key construction sector contracted in the first and second quarter of 2014. By contrast, manufacturing has shown an important recovery in recent months, echoing increased exports to the US, Asian, French and United Arab Emirates
1. SUMMARY
2
SUMMARY INFLATION REPORT | OCTOBER 2014
markets. Taxes on products (net of subsidies) have also shown average growth rates in the first half of 2014 that were higher than those registered in 2013.
In its update of national accounts in September 2014 Statistics Mauritius maintained its June forecast of annual GDP growth (at basic prices) of 3.5 per cent in 2014, although the sectors’ contribution to growth changed between the two forecasts. In short, higher growth in public administration value added is projected to compensate for lower than earlier expected value added growth in construction, agriculture, arts and entertainment.
The Financial Developments
Since the last Inflation Report in April 2014, broad money grew by 7.7 per cent and 7.9 per cent y-o-y by the end of June and August, respectively, due to a rapid increase in transferable and savings deposits, while the growth of time deposits lagged behind. As such, velocity of circulation of broad money has remained broadly constant at around 1.0 for the last two/three years. In general, to date, the counterpart of a sluggish growth in the liquid assets of the banking sector has been a decline in the net foreign asset position of Other Depository Corporations (ODCs) and weak growth in total ODC credit to the private sector that together more than offset a sizeable accumulation of gross official reserves.
The SEMDEX reached an all-time high of 2,154.4 points during the third quarter of 2014. The stock market performance this year has been relatively broad-based. This is unlike recent post crisis years, when rallies were bank-stock driven, reflecting the fact that bank stocks are by far the most liquid and tend to be overweighted during more uncertain times in Mauritius. Local institutional investors continued to push the market higher while foreign investors remained net sellers to the tune of Rs451.2 million between August 2013 and August 2014.
The Exchange Rate
During the second half of 2013 through to the first quarter of 2014, the trade-weighted nominal exchange rate of the Rupee (NEER) appreciated largely on account of the depreciation of the Indian rupee and South African rand against the Mauritian rupee. In
recent months, the NEER has depreciated along the appreciation of the US dollar against the euro. The currency-weighted nominal exchange rate (MERI1 or MERI2) has also depreciated marginally in recent months. In real effective terms (REER), the rupee remains appreciated compared to levels of late 2012.
Fiscal Policy
Prudent macroeconomic management continues to underpin fiscal performance in 2014, with the overall fiscal deficit (as a share of GDP) showing a decline between the first and second quarters of 2014, that is broadly on target with the 2014 Budget estimates. Since the issue of the last Inflation Report in April 2014, the overall central government deficit has dropped from an estimated 3.9 per cent of GDP in the first quarter of 2014 to 3.5 per cent of GDP in the second quarter. The primary balance (i.e., the overall fiscal deficit less the interest payments on the national debt) has also declined through the period. Trends in the overall fiscal deficit and primary balance are broadly on target, with the attainment of an overall fiscal deficit of 3.2 per cent of GDP and a primary deficit of 0.4 per cent of GDP expected by the end of 2014.
The Savings-Investment Balance
The Inflation Report assumes that domestic investment (as a share of GDP) will be largely financed by domestic savings, although the contribution of external savings will be lower than in earlier projections. The current account balance is likely to be lower than in 2013 due to a lower trade deficit. The contribution of public sector savings to the financing of domestic investment will remain negative, as in 2013. Consistent with recent trends, the level of domestic investment in 2014 has been revised downwards, from 23.2 per cent of GDP projected earlier in the year to 22.3 per cent of GDP now. A decline in private investment and inventories’ accumulation explains the third-consecutive year drop in overall domestic investment.
Inflation & Expectations
Since March 2014, headline inflation has been virtually flat at about 4.0 per cent. While the measurement of inflation based on the 12-month average (i.e., headline inflation) suffers from statistical caveats, y-o-y inflation reflects more the
3
INFLATION REPORT | OCTOBER 2014 SUMMARY
dynamics of price movements. Thus, y-o-y inflation fell systematically from 5.6 per cent in February 2014 to 3.1 per cent in July 2014. It rebounded to 3.8 per cent in August 2014 on account of higher prices of vegetables and motor vehicles before dropping substantially to 2.9 per cent in September 2014. This decline is mainly attributed to subsiding food and transport prices.
Results of the August 2014 Inflation Expectations Survey pointed to lower inflation expectations for the different time horizons, compared with the previous survey. In the survey month of May 2014, the mean headline inflation rates expected by respondents were 4.1 per cent, 4.3 per cent and 4.5 per cent, respectively, for the twelve months ending December 2014, June 2015 and a year ahead, compared with 4.4 per cent, 4.6 per cent and 4.7 per cent respectively, for December 2014, a year ahead and June 2015.
The Bank’s Inflation Forecast
Based on the Bank’s short-term forecasting model, and under the baseline scenario, CPI inflation will decline marginally during 2014Q4 and 2015Q1, with respect to the annual inflation rate registered in 2014Q3, but will increase in the remaining quarters of 2015 due to seasonal and other exogenous factors. Y-o-y inflation in 2014Q4 and 2015Q1 is projected to average about 2.9 per cent (compared with 3.3 per cent in 2014Q3), reflecting the observed dynamics to date in food and non-food inflation, resulting from sluggish growth of domestic absorption (i.e., final consumption and investment), weak global growth (that lowers imported inflation), and an improvement in Mauritius’ terms of trade along the stability of international prices for food and energy. Starting 2015Q2, however, seasonal and other exogenous factors would lead to a temporary acceleration of inflation through the end of 2015 (to an average of 4.8 per cent). During 2016, CPI inflation should gradually converge to 4 per cent.
The domestic output gap, which is also estimated using the Bank’s forecasting model, is projected to remain negative throughout 2014-2017, albeit diminishing starting the second half of 2016. Over the medium-term, the output gap closes on account of low inflation expectations that support investment and economic activity. The model forecasts growth in the range of 3.4-3.6 per cent for 2014, with the upper bound of the growth projection reflecting the hike in the quarterly growth rate from 2.7 per cent in 2014Q1 to a high of 4.6 per cent in 2014Q2.
The Balance of Risks
Overall, the Bank of Mauritius staff assessment is that, for the first quarter of 2015, based on alternative model computations, the balance of risks to the inflation outlook is on the downside (i.e., there are no inflationary pressures arising). Specifically, in this Inflation Report, the balance of risks is negative: the probability that inflation will be higher than in the baseline (due to shocks in unit labour costs and enhanced exchange rate volatility) is less than the probability that inflation will be lower than in the baseline (due to a higher negative output gap in the Eurozone and lower domestic private investment in Mauritius).
4
SUMMARY INFLATION REPORT | OCTOBER 2014
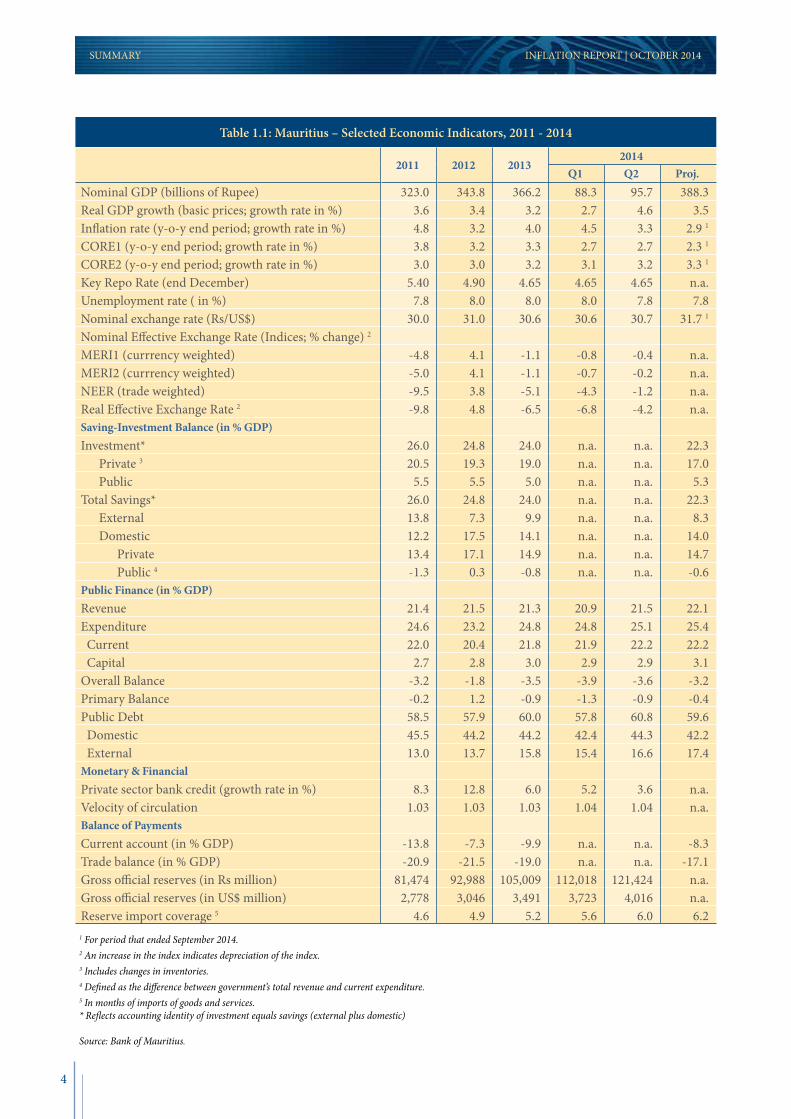
Table 1.1: Mauritius – Selected Economic Indicators, 2011 - 2014
2011 2012 20132014
Q1 Q2 Proj.Nominal GDP (billions of Rupee) 323.0 343.8 366.2 88.3 95.7 388.3Real GDP growth (basic prices; growth rate in %) 3.6 3.4 3.2 2.7 4.6 3.5Inflation rate (y-o-y end period; growth rate in %) 4.8 3.2 4.0 4.5 3.3 2.9 1
CORE1 (y-o-y end period; growth rate in %) 3.8 3.2 3.3 2.7 2.7 2.3 1
CORE2 (y-o-y end period; growth rate in %) 3.0 3.0 3.2 3.1 3.2 3.3 1
Key Repo Rate (end December) 5.40 4.90 4.65 4.65 4.65 n.a.Unemployment rate ( in %) 7.8 8.0 8.0 8.0 7.8 7.8Nominal exchange rate (Rs/US$) 30.0 31.0 30.6 30.6 30.7 31.7 1
Nominal Effective Exchange Rate (Indices; % change) 2
MERI1 (currrency weighted) -4.8 4.1 -1.1 -0.8 -0.4 n.a.MERI2 (currrency weighted) -5.0 4.1 -1.1 -0.7 -0.2 n.a.NEER (trade weighted) -9.5 3.8 -5.1 -4.3 -1.2 n.a.Real Effective Exchange Rate 2 -9.8 4.8 -6.5 -6.8 -4.2 n.a.Saving-Investment Balance (in % GDP)Investment* 26.0 24.8 24.0 n.a. n.a. 22.3 Private 3 20.5 19.3 19.0 n.a. n.a. 17.0 Public 5.5 5.5 5.0 n.a. n.a. 5.3Total Savings* 26.0 24.8 24.0 n.a. n.a. 22.3 External 13.8 7.3 9.9 n.a. n.a. 8.3 Domestic 12.2 17.5 14.1 n.a. n.a. 14.0 Private 13.4 17.1 14.9 n.a. n.a. 14.7 Public 4 -1.3 0.3 -0.8 n.a. n.a. -0.6Public Finance (in % GDP)Revenue 21.4 21.5 21.3 20.9 21.5 22.1Expenditure 24.6 23.2 24.8 24.8 25.1 25.4 Current 22.0 20.4 21.8 21.9 22.2 22.2 Capital 2.7 2.8 3.0 2.9 2.9 3.1Overall Balance -3.2 -1.8 -3.5 -3.9 -3.6 -3.2Primary Balance -0.2 1.2 -0.9 -1.3 -0.9 -0.4Public Debt 58.5 57.9 60.0 57.8 60.8 59.6 Domestic 45.5 44.2 44.2 42.4 44.3 42.2 External 13.0 13.7 15.8 15.4 16.6 17.4Monetary & FinancialPrivate sector bank credit (growth rate in %) 8.3 12.8 6.0 5.2 3.6 n.a.Velocity of circulation 1.03 1.03 1.03 1.04 1.04 n.a.Balance of PaymentsCurrent account (in % GDP) -13.8 -7.3 -9.9 n.a. n.a. -8.3Trade balance (in % GDP) -20.9 -21.5 -19.0 n.a. n.a. -17.1Gross official reserves (in Rs million) 81,474 92,988 105,009 112,018 121,424 n.a. Gross official reserves (in US$ million) 2,778 3,046 3,491 3,723 4,016 n.a. Reserve import coverage 5 4.6 4.9 5.2 5.6 6.0 6.2
1 For period that ended September 2014.2 An increase in the index indicates depreciation of the index.3 Includes changes in inventories.4 Defined as the difference between government’s total revenue and current expenditure.5 In months of imports of goods and services.* Reflects accounting identity of investment equals savings (external plus domestic)
Source: Bank of Mauritius.
5
INFLATION REPORT | OCTOBER 2014 INTERNATIONAL ECONOMY
2.1 Global Economic Activity
Global growth remains weak and uneven. This is evidenced by the renewed threats of recession and low inflation in the Eurozone, continuing economic and financial weaknesses in some large emerging economies that may have reduced their potential output growth, and dampening confidence associated with geopolitical tensions in Russia and Ukraine. However, there are bright spots, with India’s growth sustaining along rapid growth in exports and investment, and growth in Canada, Sweden, Norway, and the UK remaining rather solid.2
Global growth is expected to accelerate from 3.3 per cent in 2014 to 3.8 per cent in 2015, mainly due to strong growth of the US economy. Overall, in advanced economies, growth is forecast to quicken from 1.8 per cent in 2014 to 2.3 per cent in 2015. The US economy is projected to maintain 3.0 per cent growth in the second half of 2014 and into 2015. Growth in emerging market economies is projected to slow to 4.4 per cent in 2014 (from 4.7 per cent in 2013) before accelerating to 5.0 per cent in 2015. The October 2014 World Economic Outlook (WEO) warns that threats to the world’s moderate upswing have risen as heightened geopolitical tensions continue to endanger growth, the Eurozone’s period of weak growth and very low inflation persists, and very low interest rates across the world that could possibly lead to excessive exuberance in financial markets. Moreover, emerging market economies, particularly those with domestic weaknesses and external vulnerabilities, may face a sudden worsening of financial conditions and a reversal in capital inflows in the event of a shift in financial market sentiments.
Advanced economiesEconomic activity data from the advanced economies continue to show considerable divergence in countries’ performance. Growth appears to be accelerating in the US, while recent economic indicators from the Eurozone and Japan have disappointed yet again, suggesting their central banks are likely to step in with additional monetary stimulus. As for the UK, broad-based consumer and business spending is enabling the economy to compete for leadership in growth among the industrialised nations.
In the US, recent economic data provide additional evidence that the pace of growth has picked up and remains solid. On a seasonally-adjusted basis, the US economy grew by 4.6 per cent in the second quarter of 2014, after a contraction of 2.1 per cent in the previous quarter, reflecting strong domestic demand and a swing in inventories. Labour market conditions remained favourable, with the unemployment rate falling to 5.9 per cent in September 2014. Notwithstanding rising house prices, activity in the housing sector remained sluggish. The Purchasing Managers Indices (PMIs) for manufacturing remained at a comfortable level in August. Forward-looking business sentiment and consumer confidence indicators are also higher compared to the second quarter of 2014, thus pointing to continued robust real-side activity in the third quarter of 2014. According to analysts, the US economy is likely to record a solid gain in the first half of 2014 with both households and businesses expected to increase spending. Business non-residential investment is expected to accelerate, albeit gradually, with a greater acceleration for 2015.
The United Kingdom has also displayed good performance, with GDP expanding by around 0.8 per cent in the first two quarters of 2014. Both consumption and investment contributed to the strengthening of economic activity. The economic recovery has led to a steady decline in the unemployment rate, which was 6.0 per cent in August 2014. Leading indicators point to a continued strong momentum. The PMI for manufacturing remained at a high level of 52.5 in August. Considering the trend from the beginning of the year, GDP growth is expected to remain high while weakening exports and housing market could pose some downside risks to the growth outlook.
Unlike the US or the UK, the Eurozone continues to struggle for a broad-based recovery. The economy stagnated in the second quarter of 2014, dragged lower by the contraction in Europe’s three largest economies despite reasonable gains in other countries in the north and south. Overall demand conditions remained weak amid high unemployment, tight credit conditions and on-going balance sheet adjustments by both the public and private sectors. The unemployment rate in August 2014 remained
2. INTERNATIONAL ECONOMY
2 IMF Survey Magazine – World Economic Outlook October 2014.
6
at a high level of 11.5 per cent, while the recent PMI numbers showed output growth slowing in both the manufacturing and service sectors. Nevertheless, higher external demand continued to benefit export performance, while domestic demand was supported by more accommodative monetary conditions and a slower pace of fiscal consolidation. The challenges the Eurozone faces include slipping into deflation from the current low inflation numbers, a persistent recession in Italy and a decline in manufacturing orders from the traditionally strong German economy.
Emerging marketsAmong the emerging markets, economic growth remains relatively healthy in selected Asian countries, such as China and India, while South Africa and several Latin American countries led by Brazil are experiencing slow or negative growth.
China’s national accounts data indicate that the economy has stabilised following the slowdown earlier this year. GDP growth in the second quarter of 2014 bounced back to 2.0 per cent quarter-over-quarter after 1.5 per cent in the first quarter of 2014, mainly on account of a recovery in exports and the mini-stimulus on infrastructure spending. Growth
in industrial production and fixed assets investment accelerated, retail sales growth remained strong, and business confidence rose further in July. Growth momentum is expected to be moderate in the near-term amid a slowdown in residential investment, but the economic policies point to low risk of a sharp deterioration in the outlook.
In India, confidence and spending have improved during the first half of 2014, as a result of measures taken to control inflation and the perception that the new government will increase growth-oriented reforms. Growth is expected to pick up in both 2014 and 2015.
South Africa avoided falling into a recession after GDP figures showed the economy grew by 0.6 per cent in the second quarter of 2014. However, with declining growth in both consumption expenditure and investment, and low confidence, the outlook for growth has deteriorated further. Growth in Brazil contracted by 0.9 per cent y-o-y in the second quarter of 2014, due to sluggish investment and a fall in industrial production. Investment decreased by 11.2 per cent y-o-y in the second quarter of 2014 and activity in the manufacturing sector actually contracted by 5.5 per cent over the same period.
INTERNATIONAL ECONOMY INFLATION REPORT | OCTOBER 2014
Table 2.1: Real Growth Rates in Selected Economies
Per cent
April 2014 WEO
Projections
October 2014 WEO Projections
Difference from April 2014 WEO
Projections
2011 2012 2013 2014 2015 2014 2015 2014 2015World Output 4.1 3.4 3.3 3.6 3.9 3.3 3.8 -0.3 -0.1 Advanced Economies 1.7 1.2 1.4 2.2 2.3 1.8 2.3 -0.4 0.0 of which United States 1.6 2.3 2.2 2.8 3.0 2.2 3.1 -0.6 0.1 Euro Area 1.6 -0.7 -0.4 1.2 1.5 0.8 1.3 -0.4 -0.2 Germany 3.4 0.9 0.5 1.7 1.6 1.4 1.5 -0.3 -0.1 France 2.1 0.3 0.3 1.0 1.5 0.4 1.0 -0.6 -0.5 Italy 0.4 -2.4 -1.9 0.6 1.1 -0.2 0.8 -0.8 -0.3 Spain 0.1 -1.6 -1.2 0.9 1.0 1.3 1.7 0.4 0.7 United Kingdom 1.1 0.3 1.7 2.9 2.5 3.2 2.7 0.3 0.2 Japan -0.5 1.5 1.5 1.4 1.0 0.9 0.8 -0.5 -0.2
Emerging Market and Developing Economies 6.2 5.1 4.7 4.9 5.3 4.4 5.0 -0.5 -0.3 Sub Saharan Africa 5.1 4.4 5.1 5.4 5.5 5.1 5.8 -0.3 0.3 South Africa 3.6 2.5 1.9 2.3 2.7 1.4 2.3 -0.9 -0.4 Emerging and Developing Asia 7.7 6.7 6.6 6.7 6.8 6.5 6.6 -0.2 -0.2 of which China 9.3 7.7 7.7 7.5 7.3 7.4 7.1 -0.1 -0.2 India 6.6 4.7 5.0 5.4 6.4 5.6 6.4 0.2 0.0
Source: IMF

7
INFLATION REPORT | OCTOBER 2014 INTERNATIONAL ECONOMY
2.2 Global Inflation Developments
The subdued world output growth and sluggish demand have so far kept global inflation at moderate levels, with the potential risk of deflation in the Eurozone. Inflationary pressures are expected to remain contained in an environment of negative output gaps in advanced economies and relatively well-anchored inflation expectations. The October 2014 WEO projected consumer price inflation in the advanced economies to rise from 1.4 per cent in 2013 to 1.6 per cent and 1.8 per cent in 2014 and 2015, respectively. In emerging market and developing economies, it is projected to fall from 5.9 per cent in 2013 to 5.5 per cent in 2014 before rising marginally to 5.6 per cent in 2015.
Advanced economiesAmongst major advanced economies, US inflation stabilised further in August 2014, reflecting the unwinding of some temporary factors which had accounted for the pick-up in CPI inflation earlier this year. Inflation in the Eurozone is very low and steadily declining in recent months. In the UK, annual CPI inflation in August remained below the Bank of England’s target for the eighth month in a row.
Emerging marketsInflation developments in emerging market economies have been mixed, with CPI inflation since the beginning of the year showing an upward trend in Brazil, but stabilising in China and India, albeit at different levels.
2.3 Monetary Policy Stances
Central banks are facing different challenges given the unevenness of the economic recovery across economies and inflation movements with respect to target levels. In the US and the UK, where the recovery is stronger, the challenge is to manage their exit from the accommodative monetary policies. However, the loose monetary policy stance is expected to continue in the Eurozone and Japan to boost economic activity and fight the threat of deflation.
Advanced economiesAlthough the overall monetary policy remained highly accommodative in advanced economies, the direction diverged in the second quarter of 2014. In the US, the Federal Reserve (Fed) kept interest rates unchanged but altered its asset purchases in response
Table 2.2: Consumer Price Inflation in Selected Economies
Per cent
April 2014 WEO
Projections
October 2014 WEO Projections
Difference from April 2014 WEO
Projections
2011 2012 2013 2014 2015 2014 2015 2014 2015 Advanced Economies 2.7 2.0 1.4 1.5 1.6 1.6 1.8 0.1 0.2 of which United States 3.1 2.1 1.5 1.4 1.6 2.0 2.1 0.6 0.5 Euro Area 2.7 2.5 1.3 0.9 1.2 0.5 0.9 -0.4 -0.3 Germany 2.5 2.1 1.6 1.4 1.4 0.9 1.2 -0.5 -0.2 France 2.3 2.2 1.0 1.0 1.2 0.7 0.9 -0.3 -0.3 Italy 2.9 3.3 1.3 0.7 1.0 0.1 0.5 -0.6 -0.5 Spain 3.1 2.4 1.5 0.3 0.8 0.0 0.6 -0.3 -0.2 United Kingdom 4.5 2.8 2.6 1.9 1.9 1.6 1.8 -0.3 -0.1 Japan -0.3 0.0 0.4 2.8 1.7 2.7 2.0 -0.1 0.3
Emerging Market and Developing Economies 7.3 6.1 5.9 5.5 5.2 5.5 5.6 0.0 0.4 Sub Saharan Africa 9.5 9.3 6.6 6.1 5.9 6.7 7.0 0.6 1.1 South Africa 5.0 5.7 5.8 6.0 5.6 6.3 5.8 0.3 0.2 Emerging and Developing Asia 6.5 4.7 4.7 4.5 4.3 4.1 4.2 -0.4 -0.1 of which China 5.4 2.6 2.6 3.0 3.0 2.3 2.5 -0.7 -0.5 India 9.6 10.2 9.5 8.0 7.5 7.8 7.5 -0.2 0.0
Source: IMF
8
to an improvement in labour market conditions and contained inflation. The Fed cut its bond purchase program to US$25.0 billion in July 2014. In August 2014, it purchased US$10 billion of agency mortgage-backed securities and US$15 billion of longer-term Treasuries. At its September meeting, the Fed also said that it was likely to maintain the current target range for the federal funds rate for a considerable time after ending the asset purchase programme, especially if projected inflation continues to run below the Committee’s 2 per cent longer-run goal, and provided that longer-term inflation expectations remain well anchored. The Fed has announced that beginning in October 2014, it would add to its holdings of agency mortgage-backed securities at a pace of $5 billion per month and add to its holdings of longer-term Treasury securities at a pace of $10 billion per month, rather than $15 billion per month.
The European Central Bank (ECB) implemented further monetary easing to boost the economy, support credit conditions and reduce the risk of deflation. In addition to lowering the repo and deposit rates to all-time lows of 0.05 per cent and -0.2 per cent, respectively, ECB President Mario Draghi announced at the ECB’s meeting in September 2014 that the ECB would engage in a form of monetary easing that includes purchasing asset-backed securities and covered bonds. Looking forward, it is expected that monetary policy would remain accommodative for an extended period of time to stimulate economic activity and reduce the risk of deflation and raise the expectation of inflation towards the target level. In the UK, the Bank of England (BoE) kept the bank rate at 0.5 per cent and maintained the size of the Asset Purchase Program at £375 billion. Nevertheless, the central bank signalled the potential for a review of its monetary policy instruments, should economic activity continue to gain momentum.
Emerging marketsIn emerging and developing economies, policy settings were mixed with some countries changing their policy stance, while others kept it unchanged. In China, monetary policy is consistent with achieving an orderly slowdown in growth. By contrast, higher inflation in countries like India and Brazil means that monetary policy will need to remain restrictive.
Highlights for China, India and South Africa are as follows:
The People’s Bank of China (PBoC) appeared to have eased monetary policy recently. It cut the required reserve ratios for targeted financial institutions, and there has been a stable growth in reserve money in recent months.
In India, the central bank raised interest rate by
25 basis points to 8.0 per cent in January, while the Brazilian central bank increased the policy rate by the same amount in April. Both central banks kept their policy rates unchanged afterwards to support economic activities in their economies.
The South African Reserve Bank (SARB) increased its interest rate by 25 basis points to 5.75 per cent in July to curb the risks of rising inflation at over 6 per cent arising from strong wage increases and a weaker currency. It has continued to keep its repurchase rate unchanged in view of the slightly improved outlook for inflation and expectations of inflation, and the risk of declining economic growth.
2.4 Global Equity Markets
Global share prices have continued to increase in recent months, albeit remaining volatile to news. The gains have occurred mainly due to the widespread view that the US economy improved further and the official interest rates in major economies would remain exceptionally low for a long time. In advanced economies, higher share prices were underpinned by modest gains in the US and strong increases in Japan. In contrast, European share prices fell quite sharply recently due to the economy’s greater exposure to Russia and renewed concerns about the economy. Emerging economies’ equity indices have risen significantly after a decrease at the start of 2014. Share prices in India, Indonesia, Thailand and Turkey have all risen, reflecting a return of foreign capital to emerging equity markets since mid-February 2014, particularly in India and Indonesia. Share prices in China have also increased, driven by better-than-expected Chinese data and increased confidence in its economy.
2.5 Exchange Rates
Currency markets were mainly influenced by the difference between the major central banks’ policy outlook and rising geopolitical tensions. The US dollar rallied over the period on better-than-expected
INTERNATIONAL ECONOMY INFLATION REPORT | OCTOBER 2014

9
INFLATION REPORT | OCTOBER 2014 RECENT DEVELOPMENTS IN INFLATION
US economic data releases and the Fed’s conviction to continue with the reduction in bond purchases. Rising US Treasury yields and widening interest rate differentials attracting more and more capital inflows also supported the US dollar. Moreover, risk aversion on escalating geopolitical tensions in Ukraine added support to the safe haven appeal of the US currency. The Japanese yen came under pressure as Japan’s economy shrank in the second quarter of 2014, paving the way for further expansionary policies in coming months.
The euro tumbled against other major currencies on the back of weaker-than-expected economic data releases and the threat of dangerously low inflation. The predicament of the ECB with continued pressure on the viability of the single currency, led the ECB to cut its policy rates to near zero and embark on a new stimulus plan. The euro continued its declining trend on increasing tensions in Ukraine and the potential impact on the fragile euro zone economic growth.
The Pound sterling gained momentum on the back of robust UK data releases and jumped to a high of around US$1.72 in July 2014 on growing expectations that the BoE would tighten monetary policy sooner than later.
Major emerging market currencies came under renewed pressure, rekindling memories of heavy selloffs driven by shifts in US interest rate policy. For example, the Turkish lira and South African rand declined against the US dollar. Growing expectations that the Fed could raise rates in the first half of 2015 are driving the decline in emerging market currencies.
Table 2.3: Monetary Policy Stance
Change since (basis points) Forecast (Per cent)
Current rate (Per cent p.a) 2005-07 avg July 2011 December 2014
Developed economies 0.26 -323 -58 0.27 of which United States 0.125 -438 0.0 0.125 Euro Area 0.05 -293 -145 0.05 United Kingdom 0.50 -444 0.0 0.50 Japan 0.05 -17 0.0 0.05
Emerging Market and Developing Economies South Africa 5.75 -254 75 6.00 Emerging and Developing Asia of which China 6.00 -14 -56 6.00 India 8.00 113 0.0 8.00
Source: JPMorgan
Chart 2.1: Stock Market Indices
450
500
550
600
650
700
750
800
850
900
950
700
800
900
1,000
1,100
1,200
1,300
1,400
1,500
1,600
1,700
1,800
Jan-
12
Feb-
12
Mar
-12
Apr
-12
May
-12
Jun-
12
Jul-1
2 A
ug-1
2 Se
p-12
O
ct-1
2 N
ov-1
2 D
ec-1
2 Ja
n-13
Fe
b-13
M
ar-1
3 A
pr-1
3 M
ay-1
3 Ju
n-13
Ju
l-13
Aug
-13
Sep-
13
Oct
-13
Nov
-13
Dec
-13
Jan-
14
Feb-
14
Mar
-14
Apr
-14
May
-14
Jun-
14
Jul-1
4 A
ug-1
4
MSCI World Index MSCI Emerging Market Index MSCI Frontier (RHS)
Source: Reuters


11
INFLATION REPORT | OCTOBER 2014 DOMESTIC ECONOMIC ACTIVITY AND DEMAND
3.1 GDP by Sector
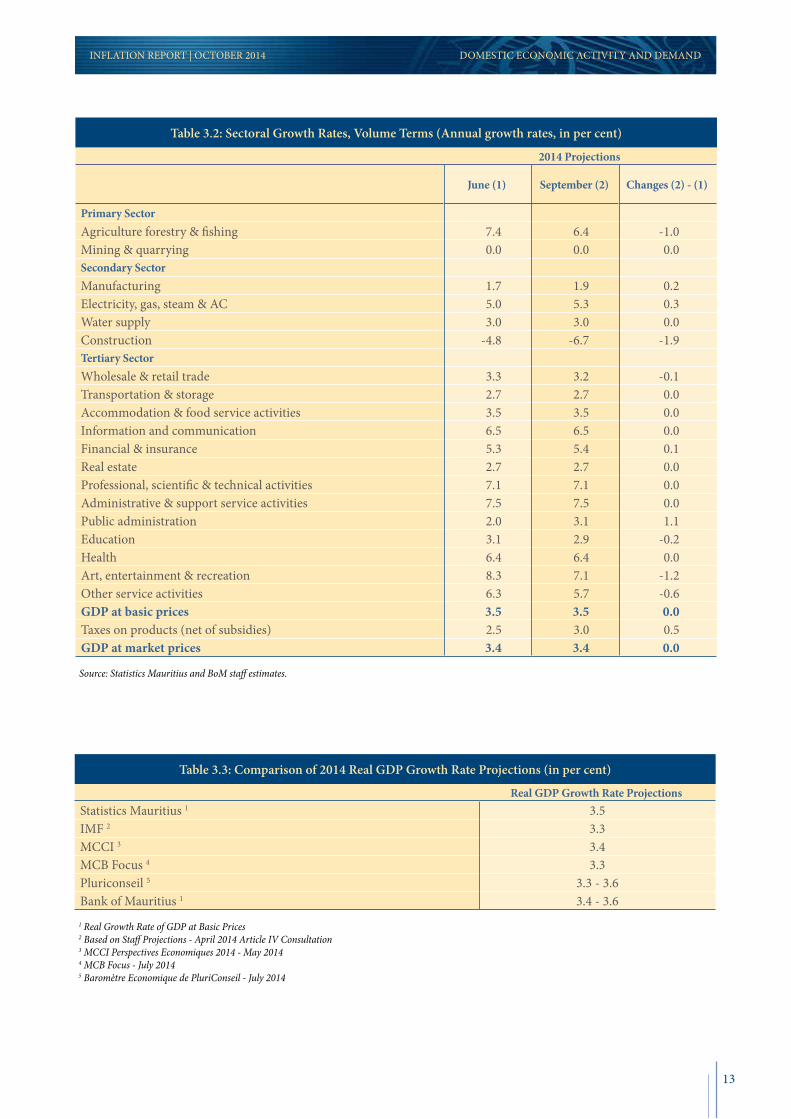
During the first half of 2014, the domestic economy expanded at rates that were marginally higher than those achieved in the first half of 2013 on account of rapid growth of the services sector (Table 3.1). The average real GDP growth rate for the first half of 2014 was 3.7 per cent, up from 3.6 per cent in the first half of 2013. Growth in 2014 reflects brisk services sector activity, especially for public administration, accommodation and food service activities, financial and insurance activities, and other services.3 The secondary sector registered positive growth in the first half of 2014, although the key construction sector registered negative growth in the first and second quarters of 2014.4 By contrast, manufacturing has shown an important recovery in recent months, echoing an improved export performance to the US and Asian markets as wellas the French and United Arab Emirates markets. Taxes on products (net of subsidies) have also shown average growth rates in the first half of 2014 that are higher than those registered in 2013. In its September 2014 national accounts update, Statistics Mauritius maintained its June forecast of annual GDP growth (at basic prices) of 3.5 per cent in 2014, although the sectors’ contribution to growth changed between the two forecasts (Table 3.2). In short, higher growth in public administration is projected to compensate for lower than earlier expected growth in construction, agriculture, arts and entertainment. This 2014 real GDP growth rate projection is, roughly, above the mid-point of growth projections by analysts, including the IMF (Table 3.3).
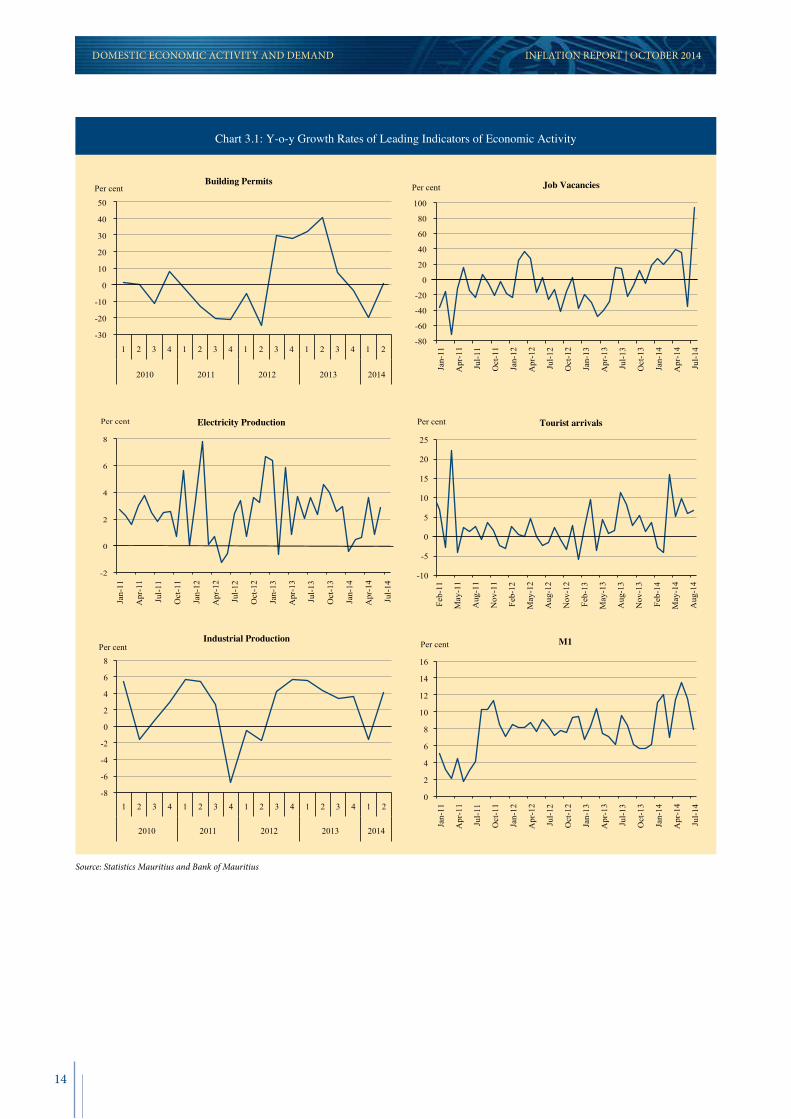
Disaggregated leading economic indicators show a mixed picture in economic activity through the second quarter of 2014. Yet, further analytical work and monitoring of these indicators is warranted to identify/extract the right “signal” (i.e., the trend) from these volatile high-frequency data (Chart 3.1). These short-term data include:
building permits job vacancies electricity production tourist arrivals industrial production index money supply M1
3. DOMESTIC ECONOMY
3 Data for the second quarter showed an important recovery in ‘accommodation and food service activities,’ with tourist arrivals from Europe – Mauritius’ main market – picking up. According to Statistics Mauritius, tourist arrivals are expected to exceed the one-million mark in 2014, owing to diversification efforts and additional flights put in place this year. Also, initiatives by the sector’s authorities are on-going to strengthen Mauritius’ image and visibility.
4 Negative growth of construction activities reflects an apparent excess supply of residential and non-residential buildings. The construction sector is projected to decline for the fourth consecutive year by 6.7 per cent in 2014, mainly due to a drop in the number of major private construction projects.
12
DOMESTIC ECONOMIC ACTIVITY AND DEMAND INFLATION REPORT | OCTOBER 2014
Table 3.1: GDP - Sectoral Growth Rates, Volume Terms (Annual growth rates, in per cent)
2013 2014Q1 Q2 Avg. Q1 Q2 Avg.
Primary Sector Agriculture forestry & fishing -4.6 -0.1 -2.4 8.4 7.2 7.8Mining & quarrying -2.4 -6.6 -4.5 -15.0 -4.8 -9.9Secondary Sector Manufacturing 6.0 4.8 5.4 -1.9 4.1 1.1Electricity, gas, steam & AC 6.3 2.6 4.5 2.3 6.4 4.4Water supply 3.2 1.3 2.3 2.2 2.5 2.4Construction -2.0 3.1 0.6 -4.7 -6.2 -5.5Tertiary Sector Wholesale & retail trade 3.7 3.1 3.4 3.2 3.1 3.2Transportation & storage 2.8 -1.0 0.9 2.7 2.6 2.7Accommodation & food service activities 1.4 0.3 0.9 -1.0 10.0 4.5Information and communication 7.2 8.1 7.7 6.0 6.9 6.5Financial & insurance 5.1 5.3 5.2 5.7 5.5 5.6Real estate 2.9 3.0 3.0 2.6 2.9 2.8Professional, scientific & technical activities 7.4 7.2 7.3 6.9 7.2 7.1Administrative & support service activities 7.2 7.1 7.2 7.2 7.3 7.3Public administration 1.2 1.8 1.5 3.2 6.7 5.0Education 2.7 2.7 2.7 3.3 2.5 2.9Health 6.3 5.9 6.1 6.3 6.6 6.5Art, entertainment & recreation 8.1 8.2 8.2 6.9 7.0 7.0Other service activities 5.1 5.9 5.5 5.6 5.5 5.6GDP at basic prices 3.8 3.4 3.6 2.7 4.6 3.7Taxes on products (net of subsidies) -0.4 4.1 1.9 2.5 4.7 3.6GDP at market prices 3.3 3.5 3.4 2.7 4.6 3.7
Source: Statistics Mauritius and BoM staff estimates.
13
INFLATION REPORT | OCTOBER 2014 DOMESTIC ECONOMIC ACTIVITY AND DEMAND
Table 3.2: Sectoral Growth Rates, Volume Terms (Annual growth rates, in per cent)
2014 Projections
June (1) September (2) Changes (2) - (1)
Primary Sector Agriculture forestry & fishing 7.4 6.4 -1.0Mining & quarrying 0.0 0.0 0.0Secondary Sector Manufacturing 1.7 1.9 0.2Electricity, gas, steam & AC 5.0 5.3 0.3Water supply 3.0 3.0 0.0Construction -4.8 -6.7 -1.9Tertiary Sector Wholesale & retail trade 3.3 3.2 -0.1Transportation & storage 2.7 2.7 0.0Accommodation & food service activities 3.5 3.5 0.0Information and communication 6.5 6.5 0.0Financial & insurance 5.3 5.4 0.1Real estate 2.7 2.7 0.0Professional, scientific & technical activities 7.1 7.1 0.0Administrative & support service activities 7.5 7.5 0.0Public administration 2.0 3.1 1.1Education 3.1 2.9 -0.2Health 6.4 6.4 0.0Art, entertainment & recreation 8.3 7.1 -1.2Other service activities 6.3 5.7 -0.6GDP at basic prices 3.5 3.5 0.0Taxes on products (net of subsidies) 2.5 3.0 0.5GDP at market prices 3.4 3.4 0.0
Source: Statistics Mauritius and BoM staff estimates.
Table 3.3: Comparison of 2014 Real GDP Growth Rate Projections (in per cent)
Real GDP Growth Rate ProjectionsStatistics Mauritius 1 3.5IMF 2 3.3MCCI 3 3.4MCB Focus 4 3.3Pluriconseil 5 3.3 - 3.6Bank of Mauritius 1 3.4 - 3.6
1 Real Growth Rate of GDP at Basic Prices2 Based on Staff Projections - April 2014 Article IV Consultation3 MCCI Perspectives Economiques 2014 - May 20144 MCB Focus - July 20145 Baromètre Economique de PluriConseil - July 2014
14
INFLATION REPORT | OCTOBER 2014 DOMESTIC ECONOMIC ACTIVITY AND DEMAND
-10
-5
0
5
10
15
20
25 Fe
b-11
May
-11
Aug
-11
Nov
-11
Feb-
12
May
-12
Aug
-12
Nov
-12
Feb-
13
May
-13
Aug
-13
Nov
-13
Feb-
14
May
-14
Aug
-14
Tourist arrivals Per cent
-8
-6
-4
-2
0
2
4
6
8
1 2 3 4 1 2 3 4 1 2 3 4 1 2 3 4 1 2
2010 2011 2012 2013 2014
Per cent Industrial Production
0
2
4
6
8
10
12
14
16
M1 Per cent
-2
0
2
4
6
8
Electricity Production Per cent
-80
-60
-40
-20
0
20
40
60
80
100
Jan-
11
Apr
-11
Jul-1
1
Oct
-11
Jan-
12
Apr
-12
Jul-1
2
Oct
-12
Jan-
13
Apr
-13
Jul-1
3
Oct
-13
Jan-
14
Apr
-14
Jul-1
4
Job Vacancies Per cent
-30
-20
-10
0
10
20
30
40
50
1 2 3 4 1 2 3 4 1 2 3 4 1 2 3 4 1 2
2010 2011 2012 2013 2014
Per cent Building Permits
Chart 3.1: Y-o-y Growth Rates of Leading Indicators of Economic Activity
Jan-
11
Apr
-11
Jul-1
1
Oct
-11
Jan-
12
Apr
-12
Jul-1
2
Oct
-12
Jan-
13
Apr
-13
Jul-1
3
Oct
-13
Jan-
14
Apr
-14
Jul-1
4
Jan-
11
Apr
-11
Jul-1
1
Oct
-11
Jan-
12
Apr
-12
Jul-1
2
Oct
-12
Jan-
13
Apr
-13
Jul-1
3
Oct
-13
Jan-
14
Apr
-14
Jul-1
4
Source: Statistics Mauritius and Bank of Mauritius
15
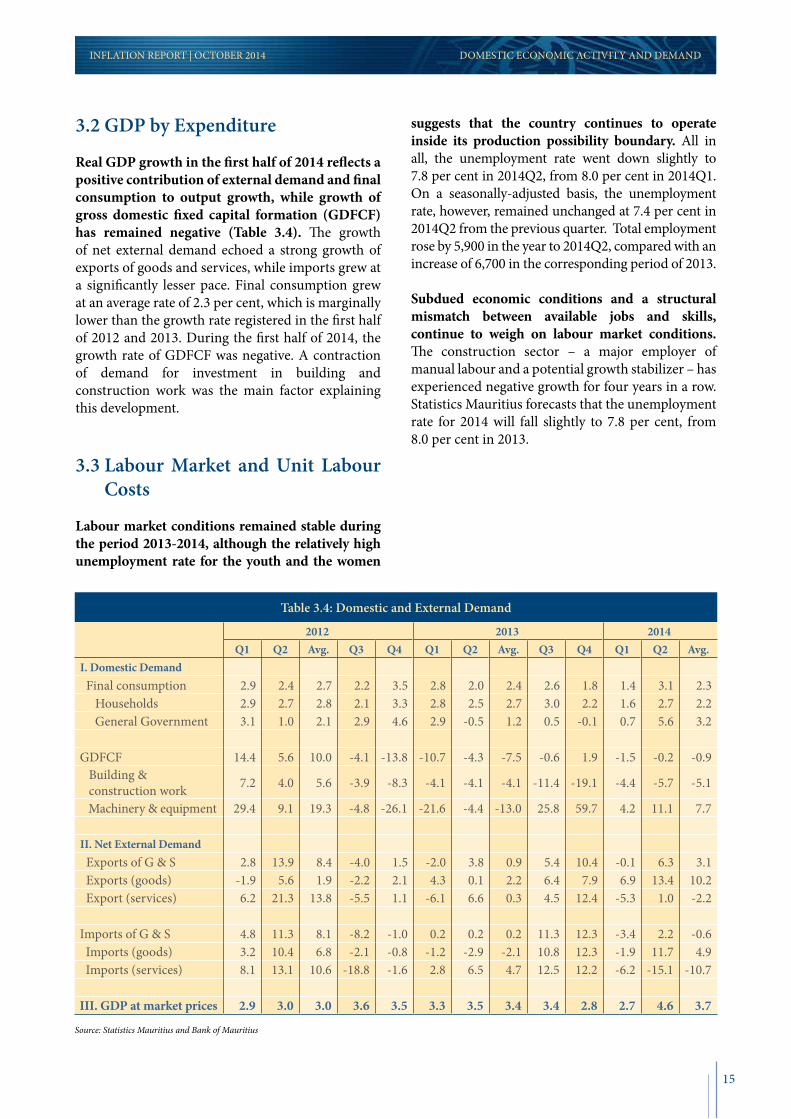
3.2 GDP by Expenditure
Real GDP growth in the first half of 2014 reflects a positive contribution of external demand and final consumption to output growth, while growth of gross domestic fixed capital formation (GDFCF)has remained negative (Table 3.4). The growth of net external demand echoed a strong growth of exports of goods and services, while imports grew at a significantly lesser pace. Final consumption grew at an average rate of 2.3 per cent, which is marginally lower than the growth rate registered in the first half of 2012 and 2013. During the first half of 2014, the growth rate of GDFCF was negative. A contraction of demand for investment in building and construction work was the main factor explaining this development.
3.3 Labour Market and Unit Labour Costs
Labour market conditions remained stable during the period 2013-2014, although the relatively high unemployment rate for the youth and the women
suggests that the country continues to operate inside its production possibility boundary. All in all, the unemployment rate went down slightly to 7.8 per cent in 2014Q2, from 8.0 per cent in 2014Q1. On a seasonally-adjusted basis, the unemployment rate, however, remained unchanged at 7.4 per cent in 2014Q2 from the previous quarter. Total employment rose by 5,900 in the year to 2014Q2, compared with an increase of 6,700 in the corresponding period of 2013.
Subdued economic conditions and a structural mismatch between available jobs and skills, continue to weigh on labour market conditions. The construction sector – a major employer of manual labour and a potential growth stabilizer – has experienced negative growth for four years in a row. Statistics Mauritius forecasts that the unemployment rate for 2014 will fall slightly to 7.8 per cent, from 8.0 per cent in 2013.
INFLATION REPORT | OCTOBER 2014 DOMESTIC ECONOMIC ACTIVITY AND DEMAND
Table 3.4: Domestic and External Demand
2012 2013 2014Q1 Q2 Avg. Q3 Q4 Q1 Q2 Avg. Q3 Q4 Q1 Q2 Avg.
I. Domestic Demand Final consumption 2.9 2.4 2.7 2.2 3.5 2.8 2.0 2.4 2.6 1.8 1.4 3.1 2.3 Households 2.9 2.7 2.8 2.1 3.3 2.8 2.5 2.7 3.0 2.2 1.6 2.7 2.2 General Government 3.1 1.0 2.1 2.9 4.6 2.9 -0.5 1.2 0.5 -0.1 0.7 5.6 3.2
GDFCF 14.4 5.6 10.0 -4.1 -13.8 -10.7 -4.3 -7.5 -0.6 1.9 -1.5 -0.2 -0.9 Building &
construction work 7.2 4.0 5.6 -3.9 -8.3 -4.1 -4.1 -4.1 -11.4 -19.1 -4.4 -5.7 -5.1
Machinery & equipment 29.4 9.1 19.3 -4.8 -26.1 -21.6 -4.4 -13.0 25.8 59.7 4.2 11.1 7.7
II. Net External Demand Exports of G & S 2.8 13.9 8.4 -4.0 1.5 -2.0 3.8 0.9 5.4 10.4 -0.1 6.3 3.1 Exports (goods) -1.9 5.6 1.9 -2.2 2.1 4.3 0.1 2.2 6.4 7.9 6.9 13.4 10.2 Export (services) 6.2 21.3 13.8 -5.5 1.1 -6.1 6.6 0.3 4.5 12.4 -5.3 1.0 -2.2
Imports of G & S 4.8 11.3 8.1 -8.2 -1.0 0.2 0.2 0.2 11.3 12.3 -3.4 2.2 -0.6 Imports (goods) 3.2 10.4 6.8 -2.1 -0.8 -1.2 -2.9 -2.1 10.8 12.3 -1.9 11.7 4.9 Imports (services) 8.1 13.1 10.6 -18.8 -1.6 2.8 6.5 4.7 12.5 12.2 -6.2 -15.1 -10.7
III. GDP at market prices 2.9 3.0 3.0 3.6 3.5 3.3 3.5 3.4 3.4 2.8 2.7 4.6 3.7
Source: Statistics Mauritius and Bank of Mauritius

After declining significantly in 2012, unit labour costs (ULCs) confronting export-oriented enterprises have been increasing, albeit due to different reasons (Charts 3.2 & 3.3). The recorded ULCs’ decline in 2012 was largely due to an increase in labour productivity that surpassed the increase
in wages. During 2013, ULCs recovered to their early 2012 levels, although the increase in costs was somewhat contained by a sustained (albeit volatile) increase in productivity. During 2014, ULCs increased rapidly as labour productivity dropped, while wages continued to rise.
INFLATION REPORT | OCTOBER 2014 DOMESTIC ECONOMIC ACTIVITY AND DEMAND
Chart 3.2: Export-Oriented Enterprises, Unit Labour Costs
Index (2012Q2 = 100)
90
92
94
96
98
100
102
104
106
108
Q2 Q3 Q4 Q1 Q2 Q3 Q4 Q1 Q2
2012 2013 2014
Source: Bank of Mauritius.
Chart 3.3 Export-Oriented Enterprises,Labour Productivity & Wages
Index (2012Q2 = 100)
90
95
100
105
110
115
Q2 Q3 Q4 Q1 Q2 Q3 Q4 Q1 Q2
2012 2013 2014
Productivity Index Wage Index
Source: Bank of Mauritius.
16
17
INFLATION REPORT | OCTOBER 2014 PUBLIC FINANCE
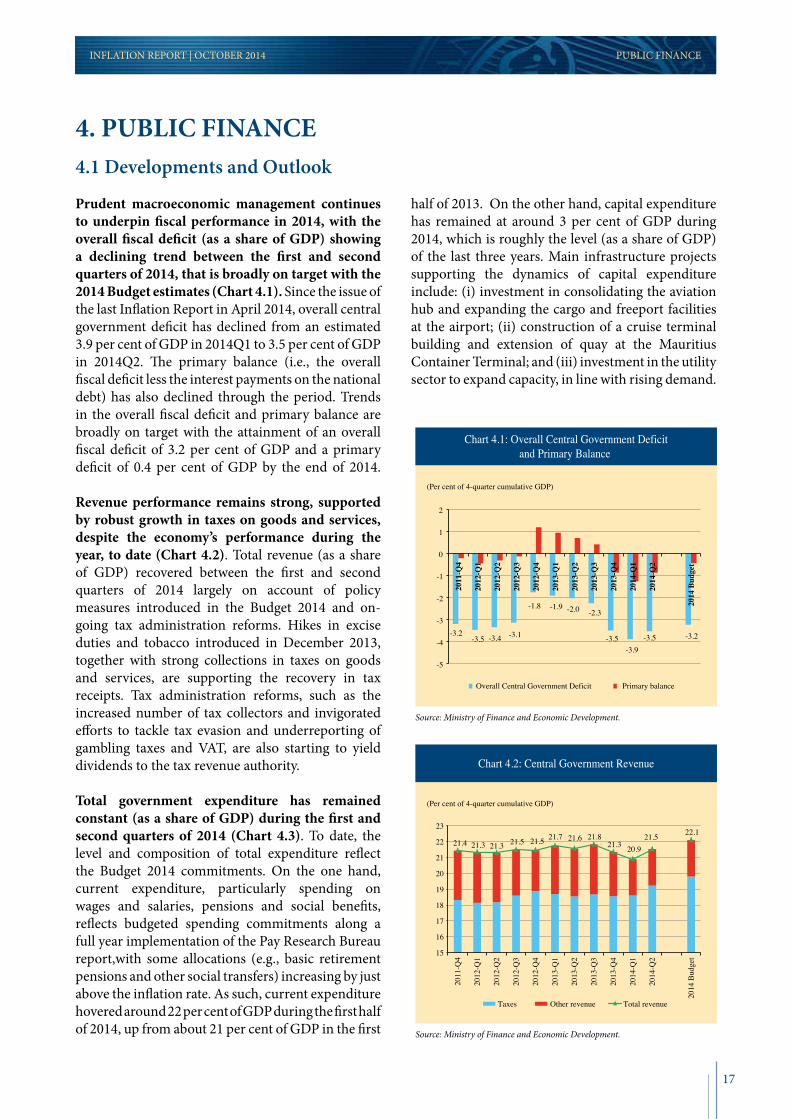
Chart 4.1: Overall Central Government Deficitand Primary Balance
(Per cent of 4-quarter cumulative GDP)
-3.2 -3.5 -3.4 -3.1
-1.8 -1.9 -2.0 -2.3
-3.5 -3.9
-3.5 -3.2
-5
-4
-3
-2
-1
0
1
2
2011
-Q4
2012
-Q1
2012
-Q2
2012
-Q3
2012
-Q4
2013
-Q1
2013
-Q2
2013
-Q3
2013
-Q4
2014
-Q1
2014
-Q2
2014
Bud
get
Overall Central Government Deficit Primary balance
Source: Ministry of Finance and Economic Development.
Chart 4.2: Central Government Revenue
(Per cent of 4-quarter cumulative GDP)
21.4 21.3 21.3 21.5 21.5 21.7 21.6 21.8 21.3 20.9
21.5 22.1
15
16
17
18
19
20
21
22
23
2011
-Q4
2012
-Q1
2012
-Q2
2012
-Q3
2012
-Q4
2013
-Q1
2013
-Q2
2013
-Q3
2013
-Q4
2014
-Q1
2014
-Q2
2014
Bud
get
Taxes Other revenue Total revenue
Source: Ministry of Finance and Economic Development.
4. PUBLIC FINANCE4.1 Developments and Outlook
Prudent macroeconomic management continues to underpin fiscal performance in 2014, with the overall fiscal deficit (as a share of GDP) showing a declining trend between the first and second quarters of 2014, that is broadly on target with the 2014 Budget estimates (Chart 4.1). Since the issue of the last Inflation Report in April 2014, overall central government deficit has declined from an estimated 3.9 per cent of GDP in 2014Q1 to 3.5 per cent of GDP in 2014Q2. The primary balance (i.e., the overall fiscal deficit less the interest payments on the national debt) has also declined through the period. Trends in the overall fiscal deficit and primary balance are broadly on target with the attainment of an overall fiscal deficit of 3.2 per cent of GDP and a primary deficit of 0.4 per cent of GDP by the end of 2014.
Revenue performance remains strong, supported by robust growth in taxes on goods and services, despite the economy’s performance during the year, to date (Chart 4.2). Total revenue (as a share of GDP) recovered between the first and second quarters of 2014 largely on account of policy measures introduced in the Budget 2014 and on-going tax administration reforms. Hikes in excise duties and tobacco introduced in December 2013, together with strong collections in taxes on goods and services, are supporting the recovery in tax receipts. Tax administration reforms, such as the increased number of tax collectors and invigorated efforts to tackle tax evasion and underreporting of gambling taxes and VAT, are also starting to yield dividends to the tax revenue authority.
Total government expenditure has remained constant (as a share of GDP) during the first and second quarters of 2014 (Chart 4.3). To date, the level and composition of total expenditure reflect the Budget 2014 commitments. On the one hand, current expenditure, particularly spending on wages and salaries, pensions and social benefits, reflects budgeted spending commitments along a full year implementation of the Pay Research Bureau report,with some allocations (e.g., basic retirement pensions and other social transfers) increasing by just above the inflation rate. As such, current expenditure hovered around 22 per cent of GDP during the first half of 2014, up from about 21 per cent of GDP in the first
half of 2013. On the other hand, capital expenditure has remained at around 3 per cent of GDP during 2014, which is roughly the level (as a share of GDP) of the last three years. Main infrastructure projects supporting the dynamics of capital expenditure include: (i) investment in consolidating the aviation hub and expanding the cargo and freeport facilities at the airport; (ii) construction of a cruise terminal building and extension of quay at the Mauritius Container Terminal; and (iii) investment in the utility sector to expand capacity, in line with rising demand.
18
PUBLIC FINANCE INFLATION REPORT | OCTOBER 2014
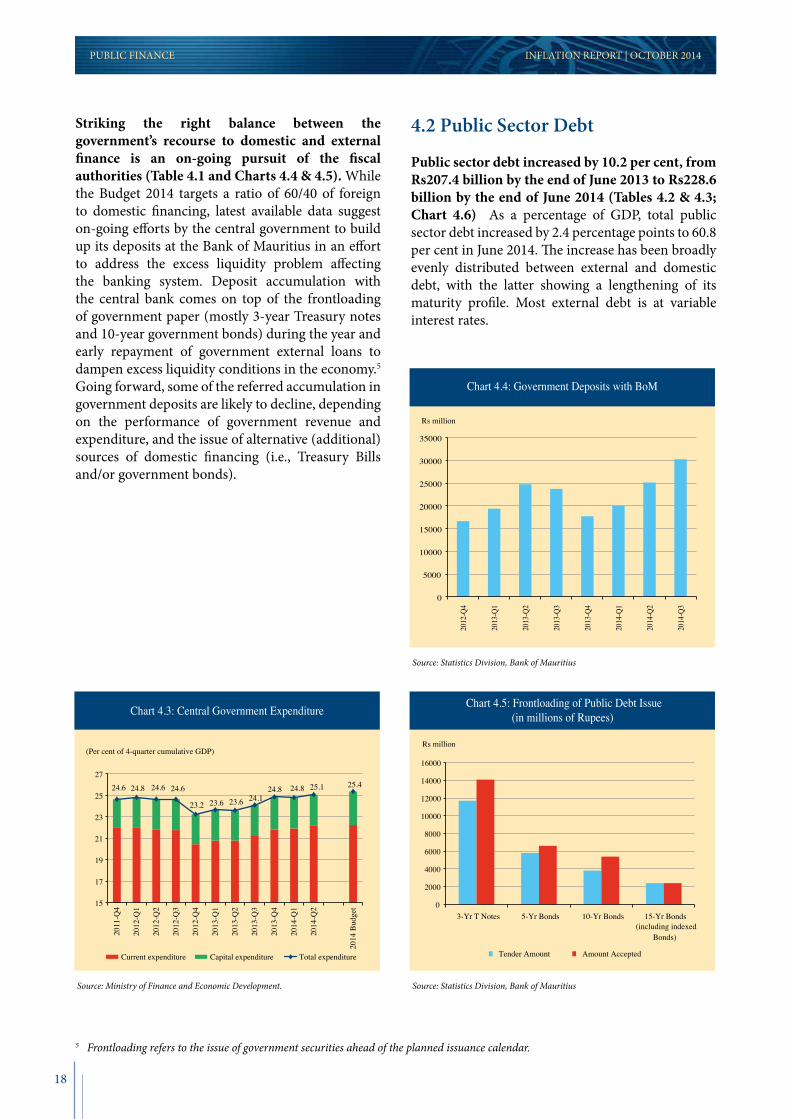
Striking the right balance between the government’s recourse to domestic and external finance is an on-going pursuit of the fiscal authorities (Table 4.1 and Charts 4.4 & 4.5). While the Budget 2014 targets a ratio of 60/40 of foreign to domestic financing, latest available data suggest on-going efforts by the central government to build up its deposits at the Bank of Mauritius in an effort to address the excess liquidity problem affecting the banking system. Deposit accumulation with the central bank comes on top of the frontloading of government paper (mostly 3-year Treasury notes and 10-year government bonds) during the year and early repayment of government external loans to dampen excess liquidity conditions in the economy.5 Going forward, some of the referred accumulation in government deposits are likely to decline, depending on the performance of government revenue and expenditure, and the issue of alternative (additional) sources of domestic financing (i.e., Treasury Bills and/or government bonds).
4.2 Public Sector Debt
Public sector debt increased by 10.2 per cent, from Rs207.4 billion by the end of June 2013 to Rs228.6 billion by the end of June 2014 (Tables 4.2 & 4.3; Chart 4.6) As a percentage of GDP, total public sector debt increased by 2.4 percentage points to 60.8 per cent in June 2014. The increase has been broadly evenly distributed between external and domestic debt, with the latter showing a lengthening of its maturity profile. Most external debt is at variable interest rates.
Chart 4.3: Central Government Expenditure
(Per cent of 4-quarter cumulative GDP)
24.6 24.8 24.6 24.6
23.2 23.6 23.6 24.1 24.8 24.8 25.1 25.4
15
17
19
21
23
25
27
2011
-Q4
2012
-Q1
2012
-Q2
2012
-Q3
2012
-Q4
2013
-Q1
2013
-Q2
2013
-Q3
2013
-Q4
2014
-Q1
2014
-Q2
2014
Bud
get
Current expenditure Capital expenditure Total expenditure
Source: Ministry of Finance and Economic Development.
Chart 4.5: Frontloading of Public Debt Issue(in millions of Rupees)
Rs million
0
2000
4000
6000
8000
10000
12000
14000
16000
3-Yr T Notes 5-Yr Bonds 10-Yr Bonds 15-Yr Bonds (including indexed
Bonds)
Tender Amount Amount Accepted
Source: Statistics Division, Bank of Mauritius
Chart 4.4: Government Deposits with BoM
Rs million
0
5000
10000
15000
20000
25000
30000
35000
2012
-Q4
2013
-Q1
2013
-Q2
2013
-Q3
2013
-Q4
2014
-Q1
2014
-Q2
2014
-Q3
Source: Statistics Division, Bank of Mauritius
5 Frontloading refers to the issue of government securities ahead of the planned issuance calendar.
19
INFLATION REPORT | OCTOBER 2014 PUBLIC FINANCE
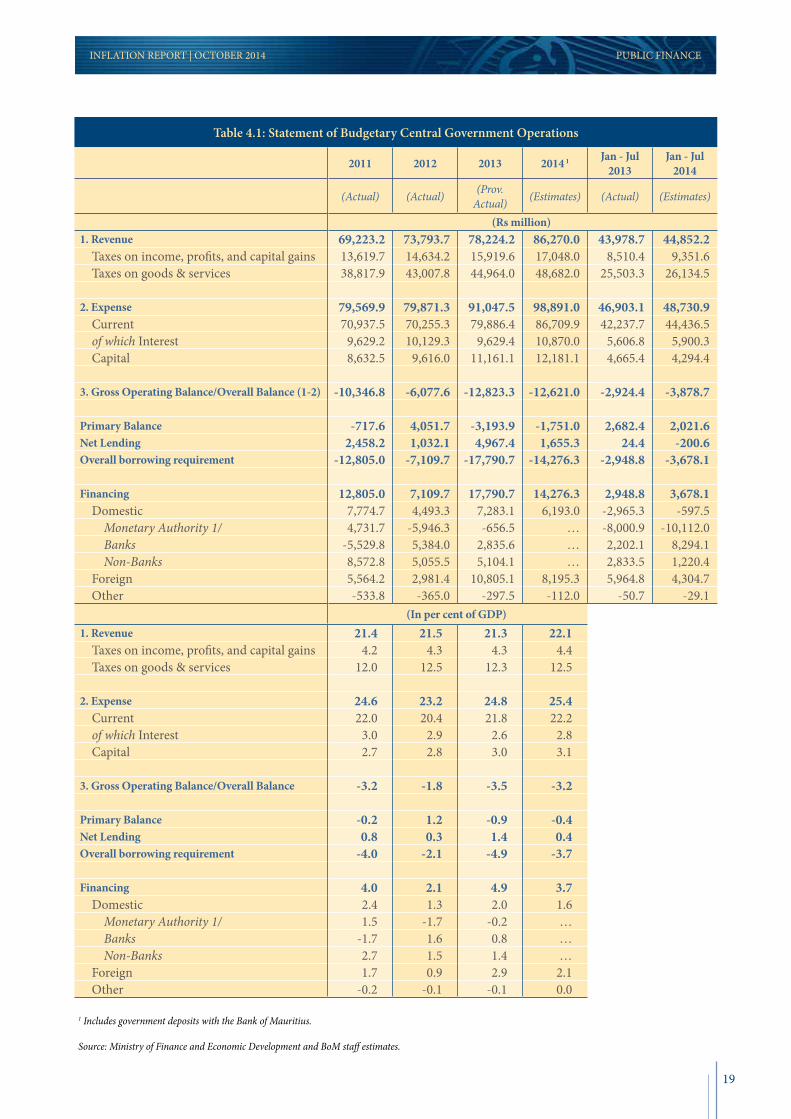
Table 4.1: Statement of Budgetary Central Government Operations
2011 2012 2013 2014 1 Jan - Jul 2013
Jan - Jul 2014
(Actual) (Actual) (Prov. Actual) (Estimates) (Actual) (Estimates)
(Rs million)1. Revenue 69,223.2 73,793.7 78,224.2 86,270.0 43,978.7 44,852.2 Taxes on income, profits, and capital gains 13,619.7 14,634.2 15,919.6 17,048.0 8,510.4 9,351.6 Taxes on goods & services 38,817.9 43,007.8 44,964.0 48,682.0 25,503.3 26,134.5
2. Expense 79,569.9 79,871.3 91,047.5 98,891.0 46,903.1 48,730.9 Current 70,937.5 70,255.3 79,886.4 86,709.9 42,237.7 44,436.5 of which Interest 9,629.2 10,129.3 9,629.4 10,870.0 5,606.8 5,900.3 Capital 8,632.5 9,616.0 11,161.1 12,181.1 4,665.4 4,294.4
3. Gross Operating Balance/Overall Balance (1-2) -10,346.8 -6,077.6 -12,823.3 -12,621.0 -2,924.4 -3,878.7
Primary Balance -717.6 4,051.7 -3,193.9 -1,751.0 2,682.4 2,021.6Net Lending 2,458.2 1,032.1 4,967.4 1,655.3 24.4 -200.6Overall borrowing requirement -12,805.0 -7,109.7 -17,790.7 -14,276.3 -2,948.8 -3,678.1
Financing 12,805.0 7,109.7 17,790.7 14,276.3 2,948.8 3,678.1 Domestic 7,774.7 4,493.3 7,283.1 6,193.0 -2,965.3 -597.5 Monetary Authority 1/ 4,731.7 -5,946.3 -656.5 … -8,000.9 -10,112.0 Banks -5,529.8 5,384.0 2,835.6 … 2,202.1 8,294.1 Non-Banks 8,572.8 5,055.5 5,104.1 … 2,833.5 1,220.4 Foreign 5,564.2 2,981.4 10,805.1 8,195.3 5,964.8 4,304.7 Other -533.8 -365.0 -297.5 -112.0 -50.7 -29.1
(In per cent of GDP)1. Revenue 21.4 21.5 21.3 22.1 Taxes on income, profits, and capital gains 4.2 4.3 4.3 4.4 Taxes on goods & services 12.0 12.5 12.3 12.5
2. Expense 24.6 23.2 24.8 25.4 Current 22.0 20.4 21.8 22.2 of which Interest 3.0 2.9 2.6 2.8 Capital 2.7 2.8 3.0 3.1
3. Gross Operating Balance/Overall Balance -3.2 -1.8 -3.5 -3.2
Primary Balance -0.2 1.2 -0.9 -0.4Net Lending 0.8 0.3 1.4 0.4Overall borrowing requirement -4.0 -2.1 -4.9 -3.7
Financing 4.0 2.1 4.9 3.7 Domestic 2.4 1.3 2.0 1.6 Monetary Authority 1/ 1.5 -1.7 -0.2 … Banks -1.7 1.6 0.8 … Non-Banks 2.7 1.5 1.4 … Foreign 1.7 0.9 2.9 2.1 Other -0.2 -0.1 -0.1 0.0
1 Includes government deposits with the Bank of Mauritius.
Source: Ministry of Finance and Economic Development and BoM staff estimates.
PUBLIC FINANCE

20
According to the Budget 2014, the aim is to reduce the discounted public sector debt from 54.8 per cent of GDP by the end of 2013 to 54.0 per cent of GDP by the end of 2014.6 The Public Debt Management Act (PDMA) 2008 sets a target for the reduction in the discounted public sector debt to 50 per cent of GDP by 2018.
PUBLIC FINANCE INFLATION REPORT | OCTOBER 2014
6 Discounted public sector debt evaluates/adjusts total public sector debt for the fiscal risks associated with debt of parastatals and state-owned enterprises. Accordingly, this debt is discounted whenever the fiscal risk is small. For operational purposes of adherence to the provisions of the PDMA 2008, it is the discounted public sector debt that is relevant.
Table 4.2: Public Sector Debt
Rs million
Dec-12 Jun-13 Dec-13Jun-14
Provisional1. Short-term Domestic Obligations 1 31,093 29,880 27,497 22,984 o/w: Treasury Bills 29,486 29,861 27,497 22,9842. Medium-term Domestic Obligations 1 40,174 40,697 43,251 50,692 o/w: Treasury Notes 40,157 40,680 43,251 50,6923. Long-term Domestic Obligations 1 69,539 73,309 79,212 83,301 o/w: MDLS/Government of Mauritius Bonds 39,892 42,287 46,062 49,079 Five-Year Government of Mauritius Bonds 29,647 31,022 33,150 34,2224. Domestic Central Government Debt (1+2+3) 140,806 143,886 149,960 156,977
(41.0) (40.5) (40.9) (41.8)5. External Government Debt 35,918 42,106 47,133 51,427
(10.4) (11.9) (12.9) (13.7)(a) Foreign Loans 31,134 37,434 42,214 46,483(b) Foreign Investment in Government Securities 241 157 427 418(c) IMF SDR Allocations 4,543 4,515 4,493 4,5256. Extra Budgetary Unit Domestic Debt 105 105 24 247. Extra Budgetary Unit External Debt 180 171 160 1478. Local Government Domestic Debt 2 1 0 09. Public Enterprise Domestic Debt 11,130 10,175 12,062 9,31910. Public Enterprise External Debt 10,888 10,994 10,569 10,65711. Domestic Public Sector Debt 152,043 154,167 162,046 166,320
(44.2) (43.4) (44.2) (44.3)12. External Public Sector Debt 46,986 53,271 57,862 62,231
(13.7) (15.0) (15.8) (16.6)13. Total Public Sector Debt (11+12) 199,029 207,438 219,908 228,551
(57.9) (58.4) (60.0) (60.8)1 By original maturity.
Notes: (i) Short-term: Up to 12 months; Medium-term: Over 1 year but less than 5 years; Long-term: 5 years and above. (ii) Figures in brackets are percentages to GDP. (iii) Figures may not add up to totals due to rounding.
Source: Financial Markets Operations Division, Bank of Mauritius; Ministry of Finance and Economic Development, Government of Mauritius.

21
INFLATION REPORT | OCTOBER 2014 PUBLIC FINANCE
Table 4.3: Government External Debt by Interest Rate Mix
(Per cent)
Dec-12 Jun-13 Dec-13Jun-14
ProvisionalFixed Rate 21.7 19.1 19.5 17.1 Floating Rate 74.1 76.9 77.0 79.8 Interest-Free 4.2 3.9 3.5 3.1
Note: Figures may not add up to totals due to rounding.
Source: Ministry of Finance and Economic Development, Government of Mauritius.
Chart 4.6 Public Debt
Per cent of GDP
0
10
20
30
40
50
60
70
80
Jun-06 Jun-07 Jun-08 Jun-09 Jun-10 Jun-11 Jun-12 Jun-13 Jun-14
Total public debt Discounted public debt
Source: Ministry of Finance and Economic Development.

23
INFLATION REPORT | OCTOBER 2014 BALANCE OF PAYMENTS
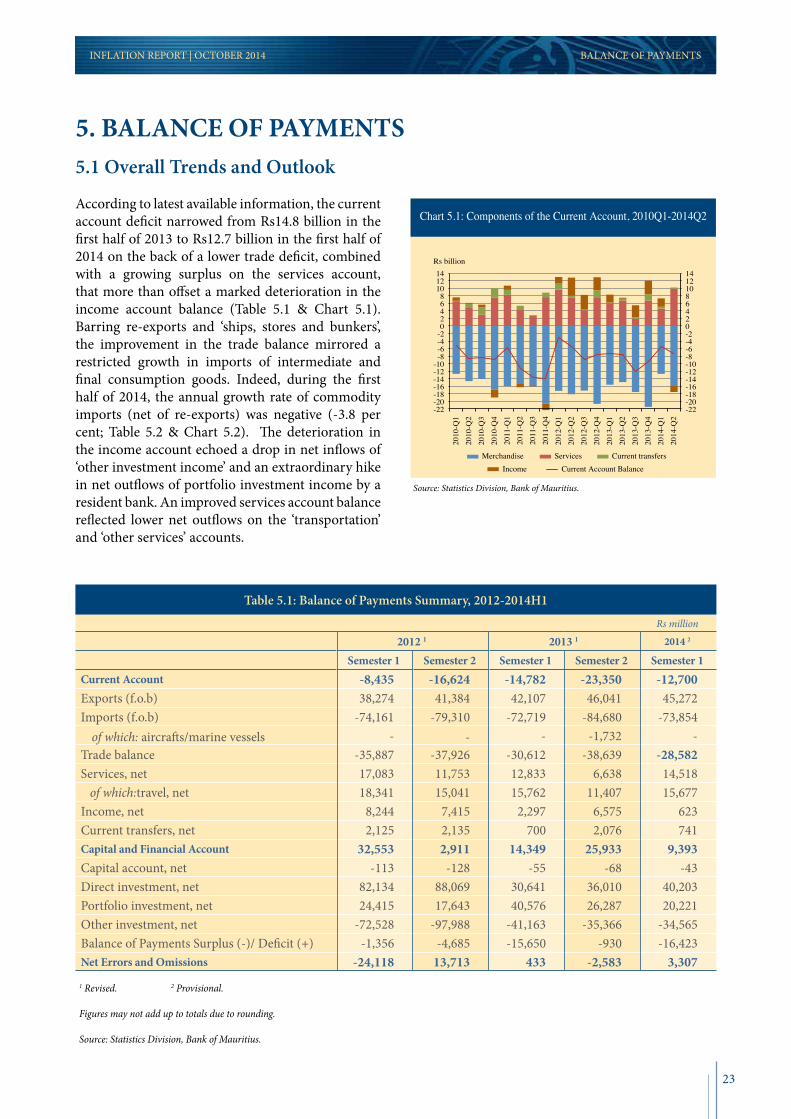
5.1 Overall Trends and Outlook
According to latest available information, the current account deficit narrowed from Rs14.8 billion in the first half of 2013 to Rs12.7 billion in the first half of 2014 on the back of a lower trade deficit, combined with a growing surplus on the services account, that more than offset a marked deterioration in the income account balance (Table 5.1 & Chart 5.1). Barring re-exports and ‘ships, stores and bunkers’, the improvement in the trade balance mirrored a restricted growth in imports of intermediate and final consumption goods. Indeed, during the first half of 2014, the annual growth rate of commodity imports (net of re-exports) was negative (-3.8 per cent; Table 5.2 & Chart 5.2). The deterioration in the income account echoed a drop in net inflows of ‘other investment income’ and an extraordinary hike in net outflows of portfolio investment income by a resident bank. An improved services account balance reflected lower net outflows on the ‘transportation’ and ‘other services’ accounts.
5. BALANCE OF PAYMENTS
Table 5.1: Balance of Payments Summary, 2012-2014H1
Rs million
2012 1 2013 1 2014 2
Semester 1 Semester 2 Semester 1 Semester 2 Semester 1Current Account -8,435 -16,624 -14,782 -23,350 -12,700Exports (f.o.b) 38,274 41,384 42,107 46,041 45,272Imports (f.o.b) -74,161 -79,310 -72,719 -84,680 -73,854 of which: aircrafts/marine vessels - - - -1,732 - Trade balance -35,887 -37,926 -30,612 -38,639 -28,582Services, net 17,083 11,753 12,833 6,638 14,518 of which:travel, net 18,341 15,041 15,762 11,407 15,677Income, net 8,244 7,415 2,297 6,575 623Current transfers, net 2,125 2,135 700 2,076 741Capital and Financial Account 32,553 2,911 14,349 25,933 9,393Capital account, net -113 -128 -55 -68 -43Direct investment, net 82,134 88,069 30,641 36,010 40,203Portfolio investment, net 24,415 17,643 40,576 26,287 20,221Other investment, net -72,528 -97,988 -41,163 -35,366 -34,565Balance of Payments Surplus (-)/ Deficit (+) -1,356 -4,685 -15,650 -930 -16,423Net Errors and Omissions -24,118 13,713 433 -2,583 3,307
1 Revised. 2 Provisional.
Figures may not add up to totals due to rounding.
Source: Statistics Division, Bank of Mauritius.
Chart 5.1: Components of the Current Account, 2010Q1-2014Q2
-22 -20 -18 -16 -14 -12 -10 -8 -6 -4 -2 0 2 4 6 8 10 12 14
-22 -20 -18 -16 -14 -12 -10 -8 -6 -4 -2 0 2 4 6 8
10 12 14
2010
-Q1
2010
-Q2
2010
-Q3
2010
-Q4
2011
-Q1
2011
-Q2
2011
-Q3
2011
-Q4
2012
-Q1
2012
-Q2
2012
-Q3
2012
-Q4
2013
-Q1
2013
-Q2
2013
-Q3
2013
-Q4
2014
-Q1
2014
-Q2
Merchandise Services Current transfers Income Current Account Balance
Rs billion
Source: Statistics Division, Bank of Mauritius.
24
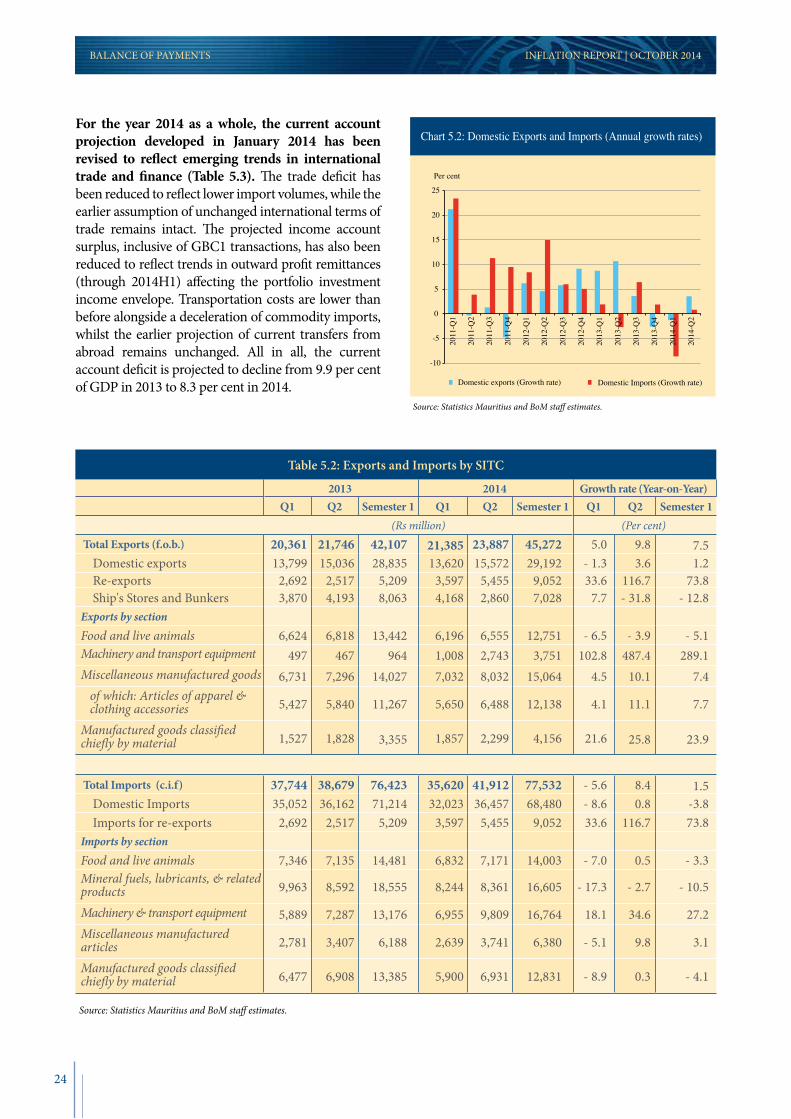
For the year 2014 as a whole, the current account projection developed in January 2014 has been revised to reflect emerging trends in international trade and finance (Table 5.3). The trade deficit has been reduced to reflect lower import volumes, while the earlier assumption of unchanged international terms of trade remains intact. The projected income account surplus, inclusive of GBC1 transactions, has also been reduced to reflect trends in outward profit remittances (through 2014H1) affecting the portfolio investment income envelope. Transportation costs are lower than before alongside a deceleration of commodity imports, whilst the earlier projection of current transfers from abroad remains unchanged. All in all, the current account deficit is projected to decline from 9.9 per cent of GDP in 2013 to 8.3 per cent in 2014.
BALANCE OF PAYMENTS INFLATION REPORT | OCTOBER 2014
Chart 5.2: Domestic Exports and Imports (Annual growth rates)
-10
-5
0
5
10
15
20
25
2011
-Q1
2011
-Q2
2011
-Q3
2011
-Q4
2012
-Q1
2012
-Q2
2012
-Q3
2012
-Q4
2013
-Q1
2013
-Q2
2013
-Q3
2013
-Q4
2014
-Q1
2014
-Q2
Domestic exports (Growth rate) Domestic Imports (Growth rate)
Per cent
Source: Statistics Mauritius and BoM staff estimates.
Table 5.2: Exports and Imports by SITC
2013 2014 Growth rate (Year-on-Year) Q1 Q2 Semester 1 Q1 Q2 Semester 1 Q1 Q2 Semester 1
(Rs million) (Per cent) Total Exports (f.o.b.) 20,361 21,746 42,107 21,385 23,887 45,272 5.0 9.8 7.5 Domestic exports 13,799 15,036 28,835 13,620 15,572 29,192 - 1.3 3.6 1.2 Re-exports 2,692 2,517 5,209 3,597 5,455 9,052 33.6 116.7 73.8 Ship's Stores and Bunkers 3,870 4,193 8,063 4,168 2,860 7,028 7.7 - 31.8 - 12.8 Exports by section Food and live animals 6,624 6,818 13,442 6,196 6,555 12,751 - 6.5 - 3.9 - 5.1 Machinery and transport equipment 497 467 964 1,008 2,743 3,751 102.8 487.4 289.1 Miscellaneous manufactured goods 6,731 7,296 14,027 7,032 8,032 15,064 4.5 10.1 7.4 of which: Articles of apparel &
clothing accessories 5,427 5,840 11,267 5,650 6,488 12,138 4.1 11.1 7.7
Manufactured goods classified chiefly by material 1,527 1,828 3,355 1,857 2,299 4,156 21.6 25.8 23.9
Total Imports (c.i.f) 37,744 38,679 76,423 35,620 41,912 77,532 - 5.6 8.4 1.5 Domestic Imports 35,052 36,162 71,214 32,023 36,457 68,480 - 8.6 0.8 -3.8 Imports for re-exports 2,692 2,517 5,209 3,597 5,455 9,052 33.6 116.7 73.8 Imports by section Food and live animals 7,346 7,135 14,481 6,832 7,171 14,003 - 7.0 0.5 - 3.3 Mineral fuels, lubricants, & related products 9,963 8,592 18,555 8,244 8,361 16,605 - 17.3 - 2.7 - 10.5
Machinery & transport equipment 5,889 7,287 13,176 6,955 9,809 16,764 18.1 34.6 27.2 Miscellaneous manufactured articles 2,781 3,407 6,188 2,639 3,741 6,380 - 5.1 9.8 3.1
Manufactured goods classified chiefly by material 6,477 6,908 13,385 5,900 6,931 12,831 - 8.9 0.3 - 4.1
Source: Statistics Mauritius and BoM staff estimates.

25
INFLATION REPORT | OCTOBER 2014 BALANCE OF PAYMENTS
Table 5.3: Balance of Payments, 2010 – 2014
2010 2011 2012 Preliminary 2013
2014 ProjectionJan. 2014 Revised
(Rs million)Current account -30,985 -44,630 -25,059 -36,187 -33,862 -32,261Trade balance -58,289 -67,585 -73,813 -69,590 -79,298 -66,526Service balance 21,949 22,869 28,838 21,493 25,297 26,912Income balance -274 -3,389 15,659 9,134 14,583 4,406 o/w GBC1 net inflows -6,478 -7,179 11,273 5,282 10,407 2,924Current transfers 5,629 3,475 4,260 2,776 5,557 2,947
Capital and Financial account 26,138 39,188 35,463 33,173 33,862 29,202Capital account -148 -53 -241 -123 -123 -150Financial account 26,286 39,241 35,704 33,296 33,984 29,352 FDI (net) 423,658 -29,009 170,204 67,213 56,816 75,911 Portfolio investment -300,682 256,972 42,059 59,760 37,178 43,405 Other investment -90,512 -183,475 -170,518 -77,098 -48,681 -68,273 o/w Banks (net) -56,096 -7,911 -24,971 46,892 41,408 Reserve assets -6,177 -5,247 -6,041 -16,580 -11,328 -21,691Errors and omissions net 4,847 5,442 -10,404 3,015 0 3,058
(In Per cent of GDP)Current account -10.4 -13.8 -7.3 -9.9 -8.7 -8.3Trade balance -19.5 -20.9 -21.5 -19.0 -20.3 -17.1Service balance 7.3 7.1 8.4 5.9 6.5 6.9Income balance -0.1 -1.0 4.6 2.5 3.7 1.1 o/w GBC1 net inflows -2.2 -2.2 3.3 1.4 1.4 0.7Current transfers 1.9 1.1 1.2 0.8 1.4 0.8
Capital and Financial account 8.7 12.1 10.3 9.1 8.7 7.5Capital account 0.0 0.0 -0.1 0.0 0.0 0.0Financial account 8.8 12.1 10.4 9.1 8.7 7.5FDI (net) 141.6 -9.0 49.5 18.3 14.6 19.5Portfolio investment -100.5 79.6 12.2 16.3 9.5 11.1Other investment -30.3 -56.8 -49.6 -21.0 -12.5 -17.5 o/w Banks (net)Reserve assets -2.1 -1.6 -1.8 -4.5 -2.9 -5.6Errors and omissions net 1.6 1.7 -3.0 0.8 0.0 0.8
Memo items:Nominal GDP (millions of Rs) 299,173 323,011 343,835 366,479 … 389,999Gross official reserves (millions of Rs) 78,011 80,054 91,409 103,258 110,080 126,700Import coverage (in months of Goods & Services) 5.0 4.6 4.9 5.2 4.8 6.2
Source: Statistics Division, Bank of Mauritius.
26
INFLATION REPORT | OCTOBER 2014
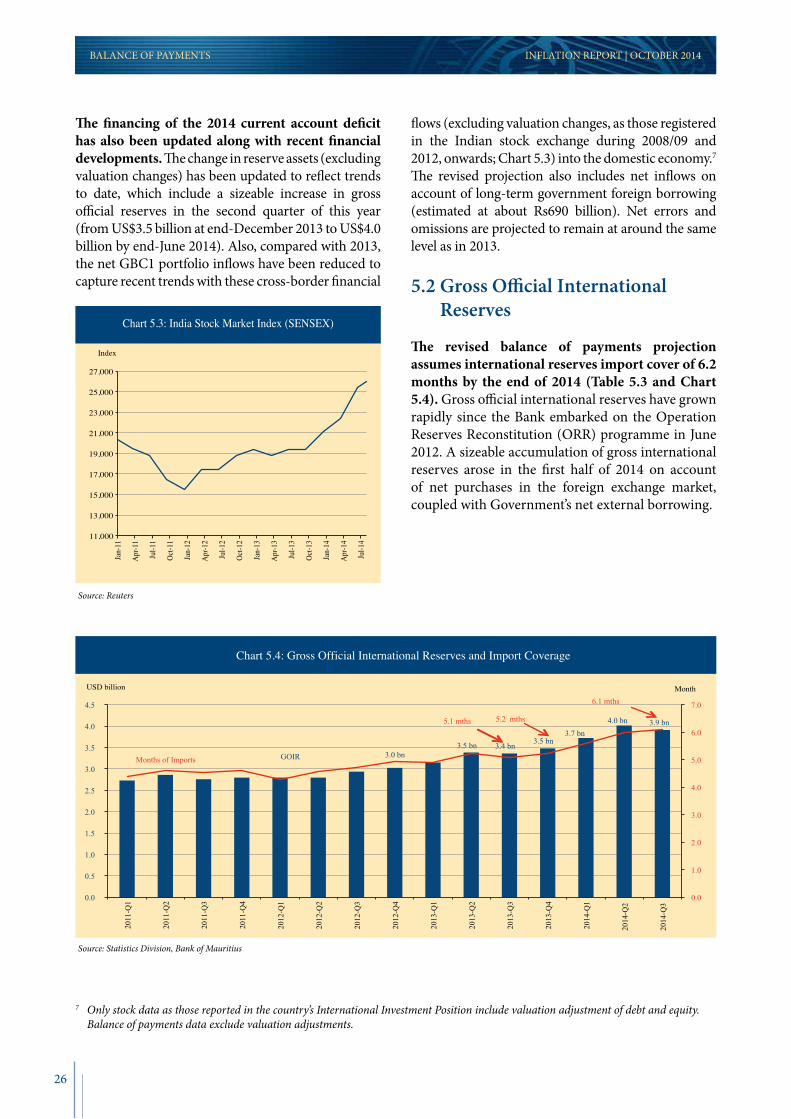
The financing of the 2014 current account deficit has also been updated along with recent financial developments. The change in reserve assets (excluding valuation changes) has been updated to reflect trends to date, which include a sizeable increase in gross official reserves in the second quarter of this year (from US$3.5 billion at end-December 2013 to US$4.0 billion by end-June 2014). Also, compared with 2013, the net GBC1 portfolio inflows have been reduced to capture recent trends with these cross-border financial
flows (excluding valuation changes, as those registered in the Indian stock exchange during 2008/09 and 2012, onwards; Chart 5.3) into the domestic economy.7 The revised projection also includes net inflows on account of long-term government foreign borrowing (estimated at about Rs690 billion). Net errors and omissions are projected to remain at around the same level as in 2013.
5.2 Gross Official International Reserves
The revised balance of payments projection assumes international reserves import cover of 6.2 months by the end of 2014 (Table 5.3 and Chart 5.4). Gross official international reserves have grown rapidly since the Bank embarked on the Operation Reserves Reconstitution (ORR) programme in June 2012. A sizeable accumulation of gross international reserves arose in the first half of 2014 on account of net purchases in the foreign exchange market, coupled with Government’s net external borrowing.
7 Only stock data as those reported in the country’s International Investment Position include valuation adjustment of debt and equity. Balance of payments data exclude valuation adjustments.
Chart 5.3: India Stock Market Index (SENSEX)
11,000
13,000
15,000
17,000
19,000
21,000
23,000
25,000
27,000
Index
Jan-
11
Apr-1
1
Jul-1
1
Oct-1
1
Jan-
12
Apr-1
2
Jul-1
2
Oct-1
2
Jan-
13
Apr-1
3
Jul-1
3
Oct-1
3
Jan-
14
Apr-1
4
Jul-1
4
Source: Reuters
Chart 5.4: Gross Official International Reserves and Import Coverage
2011
-Q1
2011
-Q2
2011
-Q3
2011
-Q4
2012
-Q1
2012
-Q2
2012
-Q3
2012
-Q4
2013
-Q1
2013
-Q2
2013
-Q3
2013
-Q4
2014
-Q1
2014
-Q2
2014
-Q3
USD billion Month
3.0 bn 3.5 bn 3.4 bn 3.5 bn
3.7 bn 4.0 bn 3.9 bn 5.2 mths 5.1 mths
6.1 mths
0.0
1.0
2.0
3.0
4.0
5.0
6.0
7.0
0.0
0.5
1.0
1.5
2.0
2.5
3.0
3.5
4.0
4.5
GOIR Months of Imports
Source: Statistics Division, Bank of Mauritius
BALANCE OF PAYMENTS
27
5.3 International Terms of Trade
During the first half of 2014, there was a further improvement in the terms of trade that was in line with the overall trend in place since 2011 (Table 5.4). While the export price index declined against the average in 2013, the import price index fell significantly in 2014Q1, alongside a substantial easing of food import prices and that of miscellaneous imports. The terms of trade index has been broadly improving since 2011, mainly on account of hikes in export price indices for fish (through 2013), apparel and clothing, while price increases for imported food and energy prices have remained contained, albeit volatile.
For 2014 as a whole, the current Inflation Report assumes that the trend in the terms of trade will remain unchanged with respect to 2013. The Report assumes that the overall import price index will continue to decline due to on-going reductions in international food and energy prices. Export price indices are also projected to decline (mainly due to drops in sugar and fish prices). The decline in export and import price indices will broadly offset each other.
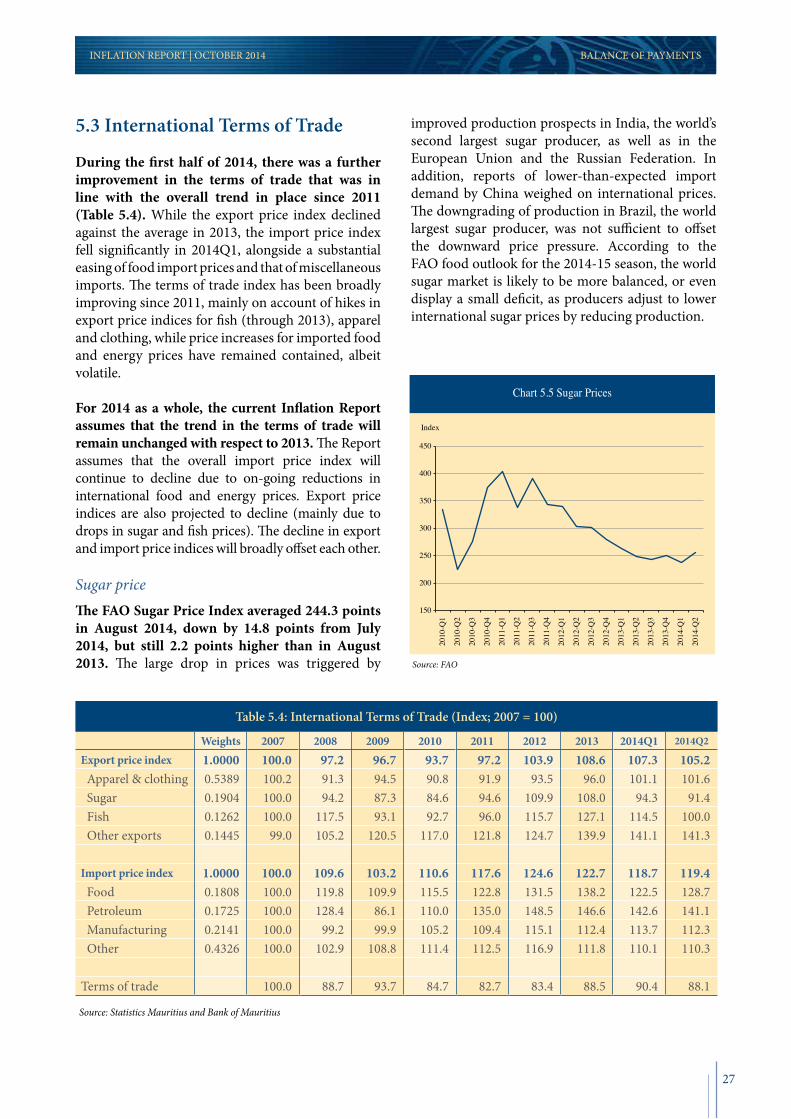
Sugar priceThe FAO Sugar Price Index averaged 244.3 points in August 2014, down by 14.8 points from July 2014, but still 2.2 points higher than in August 2013. The large drop in prices was triggered by
improved production prospects in India, the world’s second largest sugar producer, as well as in the European Union and the Russian Federation. In addition, reports of lower-than-expected import demand by China weighed on international prices. The downgrading of production in Brazil, the world largest sugar producer, was not sufficient to offset the downward price pressure. According to the FAO food outlook for the 2014-15 season, the world sugar market is likely to be more balanced, or even display a small deficit, as producers adjust to lower international sugar prices by reducing production.
INFLATION REPORT | OCTOBER 2014
Table 5.4: International Terms of Trade (Index; 2007 = 100)
Weights 2007 2008 2009 2010 2011 2012 2013 2014Q1 2014Q2
Export price index 1.0000 100.0 97.2 96.7 93.7 97.2 103.9 108.6 107.3 105.2 Apparel & clothing 0.5389 100.2 91.3 94.5 90.8 91.9 93.5 96.0 101.1 101.6 Sugar 0.1904 100.0 94.2 87.3 84.6 94.6 109.9 108.0 94.3 91.4 Fish 0.1262 100.0 117.5 93.1 92.7 96.0 115.7 127.1 114.5 100.0 Other exports 0.1445 99.0 105.2 120.5 117.0 121.8 124.7 139.9 141.1 141.3
Import price index 1.0000 100.0 109.6 103.2 110.6 117.6 124.6 122.7 118.7 119.4 Food 0.1808 100.0 119.8 109.9 115.5 122.8 131.5 138.2 122.5 128.7 Petroleum 0.1725 100.0 128.4 86.1 110.0 135.0 148.5 146.6 142.6 141.1 Manufacturing 0.2141 100.0 99.2 99.9 105.2 109.4 115.1 112.4 113.7 112.3 Other 0.4326 100.0 102.9 108.8 111.4 112.5 116.9 111.8 110.1 110.3
Terms of trade 100.0 88.7 93.7 84.7 82.7 83.4 88.5 90.4 88.1
Source: Statistics Mauritius and Bank of Mauritius
Chart 5.5 Sugar Prices
150
200
250
300
350
400
450 20
10-Q
1
2010
-Q2
2010
-Q3
2010
-Q4
2011
-Q1
2011
-Q2
2011
-Q3
2011
-Q4
2012
-Q1
2012
-Q2
2012
-Q3
2012
-Q4
2013
-Q1
2013
-Q2
2013
-Q3
2013
-Q4
2014
-Q1
2014
-Q2
Index
Source: FAO
BALANCE OF PAYMENTS
28
Crude oil pricesGeopolitical tensions in Iraq and Ukraine/Russia and supply outages put upward pressures on global oil prices in 2014H1 before subsiding in July and August 2014 as the crude oil market became complacent about the risk of supply disruptions. The September 2014 US Energy Information Administration (EIA) report expects Brent crude oil price to weaken as non-OPEC supply growth exceeds growth in world consumption. Brent crude oil price is projected to average US$106 per barrel and US$103 per barrel in 2014 and 2015, respectively.
International oil prices have, in general, remained range-bound, between US$96.0 and US$112.0 per barrel, during the period under review (Chart 5.6). ICE Brent rose from US$107.7 per barrel in March 2014 to US$111.9 per barrel in June 2014 before subsiding to US$103.6 a barrel in August. Likewise, NYMEX firmed to US$105.1 per barrel in June 2014 before moving downwards to US$96.0 per barrel in August 2014.
Food Price IndexThe Food and Agriculture Organisation’s (FAO) food price index decreased for a fifth consecutive month in August 2014. The lingering decline of food prices reflects much better expectations over supplies in the current and forthcoming seasons. The index’s August 2014 average of 196.6 points represented a decrease of 17.2 points (8.0 per cent) from March 2014. With the exception of meat, prices for all of the commodities measured by the index have dipped markedly since March 2014.
According to the July 2014 World Bank Commodity Markets Outlook, agricultural prices are projected to moderate further in 2014 under the assumptions that current crop conditions will be along the normal trends and there are ample inventories.
Wheat and maize The price for maize decreased by 27 per cent between the second quarter of 2013 and the second quarter of 2014 mainly on account of bumper harvests in key producing economies, especially the US, while wheat prices strengthened. The wheat market is reportedly still tight, as farm yields are projected to retreat from last year’s record, causing production declines in the world’s key suppliers (U.S. Canada, and Australia). According to the July
INFLATION REPORT | OCTOBER 2014
Chart 5.8: Maize and Wheat Prices
US$ per metric ton
100
150
200
250
300
350
400
1 2 3 4 1 2 3 4 1 2 3 4 1 2 3 4 1 2 3
2010 2011 2012 2013 2014
Maize (corn) Wheat
Source: FAO.
Chart 5.6: Crude Oil Prices
60
70
80
90
100
110
120
130
1 2 3 4 1 2 3 4 1 2 3 4 1 2 3 4 1 2 3
2010 2011 2012 2013 2014
US$ per barrel
Source: IMF.
BALANCE OF PAYMENTS
Chart 5.7: FAO Food Price Index
Index
120
130
140
150
160
170
180
1 2 3 4 1 2 3 4 1 2 3 4 1 2 3 4 1 2 3
2010 2011 2012 2013 2014
Source: FAO.

29
2014 World Bank Commodity Markets Outlook, the US Department of Agriculture has maintained its outlook for next season with global production of wheat and maize expected to decline.
5.4 Savings-Investment Gap
The macroeconomic framework used in this Inflation Report for projecting inflation for the whole of 2014 assumes that domestic investment (as a share of GDP) will be largely financed by domestic savings, although the contribution of external savings will be lower than in earlier
projections (Table 5.5). As noted above, the external current account deficit is expected to be lower than in 2013 due to a lower trade deficit. The contribution of public sector savings to the financing of the domestic investment envelope is expected to remain negative, as in 2013. Consistent with recent trends in the national accounts, the projection for 2014 level of domestic investment has been revised downwards from 23.2 per cent of GDP projected earlier in the year to 22.3 per cent of GDP. The expected decline in private investment and inventories’ accumulation explains the drop in overall domestic investment.
INFLATION REPORT | OCTOBER 2014
Table 5.5: Saving-Investment Balance
2011 2012 20132014 Proj.
Jan. 2014 Revised(Rs million)
Investment 83,905 85,162 87,892 91,479 86,784 Private (GDFCF) 59,667 60,175 59,266 57,943 58,413 Public 17,898 19,010 18,352 21,620 20,702 Change in inventories 6,340 5,977 10,274 11,916 7,669
Savings 83,905 85,162 87,892 91,479 86,784 External 44,630 25,059 36,187 33,862 32,261 Domestic 39,275 60,103 51,705 57,616 54,523 Private 43,334 58,962 54,770 … 56,963 Public -4,059 1,141 -3,065 … -2,440
(In per cent of GDP)
Investment* 26.0 24.8 24.0 23.2 22.3 Private (GDFCF) 18.5 17.5 16.2 14.7 15.0 Public 5.5 5.5 5.0 5.5 5.3 Change in inventories 2.0 1.7 2.8 3.0 2.0
Total Savings* 26.0 24.8 24.0 23.2 22.3 External (with global business) 13.8 7.3 9.9 8.6 8.3 Domestic 12.2 17.5 14.1 14.6 14.0 Private 13.4 17.1 14.9 … 14.7 Public -1.3 0.3 -0.8 … -0.6
(In per cent of GDP)
Savings 26.2 23.6 23.4 22.9 22.0 External (with global business) 13.9 7.0 9.7 8.5 8.2 Domestic 12.3 16.7 13.8 14.4 13.8 Private 13.5 16.4 14.6 … 14.4 Public -1.3 0.3 -0.8 … -0.6
Memo item: GDP (millions of Rs) 323,010 343,833 366,476 394,200 388,297 GNDI 320,145 360,490 374,966 399,413 394,430
* Reflects accounting identity of investment equals savings (external plus domestic)
Source: Statistics Mauritius and BoM estimates and projections.
BALANCE OF PAYMENTS

30
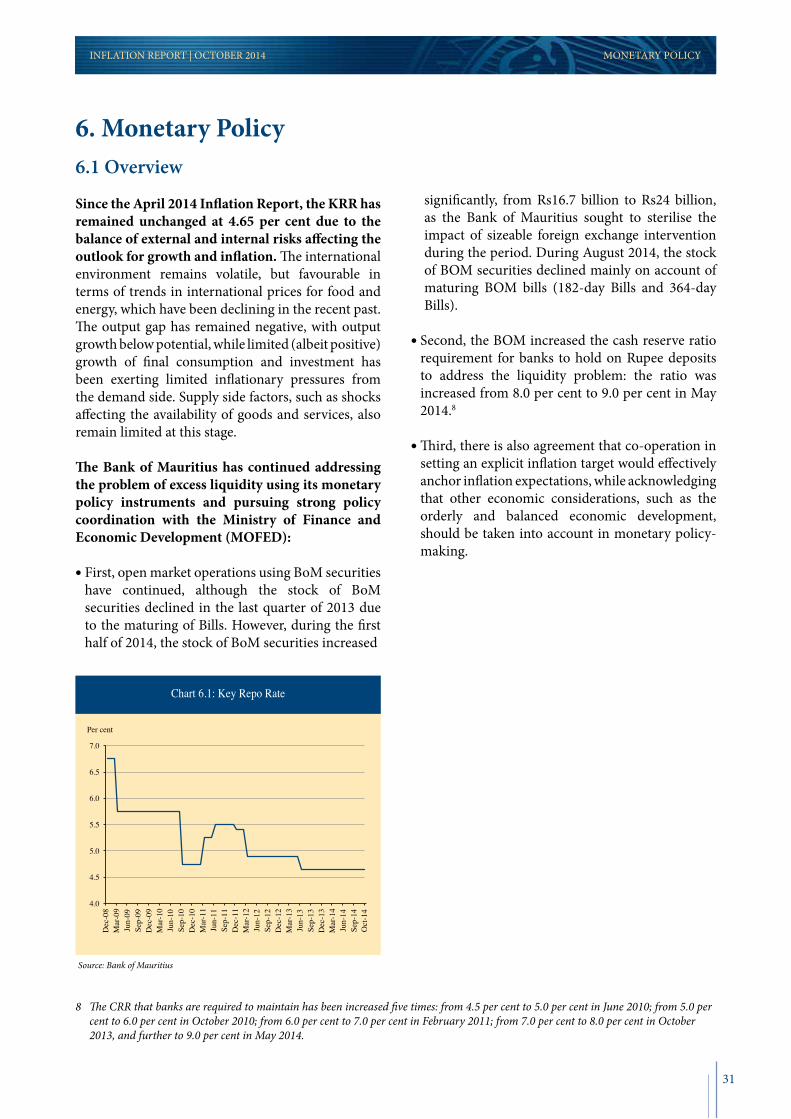
31
6.1 Overview
Since the April 2014 Inflation Report, the KRR has remained unchanged at 4.65 per cent due to the balance of external and internal risks affecting the outlook for growth and inflation. The international environment remains volatile, but favourable in terms of trends in international prices for food and energy, which have been declining in the recent past. The output gap has remained negative, with output growth below potential, while limited (albeit positive) growth of final consumption and investment has been exerting limited inflationary pressures from the demand side. Supply side factors, such as shocks affecting the availability of goods and services, also remain limited at this stage.
The Bank of Mauritius has continued addressing the problem of excess liquidity using its monetary policy instruments and pursuing strong policy coordination with the Ministry of Finance and Economic Development (MOFED):
First, open market operations using BoM securities have continued, although the stock of BoM securities declined in the last quarter of 2013 due to the maturing of Bills. However, during the first half of 2014, the stock of BoM securities increased
significantly, from Rs16.7 billion to Rs24 billion, as the Bank of Mauritius sought to sterilise the impact of sizeable foreign exchange intervention during the period. During August 2014, the stock of BOM securities declined mainly on account of maturing BOM bills (182-day Bills and 364-day Bills).
Second, the BOM increased the cash reserve ratio requirement for banks to hold on Rupee deposits to address the liquidity problem: the ratio was increased from 8.0 per cent to 9.0 per cent in May 2014.8
Third, there is also agreement that co-operation in setting an explicit inflation target would effectively anchor inflation expectations, while acknowledging that other economic considerations, such as the orderly and balanced economic development, should be taken into account in monetary policy-making.
INFLATION REPORT | OCTOBER 2014 MONETARY POLICY
6. Monetary Policy
Chart 6.1: Key Repo Rate
Per cent
4.0
4.5
5.0
5.5
6.0
6.5
7.0
Dec
-08
Mar
-09
Jun-
09
Sep-
09
Dec
-09
Mar
-10
Jun-
10
Sep-
10
Dec
-10
Mar
-11
Jun-
11
Sep-
11
Dec
-11
Mar
-12
Jun-
12
Sep-
12
Dec
-12
Mar
-13
Jun-
13
Sep-
13
Dec
-13
Mar
-14
Jun-
14
Sep-
14
Oct
-14
Source: Bank of Mauritius
8 The CRR that banks are required to maintain has been increased five times: from 4.5 per cent to 5.0 per cent in June 2010; from 5.0 per cent to 6.0 per cent in October 2010; from 6.0 per cent to 7.0 per cent in February 2011; from 7.0 per cent to 8.0 per cent in October 2013, and further to 9.0 per cent in May 2014.
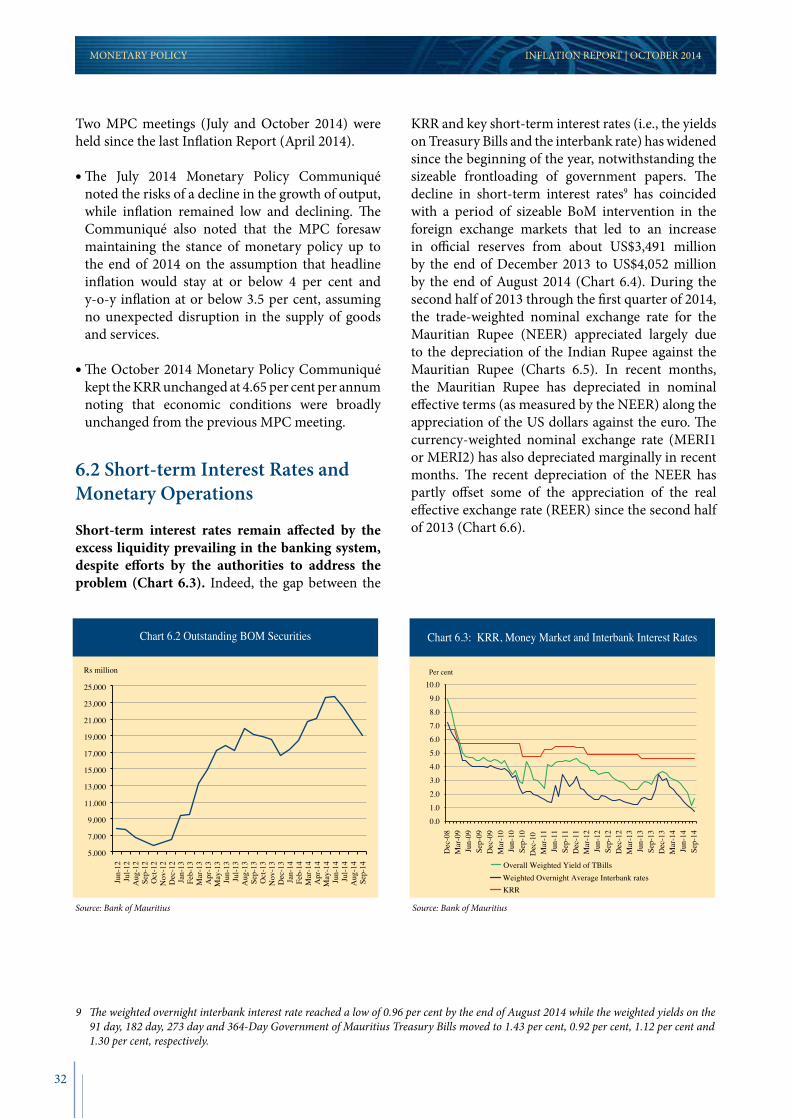
32
Two MPC meetings (July and October 2014) were held since the last Inflation Report (April 2014).
The July 2014 Monetary Policy Communiqué noted the risks of a decline in the growth of output, while inflation remained low and declining. The Communiqué also noted that the MPC foresaw maintaining the stance of monetary policy up to the end of 2014 on the assumption that headline inflation would stay at or below 4 per cent and y-o-y inflation at or below 3.5 per cent, assuming no unexpected disruption in the supply of goods and services.
The October 2014 Monetary Policy Communiqué kept the KRR unchanged at 4.65 per cent per annum noting that economic conditions were broadly unchanged from the previous MPC meeting.
6.2 Short-term Interest Rates and Monetary Operations
Short-term interest rates remain affected by the excess liquidity prevailing in the banking system, despite efforts by the authorities to address the problem (Chart 6.3). Indeed, the gap between the
KRR and key short-term interest rates (i.e., the yields on Treasury Bills and the interbank rate) has widened since the beginning of the year, notwithstanding the sizeable frontloading of government papers. The decline in short-term interest rates9 has coincided with a period of sizeable BoM intervention in the foreign exchange markets that led to an increase in official reserves from about US$3,491 million by the end of December 2013 to US$4,052 million by the end of August 2014 (Chart 6.4). During the second half of 2013 through the first quarter of 2014, the trade-weighted nominal exchange rate for the Mauritian Rupee (NEER) appreciated largely due to the depreciation of the Indian Rupee against the Mauritian Rupee (Charts 6.5). In recent months, the Mauritian Rupee has depreciated in nominal effective terms (as measured by the NEER) along the appreciation of the US dollars against the euro. The currency-weighted nominal exchange rate (MERI1 or MERI2) has also depreciated marginally in recent months. The recent depreciation of the NEER has partly offset some of the appreciation of the real effective exchange rate (REER) since the second half of 2013 (Chart 6.6).
INFLATION REPORT | OCTOBER 2014
Chart 6.2 Outstanding BOM Securities
Rs million
5,000
7,000
9,000
11,000
13,000
15,000
17,000
19,000
21,000
23,000
25,000
Jun-
12
Jul-1
2 A
ug-1
2 Se
p-12
O
ct-1
2 N
ov-1
2 D
ec-1
2 Ja
n-13
Fe
b-13
M
ar-1
3 A
pr-1
3 M
ay-1
3 Ju
n-13
Ju
l-13
Aug
-13
Sep-
13
Oct
-13
Nov
-13
Dec
-13
Jan-
14
Feb-
14
Mar
-14
Apr
-14
May
-14
Jun-
14
Jul-1
4 A
ug-1
4 Se
p-14
Source: Bank of Mauritius
Chart 6.3: KRR, Money Market and Interbank Interest Rates
Per cent
Overall Weighted Yield of TBills Weighted Overnight Average Interbank rates KRR
0.0
1.0
2.0
3.0
4.0
5.0
6.0
7.0
8.0
9.0
10.0
Dec
-08
Mar
-09
Jun-
09
Sep-
09
Dec
-09
Mar
-10
Jun-
10
Sep-
10
Dec
-10
M
ar-1
1 Ju
n-11
Se
p-11
D
ec-1
1 M
ar-1
2 Ju
n-12
Se
p-12
D
ec-1
2 M
ar-1
3 Ju
n-13
Se
p-13
D
ec-1
3 M
ar-1
4 Ju
n-14
Se
p-14
Source: Bank of Mauritius
9 The weighted overnight interbank interest rate reached a low of 0.96 per cent by the end of August 2014 while the weighted yields on the 91 day, 182 day, 273 day and 364-Day Government of Mauritius Treasury Bills moved to 1.43 per cent, 0.92 per cent, 1.12 per cent and 1.30 per cent, respectively.
MONETARY POLICY
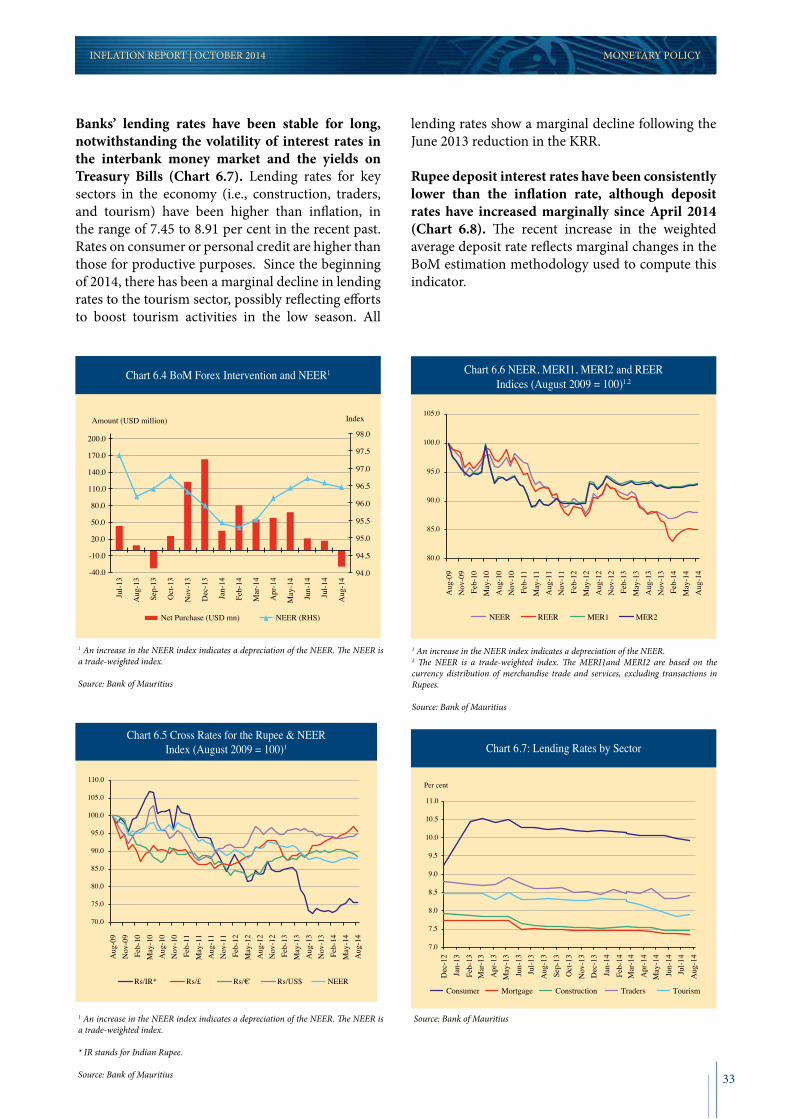
33
INFLATION REPORT | OCTOBER 2013 SECTION
Banks’ lending rates have been stable for long, notwithstanding the volatility of interest rates in the interbank money market and the yields on Treasury Bills (Chart 6.7). Lending rates for key sectors in the economy (i.e., construction, traders, and tourism) have been higher than inflation, in the range of 7.45 to 8.91 per cent in the recent past. Rates on consumer or personal credit are higher than those for productive purposes. Since the beginning of 2014, there has been a marginal decline in lending rates to the tourism sector, possibly reflecting efforts to boost tourism activities in the low season. All
lending rates show a marginal decline following the June 2013 reduction in the KRR.
Rupee deposit interest rates have been consistently lower than the inflation rate, although deposit rates have increased marginally since April 2014 (Chart 6.8). The recent increase in the weighted average deposit rate reflects marginal changes in the BoM estimation methodology used to compute this indicator.
INFLATION REPORT | OCTOBER 2014
Chart 6.7: Lending Rates by Sector
7.0
7.5
8.0
8.5
9.0
9.5
10.0
10.5
11.0
Dec
-12
Jan-
13
Feb-
13
Mar
-13
Apr
-13
May
-13
Jun-
13
Jul-1
3 A
ug-1
3 Se
p-13
O
ct-1
3 N
ov-1
3 D
ec-1
3 Ja
n-14
Fe
b-14
M
ar-1
4 A
pr-1
4 M
ay-1
4 Ju
n-14
Ju
l-14
Aug
-14
Consumer Mortgage Construction Traders Tourism
Per cent
Source: Bank of Mauritius
Chart 6.4 BoM Forex Intervention and NEER1
94.0
94.5
95.0
95.5
96.0
96.5
97.0
97.5
98.0
-40.0
-10.0
20.0
50.0
80.0
110.0
140.0
170.0
200.0
Jul-1
3
Aug
-13
Sep-
13
Oct
-13
Nov
-13
Dec
-13
Jan-
14
Feb-
14
Mar
-14
Apr
-14
May
-14
Jun-
14
Jul-1
4
Aug
-14
Net Purchase (USD mn) NEER (RHS)
Amount (USD million) Index
1 An increase in the NEER index indicates a depreciation of the NEER. The NEER is a trade-weighted index.
Source: Bank of Mauritius
Chart 6.6 NEER, MERI1, MERI2 and REERIndices (August 2009 = 100)1,2
80.0
85.0
90.0
95.0
100.0
105.0
Aug
-09
Nov
-09
Feb-
10
May
-10
Aug
-10
Nov
-10
Feb-
11
May
-11
Aug
-11
Nov
-11
Feb-
12
May
-12
Aug
-12
Nov
-12
Feb-
13
May
-13
Aug
-13
Nov
-13
Feb-
14
May
-14
Aug
-14
NEER REER MER1 MER2
1 An increase in the NEER index indicates a depreciation of the NEER.2 The NEER is a trade-weighted index. The MERI1and MERI2 are based on the currency distribution of merchandise trade and services, excluding transactions in Rupees.
Source: Bank of Mauritius
Chart 6.5 Cross Rates for the Rupee & NEERIndex (August 2009 = 100)1
70.0
75.0
80.0
85.0
90.0
95.0
100.0
105.0
110.0
Aug
-09
Nov
-09
Feb-
10
May
-10
Aug
-10
Nov
-10
Feb-
11
May
-11
Aug
-11
Nov
-11
Feb-
12
May
-12
Aug
-12
Nov
-12
Feb-
13
May
-13
Aug
-13
Nov
-13
Feb-
14
May
-14
Aug
-14
Rs/IR* Rs/£ Rs/€ Rs/US$ NEER
1 An increase in the NEER index indicates a depreciation of the NEER. The NEER is a trade-weighted index.
* IR stands for Indian Rupee.
Source: Bank of Mauritius
MONETARY POLICY
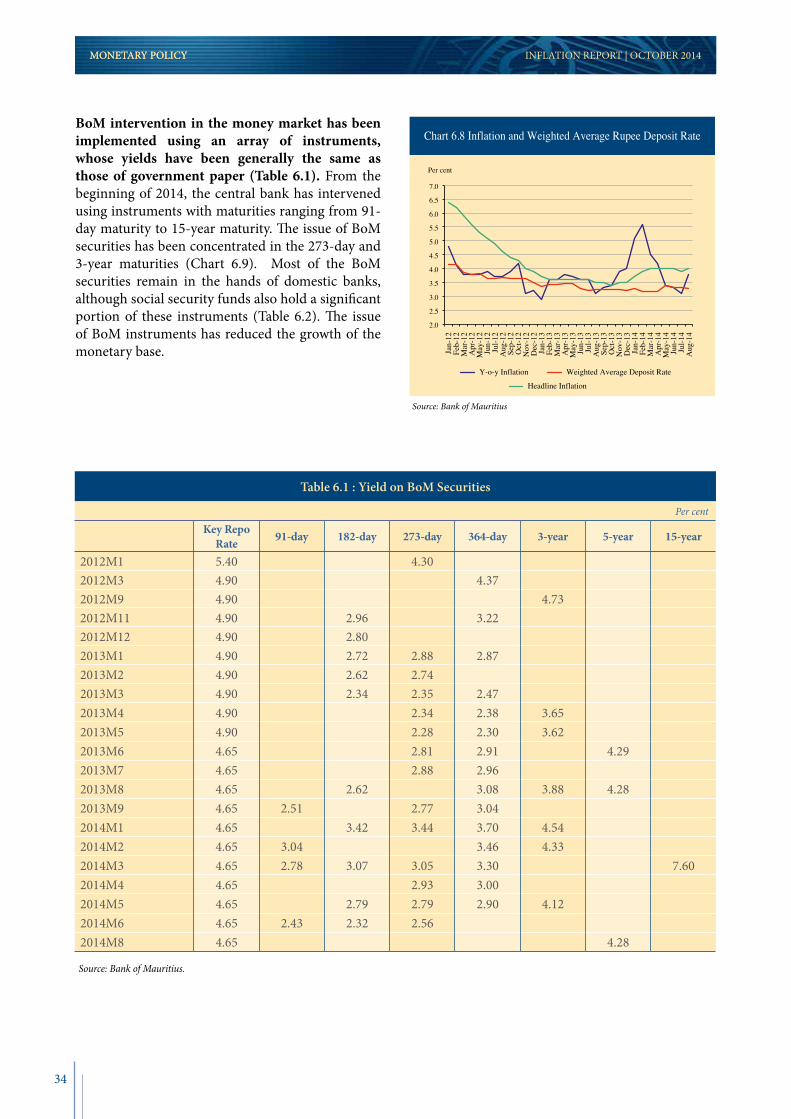
34
MONETARY POLICY INFLATION REPORT | OCTOBER 2014
BoM intervention in the money market has been implemented using an array of instruments, whose yields have been generally the same as those of government paper (Table 6.1). From the beginning of 2014, the central bank has intervened using instruments with maturities ranging from 91-day maturity to 15-year maturity. The issue of BoM securities has been concentrated in the 273-day and 3-year maturities (Chart 6.9). Most of the BoM securities remain in the hands of domestic banks, although social security funds also hold a significant portion of these instruments (Table 6.2). The issue of BoM instruments has reduced the growth of the monetary base.
Chart 6.8 Inflation and Weighted Average Rupee Deposit Rate
2.0
2.5
3.0
3.5
4.0
4.5
5.0
5.5
6.0
6.5
7.0
Jan-
12
Feb-
12
Mar
-12
Apr
-12
May
-12
Jun-
12
Jul-1
2 A
ug-1
2 Se
p-12
O
ct-1
2 N
ov-1
2 D
ec-1
2 Ja
n-13
Fe
b-13
M
ar-1
3 A
pr-1
3 M
ay-1
3 Ju
n-13
Ju
l-13
Aug
-13
Sep-
13
Oct
-13
Nov
-13
Dec
-13
Jan-
14
Feb-
14
Mar
-14
Apr
-14
May
-14
Jun-
14
Jul-1
4 A
ug-1
4
Y-o-y Inflation Weighted Average Deposit Rate
Headline Inflation
Per cent
Source: Bank of Mauritius
Table 6.1 : Yield on BoM Securities
Per cent
Key Repo Rate 91-day 182-day 273-day 364-day 3-year 5-year 15-year
2012M1 5.40 4.302012M3 4.90 4.372012M9 4.90 4.732012M11 4.90 2.96 3.222012M12 4.90 2.802013M1 4.90 2.72 2.88 2.872013M2 4.90 2.62 2.742013M3 4.90 2.34 2.35 2.472013M4 4.90 2.34 2.38 3.652013M5 4.90 2.28 2.30 3.622013M6 4.65 2.81 2.91 4.292013M7 4.65 2.88 2.962013M8 4.65 2.62 3.08 3.88 4.282013M9 4.65 2.51 2.77 3.042014M1 4.65 3.42 3.44 3.70 4.542014M2 4.65 3.04 3.46 4.332014M3 4.65 2.78 3.07 3.05 3.30 7.602014M4 4.65 2.93 3.002014M5 4.65 2.79 2.79 2.90 4.122014M6 4.65 2.43 2.32 2.562014M8 4.65 4.28
Source: Bank of Mauritius.
MONETARY POLICY
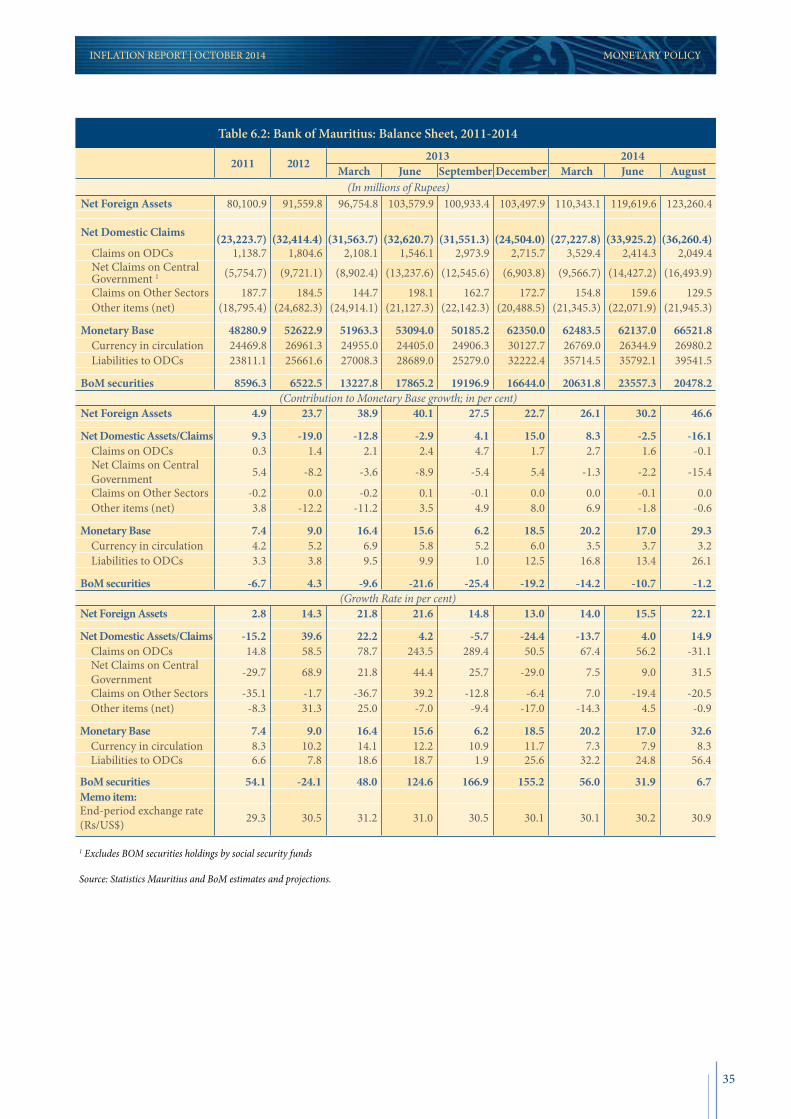
35
INFLATION REPORT | OCTOBER 2014
Table 6.2: Bank of Mauritius: Balance Sheet, 2011-2014
2011 2012 2013 2014March June September December March June August
(In millions of Rupees)Net Foreign Assets 80,100.9 91,559.8 96,754.8 103,579.9 100,933.4 103,497.9 110,343.1 119,619.6 123,260.4
Net Domestic Claims (23,223.7)
(32,414.4)
(31,563.7)
(32,620.7)
(31,551.3)
(24,504.0)
(27,227.8)
(33,925.2)
(36,260.4)
Claims on ODCs 1,138.7 1,804.6 2,108.1 1,546.1 2,973.9 2,715.7 3,529.4 2,414.3 2,049.4 Net Claims on Central
Government 1 (5,754.7) (9,721.1) (8,902.4) (13,237.6) (12,545.6) (6,903.8) (9,566.7) (14,427.2) (16,493.9)
Claims on Other Sectors 187.7 184.5 144.7 198.1 162.7 172.7 154.8 159.6 129.5 Other items (net) (18,795.4) (24,682.3) (24,914.1) (21,127.3) (22,142.3) (20,488.5) (21,345.3) (22,071.9) (21,945.3)
Monetary Base 48280.9 52622.9 51963.3 53094.0 50185.2 62350.0 62483.5 62137.0 66521.8 Currency in circulation 24469.8 26961.3 24955.0 24405.0 24906.3 30127.7 26769.0 26344.9 26980.2 Liabilities to ODCs 23811.1 25661.6 27008.3 28689.0 25279.0 32222.4 35714.5 35792.1 39541.5
BoM securities 8596.3 6522.5 13227.8 17865.2 19196.9 16644.0 20631.8 23557.3 20478.2(Contribution to Monetary Base growth; in per cent)
Net Foreign Assets 4.9 23.7 38.9 40.1 27.5 22.7 26.1 30.2 46.6
Net Domestic Assets/Claims 9.3 -19.0 -12.8 -2.9 4.1 15.0 8.3 -2.5 -16.1 Claims on ODCs 0.3 1.4 2.1 2.4 4.7 1.7 2.7 1.6 -0.1 Net Claims on Central
Government 5.4 -8.2 -3.6 -8.9 -5.4 5.4 -1.3 -2.2 -15.4
Claims on Other Sectors -0.2 0.0 -0.2 0.1 -0.1 0.0 0.0 -0.1 0.0 Other items (net) 3.8 -12.2 -11.2 3.5 4.9 8.0 6.9 -1.8 -0.6
Monetary Base 7.4 9.0 16.4 15.6 6.2 18.5 20.2 17.0 29.3 Currency in circulation 4.2 5.2 6.9 5.8 5.2 6.0 3.5 3.7 3.2 Liabilities to ODCs 3.3 3.8 9.5 9.9 1.0 12.5 16.8 13.4 26.1
BoM securities -6.7 4.3 -9.6 -21.6 -25.4 -19.2 -14.2 -10.7 -1.2(Growth Rate in per cent)
Net Foreign Assets 2.8 14.3 21.8 21.6 14.8 13.0 14.0 15.5 22.1
Net Domestic Assets/Claims -15.2 39.6 22.2 4.2 -5.7 -24.4 -13.7 4.0 14.9 Claims on ODCs 14.8 58.5 78.7 243.5 289.4 50.5 67.4 56.2 -31.1 Net Claims on Central
Government -29.7 68.9 21.8 44.4 25.7 -29.0 7.5 9.0 31.5
Claims on Other Sectors -35.1 -1.7 -36.7 39.2 -12.8 -6.4 7.0 -19.4 -20.5 Other items (net) -8.3 31.3 25.0 -7.0 -9.4 -17.0 -14.3 4.5 -0.9
Monetary Base 7.4 9.0 16.4 15.6 6.2 18.5 20.2 17.0 32.6 Currency in circulation 8.3 10.2 14.1 12.2 10.9 11.7 7.3 7.9 8.3 Liabilities to ODCs 6.6 7.8 18.6 18.7 1.9 25.6 32.2 24.8 56.4
BoM securities 54.1 -24.1 48.0 124.6 166.9 155.2 56.0 31.9 6.7Memo item:End-period exchange rate (Rs/US$) 29.3 30.5 31.2 31.0 30.5 30.1 30.1 30.2 30.9
1 Excludes BOM securities holdings by social security funds
Source: Statistics Mauritius and BoM estimates and projections.
MONETARY POLICY
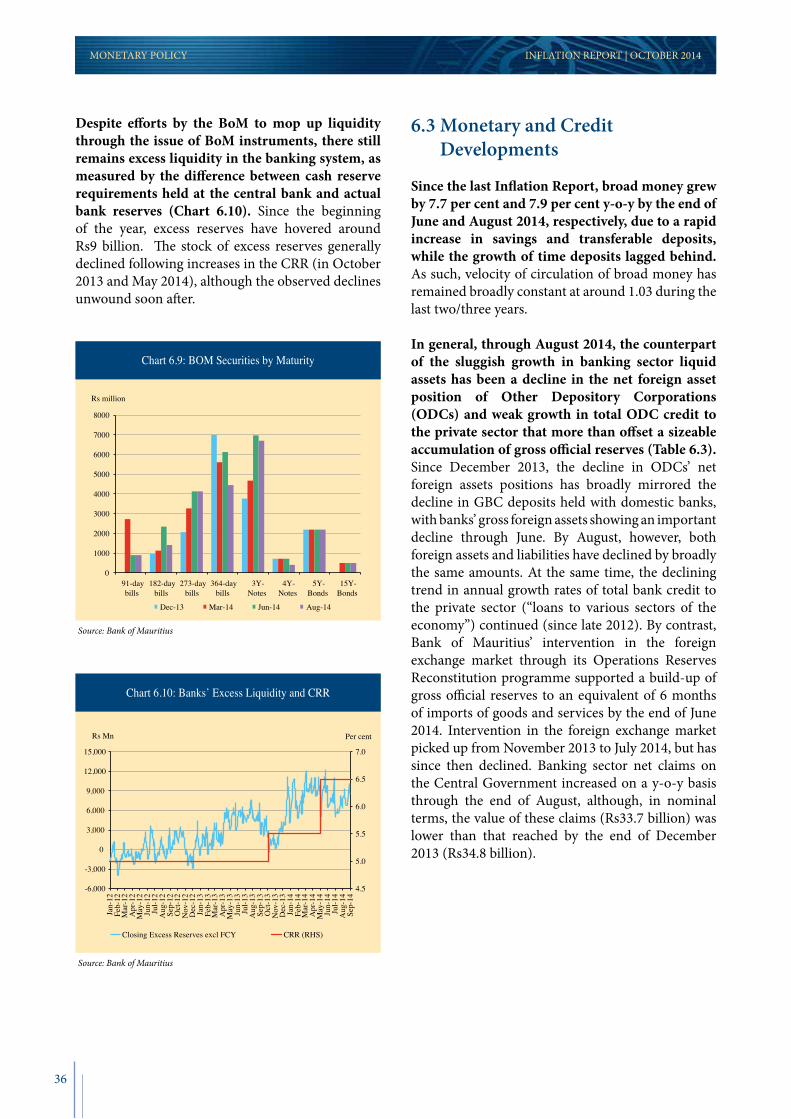
36
INFLATION REPORT | OCTOBER 2014
Despite efforts by the BoM to mop up liquidity through the issue of BoM instruments, there still remains excess liquidity in the banking system, as measured by the difference between cash reserve requirements held at the central bank and actual bank reserves (Chart 6.10). Since the beginning of the year, excess reserves have hovered around Rs9 billion. The stock of excess reserves generally declined following increases in the CRR (in October 2013 and May 2014), although the observed declines unwound soon after.
6.3 Monetary and Credit Developments
Since the last Inflation Report, broad money grew by 7.7 per cent and 7.9 per cent y-o-y by the end of June and August 2014, respectively, due to a rapid increase in savings and transferable deposits, while the growth of time deposits lagged behind. As such, velocity of circulation of broad money has remained broadly constant at around 1.03 during the last two/three years.
In general, through August 2014, the counterpart of the sluggish growth in banking sector liquid assets has been a decline in the net foreign asset position of Other Depository Corporations (ODCs) and weak growth in total ODC credit to the private sector that more than offset a sizeable accumulation of gross official reserves (Table 6.3). Since December 2013, the decline in ODCs’ net foreign assets positions has broadly mirrored the decline in GBC deposits held with domestic banks, with banks’ gross foreign assets showing an important decline through June. By August, however, both foreign assets and liabilities have declined by broadly the same amounts. At the same time, the declining trend in annual growth rates of total bank credit to the private sector (“loans to various sectors of the economy”) continued (since late 2012). By contrast, Bank of Mauritius’ intervention in the foreign exchange market through its Operations Reserves Reconstitution programme supported a build-up of gross official reserves to an equivalent of 6 months of imports of goods and services by the end of June 2014. Intervention in the foreign exchange market picked up from November 2013 to July 2014, but has since then declined. Banking sector net claims on the Central Government increased on a y-o-y basis through the end of August, although, in nominal terms, the value of these claims (Rs33.7 billion) was lower than that reached by the end of December 2013 (Rs34.8 billion).
Chart 6.9: BOM Securities by Maturity
0
1000
2000
3000
4000
5000
6000
7000
8000
91-daybills
182-daybills
273-daybills
364-daybills
3Y-Notes
4Y-Notes
5Y-Bonds
15Y-Bonds
Dec-13 Mar-14 Jun-14 Aug-14
Rs million
Source: Bank of Mauritius
Chart 6.10: Banks’ Excess Liquidity and CRR
4.5
5.0
5.5
6.0
6.5
7.0
-6,000
6,000
9,000
12,000
15,000
Jan-
12
Feb-
12
Mar
-12
Apr
-12
May
-12
Jun-
12
Jul-1
2 A
ug-1
2 Se
p-12
O
ct-1
2 N
ov-1
2 D
ec-1
2 Ja
n-13
Fe
b-13
M
ar-1
3 A
pr-1
3 M
ay-1
3 Ju
n-13
Ju
l-13
Aug
-13
Sep-
13
Oct
-13
Nov
-13
Dec
-13
Jan-
14
Feb-
14
Mar
-14
Apr
-14
May
-14
Jun-
14
Jul-1
4 A
ug-1
4 Se
p-14
Closing Excess Reserves excl FCY CRR (RHS)
Rs Mn Per cent
-3,000
0
3,000
Source: Bank of Mauritius
MONETARY POLICY
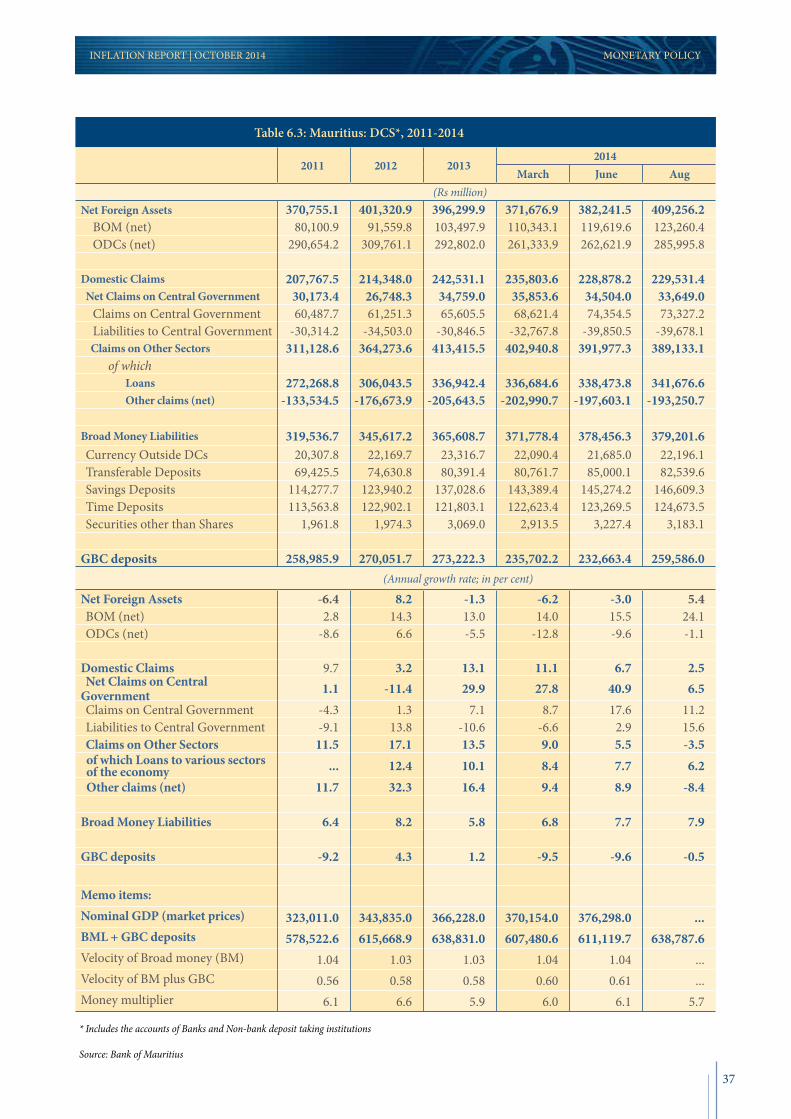
37
INFLATION REPORT | OCTOBER 2014
Table 6.3: Mauritius: DCS*, 2011-2014
2011 2012 20132014
March June Aug(Rs million)
Net Foreign Assets 370,755.1 401,320.9 396,299.9 371,676.9 382,241.5 409,256.2 BOM (net) 80,100.9 91,559.8 103,497.9 110,343.1 119,619.6 123,260.4 ODCs (net) 290,654.2 309,761.1 292,802.0 261,333.9 262,621.9 285,995.8
Domestic Claims 207,767.5 214,348.0 242,531.1 235,803.6 228,878.2 229,531.4 Net Claims on Central Government 30,173.4 26,748.3 34,759.0 35,853.6 34,504.0 33,649.0 Claims on Central Government 60,487.7 61,251.3 65,605.5 68,621.4 74,354.5 73,327.2 Liabilities to Central Government -30,314.2 -34,503.0 -30,846.5 -32,767.8 -39,850.5 -39,678.1 Claims on Other Sectors 311,128.6 364,273.6 413,415.5 402,940.8 391,977.3 389,133.1 of which Loans 272,268.8 306,043.5 336,942.4 336,684.6 338,473.8 341,676.6 Other claims (net) -133,534.5 -176,673.9 -205,643.5 -202,990.7 -197,603.1 -193,250.7
Broad Money Liabilities 319,536.7 345,617.2 365,608.7 371,778.4 378,456.3 379,201.6 Currency Outside DCs 20,307.8 22,169.7 23,316.7 22,090.4 21,685.0 22,196.1 Transferable Deposits 69,425.5 74,630.8 80,391.4 80,761.7 85,000.1 82,539.6 Savings Deposits 114,277.7 123,940.2 137,028.6 143,389.4 145,274.2 146,609.3 Time Deposits 113,563.8 122,902.1 121,803.1 122,623.4 123,269.5 124,673.5 Securities other than Shares 1,961.8 1,974.3 3,069.0 2,913.5 3,227.4 3,183.1
GBC deposits 258,985.9 270,051.7 273,222.3 235,702.2 232,663.4 259,586.0(Annual growth rate; in per cent)
Net Foreign Assets -6.4 8.2 -1.3 -6.2 -3.0 5.4 BOM (net) 2.8 14.3 13.0 14.0 15.5 24.1 ODCs (net) -8.6 6.6 -5.5 -12.8 -9.6 -1.1
Domestic Claims 9.7 3.2 13.1 11.1 6.7 2.5 Net Claims on Central Government 1.1 -11.4 29.9 27.8 40.9 6.5 Claims on Central Government -4.3 1.3 7.1 8.7 17.6 11.2 Liabilities to Central Government -9.1 13.8 -10.6 -6.6 2.9 15.6 Claims on Other Sectors 11.5 17.1 13.5 9.0 5.5 -3.5 of which Loans to various sectors of the economy ... 12.4 10.1 8.4 7.7 6.2
Other claims (net) 11.7 32.3 16.4 9.4 8.9 -8.4
Broad Money Liabilities 6.4 8.2 5.8 6.8 7.7 7.9
GBC deposits -9.2 4.3 1.2 -9.5 -9.6 -0.5
Memo items:Nominal GDP (market prices) 323,011.0 343,835.0 366,228.0 370,154.0 376,298.0 ...BML + GBC deposits 578,522.6 615,668.9 638,831.0 607,480.6 611,119.7 638,787.6Velocity of Broad money (BM) 1.04 1.03 1.03 1.04 1.04 ...Velocity of BM plus GBC 0.56 0.58 0.58 0.60 0.61 ...Money multiplier 6.1 6.6 5.9 6.0 6.1 5.7
* Includes the accounts of Banks and Non-bank deposit taking institutions
Source: Bank of Mauritius
MONETARY POLICY

38
The growth rate of bank credit to the private sector (excluding credit to GBC entities) declined from 5.9 per cent by the end of 2013 to 3.6 per cent by the end of June 2014 and to 0.5 per cent by the end of August 2014 (Table 6.4 & Charts 6.11). The slowing in credit mainly reflected a deceleration in the growth of corporate credit, while growth in household credit has also declined. The observed slowing in corporate credit is broad-based. Sectors contributing to the deceleration have been construction, financial and business services, tourism, and traders. Consumer credit to households, which accelerated in 2013, has now slowed down.
INFLATION REPORT | OCTOBER 2014
Chart 6.11: Y-o-y Growth in Banks’ Credit to Private Sector 1
-5
0
5
10
15
20
Jan-
11
Feb-
11
Mar
-11
Apr
-11
May
-11
Jun-
11
Jul-1
1 A
ug-1
1 Se
p-11
O
ct-1
1 N
ov-1
1 D
ec-1
1 Ja
n-12
Fe
b-12
M
ar-1
2 A
pr-1
2 M
ay-1
2 Ju
n-12
Ju
l-12
Aug
-12
Sep-
12
Oct
-12
Nov
-12
Dec
-12
Jan-
13
Feb-
13
Mar
-13
Apr
-13
May
-13
Jun-
13
Jul-1
3 A
ug-1
3 Se
p-13
O
ct-1
3 N
ov-1
3 D
ec-1
3 Ja
n-14
Fe
b-14
M
ar-1
4 A
pr-1
4 M
ay-1
4 Ju
n-14
Ju
l-14
Aug
-14
Y-o-y growth in total Banks' credit to private sector Y-o-y growth in Banks' credit to corporates Y-o-y growth in Banks' credit to household
Per cent
1 Excludes loans to GBC entities.
Source: Bank of Mauritius
Table 6.4 Bank Credit to Private Sector 1
2005-2011 2012-14 2013-14(Average annual growth rates; in per cent)
Total credit to private sector 12.0 5.6 3.8Corporates 11.2 3.0 0.8 Construction 26.9 10.6 5.3 Tourism 18.3 5.3 5.5 Traders 9.5 2.8 1.3 Financial services 14.3 -2.8 -5.0 Manufacturing 3.7 1.1 0.5 Agriculture & Fishing 12.9 7.6 6.5 Other 1.9 -3.4 -10.0Households 14.9 12.9 11.9 Personal credit 11.4 15.0 15.3 Mortgages 17.6 11.6 9.9
(Contribution to growth of total credit to private sector; in per cent)Total credit to private sector 12.0 5.6 3.8Corporates 8.7 2.2 0.6 Construction 1.6 1.0 0.6 Tourism 2.8 0.9 1.0 Traders 1.2 0.3 0.1 Financial services 1.5 -0.3 -0.5 Manufacturing 0.4 0.1 0.0 Agriculture & Fishing 0.8 0.5 0.4 Other 0.3 -0.3 -0.9Households 3.3 3.4 3.2 Personal credit 1.1 1.5 1.6 Mortgages 2.2 1.8 1.6
1 Data up to August 2014
Source: Bank of Mauritius
MONETARY POLICY
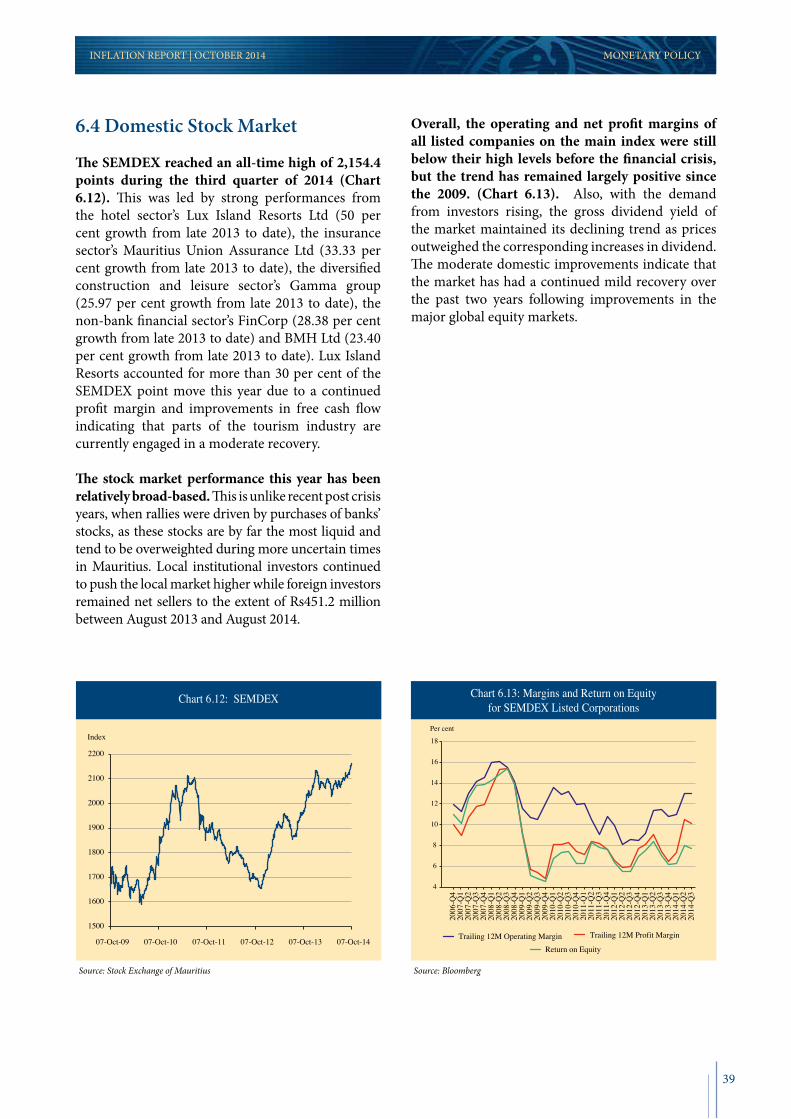
39
6.4 Domestic Stock Market
The SEMDEX reached an all-time high of 2,154.4 points during the third quarter of 2014 (Chart 6.12). This was led by strong performances from the hotel sector’s Lux Island Resorts Ltd (50 per cent growth from late 2013 to date), the insurance sector’s Mauritius Union Assurance Ltd (33.33 per cent growth from late 2013 to date), the diversified construction and leisure sector’s Gamma group (25.97 per cent growth from late 2013 to date), the non-bank financial sector’s FinCorp (28.38 per cent growth from late 2013 to date) and BMH Ltd (23.40 per cent growth from late 2013 to date). Lux Island Resorts accounted for more than 30 per cent of the SEMDEX point move this year due to a continued profit margin and improvements in free cash flow indicating that parts of the tourism industry are currently engaged in a moderate recovery.
The stock market performance this year has been relatively broad-based. This is unlike recent post crisis years, when rallies were driven by purchases of banks’ stocks, as these stocks are by far the most liquid and tend to be overweighted during more uncertain times in Mauritius. Local institutional investors continued to push the local market higher while foreign investors remained net sellers to the extent of Rs451.2 million between August 2013 and August 2014.
Overall, the operating and net profit margins of all listed companies on the main index were still below their high levels before the financial crisis, but the trend has remained largely positive since the 2009. (Chart 6.13). Also, with the demand from investors rising, the gross dividend yield of the market maintained its declining trend as prices outweighed the corresponding increases in dividend. The moderate domestic improvements indicate that the market has had a continued mild recovery over the past two years following improvements in the major global equity markets.
INFLATION REPORT | OCTOBER 2014
Chart 6.12: SEMDEX
1500
1600
1700
1800
1900
2000
2100
2200
07-Oct-09 07-Oct-10 07-Oct-11 07-Oct-12 07-Oct-13 07-Oct-14
Index
Source: Stock Exchange of Mauritius
Chart 6.13: Margins and Return on Equityfor SEMDEX Listed Corporations
4
6
8
10
12
14
16
18
2006
-Q4
2007
-Q1
2007
-Q2
2007
-Q3
2007
-Q4
2008
-Q1
2008
-Q2
2008
-Q3
2008
-Q4
2009
-Q1
2009
-Q2
2009
-Q3
2009
-Q4
2010
-Q1
2010
-Q2
2010
-Q3
2010
-Q4
2011
-Q1
2011
-Q2
2011
-Q3
2011
-Q4
2012
-Q1
2012
-Q2
2012
-Q3
2012
-Q4
2013
-Q1
2013
-Q2
2013
-Q3
2013
-Q4
2014
-Q1
2014
-Q2
2014
-Q3
Trailing 12M Operating Margin Trailing 12M Profit Margin
Return on Equity
Per cent
Source: Bloomberg
MONETARY POLICY

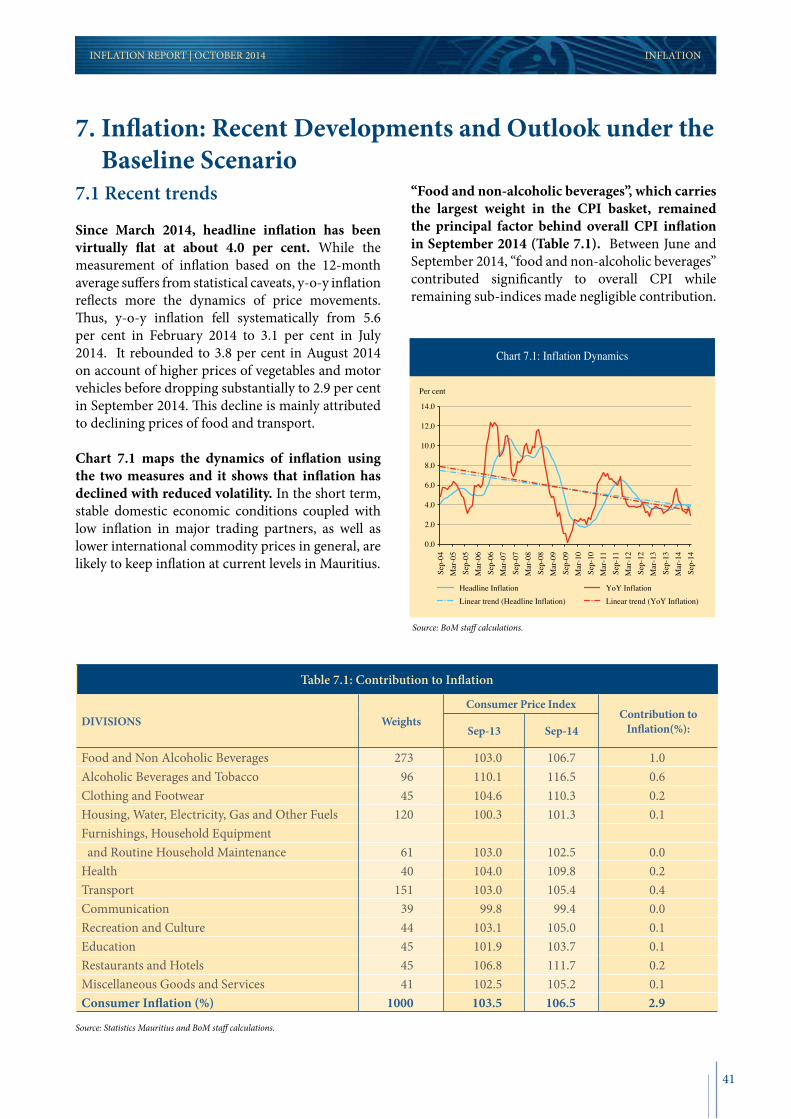
41
7.1 Recent trends
Since March 2014, headline inflation has been virtually flat at about 4.0 per cent. While the measurement of inflation based on the 12-month average suffers from statistical caveats, y-o-y inflation reflects more the dynamics of price movements. Thus, y-o-y inflation fell systematically from 5.6 per cent in February 2014 to 3.1 per cent in July 2014. It rebounded to 3.8 per cent in August 2014 on account of higher prices of vegetables and motor vehicles before dropping substantially to 2.9 per cent in September 2014. This decline is mainly attributed to declining prices of food and transport.
Chart 7.1 maps the dynamics of inflation using the two measures and it shows that inflation has declined with reduced volatility. In the short term, stable domestic economic conditions coupled with low inflation in major trading partners, as well as lower international commodity prices in general, are likely to keep inflation at current levels in Mauritius.
“Food and non-alcoholic beverages”, which carries the largest weight in the CPI basket, remained the principal factor behind overall CPI inflation in September 2014 (Table 7.1). Between June and September 2014, “food and non-alcoholic beverages” contributed significantly to overall CPI while remaining sub-indices made negligible contribution.
INFLATION REPORT | OCTOBER 2014 INFLATION
7. Inflation: Recent Developments and Outlook under the Baseline Scenario
Chart 7.1: Inflation Dynamics
0.0
2.0
4.0
6.0
8.0
10.0
12.0
14.0
Sep-
04
Mar
-05
Sep-
05
Mar
-06
Sep-
06
Mar
-07
Sep-
07
Mar
-08
Sep-
08
Mar
-09
Sep-
09
Mar
-10
Sep-
10
Mar
-11
Sep-
11
Mar
-12
Sep-
12
Mar
-13
Sep-
13
Mar
-14
Sep-
14
Headline Inflation YoY Inflation Linear trend (Headline Inflation) Linear trend (YoY Inflation)
Per cent
Source: BoM staff calculations.
Table 7.1: Contribution to Inflation
DIVISIONS Weights Consumer Price Index
Contribution to Inflation(%):Sep-13 Sep-14
Food and Non Alcoholic Beverages 273 103.0 106.7 1.0Alcoholic Beverages and Tobacco 96 110.1 116.5 0.6Clothing and Footwear 45 104.6 110.3 0.2Housing, Water, Electricity, Gas and Other Fuels 120 100.3 101.3 0.1Furnishings, Household Equipment and Routine Household Maintenance 61 103.0 102.5 0.0Health 40 104.0 109.8 0.2Transport 151 103.0 105.4 0.4Communication 39 99.8 99.4 0.0Recreation and Culture 44 103.1 105.0 0.1Education 45 101.9 103.7 0.1Restaurants and Hotels 45 106.8 111.7 0.2Miscellaneous Goods and Services 41 102.5 105.2 0.1Consumer Inflation (%) 1000 103.5 106.5 2.9
Source: Statistics Mauritius and BoM staff calculations.

42
While the majority of the inflation measures depicted stability and subdued price pressures, the movements in food price inflation and goods inflation were noteworthy (Table 7.2). The dynamics in these two measures were reflected through the volatilities in price of vegetables on the domestic market, food products and motor vehicles.
Y-o-y core inflation measures mirrored more or less CPI inflation trends; albeit the two measures charted different paths. Y-o-y CORE1 inflation declined further to 2.3 per cent in 2014Q3 while Y-o-y CORE2 inflation dropped to 3.3 per cent. The higher CORE2 inflation rate compared to CORE1 and CPI inflation rates points to downward rigidity of prices other than administered energy prices in the CPI basket.
Results of the August 2014 Inflation Expectations Survey pointed to lower inflation expectations for the different time horizons, compared with the previous survey period. The mean headline inflation rates expected by respondents were 4.1 per cent, 4.3 per cent and 4.5 per cent, respectively, for the twelve months ending December 2014 and June 2015, and for a year ahead compared with 4.4 per cent, 4.6 per cent and 4.7 per cent respectively, for December 2014, a year ahead and June 2015 for the survey month of May 2014.
7.2 Inflation Projection and Output Gap in Baseline Scenario
Using the Bank’s forecasting model (Box 1) and under the baseline scenario, CPI inflation is expected to decline marginally during the fourth quarter of 2014 and the first quarter of 2015, from its third quarter level, but it will temporarily rise over the following 3 quarters. Y-o-y inflation is projected at 3.1 per cent in the fourth quarter of 2014 and 2.8 per cent in the first quarter of 2015, compared with 3.3 per cent in the third quarter of 2014. The projected inflation dynamics reflects trends with food and non-food inflation, resulting from sluggish growth of domestic absorption, weak global growth (that lowers imported inflation), and an improvement in Mauritius’ terms of trade along the stability of international prices for food and energy. Starting 2015Q2, however, seasonal and other exogenous factors would bring about an acceleration of inflation through the end of 2015 (to an average of 4.8 per cent). During 2016, CPI inflation should gradually converge to 4 per cent.
The domestic output gap, which is also estimated using the Bank’s forecasting macro model, is projected to remain negative through 2016 (Chart 7.2). The model’s estimate is consistent with the information arising from: (i) the national accounts (moderate growth of final consumption’s and investment’s weak growth, and volatile leading economic indicators); (ii) the balance of payments (measured growth of import commodity volumes that are improving the trade balance); and (iii) the slowdown in bank credit to corporations and households.
INFLATION INFLATION REPORT | OCTOBER 2014
Table 7.2: Measures of Inflation
(Per cent)
Period Food price inflation CPIX_M* Imported
inflationGoods
inflationServices inflation Core1 Core2 TRIM10
inflationJun-14 4.0 3.4 3.4 3.3 3.2 2.7 3.2 3.2Jul-14 3.6 3.2 3.0 3.4 2.6 2.7 3.2 2.3Aug-14 6.1 3.9 3.3 4.5 2.5 2.7 3.5 3.1Sep-14 3.7 3.0 2.5 3.1 2.5 2.3 3.3 3.1
* Refers to CPI excluding mortgage payments in inflation.
Source: Bank of Mauritius

43
INFLATION REPORT | OCTOBER 2014 INFLATION
Box 1. Bank of Mauritius Output Gap and Inflation Forecasting Model
The BoM’s model is a New Keynesian Model for an open economy, formulated in terms of differences between the actuals or projected macro variables against the value of those variables in the “steady state.” The latter could be broadly interpreted as smooth filtered values for historic variables used in the model. In terms of levels (rather than in terms of differences from the steady state values), the model could be sum-marized as containing:
An IS curve,10 where output is a function of the expected domestic output, expected output in main trading partners, the real interest rate, and the real effective exchange rate;
A Phillips curve, where domestic current inflation is a function of past and expected domestic inflation, imported inflation, domestic output, and output in trading partners;
An interest rate rule, or “Taylor Rule,” where the real interest rate is a function of the lagged real interest rate, expected inflation deviation from the target, and output, and;
An interest parity condition equation, where the level of the exchange rate is a function of the ex-pected exchange rate, the nominal interest rate differential between Mauritius and the rest of the world, and the domestic risk premium.
While some parameters of the model have been estimated using e-views and other standard statistical pack-ages, certain parameters estimations have been (are) done using the Matlab software platform.
Chart 7.2: Output Gap
-1.2 2011-Q4 2012-Q4 2013-Q4 2014-Q4 2015-Q4 2016-Q4
-1
-0.6
-0.8
-0.4
-0.2
0
0.2
0.4
0.6 Output Gap, % of GDP
Source: BoM staff calculations.
10 The IS curve relates changes in real interest rates on output growth (i.e., lower interest rates increase investment and growth). In an open economy, the IS curve adds the impact on the real exchange rate on output growth (i.e., a more depreciated real exchange rate improves the external balance and fuels growth).

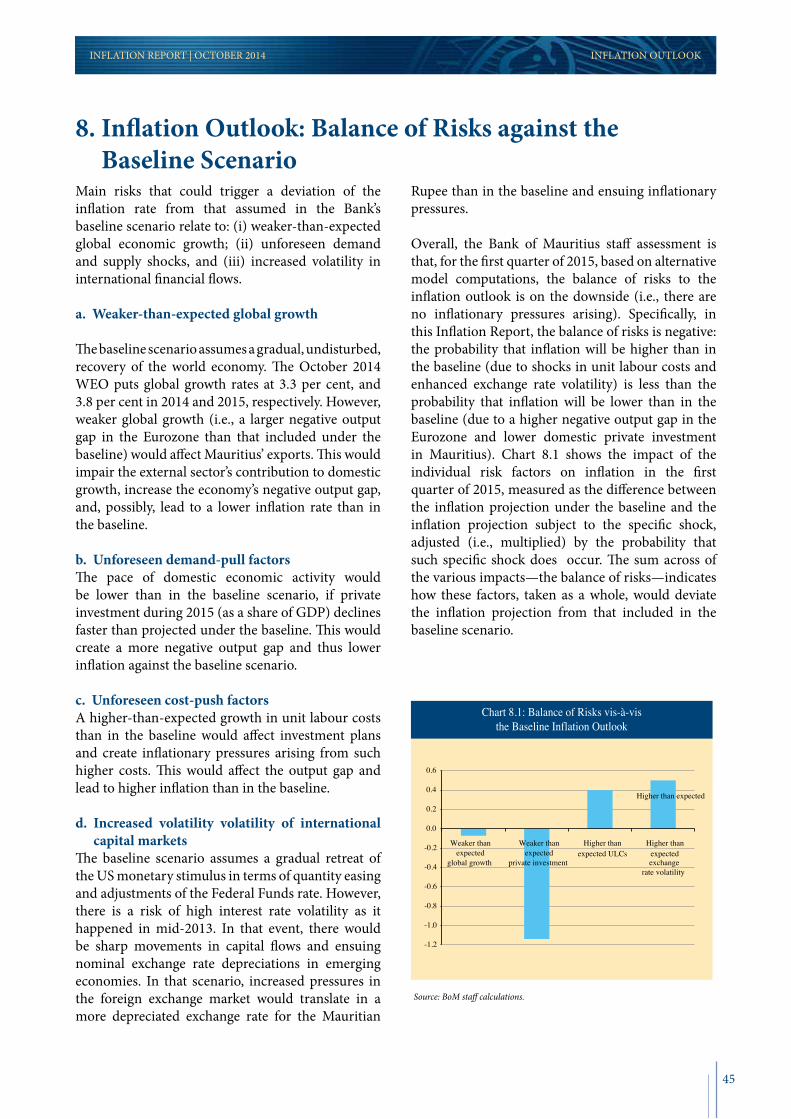
45
Main risks that could trigger a deviation of the inflation rate from that assumed in the Bank’s baseline scenario relate to: (i) weaker-than-expected global economic growth; (ii) unforeseen demand and supply shocks, and (iii) increased volatility in international financial flows.
a. Weaker-than-expected global growth
The baseline scenario assumes a gradual, undisturbed, recovery of the world economy. The October 2014 WEO puts global growth rates at 3.3 per cent, and 3.8 per cent in 2014 and 2015, respectively. However, weaker global growth (i.e., a larger negative output gap in the Eurozone than that included under the baseline) would affect Mauritius’ exports. This would impair the external sector’s contribution to domestic growth, increase the economy’s negative output gap, and, possibly, lead to a lower inflation rate than in the baseline.
b. Unforeseen demand-pull factorsThe pace of domestic economic activity would be lower than in the baseline scenario, if private investment during 2015 (as a share of GDP) declines faster than projected under the baseline. This would create a more negative output gap and thus lower inflation against the baseline scenario.
c. Unforeseen cost-push factorsA higher-than-expected growth in unit labour costs than in the baseline would affect investment plans and create inflationary pressures arising from such higher costs. This would affect the output gap and lead to higher inflation than in the baseline.
d. Increased volatility volatility of international capital markets
The baseline scenario assumes a gradual retreat of the US monetary stimulus in terms of quantity easing and adjustments of the Federal Funds rate. However, there is a risk of high interest rate volatility as it happened in mid-2013. In that event, there would be sharp movements in capital flows and ensuing nominal exchange rate depreciations in emerging economies. In that scenario, increased pressures in the foreign exchange market would translate in a more depreciated exchange rate for the Mauritian
Rupee than in the baseline and ensuing inflationary pressures.
Overall, the Bank of Mauritius staff assessment is that, for the first quarter of 2015, based on alternative model computations, the balance of risks to the inflation outlook is on the downside (i.e., there are no inflationary pressures arising). Specifically, in this Inflation Report, the balance of risks is negative: the probability that inflation will be higher than in the baseline (due to shocks in unit labour costs and enhanced exchange rate volatility) is less than the probability that inflation will be lower than in the baseline (due to a higher negative output gap in the Eurozone and lower domestic private investment in Mauritius). Chart 8.1 shows the impact of the individual risk factors on inflation in the first quarter of 2015, measured as the difference between the inflation projection under the baseline and the inflation projection subject to the specific shock, adjusted (i.e., multiplied) by the probability that such specific shock does occur. The sum across of the various impacts—the balance of risks—indicates how these factors, taken as a whole, would deviate the inflation projection from that included in the baseline scenario.
INFLATION REPORT | OCTOBER 2014 INFLATION OUTLOOK
8. Inflation Outlook: Balance of Risks against the Baseline Scenario
Chart 8.1: Balance of Risks vis-à-visthe Baseline Inflation Outlook
-1.2
-1.0
-0.8
-0.6
-0.4
-0.2
0.0
0.2
0.4
0.6
Weaker than expected
Higher than expected ULCs
Higher than expected
Higher than expected
exchangerate volatility
global growth
Weaker than expected
private investment
Source: BoM staff calculations.


47
The inflation projection, based on the Bank’s short-term forecasting model, is that, under the baseline scenario, CPI inflation will marginally decline during the fourth quarter of 2014 and the first quarter of 2015 (to an average of 2.9 per cent) with respect to the annual inflation rate registered in the third quarter of 2014 (3.3 per cent), although there will be some temporary (seasonal) inflationary pressures arising during the last three quarters of 2015. During 2016, CPI inflation should gradually converge to 4 per cent.
INFLATION REPORT | OCTOBER 2014 CONCLUDING REMARKS
9. Concluding Remarks

48
List of Tables
Table 1.1 Mauritius – Selected Economic Indicators, 2011 - 2014 4
Table 2.1 Real Growth Rates in Selected Economies 6
Table 2.2 Consumer Price Inflation in Selected Economies 7
Table 2.3 Monetary Policy Stance 9
Table 3.1 GDP - Sectoral Growth Rates, Volume Terms 12
Table 3.2 Sectoral Growth Rates, Volume Terms 13
Table 3.3 Comparison of 2014 Real GDP Growth Rate Projections 13
Table 3.4 Domestic and External Demand 15
Table 4.1 Statement of Budgetary Central Government Operations 19
Table 4.2 Public Sector Debt 20
Table 4.3 Government External Debt by Interest Rate Mix 21
Table 5.1 Balance of Payments Summary, 2012-2014H1 23
Table 5.2 Exports and Imports by SITC 24
Table 5.3 Balance of Payments, 2010 – 2014 25
Table 5.4 International Terms of Trade (Index: 2007 = 100) 27
Table 5.5 Saving-Investment Balance 29
Table 6.1 Yield on BoM Securities 34
Table 6.2 Bank of Mauritius: Balance Sheet, 2011-2014 35
Table 6.3 Mauritius: DCS, 2011-2014 37
Table 6.4 Bank Credit to Private Sector 38
Table 7.1 Contribution to Inflation 41
Table 7.2 Measures of Inflation 42
List of ChartsChart 2.1 Stock Market Indices 9
Chart 3.1 Y-o-y Growth Rates of Leading Indicators of Economic Activity 14
Chart 3.2 Export-Oriented Enterprises, Unit Labour Costs 16
Chart 3.3 Export-Oriented Enterprises, Labour Productivity & Wages 16
Chart 4.1 Overall Central Government Deficit and Primary Balance 17
Chart 4.2 Central Government Revenue 17
Chart 4.3 Central Government Expenditure 18
Chart 4.4 Government Deposits with BoM 18
LIST OF TABLES, CHARTS AND BOXES INFLATION REPORT | OCTOBER 2014
49
Chart 4.5 Frontloading of Public Debt Issue 18
Chart 4.6 Public Debt 21
Chart 5.1 Components of the Current Account, 2010H1-2014H1 23
Chart 5.2 Domestic Exports and Imports 24
Chart 5.3 India Stock Market Index 26
Chart 5.4 Gross Official International Reserves and Import Coverage 26
Chart 5.5 Sugar Prices 27
Chart 5.6 Crude Oil Prices 28
Chart 5.7 FAO Food Price Index 28
Chart 5.8 Maize and Wheat Prices 28
Chart 6.1 Key Repo Rate 31
Chart 6.2 Outstanding BOM Securities 32
Chart 6.3 KRR, Money Market and Interbank Interest Rates 32
Chart 6.4 BoM Forex Intervention and NEER 33
Chart 6.5 Cross Rates for the Rupee & NEER Index 33
Chart 6.6 NEER, MERI1, MERI2 and REER Indices 33
Chart 6.7 Lending Rates by Sector 33
Chart 6.8 Inflation and Weighted Average Rupee Deposit Rate 34
Chart 6.9 BOM Securities by Maturity 36
Chart 6.10 Banks’ Excess Liquidity and CRR 36
Chart 6.11 Y-o-y Growth in Banks’ Credit to Private Sector 38
Chart 6.12 SEMDEX 39
Chart 6.13 Margins and Return on Equity for SEMDEX Listed Corporations 39
Chart 7.1 Inflation Dynamics 41
Chart 7.2 Output Gap 42
Chart 8.1 Balance of Risks vis-à-vis the Baseline Inflation Outlook 45
List of Boxes
Box I Bank of Mauritius Output Gap and Inflation Forecasting Model 43
INFLATION REPORT | OCTOBER 2014 LIST OF TABLES, CHARTS AND BOXES
50
LIST OF ACRONYMS INFLATION REPORT | OCTOBER 2014
List of Acronyms
BoE Bank of England
BoJ Bank of Japan
BML Broad Money Liabilities
CIF Cost, Insurance and Freight
CPI Consumer Price Index
DXY Trade Weighted Dollar Index
ECB European Central Bank
EMDE’s Emerging Market and Developing Economies
FAO Food and Agriculture Organisation of the United Nations
FED Federal Reserve Bank
FOB Free on Board
FOMC Federal Open Market Committee
GBC1s Global Business Companies with a Type 1 Licence
GDFCF Gross Domestic Fixed Capital Formation
GDP Gross Domestic Product
GMTB Government of Mauritius Treasury Bills
HP Hodrick-Prescott
ICE Intercontinental Exchange
IMF International Monetary Fund
IPI Import Price Index
KRR Key Repo Rate
MCCI Mauritius Chamber of Commerce and Industry
MERI Mauritius Exchange Rate Index
MPC Monetary Policy Committee
NYMEX WTI New York Mercantile Exchange West Texas Intermediate
ODCs Other Depository Corporations
OECD Organisation for Economic Co-operation and Development
OPEC Organisation of the Petroleum Exporting Countries

51
List of Acronyms
ORR Operation Reserves Reconstitution
PE Price Earnings
PLR Prime Lending Rate
PMI Purchasing Managers’ Index
PPI-A Producer Price Index-Agriculture
PPI-M Producer Price Index-Manufacturing
REER Real Effective Exchange Rate
SDR Savings Deposits Rate
SEM Stock Exchange of Mauritius
SEMDEX
SITC
Stock Exchange of Mauritius Index
Standard International Trade Classification
VIX Volatility Index
WRI Wage Rate Index
INFLATION REPORT | OCTOBER 2014 LIST OF ACRONYMS
52
GLOSSARY INFLATION REPORT | OCTOBER 2014
GlossaryCORE1 inflation excludes food, beverages and tobacco and mortgage interest on housing loan from the CPI basket. Both headline and year-on-year CORE1 inflation measures are available.
CORE2 inflation excludes food, beverages and tobacco, mortgage interest, energy prices and administered prices from the CPI basket. Both headline and year-on-year CORE2 inflation measures are available.
Fiscal consolidation is a policy aimed at reducing government deficits and debt accumulation. GBC1s are resident corporations which conduct business outside Mauritius. The law has recently been amended to allow them to transact with residents provided that their activities in Mauritius are ancillary to their core business with non-residents.
Headline inflation is measured by the change in the average Consumer Price Index (CPI) over a twelve-month period compared with the corresponding previous twelve-month period.
Key Repo Rate is the key policy rate used by the Bank of Mauritius to signal changes in its monetary policy stance.
MERI1 is the Mauritius Exchange Rate Index, a nominal effective exchange rate introduced in July 2008, based on the currency distribution of merchandise trade.
MERI2 is the Mauritius Exchange Rate Index, a nominal effective exchange rate introduced in July 2008, based on the currency distribution of merchandise trade and tourist earnings.
Other investment, which is a category in the Balance of Payments, includes all debt liabilities between unaffiliated non-residents and residents, which are not securitised. It can be classified by institutional sector: general government, monetary authorities, banks, and other sector, and sub-classified between short-term and long-term.
PMI refers to the Purchasing Managers’ Index of financial activity, reflecting purchasing managers’ acquisition of goods and services.
Seasonally-adjusted data are derived by removing the seasonal component of a time series in order to understand the underlying trends of the series.
Y-o-y change compares the value of a variable at one period in time to the same period the previous year.
Y-o-y inflation is measured by the change in the CPI for a given month compared with the corresponding month of the preceding year.


BANK OF MAURITIUS
Address Sir William Newton Street Port Louis Mauritius
Website https://www.bom.mu ISSN 1694-2531