bank of kigali announces q2 2011 & 1h 2011 results
TRANSCRIPT

8/3/2019 Bank of Kigali Announces Q2 2011 & 1H 2011 Results
http://slidepdf.com/reader/full/bank-of-kigali-announces-q2-2011-1h-2011-results 1/9
Bank of Kigali Limited
Your trusted partner in wealth creation
Kigali, 2 September 2011
Q2 2011, Q4 2010 and Q2 2010 numbers in this press release are audited interim numbers.
About Bank of Kigali
Bank of Kigali is a leading banking institution in Rwanda, offering a wide spectrum of commercial banking services to corporate, SME and retail customers. The Bank has approximately
500 employees and serves over 90,120 retail clients. The Bank has a network of 39 branches spread across all provinces and major commercial districts in the country.
For further information, please visit www.bk.rw or contact:
Frances Ihogoza
Head of Corporate Affairs/Company Secretary
Tel: +250 252 593 100 or +250 252 593 200
Fax: +250 252 575 504 or +250 252 573 461
Email: [email protected]
SWIFT: BKIGRWRW
Company Code/ TIN n° 10.000.3458
P.o Box 175 - KIGALI Plot No. 6112, Avenue de la Paix – Kigali (Rwanda)
601.9 RwF/US$ Period End Exchange rate as at 30 June 2011
594.4 RwF/US$ Period End Exchange Rate as at 31 December 2010
587.8 RwF/US$ Period End Exchange Rate as at 30 June 2010
Bank of Kigali Announces Q2 2011 & 1H 2011 Audited Results
Q2 2011 Change
Millions, unless otherwise noted US$ RwF Q-o-Q Y-o-Y
Total Operating Income (Revenue) 11.8 7,113 11.6% 38.0%
Total Recurring Operating Costs 5.0 3,039 17.4% 19.0%
Profit Before Provisions 6.8 4,075 7.6% 56.7%
Net Provision Expense (1.1) (683) 47.5% 31.9%
Net Income (Loss) 3.3 1,975 3.1% 45.1%
1H 2011 ChangeUS$ RwF Y-o-Y
Total Operating Income (Revenue) 22.4 13,488 38.4%
Total Recurring Operating Costs 9.3 5,627 22.5%
Profit Before Provisions 13.1 7,862 52.5%
Net Provision Expense (1.9) (1,145) -33.4%
Net Income (Loss) 6.5 3,890 76.0%
As at 30 June 2011 Change
US$ RwF YTD Y-o-Y
Total Assets 409.5 246,466 24.7% 40.9%
Net Loans 184.9 111,299 9.8% 24.8%Client Deposits 292.1 175,826 29.6% 39.7%
Total Liabilities 351.7 211,707 27.7% 37.3%
Shareholders' Equity 57.7 34,759 9.1% 67.5%
As at 30 June 2011 As at 30 June 2010
Net Loans/Total Assets 45.2% 51.0%
Net Loans/Client Deposits 63.3% 70.8%
Q2 2011 Q2 2010
ROAA, annualised 3.4% 3.3%
ROAE, annualised 23.0% 26.6%

8/3/2019 Bank of Kigali Announces Q2 2011 & 1H 2011 Results
http://slidepdf.com/reader/full/bank-of-kigali-announces-q2-2011-1h-2011-results 2/9
Bank of Kigali Limited
Your trusted partner in wealth creation
Kigali, 2 September 2011
2
Bank of Kigali (the “Bank”), the leading bank in Rwanda, announced today its non-IFRS results, reporting Net Income
of RwF 1,975 million (US$3.3 million) in Q2 2011, up 3.1% q-o-q and up 45.1% y-o-y.
Q2 2011 and 1H 2011 Financial Highlights
Total Assets grew by 16.7% q-o-q and 40.9% y-o-y (24.7% YTD 2011) to RwF 246,466 million as at 30 June 2011
Total Assets Growth 1H 2011 2010
Bank of Kigali 24.7% 30.1%
The Rwandan Banking Sector* 9.6% 26.1%
Net Loans grew by 6.1% q-o-q and 24.8% y-o-y (9.8% YTD 2011) to RwF 111,299 million as at 30 June 2011
Net Loan Book Growth 1H 2011 2010
Bank of Kigali 9.8% 31.5%
The Rwandan Banking Sector* 8.6% 13.1%
Client Deposits grew by 23.7% q-o-q and 39.7% y-o-y (29.6% YTD 2011) to RwF 175,826 million as at 30 June
2011
Client Deposits Growth 1H 2011 2010
Bank of Kigali 29.6% 24.2%
The Rwandan Banking Sector* 10.6% 27.8%
Bank of Kigali Growth vs. Rwandan Banking Sector Growth in 2010 and 1H 2011
30.1%31.5%
24.2%26.1%
13.1%
27.8%
0.0%
5.0%
10.0%
15.0%
20.0%
25.0%
30.0%
35.0%
Total Assets Net Loans Client Deposits
Bank Of Kigali Growth In 2010 Rwandan Banking Sector Growth In 2010
24.7%
9.8%
29.6%
9.6%8.6%
10.6%
0.0%
5.0%
10.0%
15.0%
20.0%
25.0%
30.0%
35.0%
Total Assets Net Loans Client Balances & Deposits
Bank of Kigali Growth in 1H 2011 Rwandan Banking Sector Growth in 1H 2011
Market Share Dynamics
26.4% 26.8%25.7%
27.4%
31.5%
25.9%
30.9%31.7%
29.4%
0.0%
5.0%
10.0%
15.0%
20.0%
25.0%
30.0%
35.0%
Total Assets Net Loans Client Deposits
2009 2010 1H 2011 *Preliminary estimates have been used for EcoBank in calculating the banking sector figures, whose 1H 2011 performance figures are subject to confirmation.
Any resulting changes are unlikely to be material.

8/3/2019 Bank of Kigali Announces Q2 2011 & 1H 2011 Results
http://slidepdf.com/reader/full/bank-of-kigali-announces-q2-2011-1h-2011-results 3/9
Bank of Kigali Limited
Your trusted partner in wealth creation
Kigali, 2 September 2011
3
Net Interest Income equalled RwF 4,114 million in Q2 2011, up 13.4% q-o-q and 32.3% y-o-y. Net Fee & Commission
Income amounted to RwF 987 million in Q2 2011, up 26.8% q-o-q and 100.3% y-o-y. Total Operating Income(Revenue) reached RwF 7,113 million in Q2 2011, up 11.6% q-o-q and 38.0% y-o-y. Total Recurring Operating Costs
increased by 17.4% q-o-q and 19.0% y-o-y to RwF 3,039 in Q2 2011. Cost/Income ratio reached 49.5% in Q2 2011
slightly up from 48.2% in Q1 2011 and down from 51.8% in Q2 2010.
Annualised ROAA reached 3.4% in Q2 2011, whereas annualised ROAE reached 23.0% in Q2 2011.
Total Assets grew by 16.7% q-o-q and 40.9% y-o-y (up 24.7% YTD 2011), reaching RwF 246,466 million as at 30 June
2011. Net Loans grew by 6.1% q-o-q and 24.8% y-o-y (up 9.8% YTD 2011), reaching RwF 111,299 million as at 30 June
2011. Client Deposits amounted to RwF 176,826 million, up 23.7% q-o-q and 39.7% y-o-y (up 29.6% YTD 2011). Net
Loans/Total Assets ratio stood at 45.2% as at 30 June 2011 vs. 51.0% as at 30 June 2010. Net Loans/Client Deposits
ratio reached 63.3% as at 30 June 2011 vs. 70.8% as at 30 June 2010.
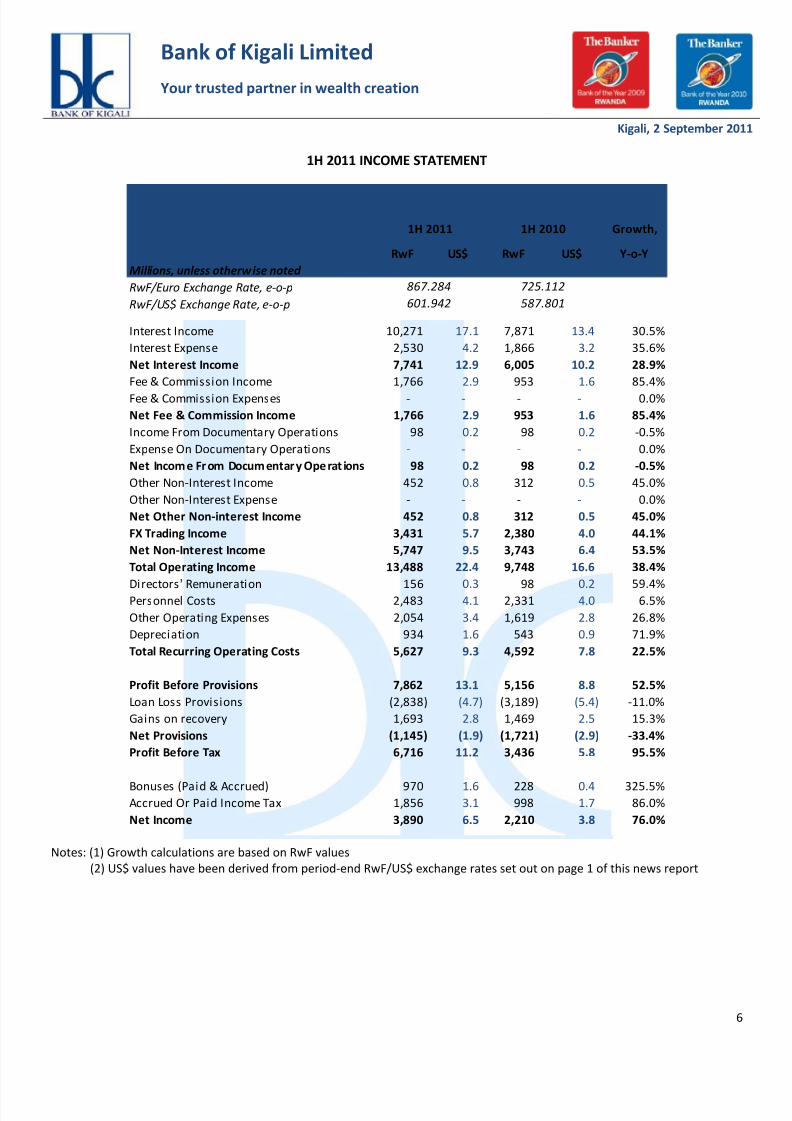
Net Interest Income equalled RwF 7,741 million in 1H 2011, up 28.9% y-o-y. Net Fee & Commission Income
amounted to RwF 1,766 million in 1H 2011, up 85.4% y-o-y. Total Operating Income (Revenue) reached RwF 13,488
million in 1H 2011, up 38.4% y-o-y. Total Recurring Operating Costs increased by 22.5% y-o-y to RwF 5,627 in 1H
2011. Cost/Income ratio decreased to 48.9% in 1H 2011 from 49.4% in 1H 2010.
“I am delighted that we have managed to grow our balance sheet and further increase our market share by total
assets. We will continue growing the Bank, with a focus on profitability and increasing shareholder value ”,
commented James Gatera, Managing Director.

8/3/2019 Bank of Kigali Announces Q2 2011 & 1H 2011 Results
http://slidepdf.com/reader/full/bank-of-kigali-announces-q2-2011-1h-2011-results 4/9
Bank of Kigali Limited
Your trusted partner in wealth creation
Kigali, 2 September 2011
4
Q2 2011 Performance Highlights
Total Operating Income Total Assets
5,153
7,113
-
1,000
2,000
3,000
4,000
5,000
6,000
7,000
8,000
Q2 2010 Q2 2011
RwF Millions
+38%
174,901
246,466
-
50,000
100,000
150,000
200,000
250,000
300,000
Q2 2010 Q2 2011
RwF Millions
+41%
Recurring Operating Costs Net Loans
2,553
3,039
-
500
1,000
1,500
2,000
2,500
3,000
3,500
Q2 2010 Q2 2011
RwF Millions
+19%
89,151
111,299
-
20,000
40,000
60,000
80,000
100,000
120,000
Q2 2010 Q2 2011
RwF Millions
+25%
Net Income Client Deposits
1,360
1,975
-
500
1,000
1,500
2,000
2,500
Q2 2010 Q2 2011
RwF Millions
+45%
125,838
175,826
-
20,000
40,000
60,000
80,000
100,000
120,000
140,000
160,000
180,000
200,000
Q2 2010 Q2 2011
RwF Millions
+40%

8/3/2019 Bank of Kigali Announces Q2 2011 & 1H 2011 Results
http://slidepdf.com/reader/full/bank-of-kigali-announces-q2-2011-1h-2011-results 5/9
Bank of Kigali Limited
Your trusted partner in wealth creation
Kigali, 2 September 2011
5
Q2 2011 INCOME STATEMENT
Growth, Growth,
Millions, unless otherwise noted RwF US$ RwF US$ RwF US$ Q-o-Q Y-o-Y
RwF/Euro Exchange Rate, e-o-p 867.284 843.505 725.112
RwF/US$ Exchange Rate, e-o-p 601.942 600.052 587.801
Interest Income 5,501 9.1 4,770 7.9 3,930 6.7 15.3% 40.0%
Interest Expense 1,387 2.3 1,143 1.9 820 1.4 21.3% 69.2%
Net Interest Income 4,114 6.8 3,627 6.0 3,110 5.3 13.4% 32.3%
Fee & Commission Income 987 1.6 779 1.3 493 0.8 26.8% 100.3%
Fee & Commission Expenses - - - - - 0.0 0.0% 0.0%
Net Fee & Commission Income 987 1.6 779 1.3 493 0.8 26.8% 100.3%
Income From Documentary Operations 56 0.1 42 0.1 50 0.1 34.4% 12.0%
Expense On Documentary Operations - - - - - 0.0 0.0% 0.0%
Net Income From Documentary Operations 56 0.1 42 0.1 50 0.1 34.4% 12.0%
Other Non-Interest Income 232 0.4 220 0.4 165 0.3 5.8% 40.5%
Other Non-Interest Expense - - - - - 0.0 0.0% 0.0%
Net Other Non-interest Income 232 0.4 220 0.4 165 0.3 5.8% 40.5%
FX Trading Income 1,724 2.9 1,707 2.8 1,335 2.3 1.0% 29.1%
Net Non-Interest Income 2,999 5.0 2,748 4.6 2,043 3.5 9.1% 46.8%
Total Operating Income 7,113 11.8 6,375 10.6 5,153 8.8 11.6% 38.0%
Directors' Remuneration 93 0.2 63 0.1 79 0.1 46.5% 18.2%
Personnel Costs 1,282 2.1 1,200 2.0 1,210 2.1 6.8% 6.0%
Other Operating Expenses 1,172 1.9 881 1.5 929 1.6 33.0% 26.2%Depreciation 491 0.8 443 0.7 336 0.6 10.9% 46.3%
Total Recurring Operating Costs 3,039 5.0 2,588 4.3 2,553 4.3 17.4% 19.0%
Profit Before Provisions 4,075 6.8 3,787 6.3 2,600 4.4 7.6% 56.7%
Loan Loss Provisions (1,681) (2.8) (1,158) (1.9) (1,651) -2.8 45.2% 1.8%
Gains on recovery 998 1.7 695 1.2 1,133 1.9 43.6% -11.9%
Net Provisions (683) (1.1) (463) (0.8) (518) -0.9 47.5% 31.9%
Profit Before Tax 3,392 5.6 3,325 5.5 2,082 3.5 2.0% 62.9%
Bonuses (Paid & Accrued) 485 0.8 486 0.8 114 0.2 -0.1% 325.4%
Accrued Or Paid Income Tax 933 1.5 924 1.5 608 1.0 0.9% 53.4%
Net Income 1,975 3.3 1,915 3.2 1,360 2.3 3.1% 45.1%
Q2 2011 Q1 2011 Q2 2010
Notes: (1) Growth calculations are based on RwF values
(2) US$ values have been derived from period-end RwF/US$ exchange rates set out on page 1 of this news report
8/3/2019 Bank of Kigali Announces Q2 2011 & 1H 2011 Results
http://slidepdf.com/reader/full/bank-of-kigali-announces-q2-2011-1h-2011-results 6/9
Bank of Kigali Limited
Your trusted partner in wealth creation
Kigali, 2 September 2011
6
1H 2011 INCOME STATEMENT
Growth,
RwF US$ RwF US$ Y-o-Y
Millions, unless otherwise noted
RwF/Euro Exchange Rate, e-o-p
RwF/US$ Exchange Rate, e-o-p
Interest Income 10,271 17.1 7,871 13.4 30.5%
Interest Expense 2,530 4.2 1,866 3.2 35.6%
Net Interest Income 7,741 12.9 6,005 10.2 28.9%
Fee & Commission Income 1,766 2.9 953 1.6 85.4%
Fee & Commission Expenses - - - - 0.0%
Net Fee & Commission Income 1,766 2.9 953 1.6 85.4%
Income From Documentary Operations 98 0.2 98 0.2 -0.5%
Expense On Documentary Operations - - - - 0.0%
Net Incom e From Docum entary Operat ions 98 0.2 98 0.2 -0.5%
Other Non-Interest Income 452 0.8 312 0.5 45.0%
Other Non-Interest Expense - - - - 0.0%
Net Other Non-interest Income 452 0.8 312 0.5 45.0%
FX Trading Income 3,431 5.7 2,380 4.0 44.1%
Net Non-Interest Income 5,747 9.5 3,743 6.4 53.5%
Total Operating Income 13,488 22.4 9,748 16.6 38.4%
Directors' Remuneration 156 0.3 98 0.2 59.4%Personnel Costs 2,483 4.1 2,331 4.0 6.5%
Other Operating Expenses 2,054 3.4 1,619 2.8 26.8%
Depreciation 934 1.6 543 0.9 71.9%
Total Recurring Operating Costs 5,627 9.3 4,592 7.8 22.5%
Profit Before Provisions 7,862 13.1 5,156 8.8 52.5%
Loan Loss Provisions (2,838) (4.7) (3,189) (5.4) -11.0%
Gains on recovery 1,693 2.8 1,469 2.5 15.3%
Net Provisions (1,145) (1.9) (1,721) (2.9) -33.4%
Profit Before Tax 6,716 11.2 3,436 5.8 95.5%
Bonuses (Paid & Accrued) 970 1.6 228 0.4 325.5%Accrued Or Paid Income Tax 1,856 3.1 998 1.7 86.0%
Net Income 3,890 6.5 2,210 3.8 76.0%
1H 2011
867.284
601.942
1H 2010
725.112
587.801
Notes: (1) Growth calculations are based on RwF values
(2) US$ values have been derived from period-end RwF/US$ exchange rates set out on page 1 of this news report

8/3/2019 Bank of Kigali Announces Q2 2011 & 1H 2011 Results
http://slidepdf.com/reader/full/bank-of-kigali-announces-q2-2011-1h-2011-results 7/9
Bank of Kigali Limited
Your trusted partner in wealth creation
Kigali, 2 September 2011
7
Q2 2011 BALANCE SHEET
Q-o-Q Y-o-Y YTD
Millions, unless otherwise noted Change Change Growth
US$ RwF US$ RwF US$ RwF US$ RwF
Cash 15.2 9,165 11.2 6,740 11.6 6,882 5.9 3,462 36.0% 164.7% 33.2%
Balances With BNR 9.5 5,710 13.6 8,187 10.7 6,333 8.7 5,111 -30.3% 11.7% -9.8%
Cash Balances With Banks 69.8 42,044 52.0 31,204 61.4 36,480 48.8 28,659 34.7% 46.7% 15.3%
Treasuries 72.6 43,672 33.9 20,317 30.6 18,202 47.0 27,612 114.9% 58.2% 139.9%
Other Fixed Income Instruments 11.1 6,682 20.4 12,211 8.8 5,224 9.1 5,341 -45.3% 25.1% 27.9%
Gross Loans 192.6 115,913 185.0 111,014 177.5 105,527 159.1 93,524 4.4% 23.9% 9.8%
Loan Loss Reserve (7.7) (4,613) (10.2) (6,113) (6.9) (4,124) (7.4) (4,373) -24.5% 5.5% 11.9%
Net Loans To Clients 184.9 111,299 174.8 104,902 170.6 101,403 151.7 89,151 6.1% 24.8% 9.8%
Net Investments 0.4 268 0.4 268 0.5 268 0.6 340 0.0% -21.1% 0.0%
Net Property, Plant & Equipment 31.5 18,958 30.1 18,081 30.8 18,313 11.4 6,694 4.9% 183.2% 3.5%
Net Intangible Assets 0.3 164 0.6 362 0.3 181 0.4 225 -54.8% -27.2% -9.3%
Net Other Assets 14.1 8,504 14.7 8,851 7.4 4,391 14.1 8,307 -3.9% 2.4% 93.7%
Total Assets 409.5 246,466 351.8 211,123 332.5 197,677 297.6 174,901 16.7% 40.9% 24.7%
Interbank Deposits 28.0 16,857 31.5 18,921 31.8 18,921 26.1 15,341 -10.9% 9.9% -10.9%
Client Deposits 292.1 175,826 237.0 142,190 228.2 135,677 214.1 125,838 23.7% 39.7% 29.6%
Borrowed Funds 3.1 1,862 3.0 1,811 - - - - 2.8% NMF NMF
Payable Interest & Dividends 0.5 309 0.3 193 - - 4.5 2,643 NMF -88.3% 0.0%
Other Liabilities 28.0 16,853 25.4 15,223 18.9 11,208 17.6 10,329 10.7% 63.2% 50.4%
Total Liabilities 351.7 211,707 297.2 178,338 278.9 165,807 262.3 154,151 18.7% 37.3% 27.7%
Ordinary Shares 8.3 5,005 8.3 5,005 8.4 5,005 8.5 5,005 0.0% 0.0% 0.0%
Retained Earnings 31.4 18,893 31.3 18,803 22.8 13,536 23.0 13,535 0.5% 39.6% 39.6%
Revalua tion Reserve 11.6 6,972 11.8 7,061 12.0 7,151 - - -1.3% NMF -2.5%
Net Income 6.5 3,890 3.2 1,915 10.4 6,179 3.8 2,210 103.1% 76.0% -37.0%
Shareholder's Equity 57.7 34,759 54.6 32,785 53.6 31,870 35.3 20,750 6.0% 67.5% 9.1%
Total liabilities & Shareholders' Equity 409.5 246,466 351.8 211,123 332.5 197,677 297.6 174,901 16.7% 40.9% 24.7%
Q2 2010Q2 2011 Q1 2011 Q4 2010
Notes: (1) Growth calculations are based on RwF values
(2) US$ values have been derived from period-end RwF/US$ exchange rates set out on page 1 of this news report
8/3/2019 Bank of Kigali Announces Q2 2011 & 1H 2011 Results
http://slidepdf.com/reader/full/bank-of-kigali-announces-q2-2011-1h-2011-results 8/9
Bank of Kigali Limited
Your trusted partner in wealth creation
Kigali, 2 September 2011
8
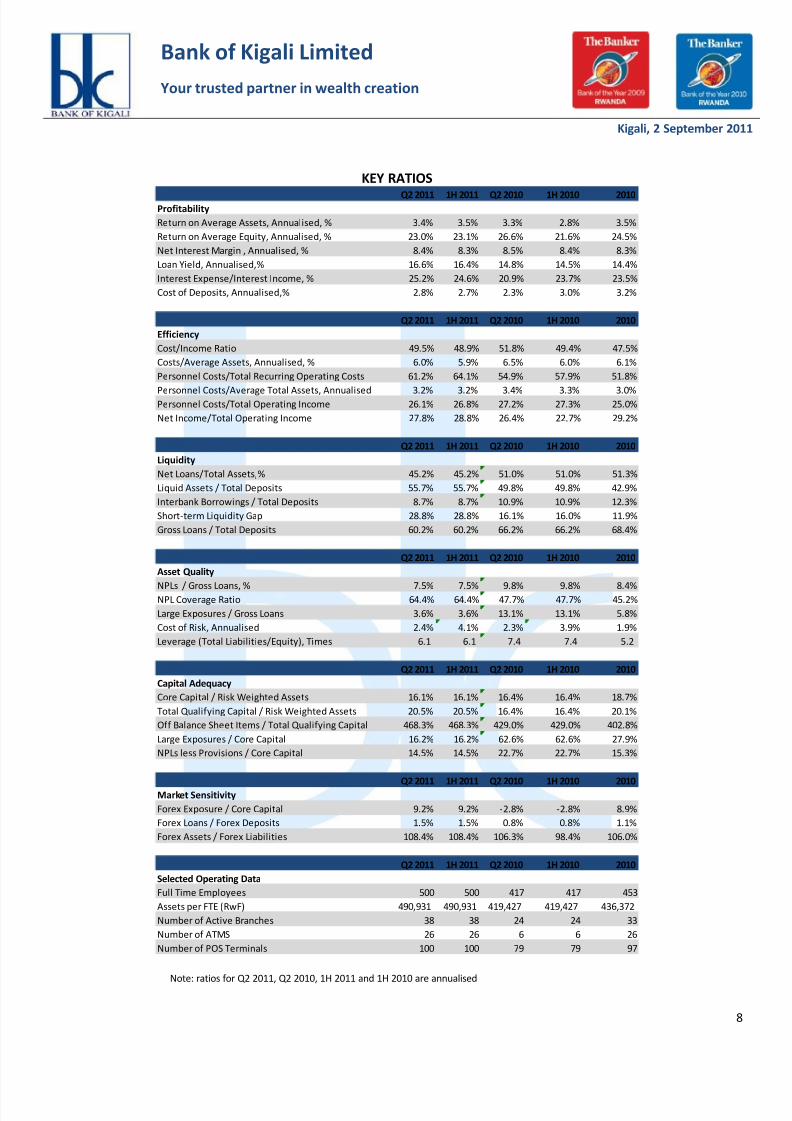
KEY RATIOS
Q2 2011 1H 2011 Q2 2010 1H 2010 2010Profitability
Return on Average Assets, Annualised, % 3.4% 3.5% 3.3% 2.8% 3.5%
Return on Average Equity, Annualised, % 23.0% 23.1% 26.6% 21.6% 24.5%
Net Interest Margin , Annualised, % 8.4% 8.3% 8.5% 8.4% 8.3%
Loan Yield, Annualised,% 16.6% 16.4% 14.8% 14.5% 14.4%
Interest Expense/Interest Income, % 25.2% 24.6% 20.9% 23.7% 23.5%
Cost of Deposits, Annualised,% 2.8% 2.7% 2.3% 3.0% 3.2%
Q2 2011 1H 2011 Q2 2010 1H 2010 2010
Efficiency
Cost/Income Ratio 49.5% 48.9% 51.8% 49.4% 47.5%
Costs/Average Assets, Annualised, % 6.0% 5.9% 6.5% 6.0% 6.1%
Personnel Costs/Total Recurring Operating Costs 61.2% 64.1% 54.9% 57.9% 51.8%
Personnel Costs/Average Total Assets, Annualised 3.2% 3.2% 3.4% 3.3% 3.0%Personnel Costs/Total Operating Income 26.1% 26.8% 27.2% 27.3% 25.0%
Net Income/Total Operating Income 27.8% 28.8% 26.4% 22.7% 29.2%
Q2 2011 1H 2011 Q2 2010 1H 2010 2010
Liquidity
Net Loans/Total Assets,% 45.2% 45.2% 51.0% 51.0% 51.3%
Liquid Assets / Total Deposits 55.7% 55.7% 49.8% 49.8% 42.9%
Interbank Borrowings / Total Deposits 8.7% 8.7% 10.9% 10.9% 12.3%
Short-term Liquidity Gap 28.8% 28.8% 16.1% 16.0% 11.9%
Gross Loans / Total Deposits 60.2% 60.2% 66.2% 66.2% 68.4%
Q2 2011 1H 2011 Q2 2010 1H 2010 2010
Asset Quality
NPLs / Gross Loans, % 7.5% 7.5% 9.8% 9.8% 8.4%NPL Coverage Ratio 64.4% 64.4% 47.7% 47.7% 45.2%
Large Exposures / Gross Loans 3.6% 3.6% 13.1% 13.1% 5.8%
Cost of Risk, Annualised 2.4% 4.1% 2.3% 3.9% 1.9%
Leverage (Total Liabilities/Equity), Times 6.1 6.1 7.4 7.4 5.2
Q2 2011 1H 2011 Q2 2010 1H 2010 2010
Capital Adequacy
Core Capital / Risk Weighted Assets 16.1% 16.1% 16.4% 16.4% 18.7%
Total Qualifying Capital / Risk Weighted Assets 20.5% 20.5% 16.4% 16.4% 20.1%
Off Balance Sheet Items / Total Qualifying Capital 468.3% 468.3% 429.0% 429.0% 402.8%
Large Exposures / Core Capital 16.2% 16.2% 62.6% 62.6% 27.9%
NPLs less Provisions / Core Capital 14.5% 14.5% 22.7% 22.7% 15.3%
Q2 2011 1H 2011 Q2 2010 1H 2010 2010Market Sensitivity
Forex Exposure / Core Capital 9.2% 9.2% -2.8% -2.8% 8.9%
Forex Loans / Forex Deposits 1.5% 1.5% 0.8% 0.8% 1.1%
Forex Assets / Forex Liabilities 108.4% 108.4% 106.3% 98.4% 106.0%
Q2 2011 1H 2011 Q2 2010 1H 2010 2010
Selected Operating Data
Full Time Employees 500 500 417 417 453
Assets per FTE (RwF) 490,931 490,931 419,427 419,427 436,372
Number of Active Branches 38 38 24 24 33
Number of ATMS 26 26 6 6 26
Number of POS Terminals 100 100 79 79 97
Note: ratios for Q2 2011, Q2 2010, 1H 2011 and 1H 2010 are annualised

8/3/2019 Bank of Kigali Announces Q2 2011 & 1H 2011 Results
http://slidepdf.com/reader/full/bank-of-kigali-announces-q2-2011-1h-2011-results 9/9
Bank of Kigali Limited
Your trusted partner in wealth creation
Kigali, 2 September 2011
9
Ratio Definitions
1 Return On Average Total Assets (ROAA) equals Net Income of the period divided by average Total Assets for the same period;
2 Return On Average Total Equity (ROAE) equals Net Income of the period divided by average Total Shareholders’ Equity for the same period;
3 Average Interest Earning Assets are calculated on a quarterly basis; Interest Earning Assets include: Cash & Balances With Banks, Treasuries
and Net Loans To Clients;
4 Net Interest Margin equals Net Interest Income of the period divided by Average Interest Earning Assets for the same period;
5 Loan Yield equals Interest Income of the period divided by average Gross Loans for the same period;
6 Cost Of Funds equals Interest Expense of the period divided by average Total Liabilities for the same period;
7 Total Operating Income includes Net Interest Income and Non-Interest Income;
8 Costs include Total Recurring Operating Costs and Bonuses (Paid and Accrued);
9 Cost/Income equals Total Recurring Operating Costs plus Bonuses (Paid and Accrued) for the period divided by Total Operating Income;
10 Personnel Costs/Total Recurring Operating Costs equals the sum of Directors’ Remuneration, Personnel Costs and Bonuses (Paid and Accrued)
for the period divided by Total Recurring Operating Costs ;
11 Personnel Costs/Average Total Assets equals the sum of Directors’ Remuneration, Personnel Costs and Bonuses (Paid and Accrued) for the
period divided by average Total Assets ;12 Client Deposits include Corporate and Retail deposits;
13 Total Deposits include Interbank Deposits and Client Deposits;
14 Shareholders’ Equity equals to Total Shareholders’ Equity;
15 NPLs are loans overdue by more than 90 days;
16 NPL Coverage ratio equals Loan Loss Reserve as of the period end divided by NPLs as of the same date;
17 Large exposures include loans that in aggregate comprise 10% of Core Capital
18 Cost Of Risk equals Net Provision For Loan Losses of the period, plus provisions for (less recovery of) other assets, divided by average Gross
Loans To Clients for the same period;
19 otal Capital Adequacy equals Total Capital as of the period end divided by Total Risk Weighted Assets as of the same date, both calculated
n accordance with the requirements of the National Bank of Rwanda.