bank of baroda
TRANSCRIPT

1
INTRODUCTION 1.1 EVOLUTION OF BANK OF BARODA
Bank of Baroda (BoB) is an Indian state-owned banking and financial
services company headquartered in Vadodara (earlier known as Baroda) in
Gujarat, India. It is the second-largest bank in India, after Bank of Baroda, and
offers a range of banking products and financial services to corporate and retail
customers through its branches and through its specialized subsidiaries and
affiliates.
The bank was founded by the Maratha, maharaja of Baroda, H. H. Sir Sayajirao
Gaekwad iii on 20 July 1908 in the princely state of Baroda, in Gujarat. The bank,
along with 13 other major commercial banks of India, was nationalized on 19 July
1969, by the government of India and has been designated as a profit-making
public sector undertaking (PSU).Bank of Baroda is one of the big four banks of
India, along with Bank of Baroda, ICICI bank and Punjab.
HISTORY
1908 to 1959
In 1908, Maharaja Sayajirao Gaekwad III, one of the knights of the Maratha
Kingdom, set up the Bank of Baroda (BoB), with other stalwarts of industry such
as Sampatrao Gaekwad, Ralph Whitenack, Vithaldas thakersey, Tulsidas
kilachand and NM Chokshi. Two years later, BOB established its first branch
in Ahmedabad.
1960’s to 1970’s
In 1961, BOB merged in new citizen bank ofIndia. This merger helped it increase
its branch network in Maharashtra. BoB also opened a branch in Fiji. The next
year it opened a branch in Mauritius. Bank of Baroda in 1963, BoB acquired Surat
banking corporation in Surat, Gujarat. The next year BoB acquired two banks:
Umbergaon people’s bank in southern Gujarat and Tamil Nadu central bank
in Tamil Nadu state.Bank of Barodaacquired bank ofIndia's operations in Uganda.
After two years later, Bank of Barodaopened a branch in Dubai and Abu

2
Dhabi.Back in India, in 1975, Bank of Barodaacquired the majority shareholding
and management control in UttarPradesh. Later on, Nainital bank has expanded
to Uttarakhand state.
1980’s to 1990’s
In this period, Bank of Barodaopened a branch in Bahrain and a representative
office in Sydney, Australia. In HongKong IUB international finance, a licensed
deposit taker was established by Bank of Baroda, union bank ofIndiaand Indian
bank in which each bank took an equal share. Back in India, in 1988, Bank of
Barodaacquired trader’s bank, which had a network of 34 branches in Delhi.Bank
of Barodaincorporated its operations in Kenya into a local subsidiary with a small
group of shares quoted on the Nairobi stock exchange. This bank also entered in
the capital market with an initial public offering (IPO). The government ofIndiais
still the largest shareholder, owning 66% of the bank equity.
2000’s to 2010’s
2005: Bank of Barodabuilt a global data center(dc) in Mumbai for running
its centralized banking solution (CBS) and other applications in more than
1,900 branches across Indiaand 20 other counties where the bank operates.
Bank of Barodaalso opened a representative office in Thailand.
2006: Bank of Barodaestablished an offshore banking unit (OBU) in
Singapore.
2007: in its centenary year, Bank of Baroda’s total business crossed
2.09 trillion (short scale), its branches crossed 2000, and its global customer
base 29 million people.
2008: Bank of Barodaopened a branch in Guangzhou, china (02/08/2008)
and in Kenton, harrowsUnited Kingdom. Bank of Barodaopened a joint
venture life insurance company with Andhra bankand legal and
general (UK) called India first life insurance company.
In period Malaysia awarded a commercial banking license to a locally
incorporated bank to be jointly owned by Bank of Baroda. Bank of Baroda opened
an electronic banking service unit (EBSU) was opened at Hamriya free zone,

3
Sharjah (UAE). It also opened four new branches in existing operations in Uganda,
Kenya (2), and Guyana.
1.2 OBJECTIVE
1) To study products and services provided by Bank of Baroda.
2) To do the financial analysis ofBank of Barodafor the year ended 31stmarch
2010, 2011, 2012, 2013and 2014.
1.3 METHODOLOGY
We have adopted following methodology as regards collection, analysis and
presentation of the data
A. Collection of data: required data have been collected from the secondary
sources such as annual reports textbooks, websites etc.
B. Analysis and presentation: data is analyzed using comparative and ratio
analysis method and is printed in the form of tables and graphs.
1.4 SCOPE OF STUDY
The scope of study has been restricted only to the study of products and services
offered by Bank of Barodaand its financial analysis for the years 2010, 2011, 2012,
2013, 2014.
1.5 LIMITATIONS
1) The project is based only on the information provided by annual reports which
are themselves subjected to serious limitations. Ratio also suffers from some
limitations and hence the same limitations may reflect in the project.
2) The project has been done by taking into consideration the annual reports of
only five years.
3) Capital adequacy ratio not calculated because of lack of information.

4
PRODUCTS AND SERVICES
Personal banking
Personal banking is a form of investment where the products and services a bank
is offering are customized to meet the needs of the customers.Personal banking
offered by Bank of Barodato its customers encompasses a range of products and
services. The two main categories of personal are deposits and advances.
Deposits
The type of deposits offered the banks are of two types:
1. Demand deposits
2. Term deposits
Demand deposits:-
A) Current account
B) Savings account
Term deposits:-
The various schemes offered by Bank of Baroda for term deposits are as follows:
A) CAPITAL GAIN ACCOUNT SCHEME, 1988
B) SPECIAL TERM DEPOSITS
C) RECURRING DEPOSITS

5
Advances
A. HOME LOANS
B. CAR LOANS
C. EDUCATIONAL LOANS
D. GOLD LOANS
NRI services
BOBoffer a red carpet welcome to all NRI to bank with us. As a premier
nationalized bank in India, with comprehensive banking experience world-wide,
and by virtue of our consistent track record of profit making since 1908, BOB are
confident of meeting all your banking requirements.
BOB’s wide network of foreign branches, offices and correspondent relations at
convenient business locations all round the world, which is the largest among any
bank in India, will ensure a smooth and safe banking experience.
BOB continue to cherish our rich ethnic traditional values and culture, during our
personal interface. Yet BoB are speedily repositioning us in the e-millennium era
of banking in India, to take care of your changing needs and expectations. BOB’s
information technology strategies are directed towards enabling us to provide
you with a state of the art customer convenience, thereby facilitating a global
banking experience.
Internet banking
The internet banking portal ofBank of Baroda enables its retail banking customers
to operate their accounts for anywhere anytime, removing the restrictions
imposed by geography and time. It is a platform that enables the customers to
carry out their banking activities from their desktop, aided by the power and
6
convenience of the internet. Internet banking enables the customers to carry out
his online bank transaction.
Mobile banking
Mobile banking is a service provided by Bank of Baroda through which a customer
can carry out limited banking transactions from anywhere and at any time. For
example do the balance inquiriesof the accounts, transfer funds within and
outside the bank, top up or recharge etc. These facilities can be availed by the
customer by using the Bank of Baroda app on their mobile phone.
ATM services
Bank of Baroda offers theircustomer’s convenience of over 26,000 ATM’s in India,
the largest network in the country and continuing to expand fast! This means that
one can transact free of cost at the ATM’s of state bank group and wholly on
subsidiary viz. Bank of Baroda commercial and international bank ltd. Using the
BOB ATM-cum-debit (cash plus )card. ATM service allows the customers to
withdraw cash from Bank of BarodaATM’s wherever they go. The minimum
amount of cash that can be withdrawn is rs.100/- and maximum is rs.40, 000/- per
day. Also the customer can get their balance inquiry and the mini statement of
their accounts, transfer funds to ATM to ATM, etc.
Locker services
Lockers are available for safe deposits of valuable as per the requirement of the
customer. Lockers of three sizes are available, small, medium and large twelve
visited in a year to the locker are free. For additional visit charge ofrs.50/- per visit
is levied.
7
FINANCIAL ANALYSIS
3.1Capital adequacy
Capital adequacy is the capital expected to maintain balance with the risks
exposure of the financial institution such as credit risk, market risk and
operational risk, in order to absorb the potential losses and protect the financial
institution’s debt holder. “Meeting statutory minimum capital requirement is the
key factor in deciding the capital adequacy and maintaining an adequate level of
capital is a critical element.
3.1.1Capital adequacy ratio (CAR)
Capital adequacy ratio is propounded to ensure that banks can take up a
reasonable level of losses arising from operational losses. The higher the car ratio,
indicates stronger the bank and the more will be the protection to investors.The
banks are required to maintain 9% capital adequacy ratio as per latest RBI norms.
Car = (tire –i capital + tire-ii capital)
Tire 1 capital (core capital) is shareholders equity capital. Tire 2capital
(supplementary capital) are the bank’s loan loss reserves plus subordinated debt
which consist of bonds sold to raise funds. Risk –weighted assets are the weighted
total of each class of assets and off –balance sheet asset exposures with weights
related to the risk associated with each type of assets.
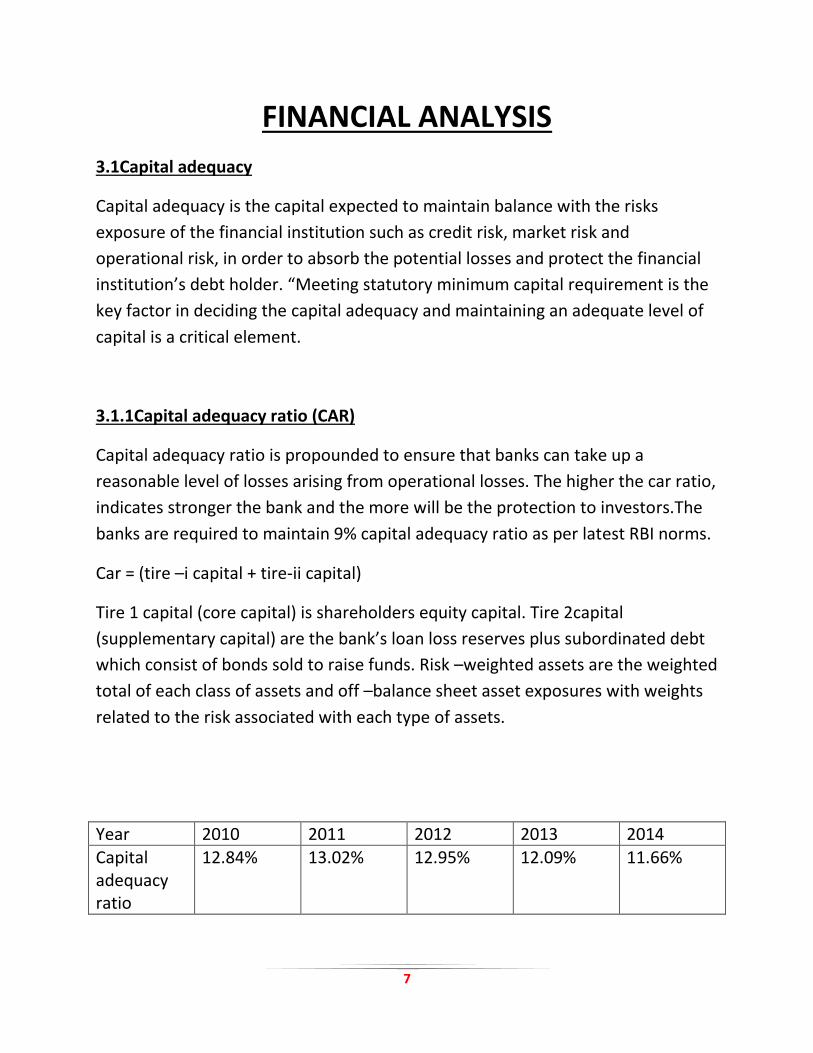
Year 2010 2011 2012 2013 2014 Capital adequacy ratio
12.84% 13.02% 12.95% 12.09% 11.66%

8
In the above table and graph, we see that the capital adequacy ratio has been
fluctuating. Theratio was the highest at 13.02 in the year 2011. In 2010 the ratio
was 12.84, which increased in year 2011 to 13.02, in 2012 the ratio was 12.95, in
2013 the ratio was 12.09, in 2014 the ratio is11.66, however the ratio is above 9%
in each of the year.
10.5
11
11.5
12
12.5
13
13.5
2010 20112012
20132014
Capital adequacy ratio (IN %)
Capital adequacy ratio (IN %)

9
3.1.2Debt equity ratio
The debt to equity ratio is a financial ratio indicating the relative proportion
ofshareholders equity and debt used to finance co. Assets. The ratio is also known
as risk, gearing or leverage. The 2 components are often taken from banks
balance sheet of statement of financial position, but the ratio may also be
calculated using market values for both, if the co. Debt and equity publicly traded,
or using a combination of book value for debt and market value for equity
financial.
Value in crores: 000’s are omitted
Year 2010 2011 2012 2013 2014
Debt 134042707 223783296 235980584 265529425 369763007
Shareholders net worth
157245900 285163033 218265720 271774219 221081700
Debt to equity ratio= Total borrowings
Shareholders net worth
Year 2010 2011 2012 2013 2014
Debt to equity ratio
0.85 0.78 1.08 0.97 1.67

10
In the above table and graph, we see that the debt to equity ratio has been
fluctuating. The ratio was the highest at 1.67 in the year2014. In 2010 the ratio
was 0.85. In year 2011 the ratio was 0.78, in 2012 the ratio was 1.08, in 2013 the
ratio was 0.97and in 2014 the ratio is 1.67.
Favorably the ratio should be less than 1, which means for every 1 rupee of equity
there is less than 1 rupee of debt. In the year 2010, 2011, 2013 the ratio is 0.85,
0.78 and 0.97 respectively which is a good sign, it means that for every 1 rupee of
owners fund there is less than 1 rupee of outside fund. On the contrary in the
year 2012 and 2014 the ratio is 1.08 and 1.67 which is not a good sign, it means
that for every 1 rupee of owners fund there is more than 1 rupee of outside fund.
0
0.2
0.4
0.6
0.8
1
1.2
1.4
1.6
1.8
20102011
20122013
2014
DEBT TO EQIUTY
DEBT TO EQIUTY

11
3.1.3Advances to assets ratio
This ratio indicates the relationship between the total advances and total assets.
This ratio indicates bank aggressiveness in lending which ultimately produces
better profitability. Higher ratio is preferred than a lower one.
Values in crores: 000‘s are omitted
Year 2010 2011 2012 2013 2014
Advances 1777118975 2320851112 2920771369 3336251972 4037153727 Assets 2842767651 3662137657 4574120058 5593883319 6761141057
Advances to assets ratio = Total advances x 100
Total assets
Year 2010 2011 2012 2013 2014 Advances to assets ratio
62.51% 63.37% 63.85% 59.64% 59.71%

12
In the above table and graph, we see that the advance to assets ratio has been
fluctuating. The ratio was the highest at 63.85% in the year 2012. In 2010 the
ratio was 62.51%, in year 2011 the ratio was 63.37%, in 2012 the ratio was
63.85%, in 2013 the ratio was 59.64% and in 2014 the ratio is 59.71%.
This ratio should be maximum as possible because the main function of the bank
is to give out advances. If there is more lending more will be the income from its
operations. There is no use of having idol assets.
In the years 2010, 2011 and 2012 the percentage of advances had been increasing
but in the year 2013 and 2014 the percentage of advances has reduced in
comparison. The bank should see that the ratio should be high so they can yield
maximum profits from interest on lending.
57
58
59
60
61
62
63
64
20102011
20122013
2014
Advances to assets ratio (in %)
ADVANCES TO ASSETS (IN%)

13
3.1.4Government securities to total investment ratio
This ratio reflects the risk involved in a bank investment. It is calculated by
dividing the amount invested in government securities by total investments. Since
government securities are risk free, higher the proportion of government
securities in total investment, lower will be the risk involved in bank investment
and vice-versa.
Values in crores: 000’s are omitted
Year 2010 2011 2012 2013 2014 Government securities
526801503 631317455 733574682 1067594785 1015115501
Total investment
631632703 741544187 866970036 1256170527 1221128639
Government securities to total investment ratio= Government securities x 100
Total investment
Year 2010 2011 2012 2013 2014
Government securities to total investmentratio
83.40% 85.13% 84.61% 84.98% 83.12%

14
In the above table and graph, we see that the government security to total
investment has been fluctuating. The ratio was the highest at 85.13% in the year
2011. In 2010 the ratio was 83.40%, in year 2011 the ratio was 85.13%, in 2012
the ratio was 84.61%, in 2013 the ratio was 84.98% and in 2014 the ratio is
83.12%.
Government securities are the most secured investments that a bank can have. In
the above graph we can see that the investments in government securities are
always above 80% which is good, it ensures constant rate of returns to the bank.
All investments cannot be made up of government securities because they tend
to have a low rate of return. There should be a balance between government
securities and other investments.
82
82.5
83
83.5
84
84.5
85
85.5
2010 2011 20122013
2014
Government securities to total investment ratio(in %)
GOVERNMENT SECURITIES TOTOTAL INVESTMENT (IN %)

15
3.2Assets quality
Assets quality is related to the left hand side of the bank balance sheet. Bank
manager are concerned with the quality of their loans since that provides earning
for the bank. Loan quality and asset quality are two terms with basically the same
meaning. A bad quality loan has higher probability ofbecoming nonperforming
assets (NPA’s) with no return.
3.2.1 NPA to total advances ratio
It is the most standard measure to judge the assets quality, measuring the net
non-performing assets as a percentage of total advances.
Values in crores: 000’s are omitted
Year 2010 2011 2012 2013 2014 Non-performing assets
24006900 31525000 44647500 79825800 118759000
Total advances
1777118975 232085112 2920771369 3336251972 4037153727
NPA to total advances ratio = Nonperforming assets x 100
Total advances
Year 2010 2011 2012 2013 2014
NPA to total advancesratio
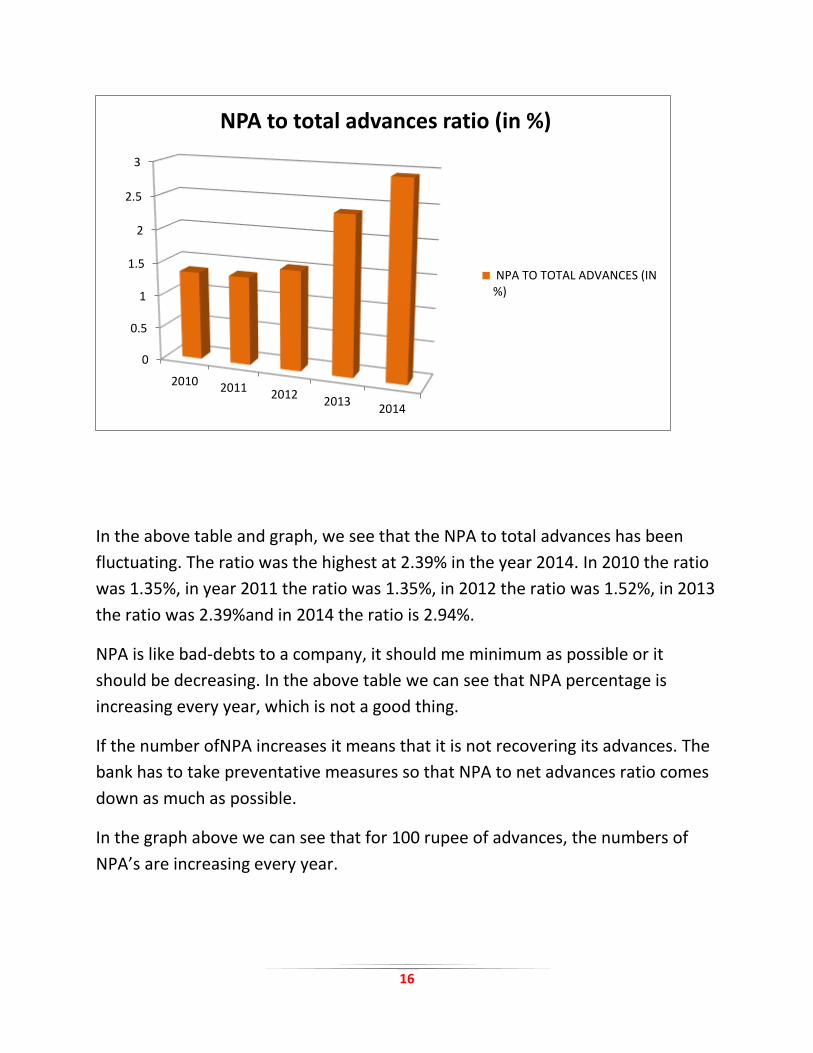
1.35% 1.35% 1.52% 2.39% 2.94%
16
In the above table and graph, we see that the NPA to total advances has been
fluctuating. The ratio was the highest at 2.39% in the year 2014. In 2010 the ratio
was 1.35%, in year 2011 the ratio was 1.35%, in 2012 the ratio was 1.52%, in 2013
the ratio was 2.39%and in 2014 the ratio is 2.94%.
NPA is like bad-debts to a company, it should me minimum as possible or it
should be decreasing. In the above table we can see that NPA percentage is
increasing every year, which is not a good thing.
If the number ofNPA increases it means that it is not recovering its advances. The
bank has to take preventative measures so that NPA to net advances ratio comes
down as much as possible.
In the graph above we can see that for 100 rupee of advances, the numbers of
NPA’s are increasing every year.
0
0.5
1
1.5
2
2.5
3
2010 20112012
20132014
NPA to total advances ratio (in %)
NPA TO TOTAL ADVANCES (IN%)
17
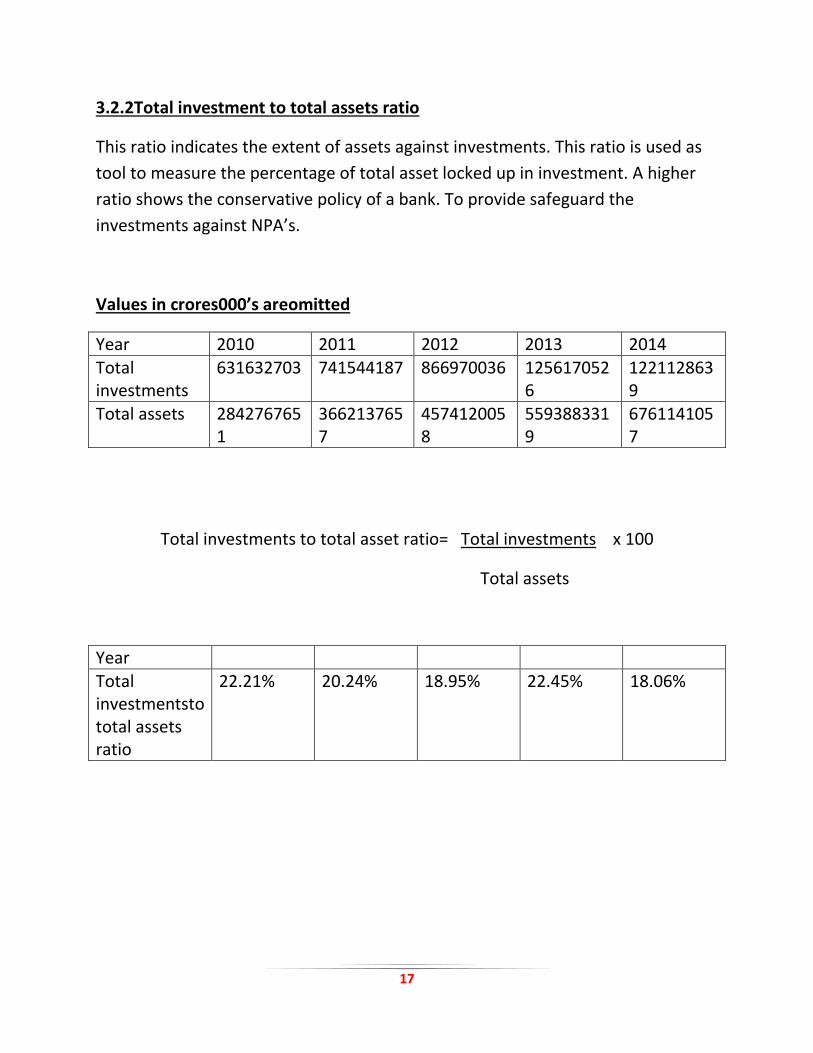
3.2.2Total investment to total assets ratio
This ratio indicates the extent of assets against investments. This ratio is used as
tool to measure the percentage of total asset locked up in investment. A higher
ratio shows the conservative policy of a bank. To provide safeguard the
investments against NPA’s.
Values in crores000’s areomitted
Year 2010 2011 2012 2013 2014
Total investments
631632703 741544187 866970036 1256170526
1221128639
Total assets 2842767651
3662137657
4574120058
5593883319
6761141057
Total investments to total asset ratio= Total investments x 100
Total assets
Year
Total investmentsto total assets ratio
22.21% 20.24% 18.95% 22.45% 18.06%

18
In the above table and graph, we see that the total investments total assets ratio
has been fluctuating. The ratio was the highest at 22.45% in the year 2013. In
2010 the ratio was 22.21%, in year 2011 the ratio was 20.24%, in 2012 the ratio
was 18.95%, in 2013 the ratio was 22.45% and in 2014 the ratio is 18.06%.
In the above graph we can see that on average the ratio is about 20% every year.
This shows us that the bank has 20% of its assets locked up as investments. This
ensures provision for any NPA’s which may occur.
0
5
10
15
20
25
2010 20112012
20132014
Total investments to total asset ratio (in %)
NPA TO TOTAL ADVANCES (IN%)
19
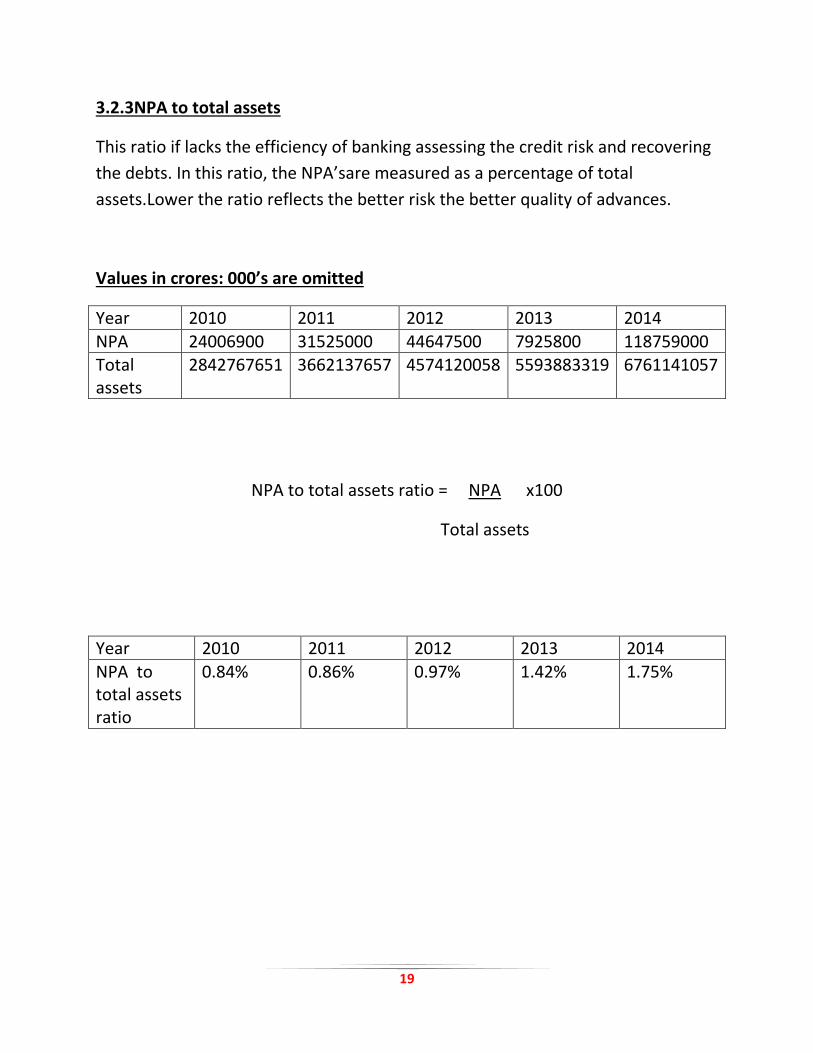
3.2.3NPA to total assets
This ratio if lacks the efficiency of banking assessing the credit risk and recovering
the debts. In this ratio, the NPA’sare measured as a percentage of total
assets.Lower the ratio reflects the better risk the better quality of advances.
Values in crores: 000’s are omitted
Year 2010 2011 2012 2013 2014
NPA 24006900 31525000 44647500 7925800 118759000 Total assets
2842767651 3662137657 4574120058 5593883319 6761141057
NPA to total assets ratio = NPA x100
Total assets
Year 2010 2011 2012 2013 2014
NPA to total assets ratio
0.84% 0.86% 0.97% 1.42% 1.75%

20
In the above table and graph, we see that the NPA total asset has been
fluctuating. The ratio was the highest at 1.75% in the year 2014. In 2010 the ratio
was 0.84%, in year 2011 the ratio was 0.86%, in 2012 the ratio was 0.97%, in 2013
the ratio was 1.47%and in 2014 the ratio is 1.75%.
NPA means bad debts to a company, the bank should see that the NPA levels are
kept minimum as possible. If NPA is low the returns on the asset is of high quality.
In the above table we can see that the NPA figure is increasing, which is not good.
The bank has to take measures to reduce the level ofNPA. If the NPA levels
increase the income or returns on their investments/advances will reduce.
In the graph above we can see that for every 100 rupee of asset the number of
NPA’s is increasing every year. The bank has to take measures to correct its NPA’s.
0
0.2
0.4
0.6
0.8
1
1.2
1.4
1.6
1.8
2010 20112012
20132014
NPA to total assets ratio (in %)
NPA TO TOTAL ASSETS RATIO(IN %)

21
3.3Management efficiency
Ratios that are typically used to analyze how well a bank uses its assets and
liabilities internally.Efficiency ratio can calculate the turnover of receivables, the
replacement of liabilities, the quality and usage of equity and the general use of
inventory and machinery.
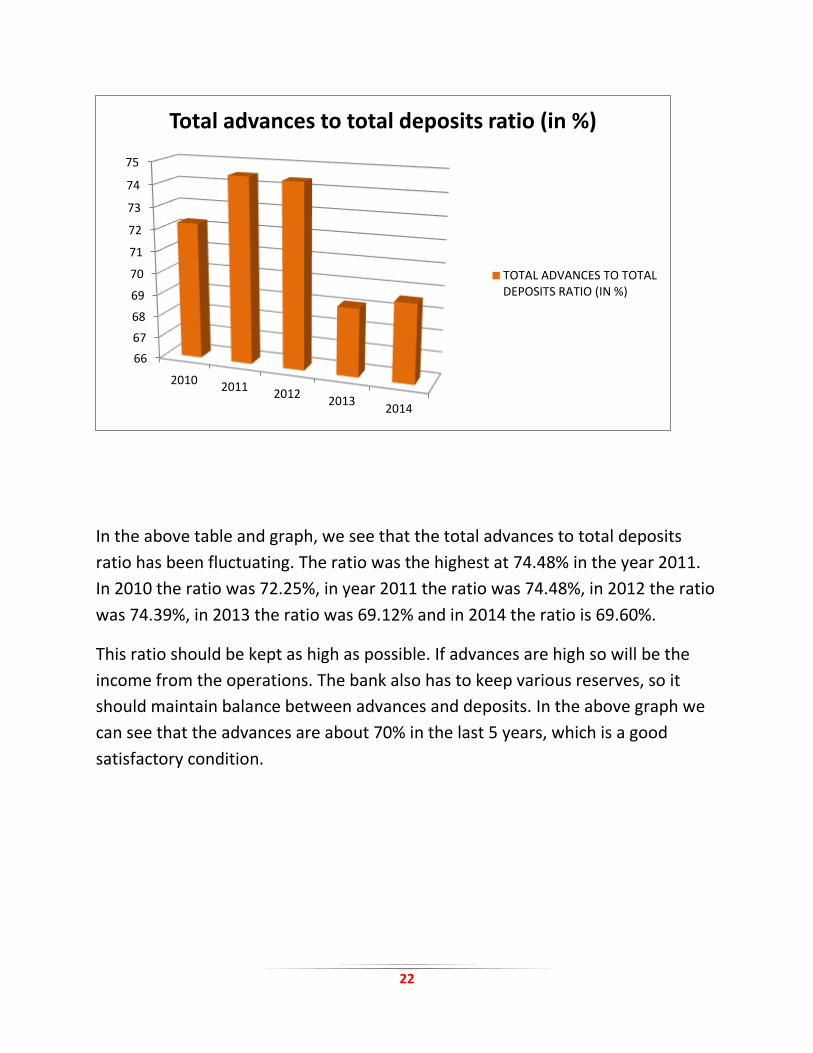
3.3.1Total advances to total deposits ratio
This ratio evaluate the efficiency and capabilities of the banks management in
applying the deposits (including the receivables) available excluding the other
funds viz. Equity capital etc. Into reach earning advances.
Value in crores: 000’sare omitted
Year 2010 2011 2012 2013 2014 Total advances
1777118975 2320851112 2920771369 3336251972 4037153727
Total deposits
2459511455 3116032489 3926159450 4826388930 5799970560
Total advances to total deposits ratio = Total advances X 100
Total deposits
Year 2010 2011 2012 2013 2014 Total advances to total deposits ratio
72.25% 74.48% 74.39% 69.12% 69.60%
22
In the above table and graph, we see that the total advances to total deposits
ratio has been fluctuating. The ratio was the highest at 74.48% in the year 2011.
In 2010 the ratio was 72.25%, in year 2011 the ratio was 74.48%, in 2012 the ratio
was 74.39%, in 2013 the ratio was 69.12% and in 2014 the ratio is 69.60%.
This ratio should be kept as high as possible. If advances are high so will be the
income from the operations. The bank also has to keep various reserves, so it
should maintain balance between advances and deposits. In the above graph we
can see that the advances are about 70% in the last 5 years, which is a good
satisfactory condition.
66
67
68
69
70
71
72
73
74
75
20102011
20122013
2014
Total advances to total deposits ratio (in %)
TOTAL ADVANCES TO TOTALDEPOSITS RATIO (IN %)

23
3.3.2Returns on equity
It is a measure of the profitability of the bank. In calculation of this ratio, profit
after tax is expressed as a percentage of equity.
Year 2010 2011 2012 2013 2014
Net profit (000’s are omitted)
32498728 45159105 53872358 49829573 52819205
Number of equity share
365527700 392807300 412384600 422517500 430676300
Returns on equity= Net profitx 100
No. of equity share
Year 2010 2011 2012 2013 2014 Returns on equity
8.89% 11.49% 13.06% 11.79% 12.26%

24
In the above table and graph, we see that the return on equity has been
fluctuating. The ratio was the highest at 13.06% in the year 2012. In 2010 the
ratio was 8.89%, in year 2011 the ratio was 11.49%, in 2012 the ratio was 13.06%,
in 2013 the ratio was 11.79% and in 2014 the ratio is 12.26%.
This ratio gives us the earning per share issued. The returns should be kept at a
constant/increasing rate which is also very attractive. In the above graph we can
see that the average returns are about 11.5% of the net earnings of the bank. The
rate is very good. A return on equity has increased every year, which has yielded
more return to the shareholders.
0
2
4
6
8
10
12
14
20102011
20122013
2014
RETURNS ON EQUITY (IN %)
RETURNS ON EQUITY (IN %)
25
3.4Earning quality
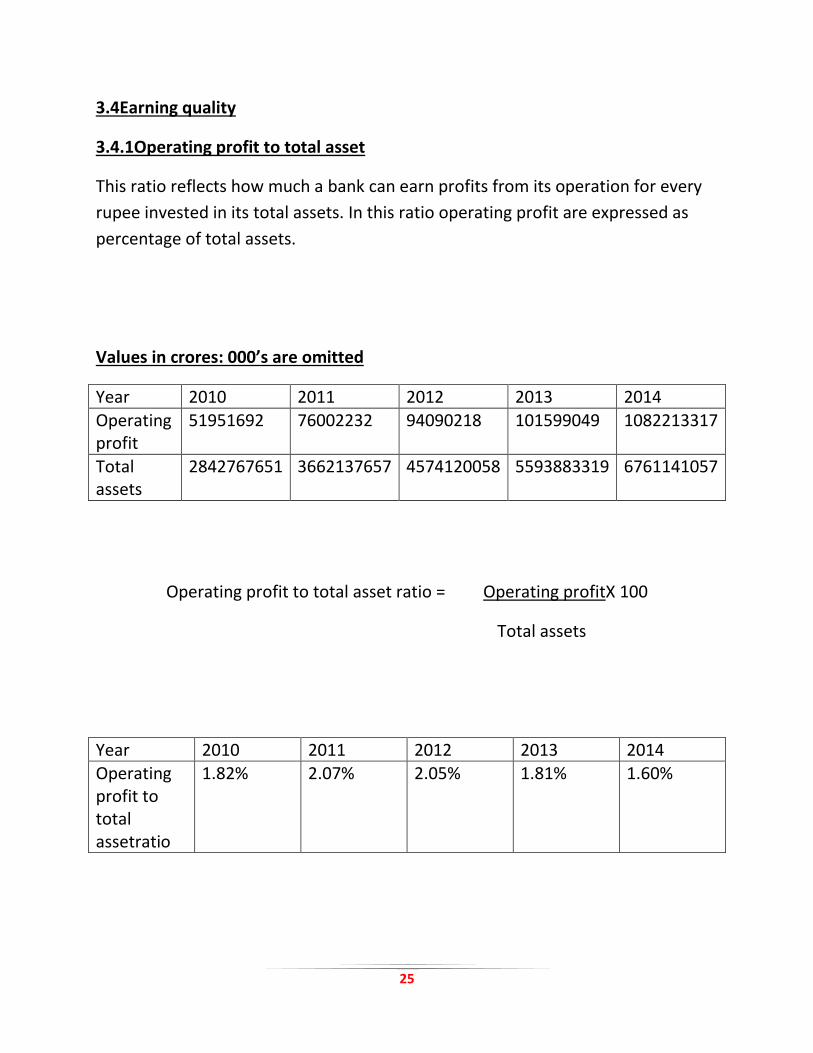
3.4.1Operating profit to total asset
This ratio reflects how much a bank can earn profits from its operation for every
rupee invested in its total assets. In this ratio operating profit are expressed as
percentage of total assets.
Values in crores: 000’s are omitted
Year 2010 2011 2012 2013 2014
Operating profit
51951692 76002232 94090218 101599049 1082213317
Total assets
2842767651 3662137657 4574120058 5593883319 6761141057
Operating profit to total asset ratio = Operating profitX 100
Total assets
Year 2010 2011 2012 2013 2014 Operating profit to total assetratio
1.82% 2.07% 2.05% 1.81% 1.60%

26
In the above table and graph, we see that the operating profit to total asset has
been fluctuating. The ratio was the highest at 2.07% in the year 2011. In 2010 the
ratio was 1.82%, in year 2011 the ratio was 2.07%, in 2012 the ratio was 2.05%, in
2013 the ratio was 1.81% and in 2014 the ratio is 1.60%.
In the above graph we can see that the ratio is always above 1.5% which is good,
it means that for every 100 rupees invested the bank can get 1.5% increase in the
returns it will give. For example if we invest Rs.100 than at the end of the year we
will get rs101.5 as our returns.
0
0.5
1
1.5
2
2.5
2010 20112012
20132014
Operating profit to total asset ratio (in %)
OPERATING PROFIT TO TOTALASSET RATIO (IN %)

27
3.4.2Net profit to total assets
This ratio reflects the return in assets employed or the efficiency in utilization of
assets. It is calculated by dividing the net profits with the total assets of the bank.
Higher ratio reflects better earning potential of a bank in the future.
Values in crores: 000’s are omitted
Year 2010 2011 2012 2013 2014
Net profit 32498728 45159105 53872358 49829573 52819205 Total assets
2842767651 3662137657 4574120058 5593883319 6761141057
Net profit to total assets ratio = Net profit X 100
Total assets
Year 2010 2011 2012 2013 2014
Net profit to total assets ratio
1.14% 1.23% 1.17% 0.89% 0.78%

28
In the above table and graph, we see that the net profit to total asset ratio has
been fluctuating. The ratio was the highest at 1.23% in the year 2011. In 2010 the
ratio was 1.14%, in year 2011 the ratio was 1.23%, in 2012 the ratio was 1.17%, in
2013 the ratio was 0.89% and in 2014 the ratio is 0.78%.
In the above graph we can see that the ratio is on an average 1% every year. It
means that for every 100 rupees invested the bank can get 1% increase in the
returns it will give. For example if we invest Rs.100 than at the end of the year we
will get rs101 as our returns. An increase in this ratio means higher amounts of
net profit i.e.Income from investment.
0
0.2
0.4
0.6
0.8
1
1.2
1.4
2010 20112012
20132014
NET PROFIT TO TOTAL ASSETS RATIO (IN %)
NET PROFIT TO TOTAL ASSETSRATIO (IN %)

29
3.4.3Interest income to total income ratio
Interest income is considered as prime source of revenue for bank. The interest
income to total income reflects the capability of the bank in generating income
from its lending business.
Values in crores: 000’s are omitted
Year 2010 2011 2012 2013 2014
Interest income
172348186 225133054 304884936 364420574 404628927
Total income
202001151 258004056 345889102 409526805 460180460
Interest income to total income ratio = Interest incomeX 100
Total income
Year 2010 2011 2012 2013 2014 Interest income to total income ratio
85.32% 87.25% 88.14% 88.98% 87.92%

30
In the above table and graph, we see that the interest income to total income
ratio has been fluctuating. The ratio was the highest at 88.98% in the year 2013.
In 2010 the ratio was 85.32%, in year 2011 the ratio was 87.25%, in 2012 the ratio
was 88.14%, in 2013 the ratio was 88.98%and in 2014 the ratio is 87.92%.
This ratio shows the income from the operations of the bank. High ratio will
indicate the performance of the bank from its operations. Interestearned should
be as high as possible, as the major function of the bank is lending of funds to the
customers.
In the above graph we can see that the ratio is always above 85%. This means that
the income is generated from the operations of the business.The bank has to see
that the ratio is maintained at high levels.
83
84
85
86
87
88
89
2010 20112012
20132014
INTEREST INCOME TO TOTAL INCOME (IN %)
INTEREST INCOME TO TOTALINCOME (IN %)

31
3.5Liquidity
Risk of liquidity can have an effect on the image of bank. Liquidity is a crucial
aspect which reflects banks’ ability to meet its financial obligation. An adequate
liquidity position means a situation, where organization can obtain sufficient
liquid fund, either by increasing liabilities or by converting its assets into cash.
3.5.1Liquid assets to total assets ratio
This ratio measures the overall liquidity position of the bank. The liquid asset
include cash in hand, money at call and short notice, balance with reserve bank
ofIndia and balance with banks (India and abroad).total asset include the
revaluation of all the assets.
Values in crores: 000’s are omitted
Year 2010 2011 2012 2013 2014 Liquid asset
365694792 514237272 658103467 877020666 1343556680
Total asset
2842767651 3662137657 4574120058 5593883319 6761141057
Liquid assets to total assets= liquid assetsX 100
Total assets
Years 2010 2011 2012 2013 2014 Liquid assets to total assets ratio
12.86% 14.04% 14.38% 15.67% 19.87%

32
In the above table and graph, we see that the liquid assets to total assets ratio has
been fluctuating. The ratio was the highest at 19.87% in the year 2014. In 2010
the ratio was 12.86%, inyear 2011 the ratio was 14.04%, in 2012 the ratio was
14.38%, in 2013 the ratio was 15.67% and in 2014 the ratio is 19.87%.
This ratio shows the assets kept as liquid form or can be liquidated as easily and
as fast as possible. The ratio should be kept at a balanced rate. Lending and
liquidity have to be kept balanced.
In the above graph we can see that the ratio is increasing and is above 12%. This
ratio ensures that the bank will have enough liquid assets in order to cope-up
with sudden demand for withdrawals.
0
2
4
6
8
10
12
14
16
18
20
20102011
20122013
2014
LIQUID ASSETS TO TOTAL ASSETS (IN %)
LIQUID ASSETS TO TOTALASSETS (IN %)

33
3.5.2Liquid asset to total depositsratio
This ratio measures the liquidity available to the depositor of a bank. It is
calculated by dividing the liquid asset with total deposits.
Value in crores: 000’s are omitted
Year 2010 2011 2012 2013 2014
Liquid assets
365694792 514237272 568103467 877020666 1343556680
Total deposits
2459511455 3116032489 3926159450 4826388930 5799970560
Liquid assets to total deposits ratio = Liquid assets x 100
Total deposit
Year 2010 2011 2012 2013 2014 Liquid assets to total deposits ratio
14.86% 16.50% 16.76% 18.17% 23.16%

34
In the above table and graph, we see that the liquid assets to total deposits ratio
has been fluctuating. The ratio was the highest at 23.16% in the year 2014. In
2010 the ratio was 14.86%, in year 2011 the ratio was 16.50%, in 2012 the ratio
was 16.76%, in 2013 the ratio was 18.17% and in 2014 the ratio is 23.16%.
This ratio shows the percentage of liquid assets /investment in comparison to the
total deposits available in the bank .the bank should maintain balance between
the liquid assets and its advances in order to ensure constant flow of withdrawals
to the customer.
In the above graph we can see that the ratio is increasing every year which is a
sign showing that the bank is maintaining a proper balance.
0
5
10
15
20
25
20102011
20122013
2014
Liquid assets to total deposits (in %)
LIQUID ASSETS TO TOTALDEPOSITS (IN %)
35
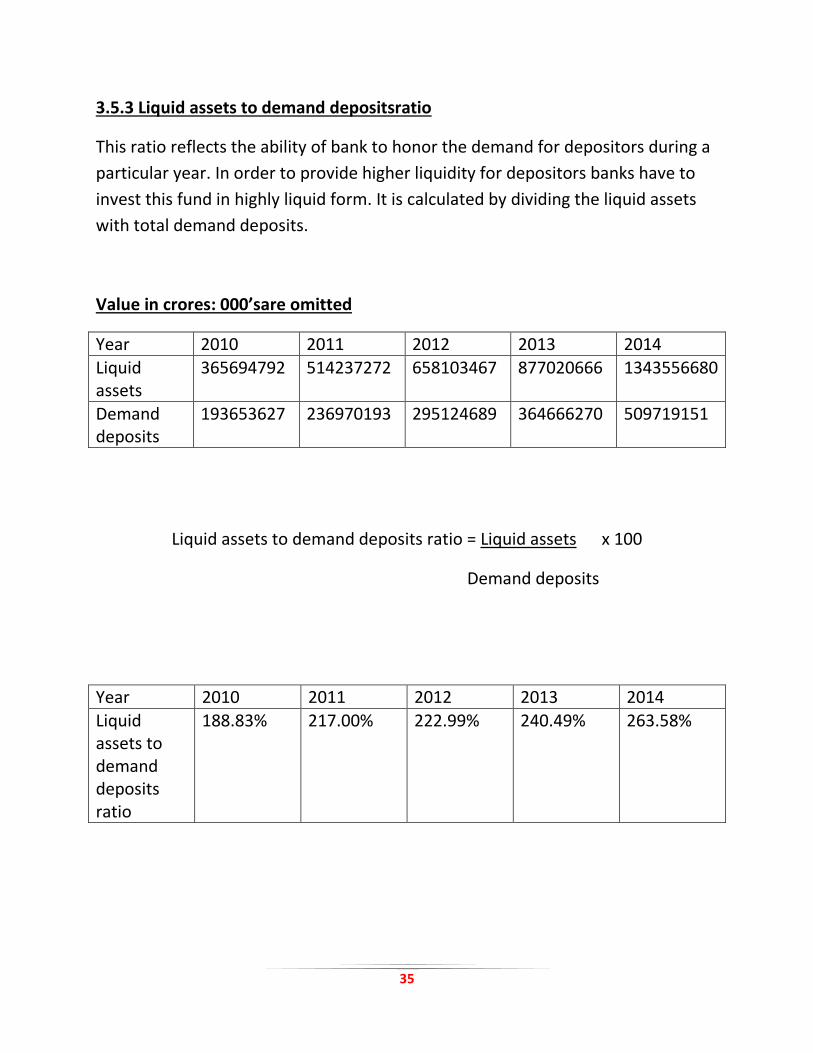
3.5.3 Liquid assets to demand depositsratio
This ratio reflects the ability of bank to honor the demand for depositors during a
particular year. In order to provide higher liquidity for depositors banks have to
invest this fund in highly liquid form. It is calculated by dividing the liquid assets
with total demand deposits.
Value in crores: 000’sare omitted
Year 2010 2011 2012 2013 2014
Liquid assets
365694792 514237272 658103467 877020666 1343556680
Demand deposits
193653627 236970193 295124689 364666270 509719151
Liquid assets to demand deposits ratio = Liquid assets x 100
Demand deposits
Year 2010 2011 2012 2013 2014
Liquid assets to demand deposits ratio
188.83% 217.00% 222.99% 240.49% 263.58%

36
In the above table and graph, we see that the liquid assets to demand deposits
ratio have been fluctuating. The ratio was the highest at 260.58% in the year
2014. In 2010 the ratio was 188.83%, in year 2011 the ratio was 217%, in 2012 the
ratio was 222.99%, in 2013 the ratio was 240.49% and in 2014 the ratio is
263.58%.
This ratio shows the percentage of liquid assets /investment in comparison to the
total deposits available in the bank. The bank should maintain balance between
the liquid assets and its advances in order to ensure constant flow of withdrawals
to the customer.
In the above graph we can see that the ratio is increasing every year which is a
sign showing that the bank is maintaining a proper balance.
0
50
100
150
200
250
300
2010 20112012
20132014
Liquid assets to demand deposits(In %)
LIQUID ASSETS TO DEMANDDEPOSITS RATIO (IN %)
37
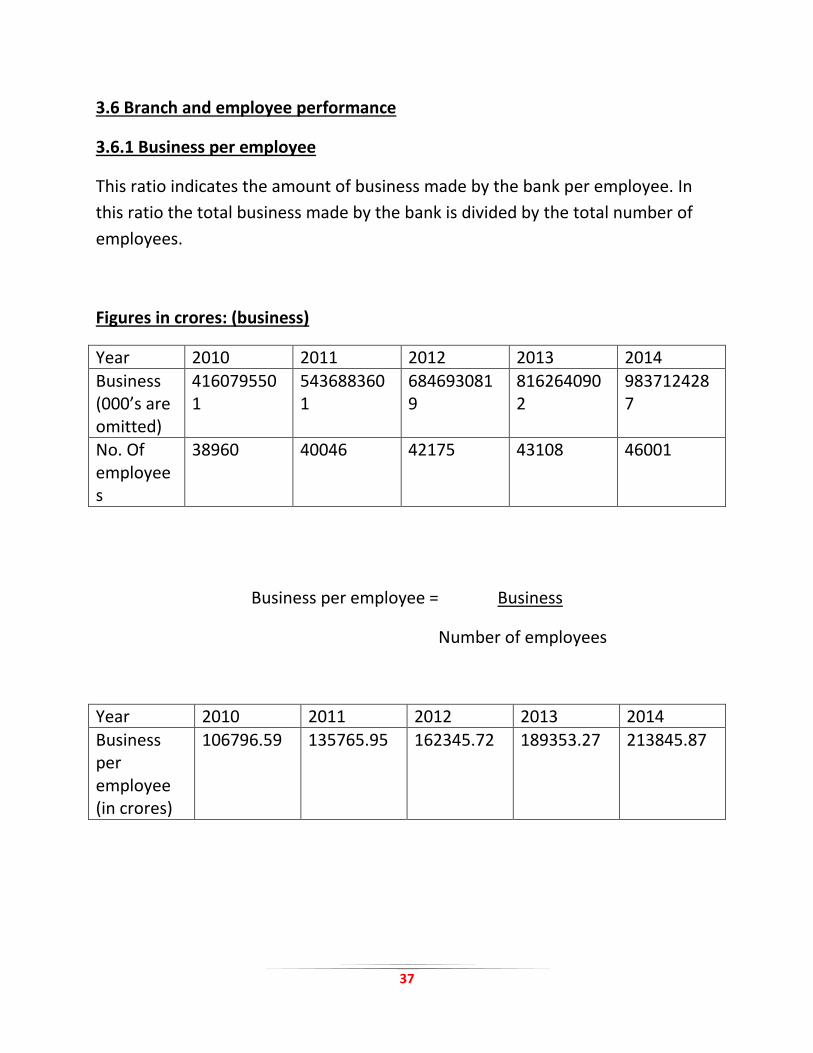
3.6 Branch and employee performance
3.6.1 Business per employee
This ratio indicates the amount of business made by the bank per employee. In
this ratio the total business made by the bank is divided by the total number of
employees.
Figures in crores: (business)
Year 2010 2011 2012 2013 2014
Business (000’s are omitted)
4160795501
5436883601
6846930819
8162640902
9837124287
No. Of employees
38960 40046 42175 43108 46001
Business per employee = Business
Number of employees
Year 2010 2011 2012 2013 2014
Business per employee (in crores)
106796.59 135765.95 162345.72 189353.27 213845.87

38
In the above table and graph, we see that the business per employee has been
steadily increasing. Thebusiness was the highest at Rs.213845.87crores per
employee in the year 2014. In 2010 the business was Rs.106796.59 crores per
employee, in year 2011 the business was Rs.135765.95 crores per employee , in
2012 the business was Rs.162345.72 crores per employee, in 2013 the business
was Rs.189353.27crores per employee, in 2014 the ratio is Rs.213845.87crores
per employee.
This ratio shows the efficiency levels of the employees to generate business to the
bank. More the ratio more is the efficiency level of the banks employees.
In the above graph we can see that business per employee is constantly
increasing.
0
50000
100000
150000
200000
250000
2010 20112012
20132014
BUSINESS PER EMPLOYEE
BUSINESS PER EMPLOYEE

39
3.6.2 Net profit per employee
This ratio indicates the amount of net profit made by the bank per employee. In
this ratio the total net profit made by the bank is divided by the total number of
employees.
Figures in crores: (business)
Year 2010 2011 2012 2013 2014
Net profit (000’s are omitted)
32498728 45159105 53872358 49829573 52819205
No. Of employees
38960 40046 42175 43108 46001
Net profit per employees = Net profit
Number of employees
Year 2010 2011 2012 2013 2014
Business per employees (in crores)
834.14 1127.68 1277.35 1155.92 1148.21

40
In the above table and graph, we see that the net profit per employee has been
fluctuating. The business was the highest at Rs. 1277.35 crores per employee in
the year 2012. In 2010 the business was Rs. 834.14crores per employee, in year
2011 the business was Rs. 1127.68crores per employee , in 2012 the business was
Rs. 1277.35 crores per employee, in 2013 the business was Rs. 1155.92 crores per
employee, in 2014 the ratio is Rs. 1148.21crores per employee.
This ratio shows the efficiency levels of the employees to generate business to the
bank. More the ratio more is the efficiency level of the banks employees.
In the above graph we can see that net profit per employee is growing at an
acceptable rate.
0
200
400
600
800
1000
1200
1400
2010 20112012
20132014
NET PROFIT PER EMPLOYEES
NET PROFIT PER EMPLOYEES
41
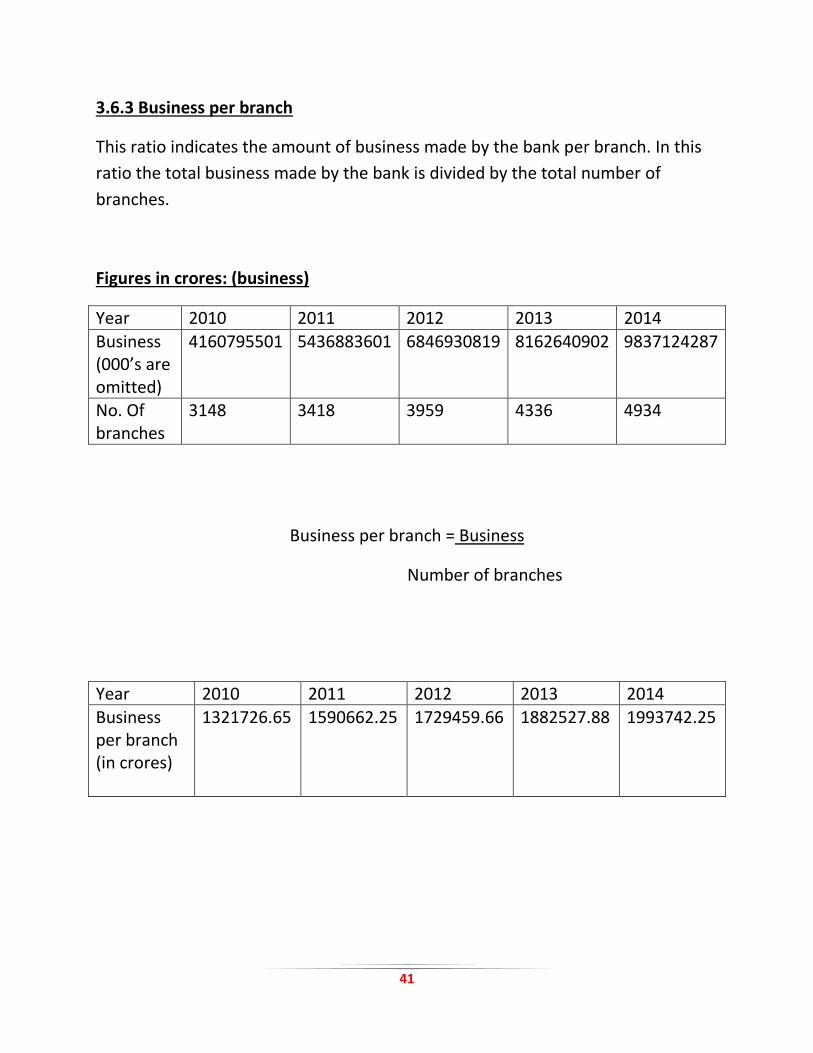
3.6.3 Business per branch
This ratio indicates the amount of business made by the bank per branch. In this
ratio the total business made by the bank is divided by the total number of
branches.
Figures in crores: (business)
Year 2010 2011 2012 2013 2014
Business (000’s are omitted)
4160795501 5436883601 6846930819 8162640902 9837124287
No. Of branches
3148 3418 3959 4336 4934
Business per branch = Business
Number of branches
Year 2010 2011 2012 2013 2014
Business per branch (in crores)
1321726.65 1590662.25 1729459.66 1882527.88 1993742.25

42
In the above table and graph, we see that the business per branch has been
steadily increasing. The business was the highest at Rs.1993742.25 crores per
branch in the year 2014. In 2010 the business was Rs.1321726.65 crores per
branch, in year 2011 the business was Rs.1590662.25 crores per branch, in 2012
the business was Rs.1729459.66 crores per branch, in 2013 the business was
Rs.1882527.88 crores per branch and in 2014 the ratio is Rs. 1993742.25 crores
per employee.
In the above graph we can see that business of the bank per branch has increased
every year, which is a good sign for the bank.
0
200000
400000
600000
800000
1000000
1200000
1400000
1600000
1800000
2000000
2010 20112012
20132014
BUSINESS PER BRANCH
BUSINESS PER BRANCH
43
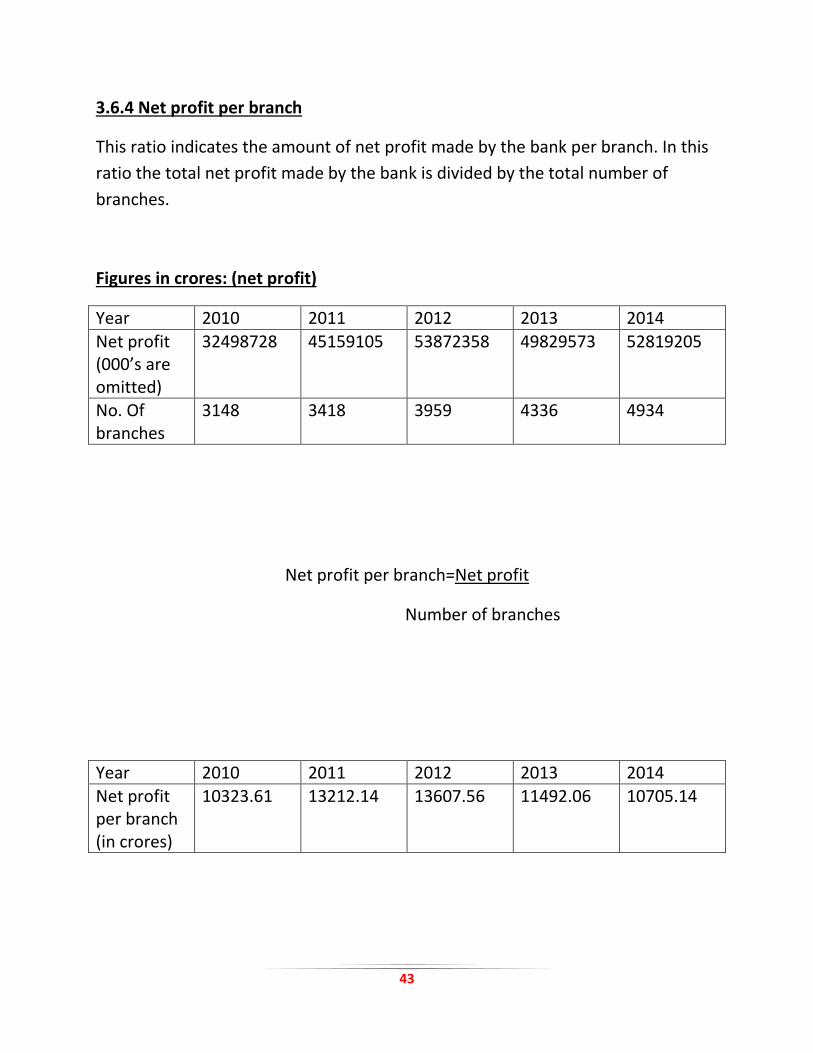
3.6.4 Net profit per branch
This ratio indicates the amount of net profit made by the bank per branch. In this
ratio the total net profit made by the bank is divided by the total number of
branches.
Figures in crores: (net profit)
Year 2010 2011 2012 2013 2014
Net profit (000’s are omitted)
32498728 45159105 53872358 49829573 52819205
No. Of branches
3148 3418 3959 4336 4934
Net profit per branch=Net profit
Number of branches
Year 2010 2011 2012 2013 2014
Net profit per branch (in crores)
10323.61 13212.14 13607.56 11492.06 10705.14

44
In the above table and graph, we see that the net profit per branch has been
fluctuating. The net profit was the highest at Rs.13607.56 crores per branch in the
year 2012. In 2010 the net profit was Rs.10323.61 crores per branch, in year 2011
the net profit was Rs.13212.14 crores per branch, in 2012 the net profit was
Rs.13607.56 crores per branch, in 2013 the net profit wasRs.11492.06 crores per
branch and in 2014 the ratio is Rs.10705.14 crores per branch.
Till 2012 net profit earned per branch has increased. However from 2013 onwards
it reduced. The reduction in net profit indicates inefficiency to manage their
branches.
0
2000
4000
6000
8000
10000
12000
14000
2010 20112012
20132014
Net profit per branch
NET PROFIT PER BRANCH

45
SUMMARY
Ratio 2010 2011 2012 2013 2014 Capital adequacy
Capital adequacy
12.84% 13.03% 12.95% 12.09% 11.66%
Debt to equity
0.85 0.78 1.08 0.97 1.67
Advances to total assets
62.51% 63.37% 63.85% 59.64% 59.71%
Govt. Securities to total investments
83.40% 85.13% 84.61% 84.98% 83.12%
Asset quality NPA to total advances
1.35% 1.35% 1.52% 2.39% 2.94%
Investments to total assets
22.21% 20.24% 18.95% 22.45% 18.06%
NPA to total assets
0.84% 0.86% 0.87% 1.42% 1.75%
MANAGERIAL EFFICIENCY Advances to total deposits
72.25% 74.48% 74.39% 69.12% 69.60%
Returns on equity
8.89% 11.49% 13.06% 11.79% 12.26%
Earning quality Operating profit to total assets
1.82% 2.07% 2.05% 1.81% 1.60%
Net profit to total assets
1.14% 1.23% 1.17% 0.89% 0.78%
Interest income to total income
85.32% 87.25% 88.14% 88.98% 87.92%
**Next page**

46
LIQUIDITY
Liquid assets to total assets
12.86% 14.04% 14.38% 15.67% 19.87%
Liquid assets to total deposits
14.86% 16.50% 16.76% 18.17% 23.16%
Liquid assets to demand deposits
188.83% 217.00% 222.99% 240.49% 263.58%
Branch and employee performance (in crores)
Business per employee
106796.59 135765.95 162345.72 189353.27 213845.87
Net profit per employee
834.14 1127.68 1277.35 1155.92 1148.21
Business per branch
1321726.65 15906620.25 1729459.66 1882527.88 1993742.25
Net profit per branch
10323.61 13212.44 13607.56 11492.06 10705.14

47
CONCLUSION
During the process of analysis done on Bank of Barodafor the 5 financial years
using camel model we conclude that:
Capital adequacy-
In our study, we found that BOB has grown into wider business unit each year.
The capital adequacy parameter is satisfactory in terms of percentage from the
year 2010 to 2014. The percentage is always above 9%.
Capital adequacy consists of capital adequacy ratio, debt-equity ratio, advance to
assets, government securities to total investment ratios. The capital adequacy
ratio of the bank stands at 11.66% for the year 2014, against RBI stipulated of9%
with tier i capital at8.22 % and tier ii capital at 5.16%. In the year 2014, BOB has
the highest debt-equity ratio compared to other years.The advance to asset ratio
is at a good level in 2014. BOBhas invested sufficient amount in government
securities in every year.
Asset Quality-
In terms of asset quality, the performance ofBOB in net NPA to net advances was
not very good in 2014 as compared to other years;NPA’s in 2014 were the highest
in 2014. Total investment to total assets ratio has decreased in 2014. The possible
reason was that, there was increase in total investments compared to other years
but proportionate increase was not there compared to previous year’s total
assets. NPA to total asset ratio increasing every year, in 2014 it was the highest at
1.75%.

48
Managerial efficiency-
Under management efficiency parameter it was observed that the efficiency has
acceptable from 2010 to 2014. Total advances to total deposits ratio has
decreased by 2.65%in 2014 when we compare it with 2010. Shareholders enjoyed
better return on equity in 2014as compared to other years.
Earning Quality-
In terms of earning quality parameter, BOB has had a stable period of 5 years
where its earning quality was quite similar. Interest income to total income was
has been increasing at a stable rate in the last 5 years, in the year 2014 the ratio is
87.92%.
Liquidity-
This is a parameter where BOB has done outstandingly well. All the three aspects
i.e. Liquid asset to total deposit, liquid asset to time deposits & liquid asset to
demand deposit have done well. All three ratios have shown a positive
movement.