bank of america merrill lynch 2018 global health …
TRANSCRIPT

SEPTEMBER 14, 2018
BANK OF AMERICA MERRILL LYNCH 2018 GLOBAL HEALTH CARE CONFERENCE
2
Provided September 14, 2018, as part of an oral presentation and is
qualified by such, contains forward-looking statements, actual results may
vary materially; Amgen disclaims any duty to update.
SAFE HARBOR STATEMENTThis presentation contains forward-looking statements that are based on management’s current expectations and beliefs and are subject to a number of risks, uncertainties andassumptions that could cause actual results to differ materially from those described. All statements, other than statements of historical fact, are statements that could be deemedforward-looking statements, including statements about estimates of revenues, operating margins, capital expenditures, cash, other financial metrics, expected legal, arbitration,political, regulatory or clinical results or practices, customer and prescriber patterns or practices, reimbursement activities and outcomes and other such estimates and results.Forward-looking statements involve significant risks and uncertainties, including those discussed below and more fully described in the Securities and Exchange Commission (SEC)reports filed by Amgen, including Amgen’s most recent annual report on Form 10-K and any subsequent periodic reports on Form 10-Q and Form 8-K. Please refer to Amgen’s mostrecent Forms 10-K, 10-Q and 8-K for additional information on the uncertainties and risk factors related to our business. Unless otherwise noted, Amgen is providing this informationas of September 14, 2018 and expressly disclaims any duty to update information contained in this presentation.
No forward-looking statement can be guaranteed and actual results may differ materially from those we project. Our results may be affected by our ability to successfully market bothnew and existing products domestically and internationally, clinical and regulatory developments involving current and future products, sales growth of recently launched products,competition from other products including biosimilars, difficulties or delays in manufacturing our products and global economic conditions. In addition, sales of our products areaffected by pricing pressure, political and public scrutiny and reimbursement policies imposed by third-party payers, including governments, private insurance plans and managedcare providers and may be affected by regulatory, clinical and guideline developments and domestic and international trends toward managed care and healthcare cost containment.Furthermore, our research, testing, pricing, marketing and other operations are subject to extensive regulation by domestic and foreign government regulatory authorities. We orothers could identify safety, side effects or manufacturing problems with our products, including our devices, after they are on the market. Our business may be impacted bygovernment investigations, litigation and product liability claims. In addition, our business may be impacted by the adoption of new tax legislation or exposure to additional taxliabilities. If we fail to meet the compliance obligations in the corporate integrity agreement between us and the U.S. government, we could become subject to significant sanctions.Further, while we routinely obtain patents for our products and technology, the protection offered by our patents and patent applications may be challenged, invalidated orcircumvented by our competitors, or we may fail to prevail in present and future intellectual property litigation. We perform a substantial amount of our commercial manufacturingactivities at a few key facilities, including in Puerto Rico, and also depend on third parties for a portion of our manufacturing activities, and limits on supply may constrain sales ofcertain of our current products and product candidate development. In addition, we compete with other companies with respect to many of our marketed products as well as for thediscovery and development of new products. Discovery or identification of new product candidates cannot be guaranteed and movement from concept to product is uncertain;consequently, there can be no guarantee that any particular product candidate will be successful and become a commercial product. Further, some raw materials, medical devicesand component parts for our products are supplied by sole third-party suppliers. Certain of our distributors, customers and payers have substantial purchasing leverage in theirdealings with us. The discovery of significant problems with a product similar to one of our products that implicate an entire class of products could have a material adverse effect onsales of the affected products and on our business and results of operations. Our efforts to acquire other companies or products and to integrate the operations of companies wehave acquired may not be successful. A breakdown, cyberattack or information security breach could compromise the confidentiality, integrity and availability of our systems and ourdata. Our stock price is volatile and may be affected by a number of events. Our business performance could affect or limit the ability of our Board of Directors to declare a dividendor our ability to pay a dividend or repurchase our common stock. We may not be able to access the capital and credit markets on terms that are favorable to us, or at all.
This presentation includes GAAP and non-GAAP financial measures. In accordance with the requirements of SEC Regulation G, reconciliations between these two measures, if theseslides are in hard copy, accompany the hard copy presentation or, if these slides are delivered electronically, are available on the Company's website at www.amgen.com within theInvestors section.
3
Provided September 14, 2018, as part of an oral presentation and is
qualified by such, contains forward-looking statements, actual results may
vary materially; Amgen disclaims any duty to update.
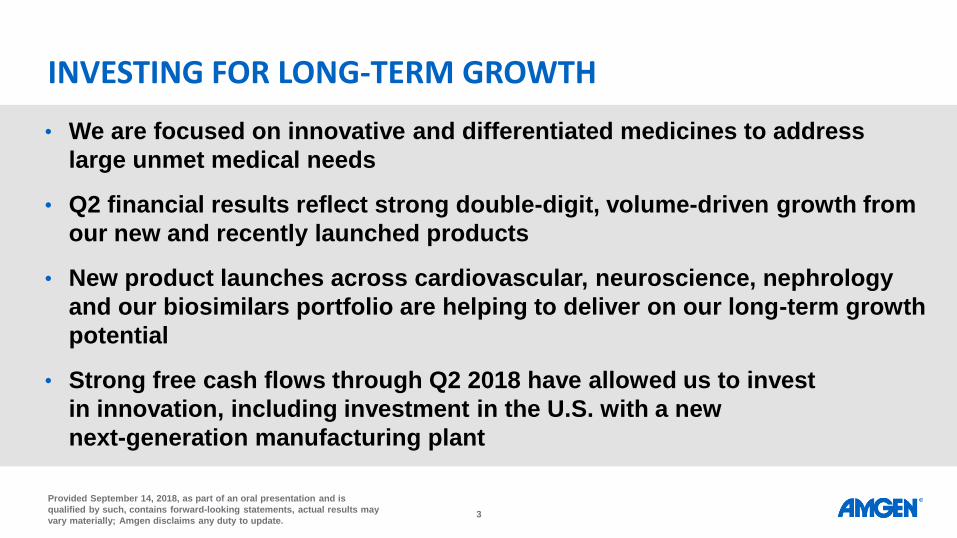
INVESTING FOR LONG-TERM GROWTH
• We are focused on innovative and differentiated medicines to address
large unmet medical needs
• Q2 financial results reflect strong double-digit, volume-driven growth from
our new and recently launched products
• New product launches across cardiovascular, neuroscience, nephrology
and our biosimilars portfolio are helping to deliver on our long-term growth
potential
• Strong free cash flows through Q2 2018 have allowed us to invest
in innovation, including investment in the U.S. with a new
next-generation manufacturing plant
4
Provided September 14, 2018, as part of an oral presentation and is
qualified by such, contains forward-looking statements, actual results may
vary materially; Amgen disclaims any duty to update.
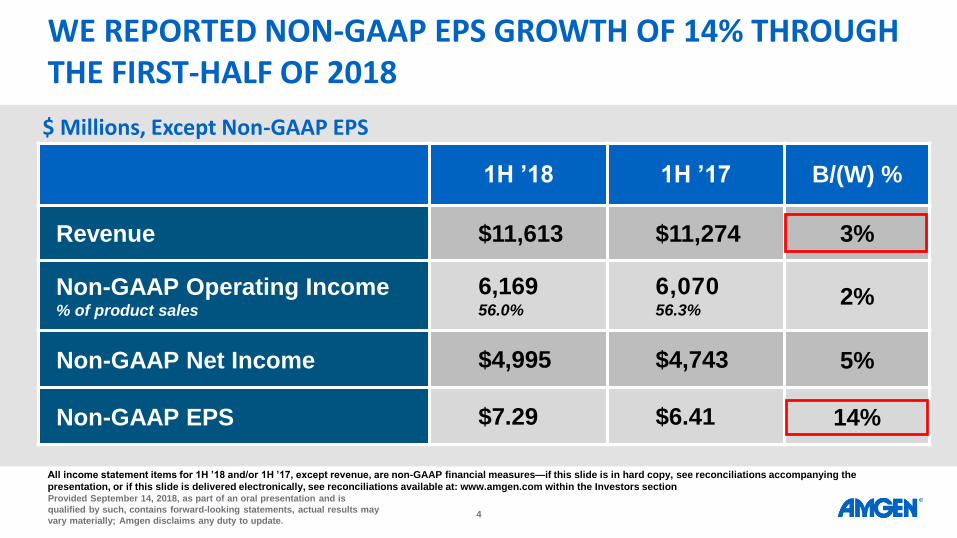
WE REPORTED NON-GAAP EPS GROWTH OF 14% THROUGH THE FIRST-HALF OF 2018
$ Millions, Except Non-GAAP EPS
All income statement items for 1H ’18 and/or 1H ’17, except revenue, are non-GAAP financial measures—if this slide is in hard copy, see reconciliations accompanying the
presentation, or if this slide is delivered electronically, see reconciliations available at: www.amgen.com within the Investors section
1H ’18 1H ’17 B/(W) %
Revenue $11,613 $11,274 3%
Non-GAAP Operating Income% of product sales
6,169 56.0%
6,07056.3%
2%
Non-GAAP Net Income $4,995 $4,743 5%
Non-GAAP EPS $7.29 $6.41 14%

5
Provided September 14, 2018, as part of an oral presentation and is
qualified by such, contains forward-looking statements, actual results may
vary materially; Amgen disclaims any duty to update.
2018 GUIDANCE REVISED UPWARD
*Non-GAAP financial measure—if this slide is in hard copy, see reconciliations accompanying the presentation, or if this slide is delivered electronically, or
amounts pertain to previously issued financial guidance, see reconciliations available at: www.amgen.com within the Investors section
Guidance(Provided Q2 2018)
Guidance(Provided Q1 2018)
Revenue $22.5B–$23.2B $21.9B–$22.8B
Non-GAAP EPS* $13.30–$14.00 $12.80–$13.70
Non-GAAP Tax Rate* 13.5%–14.5% 13.5%–14.5%
Capital Expenditures ~ $750M ~ $750M
Guidance is as of July 26, 2018 and is not being updated at this time.
KEY PRODUCT GROWTH DRIVERS

7
Provided September 14, 2018, as part of an oral presentation and is
qualified by such, contains forward-looking statements, actual results may
vary materially; Amgen disclaims any duty to update.
PROLIA®: A SUCCESSFUL BIOLOGICS COMMERCIALIZATION CASE STUDY IN BOTH SPECIALTY AND PRIMARY CARE MARKETS
$ Billions, Net Sales
$0.5 $0.7
$1.0
$1.3
$1.6
$2.0
2012 2013 2014 2015 2016 2017
33% CAGR
2012–2017
Highlights
Statements as of July 26, 2018
• Strong volume-driven growth since launch
• Grew 21% in Q2 2018, with double-digit
unit growth from share gains worldwide
– Repeat injection rates remain strong
• Continuing to increase investment to
support commercialization
• Expect Prolia® to remain a significant
growth driver
8
Provided September 14, 2018, as part of an oral presentation and is
qualified by such, contains forward-looking statements, actual results may
vary materially; Amgen disclaims any duty to update.
Highlights
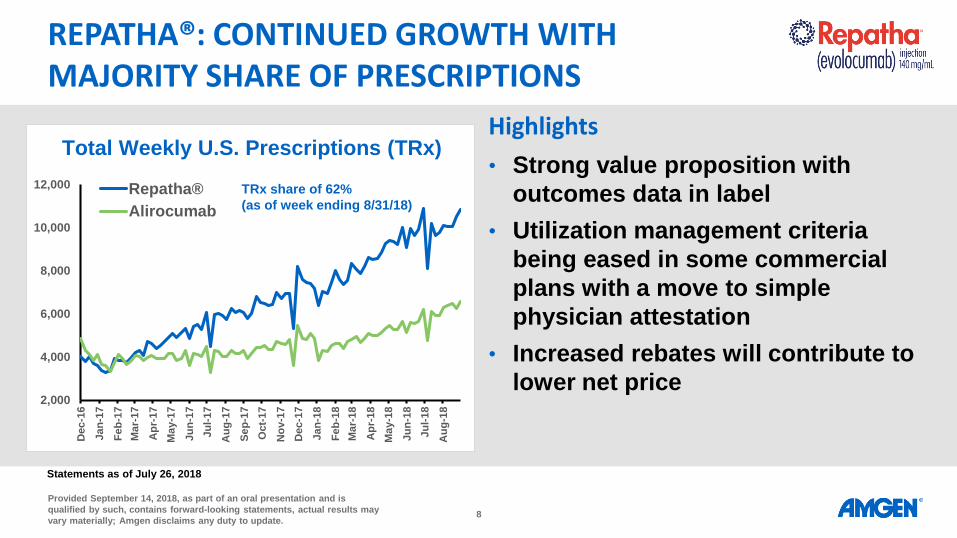
REPATHA®: CONTINUED GROWTH WITH MAJORITY SHARE OF PRESCRIPTIONS
• Strong value proposition with
outcomes data in label
• Utilization management criteria
being eased in some commercial
plans with a move to simple
physician attestation
• Increased rebates will contribute to
lower net price
Statements as of July 26, 2018
2,000
4,000
6,000
8,000
10,000
12,000
Dec-1
6
Jan
-17
Fe
b-1
7
Ma
r-17
Ap
r-17
Ma
y-1
7
Ju
n-1
7
Ju
l-17
Au
g-1
7
Se
p-1
7
Oct-
17
No
v-1
7
Dec-1
7
Jan
-18
Fe
b-1
8
Ma
r-18
Ap
r-18
Ma
y-1
8
Ju
n-1
8
Ju
l-18
Au
g-1
8
Repatha®
Alirocumab
TRx share of 62%
(as of week ending 8/31/18)
Total Weekly U.S. Prescriptions (TRx)
9
Provided September 14, 2018, as part of an oral presentation and is
qualified by such, contains forward-looking statements, actual results may
vary materially; Amgen disclaims any duty to update.
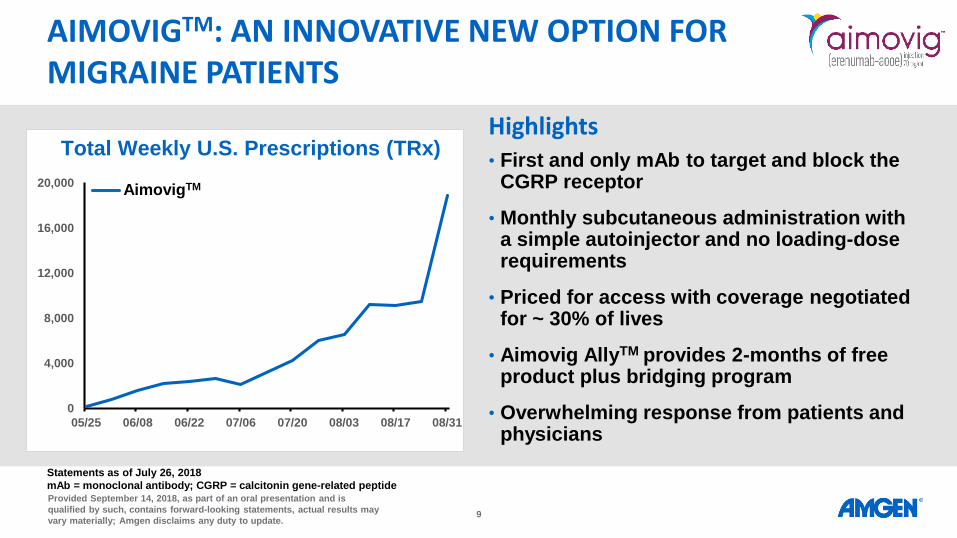
AIMOVIGTM: AN INNOVATIVE NEW OPTION FOR MIGRAINE PATIENTS
• First and only mAb to target and block the CGRP receptor
• Monthly subcutaneous administration with a simple autoinjector and no loading-dose requirements
• Priced for access with coverage negotiated for ~ 30% of lives
• Aimovig AllyTM provides 2-months of free product plus bridging program
• Overwhelming response from patients and physicians
Highlights
0
4,000
8,000
12,000
16,000
20,000
05/25 06/08 06/22 07/06 07/20 08/03 08/17 08/31
Total Weekly U.S. Prescriptions (TRx)
Statements as of July 26, 2018
mAb = monoclonal antibody; CGRP = calcitonin gene-related peptide
AimovigTM

10
Provided September 14, 2018, as part of an oral presentation and is
qualified by such, contains forward-looking statements, actual results may
vary materially; Amgen disclaims any duty to update.
• Strong execution with our lifecycle management strategies
– Neulasta® Onpro® kit exited Q2 ’18 with 63% share of Neulasta® units
– ESA contract with DaVita through 2022
– Shift of EPOGEN® to Aranesp® at small-to-midsize dialysis centers
– Aranesp® and Enbrel® have U.S. exclusivity through 2024
and 2029, respectively
• We continue to make strategic investments in ENBREL
WE EXPECT OUR MATURE BRANDS TO GENERATE STRONG CASH FLOWS FOR MANY YEARS TO COME
ESA = erythropoiesis-stimulating agent

11
Provided September 14, 2018, as part of an oral presentation and is
qualified by such, contains forward-looking statements, actual results may
vary materially; Amgen disclaims any duty to update.
OUR KEY PIPELINE OPPORTUNITIES INCLUDE…
Inflammation
Tezepelumab
AMG 592 (IL-2 Mutein)
Cardiovascular
Omecamtiv mecarbil
AMG 890 (Lp(a))
Cancer
13 BiTE® programs
BLINCYTO®—new indications
IMLYGIC®—new indications
Biosimilars
Portfolio of 10 Molecules• KANJINTI™1 launched in EU
• AMGEVITA™ soon to be launched in EU
Neuroscience
AMG 520 (CNP520)
AMG 301 (PAC1 antibody)
Bone
EVENITY™
BiTE® = bispecific T-cell engager antibody; PAC1 = pituitary adenylate cyclase-activating polypeptide type I receptor1KANJINTI™ trade name provisionally approved in U.S.

12
Provided September 14, 2018, as part of an oral presentation and is
qualified by such, contains forward-looking statements, actual results may
vary materially; Amgen disclaims any duty to update.
StatusOriginator Worldwide
2017 Sales*
AMJEVITA™1 October 2018 EU launch; U.S. 2023 HUMIRA® ~ $19B
MVASI™2/ABP 215 Approved in U.S. and EU Avastin® ~ $7B
KANJINTI™3/ABP 980Launched in EU
Filed in U.S. (complete response letter)Herceptin® ~ $7B
ABP 710 Reported Phase 3 RA data REMICADE® ~ $7B
ABP 798 Phase 3 RITUXAN® ~ $7B
ABP 959 Completed Phase 1 Soliris® ~ $3B
ABP 494 Process development ERBITUX® ~ $2B
Molecules #8–#10 Process development ~ $12B
Total ~ $65B+
WE EXPECT BIOSIMILARS TO BE A GROWTH OPPORTUNITY
*Per EvaluatePharma (December 13, 2017); numbers may not add due to rounding; RA = rheumatoid arthritis1Approved in Europe as AMGEVITA™; 2MVASI™ trade name approved in U.S.; 3KANJINTI™ trade name provisionally approved in U.S.

13
Provided September 14, 2018, as part of an oral presentation and is
qualified by such, contains forward-looking statements, actual results may
vary materially; Amgen disclaims any duty to update.
264%
147%
AMGN S&P 500
DISCIPLINED CAPITAL ALLOCATION HAS GENERATEDLONG-TERM SHAREHOLDER VALUE
Strong Total Returns to Shareholders
*Represents annualized dividend after September 2011 initiation
Total Shareholder Return (TSR)
January 1, 2011 Through December 31, 2017
*
$0.56
$1.44
$1.88
$2.44
$3.16
$4.00
$4.60
2011 2012 2013 2014 2015 2016 2017
$1.12 29%
31%
30%
30%
27%
15%
Annual Dividend IncreasesThrough 2017, Dividend Increased
Over 300% Since Inception in 2011

14
Provided September 14, 2018, as part of an oral presentation and is
qualified by such, contains forward-looking statements, actual results may
vary materially; Amgen disclaims any duty to update.
Our outlook remains strong
• Long-term growth will be driven by
– Innovative and differentiated molecules and delivery systems
– Biosimilars
– International expansion
• Prolia®, Repatha®, Aimovig™ and biosimilars will add to
volume-driven growth
• Solid operating margin, strong cash flows and significant return
of cash to shareholders*
WE HAVE COMPELLING LONG-TERM GROWTH DRIVERS
*55.1% Non-GAAP operating margin, $1.9 billion Non-GAAP free cash flow and $4.1 billion returned to shareholders via dividends and share repurchases in Q2 2018;
Q2 2018 operating margin and free cash flow are non-GAAP financial measures—if this slide is in hard copy, see reconciliations accompanying the presentation, or if this slide is
delivered electronically, see reconciliations available at: www.amgen.com within the Investors section

RECONCILIATIONS

16
Provided September 14, 2018, as part of an oral presentation and is
qualified by such, contains forward-looking statements, actual results may
vary materially; Amgen disclaims any duty to update.
Amgen Inc.
GAAP to Non-GAAP Reconciliations
(Dollars in millions)
(Unaudited)
2018 2017 2018 2017
GAAP cost of sales 1,024$ 1,024$ 1,968$ 2,020$
Adjustments to cost of sales:
Acquisition-related expenses (a) (279) (314) (545) (628)
Total adjustments to cost of sales (279) (314) (545) (628)
Non-GAAP cost of sales 745$ 710$ 1,423$ 1,392$
GAAP cost of sales as a percentage of product sales 18.0% 18.4% 17.9% 18.8%
Acquisition-related expenses (a) -4.9 -5.7 -5.0 -5.9Non-GAAP cost of sales as a percentage of product sales 13.1% 12.7% 12.9% 12.9%
GAAP research and development expenses 869$ 873$ 1,629$ 1,642$
Adjustments to research and development expenses:
Acquisition-related expenses (a) (19) (19) (40) (38)
Certain net charges pursuant to our restructuring initiative - (3) - (5)
Total adjustments to research and development expenses (19) (22) (40) (43)
Non-GAAP research and development expenses 850$ 851$ 1,589$ 1,599$
GAAP research and development expenses as a percentage of product sales 15.3% 15.7% 14.8% 15.2%
Acquisition-related expenses (a) -0.3 -0.3 -0.4 -0.3
Certain net charges pursuant to our restructuring initiative 0.0 -0.1 0.0 -0.1Non-GAAP research and development expenses as a percentage of product sales 15.0% 15.3% 14.4% 14.8%
GAAP selling, general and administrative expenses 1,353$ 1,209$ 2,480$ 2,273$
Adjustments to selling, general and administrative expenses:
Acquisition-related expenses (a) (20) (32) (45) (57)
Certain net charges pursuant to our restructuring initiative - - (3) -
Other - (3) - (3)
Total adjustments to selling, general and administrative expenses (20) (35) (48) (60)
Non-GAAP selling, general and administrative expenses 1,333$ 1,174$ 2,432$ 2,213$
GAAP selling, general and administrative expenses as a percentage of product sales 23.8% 21.7% 22.5% 21.1%
Acquisition-related expenses (a) -0.3 -0.5 -0.4 -0.6
Certain net charges pursuant to our restructuring initiative 0.0 0.0 0.0 0.0
Other 0.0 -0.1 0.0 0.0
Non-GAAP selling, general and administrative expenses as a percentage of product sales 23.5% 21.1% 22.1% 20.5%
GAAP operating expenses 3,227$ 3,112$ 6,055$ 5,985$
Adjustments to operating expenses:
Adjustments to cost of sales (279) (314) (545) (628)
Adjustments to research and development expenses (19) (22) (40) (43)
Adjustments to selling, general and administrative expenses (20) (35) (48) (60)
Certain net charges pursuant to our restructuring initiative (b) 7 (9) 6 (46)
Certain other expenses (25) - (25) -
Acquisition-related adjustments (c) 37 3 41 (4)
Total adjustments to operating expenses (299) (377) (611) (781)
Non-GAAP operating expenses 2,928$ 2,735$ 5,444$ 5,204$
Three months ended Six months ended
June 30, June 30,

17
Provided September 14, 2018, as part of an oral presentation and is
qualified by such, contains forward-looking statements, actual results may
vary materially; Amgen disclaims any duty to update.
Amgen Inc.
GAAP to Non-GAAP Reconciliations
(Dollars in millions)
(Unaudited)
2018 2017 2018 2017
Non-GAAP operating expenses 2,928$ 2,735$ 5,444$ 5,204$
GAAP operating income 2,832$ 2,698$ 5,558$ 5,289$
Adjustments to operating expenses 299 377 611 781
Non-GAAP operating income 3,131$ 3,075$ 6,169$ 6,070$
GAAP operating income as a percentage of product sales 49.9% 48.4% 50.4% 49.1%
Adjustments to cost of sales 4.9 5.7 5.0 5.9
Adjustments to research and development expenses 0.3 0.4 0.4 0.4
Adjustments to selling, general and administrative expenses 0.3 0.6 0.4 0.6
Certain net charges pursuant to our restructuring initiative (b) 0.0 0.2 0.0 0.3
Certain other expenses 0.4 0.0 0.2 0.0
Acquisition-related adjustments (c) -0.7 -0.1 -0.4 0.0
Non-GAAP operating income as a percentage of product sales 55.1% 55.2% 56.0% 56.3%
GAAP interest and other income, net 162$ 165$ 393$ 360$
Adjustments to other income (d) - - (75) -
Non-GAAP interest and other income, net 162$ 165$ 318$ 360$
GAAP income before income taxes 2,647$ 2,542$ 5,266$ 5,002$
Adjustments to operating expenses 299 377 611 781
Adjustments to other income (d) - - (75) -
Non-GAAP income before income taxes 2,946$ 2,919$ 5,802$ 5,783$
GAAP provision for income taxes 351$ 391$ 659$ 780$
Adjustments to provision for income taxes:
Income tax effect of the above adjustments (e) 74 117 138 236
Other income tax adjustments (f) (8) 1 10 24
Total adjustments to provision for income taxes 66 118 148 260
Non-GAAP provision for income taxes 417$ 509$ 807$ 1,040$
GAAP tax as a percentage of income before taxes 13.3% 15.4% 12.5% 15.6%Adjustments to provision for income taxes:
Income tax effect of the above adjustments (e) 1.2 2.0 1.2 2.0
Other income tax adjustments (f) -0.3 0.0 0.2 0.4
Total adjustments to provision for income taxes 0.9 2.0 1.4 2.4
Non-GAAP tax as a percentage of income before taxes 14.2% 17.4% 13.9% 18.0%
GAAP net income 2,296$ 2,151$ 4,607$ 4,222$
Adjustments to net income:
Adjustments to income before income taxes, net of the income tax effect 225 260 398 545
Other income tax adjustments (f) 8 (1) (10) (24)
Total adjustments to net income 233 259 388 521
Non-GAAP net income 2,529$ 2,410$ 4,995$ 4,743$
Three months ended Six months ended
June 30, June 30,

18
Provided September 14, 2018, as part of an oral presentation and is
qualified by such, contains forward-looking statements, actual results may
vary materially; Amgen disclaims any duty to update.
Amgen Inc.
GAAP to Non-GAAP Reconciliations
(In millions, except per share data)
(Unaudited)
The following table presents the computations for GAAP and non-GAAP diluted EPS.
GAAP Non-GAAP GAAP Non-GAAP
Net income………………………………………………………..………………………………………………………………………………………………………………………………………………………………………………………………….2,296$ 2,529$ 2,151$ 2,410$
Weighted-average shares for diluted EPS……………………………………………...………………………………………………………………………………………………………………..660 660 738 738
Diluted EPS……………………………………………………………………………………………………………………………………………………………………………………………………………………………………………3.48$ 3.83$ 2.91$ 3.27$
GAAP Non-GAAP GAAP Non-GAAP
Net income………………………………………………………..………………………………………………………………………………………………………………………………………………………………………………………4,607$ 4,995$ 4,222$ 4,743$
Weighted-average shares for diluted EPS……………………………………………...………………………………………………………………………………………………………………..685 685 740 740
Diluted EPS……………………………………………………………………………………………………………………………………………………………………………………………………………………………………………6.73$ 7.29$ 5.71$ 6.41$
(a)
(b)
(c)
(d)
(e)
(f)
Three months ended Three months ended
June 30, 2018 June 30, 2017
Six months ended Six months ended
The tax effect of the adjustments between our GAAP and non-GAAP results takes into account the tax treatment and related tax rate(s) that apply to each adjustment in the applicable
tax jurisdiction(s). Generally, this results in a tax impact at the U.S. marginal tax rate for certain adjustments, including the majority of amortization of intangible assets, whereas the tax
impact of other adjustments, including restructuring expense, depends on whether the amounts are deductible in the respective tax jurisdictions and the applicable tax rate(s) in those
jurisdictions. Due to these factors, the effective tax rates for the adjustments to our GAAP income before income taxes, for the three and six months ended June 30, 2018 were 24.7%
and 25.7%, compared with 31.0% and 30.2% for the corresponding periods of the prior year.
The adjustments related primarily to certain acquisition items and prior period items excluded from GAAP earnings.
June 30, 2018 June 30, 2017
The adjustments related primarily to non-cash amortization of intangible assets acquired in business combinations.
For the six months ended June 30, 2017, the adjustment related primarily to severance expenses associated with our restructuring initiative.
For the three and six months ended June 30, 2018, the adjustment related primarily to the change in fair values of contingent consideration liabilities.
For the six months ended June 30, 2018, the adjustment related to the net gain associated with the Kirin-Amgen share acquisition.

19
Provided September 14, 2018, as part of an oral presentation and is
qualified by such, contains forward-looking statements, actual results may
vary materially; Amgen disclaims any duty to update.
Reconciliation of GAAP EPS Guidance to Non-GAAP
EPS Guidance for the Year Ending December 31, 2018
(Unaudited)
GAAP diluted EPS guidance.............................................................................................…………………….. .. 11.83$ - 12.62$
Known adjustments to arrive at non-GAAP*:
Acquisition-related expenses (a)...................................................................................... 1.35
Restructuring charges...................................................................................................... 0.02 - 0.11
Certain other expenses.................................................................................................... 0.03
Tax adjustments (b)......................................................................................................... (0.02)
Non-GAAP diluted EPS guidance ....................................................................................................................................................................… .. 13.30$ - 14.00$
* The known adjustments are presented net of their related tax impact, which amount to approximately $0.40
per share, in the aggregate.
(a) The adjustments relate primarily to non-cash amortization of intangible assets acquired in business combinations.
(b) The adjustments relate primarily to certain acquisition items and prior period items excluded from GAAP earnings.
Our GAAP diluted EPS guidance does not include the effect of GAAP adjustments triggered by events that may
occur subsequent to this press release such as acquisitions, asset impairments, litigation and changes in the fair value
of our contingent consideration.
Reconciliation of GAAP Tax Rate Guidance to Non-GAAP
Tax Rate Guidance for the Year Ending December 31, 2018
(Unaudited)
GAAP tax rate guidance...........................................................................................................…............................................................. 12.5% - 13.5%
Tax rate effect of known adjustments discussed above..................................................................................................…............................................................. 1.0%
Non-GAAP tax rate guidance ....................................................................................................................................................................… 13.5% - 14.5%

20
Provided September 14, 2018, as part of an oral presentation and is
qualified by such, contains forward-looking statements, actual results may
vary materially; Amgen disclaims any duty to update.
Amgen Inc.
Reconciliations of Cash Flows
(In millions)
(Unaudited)
Three months ended
June 30, 2018
Net cash provided by operating activities............................................................................................2,102$
Net cash provided by investing activities ............................................................................................2,938
Net cash used in financing activities............................................................................................(4,650)
Increase in cash and cash equivalents............................................................................................390
Cash and cash equivalents at beginning of period............................................................................................9,741
Cash and cash equivalents at end of period............................................................................................10,131$
Three months ended
June 30, 2018
Net cash provided by operating activities............................................................................................2,102$
Capital expenditures............................................................................................(187)
Free cash flow............................................................................................1,915$