bank consolidation and the dynamics of consumer loan ... · bank consolidation and the dynamics of...
TRANSCRIPT

Comments Welcome
Bank Consolidation and the Dynamics of
Consumer Loan Interest Rates*
by
Charles Kahn
Department of FinanceUniversity of Illinois
1407 W. Gregory DriveUrbana, Illinois 61801
Phone: (217) 333-2813Email: [email protected]
George Pennacchi
Department of FinanceUniversity of Illinois
1407 W. Gregory DriveUrbana, Illinois 61801
Phone: (217) 244-0952Email: [email protected]
Ben Sopranzetti
Department of FinanceRutgers University
94 Rockafeller RoadPiscataway, New Jersey 08854
Phone: (732) 445-4188Email: [email protected]
Current version: August, 2002
*We are grateful to Bankrate, Inc. for permitting our use of their data. Valuable comments werereceived from David T. Brown, Oded Palmon, Kwangwoo Park, participants of seminars at theFederal Reserve Bank of Cleveland and the University of Florida, and participants of the 1999University of Texas Conference on Financial Economics and Accounting, the 2000 FederalReserve Bank of Chicago Conference on Bank Structure and Competition, the 2001 FederalReserve Bank of Philadelphia Conference on Consumer Transactions and Credit, and the 2002Melbourne Business School Conference on the Dollars and Sense of Bank Consolidation. We areindebted to David Becher for help in identifying mergers, and we thank Murillo Campello forresearch assistance. Sopranzetti acknowledges support from the Rutgers University ResearchCouncil.

Bank Consolidation and the Dynamics ofConsumer Loan Interest Rates
Abstract
The recent wave of bank mergers has raised concern over its effect on competition. This
paper examines the influence of concentration and merger activity on consumer loan interest
rates. It uses Bankrate, Inc. survey data on loan rates quoted weekly by large commercial banks
in ten major U.S. cities during the period 1989 to 1997. The pricing behavior of banks is
analyzed for two types of loans: new automobile loans and unsecured personal loans.
Market concentration has a significant positive impact on the level of personal loan rates,
but not on auto loan rates. Auto loan rates show little change around the time of significant bank
mergers, suggesting that their relevant market is nationwide. However, consistent with mergers
changing the market power and size structure of personal loan markets, the personal loan rates of
banks involved in mergers show a significant decline relative to their market rivals during the
period prior to the merger’s completion. Merger participants’ decision to lower personal loan
rates could also reflect their desire to gain regulatory approval of the merger.
The paper also tests for the existence of leader-follower relationships in loan pricing and
finds that it is more widespread in markets for automobile loans. Interest rates on both types of
loans respond asymmetrically to a change in equivalent maturity Treasury security rates, being
more sensitive to a rise than a fall. In addition, personal loan rates are less responsive in more
concentrated markets.

I. Introduction
The recent wave of bank mergers has spawned research examining whether potentially
vulnerable bank customers, such as small businesses and consumers, are hurt by consolidation in
banking markets. These studies have tended to focus on the effects of mergers and concentration
on small business loans and on consumer bank deposits. In contrast, there has been very little
research analyzing how mergers influence banks’ consumer lending practices.1 A reason for the
void in research on consumer credit is a lack of data on the quantities and interest rates of specific
consumer loans made by banks.
This paper sheds new light on the relationship between bank consolidation and consumer
lending by examining a newly constructed database on interest rates charged for two types of
consumer loans: new automobile loans and unsecured personal loans. These data were collected
by Bankrate, Inc. from weekly surveys of consumer loan rates charged by large banks in various
cities across the country. The data enable us to track the effects of changes in concentration and
merger activity on bank pricing behavior at a very detailed level. To our knowledge this is the
first study that examines the dynamics of consumer loan rates and their relationship to
concentration and consolidation in banking.
The paper considers several aspects of consumer loan pricing by performing tests similar
to those used in research on consumer deposit rates. First, it analyzes factors that might explain
the average level of consumer loan rates in different markets. Market concentration is found to
have a positive and significant effect on personal loan rates, but not on auto loan rates. Second, it
examines the dynamics of bank pricing decisions during periods around large merger events
when substantial changes in concentration and in the size of banks can occur.2 We find little
evidence of systematic changes in auto loan rates at the time of significant mergers. However,
1 The review article by Berger, Demsetz, and Strahan (1999) makes this point.2 Unless indicated otherwise, this paper uses the term “merger” to describe both a merger and anacquisition. In a bank merger, two banks’ balance sheets are combined into one, whereas a bank

2
banks participating in mergers appear to reduce their personal loan rates relative to those charged
by their market rivals, particularly during the period prior to the merger’s completion.
Our study also performs a more general analysis of the dynamics of consumer loan
pricing. We find evidence of bank leader-follower behavior in setting loan rates in some markets,
especially in the case of auto loans. We also examine the general factors explaining loan rate
changes. Personal loan rates are stickier than those for auto loans, and personal rate stickiness is
greater in more concentrated markets. Further, banks appear to change both types of loan rates in
an asymmetric manner: banks are quicker to raise loan rates in response to a rise in Treasury rates
than they are to lower them following a decline in Treasury yields. Perhaps surprisingly, this
asymmetric behavior is more prevalent in less concentrated loan markets.
The plan of the paper is as follows. Section II discusses prior research on bank
concentration and consolidation and its effect on the pricing of banking services. The data used
in our study are described in Section III. Section IV examines the relationship between a
market’s concentration and the level of consumer loan interest rates charged by banks in that
market. Section V then focuses on the specific effects of mergers on consumer loan interest rates.
It analyzes the dynamics of loan pricing for banks that merge as well as non-merging banks
located in markets where mergers occur. In Section VI, a more general analysis of movements in
consumer loan interest rates is presented. It tests for the presence of a bank leader-follower
relationship in the setting of consumer loan rates and also studies how these rates respond to
yields on Treasury securities. A conclusion is given in Section VII.
II. Prior Research on Bank Concentration and Consolidation
There is a growing literature that examines the market structure and the merger and
acquisition activity of the banking sector. Berger, Demsetz, and Strahan (1999) provide a
valuable survey and critical analysis of this literature. They conclude that the consensus of
acquisition involves the two banks maintaining separate balance sheets within a single bank holding

3
“static” studies using data from the 1980’s is that greater bank concentration at the Metropolitan
Statistical Area (MSA) level is correlated with higher rates for small business loans and lower
rates for consumer deposits, as well as greater stickiness of rates. They also cite evidence that
during the 1990’s, the relationship between local market concentration and consumer deposit
rates has weakened, but that the link between concentration and small business loan rates is still
strong.
Studies that attempt to incorporate “dynamic effects” of merger activity are relatively
recent. Berger, Kashyap, and Scalise (1995) analyze the effect of bank mergers on the supply of
small business loans using data derived from the Federal Reserve’s Survey of the Terms of Bank
Lending to Businesses, while Strahan and Weston (1996) and Moore (1997) use FDIC Call
Report data. These studies find that smaller banks tend to invest a greater proportion of their
assets in smaller loans than do larger banks. In addition, Berger, Kashyap, and Scalise (1995)
find that a loosening of geographical restrictions on banking activity led to a decline in the supply
of small business loans. More specifically, Berger, Saunders, Scalise, and Udell (1998) examine
the impact of bank mergers on the availability of such loans. They find that although bank
mergers do tend to reduce the quantity of credit supplied to small businesses, the reduction is
more than offset by an increase in lending by the merging banks’ competitors.
Only a few researchers have investigated the impact of bank mergers on pricing in a
dynamic framework.3 Prager and Hannan (1998) examine the impact of bank mergers that had a
significant effect on market concentration. They document that (relative to non-merging banks)
merging banks tend to decrease retail deposit interest rates significantly during the twelve months
prior to and during the twelve months following a merger. They offer this as evidence that
merging banks are not passing on efficiency gains to their depositors but, instead, are exercising
company.3 In contrast “event studies” documenting the effects of mergers on bank market values and profitability arerelatively common—again, see Berger, Demsetz, and Strahan (1999).

4
monopoly power. Furthermore, they find that non-merging banks located in the geographical
markets where the mergers occurred also lowered deposit rates.4
Using detailed data on loan contracts between Italian banks and borrowing firms,
Sapienza (2002) analyzes the effect of mergers on business lending. She finds that interest rates
on business loans tend to fall following within-market mergers between banks with small market
shares, evidence that is consistent with efficiency gains from these types of mergers. However,
loan rates tend to fall less the greater are the market shares of the merging banks, and, for
sufficiently high market shares, mergers lead to loan rate increases. Hence, these findings
suggest that when mergers significantly increase concentration, the exercise of market power
offsets the benefits of scale economies.
A recent study by Berger, Rosen, and Udell (2001) examines how the cost and
availability of small business loans are related to a banking market’s “size structure.” Size
structure refers to the distribution of local market shares of different size classes of banks,
whether or not size is achieved entirely in that local market. For example, if a bank operating
solely in a given local market is acquired by an out-of-market bank, the local market’s size
structure is changed but not its level of concentration: the (unchanged) market share previously
held by the (smaller) local bank is now held by a larger sized bank. Using firm-level data on
small business loans, the authors find that large banks are no less likely to make small business
loans than smaller banks. Also, for a given level of market concentration, large banks charge
lower interest rates than small banks in markets dominated by large banks. An explanation for
this may be that as the number of large banks in a market reaches a critical level, competition
between them intensifies and leads to lower loan rates.
4 Studies using larger sets of data on mergers, including those that do not affect local market concentration,have found that mergers have a much smaller impact. See Simons and Stavins (1998) and Akhavein,Berger and Humphrey (1997).

5
III. The Data
The loan interest rates in our sample are provided by Bankrate, Inc. from their newsletter
Bank Rate Monitor (BRM). The data are weekly interest rates on new automobile loans and
unsecured personal loans quoted by relatively large commercial banks in 10 cities: Boston,
Chicago, Dallas, Detroit, Houston, Los Angeles, New York, Philadelphia, San Francisco, and
Washington, D.C. Each week during the August 16, 1989, to August 8, 1997, sample period,
BRM surveyed usually four or five individual commercial banks in each city.5 Table 1 lists the
banks in our sample, giving the specific dates that the individual banks were surveyed by BRM.
The primary reason that banks dropped into and out of the sample over the 1989 to 1997 period
was due to mergers and acquisitions.
The loan rates surveyed by BRM are those that would be charged to walk-in customers
having no other banking relationship with the lending institution.6 Since loan rates can vary from
branch to branch, BRM calculates a simple average of the individual branch loan rates when more
than one branch exists in any given city. BRM’s rates on new auto loans are for four-year loans
with a principal amount of $16,000 and a 10 percent down payment. The rates on unsecured
personal loans are for two-year loans with a principal value of $3,000. Both the new auto loans
and the unsecured personal loans are fixed rate loans.
To establish a benchmark for consumer loan rates, some of our analysis uses market
interest rates having similar durations (effective maturities). Due to amortization, the two-year
personal loan is measured against a one-year Treasury bill yield and the four-year automobile
loan is compared to the three-year (constant maturity) Treasury security yield. Weekly time
series of these Treasury yields were obtained from the Federal Reserve Bank of St. Louis’s
5 Specifically, the survey covers 10 markets over a 417-week period. For new automobile loans, of the4,170 market-week observations, five banks were surveyed 71.15 percent of the time, four banks weresurveyed 28.18 percent of the time, and three banks were surveyed 0.67 percent of the time. For unsecuredpersonal loans, the corresponding percentages for five, four, and three banks were 46.86, 43.77, and 9.38,respectively.

6
Federal Reserve Economic Data (FRED). We also constructed an annual time series of average
nation-wide credit card interest rates, as reported in the Federal Reserve Bulletin, to use as
another benchmark for personal loan rates.7 Similarly, to help gauge our sample of auto loan
rates, a monthly time series of the average rate on new auto loans charged by the finance
company subsidiaries of the three major U.S. automobile manufacturers was obtained from the
Federal Reserve’s Consumer Credit Statistical Release G.19.
For the purpose of measuring market concentration, we define markets in our sample as
the city’s Primary Metropolitan Statistical Area (MSA). Concentrations within these markets are
described by an annual Herfindahl-Hirschman index (HHI) based on the deposits of commercial
banks’ branches located in the MSA.8 The deposit data comes from the FDIC’s Summary of
Deposits, which records deposits at the end of June of each year. Also using this branch-level
deposit data and FDIC Call Reports, two proxies for the overall level of recent bank consolidation
were calculated. A merger activity variable was defined as the share of MSA deposits in banks
involved in mergers in which two or more bank charters are consolidated, averaged over the
previous three years. Similarly, an acquisition activity variable was defined as the share of MSA
deposits in banks involved in acquisitions in which the banks retain their separate charters but
change their top-tier bank holding company ownership, averaged over the previous three years.
To help control for market differences, annual demographic data on personal income and
population for each MSA was obtained from the Commerce Department’s Bureau of Economic
Analysis. Our personal income variable was defined as the MSA’s per capita personal income as
a percentage of the per capita income for the entire United States. Population was measured as
6 Thus a potential advantage of these data is that quoted rates are not sensitive to particular borrowers’ riskcharacteristics.7 The Federal Reserve changed its method of computing this average credit card rate in 1994. To create aconsistent series, we added the difference between its reported 1994 rates under the old and new methods(24 basis points) to the rate series for 1995-97.8 In principle, it would be preferable to calculate concentration measures using consumer loans, rather thandeposits. However, data on consumer loans are not available at the branch level, and many banks often donot even report the data at the bank level.

7
the MSA’s population as a percentage of the total U.S. population. Percentages of the
corresponding U.S. level were used to control for national trends.
Lastly, we also collected quarterly FDIC Call Report data on the total assets of each bank in
our sample. Nominal asset values were converted to real terms (1996 dollars) using the quarterly
GDP deflator. This series is used to examine whether individual banks’ loan pricing decisions
vary by size.
Table 2 provides summary statistics of the data over our eight-year sample period. During
this period the data provide weekly rates quoted by over 70 different banks. The average auto
loan rate of 9.93 percent is significantly lower than the average unsecured personal loan rate of
16.06. The average auto loan rate also is somewhat lower than the average finance company auto
loan rate of 10.55 percent, while the average personal loan rate is around 100 basis points lower
than the average credit card rate of 17.04 percent.
Our sample covers a period of bank consolidation. On average 3.73 percent of an MSA’s
deposits were issued by banks that have been acquired over the previous three year period, while
24.45 percent of deposits were issued by banks that have merged over the past three years. Note
that the (Primary) MSAs in our sample are quite large, averaging over two percent of the total
U.S. population, and tend to have high per capita personal income, averaging almost 122 percent
of average U.S. per capita income. Also note that the banks surveyed by BRM are predominantly
large ones, with median total assets (1996 dollars) of $18 billion and average total assets of $34
billion. Hence, our study analyses how large banks price consumer loans, and its results may not
be applicable to smaller banks.9
9 Numerous papers such as Strahan and Weston (1998), Haynes, Ou, and Berney (1999), Cole, Goldberg,and White (1999), and Berger, Miller, Petersen, Rajan, and Stein (2001) find evidence that small businesslending differs between large and small banks.

8
IV. Market Concentration and Consumer Loan Rates
Much of our paper’s analysis uses tests similar to those performed by studies on consumer
deposit rates. As with deposit rate research, our statistical tests for consumer loan rates are
constrained by data availability. Our first test explores the relationship between loan rates and
market-level factors, and is constrained to annual observations because market characteristics
such as bank concentration, merger and acquisition activity, and market demographic variables
are available only yearly. In our later tests that focus on non-market determinants of loan rate
changes, we take advantage of our high-frequency weekly loan rates and control for market or
macro-economic factors using other techniques, such as fixed-effects regressions.
We begin with a static analysis of market characteristics and consumer loan rates by
performing tests similar to those of Berger and Hannan (1989) who regress retail deposit interest
rates on measures of market concentration. Since market concentration, consolidation, and
demographic variables are observed annually, the dependent variables for our regressions are the
annual average of loan rates in each market.10 Since our data spans 10 markets (MSAs) across
nine years, this gives us 90 observations for each loan type.
The loan rate averages are regressed on explanatory variables representing bank market
concentration, other types of interest rates, demographic information, and proxies for recent bank
merger and acquisition activity in the market. As indicated above, our measure of market
concentration is the HHI. For new auto loans, funding costs are measured as annual averages of
the weekly three-year constant maturity Treasury security rates while for personal loans we use
the average of the weekly one-year Treasury bill rates. The auto loan regressions also include the
annual average of the spread between the finance company loan rate and the three-year Treasury
10 Specifically, we calculate the average (auto or personal) loan rate charged by the (five, four, or three)banks in a given market during each week. These weekly averages are then averaged over the year.Regressions were also carried out using the annual average of the weekly median loan rate and the annualaverage of the weekly minimum loan rate among the banks in a given market. The results of theseregressions are essentially identical to those reported in Table 3.

9
rate, while the personal loan regressions include the annual average spread between credit card
rates and the one-year Treasury rate.11
The personal income, population, merger activity, and acquisition activity variables
described above are used as additional explanatory variables. Because the MSA’s per-capita
personal income might be a proxy for credit quality, one might expect that greater income would
reduce default risk premia, leading to a negative relationship between income and loan rates.
Population could proxy for the overall size of the consumer loan market, possibly affecting the
potential for (dis-) economies of scale or the level of non-bank competition. The relationship
between this variable and loan rates is uncertain. We include measures of recent merger and
acquisition (M&A) activity to distinguish between the potentially different effects of
consolidation versus concentration. Consolidation leads to larger banks and could change the
process by which most banks make loans.12 Berger, Rosen, and Udell (2001) find that for a given
level of market concentration, rates charged on small business loans are lower if large banks
dominate the market. Hence, we might expect a negative relationship between consumer loan
rates and M&A activity.
One of our regression specifications also includes a yearly time trend. This explanatory
variable proxies for structural change in consumer credit markets. For example, securitization of
auto loans became more prevalent during our sample period, possibly lowering banks’ cost of
funding these loans.13 In addition, credit cards issued by both banks and non-banks became more
widely available. Since credit cards are a close substitute for unsecured personal loans, their
growth probably intensified competition in the market for unsecured personal credit. Hence, for
both auto loans and personal loans, we might expect a downward trend in rates.
11 As mentioned earlier, in 1994 the Federal Reserve changed its method of constructing the credit cardseries. The results are not sensitive to our inclusion of the credit card – Treasury spread. In particular, wefind that personal loan rates are significantly higher in more concentrated markets even when the creditcard spread is omitted from the regressions.12 Cole, Goldberg, and White (1999) find evidence that the criteria used to approve small business loansdiffers by bank size, with larger banks’ decisions relying more heavily on businesses’ financial statements.

10
Table 3 provides the regression results. Auto loan rates are the dependent variable in
columns 1 through 4 and personal loan rates are the dependent variable in columns 5 through 8.
In all regressions, the cost of funds, as proxied by the Treasury security yield, has a coefficient
close to 1.0 and is statistically significant. As expected, auto loan rates are positively related to
the finance company spread while personal loan rates are positively related to the credit card
spread. The coefficients on these spread variables are statistically significant on all regressions
except those that include a time trend. In general, these results support the view that banks
consider their cost of funds and the rates set by competitors when pricing consumer loans.
In the regressions that include demographic variables, both per capita income and
population are positively and significantly related to loan rates. The positive coefficient on per
capita income is somewhat puzzling, but might reflect a greater demand for consumer spending
and borrowing in higher income markets. The positive population – loan rate relation is
consistent with greater costs of making loans in more populous markets, perhaps because it is less
likely that a bank loan officer would acquire “soft” information regarding a loan applicant.
Most important from our point of view is the link between concentration and consumer
loan rates. Here, a difference between the two types of loans is clear. In none of the auto loan
regressions is the HHI statistically significant. In contrast, personal loan rates are positively
related to market concentration at the 1 percent significance level in all of the regressions. The
magnitudes of these coefficients imply that a 100 point increase in the HHI is associated with a
rise in personal loan rates of between 11.9 to 14.5 basis points.
The regressions in columns 3, 4, 7, and 8 of Table 3 include the merger and acquisition
activity variables. In most cases, these M&A variables have negative coefficients, as might be
predicted from the evidence in Berger, Rosen, and Udell (2001), but they are never statistically
significant. Regressions 4 and 8 include a time trend. Its coefficient is negative and statistically
13 See Pennacchi (1988) for a model showing how bank loan sales reduce a bank’s cost of funding.

11
significant in the auto loan regression, suggesting that structural change may be lowering auto
loan rates.
There are several possible reasons for the relative unimportance of concentration in the
market for new car loans. First, bank concentration ratios may be a less accurate measure of true
concentration in the car loan market if there is effective competition from other financing sources,
such as the captive finance companies of auto manufacturers. Second, there may be less scope
for monopoly power in the market for car loans. Screening and monitoring by banks are likely to
be more important for unsecured personal loans, whose risks are more heterogeneous and less
quantifiable by credit-scoring models. Thus, private information and individual expertise may
increase the scope for market power in pricing personal loans. In contrast, an auto loan’s
collateral, underwriting standards, and credit score make the bank’s monitoring and screening
functions less important. Auto lending is probably more a “transaction-oriented” than a
“relationship-oriented” form of lending, as evidenced by the ease of securitizing auto loans.
V. The Dynamics of Loan Rates During Mergers
V.A Defining Significant Mergers
This section presents a dynamic analysis of consumer loan pricing, focusing on the
relationship between bank mergers and loan rates. We examine whether, around the time of a
major bank acquisition, there is a systematic tendency for loan rate changes by acquirers, targets,
and other “exposed banks,” which we define as banks operating in the merger-affected market.
The methodology follows Prager and Hannan (1998) who found evidence that “significant” bank
mergers decreased retail deposit rates in the affected deposit markets. An important task in their
study and in the present paper is to identify criteria for judging whether bank mergers are
“significant” in the sense that they have the potential to influence interest rates. Only such
mergers would merit inclusion in our studies.

12
Recall that the BRM survey covers the largest banks operating in 10 major metropolitan
areas. Bank mergers occur frequently in these large MSAs, but most mergers are unlikely to
influence market loan rates because they involve small banks. Hence, we need to identify only
those mergers that are large enough to have a potential impact on loan rates. We consider three
different standards for defining significant mergers. The first, and broadest, defines a significant
merger as occurring whenever a bank surveyed by BRM is acquired by another bank, or if a bank
surveyed by BRM acquires another bank that is at least 25 percent of its size.14 These mergers
are defined as acquisitions that change control of the bank’s top-tier holding company, even if the
commercial bank subsidiary’s charter is not immediately merged into that of another bank. We
used a variety of sources to document these consolidations and their completion dates, including
Securities Data Company’s Mergers and Acquisitions database, the Federal Reserve System’s
National Information Center, the FDIC’s Institution Directory, and Rhoades (2000).
Based on this definition, Table 4 gives a complete listing of all markets of the target and
acquirer banks involving significant mergers. The bank names given in bold type indicate those
banks surveyed by BRM. There are a total of 30 qualifying “merger-markets” under this broadest
of merger definitions.
The second definition of a significant merger accounts for the likelihood that a merger
impacts loan rates only when the level of concentration is sufficiently high, thereby making the
exercise of market power feasible. This leads to our restricting the first definition’s mergers to
those involving domestic banks for which the target bank’s MSA has a post-merger HHI
exceeding 1400.15 We exclude mergers involving a foreign bank acquirer because the scope for
increasing market power is less likely if the acquirer lacks a previous domestic presence. The
first 15 merger-markets listed in Table 4 satisfy this second definition of significant mergers.
14 In the ten BRM-surveyed markets, we came across no large bank mergers that did not include a BRM-surveyed bank. This reflects BRM’s objective of surveying the largest banks within each market.

13
The third definition imposes yet an additional constraint, namely, that during the year in
which the merger was completed, the HHI in the target bank’s market increases by at least 100.
This condition restricts significant mergers to those within-market mergers that substantially
increase concentration. Table 4 shows that 10 merger-markets satisfy these criteria.
In summary, our first definition of a significant merger is the broadest, encompassing all
BRM mergers in Table 4. The second imposes an intermediate restriction, HHI > 1400, and the
third imposes the most stringent restrictions, HHI > 1400 and ∆HHI > 100.
V.B Test Methodology
We now describe the regression model and data for analyzing whether systematic loan
rate changes occur around the time of a merger. The model, an extension of Prager and Hannan
(1998), involves a time series – cross section regression consisting of observations for all banks
covered by the BRM survey. Prager and Hannan examine monthly deposit rate changes during
each of the 12 months before, and 12 months after, the month in which a bank merger is
completed. Similarly, we base our tests on loan rate changes computed over four-week intervals.
Since our sample is taken over 417 weeks, this allows us to construct a time series of exactly 104
four-week loan rate changes. Hereafter, we refer to this four-week interval as a “month,” but we
emphasize it is not a true calendar month. The reasons for choosing a “monthly” interval, rather
than a weekly one, are twofold. First, it allows a closer comparison to Prager and Hannan’s
monthly analysis. Second, as explained below, it limits the (dummy) variables in our regression
to a number that can feasibly be estimated.
The form of our time series – cross section regression is
( )104 12 12 6
, , 11 12 12 12
ln M Expo Acq Tari i i i i il t l t t t j t j t j t t
t j j j
r r j j jα β δ γ ε−= =− =− =−
= + + + +∑ ∑ ∑ ∑ (1)
15 U.S. Justice Department guidelines state that an HHI exceeding 1800 would subject a merger to achallenge. Prager and Hannan (1998) use the cut-off level of 1800 to define a “substantial” merger and thelevel of 1400 to define a “less substantial” merger.

14
where ,i
l tr is the loan rate charged by the ith bank at the end of month t, so that the dependent
variable is the log change in a given bank’s loan rate during month t. Mt is one of a set of 104
dummy variables that equals 1 if the current month equals date t, zero otherwise. We include
these fixed-effects dummy variables to control for monthly differences in market interest rates
and other macro-economic and industry-wide factors that affect loan rates.
To examine systematic loan rate changes by banks operating in a market where a merger
occurs, a set of 25 dummy variables, Expojti, j = -12,…, 12, are included. This variable takes the
value 1 if bank i is located in a market where a merger occurs and time t is j months following the
completion of that merger, and 0 otherwise.16 Hence, these variables capture systematic loan rate
changes by banks exposed to mergers during the period 12 months before to 12 months after the
merger completion month. This set-up allows for merger-related rate changes over a two-year
span because the precise timing of such changes is uncertain. Since merger announcements
usually occur many months prior to the merger’s completion, there is the possibility that effective
control by the acquirer occurs before the merger is completed.17 On the other hand, re-
organization of management personnel and the merging of bank charters may occur after the
merger’s completion, thereby delaying the acquirer’s effective control over loan pricing.
If loan rates are strictly a function of market concentration, one might expect that the loan
rates of merger participants and those of their rivals would change similarly from merger-induced
changes in concentration. But, more generally, there may be differences in how acquirers,
targets, and rival banks change their rates. The differences could be due to changes in the size
and loan processing operations of merger participants or due to possible strategic behavior by
these banks. Equation (1) allows for such differences by including Acqjti , j = -12,…, 12, and
Tarjti, j = -12,…, 6, which are sets of dummy variables used to indicate whether loan rate changes
16 In cases where the same bank is exposed to multiple mergers whose 25-month analysis periods overlap,we attribute loan pricing effects to both mergers during the overlap period. This is implemented bydividing Expo jt
i by the number of mergers to which the bank is exposed at date t.17 In our sample, the median time between the merger’s announcement and its completion is 6.2 months.

15
by acquirer and target banks change systematically during a merger.18 Acquirer banks’ behavior
is analyzed 12 months before and after the merger completion month. Target banks’ loan pricing
is analyzed 12 months before but only 6 months after completion of the merger. We use a shorter
post-merger period because many targets drop out of our sample following a merger.
To determine the overall change in bank loan rates associated with a merger, we examine
the size and significance of sums of the pre- and post-merger coefficients. The “pre-merger”
effects for exposed banks, acquirers, and targets are given by 0
12 jjβ
=−∑ , ( )0
12 j jjβ δ
=−+∑ ,
and ( )0
12 j jjβ γ
=−+∑ , respectively. Likewise, the “post-merger” effects for exposed banks,
acquirers, and targets are given by 12
1 jjβ
=∑ , ( )12
1 j jjβ δ
=+∑ , and ( )6
1 j jjβ γ
=+∑ .
In estimating equation (1), a concern arises regarding independence of the error term for
loan rates quoted by the same bank but in different cities. As Radecki (1998) points out, many
banks having offices in multiple cities located within the same state quote identical deposit and
loan rates statewide.19 We examined such cases in our data, which involved a bank operating in
both Dallas and Houston or in both Los Angeles and San Francisco. In cases where a bank’s
statewide loan rates were uniform, we treated its quotes as a single time series, rather than two.20
18 Prager and Hannan (1998) group acquirers and targets together, defining them as “banks participating inmergers.” We allow for the possibility of different loan pricing by acquirers and targets.19 Radecki (1998) analyzes rates during 1996-97 using BRM survey data covering instances where rates ofthe same bank were surveyed in multiple cities within a state.20 With exceptions at only a couple dates, the banks that had offices in both Los Angeles and SanFrancisco, which are Bank America, First Interstate, Sanwa, Sumitomo, Union Bank of CA, and WellsFargo, quoted the same auto and personal loan rates in both cities. However, not all banks having offices inboth Dallas and Houston quoted identical rates in both cities. While, with only a few exceptions,Bankamerica and Nationsbank quoted identical rates in Dallas and Houston, First City typically quoteddifferent rates in these two cities during the 8/16/89 to 2/10/93 period prior to its acquisition by TexasCommerce. Bank One quoted different rates in the two cities prior to 2/23/94, but switched to identicalquotes thereafter. Similarly, Texas Commerce’s quotes differed between the two cities prior to 5/16/90, butthen became uniform after this date. Thus, early in the sample period there were a number of banksquoting different rates in Dallas and Houston, but during the latter half of the sample, all banks with officesin both cities quoted uniformly. Many banks where surveyed by BRM in multiple cities located in differentstates. These banks were Bankamerica, Comerica, First Interstate, First Union, Nationsbank, PNC, andWells Fargo. In all cases, these banks did not price auto loans or personal loans uniformly across statelines.

16
V.C Results
The regression results using auto loan rates are reported in Table 5. Panels A, B, and C
of the table summarize the results from regressions based on the broadest, intermediate, and most
stringent merger definitions, respectively. Each panel gives the estimated proportional loan rate
changes for exposed banks, acquirers, and targets during the pre- and post-merger periods. It also
presents estimates of the relative loan rate changes for acquirers versus exposed banks, targets
versus exposed banks, and acquirers versus targets.
There is virtually no evidence of systematic changes in auto loan rates during mergers.
The only marginally significant result (t-statistic = 1.93, p value = 0.053) appears to be that
acquirers raise loan rates by 5.17 percent during the year following a merger, but only when
mergers are defined under the broadest of criteria (Panel A). However, when both pre- and post-
merger periods are combined, acquirers’ increase in auto loan rates of 2.2 percent is not
statistically significant.
Table 6 presents similar regressions using changes in unsecured personal loan rates. In
general, the evidence for systematic movements during mergers is also sparse in personal loans;
however acquirer banks appear to significantly lower their personal loan rates, relative to exposed
banks, during the pre-merger period. The magnitude of this effect is greatest when mergers are
restricted to those in concentrated markets: a 9.56 percent drop by acquirers vis-à-vis their rivals
for mergers with HHI > 1400 and ∆HHI > 100; and a 7.84 percent drop by acquirers relative to
rivals when for all mergers where HHI > 1400. While under both of these merger definitions,
acquirers show a net relative decline in personal loan rates over the total 25- month merger period
There was one situation where BRM surveyed two banks in Washington, D.C. that were under thesame bank holding company: Maryland National Bank and American Security Bank, both owned by MNCCorp as of 3/16/87 when it acquired American Security Corp. Up until 8/8/90, the two banks’ ratestypically differed, with Maryland National always being at least as high as American Security. On 8/15/90,American Security raised its auto loan rate from 11.25 to 12.25 and its personal rate from 16.00 to 17.90 toexactly match Maryland National’s higher rates. From that point until 9/28/94, when both banks wereacquired by Nationsbank, their rates were exactly the same. Thus, as of 8/15/90, we treat AmericanSecurity and Maryland National as one bank.

17
(7.61 and 6.71 percent, respectively), these changes are not statistically significant. Targets also
lower their rates relative to exposed banks over both the pre-merger and total periods, but the
decline is not statistically significant.
Figures 1 and 2 provide graphical confirmation of the statistical results of Tables 5 and 6.
Each panel of a figure matches the merger definition used in the corresponding panel of a table.
Three loan rate spreads are graphed in each panel: the average of acquirers’ rates minus the
average of contemporaneous rates charged by all other banks outside of each acquirer’s market;
the average of targets’ rates minus the average of contemporaneous rates charged by all other
banks outside of each target’s market; and the average of exposed banks’ rates minus the average
of contemporaneous rates charged by all other banks outside of each exposed bank’s market.
These spreads are graphed for the period 42 weeks prior to and following the merger completion
week, except for targets whose spreads are terminated 10 weeks following the completed
merger.21
In Figure 1, as in Table 5, there appears to be no significant changes in the three types of
banks’ auto loan rates. The possible exception occurs under the broadest definition of mergers
(Panel A), where there is somewhat of an increase in acquirers’ auto loan rates following the
merger. The pre- to post-merger jump in the targets’ interest rate spread apparent in panels A and
B is not statistically significant
Figure 2 helps clarify the estimated loan rate dynamics summarized in Table 6. Well
before the merger, acquirers and exposed banks appear to charge similar personal loan rates, on
average. However, when mergers are restricted to those occurring in highly concentrated markets
21 The graph of these spreads is only suggestive in that the sample of acquirers, targets, and exposed bankscan change at any point as the BRM survey sample changes. The targets’ average spread ends earlybecause many targets cease to quote loan rates following the merger. Because the number of acquirers forwhich quotes are observed also declines farther away from the merger completion date, we limit the graphto 42 weeks before and after the merger.

18
(Panels B and C), we find that targets’ average loan rates are lower than others in their market.22
On average, targets appear to be pricing loans relatively aggressively. As the merger’s
completion approaches, targets’ and acquirers’ personal loan rates converge, with acquirers’ rates
departing from those of other banks in the market, leading to a significant relative decline. These
dynamics fit the size structure evidence on small business lines of credit found by Berger, Rosen,
and Udell (2001). As banks become larger, they appear to compete more intensively for personal
loans, relative to other banks in the market. Our evidence suggests that this occurs when
acquirers choose targets that are already quite competitive in pricing personal loans.
Another possible explanation for the relative decline in acquirers’ personal loan rates is
that acquirers choose to cut their margins on these loans to curry favor with regulators. All
mergers require approval by regulators who must consider each merger’s impact on consumers.
Since, for the mergers in our sample, regulatory approval occurs prior to each merger’s
completion date, the acquirers’ tendency to reduce their rates during the pre-merger period could
be a strategy for indicating consumer-friendliness. Along with their choice of targets that set
relatively low rates on personal loans, such behavior could circumvent opposition to mergers. It
is interesting to note that similar behavior is documented by Bostic, Mehran, Paulson, and
Saidenberg (2002) in the case of Community Reinvestment Act lending. They find that banks
increase the quantity of their CRA mortgage lending in the year leading up to an acquisition, and
that this effect is strongest for large banks. Moreover banks that are destined to be targets do not
change their behavior in this way.
22 There were 10 merger markets having an HHI exceeding 1400 and having the target bank’s personal loanrate being surveyed by BRM during the week prior to the merger announcement date. In seven cases thetarget’s rate was lower than the average of the other banks in its market, in one case it was the same, and intwo cases the target’s rate was higher than the other banks’ average. The average difference between theaverage of the other banks’ rates and the target just prior to the merger announcement was 71 basis points.

19
As a check for robustness, we re-estimated the regressions in Tables 5 and 6 but imposed
the constraint that δj = γj ∀ j, that is, we treat acquirers and targets as a single class of banks.23
This assumption of categorizing banks in a merger market as either “exposed banks” or “merger
participants” was made by Prager and Hannan (1999). Making this assumption for the case of
auto loans, the results (not reported) show no statistically significant pre- or post-merger changes
in rates by merger participants or exposed banks. However, when acquirers and targets are
grouped together in the regressions for personal loans, the results indicate a significant decline in
merger participants’ rates, relative to those of exposed banks, during the pre-merger period for all
three merger definitions. These results are reported in Table 7. For the broadest, intermediate,
and narrowest definitions of mergers, participants’ rates fall significantly relative to those of
exposed banks by 5.4, 7.1, and 7.8 percent, respectively, during the pre-merger period.24 As in
the case when a distinction is made between acquirers and targets, the total effect for the relative
change in participants’ versus exposed banks’ rates is negative but not statistically significant.
In summary, mergers do not appear to have significant effects on auto loan rates.
However, merger participants appear to lower their personal loan rates relative to other banks
operating in their market, particularly during the year prior to the merger’s completion. This
behavior is consistent with a size structure effect that leads the now larger merger participants to
lower their personal loan rates. But it is also consistent with the merging banks acting in a
consumer-friendly manner, thereby increasing the chance for regulatory approval of the merger.
VI. More on the Dynamic Behavior of Consumer Loan Rates
VI.A Evidence of Leader/Follower Relationships
By using relatively high frequency weekly data on individual banks’ consumer loan rates,
we can analyze various aspects of the dynamics of loan rate changes. In this section we test for
23 We also estimated auto and personal loan regressions imposing the constraint δj = γj = 0 ∀ j, whichrestricts the behavior of all banks in the merger-affected market to be the same. In this case, there were nostatistically significant pre-, post-, or total merger effects for either type of loan.

20
the presence of a leader/follower relationship in each consumer loan market. We define a bank to
be a leader if the change in its consumer loan rate predicts a change in the average consumer loan
rate of the other banks in its MSA. This predictability is analyzed using a Granger causality test.
More specifically, for each bank in our sample, we construct two weekly time series: one being
the change in the loan rate charged by the particular leader “candidate” bank and the other being
the change in the average loan rate charged by the other rival banks in the same market. The
change in the average loan rate of the rival banks is regressed on eight lags of itself and eight lags
of the change in the loan rate of the candidate bank. We then perform an F-test of the hypothesis
that the coefficients of the lagged changes in the candidate bank’s loan rate are all zero. The
candidate bank is considered a leader if we reject this hypothesis with 95 percent confidence.
Table 8 summarizes the results. Panel A indicates that 15 different banks behaved as
leaders in their respective markets for auto loans and Panel B shows that three different banks
could be considered leaders in their personal loan markets.25 In addition to reporting the F-test
statistic of the hypothesis that the coefficients of the lagged changes in the candidate bank’s loan
rate are all zero, Table 8 reports the sum of these lagged coefficients and a t-test of the hypothesis
that this sum equals zero. As shown in column 2 of Table 8, the sums of these coefficients are
positive for all banks, as one would expect if a leadership relationship exists. In addition, column
3 indicates that, in most cases, the sums of these coefficients are statistically significant.
The greater number of market leaders for auto loans relative to personal unsecured loans
is consistent with there being more intense competition between banks in the auto loan market.
There may be higher consumer switching costs in the personal loan market that make the personal
loan rate set by a given bank to be less responsive to its competitors’ rates.
VI.B The Rigidity of Consumer Loan Rates
24 The p-values are 0.044, 0.044, and 0.060, respectively.25 Note that due to mergers, many of these banks operated in particular markets for only part of the August1989 to August 1997 sample period.

21
Several studies, including Hannan and Berger (1991), Neumark and Sharpe (1992),
Hannan (1994), Jackson (1997), and Rosen (2002), analyze how banks adjust consumer deposit
rates in response to wholesale market interest rates such as Treasury bill rates. This research
finds that deposit rates are slower to adjust in more concentrated markets, that is, less competition
leads to greater stickiness in retail deposit rates. Moreover, this stickiness tends to be
asymmetric: deposit rates are slower to increase when other market interest rates rise than they
are to decrease when market rates fall.26
Mester and Saunders (1995) analyze changes in the prime interest rate and also find
evidence of asymmetric rate setting. The nationwide prime rate rises more quickly than it falls in
response to changes in macroeconomic variables.27 While the asymmetry is in the opposite
direction to that of deposit rates, it is consistent with banks displaying “opportunistic” behavior
by delaying changes that would shrink their profit margins (interest rate spreads). Scholnick
(1999) examines the average loan and deposit rates of six Canadian banks and finds asymmetric
rate setting for the average new car loan rate and the average savings deposit rate, but not for the
average mortgage or long-maturity deposit rates.
Asymmetric and opportunistic pricing has been documented outside of banking.
Borenstein, Cameron, and Gilbert (1997) find that gasoline prices respond more quickly to crude
oil price increases than decreases. Peltzman (2000) analyzes a broad range of producer and
consumer goods and finds that the prices of more than two-thirds of these products rise more
quickly in response to input cost increases than they decline in response to input cost decreases.
Taken together, the evidence suggests firms engage in opportunistic pricing for many, but not all,
consumer goods and services. We now examine whether this tendency extends to the auto and
26 For an alternative approach to analyzing rigidities in consumer deposit rates, see Kahn, Pennacchi, andSopranzetti (1999).27 Since the prime interest rate is set nationwide, not on a market-by-market basis, the effect of marketconcentration is not relevant.
22
personal loans in our sample, and, if so, whether it is related to variables such as market
concentration and bank size.
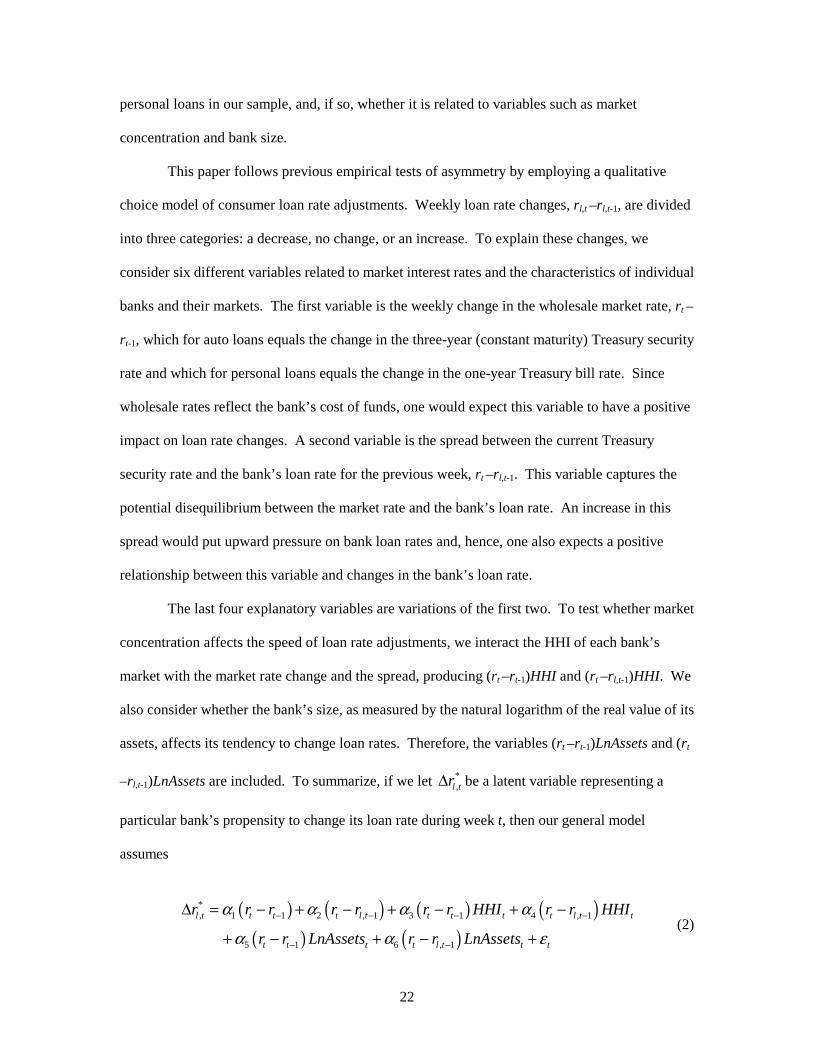
This paper follows previous empirical tests of asymmetry by employing a qualitative
choice model of consumer loan rate adjustments. Weekly loan rate changes, rl,t –rl,t-1, are divided
into three categories: a decrease, no change, or an increase. To explain these changes, we
consider six different variables related to market interest rates and the characteristics of individual
banks and their markets. The first variable is the weekly change in the wholesale market rate, rt –
rt-1, which for auto loans equals the change in the three-year (constant maturity) Treasury security
rate and which for personal loans equals the change in the one-year Treasury bill rate. Since
wholesale rates reflect the bank’s cost of funds, one would expect this variable to have a positive
impact on loan rate changes. A second variable is the spread between the current Treasury
security rate and the bank’s loan rate for the previous week, rt –rl,t-1. This variable captures the
potential disequilibrium between the market rate and the bank’s loan rate. An increase in this
spread would put upward pressure on bank loan rates and, hence, one also expects a positive
relationship between this variable and changes in the bank’s loan rate.
The last four explanatory variables are variations of the first two. To test whether market
concentration affects the speed of loan rate adjustments, we interact the HHI of each bank’s
market with the market rate change and the spread, producing (rt –rt-1)HHI and (rt –rl,t-1)HHI. We
also consider whether the bank’s size, as measured by the natural logarithm of the real value of its
assets, affects its tendency to change loan rates. Therefore, the variables (rt –rt-1)LnAssets and (rt
–rl,t-1)LnAssets are included. To summarize, if we let *,l tr∆ be a latent variable representing a
particular bank’s propensity to change its loan rate during week t, then our general model
assumes
( ) ( ) ( ) ( )( ) ( )
*, 1 1 2 , 1 3 1 4 , 1
5 1 6 , 1
l t t t t l t t t t t l t t
t t t t l t t t
r r r r r r r HHI r r HHI
r r LnAssets r r LnAssets
α α α α
α α ε− − − −
− −
∆ = − + − + − + −
+ − + − +(2)

23
Two types of probit models of loan rate adjustments are estimated. The first type
assumes that the explanatory variables affect loan rate increases and decreases in a symmetric
manner. In other words, banks are assumed to raise loan rates when market rates are rising at the
same speed at which they lower loan rates when market rates are falling. This implies a three
category (decrease, no change, increase) ordered probit model. The second type of model allows
the explanatory variables to have asymmetric effects on rate increases versus rate decreases. This
is accomplished by separately estimating two different two-category probit models. In one case,
a model using only observations where there is no change or an increase in loan rates is
estimated. In the other case, we estimate the model restricting the observations to be either no
changes or decreases in loan rates.
Table 9 gives the results of estimating these probit models using weekly changes in auto
loan rates quoted by 71 different banks over the August 1989 to August 1997 sample period. Of
the 18,943 total observations, 90.1 percent are observations where there was no change, 4.5
percent are observations where there was an increase, and 5.3 percent are observations where
there was a decrease. Columns 1 and 4 of the table report results assuming that the explanatory
variables affect positive and negative loan rate changes in a symmetric manner. The positive and
statistically significant coefficients for (rt –rt-1)HHI and (rt –rl,t-1)HHI indicate that banks in more
concentrated markets are quicker to adjust auto loan rates in response to changes in Treasury
yields or Treasury yield spreads than banks in less concentrated markets. This result runs counter
to previous findings that consumer deposit rates are stickier in more concentrated markets. The
results in column 4 also provide evidence that larger banks are quicker to adjust rates in response
to changes in Treasury rates but slower to adjust rates based on the spread between Treasuries and
loan rates. Columns 1 and 4 further report the total derivatives of auto loan rates with respect to
(rt –rt-1) and (rt –rl,t-1) at the sample averages of the explanatory variables HHI and LnAssets. This
confirms that loan rates respond to these variables in the expected positive manner.

24
Columns 2, 3, 5, and 6 present evidence of asymmetry in the response of auto loan rate
increases versus decreases. Examining the total derivatives of auto loan rates with respect to (rt –
rt-1) and (rt –rl,t-1) for the case of loan rate increases versus loan rate decreases, one sees that banks
are quicker to raise auto loan rates when market rates are high or rising than they are to lower
loan rates when market rates are low or are falling. This result is consistent with Mester and
Saunders (1995) and the opportunistic behavior banks display in setting consumer deposit rates.
However, in contrast to the deposit rate evidence, banks in more concentrated markets engage in
less of this asymmetric behavior: the coefficient estimates on (rt –rt-1)HHI and (rt –rl,t-1)HHI are
higher for decreases than for increases. Differences in the coefficients on the variables (rt –rt-1)
LnAssets and (rt –rl,t-1)LnAssets in columns 5 and 6 also show that large banks are relatively
quicker to lower loan rates in response to declines in Treasuries but respond more slowly to lower
rates when the Treasury spread is low.
In review, the evidence indicates that banks are quicker to increase auto loan rates in a
high or rising market rate environment than to decrease them when market rates are low or
falling. Banks in more concentrated markets, however, are less likely to engage in such
asymmetric behavior. We now turn to the results of a similar analysis using personal loan rates.
Table 10 reports the results of the same types of probit models estimated using 17,516
observations of weekly changes in unsecured personal loan rates quoted by 71 banks from August
1989 to August 1997. Personal loan rates appear to be even more sticky, in general, than auto
loan rates since almost 95.9 percent of the observations have no change and only 2.2 percent and
1.9 percent are increases and decreases, respectively. Assuming the explanatory variables affect
loan rates increases and decreases symmetrically, columns 1 and 4 provide evidence that personal
loan rates are stickier in more concentrated markets, a result just opposite of that for auto loans
but consistent with previous findings for consumer deposit rates. In particular, the negative
coefficient on (rt –rl,t-1)HHI is statistically significant at better than the 5 percent level when the
LnAssets variables are excluded, and the negative coefficients on (rt –rt-1)HHI and (rt –rl,t-1)HHI

25
are statistically significant at better than the 10 percent level when the LnAssets variables are
included. However, similar to the auto loan results, column 4 shows that larger banks are quicker
to adjust rates in response to changes in Treasury rates but slower to adjust rates based on the
spread between Treasuries and loan rates. Note also that the total derivatives of personal loan
rates with respect to (rt –rt-1) and (rt –rl,t-1) at the sample averages of the explanatory variables HHI
and LnAssets are of the expected positive sign.
Comparing the total derivatives of personal loan interest rates with respect to (rt –rt-1) and
(rt –rl,t-1) in columns 2 versus 3 and columns 5 versus 6 shows that asymmetry also exists for
personal loans. Consistent with our results on auto loans and Mester and Saunders’s (1995)
results on the prime rate, banks appear quicker to raise personal loan rates than to decrease them.
In addition, similar to our auto loan results, but unlike the previous results on deposit rates, banks
in more concentrated markets appear to engage in this asymmetry less.28 Finally, differences in
the coefficients on (rt –rt-1)LnAssets and (rt –rl,t-1)LnAssets in columns 5 and 6 also show that large
banks are relatively quicker to lower personal loan rates in response to declines in Treasuries but
respond more slowly to lower rates when the Treasury spread is low. Hence, our results for
personal loans track those for auto loans with the important exception that personal loan rates are
stickier in more concentrated markets.
VII. Conclusion
It is simplistic to presume that bank consolidation affects different types of banking
services in a uniform manner. Even within the somewhat narrow category of consumer credit
services, bank mergers can have a disparate impact. Some consumer borrowers may benefit,
while others may be harmed, from bank mergers. Thus, public policy regarding mergers cannot
avoid weighing the gains against the losses to various bank customers. The evidence presented in
this paper suggests that mergers have little effect on rates charged for auto loans because the auto

26
loan market is national in scope. In contrast, interest rates charged on unsecured personal loans
appear to be influenced by local market concentration, and can change around the time of major
bank mergers. The personal loan rates of banks involved in mergers show a significant decline
relative to their market rivals during the period prior to the merger’s completion. Because the
merging banks become larger in size, this result is consistent with a size structure effect, though
the strength of this effect appears to diminish over time. An alternative explanation is that merger
participants’ decision to lower personal loan rates reflects their desire to gain regulatory approval
of the merger.
Other analyses in this study point to marked differences in the pricing of auto versus
personal loans. Leader-follower pricing behavior is more widespread in auto lending markets,
suggesting that segmentation across banks is less than in markets for personal loans. Auto loan
rates also are less sticky than personal loan rates. Further, personal, but not auto, loan rates are
more rigid in more concentrated markets. However, both auto and personal loans are similar in
that banks set both loans’ rates in an opportunistic fashion: banks are slower to lower consumer
loan rates when warranted by declines in other market rates than they are to raise consumer loan
rates when other market rates rise. Given prior empirical evidence that banks, as well as non-
financial firms, tend to change prices in an opportunistic, asymmetric manner, theoretical
research exploring a rationale for such behavior would be welcome.
28 Peltzman (2000) examines a broad range of goods and finds no systematic relationship between thedegree of price asymmetry for a product and the product’s market concentration.

27
References
Akhavein, J.D., Allen N. Berger, and David B. Humphrey (1997) “The Effects of Megamergers
on Efficiency and Prices: Evidence from a Profit Function,” Review of Industrial
Organization 12, 95-139.
Berger, Allen N., Rebecca S. Demsetz, and Phillip E. Strahan (1999) “The Consolidation of the
Financial Services Industry: Causes, Consequences, and Implications for the Future,”
Journal of Banking and Finance 23, 135-194.
Berger, Allen N. and Timothy H. Hannan (1989) “The Price-Concentration Relationship in
Banking,” Review of Economics and Statistics 71, 291-9.
Berger, Allen N., Nathan H. Miller, Mitchell A. Petersen, Raghuram G. Rajan, and Jeremy C.
Stein (2001) “Does Function Follow Organizational Form? Evidence from the Lending
Practices of Large and Small Banks,” NBER working paper No. w8752.
Berger, Allen N., Richard J. Rosen, and Gregory F. Udell (2001) “The Effect of Market Size
Structure on Competition: The Case of Small Business Lending,” FEDS working paper
2001-63, Board of Governors of the Federal Reserve System.
Berger, Allen N., Anthony Saunders, Joseph M. Scalise, and Gregory F. Udell (1998) “The
Effects of Bank Mergers and Acquisitions on Small Business Lending,” Journal of
Financial Economics 50, 187-229.
Berger, Allen N., Joseph M. Scalise, and Anil K. Kashyap (1995) “The Transformation of the
U.S. Banking Industry: What a Long, Strange Trip It’s Been,” Brookings Papers on
Economic Activity 2, 55-218.
Borenstein, Severin, A. Colin Cameron, and Richard Gilbert (1997) “Do Gasoline Prices Respond
Asymmetrically to Crude Oil Price Changes?” Quarterly Journal of Economics 112, 305-
39.

28
Bostic, Raphael, Hamid Mehran, Anna Paulson, and Marc Saidenberg (2002) “Regulatory
Incentives and Consolidation: The Case of Commercial Bank Mergers and the
Community Reinvestment Act,” Working Paper 2002-06, Federal Reserve Bank of
Chicago.
Cole, Rebel A., Lawrence G. Goldberg, and Lawrence J. White (1999) “Cookie-cutter versus
Character: The Micro Structure of Small Business Lending by Large and Small Banks,”
in J.L. Blanton, A. Williams, and S.L.W. Rhine, eds.: Business Access to Capital and
Credit, Federal Reserve System Research Conference.
Hannan, Timothy H. (1994) “Asymmetric Price Rigidity and the Responsiveness of Customers to
Price Changes: The Case of Deposit Interest Rates,” Journal of Financial Services
Research 8, 257-67.
Hannan, Timothy H. and Allen N. Berger (1991) “The Rigidity of Prices: Evidence from the
Banking Industry,” American Economic Review 81, 938-945.
Haynes, George W., Charles Ou, and Robert Berney (1999) “Small Business Borrowing from
Large and Small Banks,” in J.L. Blanton, A. Williams, and S.L.W. Rhine, eds., Business
Access to Capital and Credit (Federal Reserve System Research Conference), 287-327.
Jackson, William E. III (1997) “Market Structure and the Speed of Price Adjustments: Evidence
of Non-monotonicity,” Review of Industrial Organization 12, 37-57.
Kahn, Charles M., George G. Pennacchi, and Ben J. Sopranzetti (1999) “Bank Deposit Rate
Clustering: Theory and Empirical Evidence,” Journal of Finance 54, 2185-2214.
Mester, Loretta J. and Anthony Saunders (1995) “When Does the Prime Rate Change,” Journal
of Banking and Finance 19, 743-64.
Moore, Robert R. (1997) “Bank Acquisition Determinants: Implications for Small Business
Credit,” Financial Industry Studies Working Paper 2-97, Federal Reserve Bank of
Dallas.

29
Neumark, David and Steven A. Sharpe (1992) “Market Structure and the Nature of Price
Ridigity: Evidence from the Market for Consumer Deposits,” Quarterly Journal of
Economics 107, 657-80.
Peltzman, Sam (2000) “Prices Rise Faster than They Fall,” Journal of Political Economy 108,
446-502.
Pennacchi, George G. (1988) “Loan Sales and the Cost of Bank Capital,” Journal of Finance 43,
375-96.
Prager, Robin A. and Timothy H. Hannan (1998) “Do Substantial Horizontal Mergers Generate
Significant Price Effects? Evidence from the Banking Industry,” Journal of Industrial
Economics 46, 433-52.
Radecki, Lawrence J. (1998) “The Expanding Reach of Geographic Banking Markets,” Economic
Policy Review 4 (June), 15-34, Federal Reserve Bank of New York.
Rhoades, Stephen A. (2000) “Bank Mergers and Banking Structure in the United States, 1980-
98,” Staff study 174, Board of Governors of the Federal Reserve System.
Rosen, Richard J. (2002) “What Goes Up Must Come Down? Asymmetries and Persistence in
Bank Deposit Interest Rates,” Journal of Financial Services Research (forthcoming).
Sapienza, Paola (2002) “The Effects of Bank Mergers on Loan Contracts,” Journal of Finance
57, 329-69.
Scholnick, Barry (1999) “Interest Rate Asymmetries in Long-Term Loan and Deposit Markets,”
Journal of Financial Services Research, 16:1 5-16.
Simons, Katerina and Joanna Stavins (1998) “Has Antitrust Policy in Banking Become
Obsolete?” New England Economic Review, Federal Reserve Bank of Boston 13-26.
Strahan, Phillip E. and James P. Weston (1996) “Small Business Lending and Bank
Consolidation: Is There Cause for Concern?,” Current Issues in Economics and Finance
2, Federal Reserve Bank of New York, 1-6.

30
Strahan, Phillip E. and James P. Weston (1998) “Small Business Lending and the Changing
Structure of the Banking Industry,” Journal of Banking and Finance 22, 821-45.

31
Table 1
Banks Surveyed by Bank Rate Monitor
Bank Name Begin Survey End Survey Begin Survey End SurveyBoston Los Angeles
Bank of Boston 8/16/1989 8/13/97 Bank of America 8/16/1989 8/13/1997Bank of New England 8/16/1989 7/10/1991 First Interstate 8/16/1989 7/31/1996BayBank 8/16/1989 5/21/1997 Sanwa 5/13/1992 8/13/1997Century Bank & Trust 5/28/1997 8/13/1997 Security Pacific4 8/16/1989 5/6/1992Fleet 7/17/1991 8/13/1997 Sumitomo 8/7/1996 8/13/1997PNC 4/24/1996 8/13/1997 Union Bank of CA 8/16/1989 8/13/1997Shawmut 8/16/1989 3/27/1996 Wells Fargo 8/16/1989 8/13/1997US Trust 4/3/1996 8/13/1997 New York
Chicago Bank of New York 8/16/1989 8/13/1997Bank of America 4/30/1997 8/13/1997 Chase Manhattan 8/16/1989 8/28/1996First Chicago / NBD1 8/16/1989 8/13/1997 Chemical / Chase Manhattan5 8/16/1989 8/13/1997Harris Trust 8/16/1989 8/13/1997 Citibank 8/16/1989 8/13/1997LaSalle 8/16/1989 8/13/1997 European American 9/4/1996 8/13/1997Northern Trust 8/16/1989 8/13/1997 Manufacturers Hanover 8/16/1989 8/5/1992
Dallas Republic of New York4 9/15/1993 8/13/1997Bank of America 2/17/1993 8/13/1997 PhiladelphiaBank One 8/16/1989 8/13/1997 Continental / Midlantic6 10/10/1990 7/17/1996Comerica 12/2/1992 8/13/1997 First Fidelity 8/16/1989 2/7/1996First City 8/16/1989 2/10/1993 First Pennsylvania 8/16/1989 10/3/1990NCNB / Nationsbank2 8/16/1989 8/13/1997 First Union 2/14/1996 8/13/1997Team 8/16/1989 11/25/1992 Frankford / Keystone7 7/24/1996 8/13/1997Texas Commerce3 8/16/1989 8/13/1997 Mellon 8/16/1989 8/13/1997
Detroit Philadelphia / Corestates8 8/16/1989 8/13/1997Comerica 8/16/1989 8/13/1997 Provident / PNC9 8/16/1989 8/13/1997First of America 8/16/1989 8/13/1997 San FranciscoHuntington 5/18/1994 8/13/1997 Bank of America 8/16/1989 8/13/1997Manufacturers National 8/16/1989 9/9/1992 First Interstate 8/16/1989 7/31/1996Michigan National 8/16/1989 8/13/1997 Sanwa 8/7/1996 8/13/1997First Chicago / NBD1 8/16/1989 8/13/1997 Sumitomo 5/13/1992 8/13/1997Security Bank & Trust 9/16/1992 5/11/1994 Union Bank of CA 8/16/1989 8/13/1997
Houston Wells Fargo 8/16/1989 8/13/1997Bank of America 2/17/1993 8/13/1997 Washington, D.C.Bank One 8/16/1989 8/13/1997 American Security10 8/16/1989 8/15/1990First City 8/16/1989 2/10/1993 Crestar 10/5/1994 8/13/1997First Interstate 8/16/1989 7/31/1996 First American 8/16/1989 11/10/1993NCNB / Nationsbank2 8/16/1989 8/13/1997 First NB of Maryland 7/31/1996 8/13/1997Texas Commerce3 8/16/1989 8/13/1997 First Union 11/24/1993 8/13/1997Wells Fargo 8/7/1996 8/13/1997 Maryland NB/Am. Security10 8/16/1989 9/28/1994
NCNB / Nationsbank2 1/8/1992 8/13/1997Riggs 8/16/1989 8/13/1997Signet 10/5/1994 8/13/1997Sovran / C&S Sovran 8/16/1989 12/31/1991
Notes:1 NBD acquired First Chicago in 1995 and both were renamed First Chicago / NBD.

32
2 NCNB was renamed Nationsbank in 1992.3 Texas Commerce was purchased by Chemical in 1987.4 BRM obtained only new car loan quotes from Security Pacific and only unsecured personal loan quotesfrom Republic of New York.5 Following Chemical’s acquisition of Chase Manhattan in 1996, it was renamed Chase Manhattan.6 Midlantic acquired Continental in 1987. The Continental / Midlantic series is treated as one bank.7 Frankford was renamed Keystone in 1997.8 Philadelphia National Bank was renamed Corestates in 1990.9 Provident was purchased by PNC in 1983. The Provident / PNC series is treated as one bank.10 Maryland National and American Security came under the same holding company in 1987. Starting on8/15/1990, they quoted identical rates. Thus, they are treated as one bank starting at this date.
Table 2
Summary Statistics of Data
Variable Mean Median Minimum Maximum Std. Dev.
New Automobile Loan Rate 9.93 9.50 6.49 15.90 1.81
Unsecured Personal Loan Rate 16.06 15.75 8.24 24.00 2.32
1-Year Treasury Yield 5.62 5.67 3.04 8.76 1.52
3-Year Treasury Yield 6.27 6.17 4.09 9.02 1.23
Finance Company Rate 10.55 10.40 5.93 13.27 1.66
Credit Card Rate 17.04 16.83 15.87 18.23 1.00
Herfindahl – Hirschman Index 1393 1275 538 2930 551
MSA Per Capita Income (% of U.S.) 121.84 117.00 99.60 163.90 15.95
MSA Population (% of U.S.) 2.05 1.79 0.62 3.56 0.91
Acquisition Activity 0.0373 0.0142 0.0000 0.2169 0.0489
Merger Activity 0.2445 0.2131 0.0134 0.5754 0.1515
Bank Assets (Millions 1996 $) 33,950 18,150 636 285,477 45,319
Notes: New automobile and unsecured personal loan rates are those surveyed by Bank Rate Monitor. The1-year and 3-year Treasury yields represents the one- and three-year constant maturity Treasury bond ratesobtained from the Federal Reserve Bank of St. Louis database. Finance company rate is taken from theFederal Reserve’s Consumer Credit Statistical Release G.19, which is the average yield on new automobileloans charged by the finance company subsidiaries of the three major U.S. automobile manufacturers. Theaverage credit card rate is reported in various issues of the Federal Reserve Bulletin. The Herfindahl-Hirschman index is computed from end-of-June FDIC Summary of Deposits data of all commercial bankbranches within the MSA. MSA per capita income is its per capita income as a percentage of the per capitaincome of the entire United States. MSA Population is its population as a percentage of the total populationof the United States. These data were obtained from the Commerce Department’s Bureau of EconomicAnalysis. Merger activity is the share of local market deposits in banks involved in mergers in which twoor more banks charters are consolidated, averaged over the previous three years. Acquisition activity is theshare of local market deposits in banks involved in acquisitions in which the banks retain their separatecharters but changed their top-tier bank holding company ownership, average over the previous three years.Bank assets are obtained from quarterly FDIC Call Reports and converted to real terms by the quarterlyGDP deflator.

33
Table 3
Determinants of Interest Rates for Automobile Loans and Unsecured Personal Loans
New Automobile Loans Unsecured Personal LoansVariable Coefficient
(t-statistic in parentheses)Coefficient
(t-statistic in parentheses)Constant 1.231
(1.48)-2.806
(-2.58)-2.156(-1.77)
16.114(2.44)
-0.536(-0.15)
-8.869(-2.68)
-9.711(-2.68)
-3.102(-0.13)
Treasury yield 1.144(12.19)
1.150(13.98)
1.170(13.95)
0.966(8.93)
0.987(4.76)
1.012(5.75)
1.082(6.02)
0.954(1.99)
Finance co. spread 0.368(4.17)
0.387(4.99)
0.376(4.73)
0.155(1.42)
Credit card spread 0.823(3.89)
0.855(4.76)
0.911(4.93)
0.794(1.77)
HHI -0.107(-0.05)
1.548(0.76)
0.218(0.095)
1.081(0.48)
12.519(3.63)
14.502(4.29)
11.946(3.14)
12.085(3.13)
Personal income 0.021(3.28)
0.020(3.05)
0.020(3.19)
0.045(4.26)
0.047(4.34)
0.047(4.32)
Population 0.551(4.81)
0.468(3.59)
0.503(4.01)
0.984(5.16)
0.941(4.37)
0.947(4.35)
Merger activity -0.507(-0.74)
-0.183(-0.27)
1.095(0.95)
1.122(0.96)
Acquisition activity -3.154(-1.33)
-2.730(-1.19)
-4.62(-1.17)
-4.54(-1.14)
Year -0.176(-2.81)
-0.049(-0.29)
Observations 90 90 90 90 90 90 90 90R2 0.669 0.753 0.759 0.780 0.249 0.481 0.500 0.501
Notes: The dependent variable is the annual average of the loan rate in a particular market for a given year.The sample consists of 10 cities (markets) for the years 1989 to 1997, resulting in 90 observations for eachloan type. “Treasury yield” represents the three-year constant maturity Treasury bond rate for the case ofnew automobile loans and the one-year, annually-compounded Treasury bill secondary market yield for thecase of personal unsecured loans. Both yields are from the Federal Reserve Bank of St. Louis database.“Finance co. spread” is the average yield on new automobile loans charged by the finance companysubsidiaries of the three major U.S. automobile manufacturers (taken from the Federal Reserve’s ConsumerCredit Statistical Release G.19) minus the three-year Treasury rate. “Credit card spread” is the averagecredit card rate (reported in the Federal Reserve Bulletin) minus the one-year Treasury rate. “HHI” is theHerfindahl-Hirschman index divided by 1000 computed from end-of-June FDIC Summary of Deposits dataof all commercial bank branches within the PMSA. “Personal income” is the MSA’s per capital income asa percentage of the per capita income of the entire United States. “Population” is the MSA’s population as apercentage of the total population of the United States. These data were obtained from the CommerceDepartment’s Bureau of Economic Analysis. “Merger activity” is the share of local market deposits inbanks involved in mergers in which two or more banks charters are consolidated, averaged over theprevious three years. “Acquisition activity” is the share of local market deposits in banks involved inacquisitions in which the banks retain their separate charters but changed their top-tier bank holdingcompany ownership, average over the previous three years. “Year” is a time trend ranging from 89 to 97.

34
Table 4
Bank MergersMerger Merger Post Merger
Market Target Name Acquirer Name Announced Completed HHI ∆∆∆∆HHIMergers of Domestic Banks with HHI > 1400 and ∆∆∆∆HHI > 100
Los Angeles Security Pacific BankAmerica 8/12/1991 4/22/1992 1808 765New York Chase Manhattan Chemical 8/28/1995 3/31/1996 2041 702Philadelphia Continental/Midlantic PNC 7/10/1995 1/2/1996 1749 567Philadelphia First Fidelity First Union 6/19/1995 1/2/1996 1749 567Philadelphia Meridian Corestates 10/10/1995 4/9/1996 1749 567Boston BayBank Bank of Boston 12/12/1995 7/29/1996 2222 494Boston Walden UST 8/30/1996 1/3/1997 2222 494Detroit Manufacturers NB Comerica 10/29/1991 6/19/1992 2096 481New York Manufacturers Hanover Chemical 7/15/1991 12/31/1991 1426 309Boston Shawmut Fleet 2/21/1995 11/30/1995 1728 307
Additional Mergers of Domestic Banks with HHI > 1400Los Angeles First Interstate Wells Fargo 10/18/1995 4/1/1996 1557 97San Francisco First Interstate Wells Fargo 10/18/1995 4/1/1996 2684 40Dallas First City1 Texas Commerce 2/13/1993 1556 64Dallas Team Bank One 3/23/1992 12/1/1992 1556 64Detroit Security Bank & Trust First of America 9/12/1991 5/1/1992 1614 -85
All Other MergersHouston First City1 Texas Commerce 2/13/1993 1260 267Boston Bank of New England1 Fleet 1/6/1991 7/14/1991 1256 164Philadelphia First Pennsylvania Philadlephia/Corestates 9/18/1989 3/5/1990 1126 159Houston First Interstate Wells Fargo 10/18/1995 4/1/1996 1034 -51D.C. Maryland NB/Am. Security Nationsbank 7/20/1992 10/5/1993 997 277D.C. First American First Union 2/26/1993 9/30/1993 997 277D.C. C&S Sovran NCNB / Nationsbank 6/26/1991 12/31/1991 761 -87D.C. Equitable Maryland National 7/13/1989 1/18/1990 845 30Chicago First Chicago NBD 7/13/1995 12/1/1995 695 55D.C. Citizens & Southern Sovran 10/13/1989 8/31/1990 849 3Detroit First Chicago NBD 7/13/1995 12/1/1995 2138 -17Boston National Westminster Fleet 12/19/1995 5/1/1996 1728 307Detroit Michigan National National Australia 2/6/1995 11/2/1995 2138 -17Los Angeles Union Bank of CA2 Mitsuibishi 2/16/1996 4/1/1996 1557 97San Francisco Union Bank of CA2 Mitsuibishi 2/16/1996 4/1/1996 2684 40
Notes: Banks in bold type are ones surveyed by Bank Rate Monitor.1 First City and Bank of New England were failed bank mergers that obtained FDIC assistance.2 Bank of Toyko purchased Union in 1988. Mitsuibishi Bank acquired Bank of Tokyo in 1996, therebyacquiring Union.

35
Table 5
Impact of Mergers on Automobile Loan Rates
Panel A: All BRM Mergers Obs. = 4140, R2 = 0.164Sum of Coefficients
(t-statistics in parentheses)Effect Exposed
BanksAcquirer
BanksTargetBanks
Acquirer -Exposed
Target –Exposed
Acquirer –Target
Pre-merger 0.005(0.21)
-0.029(-0.92)
-0.008(-0.26)
-0.034(-1.03)
-0.013(-0.39)
-0.022(-0.57)
Post-merger 0.011(0.51)
0.052(1.93)
0.022(0.76)
0.041(1.47)
0.011(0.45)
0.011(0.38)
Total 0.016(0.45)
0.022(0.51)
0.014(0.33)
0.007(0.15)
-0.001(-0.03)
-0.011(-0.23)
Panel B: BRM Mergers with HHI > 1400 Obs. = 4140, R2 = 0.166Sum of Coefficients
(t-statistics in parentheses)Effect Exposed
BanksAcquirer
BanksTargetBanks
Acquirer -Exposed
Target –Exposed
Acquirer –Target
Pre-merger 0.004(0.12)
-0.027(-0.74)
0.010(0.27)
-0.031(-0.76)
0.006(0.15)
-0.037(-0.77)
Post-merger 0.006(0.21)
0.022(0.66)
0.011(0.26)
0.016(0.45)
0.005(0.13)
0.008(0.19)
Total 0.010(0.22)
-0.004(-0.09)
0.021(0.37)
-0.014(-0.25)
0.011(0.19)
-0.029(-0.47)
Panel C: BRM Mergers with HHI > 1400 and ∆HHI > 100 Obs. = 4140, R2 = 0.159Sum of Coefficients
(t-statistics in parentheses)Effect Exposed
BanksAcquirer
BanksTargetBanks
Acquirer -Exposed
Target –Exposed
Acquirer –Target
Pre-merger -0.007(-0.21)
-0.033(-0.78)
-0.005(-0.11)
-0.025(-0.53)
0.002(0.04)
-0.028(-0.47)
Post-merger -0.002(-0.06)
0.023(0.57)
0.033(0.73)
0.024(0.56)
0.034(0.82)
-0.022(-0.49)
Total -0.009(-0.19)
-0.010(-0.17)
0.028(0.43)
-0.001(-0.01)
0.037(0.53)
-0.050(-0.67)
Notes: The pre-merger effect is the proportional loan rate change for the period 13 months prior to andincluding the merger completion month. The post-merger effect is the proportional loan rate change for theperiod 12 months following the merger completion month for exposed banks and acquirers, and is theproportional loan rate change for the period 6 months following the merger completion month for targets.The total effect is the sum of pre- and post-merger effects.

36
Table 6
Impact of Mergers on Personal Loan Rates
Panel A: All BRM Mergers Obs. = 3851, R2 = 0.047Sum of Coefficients
(t-statistics in parentheses)Effect Exposed
BanksAcquirer
BanksTargetBanks
Acquirer -Exposed
Target –Exposed
Acquirer –Target
Pre-merger 0.026(1.07)
-0.036(-1.02)
-0.012(-0.68)
-0.062(-1.82)
-0.046(-1.44)
-0.017(-0.42)
Post-merger 0.010(0.48)
0.027(1.02)
0.027(0.97)
0.017(0.62)
0.018(0.70)
-0.015(-0.53)
Total 0.036(1.04)
-0.010(-0.23)
0.007(0.172)
-0.045(-1.01)
-0.028(-0.69)
-0.031(-0.65)
Panel B: BRM Mergers with HHI > 1400 Obs. = 3851, R2 = 0.050Sum of Coefficients
(t-statistics in parentheses)Effect Exposed
BanksAcquirer
BanksTargetBanks
Acquirer -Exposed
Target –Exposed
Acquirer –Target
Pre-merger 0.039(1.22)
-0.039(-1.08)
-0.020(-0.52)
-0.078(-1.94)
-0.059(-1.31)
-0.020(-0.40)
Post-merger -0.007(-0.24)
0.005(0.14)
0.014(0.36)
0.011(0.32)
0.021(0.57)
-0.020(-0.51)
Total 0.032(0.74)
-0.035(-0.70)
-0.005(-0.10)
-0.067(-1.20)
-0.038(-0.63)
-0.040(-0.63)
Panel C: BRM Mergers with HHI > 1400 and ∆HHI > 100 Obs. = 3851, R2 = 0.045Sum of Coefficients
(t-statistics in parentheses)Effect Exposed
BanksAcquirer
BanksTargetBanks
Acquirer -Exposed
Target –Exposed
Acquirer –Target
Pre-merger 0.033(0.95)
-0.063(-1.45)
-0.018(-0.38)
-0.096(-1.97)
-0.051(-0.92)
-0.045(-0.73)
Post-merger -0.011(-0.34)
0.009(0.23)
0.005(0.12)
0.020(0.46)
0.016(0.38)
-0.006(-0.13)
Total 0.022(0.47)
-0.054(-0.93)
-0.013(-0.20)
-0.076(-1.12)
-0.035(-0.50)
-0.051(-0.67)
Notes: The pre-merger effect is the proportional loan rate change for the period 13 months prior to andincluding the merger completion month. The post-merger effect is the proportional loan rate change for theperiod 12 months following the merger completion month for exposed banks and acquirers, and is theproportional loan rate change for the period 6 months following the merger completion month for targets.The total effect is the sum of pre- and post-merger effects.

37
Table 7
Impact of Mergers on Personal Loan Rates
Notes: The pre-merger effect is the proportional loan rate change for the period 13 months prior to andincluding the merger completion month. The post-merger effect is the proportional loan rate change for theperiod 12 months following the merger completion month for exposed banks and acquirers, and is theproportional loan rate change for the period 6 months following the merger completion month for targets.The total effect is the sum of pre- and post-merger effects.
Panel A: All BRM Mergers Obs. = 3851, R2 = 0.040Sum of Coefficients
(t-statistics in parentheses)Effect Exposed
BanksMerger
ParticipantsMerger Participants
- Exposed BanksPre-merger 0.026
(1.10)-0.027(-1.13)
-0.054(-2.02)
Post-merger 0.010(0.48)
0.027(1.16)
0.017(0.68)
Total 0.037(1.06)
-0.000(-0.01)
-0.037(-0.98)
Panel B: BRM Mergers with HHI > 1400 Obs. = 3851, R2 = 0.044Sum of Coefficients
(t-statistics in parentheses)Effect Exposed
BanksMerger
ParticipantsMerger Participants
- Exposed BanksPre-merger 0.040
(1.26)-0.030(-1.07)
-0.071(-2.01)
Post-merger -0.009(-0.34)
0.013(0.41)
0.022(0.65)
Total 0.031(0.70)
-0.018(-0.42)
-0.049(-0.95)
Panel C: BRM Mergers with HHI > 1400 and ∆HHI > 100 Obs. = 3851, R2 = 0.041Sum of Coefficients
(t-statistics in parentheses)Effect Exposed
BanksMerger
ParticipantsMerger Participants
- Exposed BanksPre-merger 0.035
(1.02)-0.043(-1.28)
-0.078(-1.88)
Post-merger -0.015(-0.47)
0.016(0.46)
0.031(0.76)
Total 0.020(0.43)
-0.027(-0.56)
-0.048(-0.78)

38
Table 8
Evidence of Market Leadership
Panel A: New Automobile Loans
Bank Market F Test ofPredictability
Sum of LaggedCoefficients
t-statistic of Sumof Lagged
CoefficientsSecurity Bank & Trust Detroit 10.34 1.269 4.15Northern Trust Chicago 5.69 0.680 5.03First City Houston 3.82 0.401 1.87Riggs Washington, D.C. 3.00 0.479 4.02First City Dallas 2.90 0.600 3.23First Chicago / NBD Chicago 2.87 0.376 4.08Texas Commerce Dallas 2.66 0.575 3.48BayBank Boston 2.41 0.335 2.72Continental / Midlantic Philadelphia 2.35 0.418 2.03First Union Washington, D.C. 2.19 0.093 0.78Bank of New York New York 2.18 0.240 1.81Bank of Boston Boston 2.17 0.158 2.04Bank of New England Boston 2.10 0.325 1.14Crestar Washington, D.C. 2.03 0.229 1.34First of America Detroit 2.00 0.209 1.85
Panel B: Unsecured Personal Loans
Bank MarketF Statistic for
Test ofPredictability
Sum of LaggedCoefficients
t Statistic forNon-zero Sum
CoefficientsFirst Chicago / NBD Chicago 2.33 0.282 2.51Harris Trust Chicago 2.26 0.235 2.63Texas Commerce Dallas 1.98 0.168 1.00
Notes: The table reports the results of Granger causality tests of whether the log change in a given bank’sloan rate predicts the log change in the average loan rate of the other banks in its market (MSA). Thechange in the average loan rates of the other banks is regressed on eight lags of itself and eight lags of thechange in the loan rate of the target bank. This is done on a weekly basis over the period August 1989 toAugust 1997. The F statistic tests the hypothesis that the coefficients of the lagged changes in the targetbank’s loan rate are all zero. The target bank is considered a leader and reported in this table if thehypothesis can be rejected at greater than the 95 percent confidence level. Panels A and B list marketleaders for new automobile loans and unsecured personal loans, respectively. Also reported is the sum ofthe coefficients of the lagged changes in the target bank’s loan rate, and a t statistic for a test of thehypothesis that this sum equals zero.

39
Table 9
Changes in New Automobile Loan Rates
(t-statistics in parentheses)
IndependentVariables
SymmetricChanges
Increase Decrease SymmetricChanges
Increase Decrease
rt –rt-1 -0.462(-1.75)
0.151(0.36)
-0.520(-1.48)
-3.385(-2.59)
-4.956(-2.45)
-1.006(-0.56)
rt –rl,t-1 0.157(13.03)
0.437(24.41)
0.017(1.06)
0.734(15.21)
1.139(14.36)
0.439(7.15)
(rt –rt-1)HHI 4.882(3.05)
1.591(0.63)
3.042(1.35)
4.198(2.54)
0.583(0.22)
2.945(1.25)
(rt –rl,t-1)HHI 0.188(3.45)
-0.818(-9.00)
0.746(10.58)
0.359(6.45)
-0.670(-7.31)
0.868(11.82)
(rt –rt-1)LnAssets 0.175(2.22)
0.308(2.60)
0.026(0.23)
(rt –rl,t-1)LnAssets -0.033(-12.25)
-0.041(-9.44)
-0.024(-6.94)
Total Derivativesat Sample Averages:
rt –rt-1
rt –rl,t-1
0.226
0.184
0.376
0.322
-0.0911
0.1220
0.126
0.239
0.267
0.362
-0.158
0.168
Observations:IncreaseNo ChangeDecrease
85817,0761,009
85817,076
0
017,0761,009
85817,0761,009
85817,076
0
017,0761,009
Notes: The table gives estimates for probit models of changes in loan rates quoted weekly by 71 banks during theperiod August 1989 to August 1997. The estimates for the “Symmetric Changes” case are the results of an orderedprobit with the dependent variable being a negative change, no change, or a positive change in the loan rate. Theestimates for the “Increase” case are the results of a probit model with the dependent variable being no change or apositive change in the loan rate. The estimates for the “Decrease” case are the results of a probit model with thedependent variable being a negative change or no change in the loan rate. “HHI” is the Herfindahl-Hirschman index
divided by 1000. The total derivative with respect to rt –rt-1 equals 1 2 3HHI LnAssetsc c c+ + where c1, c2, and c3
are the coefficient estimates for rt –rt-1, (rt –rt-1)HHI, and (rt –rt-1)LnAssets, respectively, and HHI and LnAssetsare the sample averages of the respective variables. The total derivative with respect to rt –rl,t-1 is calculated in asimilar manner.

40
Table 10
Changes in Unsecured Personal Loan Rates
(t-statistics in parentheses)
IndependentVariables
SymmetricChanges
Increase Decrease SymmetricChanges
Increase Decrease
rt –rt-1 1.013(2.75)
1.547(3.01)
0.856(1.74)
-4.49(-3.12)
-5.856(-3.57)
-4.062(-1.42)
rt –rl,t-1 0.068(8.10)
0.101(8.35)
0.035(3.03)
0.147(5.61)
0.314(8.60)
-0.004(-0.10)
(rt –rt-1)HHI -3.571(-1.40)
-5.537(-1.58)
-3.342(0.94)
-4.60(-1.69)
-7.864(-2.11)
-4.149(-1.05)
(rt –rl,t-1)HHI -0.068(-2.57)
-0.160(-4.06)
0.010(0.27)
-0.054(-1.94)
-0.125(-2.98)
4.6x10⁻⁴
(0.01)
(rt –rt-1)LnAssets 0.334(3.68)
0.464(4.42)
0.292(1.69)
(rt –rl,t-1)LnAssets -0.004(-3.20)
-0.012(-6.05)
0.002(1.11)
Total Derivativesat Sample Averages:
rt –rt-1
rt –rl,t-1
0.511
0.058
0.768
0.078
0.386
0.036
0.436
0.065
0.771
0.098
0.218
0.032
Observations:IncreaseNo Change
Decrease
38616,794
336
38616,794
0
016,794
336
38616,794
336
38616,794
0
016,794
336
Notes: The table gives estimates for probit models of changes in loan rates quoted weekly by 71 banks during theperiod August 1989 to August 1997. The estimates for the “Symmetric Changes” case are the results of an orderedprobit with the dependent variable being a negative change, no change, or a positive change in the loan rate. Theestimates for the “Increase” case are the results of a probit model with the dependent variable being no change or apositive change in the loan rate. The estimates for the “Decrease” case are the results of a probit model with thedependent variable being a negative change or no change in the loan rate. “HHI” is the Herfindahl-Hirschman index
divided by 1000. The total derivative with respect to rt –rt-1 equals 1 2 3HHI LnAssetsc c c+ + where c1, c2, and c3
are the coefficient estimates for rt –rt-1, (rt –rt-1)HHI, and (rt –rt-1)LnAssets, respectively, and HHI and LnAssetsare the sample averages of the respective variables. The total derivative with respect to rt –rl,t-1 is calculated in asimilar manner.

41

42