bank competition and stability: cross-country · pdf filebank competition and stability:...
TRANSCRIPT

Bank competition and stability: Cross-country heterogeneity�
Thorsten Becky Olivier De Jonghez Glenn Schepensx
July 18, 2011
Abstract
This paper documents a large cross-country variation in the relationship between bank competition
and stability and explores market, regulatory and institutional features that can explain this heterogene-
ity. Combining insights from the competition-stability and regulation-stability literatures, we develop
a uni�ed framework to assess how regulation, supervision and other institutional factors may make it
more likely that the data favor the charter-value paradigm or the risk-shifting paradigm. We show that
an increase in competition will have a larger impact on banks' risk taking incentives in countries with
stricter activity restrictions, more homogenous market structures, more generous deposit insurance and
more effective systems of credit information sharing.
Keywords: Competition, Stability, Banking, Herding, Deposit Insurance, Information Sharing, Risk
Shifting
JEL Classi�cations: G21, G28, L51�The authors would like to thank Fabio Castiglionesi, Hans Degryse, Claudia Girardone, Klaus Schaeck and seminar participants
at HEC Paris, Ghent University, Tilburg University, Cass Business School, Roma II Tor Vergata, Université Libre de Bruxelles,
Bangor Business School, the Bank of England, Bocconi (Milan) and the FIRS conference (Sydney) for interesting discussions and
helpful comments. Thorsten Beck acknowledges support from the European Commission under Marie Curie Grant, IRG 239469.
Glenn Schepens acknowledges support from the Fund for Scienti�c Research (Flanders) under FWO project G.0028.08N.yCentER, European Banking Center, Tilburg University and CEPR. [email protected], European Banking Center, Tilburg University. [email protected] of Financial Economics, Ghent University. [email protected]
1
1 Introduction
The impact of bank competition on �nancial stability remains a widely debated and controversial issue,
both among policymakers and academics.1 The belief that �ercer competition among banks would lead
to a more effective banking system initiated a deregulating spiral in the late 70s and early 80s. While the
deregulation of branching and activity restrictions may have resulted in more intense competition among
banks, with positive repercussions for �nancial depth and ef�ciency, it may as well have had the unintended
consequence of increasing banking sector instability.2 Similarly, the international process of banking liber-
alization seemingly has gone hand in hand with an increased occurrence of systemic banking crises in the
last two decades of the twentieth century, culminating in the global �nancial crisis of 2007-2009. However,
there is no academic consensus on whether bank competition leads to more or less stability in the banking
system.
A similar inconclusive debate as on the relationship between competition and stability has been led on
the effect of the regulatory framework on banks' risk-taking incentives and ultimately bank stability. On the
one hand, capital regulation and interest rate and activity restrictions are seen as fostering stability (Hell-
mann, Murdock, and Stiglitz (2000)); on the other hand, they might lead to rent-seeking and might prevent
banks from reaping necessary diversi�cation and scale bene�ts. The role of deposit insurance schemes has
been especially controversial. While often introduced to protect small depositors' lifetime savings and to
prevent bank runs, they also provide perverse incentives to banks to take aggressive and excessive risks.
These perverse incentives are held less in check in weak supervisory frameworks (Demirguc-Kunt and De-
tragiache (2002)).1See Group of Ten (2001), Bank for International Settlements (2001), International Monetary Fund (2001) and Indonesia and
Banco de Mexico (2008) as well as Vives (2001) and Carletti and Vives (2009). For a recent on-line debate on this topic, see
http://www.economist.com/debate/overview/205.
2See among others Keeley (1990) and Jayaratne and Strahan (1998)
2

The contribution of this paper originates in combining the two literatures and showing empirically that
the relationship between competition and stability varies across markets with different regulatory frame-
works, market structures and levels of institutional development. While we show, on average, a positive
relationship between banks' market power, as measured by the Lerner index, and banks' stability, as mea-
sured by the Z-score, we �nd large cross-country variation in this relationship. We test the possible channels
that may create cross-country variation in the competition-stability relationship and show that cross-country
variation in market structure, the regulatory framework and the institutional environment in which banks op-
erate affects cross-country heterogeneity in the competition-stability relationship. Speci�cally, our results
suggest that an increase in competition will have a larger impact on banks' risk taking incentives in countries
with stricter activity restrictions, more homogenous market structures, more generous deposit insurance and
more effective systems of credit information sharing.
The effects of these structural country features on the competition-stability relationship are not only
statistically, but also economically large and thus have important policy implications. For example, we con-
duct a ceteris paribus analysis that mimics a post 'great recession' scenario with generous deposit insurance
schemes and stronger restrictions on bank activities and, hence, implying more herding. The relationship
between market power and soundness is almost twice as strong compared to the average country in the ab-
sence of such a change, suggesting a very negative impact of competition on stability in this scenario. In
the base scenario, a one standard deviation reduction in market power leads to a drop in the Z-score of 20%.
In our �ctitious post-crisis scenario, a similar loss in market power leads to a 38% reduction in the average
Z-score. This effect of regulatory reform comes in addition to any direct effect (positive or negative) that
such reforms might have on banks' stability.
Exploring the variation in the competition-stability relationship is important for academics and policy
makers alike. The academic debate on the effect of competition on bank stability has been inconclusive and
by exploring factors that can explain cross-country variation in the relationship, this paper contributes to
3

the resolution of the puzzle. Policy makers have been concerned about the effect of deregulation and the
consequent competition on bank stability but have also discussed different elements of the regulatory frame-
work that have both an impact on competition and directly on stability, including deposit insurance, capital
regulation and activity restrictions. This debate has been renewed after the recent crisis, with reform sugges-
tions focusing on activity restrictions, capital standards, deposit insurance and the institutional structure of
supervision. This paper shows a critical role for the regulatory framework in explaining the variation across
countries and over time in the relationship between competition and stability and has therefore important
policy repercussions.3
Our paper builds on a rich theoretical and empirical literature exploring the relationship between com-
petition and stability in the banking system.4 On the one hand, the competition-fragility view posits that
more competition among banks leads to more fragility. This �charter value� view of banking, as theoreti-
cally modeled by Marcus (1984) and Keeley (1990), sees banks as choosing the risk of their asset portfolio.
Bank owners, however, have incentives to shift risks to depositors, as in a world of limited liability they only
participate in the up-side part of this risk taking. In a more competitive environment with more pressure on
pro�ts, banks have higher incentives to take more excessive risks, resulting in higher fragility. However, in
systems with restricted entry and therefore limited competition, banks have better pro�t opportunities, capi-
tal cushions and therefore fewer incentives to take aggressive risks, with positive repercussions for �nancial
stability. In addition, in a more competitive environment, banks earn fewer informational rents from their
relationship with borrowers, reducing their incentives to properly screen borrowers, again increasing the
risk of fragility (Boot and Thakor (1993), Allen and Gale (2000), Allen and Gale (2004)). The competition-3If such a country-specifc factor affects both competition and banking sector stability, then a spurious relationship between
competition and stability may be the outcome. Therefore, we only exploit the within country-year variation in bank market power
and bank soundness. More detailed information is in the Methodology section.4For an excellent overview of the existing (pre-2008) models and empirical evidence on competition and stability, see Carletti
(2008) and Degryse and Ongena (2008).
4

stability hypothesis, on the other hand, argues that more competitive banking systems result in more rather
than less stability. Speci�cally, Boyd and De Nicolo (2005) show that lower lending rates reduce the entre-
preneurs' cost of borrowing and increase the success rate of entrepreneurs' investments. In addition, these
�rms will refrain from excessive risk-taking to protect their increased franchise value. As a consequence,
banks will face lower credit risk on their loan portfolio in more competitive markets, which should lead
to increased banking sector stability. However, more recent extensions of the Boyd and De Nicolo (2005)
model that allow for imperfect correlation in loan defaults (Martinez-Miera and Repullo (2010); Hakenes
and Schnabel (2011)) show that the relationship between competition and risk is U-shaped. Hence, the im-
pact of an increase in competition can go either way, depending on other factors. Wagner (2010) extends
the Boyd and De Nicolo (2005) model and allows for risk choices made by borrowers as well as banks. If
lending rates decline due to more competition, banks have less to lose in case a borrower defaults. Hence,
a bank may �nd it optimal to switch to �nancing riskier projects, which overturns the Boyd and De Nicolo
(2005) results.5
The standard response to con�icting theoretical predictions is to let the data speak. Numerous authors
have used different samples, risk measures and competition proxies to discriminate between the competition-
fragility and competition-stability view.6 Empirical studies for speci�c countries � many if not most for the
U.S. � have not come to conclusive evidence for either a stability-enhancing or a stability-undermining
role of competition. The cross-country literature has found that more concentrated banking systems are
less likely to suffer a systemic banking crisis as are more competitive banking systems (Beck, Demirguc-
Kunt, and Levine (2006); Schaeck, Cihak, and Wolfe (2009)). There seems also evidence that banks in
more competitive banking systems hold more capital, thus compensating for potentially higher risk they are
taking (Schaeck and Cihak (2011), Berger, Klapper, and Turk Ariss (2009)). A consequence of the recent5Other authors have also shown that more intense competition may induce banks to (i) switch to more risky, opaque borrowers
(Dell'Ariccia and Marquez (2004)), and (ii) acquire less information on borrowers (Hauswald and Marquez (2006)).6For an overview, see Beck (2008).
5

theoretical extensions is that the predicted impact of competition on bank stability moved from a bipolar
setting (good or bad per se) to a continuous approach (settings that are better or worse in relative terms).
These models lead to new testable implications that exceed a mere assessment of the sign of the coef�cient
of bank market power. For example, by allowing loan defaults to be imperfectly correlated, the Martinez-
Miera and Repullo (2010) model and the Hakenes and Schnabel (2011) model imply that the impact of
competition on risk is affected by regulatory constraints on asset diversi�cation, since the latter will affect
the correlation structure of loan defaults.
Our paper also relates to the literature on bank regulation and stability. More effective credit information
sharing cannot only help deepen and broaden �nancial systems, but also reduce fragility (Powell, Mylenko,
Miller, and Majnoni (2004)). Capital requirements have often been advocated as tools to reduce bank
fragility, though there is little empirical evidence that more stringent capital regulation helps reduce bank
fragility (Barth, Caprio, and Levine (2006)). While activity restrictions have often been heralded as a way
to reduce bank fragility, cross-country evidence has also shown a positive relationship between activity
restrictions and the likelihood of a systemic crisis (Beck, Demirguc-Kunt, and Levine (2006)). The role
of deposit insurance schemes has been especially controversial. A substantial body of empirical work has
shown the negative effects that generous deposit insurance can have on bank stability by providing perverse
incentives to take aggressive risks (see Demirguc-Kunt and Kane (2002), for an overview). The market
structure can also have important repercussions for banking sector stability. Acharya and Yorulmazer (2007)
and Brown and Dinc (2011) show that the supervisory decision to intervene a failing bank is subject to an
implicit too-many-to-fail problem: when the number of bank failures is large, the regulator �nds it ex-post
optimal to bail out some or all failed banks. This, however, gives banks incentives to herd and increases the
risk that many banks may fail together.
While this paper builds on the cross-country literature on the competition-stability relationship, it is the
�rst - to our best knowledge - to explore the heterogeneity of this link and thus connects directly to the
6

current debate on regulatory reforms. It is important to note some limitations of our analysis, however.
First, we focus on a speci�c measure of bank competition, the Lerner index. Since we want to exploit cross-
country heterogeneity of the competition-stability relationship, we cannot use indicators of competition on
the country level, such as the H-statistic. Nevertheless, we show that in our sample, the country-averaged
Lerner index is meaningfully and statistically related to other competition and market structure measures.
Second, and for the same reason, we focus on a bank-level indicator of stability rather than indicators
of systemic distress. It is important to stress, therefore, that we do not want to settle the competition-
stability debate, but rather show the importance of cross-country heterogeneity and the need to take into
account regulatory and other policies when assessing the effect of competition on stability. Third, this
paper does not investigate the direct impact of regulation (Z) on competition (X) or risk (Y), questions
that have been the topic of previous research. Rather, we focus on the impact of regulation (Z) on the
competition-stability trade-off ( @Y@X ). The former effects are controlled for by including time-varying country
�xed effects, which imply that we only exploit the within-country year information. Finally, we try to control
for biases stemming from reverse causation and simultaneity, but are careful to not infer causality from our
analysis.
The remainder of the paper is structured as follows. Section 2 discusses different factors that might
explain the variation in the competition-stability relationship. Section 3 introduces data and methodology.
Section 4 presents results on the average cross-country relationship between bank competition and stability,
while section 5 explores the cross-country heterogeneity in this relationship. Section 6 concludes with policy
implications.
2 Competition-stability relationship - a conceptual framework
Unlike previous papers we do not test the validity of one of the two hypotheses on the relationship between
competition and stability, but rather their relative importance and strength as function of the market, reg-
7

ulatory and institutional framework in which banks operate. Speci�cally, we argue that country-speci�c
features may affect the existing empirical evidence on the relationship between competition and stability via
three possible channels. First, a certain type of regulation may limit the extent to which banks can or will
engage in riskier activities if their franchise values are eroded. This would thus in�uence the strength of
the competition-fragility relationship. Second, country-speci�c characteristics may also affect the adverse
selection problem that banks face if they charge higher loan rates. This would thus in�uence the strength
of the competition-stability relationship. Third, institutional characteristics may affect the proportion of
systematic and idiosyncratic risk in loan defaults and may make it hence more likely that the empirical data
favor one theory over the other. The relative strength of each of these three channels may explain why dif-
ferent studies obtain different results in terms of magnitude or even sign. That is, certain country-speci�c
features may make the assumptions and predictions of a given theoretical model more realistic.
To more formally conceptualize the framework for our hypothesis, let � denote the estimated effect of
bank market power on stability. This point estimate is in�uenced by three factors: �CF > 0; �CS <
0; p(CF ) 2 [0; 1] where �CF denotes the stability welfare gains of a unit increase in market power
(competition-fragility hypothesis), �CS denotes the stability loss as a result of a unit increase in market
power (competition-stability hypothesis) and p(CF ) indicates how likely it is that one theory dominates
over the other. �CF and �CS are the parameters one would obtain in an ideally designed laboratory setup
that perfectly matches the assumptions of the underlying model. In the absence of such a setup, every es-
timate of the relationship between market power and bank soundness is a combination of these underlying
'deep' parameters. Our conjecture is that these theories do, however, provide information on how certain
country characteristics affect �CF ; �CS and p(CF ). More speci�cally, let x denote the speci�c feature
under investigation and let � = p(CF ) � �CF + (1� p(CF )) � �CS . A change in x (or two samples with
different x) can lead to a different estimated impact of market power on stability via three different channels.
8
It may affect �CF , �CS , as well as p(CF ) . The joint impact on � is determined by:
@�
@x=@p(CF )
@x� �CF �
@p(CF )
@x� �CS + p(CF ) �
@�CF@x
+ (1� p(CF )) � @�CS@x
In the remainder of this section, we describe the theoretical predictions about the impact of country-
speci�c features on the competition-risk taking relationship. These predictions are inferred from the assump-
tions underlying the models in the competition-stability as well regulation-stability literature. We combine
the different predictions in three groups.
2.1 Institutional and �nancial development
A �rst set of country traits that can in�uence the competition-stability relationship is the institutional frame-
work and �nancial system structure in which banks operate. The institutional framework may affect the
scope for adverse selection and moral hazard by entrepreneurs, which is one of the crucial ingredients in
the model of Boyd and De Nicolo (2005). First, we consider the credit information sharing framework.
Credit registry institutions are public or private entities which collect information on the creditworthiness of
borrowers. The existence of credit registers is expected to reduce both adverse selection and moral hazard
problems that are inherent on being in the lending business (Pagano and Jappelli (1993) and Kallberg and
Udell (2003)). As borrowers realize that it will be hard to get a loan at another institution when they default
on their current loan, they will have a stronger incentive to repay and they will choose a safer project (Padilla
and Pagano (2000), Vercammen (1995)). Houston, Lin, Lin, and Ma (2010) show for a sample of nearly
2400 banks in 69 countries that greater information sharing leads to higher bank pro�ts and lowers bank
risk. Hence, a �rst testable cross-country hypothesis is that in countries with better information sharing
systems an increase in market power is less detrimental to stability, since better information sharing systems
will lower the entrepreneurs' incentive to take more risk (@�CS@x > 0).
In addition, we consider �nancial structure and, more speci�cally, competition for banks coming from
�nancial markets. More developed stock markets make it easier for �rms to switch between bank-based
9
and market-based funding. However, it also implies that �rms who behave or default strategically (i.e.,
moral hazard) will suffer reputation losses in other markets as well. Moreover, a stock listing also requires
more information disclosure and transparency (even in the absence of credit registries). This could lead to
an additional effect of a change in competition on bank risk behavior. This leads us to hypothesize that,
ceteris paribus, it is less likely to �nd a negative relationship between market power and bank stability in
countries with well developed �nancial markets (@�CS@x > 0).
2.2 Regulatory and supervisory framework
A second group of country traits that in�uence the relationship between competition and stability consists
of regulation and supervision designed to protect bank charter values and to prevent risk-seeking behavior
if charters are eroded. Risk-adjusted deposit insurance or appropriate capital requirements would help to
control risk taking, even in the presence of intense competition (Hellmann, Murdock, and Stiglitz (2000),
Matutes and Vives (2000) and Repullo (2004)). Allen, Carletti, and Marquez (2011) show that borrowers
prefer well capitalized banks, since these banks have a relatively higher incentive to monitor, which improves
�rm performance. This rise in bank value and the borrower preferences should induce a rise in bank charter
value, thus lowering the banks' risk appetite. These effects allow us to hypothesize that more stringent
(risk-based) capital regulation may limit the negative in�uence that competition may have on stability
(@�CF@x < 0). Another, popular regulatory measure to increase the stability of banking systems is deposit
insurance, as it reduces the risk of bank runs (Matutes and Vives (1996)). On the other hand, too generous
deposit insurance schemes or inappropriately priced deposit insurance might increase moral hazard (see,
e.g., Demirguc-Kunt and Kane (2002) and Demirguc-Kunt and Huizinga (2004)) since the safety net subsidy
increases the liquidation value of the bank. Thus, a generous deposit insurance system will increase risk-
taking incentives in more competitive environments, i.e. @�CF@x > 0.
In addition to regulation, such as capital requirements and deposit insurance, effective banking super-
10

vision can be important for several reasons. First, monitoring banks is both costly and dif�cult for both
depositors and shareholders, which can lead to suboptimal bank risk behavior. Second, bank failures may be
very costly, due to the crucial role banks play within the economic system. Taking these points into account,
more effective supervision should provide incentives to limit bank risk taking and thus could soften the effect
of competition on risk taking (@�CF@x < 0). Having multiple supervisors may lead to different supervisory
approaches, which can generate useful information which would otherwise be neglected (Llewellyn (1999)).
However, it might also lead to regulatory arbitrage, exacerbating the effect of competition on stability. Bank-
ing supervision may be supplemented by external governance which serves the same purpose. Having a
wide range of private control mechanisms such as external audit and external ratings should also dampen the
risk incentives of a bank. Increased level of disclosure makes it easier for depositors to determine a banks'
risk position and will make funding costs more risk-sensitive, which gives banks an incentive to improve the
quality of their asset portfolio.
2.3 Herding and market structure
A third important country characteristic that can in�uence the relationship between competition and stability
is the covariation of banks' behavior, also known as herding. An important factor in deciding whether or
not to intervene is whether the whole system or only a minor fraction of banks are at risk. Acharya and
Yorulmazer (2007) and Brown and Dinc (2011) show that the supervisory decision to intervene a failing
bank is subject to an implicit too-many-to-fail problem: when the number of bank failures is large, the
regulator �nds it ex-post optimal to bail out some or all failed banks. This, however, gives banks incentives
to herd and increases the risk that many banks may fail together. Hence, herding behavior may also affect
banks' incentive to increase risk-taking in response to an increase in competition. Activity restrictionsmay
have the unwanted consequence of encouraging herding, as they limit banks' potential to venture in new
markets if the bank faces �ercer competition in its core market. Hence, all else equal, an increase in activity
11
restrictions will lead to more gambling behavior in response to more competition (@�CF@x > 0) as banks have
limited outside options, and hence herd more (less heterogeneity), in such a setup. In addition, Martinez-
Miera and Repullo (2010) and Hakenes and Schnabel (2011) show that a lower correlation of loan defaults
makes it more likely that �ercer competition harms stability. A bank's potential to reduce the correlation of
its loan portfolio and other revenues is clearly affected by restrictions on diversi�cation. Let x be a proxy
for restrictions on diversi�cation, we then conjecture that @p(CF )@x < 0. Moreover, herding can also occur
without activity restrictions. When some banks invest in one type of product that generates high pro�ts,
other banks may be forced to imitate them, as otherwise shareholders will hold them responsible for the
lower pro�tability of the institution. Hence, there will be a lack of bank business model diversi�cation if
they all venture in the same new, pro�table business lines. Thus, we can hypothesize that competition will
have a stronger impact on bank risk behavior in more heterogeneous banking systems, i.e. @�CF@x < 0.
We also look at herding in terms of risk taking behavior (systemic risk). A crucial assumption in Boyd
and De Nicolo (2005) is that loan defaults are perfectly correlated. Martinez-Miera and Repullo (2010)
show that if this restriction is relaxed, such that a bank's loan portfolio has both systematic and idiosyncratic
risk, then Boyd and De Nicolo (2005)'s predictions can switch sign. When there is herding in risk-taking
behavior, there will be fewer idiosyncratic defaults. In times of systemic distress, the stock price correlation
of non-�nancial �rms also increases and hence, the assumption of perfectly correlated loan defaults becomes
more plausible. Therefore, if systemic risk is high, we expect to see a reduction in the probability that the
competition-fragility view is favoured over the competition-stability model, implying that @p(CF )@x < 0.
The expected effects can be summarized in the following table. The �rst column represents the variable
of interest. The second column contains the expected impact on the market power-soundness relationship.
The third column describes the channel (theory) through which the variable may have an impact on the
competition-stability relationship.
12

Variable Expected Impact on � Operates through
Institutional and �nancial development
Information Sharing + �CS
Stock Market Development + �CS
Regulation and Supervision
Capital Regulation � �CF
Deposit Insurance + �CF
Multiple Supervision + or � �CF
External Governance + �CF
Herding
Activity Restrictions + or � �CF (+) or p(CF ) (-)
Heterogeneous Banking System � or + �CF (-) and p(CF ) (+)
Systemic Risk + or � �CF (+) and p(CF ) (-)
3 Data and Methodology
In this section, we describe the data and methodology for our empirical analysis. First, we describe the
sample composition and data sources. Next, we explain how we allow for country-level variation in the
estimated impact of competition on stability. We also describe how we compute the bank-speci�c measures
of soundness and market power.
13

3.1 Data sources
To gauge the relationship between bank competition and stability, we combine data from several sources.
We obtain information on banks' balance sheets and income statements from Bankscope, which is a database
compiled by Fitch/Bureau Van Dijck that contains information on banks around the globe, based on publicly
available data-sources. The period of analysis is 1994�2009. If banks report information at the consolidated
level, we delete the unconsolidated entries of the group from the sample to avoid double counting. We
apply a number of selection criteria to arrive at our sample. First, we exclude countries for which we have
information on fewer than 50 bank-year observations. Second, we limit our analysis to commercial, saving
and cooperative banks, which represent, respectively, 53:4%, 28:2% and 18:4% of the sample. Third, we
delete banks that report information for fewer than three consecutive years, as our risk measure is computed
over rolling windows of three years. Fourth, we drop bank-year observations that do not have data available
on basic variables. Subsequently, we winsorize all variables at the 1 percent level to mitigate the impact
of outliers and to enhance robustness of the standard errors. While most of the bank-speci�c variables are
ratios, variables in levels (such as size) are expressed in 2007 US dollars.
The bank-speci�c data are linked to various country-level datasets that contain information on the regu-
latory framework, strength of supervision and other institutional features. More speci�cally, we employ data
from the three waves (1997, 2001 and 2005) of the Bank Regulation and Supervision database compiled by
the World Bank (Barth, Caprio, and Levine (2008)). Additional information is obtained from the World
Development Indicators and the Doing Business database. A detailed list of the variables used and the data-
base from which they are collected can be found in Appendix A. Filtering the bank-speci�c database and
matching it with the country-level datasets yields a sample of banks from 79 countries. The sample consists
of a mix of developed and developing countries (see Appendix B).
14
3.2 Empirical framework
In the literature, there are two main approaches to assessing the relationship between competition and sta-
bility: a multiple country or single country setup. In a cross-country setup, proxies of market power at the
bank- or country-level are related to bank soundness in a linear or quadratic speci�cation. The sign of the
coef�cient(s) then indicates whether competition helps or harms stability (or whether there is a turning point
at which there is a sign reversal). These studies provide insight into the average relationship between com-
petition and stability for the set of countries under investigation (e.g.: developing countries as in Turk Ariss
(2010), developed countries as in Berger, Klapper, and Turk Ariss (2009), the European Union as in Schaeck
and Cihak (2010)), while controlling for other country-speci�c factors such as macro-economic conditions,
regulation and supervision. However, single country studies (such as Keeley (1990), Salas and Saurina
(2003), Jimenez, Lopez, and Saurina Salas (2010), Boyd, De Nicolo, and Jalal (2006)) document a large
degree of variation in the competition-stability relationship. This indicates that these other country-speci�c
factors may not only have a level effect but also a slope effect. Hence, it is not only important to control
for the impact of these factors on risk but also on how they shape the competition-stability relationship. Put
differently, these variables may also determine whether it is more likely to �nd support for the franchise
value paradigm compared to the risk-shifting hypothesis or vice versa. This results in the following setup:
Riski;j;t = c+ �j � Competitioni;j;t�1 + j �Xi;j;t�1 + �Zj;t + "i;j;t (1)
In this setup, the indices i; j ; t stand respectively for bank, country and time. The impact of competition
(as well as any other bank-speci�c variable, Xi;j;t) on risk is allowed to vary at the country level. This is
denoted by giving the corresponding (vector of) coef�cient(s) a j subscript. The vector of bank-speci�c
variables, Xi;t�1, characterizes a bank's business model. In particular, we include proxies for the funding
structure (share of wholesale funding in total funding), asset (loans to assets ratio) and revenue mix (share
of non-interest income in total income) as well bank size (natural logarithm of total assets), credit risk (loan
15

loss provisions to interest income) and asset growth. In addition, we include specialization dummies to allow
for different intercepts for commercial banks, saving banks and cooperatives. Summary statistics on these
control variables that determine bank soundness are presented in the upper part of Table 1. Furthermore,
time-varying country-speci�c characteristics may also affect bank soundness and are therefore included in
the vector Zj;t.
<Insert Table 1 around here>
We hypothesize that �j can be modelled as a function of (a subset of) these country-speci�c factors. To
gain insight in the potential drivers of heterogeneity in �, we take a two-step approach. In a �rst step, we
relate bank market power to a measure of bank soundness. This relationship is assessed at the country level.
Speci�cally, for each country we regress bank stability on bank competition and a group of bank-speci�c
control variables, while controlling for time-�xed effects and using �ve year rolling windows:
Riski;t = c+ � � Competitioni;t�1 + Xi;t�1 + vt + "i;t (2)
The retrieved conditional correlations are subsequently matched to country-speci�c variables measured at
the �rst year of the �ve year window. Including time �xed effects and estimating this equation country by
country over time has several advantages. First, we allow for the maximum extent of heterogeneity in the
competition-stability trade-off across countries. Second, the time dummies differ in each country regression
and hence indirectly capture the level effect of country-speci�c regulation or the business cycle on bank risk.
In the second step, we explore which country-speci�c variables explain the heterogeneity in the estimated
�js. Speci�cally, we regress the estimated �js on a set of country-level variables capturing the market,
regulatory and institutional framework in which banks operate.
In an alternative speci�cation, we combine the two stages into one. Speci�cally, we run the following
regression:
Riski;j;t = c+ (�0 + �1Zj;t) � Competitioni;j;t�1 + Xi;j;t�1 + vj;t + "i;j;t (3)
16

where Zj;t is either just one of the country-speci�c characteristics or a vector containing all of them.
We are interested in the �1 coef�cients that directly gauge the impact of different country characteristics
on the competition-stability relationship. We also include country-time �xed effects, �j;t. We do this for
two main reasons. First, as mentioned in the introduction and throughout the paper, many other papers
have documented that regulation, supervision and the business cycle may have an impact on competition
and market structure, as well as banking system stability and bank crises. This could create a spurious
correlation between market power and stability driven by a third country-speci�c variable. We rule out
this possibility by only exploiting the within country-year variation.7 Second, time-varying country �xed
effects eliminate the impact of omitted (e.g., stance of the business cycle or in�ation) or unobservable (e.g.,
unexpected monetary policy) country-speci�c variables by capturing the maximum extent of unobserved
time-varying country heterogeneity. Furthermore, we also cluster the error terms on the country-year level.
Both methods have their (dis)advantages. The two-step approach allows for heterogeneous coef�cients
for all variables (as Equation (2) is estimated for each country separately), compared to a pooled coef�cient
on the control variables Xi;j;t in Equation (3). The two-step approach gives equal weight to each country,
whereas the pooled approach gives more degrees of freedom. In the two step approach, the dependent
variable is an estimated variable (which is accounted for), whereas the multicollinearity problem may be
more severe for interaction variables in Equation (3). The combination of these two setups should provide
reliable and robust evidence on the drivers of heterogeneity in the competition-stability relationship.
3.3 Indicators of market power and bank soundness
In order to test for cross-country and cross-time variation in the bank competition-stability relationship,
we need indicators of competition and stability that vary on the bank-level over time, as indicators on the7In mathematical terms, an (un)observed country-speci�c variable Zj;t may affect Riskj;t and Competitionj;t. This may
create a spurious relationship between Riski;j;t and Competitioni;j;t. This paper's setup examines the relationship between
(Riski;j;t �Riskj;t) and (Competitioni;j;t � Competitionj;t) and how this relationship varies because of Zj;t.
17

country level would not allow us to exploit the cross-country heterogeneity in the relationship between the
two. We therefore focus on two standard indicators of banks' market power and soundness, respectively,
which we will discuss in depth in the following.
3.3.1 The Lerner index: measure of pricing power
The Lerner index is the only measurable market power indicator, besides market share, that varies at the bank
level. We prefer the Lerner index over market share as it is more closely linked to the theoretical models
that hinge on banks' franchise value. The Lerner index is a proxy for current and future pro�ts stemming
from pricing power. As such, it �ts well with the theoretical concept of banks' franchise value. Market
share, on the other hand, not only is a proxy for pricing power, but also captures the rents extracted from
being too-big-to-fail. Hence, market share as a proxy for pricing power is subject to measurement error in a
similar fashion as Tobin's Q (Gan (2004)). Moreover, the Lerner index captures both the impact of pricing
power on the asset and funding side of the bank. Finally, the Lerner index does not necessitate to de�ne the
geographical market, in contrast to market share or market concentration measures.8 Conditional on having
an estimate of the marginal price and cost, we can construct the Lerner index for each bank and each year,
as follows:
Lerneri;t =Pi;t �MCi;t
Pi;t(4)
where Pi;t is proxied by the ratio of total operating income to total assets. As banks have the opportunity
to expand their activities into non-interest generating activities, we include both interest and non-interest
revenues. The marginal cost, MCi;t, is derived from a translog cost function. As Berger, Klapper, and
Turk Ariss (2009), we model the total operating cost of running the bank as a function of a single, aggregate8Admittedly, one has to make a choice of the scope of the market when estimating the cost function. In the reported results, we
estimate the cost function by country. However, estimating a global cost function or using average cost rather than marginal cost
lead to very similar results.
18

output proxy, Qi;t, and three input prices, wji;t, with j 2 f1; 2; 3g. More speci�cally, we estimate:
lnCi;t = �0+�1 lnQi;t+�2(lnQi;t)2+
3Xj=1
�j lnwji;t+
3Xj=1
3Xk=1
�j;k lnwji;t lnw
ki;t+
3Xj=1
j lnwji;t lnQi;t+vt+"i;t
(5)
We also include time dummies to capture technological progress as well as varying business cycle condi-
tions, and a bank specialization dummy. Homogeneity of degree one in input prices is obtained by imposing
the restrictions:3Xj=1
�j = 1;
3Xj=1
j = 0 and 8 k 2 f1; 2; 3g :3Xj=1
�j;k = 0. Marginal cost is then obtained
as follows:
MCi;t =@Ci;t@Qi;t
=Ci;tQi;t
0@b�1 + 2b�2 lnQi;t + 2Xj=1
b j ln wji;tw3i;t
1A (6)
in which Ci;t measures total operating costs (interest expenses, personnel and other administrative or
operating costs), Qi;t represents a proxy for bank output or total assets for bank i at time t. The three
input prices capture the price of �xed assets, the price of labor and the price of borrowed funds. They are
constructed as, respectively, the share of other operating and administrative expenses to total assets, the ratio
of personnel expenses to total assets and the ratio of interest expenses to total deposits and money market
funding. Following Berger, Klapper, and Turk Ariss (2009), Equation (5) is estimated separately for each
country in the sample to re�ect potentially different technologies.
Table 1 presents summary statistics on the variables needed to construct the Lerner index (middle panel)
as well as the estimated Lerner index (lower panel). The average Lerner index at the country level is 12:4%,
but varies across countries, from �5% in Thailand to 30:3% in Saudi Arabia (see Appendix B). The bottom
panel of Table 1 shows that most of the variation in the Lerner index is between banks as opposed to within
banks over time. Interestingly, we also �nd a larger variation across banks for a given country and year than
between countries.
In many other cross-country studies that examine the bank competition-stability relationship, authors
have relied on country-speci�c measures of market power or market structure. For aforementioned reasons,
19

these measures can not be used in this setup. However, the results in Table 2 indicate that aggregate Lerner
indices are meaningfully and statistically related with other measures of competition and market structure.
Table 2 provides a correlation matrix between non-structural measures of market power and concentration,
that are measured at the country-year level, such as the number of banks, the Hirschmann-Her�ndahl index,
a CR3 concentration ratio as well as a structural indicator of competition, the Panzar-Rosse H-statistic. In
addition, we also include the country average of the Lerner index and market share. We de�ne all measures
such that an increase in the measure indicates less competition.9
<Insert Table 2 around here>
The Lerner index is positively related to all other indicators and the correlation is signi�cant for all
but the Her�ndahl index. In addition, the correlation table shows that all signi�cant correlations are positive
(except the one between the H-statistics and the number of banks). To conclude, the Lerner index is preferred
over all other proxies both from a modelling perspective (variation across banks) as well as from a theoretical
perspective (current and future pricing power constitute a bank's franchise value, which lies at the core of
the theoretical models). It is reassuring, however, that our preferred competition proxy, the Lerner index, is
positively related to other competition proxies.
3.3.2 The Z-Score: measure of bank soundness
In our analysis, bank risk is measured using the natural logarithm of the Z-score (as in e.g. Houston, Lin,
Lin, and Ma (2010), Demirguc-Kunt and Huizinga (2010), Laeven and Levine (2009) and many others).
The Z-score measures the distance from insolvency (Roy (1952)) and is calculated as
Zi;t =ROAi;t + (E=A)i;t
�(ROA)i;t(7)
whereROA is return on assets, E=A denotes the equity to asset ratio and �(ROA) is the standard deviation
of return on assets. While in large parts of the literature the volatility of pro�ts is computed over the full9More speci�cally, we take the inverse number of banks and the negative of the Panzar-Rosse H-statistic.
20
sample period, we use a three-year rolling time window for the standard deviation of ROA to allow for
time variation in the denominator of the Z-score. This approach avoids that the variation in Z-scores within
banks over time is exclusively driven by variation in the levels of capital and pro�tability (Schaeck and
Cihak (2010)). Moreover, given the unbalanced nature of our panel dataset, it avoids that the denominator is
computed over different window lengths for different banks. The Z-score can be interpreted as the number
of standard deviations by which returns would have to fall from the mean to wipe out all equity in the bank
(Boyd and Runkle (1993)). A higher Z-score implies a lower probability of insolvency, providing a more
direct measure of soundness than, for example, simple leverage measures. Because the Z-score is highly
skewed, we use the natural logarithm of Z-score to smooth out higher values.10 Table 1 shows that the
average value of ln(Z-score) slightly exceeds four with a standard deviation of 1:31. It ranges from 4:97 in
Switzerland to 2:37 in Uruguay (see Appendix B). The bottom panel of Table 1 shows that - as in the case
of the Lerner index - most of the variation is between banks rather than over time within a given bank. We
also �nd a larger variation across banks within a speci�c country and year than across countries.
3.3.3 Lerner index and Z-score: a spurious correlation?
One concern in our empirical analysis is that Lerner index and Z-score both include pro�tability in the
numerator and any positive relationship between the two might thus be mechanical rather than economically
meaningful. As a �rst approach, we therefore gauge the relationship between the Lerner index and Z-score
over time as well as between Lerner index and the denominator of the Z-score, pro�t volatility. Figure 1
provides information on the time series evolution of the Lerner index, the Z-score as well as the denominator
of the latter, i.e. pro�t volatility. The variables are �rst averaged by country and then across countries, to
give equal weight to each country. The values of the market power measure (the Lerner index) are measured10Others have used the transformation ln(1+Z-score) to avoid truncating the dependent variable at zero. We take the natural
logarithm after winsorizing the data at the 1% level. As none of the Z-scores is lower than zero after winsorizing, this approach is
similar, save for a rescaling, to the former approach and winsorizing after the transformation.
21
at the right-hand axis, while the values of the Z-score on the left-hand axis.
<Insert Figure 1 around here>
There is a close correspondence between the time series pattern of bank soundness (Z-score) and bank
market power, which documents that competition and fragility are positively correlated over time. The lower
graph, which plots the Lerner index and the volatility of bank pro�ts, con�rms this �nding. An increase in
market power is associated with a reduction of pro�t volatility. As both plots yield a similar insight, this
is already a �rst indication that the empirical relationship between the Lerner index and the Z-score is not
spuriously created by including bank pro�ts in the numerator of the Z-score.
4 The cross-country relationship between market power and bank sound-
ness
4.1 Main results
Regression-based evidence on the relationship between bank market power and bank soundness is reported
in Table 3, where we assume a homogenous relationship between the two variables across countries and
over time. In this pooled cross-country setup, we regress the ln(Z-score) on the Lerner index and a set of
control variables, as described in regression Equation (3) and impose that �1 = 0. This assumption will be
relaxed in section 5.
The results in column 1 of Table 3 show a positive and signi�cant relationship between market power and
bank soundness. Put differently, an increase in competition, which erodes banks' pricing power, increases
banks' risk taking behavior and is hence detrimental for �nancial stability. This result is in line with existing
literature that also uses the Lerner index as a market power proxy (see, e.g., Berger, Klapper, and Turk Ariss
(2009)). In contrast to Figure 1, where we identi�ed the relationship in a time-series dimension, we now
22

exclusively rely on the heterogeneity in the variables within a country and a given year (as we include time-
varying country �xed effects). Doing so, we control for the impact of time-varying country characteristics
that may affect both the aggregate level of competition and stability in a country and could lead to a spurious
relationship.
<Insert Table 3 around here>
The effect is not only statistically, but also economically large. As the dependent variable is the natural
logarithm of the Z-score, the point estimate can be interpreted as a semi-elasticity. A one-standard deviation
reduction in the Lerner index, which equals 0:127, leads to a drop in the Z-score of almost 25%. Put
differently, the number of standard deviations pro�ts have to fall before capital is depleted is reduced by
25% if market power is reduced by one standard deviation.
Table 3 also reports three robustness checks on the baseline equation. First, we verify whether or not
the results are dominated by countries that constitute the lion's share of our sample.11 We weigh each
observation with the inverse of the number of banks in the corresponding country. These weights ascertain
that each country's banking sector gets an equal weight in the estimation. We again �nd a positive and
signi�cant relationship between market power and bank stability, though with a slightly smaller coef�cient
(column 2). Second, we report the results for the pre-2007 sample (column 3). The period of analysis is
thus 1994-2006, and is hence not contaminated by the exceptional events of the 2007-09 global �nancial
crisis. In addition, it spans the period before Basel II was implemented. As such, the change in capital
regulation does not affect our measure of risk. The impact of competition on stability in this shorter sample
is almost identical to the results reported in column 1. Third, bank market power may be endogenous and
the estimated relationship may re�ect reverse causality if bank failures affect market structure and possibly
the intensity of competition. While in all equations, we use lagged independent variables to address this11To avoid overrepresentation of US banks in the pooled sample, we already limited the dominant presence of the US banks in
the sample. For each time period, we include the largest 100 US banks as well as 1500 randomly selected banks.
23
possibility, the column 4 and 5 regressions control more directly for reverse causation and endogeneity
biases. In column 4, we control for unobserved heterogeneity at the bank level, by controlling for bank �xed
effects, rather than time-varying country �xed effects. Using within-bank variation over time, we con�rm
the positive relationship between banks' market power and stability. As a bank in a speci�c country faces
a more competitive environment, it becomes more risky. In column 5, we present IV (2SLS) regression
results, with loan growth, the cost-income ratio and lagged values of the Lerner index as instruments. The
F-statistic and J-statistic indicate the appropriateness of these instruments. In the pooled IV approach, we
again �nd a positive impact of market power on bank soundness. The estimated coef�cient is only slightly
larger compared to the baseline case.12
While not the focus of the paper, we do �nd some other interesting and stable relationships between
the control variables and bank soundness in the various speci�cations. Banks that have expanded into non-
interest income activities are riskier. Furthermore, faster growing banks and banks with large provisions for
loan defaults are also less sound.
4.2 Robustness tests
The Table 4 results show that the positive relationship between banks' market power and soundness is not
driven by a speci�c component of the Z-score. The Z-score consists of three building blocks: bank pro�ts,
bank capital and pro�t volatility. In Table 4, we report in the �rst four columns the impact of the Lerner index
on the Z-score (replicating column 1 of Table 3) as well as the impact of Lerner on each of the constituents
of the Z-score. An increase in market power is associated with an increase in pro�ts, a higher capital ratio
and less volatile pro�ts. The latter two results indicate that the relationship between the Lerner index and
the Z-score is not spuriously created by regressing a price markup on a variable related to bank pro�tability.12Next to cost ef�ciency and loan growth, we use lagged values of the Lerner index as instruments. Therefore the sample size
reduces substantially. Estimating the baseline equation (as in column one) on this sample of 47488 observations yields a coef�cient
of 1.76 for Lerner.
24

The negative relationship between market power and bank risk (column 4) is in line with the lower panel of
Figure 1.
<Insert Table 4 around here>
Next, we gauge the robustness of our �ndings to alternative measures of bank soundness. While in large
parts of the literature the volatility of pro�ts is computed over the full sample period, we follow Schaeck
and Cihak (2010) and use a three-year rolling time window for the standard deviation of ROA to allow
for variation in the denominator of the Z-score. This approach avoids that the Z-scores are exclusively
driven by variation in the levels of capital and pro�tability (Schaeck and Cihak (2010)). Moreover, given the
unbalanced nature of our panel dataset, it avoids that the denominator is computed over different window
lengths for different banks. In the �fth column, we employ a Z-score where pro�t volatility is measured over
5 year rolling windows (instead of three years). Even though the measure is different and the sample size is
reduced in column 5, we do not �nd that the relationship between competition and stability is signi�cantly
different from the baseline approach (column 1 of Table 4). In column 6, we use Non-Performing Loans
(NPL) as an alternative risk measure.13 We do not �nd a signi�cant relationship between the Lerner index
and the NPL ratio, which can be explained by several factors. First, the NPL ratio is an ex-post risk measure
that does not necessarily re�ect banks' voluntary choices. Second, non-performing loans reduce earnings
and hence also the Lerner index. This reverse causality creates a bias in the estimated relationship, whereas
the results in column 1-4 indicate that this is less of a concern for the Z-score. Finally, the NPL ratio is an
indicator of credit risk which is only one aspect of total bank risk.
In the last three columns of Table 4, we con�rm the pooled sample evidence on the positive impact
of market power on stability by looking at alternative bank-level competition measures. In column 7, we
simultaneously include the subcomponents of the Lerner index, which is a relative markup of price over13In this speci�cation, we do not include loan loss provisions as an independent variable.
25
marginal cost.14 The average price of bank activities is a proxy for market power in the loan market, while
the marginal cost is a proxy for the cost of funding (among other costs). Both price and marginal cost affect
banks' risk-taking signi�cantly and indicate that a reduction in the mark-up (more competition) originated
from prices, costs or both leads to less stability. In the last two columns, we include the loan market share
and market share in total assets15 instead of a pricing power index. While a large market share does not
necessarily imply market power, we do �nd that banks with a larger market share behave more prudent.
In the remainder of the paper, we focus on a speci�c measure of bank competition, the Lerner index and
a bank-level indicator of stability. The aforementioned robustness tests as well as the correlation table of
the different competition and market structure measures provide an indication that the relationship between
competition and stability is robust to using alternative setups. Nevertheless, it is important to stress that we,
however, do not want to settle the debate on the exact measures to use in a study of competition-stability,
but rather aim to show the importance of cross-country heterogeneity and the need to take into account
regulatory and other policies when assessing the effect of competition on stability. Even if the competition
or risk measure would be �awed and a source of bias, it would only affect our results if the bias works
disproportionately across countries and is related to our country-speci�c variables of interest.
5 The competition-stability relationship: explaining cross-country variation
So far, we have shown a conditional positive correlation between banks' market power and soundness. Be-
hind this average relationship, however, is a large variation both over time and across countries, as illustrated14All results in the paper also hold when using average cost rather than marginal cost in the Lerner index. While average cost is
theoretically inferior to marginal cost in the concept of the Lerner index, it has the advantages that it does not (i) require a choice of
cost function, (ii) involve an additional estimation step and (iii) require the demarcation of the region/sample used in the estimation.15Since we include time-varying country �xed effects and hence look at within country variation, there is a high correlation
between market share and bank size (and the rank correlation is perfect). Therefore, in the latter two speci�cations, we do not
include bank size as a separate regressor in the regression.
26

in Figures 2 and 3.
<Insert Figure 2 around here>
Figure 2 shows the coef�cient estimate on � if the baseline regression (as in Equation (3)) is run sepa-
rately for each year in the sample period, including country �xed effects and the same group of bank-level
control variables as discussed above. We �nd that a positive and signi�cant relationship between market
power and stability across all years, but the estimated relationship varies signi�cantly, with coef�cient es-
timates ranging from over three to (1994) to less than one (1997). The time variation in the estimated
relationship is much lower from 2000 onwards.
<Insert Figure 3 around here>
Figure 3 shows the unconditional and conditional correlation between banks' market power and sound-
ness across countries, with a very similar �nding16. The bar charts show that the unconditional and condi-
tional correlations are positive in most countries. In the �rst panel of Figure 3, the height of the bars shows
the magnitude of the unconditional correlation between the Z-score and the Lerner index. In the second
panel of Figure 3, the height of the bars shows the magnitude of the coef�cient of the Lerner index when
estimating Equation (2) for each country separately. The correlations and coef�cients that are signi�cantly
different from zero have a lighter shade. The average of the 79 estimated coef�cients equals 1:64, which
resembles the full sample coef�cient from the weighted regression (1:46). Hence, on average, it seems that
the franchise value paradigm dominates the risk-shifting hypothesis. However, there is a large amount of
heterogeneity in the competition-stability relationship from a negative and signi�cant relationship to a co-
ef�cient estimate of almost six. The standard deviation of the coef�cient across the 79 countries is 1:42. A
quick look at the country labels17 on the X-axis also reveals that it is not just a developed versus developing
countries story or that regions exhibit similar behavior.16The correlation between the conditional and unconditional correlation is 0:77 and strongly signi�cant.17Info on the country names, labels and exact numbers can be found in Appendix B.
27

In the remainder of this section, we will empirically explore what drives this large cross-country variation
in the competition-stability relationship. In the following, we pick up on our conceptual framework of
section 2 and discuss in more depth the different indicators that we use as proxies for the institutional
environment, the regulatory framework and herding. Table 5 presents descriptive statistics for the different
country-level variables, while Table 6 reports correlations. The de�nition and source of the variables are in
Appendix A.
<Insert Table 5 around here>
<Insert Table 6 around here>
Subsequently, in section 5.2., we present the main results before discussing some robustness tests.
5.1 Country-level indicators of herding, regulation and institutional environment
5.1.1 Institutional and �nancial development
We hypothesized that variables capturing the extent to which information on borrowers (and defaults) are
shared may affect the risk-shifting incentives of entrepreneurs. We therefore use an indicator of the Depth
of Information Sharing, which captures the difference in information content between the credit registries
in different countries. Some of them only collect limited information on large borrowers, while others have
extensive information on a whole range of borrowers and their characteristics (Miller (2003)). The index
ranges between 0 and 6, with a higher value indicating that more information is available. Furthermore,
we use Stock Market Turnover, i.e. the ratio of stocks traded to stocks listed, as an indicator of �nancial
market development and thus an indicator of alternative funding sources for enterprises. The turnover
ranges from zero in countries without stock exchanges to over 16, with an average of 0.54. The correlation
analysis shows that countries with more liquid stock exchanges also have more effective systems of credit
information sharing.
28

5.1.2 Regulatory and supervisory framework
We consider several dimensions of the regulatory and supervisory framework that might impact on the re-
lationship between banks' market power and soundness. First, we use a Capital Stringency index that
indicates whether there are explicit requirements regarding the amount and source of capital that a bank
should have. Speci�cally, it includes information on whether the source of funds that count as regulatory
capital can include assets other than cash, government securities, or borrowed funds, and whether the au-
thorities verify the sources of capital. A higher index indicates greater stringency. Capital Stringency ranges
from 2 to 10, with an average of 5.8. It is not correlated with any of the other country-level indicators.
Second, Deposit Insurance Coverage is proxied by deposit insurance coverage relative to GDP per capita.
This variable is taken from the Deposit Insurance Around the World database of the World Bank (Demirguc-
Kunt, Karacaovali, and Laeven (2005)). Deposit insurance coverage ranges from less than 20% of GDP per
capita to more than 20 times GDP per capita; in the regressions we will use this variable in logs. Third,
the degree of market discipline is captured by a dummy that equals one if there are multiple supervisors
in a country and an External Governance index. The external governance index includes information on
the effectiveness of external audits, the transparency of �nancial statements and the evaluations by rating
agencies and the incentives for future monitoring by creditors. This variable thus serves as a proxy for the
in�uence of private monitoring mechanism. External Governance ranges from 6 to 16.5, with an average of
12.7. TheMultiple Supervisors dummy gives more info on the structure of public supervision, with more
regulators indicating the possibility of regulatory arbitrage, but also more information. 16% of our sample
observations (country-years) have multiple bank supervisors. Interestingly, these four indicators of the regu-
latory and supervisory framework are not correlated with each other. The correlation table, however, shows a
positive and signi�cant correlation between Depth of Information Sharing and External Governance as well
as between Stock Market Turnover and Multiple Supervisors. Deposit Insurance Coverage is correlated with
both proxies of institutional and �nancial development.
29

5.1.3 Herding and market structure
As discussed above, we use three proxies of herding and market structure. First, we look at whether overall
activity restrictions limit the possibility of banks to diversify their activities. Therefore we include an Ac-
tivity Restrictions index, taken from the World Bank's Bank Regulation and Supervision database (Barth,
Caprio, and Levine (2008)), which measures the degree to which banks are permitted to engage in fee-based
activities related to securities, insurance and real estate rather than more traditional interest spread-based
activities. Lower values of the index indicate that no restrictions are placed on this type of diversi�cation
by banks and higher values indicate that such diversi�cation is prohibited. The index ranges from 4 to 15,
with an average of 9.5. Second, Heterogeneity-Revenues measures whether there are substantial revenue
differences among �nancial institutions within a country. It is calculated as the within-country, within-year
standard deviation of the non-interest income share. If all banks in a country have a similar business model
(either voluntarily or forced by regulation), the indicator will be low. A higher value indicates that there is
less herding in revenues in the banking system. Heterogeneity-Revenues ranges from 0.031 to 0.340, with a
mean of 0.180 and a standard deviation of 0.059. A second indicator of the too-many-to-fail problem is the
aggregate Z-score, which is the country-wide Z-score across all banks for a given year and country (i.e., how
large is the aggregate capital buffer against industry wide losses). This variable - Systemic Stability - is a
proxy of systemic risk. Lower values of the aggregate Z-score points to a lower aggregate level of banking
sector soundness and larger scope for herding as the likelihood of joint failures is larger in unstable banking
sectors. Systemic Stability ranges from 0.185 to 6.297, with an average of 3.60�4. Activity restrictions is
negatively and signi�cantly correlated with both Heterogeneity-Revenues and Systemic Stability, i.e. coun-
tries with more homogenous and riskier banking systems also experience higher activity restrictions, while
the other two variables are not correlated with each other. We also �nd a positive and signi�cant correlation
between Heterogeneity-Revenues and the Depth of Information Sharing.
30

5.2 Main results
In a �rst approach, we regress the estimated coef�cient from a country-by-country regression of bank sound-
ness on bank market power on the different country-level variables discussed above. Speci�cally, for each
country we regress our bank stability measure18 (Z-score) on the Lerner index and a group of bank-speci�c
control variables, while controlling for time-�xed effects and using �ve year rolling windows. Since our
sample period is 1994-2009, and taking into account that we lag our independent variables with one period,
we get a maximum of eleven country-speci�c conditional correlations and a total of 590 coef�cient esti-
mates for 73 countries. The retrieved conditional correlations are subsequently matched to country-speci�c
variables measured at the �rst year of the �ve year window. In the �rst nine columns of Table 7 we regress
the conditional correlation coef�cient separately on each country speci�c characteristic. The tenth column
shows the results when pooling all characteristics in a single regression.19
The results in Table 7 suggest that competition is more harmful for stability in countries where (i) there
are more effective systems of credit information sharing, (ii) stock markets are more liquid, (iii) there is
more stringent capital regulation, (iv) deposit insurance is more generous, (v) there are more restrictions on
the permissible range of activities and (vi) banks herd more in terms of revenue structure. When including
all nine country-speci�c indicators simultaneously, however, only the depth of credit information sharing,
the strength of capital regulations, deposit insurance coverage and the heterogeneity of revenues continue to
enter signi�cantly, while stock market turnover and activity restrictions lose their signi�cance. The latter is
due to the correlation with other variables. Stock market turnover is signi�cantly correlated with the depth
of information sharing. Activity restrictions is negatively correlated with the heterogeneity of revenues.18The reported results are based on the Z-score in which the volatility of pro�ts is measured over a three-year interval. The
results are robust to using a Z-score in which the denominator is measured using �ve-year rolling windows.19The number of countries and observations vary in each speci�cation due to the availability and coverage of different country-
speci�c characteristics. When repeating the regressions reported in columns 1-9 using a common sample (the sample used in
column 10), we obtain similar results.
31

The signs of the signi�cant relationships are in line with the theoretical predictions as explained in Section
2 (except for the coef�cient of the capital stringency index). Systemic stability, external governance and
multiple supervisors do not enter signi�cantly in any regression.
<Insert Table 7 around here>
The results in Table 7 are not only statistically, but also economically large, as indicated by the last
two columns. Speci�cally, we report the predicted � coef�cient at the 10th and the 90th percentile of the
respective country-speci�c characteristic. We note that in all cases, there is a positive relationship between
banks' market power and soundness, with the magnitude of the relationship, however, varying signi�cantly.
Take the case of deposit insurance, where the magnitude of the market power-soundness relationship is
more than twice as high at the 90th percentile of deposit insurance generosity as at the 10th percentile. The
relationship between market power and soundness is more than 50% higher at the 90th percentile of the
depth of credit information sharing and the strength of capital regulation than at the 10th percentile of the
respective variable.
Finally, the four cases mentioned in the lower end of these columns show the impact of a change in
competition corresponding with one of four different scenarios. Case 1 reports the predicted relationship
between banks' market power and soundness for a country that is average for each of the country-speci�c
variables. The predicted value - 1.642 - is very close to the average estimate reported in Table 3. Case 2
resembles a �ctitious post-crisis scenario with generous deposit insurance schemes (two standard deviations
increase) and more herding among banks (two standard deviation reduction in heterogeneity) and stronger
restrictions on bank activities (a one standard deviation increase), re�ecting recent regulatory reforms or
reform suggestions. Compared to the average country (case 1), the relationship between banks' market
power and soundness is almost twice as strong, suggesting a very negative impact of competition on stability
in this scenario. Case 3 (4), puts the country variables at the mean of the lowest (highest) �ve countries for
each variable, where we rede�ne all variables to have a positive impact on the market power-soundness
32

relationship. Doing so, we �nd that the relationship between banks' market power and soundness is almost
twice as high in countries with high values among the variables strengthening the market power-soundness
relationship than in countries with low values for these variables.
Table 8 shows the robustness of our �ndings to using an alternative speci�cation that combines the two
stages into one, using regression equation (3). For ease of comparability of the economic signi�cance, all
country-speci�c variables have been normalized to have zero mean and unit variance. We include country-
year �xed effects. We do this for two main reasons. First, as mentioned in the introduction and throughout
the paper, many other papers have documented that regulation, supervision and the like have an impact on
competition and market structure, as well as banking system stability and bank crises. This could create a
spurious correlation between market power and stability driven by a third country-speci�c variable. We rule
out this possibility by only exploiting the within country-year variation. Second, time-varying country �xed
effects eliminate the impact of omitted (e.g., stance of the business cycle or in�ation) or unobservable (e.g.,
unexpected monetary policy) country-speci�c variables by capturing the maximum extent of unobserved
time-varying country heterogeneity.
<Insert Table 8 around here>
The results in Table 8 indicate a positive relationship between banks' market power and soundness, a
relationship that is stronger in countries and periods where and when (i) there are more effective systems of
credit information sharing (ii) stock markets are more liquid, (iii) deposit insurance is more generous, (iv)
there are more restrictions on the permissible range of activities, (v) banks herd more in terms of revenue
structure and (iv) there is more systemic stability. When including the interaction of the Lerner index with
all variables simultaneously (column 10), we continue to �nd that the relationship between market power
and soundness is stronger in countries with more effective systems of credit information sharing, more
generous deposit insurance, more systemic stability and higher activity restrictions. While the coef�cient on
the interaction of Lerner index and Multiple Supervisors enters signi�cantly and positively when included
33

by itself, it enters negatively and signi�cantly when controlling for the interaction of the Lerner index with
the other country-level variables. The capital stringency index, which sign in Table 7 con�icts with the
theoretical predictions put forward in section 2, is no longer signi�cant in the one-step approach results of
Table 8.
Interestingly, the absolute value of the coef�cients of the signi�cant variables varies in magnitude (be-
tween 0:14 and 0:48). As we normalized the variables, there seems to be an important effect in economic
terms, and the importance varies with the variable under consideration. The coef�cient on the Lerner index
without interaction is 1:55. A one standard deviation increase in one of these variables hence leads to a 10%
to 30% change in the impact of competition on stability, a similarly large effect as found in Table 7. The
dependent variable is the Z-score in which the denominator, volatility of pro�ts, is measured over a three
year interval. The results are robust to using a Z-score in which the denominator is measured using �ve
year rolling windows. Another unreported regression con�rms the stability of the �ndings in the sample
period 1994-2006, which does not include the unusual events of the Great Recession. Finally, the number
of countries and observations vary in each speci�cation due to the availability and coverage of different
country-speci�c characteristics. When repeating the regressions reported in columns 1-9 using a common
sample (the sample used in column 10), we obtain similar results.
5.3 Additional results exploiting bank-level variation
So far, we have exploited cross-country and time-series variation in the competition-stability relationship.
However, banks' risk-taking incentives might be also in�uenced by their own relative position in the market.
Speci�cally, we posit that failing banks have a greater incentive to exploit competition towards more aggres-
sive risk-taking. Further, banks with a larger market share that therefore consider themselves too-big-to-fail
might also exploit increasing competition to take more aggressive risks. This subsection assesses whether
such bank-level variation exists.
34

<Insert Table 9 around here>
Table 9 shows the impact of competition on bank stability while controlling for the potential impact of
failing banks. The �rst column shows our baseline competition-stability regression. In the second and the
third column, we interact the Lerner index with an exit dummy. In the second regression, the exit dummy
equals one in the two years before the bank leaves the sample. These banks seem to react less intense
when competition changes. However, notice that this dummy does not discriminate between defaults and
distressed mergers, on the one hand, and 'normal' mergers or acquisitions, on the other hand. Therefore,
in the third regression, the exit dummy only equals one in the two years before a bank leaves the sample
when the bank had a negative return on assets in that period. In this way, we only capture the banks
that actually where in distress before they leave the sample. The signi�cant and positive interaction term
between competition and the exit dummy indicates that these banks that are in trouble before leaving the
sample react more strongly to a change in competition. Thus, banks that are in distress gamble even more
than others when competition rises, probably because there is not much left to loose for them. In the fourth
regression, we only look at banks that did not exit the sample (Distressed Exit Dummy=0), while adding
interaction terms between the Lerner index and country-speci�c characteristics that potentially in�uence the
competition-stability relationship. The results show that market power still has a positive impact on bank
stability for these banks. Furthermore, as shown in our previous analysis, banks operating in a country
with overall more effective systems of credit information sharing, generous deposit insurance, multiple
supervisors, high activity restrictions and higher systemic stability react stronger to a change in competition.
This shows that our main results are not driven by distress situations.
<Insert Table 10 around here>
Table 10 shows the results for the baseline competition-stability regression while controlling for the
impact of bank market share. The �rst column retakes our baseline results, while we include a squared term
35
of the Lerner index in the second column. Including the squared term does not affect the main results on
the interaction variables as can be inferred from comparing column 1 and 2. The only variable that turns
insigni�cant after including the squared Lerner variable is Multiple Supervisors (for which we did not �nd
signi�cance in Table 7 and con�icting results in Table 8). We still obtain that banks operating in a country
with overall more effective systems of credit information sharing, generous deposit insurance, high activity
restrictions and higher systemic stability react stronger to a change in competition. We estimate a signi�cant
and negative coef�cient on the squared term, suggesting a non-linear, inverse U-shaped relationship between
market power and bank soundness, which is in line with Martinez-Miera and Repullo (2010)'s theoretical
predictions. However, the relationship does not turn negative until a value of 0.285 for the Lerner index
is reached, which is more than one standard deviation above its mean and does not turn signi�cant and
negative below 0.33 (which corresponds to only 5% of all bank-year observations). In the subsequent tests,
we always include the squared Lerner term to avoid that the measure of market share and TBTF would
spuriously pick up this effect. In the third column, we add the interaction of the Lerner index with a bank's
market share (measured in terms of total assets). This allows us to check whether banks with a higher market
share have an incentive to take more risk in more competitive environments, because they can potentially see
themselves as too-big-to-fail. Since we also include bank size, our interaction term only captures the extent
to which TBTF may affect bank incentives in response to changes in market power. The results indicate
that there is no direct too-big-to-fail effect in�uencing the competition-stability relationship. In the fourth
column, we do a similar exercise, but now using a market share dummy that equals one for banks with
a market share that is larger than 10 percent. Again, we do not �nd a signi�cant direct effect of a banks'
market share on the competition-stability relationship. Finally, in columns 5 and 6, we use the interaction
of the Lerner index with dummies indicating banks whose assets are above 10% or 25% of GDP of its
home country. The interaction enters signi�cantly in neither case. Overall, we cannot �nd evidence that
competition exacerbates the too-big-to-fail phenomenon.
36

6 Conclusion
This paper documents signi�cant cross-country heterogeneity in the competition-stability relationship. While,
on average, it seems that the franchise value paradigm dominates the risk-shifting hypothesis, this full sam-
ple relationship hides a substantial amount of cross-sectional heterogeneity, with estimates ranging from
signi�cantly negative, over insigni�cant to mostly strong positive relationships between competition and
stability.
We develop a framework to assess how regulation, supervision and other institutional factors may make
it more likely that the data favor one theory over the other, i.e. the charter value paradigm over the risk-
shifting paradigm. We show that an increase in competition will have a larger impact on banks' risk taking
incentives in countries with stricter activity restrictions, more homogenous market structures, more gener-
ous deposit insurance and more effective systems of credit information sharing. Our �ndings help in un-
derstanding the seemingly con�icting empirical evidence. Most studies tend to �nd results in favour of
the competition-fragility view. However, if one would sample banks from countries/regions with less strict
activity restrictions and capital regulations, less homogenous market structures, no deposit insurance and
credit registries, obtaining insigni�cant or the opposite result need not be inconsistent. Understanding the
market, regulatory and institutional framework in which banks operate is thus critical in gauging the effect
of competition on stability.
Our �ndings have important policy repercussions. They suggest that activity restrictions and herding
trends can exacerbate the negative impact of competition on bank stability so that regulatory reforms have
to take this into account. We show that the too-many-to-fail phenomenon is worse in more competitive
environments. They also stress the importance of the moral hazard risk of generous deposit insurance, exac-
erbated in more competitive environments. In the midst of the 2007-2009 crisis, many countries increased
the generosity of the deposit insurance schemes. At the same time, there were calls for restrictions on banks'
activities (as was the case after the Great Depression when the U.S. imposed the Glass-Steagall Act). Mim-
37

icking this post-crisis scenario in a �ctitious ceteris paribus analysis reveals that the relationship between
market power and soundness is almost twice as strong compared to the benchmark case, suggesting a very
negative impact of competition on stability in this scenario. In the base scenario, a one standard deviation
reduction in market power leads to a drop in the Z-score of 20%. In our �ctitious post-crisis scenario, a
similar loss in market power leads to a 38% reduction in the average Z-score (which is the buffer of capital
against losses expressed in terms of pro�t volatility).
Our results also show that more stringent capital regulation can have an exacerbating in�uence on the
relationship between competition and stability, which puts the current debate on capital buffers somewhat
in perspective. Finally, they show the trade-off in reducing information asymmetries by introducing or
upgrading credit registries; while helping to deepen and broaden �nancial systems, they can also exacerbate
the impact of competition on stability. Most importantly, our �ndings underline the importance of regulatory
policies and market structure for stability. In addition to a direct effect of these policies on risk-taking
incentives of banks, they also have an indirect effect by dampening or exacerbating the effect of competition
on banks' riskiness.
References
Acharya, V. V., and T. Yorulmazer, 2007, �Too many to fail�An analysis of time-inconsistency in bank
closure policies,� Journal of Financial Intermediation, 16(1), 1�31.
Allen, F., E. Carletti, and R. Marquez, 2011, �Credit Market Competition and Capital Regulation,� Review
of Financial Studies, 24(4), 983�1018.
Allen, F., and D. Gale, 2000, �Comparing �nancial systems,� Cambridge, MA: MIT Press.
, 2004, �Competition and �nancial stability,� Journal of Money Credit and Banking, 36(3), 453�480.
38

Bank for International Settlements, ., 2001, �The banking industry in the emerging market economies:
Competition, consolidation and systemic stability,� BIS Paper 4.
Barth, J., G. Caprio, and R. Levine, 2006, �Rethinking bank regulation: Till angels govern.,� (Cambridge
University Press).
Barth, J., G. Caprio, and R. Levine, 2008, �Bank Regulation and Supervision Database (updated June
2008),� World Bank.
Beck, T., 2008, �Bank competition and �nancial stability: friends or foes ?,� in: Bank Indonesia and Banco
de Mexico (Eds.): Competition in the Financial Sector.
Beck, T., A. Demirguc-Kunt, and R. Levine, 2006, �Bank concentration, competition, and crises: First
results,� Journal of Banking and Finance, 30(5), 1581�1603.
Berger, A. N., L. F. Klapper, and R. Turk Ariss, 2009, �Bank Competition and Financial Stability,� Journal
of Financial Services Research, 35(2), 99�118.
Boot, A. W. A., and A. V. Thakor, 1993, �Self-Interested Bank Regulation,� The American Economic Re-
view, 83(2), 206�212.
Boyd, J. H., and G. De Nicolo, 2005, �The Theory of Bank Risk Taking and Competition Revisited,� Journal
of Finance, 60(3), 1329�1343.
Boyd, J. H., G. De Nicolo, and A. M. Jalal, 2006, �Bank Risk-Taking and Competition Revisited: New
Theory and New Evidence,� IMF Working Paper No. 06/297.
Boyd, J. H., and D. E. Runkle, 1993, �Size and Performance of Banking Firms - Testing the Predictions of
Theory,� Journal of Monetary Economics, 31(1), 47�67.
39
Brown, C. O., and S. I. Dinc, 2011, �Too Many to Fail? Evidence of Regulatory Forbearance When the
Banking Sector Is Weak,� Review of Financial Studies, 24(4), 1378�1405.
Carletti, E., 2008, �Competition and Regulation in Banking,� in Handbook of Financial Intermediation and
Banking, ed. by A. W. A. Boot, and A. V. Thakor. Elsevier, San Diego, pp. 449�482.
Carletti, E., and X. Vives, 2009, �Regulation and Competition Policy in the Banking Sector,� in Competition
Policy in the EU, 260�284.
Degryse, H., and S. Ongena, 2008, �Competition and Regulation in the Banking Sector: A Review of
the Empirical Evidence on the Sources of Bank Rents,� in Handbook of Financial Intermediation and
Banking, ed. by A. W. A. Boot, and A. V. Thakor. Elsevier, San Diego, pp. 483�554.
Dell'Ariccia, G., and R. Marquez, 2004, �Information and bank credit allocation,� Journal of Financial
Economics, 72(1), 185�214.
Demirguc-Kunt, A., and E. Detragiache, 2002, �Does deposit insurance increase banking system stability?
An empirical investigation,� Journal of Monetary Economics, 49(7), 1373�1406.
Demirguc-Kunt, A., and H. Huizinga, 2004, �Market discipline and deposit insurance,� Journal of Monetary
Economics, 51(2), 375�399.
, 2010, �Bank activity and funding strategies: The impact on risk and returns,� Journal of Financial
Economics, 98(3), 626�650.
Demirguc-Kunt, A., and E. Kane, 2002, �Deposit Insurance around the Globe: Where Does It Work?,�
Journal of Economic Perspectives, 16(2), 175�195.
Demirguc-Kunt, A., B. Karacaovali, and L. Laeven, 2005, �Deposit Insurance around the World: A Com-
prehensive Database,� Policy Research Paper , World Bank.
40
Gan, J., 2004, �Banking market structure and �nancial stability: Evidence from the Texas real estate crisis
in the 1980s,� Journal of Financial Economics, 73(3), 567�601.
Group of Ten, ., 2001, �Report on consolidation in the �nancial sector,� .
Hakenes, H., and I. Schnabel, 2011, �Capital Regulation, Bank Competition, and Financial Stability,� Eco-
nomics Letters, , forthcoming.
Hauswald, R., and R. Marquez, 2006, �Competition and strategic information acquisition in credit markets,�
Review of Financial Studies, 19(3), 967�1000.
Hellmann, T. F., K. C. Murdock, and J. E. Stiglitz, 2000, �Liberalization, moral hazard in banking, and
prudential regulation: Are capital requirements enough?,� American Economic Review, 90(1), 147�165.
Houston, J. F., C. Lin, P. Lin, and Y. Ma, 2010, �Creditor rights, information sharing, and bank risk taking,�
Journal of Financial Economics, 96(3), 485�512.
Indonesia, B., and . Banco de Mexico, 2008, �Competition in the �nancial sector,� .
International Monetary Fund, ., 2001, �Financial sector consolidation in emerging markets, Chapter V,�
International Capital Market report, Washington DC.
Jayaratne, J., and P. Strahan, 1998, �Entry Restrictions, Industry Evolution, and Dynamic Ef�ciency: Evi-
dence from Commercial Banking,� Journal of Law and Economics, 41(1), 239�273.
Jimenez, G., J. A. Lopez, and J. Saurina Salas, 2010, �How Does Competition Impact Bank Risk-Taking?,�
Banco de Espana Working Paper No. 1005.
Kallberg, J. G., and G. F. Udell, 2003, �The value of private sector business credit information sharing: The
U.S. case,� Journal of Banking and Finance, 27(3), 449�469.
41
Keeley, M. C., 1990, �Deposit Insurance, Risk, and Market Power in Banking,� American Economic Review,
80(5), 1183�1200.
Laeven, L., and R. Levine, 2009, �Bank governance, regulation and risk taking,� Journal of Financial
Economics, 93(2), 259�275.
Llewellyn, D. T., 1999, �Introduction: The Institutional Structure of Regulatory Agencies,� in N.Courtis
(ed.), How countries supervise their banks, insurers and securities markets.
Marcus, A. J., 1984, �Deregulation and bank �nancial policy,� Journal of Banking and Finance, 8(4), 557�
565.
Martinez-Miera, D., and R. Repullo, 2010, �Does Competition Reduce the Risk of Bank Failure?,� Review
of Financial Studies, 23(10), 3638�3664.
Matutes, C., and X. Vives, 1996, �Competition for Deposits, Fragility, and Insurance,� Journal of Financial
Intermediation, 5(2), 184�216.
, 2000, �Imperfect competition, risk taking, and regulation in banking,� European Economic Review,
44(1), 1�34.
Miller, M. J., 2003, �Credit Reporting Systems and the International Economy,� The MIT Press.
Padilla, A. J., andM. Pagano, 2000, �Sharing default information as a borrower discipline device,� European
Economic Review, 44(10), 1951�1980.
Pagano, M., and T. Jappelli, 1993, �Information Sharing in Credit Markets,� The Journal of Finance, 48(5),
1693�1718.
Powell, A., N. Mylenko, M. Miller, and G. Majnoni, 2004, �Improving credit information, bank regulation,
42
and supervision : on the role and design of public credit registries,� Policy Research Working Paper Series
3443.
Repullo, R., 2004, �Capital requirements, market power, and risk-taking in banking,� Journal of Financial
Intermediation, 13(2), 156�182.
Roy, A. D., 1952, �Safety First and the Holding of Assets,� Econometrica, 20(3), 431�449.
Salas, V., and J. Saurina, 2003, �Deregulation, market power and risk behaviour in Spanish banks,� European
Economic Review, 47(6), 1061�1075.
Schaeck, K., and M. Cihak, 2010, �Competition, Ef�ciency, and Soundness in Banking: An In-
dustrial Organization Perspective,� European Banking Center Discussion Paper No. 2010-20S,
http://ssrn.com/paper=1635245.
, 2011, �Banking competition and capital ratios,� European Financial Management, , Forthcoming.
Schaeck, K., M. Cihak, and S. Wolfe, 2009, �Are Competitive Banking Systems More Stable?,� Journal of
Money, Credit and Banking, 41(4), 711�734.
Turk Ariss, R., 2010, �On the implications of market power in banking: Evidence from developing coun-
tries,� Journal of Banking and Finance, 34(4), 765�775.
Vercammen, J. A., 1995, �Credit Bureau Policy and Sustainable Reputation Effects in Credit Markets,�
Economica, 62(248), 461�478.
Vives, X., 2001, �Competition in the Changing World of Banking,� Oxford Review of Economic Policy,
17(4), 535�547.
Wagner, W., 2010, �Loan Market Competition and Bank Risk-Taking,� Journal of Financial Services Re-
search, 37(1), 71�81.
43

Figure 1: Evolution over Time of Market Power, Bank Stability and Pro�t Volatility
This graph contains information on the relationship between bank market power and bank soundness. The upper �gureshows the evolution over time of our two main variables of interest: market power and bank soundness. Market poweris measured through the Lerner index, which is the relative markup of price over marginal cost. Bank soundness iscaptured by the natural logarithm of the Z-score. The Z-score equals the sum of equity over total assets and return onassets divided by the three year rolling standard deviation of return on assets. Both indicators are initially calculated atthe bank-year level and then averaged by country on a yearly basis between 1994 and 2009. The plotted lines correspondwith the yearly averages of these cross-country averages. The evolution of the Z-score is shown on the left axis, whereasthe evolution of the Lerner index is shown on the right axis. The lower �gure depicts the evolution, between 1994 an2009, of the Lerner index and the volatility of return on assets, which is the denominator of the Z-score. The volatilityof bank pro�ts (ROA) is again calculated on a three year rolling window basis. Again, we �rst compute this measureby bank-year observation, before averaging �rst at the country-year level and subsequently by time period.
.08
.1.1
2.1
4.1
6Le
rner
3.2
3.3
3.4
3.5
3.6
ln(Z
sco
re)
1995 2000 2005 2010Year
ln(Zscore) Market Power
Time series evolution of Average Risk and Average Market Power
.08
.1.1
2.1
4.1
6Le
rner
.6.7
.8.9
1V
olat
ility
of R
OA
1995 2000 2005 2010Year
ROA volatility Market Power
Time series evolution of ROA volatility and Average Market Power
44

Figure 2: Evolution over Time of the Conditional Correlation between Bank Market Power and Stability
This graph shows the evolution of the conditional correlation between a bank market power measure and a bank stabilitymeasure between 1994 and 2009. Bank market power is proxied by the Lerner index, which is the relative markup ofprice over marginal cost. Bank soundness is captured by the logarithm of the Z-score, which equals the number ofstandard deviations bank pro�ts have to fall before the equity cushion is depleted. The height of the bars shows themagnitude of the coef�cient of the Lerner index when running year-by-year regressions of the Z-score on the Lernerindex, and a group of bank-speci�c control variables. We also include country �xed effects to control for unobservedeffects at the country level. Standard errors are robust and clustered at the country level. All depicted correlations aresigni�cant at the 5 percent level.
01
23
Reg
ress
ion
coef
ficie
nt L
erne
r
1993 1994 1995 1996 1997 1998 1999 2000 2001 2002 2003 2004 2005 2006 2007 2008
Evolution over timeConditional correlation of Bank Market Power and Stability
45
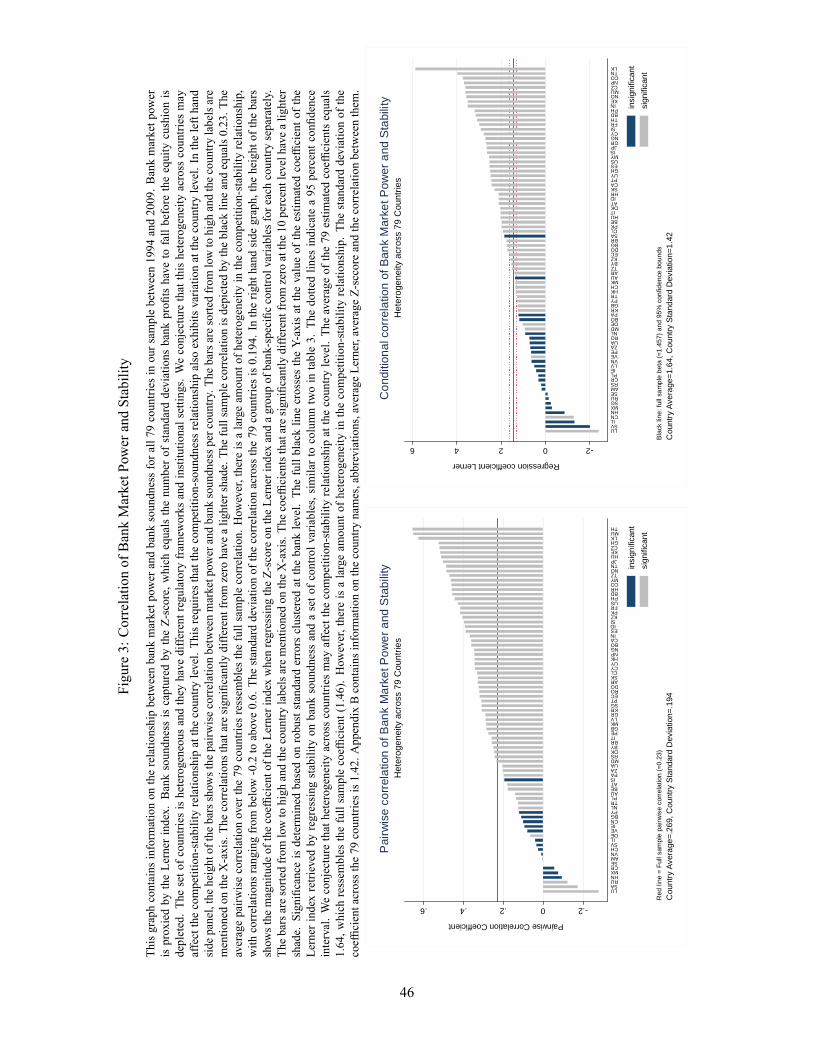
Figure3:CorrelationofBankMarketPowerandStability
Thisgraphcontainsinformationontherelationshipbetweenbankmarketpowerandbanksoundnessforall79countriesinoursamplebetween1994and2009.Bankmarketpower
isproxiedbytheLernerindex.BanksoundnessiscapturedbytheZ-score,whichequalsthenumberofstandarddeviationsbankpro�tshavetofallbeforetheequitycushionis
depleted.Thesetofcountriesisheterogeneousandtheyhavedifferentregulatoryframeworksandinstitutionalsettings.Weconjecturethatthisheterogeneityacrosscountriesmay
affectthecompetition-stabilityrelationshipatthecountrylevel.Thisrequiresthatthecompetition-soundnessrelationshipalsoexhibitsvariationatthecountrylevel.Inthelefthand
sidepanel,theheightofthebarsshowsthepairwisecorrelationbetweenmarketpowerandbanksoundnesspercountry.Thebarsaresortedfromlowtohighandthecountrylabelsare
mentionedontheX-axis.Thecorrelationsthataresigni�cantlydifferentfromzerohavealightershade.Thefullsamplecorrelationisdepictedbytheblacklineandequals0.23.The
averagepairwisecorrelationoverthe79countriesressemblesthefullsamplecorrelation.However,thereisalargeamountofheterogeneityinthecompetition-stabilityrelationship,
withcorrelationsrangingfrombelow-0.2toabove0.6.Thestandarddeviationofthecorrelationacrossthe79countriesis0.194.Intherighthandsidegraph,theheightofthebars
showsthemagnitudeofthecoef�cientoftheLernerindexwhenregressingtheZ-scoreontheLernerindexandagroupofbank-speci�ccontrolvariablesforeachcountryseparately.
ThebarsaresortedfromlowtohighandthecountrylabelsarementionedontheX-axis.Thecoef�cientsthataresigni�cantlydifferentfromzeroatthe10percentlevelhavealighter
shade.Signi�canceisdeterminedbasedonrobuststandarderrorsclusteredatthebanklevel.ThefullblacklinecrossestheY-axisatthevalueoftheestimatedcoef�cientofthe
Lernerindexretrievedbyregressingstabilityonbanksoundnessandasetofcontrolvariables,similartocolumntwointable3.Thedottedlinesindicatea95percentcon�dence
interval.Weconjecturethatheterogeneityacrosscountriesmayaffectthecompetition-stabilityrelationshipatthecountrylevel.Theaverageofthe79estimatedcoef�cientsequals
1.64,whichressemblesthefullsamplecoef�cient(1.46).However,thereisalargeamountofheterogeneityinthecompetition-stabilityrelationship.Thestandarddeviationofthe
coef�cientacrossthe79countriesis1.42.AppendixBcontainsinformationonthecountrynames,abbreviations,averageLerner,averageZ-sccoreandthecorrelationbetweenthem.
.20.2.4.6
Pairwise Correlation Coefficient
LUSARUHNMXCRSEAMVNCHSVIL
DEVEIE
CNBGPYNLTRPLAUBEATIS
PAZAUAMDRSDKBYBRIT
PEGBMKLVGRKRSGPTECRODOARSKCLCYUYHKNPNGBOCAIN
ESIDSI
KZPKFRUSPHBDHRCOMYTZNOTNJPHUKECZGHLK
MUTH
Red
line
= F
ull s
ampl
e pa
irwis
e co
rrel
atio
n (=
0.23
)C
ount
ry A
vera
ge=.
269,
Cou
ntry
Sta
ndar
d D
evia
tion=
.194
Het
erog
enei
ty a
cros
s 79
Cou
ntrie
sP
airw
ise
corre
latio
n of
Ban
k M
arke
t Pow
er a
nd S
tabi
lity in
sign
ifica
ntsi
gnifi
cant
20246
Regression coefficient Lerner
LUSVIL
CNHNMXSGRUSEAMRSCRPLIE
LVVNVEPEZAUARONLMDDEBOPAKRGBPYTRHKCHMKAUARTZBYKZECDOBGBRSACLPKBEHU
ITDKATID
HRSKCAPTUYGHESUSMY
ISJP
GRNGCYSI
FRTHBDPHIN
KENOMUCZNPCOTNLK
Bla
ck li
ne: f
ull s
ampl
e be
ta (=
1.45
7) a
nd 9
5% c
onfid
ence
bou
nds
Cou
ntry
Ave
rage
=1.6
4, C
ount
ry S
tand
ard
Dev
iatio
n=1.
42
Het
erog
enei
ty a
cros
s 79
Cou
ntrie
sC
ondi
tiona
l cor
rela
tion
of B
ank
Mar
ket P
ower
and
Sta
bilit
y
insi
gnifi
cant
sign
ifica
nt
46
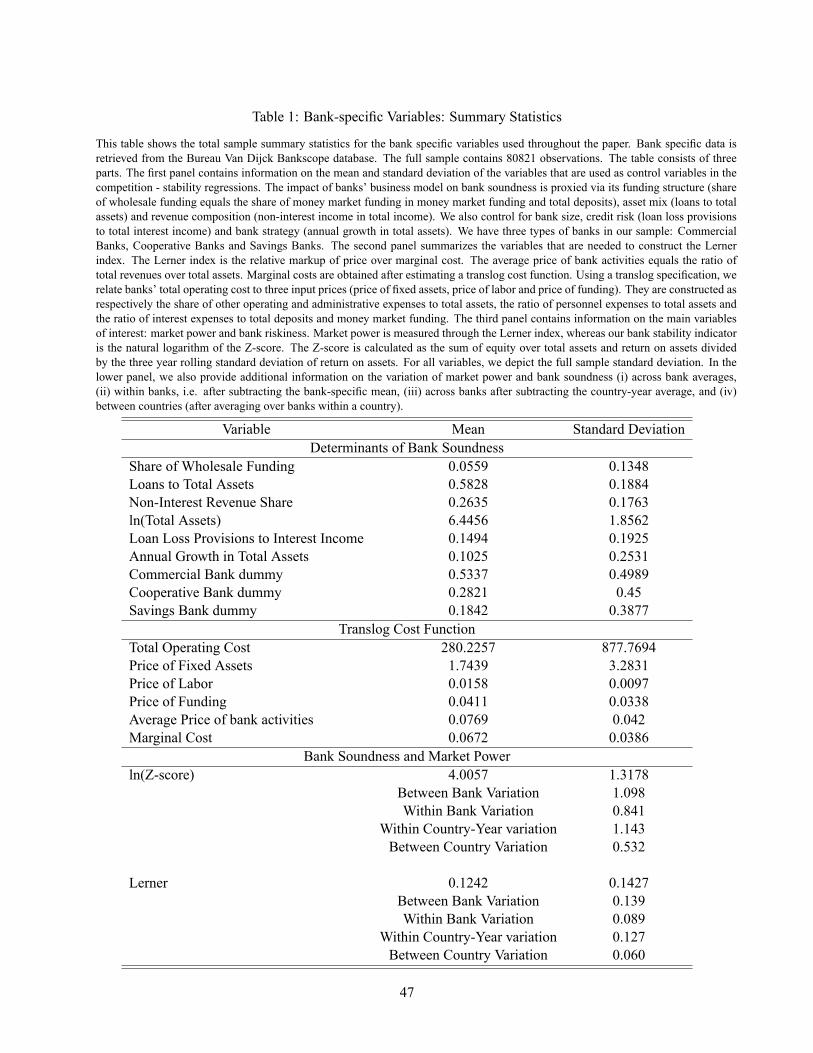
Table 1: Bank-speci�c Variables: Summary Statistics
This table shows the total sample summary statistics for the bank speci�c variables used throughout the paper. Bank speci�c data isretrieved from the Bureau Van Dijck Bankscope database. The full sample contains 80821 observations. The table consists of threeparts. The �rst panel contains information on the mean and standard deviation of the variables that are used as control variables in thecompetition - stability regressions. The impact of banks' business model on bank soundness is proxied via its funding structure (shareof wholesale funding equals the share of money market funding in money market funding and total deposits), asset mix (loans to totalassets) and revenue composition (non-interest income in total income). We also control for bank size, credit risk (loan loss provisionsto total interest income) and bank strategy (annual growth in total assets). We have three types of banks in our sample: CommercialBanks, Cooperative Banks and Savings Banks. The second panel summarizes the variables that are needed to construct the Lernerindex. The Lerner index is the relative markup of price over marginal cost. The average price of bank activities equals the ratio oftotal revenues over total assets. Marginal costs are obtained after estimating a translog cost function. Using a translog speci�cation, werelate banks' total operating cost to three input prices (price of �xed assets, price of labor and price of funding). They are constructed asrespectively the share of other operating and administrative expenses to total assets, the ratio of personnel expenses to total assets andthe ratio of interest expenses to total deposits and money market funding. The third panel contains information on the main variablesof interest: market power and bank riskiness. Market power is measured through the Lerner index, whereas our bank stability indicatoris the natural logarithm of the Z-score. The Z-score is calculated as the sum of equity over total assets and return on assets dividedby the three year rolling standard deviation of return on assets. For all variables, we depict the full sample standard deviation. In thelower panel, we also provide additional information on the variation of market power and bank soundness (i) across bank averages,(ii) within banks, i.e. after subtracting the bank-speci�c mean, (iii) across banks after subtracting the country-year average, and (iv)between countries (after averaging over banks within a country).
Variable Mean Standard DeviationDeterminants of Bank Soundness
Share of Wholesale Funding 0.0559 0.1348Loans to Total Assets 0.5828 0.1884Non-Interest Revenue Share 0.2635 0.1763ln(Total Assets) 6.4456 1.8562Loan Loss Provisions to Interest Income 0.1494 0.1925Annual Growth in Total Assets 0.1025 0.2531Commercial Bank dummy 0.5337 0.4989Cooperative Bank dummy 0.2821 0.45Savings Bank dummy 0.1842 0.3877
Translog Cost FunctionTotal Operating Cost 280.2257 877.7694Price of Fixed Assets 1.7439 3.2831Price of Labor 0.0158 0.0097Price of Funding 0.0411 0.0338Average Price of bank activities 0.0769 0.042Marginal Cost 0.0672 0.0386
Bank Soundness and Market Powerln(Z-score) 4.0057 1.3178
Between Bank Variation 1.098Within Bank Variation 0.841
Within Country-Year variation 1.143Between Country Variation 0.532
Lerner 0.1242 0.1427Between Bank Variation 0.139Within Bank Variation 0.089
Within Country-Year variation 0.127Between Country Variation 0.060
47
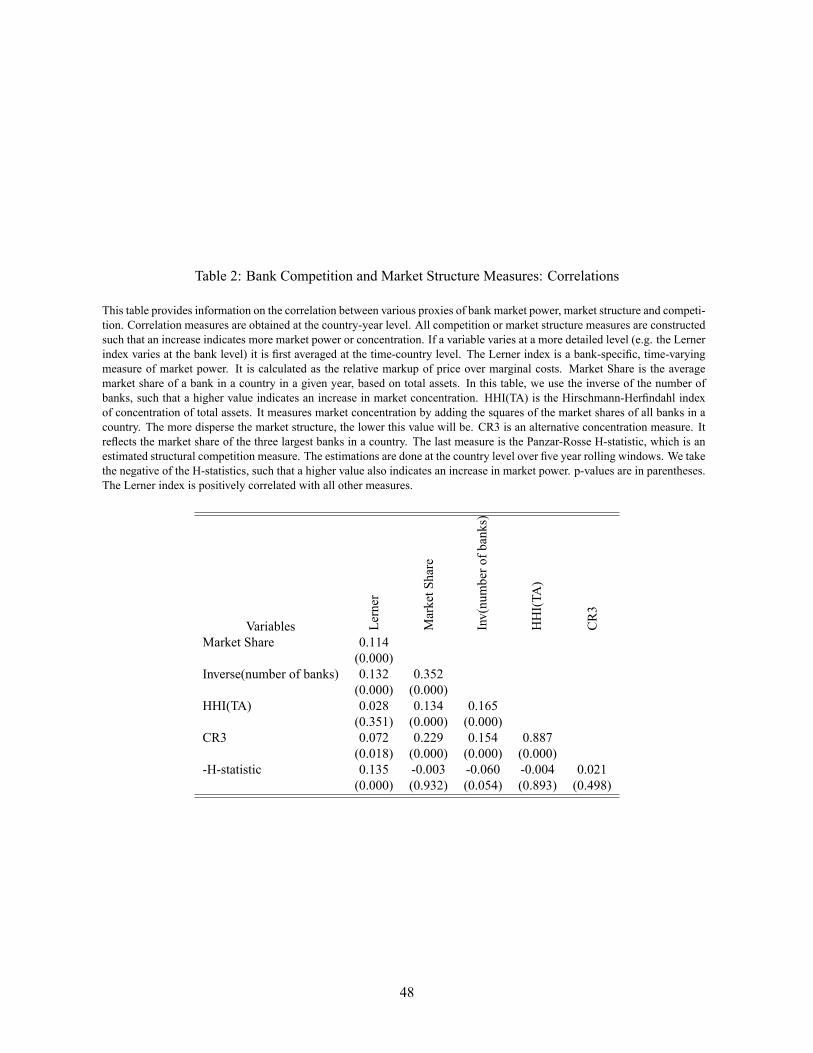
Table 2: Bank Competition and Market Structure Measures: Correlations
This table provides information on the correlation between various proxies of bank market power, market structure and competi-tion. Correlation measures are obtained at the country-year level. All competition or market structure measures are constructedsuch that an increase indicates more market power or concentration. If a variable varies at a more detailed level (e.g. the Lernerindex varies at the bank level) it is �rst averaged at the time-country level. The Lerner index is a bank-speci�c, time-varyingmeasure of market power. It is calculated as the relative markup of price over marginal costs. Market Share is the averagemarket share of a bank in a country in a given year, based on total assets. In this table, we use the inverse of the number ofbanks, such that a higher value indicates an increase in market concentration. HHI(TA) is the Hirschmann-Her�ndahl indexof concentration of total assets. It measures market concentration by adding the squares of the market shares of all banks in acountry. The more disperse the market structure, the lower this value will be. CR3 is an alternative concentration measure. Itre�ects the market share of the three largest banks in a country. The last measure is the Panzar-Rosse H-statistic, which is anestimated structural competition measure. The estimations are done at the country level over �ve year rolling windows. We takethe negative of the H-statistics, such that a higher value also indicates an increase in market power. p-values are in parentheses.The Lerner index is positively correlated with all other measures.
Variables Lerner
MarketShare
Inv(numberofbanks)
HHI(TA)
CR3
Market Share 0.114(0.000)
Inverse(number of banks) 0.132 0.352(0.000) (0.000)
HHI(TA) 0.028 0.134 0.165(0.351) (0.000) (0.000)
CR3 0.072 0.229 0.154 0.887(0.018) (0.000) (0.000) (0.000)
-H-statistic 0.135 -0.003 -0.060 -0.004 0.021(0.000) (0.932) (0.054) (0.893) (0.498)
48
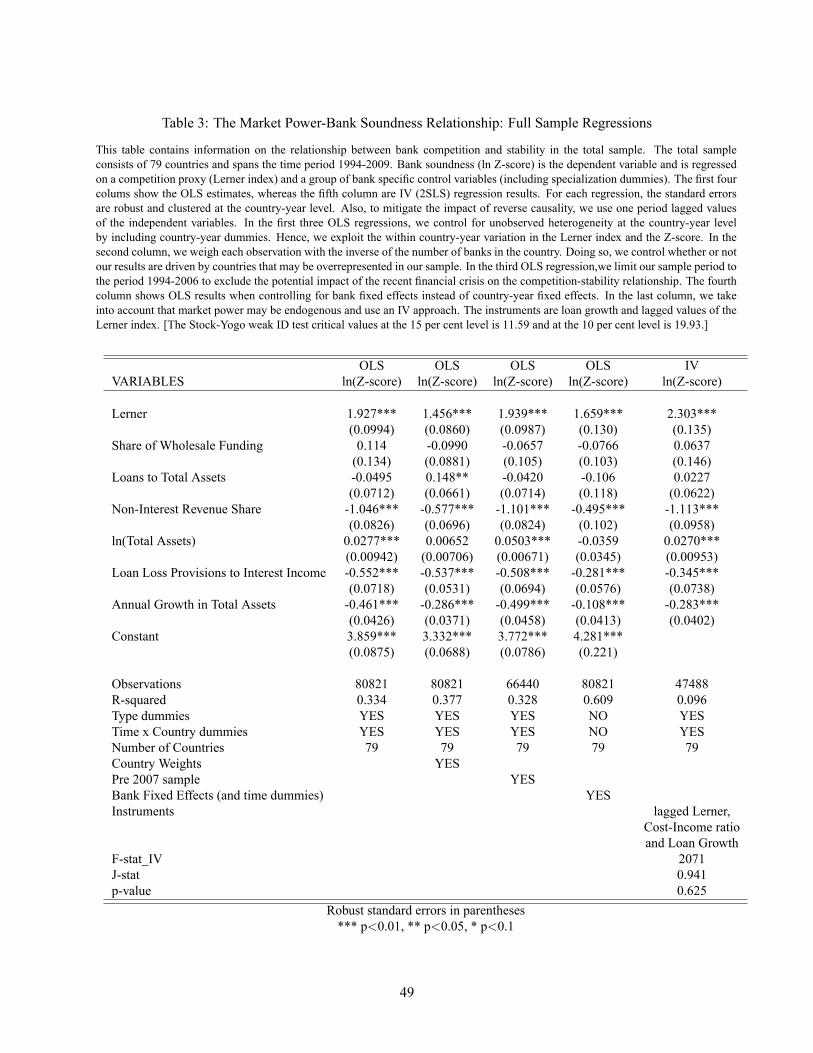
Table 3: The Market Power-Bank Soundness Relationship: Full Sample Regressions
This table contains information on the relationship between bank competition and stability in the total sample. The total sampleconsists of 79 countries and spans the time period 1994-2009. Bank soundness (ln Z-score) is the dependent variable and is regressedon a competition proxy (Lerner index) and a group of bank speci�c control variables (including specialization dummies). The �rst fourcolums show the OLS estimates, whereas the �fth column are IV (2SLS) regression results. For each regression, the standard errorsare robust and clustered at the country-year level. Also, to mitigate the impact of reverse causality, we use one period lagged valuesof the independent variables. In the �rst three OLS regressions, we control for unobserved heterogeneity at the country-year levelby including country-year dummies. Hence, we exploit the within country-year variation in the Lerner index and the Z-score. In thesecond column, we weigh each observation with the inverse of the number of banks in the country. Doing so, we control whether or notour results are driven by countries that may be overrepresented in our sample. In the third OLS regression,we limit our sample period tothe period 1994-2006 to exclude the potential impact of the recent �nancial crisis on the competition-stability relationship. The fourthcolumn shows OLS results when controlling for bank �xed effects instead of country-year �xed effects. In the last column, we takeinto account that market power may be endogenous and use an IV approach. The instruments are loan growth and lagged values of theLerner index. [The Stock-Yogo weak ID test critical values at the 15 per cent level is 11.59 and at the 10 per cent level is 19.93.]
OLS OLS OLS OLS IVVARIABLES ln(Z-score) ln(Z-score) ln(Z-score) ln(Z-score) ln(Z-score)
Lerner 1.927*** 1.456*** 1.939*** 1.659*** 2.303***(0.0994) (0.0860) (0.0987) (0.130) (0.135)
Share of Wholesale Funding 0.114 -0.0990 -0.0657 -0.0766 0.0637(0.134) (0.0881) (0.105) (0.103) (0.146)
Loans to Total Assets -0.0495 0.148** -0.0420 -0.106 0.0227(0.0712) (0.0661) (0.0714) (0.118) (0.0622)
Non-Interest Revenue Share -1.046*** -0.577*** -1.101*** -0.495*** -1.113***(0.0826) (0.0696) (0.0824) (0.102) (0.0958)
ln(Total Assets) 0.0277*** 0.00652 0.0503*** -0.0359 0.0270***(0.00942) (0.00706) (0.00671) (0.0345) (0.00953)
Loan Loss Provisions to Interest Income -0.552*** -0.537*** -0.508*** -0.281*** -0.345***(0.0718) (0.0531) (0.0694) (0.0576) (0.0738)
Annual Growth in Total Assets -0.461*** -0.286*** -0.499*** -0.108*** -0.283***(0.0426) (0.0371) (0.0458) (0.0413) (0.0402)
Constant 3.859*** 3.332*** 3.772*** 4.281***(0.0875) (0.0688) (0.0786) (0.221)
Observations 80821 80821 66440 80821 47488R-squared 0.334 0.377 0.328 0.609 0.096Type dummies YES YES YES NO YESTime x Country dummies YES YES YES NO YESNumber of Countries 79 79 79 79 79Country Weights YESPre 2007 sample YESBank Fixed Effects (and time dummies) YESInstruments lagged Lerner,
Cost-Income ratioand Loan Growth
F-stat_IV 2071J-stat 0.941p-value 0.625
Robust standard errors in parentheses*** p<0.01, ** p<0.05, * p<0.1
49

Table4:AlternativeRiskandCompetitionMeasures
Thistablecontainsatestoftherobustnessoftheresultswithrespecttothebankmarketpowerandstabilitymeasure.Inthebaselinesetup,marketpowerismeasuredastheLerner
indexandbanksoundnessiscapturedbythenaturallogarithmoftheZ-score.TheLernerindexistherelativemarkupofpriceovermarginalcost.TheZ-scoreequalsthesumof
equityovertotalassetsandreturnonassetsdividedbythethreeyearrollingstandarddeviationofreturnonassets.The�rstcolumnshowstheresultsforourbaselineregression,as
alsoshownincolumnoneoftable3.Inregressiontwotosix,weuse�vealternativebanksoundnessmeasures.Incolumntwotofour,wereplacetheZ-scorebyoneofitsconstituents,
beingreturnonassets,equityovertotalassetsandthevolatilityofreturns.Incolumn�ve,theoriginalZ-scorewiththevolatilityofreturnscalculatedbasedonathreeyearrolling
windowisreplacedbyaZ-scorewherethevolatilityofthereturnsiscalculatedusinga�veyearrollingwindow.Thesixthcolumnusesnon-performingloansasanalternative
stabilityindicator.Inregressionsseventonine,welookatalternativemarketpowermeasures.IncolumnsevenwereplacetheLernerindexwithitstwosubcomponents,beingthe
averagepriceofbankactivitiesandmarginalcost.Incolumneightandnine,weuseamarketshareindicatorbasedontotalloansortotalassetsasaproxyforbankmarketpower.All
regressionsincludebankspeci�ccontrolvariablesandcountry-year�xedeffects.Whenusingnon-performingloansasastabilitymeasure,weleaveouttheloanlossprovisionsover
interestincomeratioasacontrolvariable,sincebothvariablesarestronglyrelatedtoeachother.Standarderrorsarerobustandclusteredatthecountry-yearlevel.
VARIABLES
ln(Z-score3)
ROA
Equity/TA
�(ROA)
ln(Z-score5)
NPL
ln(Z-score3)
ln(Z-score3)
ln(Z-score3)
Lerner
1.927***
3.560***
7.447***
-0.788***
1.824***
0.000962
(0.0994)
(0.138)
(0.451)
(0.0578)
(0.105)
(0.00960)
AveragePriceofbankactivities
7.716***
(0.820)
MarginalCost
-12.42***
(1.044)
MarketShare-Loans
0.463**
(0.230)
MarketShare-TotalAssets
0.407*
(0.235)
Constant
3.859***
0.316***
19.07***
0.777***
3.582***
0.630***
4.276***
4.286***
4.285***
(0.0875)
(0.0615)
(0.593)
(0.0524)
(0.0985)
(0.0224)
(0.0911)
(0.0688)
(0.0690)
Observations
80821
80821
80821
80821
59512
80648
80821
80821
80821
R-squared
0.334
0.436
0.437
0.408
0.374
0.630
0.321
0.304
0.304
BankSpeci�cControlVariables
YES
YES
YES
YES
YES
YES
YES
YES
YES
Typedummies
YES
YES
YES
YES
YES
YES
YES
YES
YES
TimexCountrydummies
YES
YES
YES
YES
YES
YES
YES
YES
YES
Robuststandarderrorsinparentheses
***p<0.01,**p<0.05,*p<0.1
50
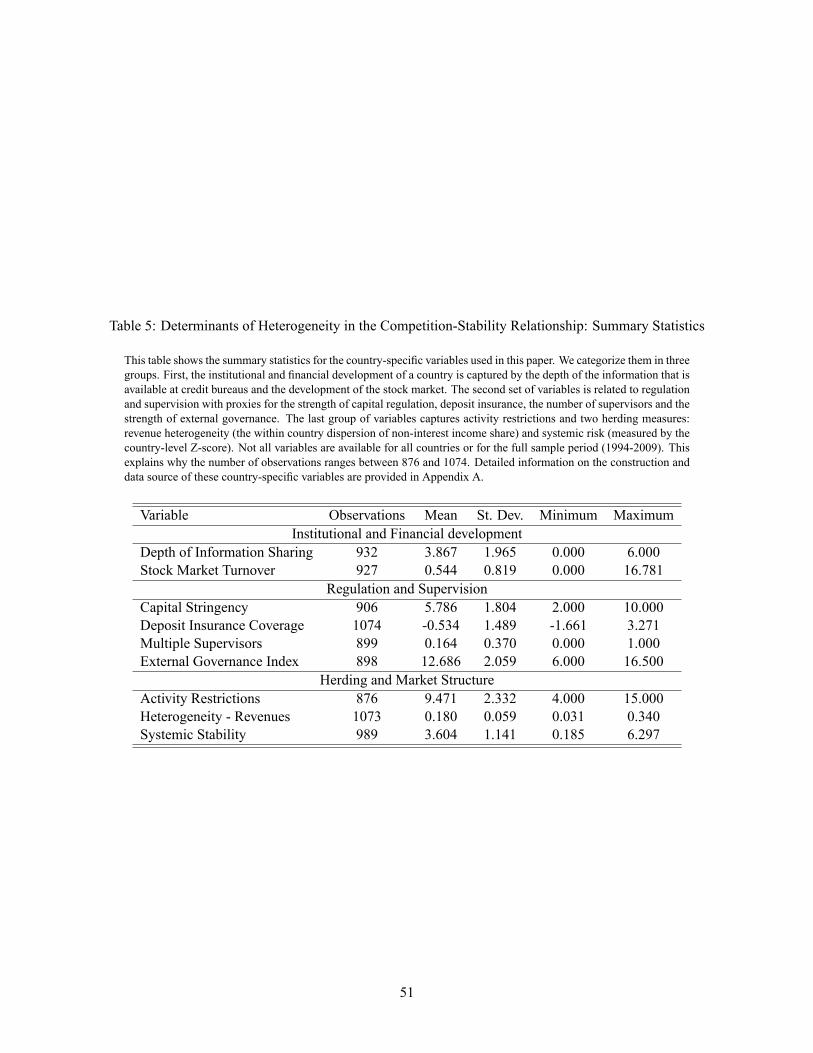
Table 5: Determinants of Heterogeneity in the Competition-Stability Relationship: Summary Statistics
This table shows the summary statistics for the country-speci�c variables used in this paper. We categorize them in threegroups. First, the institutional and �nancial development of a country is captured by the depth of the information that isavailable at credit bureaus and the development of the stock market. The second set of variables is related to regulationand supervision with proxies for the strength of capital regulation, deposit insurance, the number of supervisors and thestrength of external governance. The last group of variables captures activity restrictions and two herding measures:revenue heterogeneity (the within country dispersion of non-interest income share) and systemic risk (measured by thecountry-level Z-score). Not all variables are available for all countries or for the full sample period (1994-2009). Thisexplains why the number of observations ranges between 876 and 1074. Detailed information on the construction anddata source of these country-speci�c variables are provided in Appendix A.
Variable Observations Mean St. Dev. Minimum MaximumInstitutional and Financial development
Depth of Information Sharing 932 3.867 1.965 0.000 6.000Stock Market Turnover 927 0.544 0.819 0.000 16.781
Regulation and SupervisionCapital Stringency 906 5.786 1.804 2.000 10.000Deposit Insurance Coverage 1074 -0.534 1.489 -1.661 3.271Multiple Supervisors 899 0.164 0.370 0.000 1.000External Governance Index 898 12.686 2.059 6.000 16.500
Herding and Market StructureActivity Restrictions 876 9.471 2.332 4.000 15.000Heterogeneity - Revenues 1073 0.180 0.059 0.031 0.340Systemic Stability 989 3.604 1.141 0.185 6.297
51

Table6:DeterminantsofHeterogeneityintheCompetition-StabilityRelationship:CorrelationTable
Thistableprovidesinformationonthecorrelationbetweenthecountry-speci�cvariablesusedthroughoutthepaper.Thevariablesusedforthistable
aremeasuredatthecountry-yearlevel.Thetablecontainspairwisecorrelationcoef�cientsaswellasp-values(inbrackets)thatindicatethesigni�cance
ofthecorrelation.Wealsoindicatethenumberofcountriesthatareusedtocalculateeachcorrelationcoef�cient(initalic).Detailedinformationon
theconstructionofthesevariablescanbefoundinAppendixA.
Variables
DepthofInformationSharing
StockMarketTurnover
CapitalStringency
DepositInsuranceCoverage
MultipleSupervisors
ExternalGovernance
ActivityRestrictions
Heterogeneity-Revenues
StockMarketTurnover
0.240
1.000
(0.048)
68CapitalStringency
-0.150
0.036
1.000
(0.234)(0.767)
6570
DepositInsuranceCoverage
0.267
0.227
-0.043
1.000
(0.024)(0.049)(0.722)
7176
72MultipleSupervisors
0.150
0.358
-0.093
0.178
1.000
(0.234)(0.002)(0.438)(0.135)
6570
7272
ExternalGovernance
0.267
0.072
0.098
-0.096
0.054
1.000
(0.031)(0.552)(0.413)(0.422)(0.652)
6570
7272
72ActivityRestrictions
0.046
-0.109
0.034
0.029
-0.064
0.181
1.000
(0.715)(0.367)(0.775)(0.808)(0.593)(0.129)
6570
7272
7272
Heterogeneity-Revenues
0.270
0.101
0.146
0.121
0.047
0.145
-0.320
1.000
(0.023)(0.383)(0.220)(0.290)(0.694)(0.225)(0.006)
7176
7279
7272
72SystemicStability
0.110
-0.037
0.039
-0.139
-0.186
0.094
-0.205
-0.096
(0.362)(0.749)(0.747)(0.222)(0.117)(0.432)(0.084)(0.401)
7176
7279
7272
7279
52

Table7:DriversofTime-varyingConditionalCorrelationbetweenLernerandZ-score
Thistableexplainsthevariationintheconditional(regression-based),time-varyingcorrelationbetweenbankstabilityandcompetitionbyregressingthesecorrelationcoef�cientsoncountry-
speci�ccharacteristics.Thetime-varyingcorrelationisretrievedbyrunningcountrybycountryregressionsover�veyearrollingwindowsasinEquation(2).Morespeci�cally,foreach
countryweregressourbankstabilitymeasure(Z-score)ontheLernerindexandagroupofbank-speci�ccontrolvariables,whilecontrollingfortime�xedeffectsandusing�veyearrolling
windows.Sinceoursampleperiodis1994-2009,andtakingintoaccountthatwelagourindependentvariableswithoneperiod,wegetamaximum
ofelevencountry-speci�cconditional
correlations.Theretrievedconditionalcorrelationissubsequentlymatchedtocountry-speci�cvariablesmeasuredatthe�rstyearofthe�veyearwindow.Asourdependentvariableisan
estimateddependentvariable,werequireatleast50observationsoverthe�veyearestimationperiodtomitigateanerrorsinvariablesproblem.Inthe�rstninecolumns,weregressthe
conditionalcorrelationcoef�cientseparatelyoneachcountryspeci�ccharacteristic.Thetenthcolumnshowstheresultswhenpoolingallcharacteristicsinasingleregression.Thelasttwo
columnsgiveanindicationoftheeconomicsigni�canceofthevariableswhenpoolingallcountryvariablesintooneregression.Werespectivelylookatthe10thandthe90thpercentile
whenrankingthemaccordingtooneofthecountryspeci�ccharacteristicsandcalculatetheimpactofachangeinmarketpowerforthesetwopercentiles.Thefourcasesmentionedinthe
lowerendofthesecolumnsshowtheimpactofachangeincompetitioncorrespondingwithoneofthefourdifferentscenariosdescribedinthetext.Case1correspondstotheeffectfora
countrythatisaverageineachdimension.Case2ressemblesa�ctitiouspostglobalrecessionscenariowithgenerousdepositinsuranceschemes(twostandarddeviationsincrease)andmore
herding/restrictionsonbankactivities;Incase3(4),weputthecountryvariablesatthemeanofthelowest(highest)5percentofcountries.Allcountry-speci�cvariablesarenormalized(on
thefullsample)tofacilitatecomparingtheeconomicmagnitudesacrossspeci�cations.Allregressionsincludetime�xedeffects.Standarderrorsarerobustandclusteredatthethetimelevel.
Differencesinthenumberofcountriesusedintheregressionsareduetodifferencesinthedataavailabilityforthecountry-speci�cvariables.
Dependentvariable:Time-varyingestimatedrelationshipbetweenmarketpowerandbanksoundness
EconomicSigni�cance
VARIABLES
��
��
��
��
��
p10
p90
DepthofInformationSharing
0.133***
0.176**
1.285
1.823
(0.0242)
(0.0562)
StockMarketTurnover
0.111*
0.0607
1.589
1.706
(0.0569)
(0.0603)
CapitalStringency
0.249***
0.296***
1.306
1.971
(0.0684)
(0.0523)
DepositInsuranceCoverage
0.413***
0.551***
1.070
2.249
(0.0881)
(0.130)
MultipleSupervisors
0.0162
-0.0919
1.684
1.436
(0.0628)
(0.0849)
ExternalGovernanceIndex
-0.105
-0.124
1.792
1.487
(0.0722)
(0.0691)
ActivityRestrictions
0.187***
0.0865
1.529
1.751
(0.0320)
(0.0812)
Heterogeneity-Revenues
-0.222***
-0.150*
1.799
1.494
(0.0462)
(0.0792)
SystemicStability
-0.0583
-0.111
1.529
1.751
(0.0518)
(0.0670)
Constant
1.512***
1.729***
1.531***
1.462***
1.599***
1.484***
1.657***
1.624***
1.635***
2.238***
(0.00429)
(0.0127)
(0.00521)
(0.0337)
(0.00826)
(0.0459)
(0.0174)
(0.000839)
(0.00444)
(0.0844)
Case1
1.642
Case2
2.965
Observations
536
568
505
590
499
502
495
590
574
437
Case3
1.009
R-squared
0.009
0.006
0.022
0.048
0.002
0.004
0.014
0.016
0.005
0.123
Case4
1.824
Yeardummies
YES
YES
YES
YES
YES
YES
YES
YES
YES
YES
NumberofCountries
6670
6673
6666
6673
7255
Robuststandarderrorsinparentheses
***p<0.01,**p<0.05,*p<0.1
53
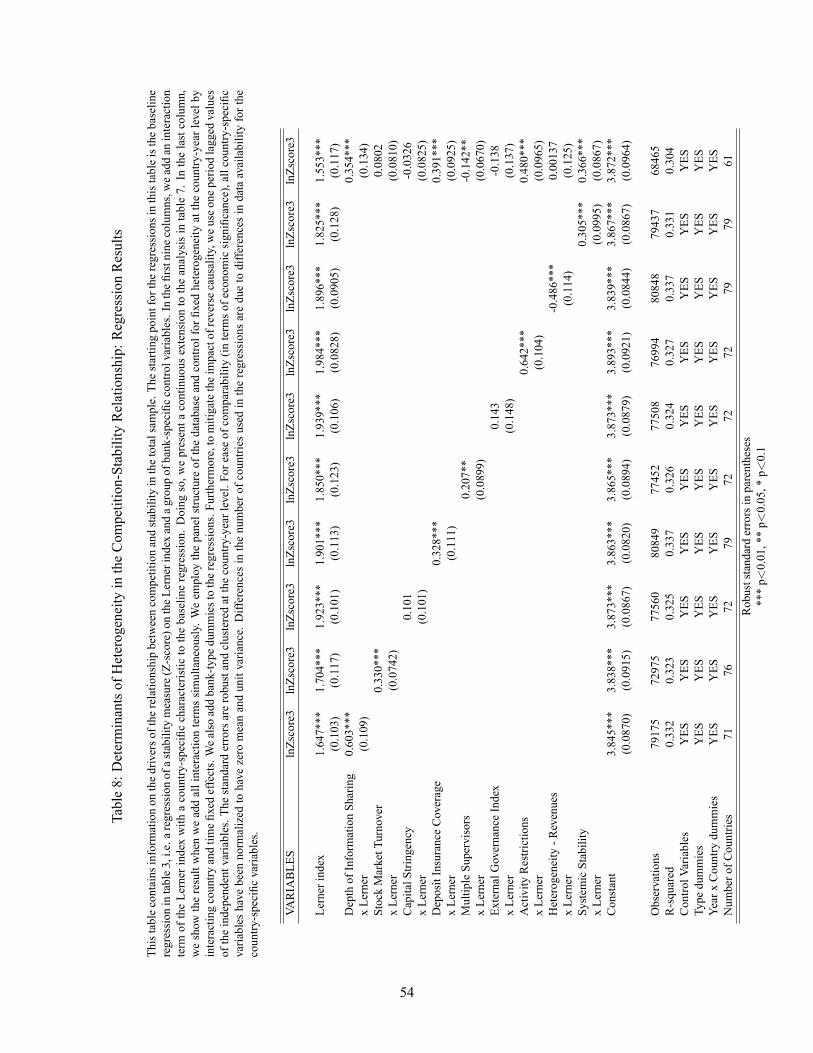
Table8:DeterminantsofHeterogeneityintheCompetition-StabilityRelationship:RegressionResults
Thistablecontainsinformationonthedriversoftherelationshipbetweencompetitionandstabilityinthetotalsample.Thestartingpointfortheregressionsinthistableisthebaseline
regressionintable3,i.e.aregressionofastabilitymeasure(Z-score)ontheLernerindexandagroupofbank-speci�ccontrolvariables.Inthe�rstninecolumns,weaddaninteraction
termoftheLernerindexwithacountry-speci�ccharacteristictothebaselineregression.Doingso,wepresentacontinuousextensiontotheanalysisintable7.Inthelastcolumn,
weshowtheresultwhenweaddallinteractiontermssimultaneously.Weemploythepanelstructureofthedatabaseandcontrolfor�xedheterogeneityatthecountry-yearlevelby
interactingcountryandtime�xedeffects.Wealsoaddbank-typedummiestotheregressions.Furthermore,tomitigatetheimpactofreversecausality,weuseoneperiodlaggedvalues
oftheindependentvariables.Thestandarderrorsarerobustandclusteredatthecountry-yearlevel.Foreaseofcomparability(intermsofeconomicsigni�cance),allcountry-speci�c
variableshavebeennormalizedtohavezeromeanandunitvariance.Differencesinthenumberofcountriesusedintheregressionsareduetodifferencesindataavailabilityforthe
country-speci�cvariables.
VARIABLES
lnZscore3
lnZscore3
lnZscore3
lnZscore3
lnZscore3
lnZscore3
lnZscore3
lnZscore3
lnZscore3
lnZscore3
Lernerindex
1.647***
1.704***
1.923***
1.901***
1.850***
1.939***
1.984***
1.896***
1.825***
1.553***
(0.103)
(0.117)
(0.101)
(0.113)
(0.123)
(0.106)
(0.0828)
(0.0905)
(0.128)
(0.117)
DepthofInformationSharing
0.603***
0.354***
xLerner
(0.109)
(0.134)
StockMarketTurnover
0.330***
0.0802
xLerner
(0.0742)
(0.0810)
CapitalStringency
0.101
-0.0326
xLerner
(0.101)
(0.0825)
DepositInsuranceCoverage
0.328***
0.391***
xLerner
(0.111)
(0.0925)
MultipleSupervisors
0.207**
-0.142**
xLerner
(0.0899)
(0.0670)
ExternalGovernanceIndex
0.143
-0.138
xLerner
(0.148)
(0.137)
ActivityRestrictions
0.642***
0.480***
xLerner
(0.104)
(0.0965)
Heterogeneity-Revenues
-0.486***
0.00137
xLerner
(0.114)
(0.125)
SystemicStability
0.305***
0.366***
xLerner
(0.0995)
(0.0867)
Constant
3.845***
3.838***
3.873***
3.863***
3.865***
3.873***
3.893***
3.839***
3.867***
3.872***
(0.0870)
(0.0915)
(0.0867)
(0.0820)
(0.0894)
(0.0879)
(0.0921)
(0.0844)
(0.0867)
(0.0964)
Observations
79175
72975
77560
80849
77452
77508
76994
80848
79437
68465
R-squared
0.332
0.323
0.325
0.337
0.326
0.324
0.327
0.337
0.331
0.304
ControlVariables
YES
YES
YES
YES
YES
YES
YES
YES
YES
YES
Typedummies
YES
YES
YES
YES
YES
YES
YES
YES
YES
YES
YearxCountrydummies
YES
YES
YES
YES
YES
YES
YES
YES
YES
YES
NumberofCountries
7176
7279
7272
7279
7961
Robuststandarderrorsinparentheses
***p<0.01,**p<0.05,*p<0.1
54

Table 9: Failing Banks
This table shows regression results for the competition-stability trade-off while controlling for the impact of distressedand failing banks. The �rst column replicates the results from column 10 in table 8, i.e. regressing the Z-score on theLerner index and all interaction terms between the Lerner index and the country-speci�c variables, while controlling forbank-speci�c characteristics and country-year �xed effects. In the second and the third regression, we add an interactionterm of the Lerner index with an exit dummy. For the second regression, the exit dummy equals one in the two yearsbefore the bank leaves the sample. Notice that this dummy does not discrimate between defaults and distressed mergerson the one hand and 'normal' mergers or acquisitions on the other hand. Therefore, in the third regression, the exitdummy only equals one in the two years before a bank leaves the sample if the bank had a negative ROA in thatperiod. In this way, we only capture the banks that actually were in distress before they leave the sample. In the fourthregression, we only look at banks that did not exit the sample due to a distressed situation (Distressed Exit Dummy =0).For each regression, error terms are robust and clustered at the country-year level.
VARIABLES Baseline Exit Distressed Exit Not Distressed
Lerner index 1.553*** 1.609*** 1.368*** 1.321***(0.117) (0.111) (0.120) (0.127)
Depth of Information Sharing 0.354*** 0.346*** 0.335** 0.379***x Lerner (0.134) (0.130) (0.132) (0.145)Stock Market Turnover 0.0802 0.0943 0.0420 -0.0266x Lerner (0.0810) (0.0826) (0.0703) (0.0854)Capital Stringency -0.0326 -0.0354 -0.0146 0.0459x Lerner (0.0825) (0.0825) (0.0807) (0.0882)Deposit Insurance Coverage 0.391*** 0.378*** 0.393*** 0.493***x Lerner (0.0925) (0.0913) (0.0917) (0.113)Multiple Supervisors -0.142** -0.135** -0.147** -0.177**x Lerner (0.0670) (0.0679) (0.0631) (0.0719)External Governance Index -0.138 -0.136 -0.131 -0.0924x Lerner (0.137) (0.136) (0.133) (0.148)Activity Restrictions 0.480*** 0.493*** 0.408*** 0.481***x Lerner (0.0965) (0.0962) (0.0928) (0.102)Heterogeneity - Revenues 0.00137 0.00953 -0.0251 0.0209x Lerner (0.125) (0.125) (0.119) (0.129)Systemic Stability 0.366*** 0.370*** 0.374*** 0.369***x Lerner (0.0867) (0.0888) (0.0776) (0.0881)Last Observation -0.189**x Lerner (0.0888)Last Observation Distressed 1.818***x Lerner (0.189)Constant 3.872*** 3.874*** 3.917*** 3.945***
(0.0964) (0.0961) (0.0957) (0.0959)
Observations 68465 68465 68465 67201R-squared 0.304 0.304 0.306 0.280Control Variables YES YES YES YESType dummies YES YES YES YESYear x Country dummies YES YES YES YES
Robust standard errors in parentheses*** p<0.01, ** p<0.05, * p<0.1
55

Table 10: Robustness test - Market ShareThis table shows regression results for the competition-stability trade-off while controlling for the potential impact of nonlinearities, abanks' market share and too big to fail status. The �rst column replicates the results from column 10 in table 8, i.e. regressing the Z-scoreon the Lerner index and all interaction terms between the Lerner index and the country-speci�c variables, while controlling for bank-speci�c characteristics and country-year �xed effects. In the following columns, we expand this regression with extra interaction terms. Inthe second column we control for non-linearities in the competition-stability relationship by adding a squared Lerner index. Doing so, wereduce the possibility that the other interaction terms are picking up a competition effect. In regression three and four we take into accountthe potential impact of a banks' market share by adding an interaction term of the Lerner index with a banks` market share (column 3) or adummy indicating whether the bank has a market share that is higher than 10 percent (column 4). In the last two regressions, we control forthe impact of too-big-to-fail banks. We proxy too-big-to-fail by the ratio of bank size to a country's GDP. We construct a dummy indicatingwhether this ratio is higher than 10 or 25 percent. We then interact this dummy with the Lerner index to see whether these banks reactdifferently to a change in competition. For each regression, error terms are robust and clustered at the country-year level.
VARIABLES Baseline Lerner Market Share Large Market Share TBTF10 TBTF25
Lerner index 1.553*** 1.878*** 1.900*** 1.884*** 1.888*** 1.884***(0.117) (0.109) (0.121) (0.113) (0.112) (0.110)
Depth of Information Sharing 0.354*** 0.210* 0.203* 0.208* 0.207* 0.208*x Lerner (0.134) (0.113) (0.117) (0.115) (0.114) (0.114)Stock Market Turnover 0.0802 0.0761 0.0705 0.0742 0.0720 0.0730x Lerner (0.0810) (0.0682) (0.0685) (0.0683) (0.0682) (0.0682)Capital Stringency -0.0326 -0.0709 -0.0760 -0.0724 -0.0746 -0.0751x Lerner (0.0825) (0.0769) (0.0765) (0.0767) (0.0767) (0.0768)Deposit Insurance Coverage 0.391*** 0.240*** 0.240*** 0.240*** 0.240*** 0.241***x Lerner (0.0925) (0.0769) (0.0775) (0.0771) (0.0771) (0.0769)Multiple Supervisors -0.142** -0.0355 -0.0360 -0.0356 -0.0359 -0.0364x Lerner (0.0670) (0.0614) (0.0613) (0.0614) (0.0614) (0.0615)External Governance Index -0.138 -0.117 -0.113 -0.116 -0.113 -0.113x Lerner (0.137) (0.111) (0.111) (0.111) (0.110) (0.111)Activity Restrictions 0.480*** 0.382*** 0.386*** 0.383*** 0.383*** 0.381***x Lerner (0.0965) (0.0835) (0.0842) (0.0837) (0.0836) (0.0835)Heterogeneity - Revenues 0.00137 0.00699 0.00526 0.00610 0.00677 0.00771x Lerner (0.125) (0.109) (0.108) (0.108) (0.109) (0.109)Systemic Stability 0.366*** 0.469*** 0.464*** 0.468*** 0.469*** 0.471***x Lerner (0.0867) (0.0797) (0.0801) (0.0798) (0.0796) (0.0796)Lerner -3.298*** -3.294*** -3.296*** -3.294*** -3.294***x Lerner (0.235) (0.236) (0.235) (0.235) (0.235)Market Share -1.450x Lerner (1.619)Dummy Large Market Share -0.114x Lerner (0.193)I(Size/GDP > 10%) -0.235x Lerner (0.229)I(Size/GDP > 25%) -0.433x Lerner (0.279)Constant 3.872*** 4.008*** 4.002*** 4.006*** 4.003*** 4.003***
(0.0964) (0.0894) (0.0926) (0.0908) (0.0917) (0.0908)
Observations 68465 68465 68465 68465 68465 68465R-squared 0.304 0.312 0.312 0.312 0.312 0.312Control Variables YES YES YES YES YES YESType dummies YES YES YES YES YES YESYear x Country dummies YES YES YES YES YES YES
Robust standard errors in parentheses*** p<0.01, ** p<0.05, * p<0.1
56
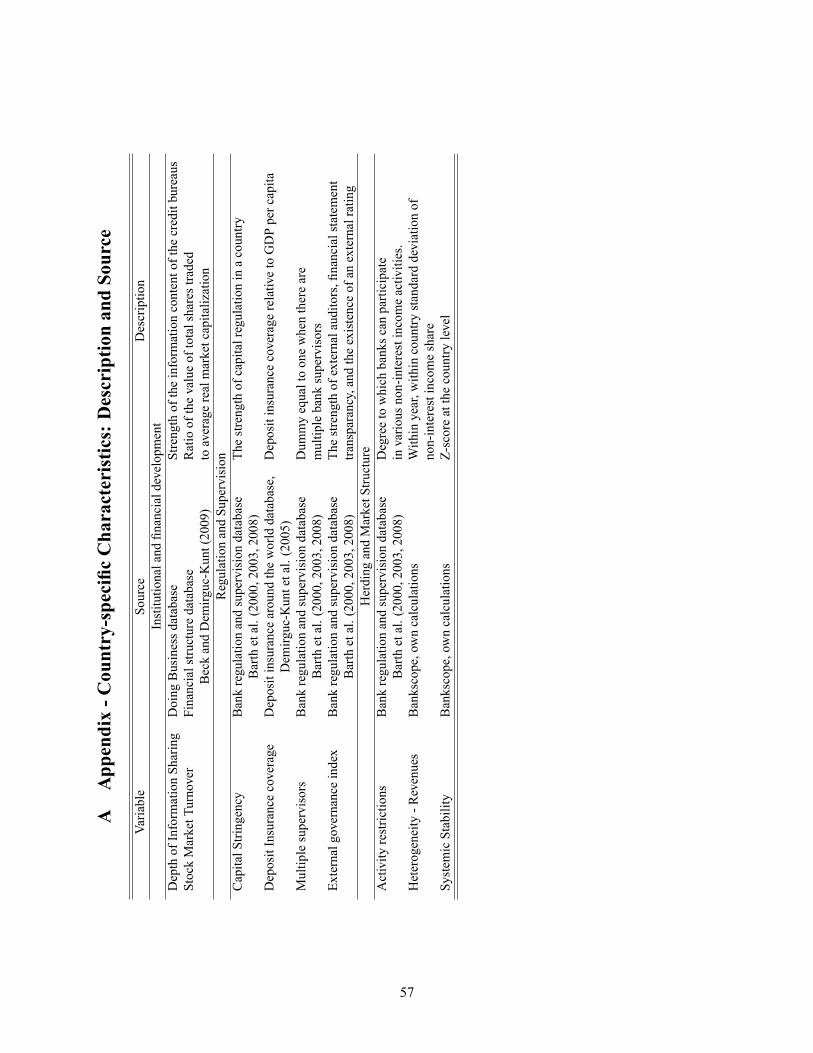
AAppendix-Country-speci�cCharacteristics:DescriptionandSource
Variable
Source
Description
Institutionaland�nancialdevelopment
DepthofInformationSharing
DoingBusinessdatabase
Strengthoftheinformationcontentofthecreditbureaus
StockMarketTurnover
Financialstructuredatabase
Ratioofthevalueoftotalsharestraded
BeckandDemirguc-Kunt(2009)
toaveragerealmarketcapitalization
RegulationandSupervision
CapitalStringency
Bankregulationandsupervisiondatabase
Thestrengthofcapitalregulationinacountry
Barthetal.(2000,2003,2008)
DepositInsurancecoverage
Depositinsurancearoundtheworlddatabase,DepositinsurancecoveragerelativetoGDPpercapita
Demirguc-Kuntetal.(2005)
Multiplesupervisors
Bankregulationandsupervisiondatabase
Dummyequaltoonewhenthereare
Barthetal.(2000,2003,2008)
multiplebanksupervisors
Externalgovernanceindex
Bankregulationandsupervisiondatabase
Thestrengthofexternalauditors,�nancialstatement
Barthetal.(2000,2003,2008)
transparancy,andtheexistenceofanexternalrating
HerdingandMarketStructure
Activityrestrictions
Bankregulationandsupervisiondatabase
Degreetowhichbankscanparticipate
Barthetal.(2000,2003,2008)
invariousnon-interestincomeactivities.
Heterogeneity-Revenues
Bankscope,owncalculations
Withinyear,withincountrystandarddeviationof
non-interestincomeshare
SystemicStability
Bankscope,owncalculations
Z-scoreatthecountrylevel
57
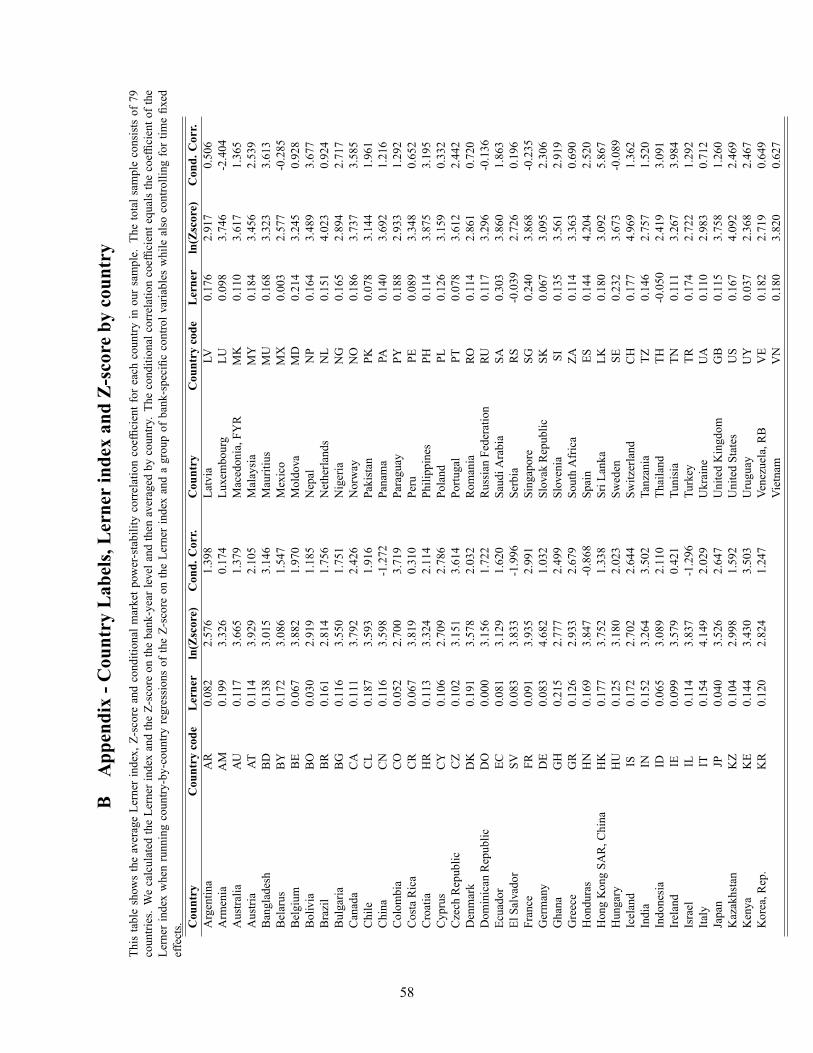
BAppendix-CountryLabels,LernerindexandZ-scorebycountry
ThistableshowstheaverageLernerindex,Z-scoreandconditionalmarketpower-stabilitycorrelationcoef�cientforeachcountryinoursample.Thetotalsampleconsistsof79
countries.WecalculatedtheLernerindexandtheZ-scoreonthebank-yearlevelandthenaveragedbycountry.Theconditionalcorrelationcoef�cientequalsthecoef�cientofthe
Lernerindexwhenrunningcountry-by-countryregressionsoftheZ-scoreontheLernerindexandagroupofbank-speci�ccontrolvariableswhilealsocontrollingfortime�xed
effects. Country
Countrycode
Lerner
ln(Zscore)
Cond.Corr.
Country
Countrycode
Lerner
ln(Zscore)
Cond.Corr.
Argentina
AR
0.082
2.576
1.398
Latvia
LV0.176
2.917
0.506
Armenia
AM
0.199
3.326
0.174
Luxembourg
LU0.098
3.746
-2.404
Australia
AU
0.117
3.665
1.379
Macedonia,FYR
MK
0.110
3.617
1.365
Austria
AT0.114
3.929
2.105
Malaysia
MY
0.184
3.456
2.539
Bangladesh
BD
0.138
3.015
3.146
Mauritius
MU
0.168
3.323
3.613
Belarus
BY
0.172
3.086
1.547
Mexico
MX
0.003
2.577
-0.285
Belgium
BE
0.067
3.882
1.970
Moldova
MD
0.214
3.245
0.928
Bolivia
BO
0.030
2.919
1.185
Nepal
NP
0.164
3.489
3.677
Brazil
BR
0.161
2.814
1.756
Netherlands
NL
0.151
4.023
0.924
Bulgaria
BG
0.116
3.550
1.751
Nigeria
NG
0.165
2.894
2.717
Canada
CA
0.111
3.792
2.426
Norway
NO
0.186
3.737
3.585
Chile
CL
0.187
3.593
1.916
Pakistan
PK0.078
3.144
1.961
China
CN
0.116
3.598
-1.272
Panama
PA0.140
3.692
1.216
Colombia
CO
0.052
2.700
3.719
Paraguay
PY0.188
2.933
1.292
CostaRica
CR
0.067
3.819
0.310
Peru
PE0.089
3.348
0.652
Croatia
HR
0.113
3.324
2.114
Philippines
PH0.114
3.875
3.195
Cyprus
CY
0.106
2.709
2.786
Poland
PL0.126
3.159
0.332
CzechRepublic
CZ
0.102
3.151
3.614
Portugal
PT0.078
3.612
2.442
Denmark
DK
0.191
3.578
2.032
Romania
RO0.114
2.861
0.720
DominicanRepublic
DO
0.000
3.156
1.722
RussianFederation
RU0.117
3.296
-0.136
Ecuador
EC0.081
3.129
1.620
SaudiArabia
SA0.303
3.860
1.863
ElSalvador
SV0.083
3.833
-1.996
Serbia
RS
-0.039
2.726
0.196
France
FR0.091
3.935
2.991
Singapore
SG0.240
3.868
-0.235
Germany
DE
0.083
4.682
1.032
SlovakRepublic
SK0.067
3.095
2.306
Ghana
GH
0.215
2.777
2.499
Slovenia
SI0.135
3.561
2.919
Greece
GR
0.126
2.933
2.679
SouthAfrica
ZA0.114
3.363
0.690
Honduras
HN
0.169
3.847
-0.868
Spain
ES0.144
4.204
2.520
HongKongSAR,China
HK
0.177
3.752
1.338
SriLanka
LK0.180
3.092
5.867
Hungary
HU
0.125
3.180
2.023
Sweden
SE0.232
3.673
-0.089
Iceland
IS0.172
2.702
2.644
Switzerland
CH
0.177
4.969
1.362
India
IN0.152
3.264
3.502
Tanzania
TZ0.146
2.757
1.520
Indonesia
ID0.065
3.089
2.110
Thailand
TH-0.050
2.419
3.091
Ireland
IE0.099
3.579
0.421
Tunisia
TN0.111
3.267
3.984
Israel
IL0.114
3.837
-1.296
Turkey
TR0.174
2.722
1.292
Italy
IT0.154
4.149
2.029
Ukraine
UA
0.110
2.983
0.712
Japan
JP0.040
3.526
2.647
UnitedKingdom
GB
0.115
3.758
1.260
Kazakhstan
KZ
0.104
2.998
1.592
UnitedStates
US
0.167
4.092
2.469
Kenya
KE
0.144
3.430
3.503
Uruguay
UY
0.037
2.368
2.467
Korea,Rep.
KR
0.120
2.824
1.247
Venezuela,RB
VE
0.182
2.719
0.649
Vietnam
VN
0.180
3.820
0.627
58