bangor university doctor of philosophy biodiversity
TRANSCRIPT

Bangor University
DOCTOR OF PHILOSOPHY
Biodiversity, ecosystem function and ecosystem service provision in saltmarsh andsand dune grasslands
Ford, Hilary
Award date:2012
Awarding institution:Bangor University
Link to publication
General rightsCopyright and moral rights for the publications made accessible in the public portal are retained by the authors and/or other copyright ownersand it is a condition of accessing publications that users recognise and abide by the legal requirements associated with these rights.
• Users may download and print one copy of any publication from the public portal for the purpose of private study or research. • You may not further distribute the material or use it for any profit-making activity or commercial gain • You may freely distribute the URL identifying the publication in the public portal ?
Take down policyIf you believe that this document breaches copyright please contact us providing details, and we will remove access to the work immediatelyand investigate your claim.
Download date: 09. Apr. 2022
i
BIODIVERSITY, ECOSYSTEM FUNCTION AND ECOSYSTEM SERVICE PROVISION
IN SALTMARSH AND SAND DUNE GRASSLANDS
A thesis submitted to Bangor University by
Hilary Ford In candidature for the degree of
Philosphiae Doctor
School of the Environment, Natural Resources and Geography,
Bangor University, Environment Centre Wales,
Bangor, Gwynedd, LL57 2UW
October 2012

v
Summary Coastal grasslands, such as salt marshes and sand dunes, provide many important ecosystem services including ‘supporting services’ (soil formation, primary productivity and nutrient cycling), ‘provisioning services’ (fresh water supply, food and fibre products, bio-chemical or genetic resources), ‘regulating services’ (equable climate, pollution control, flood prevention, invertebrate pollination and pest regulation) and ‘cultural services’ (recreation, education and aesthetic appreciation). Historically, salt marsh and sand dune grasslands were commonly used as agricultural livestock grazing land. Currently, some of these coastal grasslands are ‘conservation grazed’ (i.e. extensively grazed to maximise plant diversity and to provide a suitable habitat for over-wintering bird species), others have been ‘abandoned’ (i.e. large herbivores removed) due to the removal of agricultural subsidies or remain historically ‘un-grazed’. Grazing management of coastal grasslands influences biological and physical habitat characteristics, ecosystem function, biodiversity and ecosystem service delivery. Understanding the impact of grazing is therefore vital to enable future robust management recommendations. Biodiversity is often used as an indicator of ecosystem health and ecosystem service provision with conservation priorities allocated accordingly. It is therefore essential to critically assess just how important biodiversity is to the provision of ecosystem services within a wide range of habitats. The review chapter draws together evidence for this argument from salt marsh and sand dune habitats with the conclusion that functional diversity and composition are more important than biodiversity per se (Chapter 2). The experimental chapters of this thesis deal with the impact of grazing upon temperate salt marsh and sand dune grassland biodiversity and ecosystem service provision. ‘Grazed’ (cattle grazed < 8 cm) and historically ‘un-grazed’ upper salt marsh plots were compared. ‘Fully grazed’ (ponies 0.2 ha-1, cattle 0.05 ha-1 and rabbits 45 ha-1), ‘rabbit grazed’ and ‘un-grazed’ (for 8 years) fixed sand dune grassland plots were also evaluated. Firstly, how grazing management affected ecosystem service provision of sand dune grassland was examined, by measuring a wide range of biophysical variables as proxies for ecosystem services (Chapter 3). ‘Supporting’ and ‘regulating’ services were provided predominantly by the un-grazed, ‘provisioning’ and ‘cultural’ services by the extensively grazed grassland. Secondly, the impact of short sward cattle grazing on the abundance, composition and diversity of the ground dwelling invertebrate community of an upper salt marsh was assessed using pitfall traps (Chapter 4). The findings showed that both cattle grazed and un-grazed saltmarsh habitat should be maintained to maximise invertebrate abundance and diversity and provide suitable habitat for coastal specialists. Thirdly, greenhouse gas emissions from grazed and un-grazed salt marsh were measured monthly for one year. Additionally, below-ground gas sampling tubes were used to measure soil methane concentrations (Chapter 5). Carbon dioxide efflux was greater from the un-grazed marsh soil but ‘hotspots’ of methane efflux were only found on the grazed marsh. Finally, the influence of grazing on the soil microbial community of both salt marsh and sand dune grasslands was measured by microbial biomass (fatty acid phospholipids: PLFAs), bacterial growth rate (Leucine incorporation) and respiration rates (Chapter 6). Microbial biomass, PLFA markers and bacterial growth rate were all influenced by grazing management. In summary, this work concludes that grazing management clearly affects biological and physical habitat characteristics, biodiversity, ecosystem function and ecosystem service delivery (Chapter 7). Management of coastal grasslands evidently involves trade-offs between biodiversity conservation and multiple ecosystem service provision.

vi
Acknowledgements
I would like to thank my supervisors, Laurence Jones and Angus Garbutt of the
Centre for Ecology & Hydrology and Davey Jones of Bangor University. Also
Steve Hughes, Inma Robinson, David Robinson, David Cooper, Johannes Rousk,
Ed Rispin, Dick Loxton, Rachel Kingham, Annette Burden, Rob Mills, Lucy
Hawkes, Helen Glanville, Ylva Olsen, Aled Roberts, Rhian Walsh and Matt
Lundquist for assistance with fieldwork, invertebrate identification, lab
techniques, statistics, troubleshooting and tips. And to Paul Beattie-Edwards
and Therese Gilligan for putting up with me and Mark Cooper – my write up
biscuit buddy! Thanks also to Countryside Council for Wales and Natural
England for access to field sites. The project work for this thesis was funded as
part of a NERC – Centre for Ecology & Hydrology project – NECO3610.
vii
Table of contents
Declaration ii Summary v Acknowledgements vi Table of contents vii List of figures xi List of tables
xv
Chapter 1 Thesis introduction
1
1.1 Overview 1 1.2 Thesis outline 2 1.3 Aims 2 1.4 Contribution of authors to each chapter 3 Chapter 2 Does biodiversity underpin ecosystem service provision
in temperate salt marshes and sand dunes? – A review
4
2.1 Introduction 4 2.2 The theory – biodiversity measures and ecosystem
function 5
2.3 Wider evidence – biodiversity measures, ecosystem function and multiple ecosystem service provision
7
2.4 Selected habitats – salt marshes and sand dunes 9 2.5 Ecosystem services of salt marshes and sand dunes 13
2.5.1 Supporting services 14 2.5.2 Provisioning services 17 2.5.3 Regulating services 18 2.5.4 Cultural services 21
2.6 Conclusions 22 2.7 References 24 Chapter 3 Impacts of grazing abandonment on ecosystem service
provision: coastal grassland as a model system
40
3.1 Abstract 40 3.2 Introduction 41 3.3 Materials and methods 43
3.3.1 Study site and experimental design 43 3.3.2 Soil characteristics 44 3.3.3 Vegetation characteristics 45 3.3.4 Biodiversity of plants and invertebrates 46 3.3.5 Analysis 47
3.4 Results 48 3.4.1 Soil and vegetation characteristics 48 3.4.2 Biodiversity 52
3.5 Discussion 54 3.5.1 Supporting services 54

viii
3.5.2 Provisioning services 56 3.5.3 Regulating services 57 3.5.4 Cultural services 58 3.5.5 Grazing management for conservation 59 3.5.6 Ecosystem service tradeoffs 59
3.6 Acknowledgements 60 3.7 References 60 3.8 Appendix 67 Chapter 4 Grazing management in saltmarsh ecosystems drives
invertebrate diversity, abundance and functional group structure
73
4.1 Abstract 73 4.2 Introduction 74 4.3 Methods 78
4.3.1 Site description 78 4.3.2 Experimental design 79 4.3.3 Soil and vegetation characteristics 79 4.3.4 Ground dwelling invertebrates – pitfall traps 80 4.3.5 Invertebrate classification - functional groups & coastal
specialists 81
4.3.6 Statistical Analysis - soil and vegetation characteristics 82 4.3.7 Statistical Analysis - ground dwelling invertebrates 82 4.3.8 Statistical Analysis - relationship between
environmental variables and functional group occurrence
82
4.3.9 Food web analysis 83 4.4 Results 83
4.4.1 Soil properties and vegetation characteristics 83 4.4.2 Invertebrate summary 84 4.4.3 Abundance, species richness and functional group
structure of Coleoptera 84
4.4.4 Abundance, species richness and functional group structure of Hemiptera
85
4.4.5 Abundance, species richness and prey capture methods of Araneae
86
4.4.6 Abundance and functional group structure of other invertebrates
87
4.4.7 Abundance of coastal specialist species 87 4.4.8 Environmental factors that influence invertebrate
habitat choice 91
4.4.9 Food web analysis 91 4.5 Discussion 93
4.5.1 Overview 93 4.5.2 Coleoptera, Hemiptera and Araneae 94 4.5.3 Other invertebrates 95 4.5.4 Abundance of coastal specialist species 96
ix
4.6 Conclusion 96 4.7 Acknowledgements 97 4.8 References 97 4.9 Appendix 106 Chapter 5 Methane, carbon dioxide and nitrous oxide fluxes from a
temperate salt marsh: grazing management does not alter Global Warming Potential
111
5.1 Abstract 111 5.2 Introduction 112 5.3 Study area, materials and methods 115
5.3.1 Crossens marsh 115 5.3.2 Marsh characterisation 116 5.3.3 CH4, CO2 and N2O chamber fluxes 118 5.3.4 Flux calculation 119 5.3.5 CH4 soil concentration 119 5.3.6 Environmental measurements as predictors of chamber
gas fluxes 121
5.3.7 Statistical analysis 121 5.3.8 Up-scaling conceptual diagram 122
5.4 Results 122 5.4.1 Marsh characterisation 122 5.4.2 CH4 chamber fluxes 123 5.4.3 CO2 chamber fluxes 125 5.4.4 N2O chamber fluxes 126 5.4.5 CH4 soil concentration 127 5.4.6 Environmental measurements as predictors of chamber
gas fluxes 128
5.4.7 Up-scaling conceptual diagram 128 5.5 Discussion 128
5.5.1 Marsh characterisation 128 5.5.2 CH4 131 5.5.3 CO2 132 5.5.4 N2O 133 5.5.5 Validity of up-scaling 133
5.6 Conclusion 134 5.7 Acknowledgements 135 5.8 References 135 Chapter 6 Grazing effects on microbial community composition,
growth, and nutrient cycling in salt marsh and sand dune grasslands
143
6.1 Abstract 143 6.2 Introduction 144 6.3 Methods 146
6.3.1 Salt marsh 146

x
6.3.2 Sand dune grassland 148 6.3.3 Soil and vegetation analyses 149 6.3.4 PLFAs 150 6.3.5 Bacterial growth rate and turnover times 151 6.3.6 Statistical analysis 151
6.4 Results 152 6.4.1 Soil and vegetation characteristics 152 6.4.2 PLFAs 154 6.4.3 PLFAs and environmental variables 156 6.4.4 Bacterial growth rate and turnover times 156
6.5 Discussion 160 6.5.1 Salt marsh microbial biomass, activity and nutrient
cycling 160
6.5.2 Sand dune microbial biomass, activity and nutrient cycling
161
6.5.3 Microbial composition patterns 161 6.6 Conclusions 162 6.7 Acknowledgements 163 6.8 References 163 Chapter 7 Thesis discussion
172
7.1 Overview 172 7.2 Conclusion 175 7.3 Future research questions 176 7.4 Appendix 177
7.4.1 Methods for Table A7.1 177 7.4.1.1 Vegetation 177 7.4.1.2 C stock 177 7.4.1.3 Nectar feeders (pollinators) 178 7.4.1.4 References 178

xi
List of figures
Figure 2.1 Dyfi estuary salt marsh, Wales. 10 Figure 2.2 Newborough Warren coastal sand dunes, Wales. 11 Figure 2.3 Salt marsh and sand dune distribution, based upon Long &
Mason (1983), Yang & Chen (1995) and Martínez et al. (2004).
13
Figure 2.4 ‘Supporting service’, productive salt marsh habitat, Condor Green marsh, UK.
15
Figure 2.5 ‘Provisioning service’, sheep grazing at Ynys Hir marsh, UK. 18 Figure 2.6 ‘Regulating service’ of flood prevention, Glasson marsh, UK. 20 Figure 2.7 ‘Cultural services’ of education, recreation and
conservation, a break from soil and vegetation sampling at Crossens marsh, UK.
22
Figure 3.1 Effect of grazing (PR = fully grazed, R = rabbit grazed, U = un-grazed) on C stock. Bold text indicates significant differences between grazing treatments for each component, * (p < 0.05), ** (p < 0.01).
50
Figure 3.2 Effect of grazing (PR = fully grazed, R = rabbit grazed, U = un-grazed) on N mineralisation. Bold text indicates significant differences between grazing treatments for each component, * (p < 0.05).
50
Figure 3.3 Effect of grazing (PR = fully grazed, R = rabbit grazed, U = un-grazed) on below-ground mesofaunal feeding rate in autumn. Bold text indicates significant differences between grazing treatments for each depth zone (d1 – d4), *(p < 0.05).
51
Figure 3.4 Effect of grazing (PR = fully grazed, R = rabbit grazed, U = un-grazed) on number of new fine roots produced per month, as a proxy for potential fine root turnover. Bold text shows significant differences between grazing treatments for each soil depth * (p < 0.05).
51
Figure 3.5 Effect of grazing (PR = fully grazed, R = rabbit grazed, U = un-grazed) on plant functional groups (adjusted to 100 %). Bold text shows significant differences between grazing treatments for each plant group, * (p < 0.05), ** (p < 0.01).
53
Figure 3.6 Effects of pony and cattle removal from coastal grassland on measured variables and potential ecosystem service delivery. Significant increase or decrease in variables indicated by up (↑) or down (↓) arrows (*p < 0.05, ***p < 0.001, ns = not significant), # for expected results from the
55

xii
literature. Direct links between variables (solid lines), indirect links to ecosystem services (dashed lines) with positive (+), equal (=) or negative (-) effects on ecosystem services are also shown.
Figure 4.1 Crossens Marsh field site with fence line marking boundary between un-grazed vegetation on the left, dominated by a tall sward (20 – 30 cm) of Elytrigia repens, and consistently short cattle grazed vegetation on the right (< 8 cm).
78
Figure 4.2 Experimental design at Crossens Marsh, G1–G6 were grazed experimental units, U1-U6 were un-grazed units.
79
Figure 4.3 Coleoptera (a) and Hemiptera (b) abundance from grazed (grey bars) and un-grazed (white bars) salt marsh characterised by functional group: PRE = predatory; ZOO = zoophagus; PHY = phytophagus; DET = detritivore; NOT = not assigned. Significant differences between grazing treatment indicated by *(p < 0.05), non significant results as ns (p > 0.05), Wilcoxon matched pairs test.
88
Figure 4.4 Araneae abundance from grazed (grey bars) and un-grazed (white bars) salt marsh characterised by functional group (a): PRE = predatory and further classified by prey capture method (b): FRH = foliage running hunter; GRH = ground running hunter; SWB = space web builder; SW = sheet weaver. Significant differences between grazing treatment indicated by *(p < 0.05), non significant results as ns (p > 0.05), Wilcoxon matched pairs test.
89
Figure 4.5 All other invertebrates (not Coleoptera, Hemiptera or Araneae) abundance from grazed (grey bars) and un-grazed (white bars) salt marsh characterised by functional group: a) PRE = predatory; ZOO = zoophagus & PHY = phytophagus; b) DET = detritivore & NOT = not assigned. Significant differences between grazing treatment indicated by *(p < 0.05), non significant results as ns (p > 0.05), Wilcoxon matched pairs test.
90
Figure 4.6 RDA triplot showing the relationship between eight environmental variables and the distribution of sixteen functional groups and prey capture methods. Environmental variables were selected by forward selection (Canoco v.4.5; Monte Carlo test, 500 permutations); the three significant ones, temperature, vegetation height and salinity are shown in bold. Grazed experimental units (G1-G6) are displayed as grey circles, un-grazed units (U1-U6) as white circles.
92
Figure 4.7 Ground dwelling invertebrate food web for cattle grazed and un-grazed salt marsh. Body length of invertebrates: L (large ≤ 30 mm), M (medium ≤ 20 mm), S (small ≤ 10 mm).
93

xiii
Functional group of invertebrates: DET = detritivore, PHY = phytophagus, PRE = predatory (L PRE beetles also include zoophagus beetles). Invertebrate abundance is expressed as percentage of total invertebrates per grazing treatment.
Figure 5.1 Experimental design at Crossens Marsh, grazed experimental units (G1-G6) and un-grazed units (U1-U6). All units are 10 m x 10 m square at 20 - 30 m, 30 - 40 m or 40 - 50 m from the fence line. Not to scale.
116
Figure 5.2 Schematic representation of the underground gas sampling tubes.
120
Figure 5.3 Below-ground meso-faunal bait lamina feeding activity for both grazing treatments (G = grazed; U = un-grazed) in summer and autumn 2009 as a function of soil depth. Values represent means ± 95% confidence intervals. Significant differences denoted by ** (P < 0.01), non-significant by ns.
125
Figure 5.4 Monthly methane and carbon dioxide fluxes, comparison with grazing treatment (G = grazed; U = un-grazed) for September 10 to August 11. Values in left hand panels represent means ± 95% confidence intervals. Values in right hand panels represent mean of 2 gas chambers for grazed (G1-G6) and un-grazed (U1-U6) experimental units. Significant differences between grazing treatments, month or grazing: month interaction indicated by *(P < 0.05), **(P < 0.01) and ***(P < 0.001). Non significant results recorded as ns (P > 0.05).
126
Figure 5.5 Influence of grazing on underground soil methane concentrations, expressed as percentage on a volumetric basis for October 2010, January and July 2011 on a log scale. Values shown for all grazed (G1-G6) and un-grazed (U1-U6) experimental units. Significant differences between grazing treatments, month or grazing: month interaction indicated by ***(P < 0.001). Non significant results recorded as ns (P > 0.05).
127
Figure 5.6 Influence of grazing on soil moisture, water table depth and soil temperature, measured monthly alongside gas measurements. Values represent means ± 95% confidence intervals. Significant differences between grazing treatments, month or grazing:month interaction indicated by *(P < 0.05), **(P < 0.01) and ***(P < 0.001). Non significant results recorded as ns (P > 0.05).
129
Figure 5.7 Up-scaled conceptual diagram for total greenhouse gas efflux from grazed and un-grazed salt marsh using yearly means (calculated from monthly means; Fig. 6.), ± 95%
130

xiv
confidence intervals, to give a flux estimate per year for Crossens Marsh. All gas fluxes are expressed in g CO2e m-2 yr-1 for Global Warming Potential (GWP) of 100 years (CO2 = 1, CH4 = 25, N2O = 298; Denman et al., 2007). No significant difference in GWP between grazed and un-grazed salt marsh (ANOVA; F = 0.41, d.f. = 5, ns). # CH4 efflux via cattle (calculated for Crossens Marsh; IPCC, 1996); ## CH4 efflux via ebullition caused by cattle trampling (Herbst et al., 2011).
Figure 6.1 Experimental design at Crossens Marsh salt marsh, grazed experimental units (G1-G6) and un-grazed units (U1-U6). All units are 10 m x 10 m square at 20 - 30 m, 30 - 40 m or 40 - 50 m from the fence line. Not to scale.
147
Figure 6.2 Experimental design at Newborough Warren sand dune grassland, three replicated blocks of three grazing treatments, fully grazed, rabbit grazed and un-grazed. Not to scale.
148
Figure 6.3 Total, bacterial and fungal PLFA concentrations for salt marsh (G = grazed; U = un-grazed) and sand dune grassland (PR = fully grazed; R = rabbit grazed; U = un-grazed). Treatment means and model standard error from linear mixed effects model (ANOVA) output. Significant differences between grazing treatments indicated by *(p < 0.05), non significant results by ns.
155
Figure 6.4 RDA triplot showing relationship between environmental variables and distribution of PLFA markers for both salt marsh and sand dune grassland experimental units (Salt marsh: G1-G6 = grazed, U1-U6 = un-grazed; Sand dune grassland: PR1-PR2 = fully, R1-R3 = rabbit grazed, N_U1-N_U3 = un-grazed; black circles = grazed or fully grazed, grey circles = rabbit grazed, white circles = un-grazed). Significant environmental variables (Canoco v.4.5; Monte Carlo test, 500 permutations) have larger, bold font.
157
Figure 6.5 Bacterial growth rate for salt marsh (G = grazed; U = un-grazed) and sand dune grassland (PR = fully grazed; R = rabbit grazed; U = un-grazed). Treatment means, error bars as standard deviation of the mean. Significant differences between grazing treatments indicated by *(p < 0.05), non significant results by ns.
158
Figure 6.6 Conceptual diagram explaining differences in microbial biomass, activity and nutrient cycling between cattle grazed and un-grazed salt marsh.
159
Figure 6.7 Conceptual diagram explaining differences in microbial biomass, activity and nutrient cycling for sand dune
159

xv
grassland grazing treatments (ns = non significant differences).
Figure 7.1 Effects of saltmarsh cattle grazing (a) and sand dune coastal grassland cattle and pony grazing (b) on vegetation, soil and other measured ecosystem characteristics as proxies for ecosystem service delivery. Measured ecosystem characteristics are shown in italics with a significant increase or decrease indicated by arrows (*p < 0.05, **p < 0.1, ***p < 0.001, ns p > 0.05) with grazer removal indicated by arrows, # for expected results from the literature. Solid lines show direct effects between variables, dashed lines show indirect effects to ecosystem services with positive, equal or negative effects indicated within brackets.
174
Figure A7.1 Bulk soil electrical conductivity (ECa), a combined measure of soil saturation, salinity and texture for 0-30 cm soil depth, mapped by geophysical electromagnetic induction (EMI) imaging in October 2010 by David Robinson (CEH). Methods as in Moffett et al. (2010). This map is a close up of the Crossens marsh field site (inset shows wider area) with the fence line marked by a black dashed line and grazed experimental units (G) by G1-G6 and un-grazed (U) by U1-U6.
179
List of tables Table 2.1 Ecosystem services provided by salt marsh and sand dune
habitat ( = low, = medium, = high, composition = functional composition) following the framework of the MA (2005), information based on results of literature review and Jones et al. (2011).
23
Table 3.1 Ecosystem services (S = supporting, P = provisioning, R = regulating, C = cultural) with list of proxy measurements.
42
Table 3.2 Soil and vegetation characteristics, grazing treatment means ± standard deviations with bold letters indicating significant differences at *(p < 0.05) or ***(p < 0.001), ns = non-significant.
49
Table 3.3 Plant species richness and flowering, grazing treatment means ± standard deviations with bold letters indicating significant differences at *(p < 0.05), ns = non-significant.
52
Table A3.1 Invertebrate species counts for all grazing treatments from pitfalls and pan traps (nectar feeders only); COL (Coleoptera), ARA (Araneae), HYM (Hymenoptera), HET (Heteroptera), CHI (Chilopoda), HET (Heteroptera), OPI (Opiliones), DIC (Dictyoptera), ORT (Orthoptera), PUL (Pulmonata), ISO (Isopoda), DIP (Diploda), DER
67

xvi
(Dermaptera), HAP (Haplotaxida); sorted by functional group; PRE (Predatory), ZOO (Zoophagous), OMN (Omnivore), PHY (Phytophagous, (B) Bryophyte feeder), POL (Pollen feeder), DET (Detritivore, (F) Fungivorous, (S) Scavenging), MYR (Myrmecophilous), DUN (Dung feeder), NEC (Nectar feeders) NOT (Not assigned). Spiders; FRH (foliage running hunter), GRH (ground running hunter), SA (Stalker/Ambusher), SWB (Space web builder), OW (Orb weaver), SW (Sheet weaver). N (nationally scarce), RDB3 (Red data book 3 listed), * (associated with coastal dune habitat; Alexander et al., 2005).
Table 4.1 Soil properties and vegetation characteristics measured from the grazed and un-grazed marsh. Sampling depths are presented alongside treatment means ± standard errors, ANOVA results (n = 6), number of replicate samples per experimental unit and month sampled. For vegetation height, for each of the 6 replicates per treatment the mean of 10 measurements was used in the analysis. For vegetation height diversity, CoV = coefficient of variance.
85
Table 4.2 Invertebrate species richness comparison between grazed and un-grazed marsh; Coleoptera, Hemiptera and Araneae combined, separated into orders and at a functional group or prey capture method level. Species richness data are shown by treatment medians ± inter-quartile range, n = 6 in all cases.
86
Table A4.1 Total counts of all invertebrates sampled from grazed ‘G’ and un-grazed ‘U’ marsh. Order, family, species, species authority and common name are listed alongside functional group, prey capture method and coastal specialist information in the ‘Group’ column (evidence for functional group assignment from list of superscript numbers). Order: COL = Coleoptera, HET = Heteroptera, HOM = Homoptera (Heteroptera and Homoptera both sub-orders of Hemiptera), ARA = Araneae, HYM = Hymenoptera, OPI = Opilones, PUL = Pulmonata, LEP = Lepidoptera, HAP = Haplotaxida, COLL = Collembola, ISO = Isopoda, AMP = Amphipoda, ACA = Acarina, DIP = Diptera, + includes larvae, L = larvae only. Group: PRE = predatory, ZOO = zoophagus, PHY = phytophagus, DET = Detritivore (DET (S) = scavenging, DET (F) = fungivorous), NOT = not assigned, FRH = foliage running hunter, GRH = ground running hunter, SWB = Space web builder, SW = Sheet weaver, CS = coastal specialist, N = notable species associated with salt marsh. Invertebrate nomenclature follows Duff (2008) for Coleoptera and Fauna Europea (2011) for all other invertebrates.
106

xvii
Table 5.1 Soil properties and vegetation characteristics measured from the grazed and un-grazed marsh. Sampling depths are presented alongside treatment means ± 95% confidence intervals, ANOVA results (n = 6) and number of replicate samples per experimental unit. For vegetation height, for each of the 6 replicates per treatment the mean of 10 measurements was used in the analysis. Org. mt indicates organic matter. This table includes some results previously published in Ford et al. (2012).
124
Table 6.1 Soil and vegetation characteristics of the salt marsh in grazed and un-grazed experimental units (n = 6)
153
Table 6.2 Soil and vegetation characteristics of the coastal grassland for three grazing treatments (PR = fully grazed, R = rabbit grazed, U = un-grazed; n = 3).
153
Table 6.3 PLFA markers used for taxonomic groups. 154 Table 6.4 Relative proportions of PLFA markers for grazed and un-
grazed saltmarsh soil (n = 6). 154
Table 6.5 Relative proportions of PLFA markers for sand dune grassland soil (PR = fully grazed, R = rabbit grazed, U = un-grazed; n = 3).
155
Table A7.1 Soil properties and vegetation characteristics measured from the grazed and un-grazed salt marsh (Crossens Marsh; Figure 4.2). Treatment means, lme model SE and ANOVA results (n = 6) are presented as in chapter 4. Nectar feeders were analysed with paired t tests in Genstat.
177

Thesis introduction Chapter 1
1
Chapter 1: Thesis introduction
Hilary Ford
1.1 Overview
Coastal grasslands, such as salt marshes and sand dunes, provide many important
ecosystem services including carbon storage, coastal protection and recreation.
Historically, both grassland habitats were commonly used as agricultural livestock
grazing land. Currently, some of these coastal grasslands are ‘conservation grazed’
(i.e. extensively grazed to maximise plant diversity and to provide a suitable habitat
for over-wintering bird species), others have been ‘abandoned’ (i.e. large
herbivores removed) due to the removal of agricultural subsidies or remain
historically ‘un-grazed’. Grazing management of coastal grasslands influences
biological and physical habitat characteristics, ecosystem function, biodiversity and
ecosystem service delivery. Understanding the impact of grazing is therefore vital to
enable future robust management recommendations. Despite key ecological
differences in the two study habitats (salt marshes: high productivity – low plant
diversity; sand dune grasslands: low productivity – high plant diversity) I
hypothesise that (i) grazing intensity will have a common directional effect on
ecosystem characteristics, biodiversity and ecosystem function for both habitats, (ii)
that this in turn will influence final ecosystem service delivery leading to
management trade-offs.

Thesis introduction Chapter 1
2
1.2 Thesis outline
The thesis is divided into seven chapters, and is presented as one review (Chapter
2; not submitted), a series of four experimental research papers (Chapters 3-6) and
an overall thesis discussion (Chapter 7) including a saltmarsh field site salinity map
(Appendix 7.4). The review chapter investigates a current research question ‘Does
biodiversity underpin ecosystem service provision?’ in relation to two coastal
habitats, salt marshes and sand dunes. All four experimental chapters are
concerned with the impact of grazing management on temperate upper salt
marshes and fixed dune grasslands. Firstly, how grazing management affected
ecosystem service provision of sand dune grassland was examined, by measuring a
wide range of biophysical variables as proxies for ecosystem services (Chapter 3).
Secondly, the impact of short sward cattle grazing on the abundance, composition
and diversity of the ground dwelling invertebrate community of an upper salt
marsh was assessed using pitfall traps (Chapter 4). Thirdly, greenhouse gas
emissions from grazed and un-grazed salt marsh were measured using dark static
chambers, monthly for one year. Additionally, below-ground gas sampling tubes
were used to measure soil methane concentrations (Chapter 5). Finally, the
influence of grazing on the soil microbial community of both salt marsh and sand
dune grasslands was measured by microbial biomass (fatty acid phospholipids:
PLFAs) and bacterial growth rate (Leucine incorporation), with links made to
nutrient cycling (Chapter 6). The thesis discussion draws conclusions on the effect
of grazing management on biological and physical habitat characteristics,
biodiversity, ecosystem function and ecosystem service delivery for both salt marsh
and sand dune habitats (Chapter 7). The trade-offs between management for
maximum biodiversity and each set of ecosystem services will also be considered.
1.3 Aims
• Assess the relationship between biodiversity and ecosystem service
provision in salt marshes and sand dunes (Chapter 2)
• Record the impact of grazing on sand dune and salt marsh plant and
invertebrate diversity (Chapters 3 & 4)

Thesis introduction Chapter 1
3
• Find suitable proxies for ecosystem services from measureable biophysical
variables (Chapter 3)
• Understand how grazing management influences ecosystem service
provision of a coastal grassland (Chapter 3)
• Determine how grazing effects salt marsh regulating service of ‘equable
climate’ (Chapter 5)
• Report how grazing influences microbial composition, activity and the
supporting service of ‘nutrient cycling’ in saltmarsh and sand dune
grasslands (Chapter 6)
• Provide a consensus view of grazing management and biodiversity –
ecosystem service trade-offs in two contrasting coastal habitats (Chapter 7)
1.4 Contribution of authors to each chapter
Chapters 1, 2 and 7 are entirely my own work and have not been submitted for
publication. Chapters 3 – 5 are pre-publication versions of three first author papers
with other contributing authors, Angus Garbutt, Laurence Jones & Davey Jones,
listed in chapter headings as they appear in the publishing journal. Chapter 6 is a
modified version of a joint first author paper, with Johannes Rousk, accepted by
Biology and Fertility of Soils. Johannes Rousk undertook the phospholipid fatty acids
(PLFAs) and bacterial growth rate measurements. I carried out all the analysis for
both journal and thesis versions. We were equally responsible for the written text
in the journal version but I wrote > 90% of text for the thesis version. A hyperlink to
each published research paper has been provided on the title page for Chapter 3-6.

Biodiversity and ecosystem services Chapter 2
4
Chapter 2: Does biodiversity underpin ecosystem service provision
in temperate salt marshes and sand dunes? – A review
Hilary Ford
2.1 Introduction
Biodiversity is often used as an indicator of ecosystem health and ecosystem
service provision with conservation priorities allocated accordingly (Egoh et al.,
2007; United Nations Environment Programme: UNEP, 2010; Norris et al.,
2011). It is therefore vital to critically assess just how important biodiversity is
to the provision of ecosystem services within a wide range of habitats.
Ecosystem services are the benefits people obtain from ecosystems (Millennium
Ecosystem Assessment: MA, 2005; Boyd & Banzhaf, 2007), commonly divided
into ‘supporting services’ (soil formation, primary productivity and nutrient
cycling), ‘provisioning services’ (fresh water supply, food, fibre, timber and fuel
products, bio-chemical or genetic resources), ‘regulating services’ (equable
climate, pollution control, flood prevention, invertebrate pollination and pest
regulation) and ‘cultural services’ (recreation, education and aesthetic
appreciation) and valued at US$ 16-54 trillion per annum in the 1990s (Costanza
et al., 1997). Over sixty percent of the world’s ecosystems are degraded or over-
used, and with the global economy and human population set to increase over
the foreseeable future, this trend is likely to continue with a negative effect on
ecosystem service provision (Kettunen & Brink, 2006; Chapman, 2008; UNEP,
2008). It is therefore crucial for both scientists and policy makers to work
effectively together on ecosystem service projects to provide evidence-based
management recommendations for biodiversity conservation and for the

Biodiversity and ecosystem services Chapter 2
5
delivery of ecosystem services (Bonte & Hoffman, 2005; Sutherland et al., 2006;
Ruffo & Kareiva, 2009).
It is commonly stated that biological diversity is key to ecosystem service
provision (Convention on Biological Diversity: CBD, 2000). However, the explicit
role biodiversity plays in the provision of ecosystem services remains unclear
(Hooper et al., 2005; Norris et al., 2011). What is clear is that both biotic and
abiotic factors influence ecosystem service provision. Biotic factors such as
biodiversity, functional diversity and functional composition may influence
ecosystem service delivery, and are underpinned by abiotic factors such as soil
pH, nutrient status, redox potential, temperature, moisture content and
vegetation structure.
2.2 The theory - biodiversity measures and ecosystem function
‘Biodiversity’ is formally defined as ‘the variability among living organisms from
terrestrial, marine and other aquatic ecosystems and the ecological complexes
of which they are part including diversity within species, between species and of
ecosystems’ (CBD, 1992). However, in practice biodiversity is often measured
using either species richness (number of species present within a community),
species evenness (relative abundance of individuals of each species within a
community) or indices such as the Shannon index that incorporate both
diversity and abundance of species (Gaston & Spicer, 1998; Tilman & Lehman,
2001). Both ‘the rivet hypothesis’ (Ehrlich & Ehrlich, 1981) and ‘the diversity-
stability hypothesis’ (Chapin et al., 2000) provide a theoretical basis for the
value of biodiversity to ecosystem function. In brief, each species may react in a
different way to an unfavourable event, such as a drought or disease outbreak,
thus all should be protected under the precautionary principle, providing
greater ecosystem resilience. These theories form the basis of the ‘biodiversity-
ecosystem function hypothesis’ that states that a reduction in biodiversity will
cause a reduction in ecosystem level processes (Srivastava & Vellend, 2005),
defined as supporting services in the MA (2005). Isbell et al. (2011) illustrated
this argument by analysing data from 7 biodiversity experiments and concluding
Biodiversity and ecosystem services Chapter 2
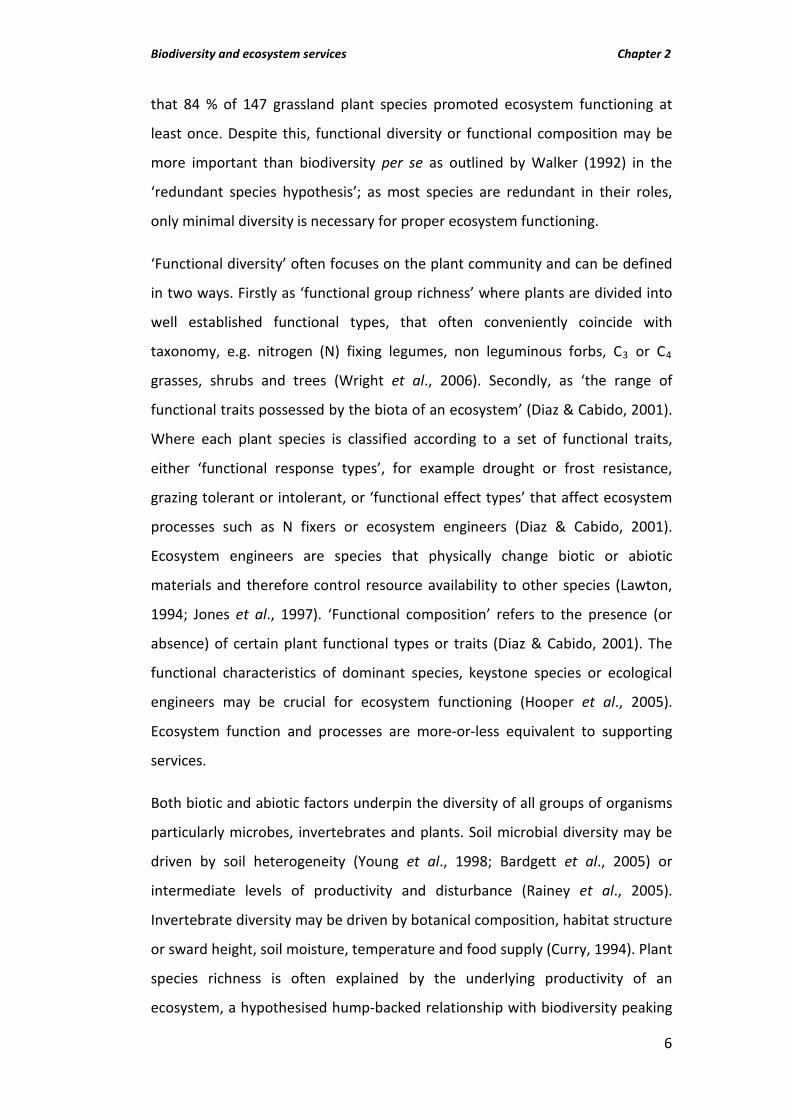
6
that 84 % of 147 grassland plant species promoted ecosystem functioning at
least once. Despite this, functional diversity or functional composition may be
more important than biodiversity per se as outlined by Walker (1992) in the
‘redundant species hypothesis’; as most species are redundant in their roles,
only minimal diversity is necessary for proper ecosystem functioning.
‘Functional diversity’ often focuses on the plant community and can be defined
in two ways. Firstly as ‘functional group richness’ where plants are divided into
well established functional types, that often conveniently coincide with
taxonomy, e.g. nitrogen (N) fixing legumes, non leguminous forbs, C3 or C4
grasses, shrubs and trees (Wright et al., 2006). Secondly, as ‘the range of
functional traits possessed by the biota of an ecosystem’ (Diaz & Cabido, 2001).
Where each plant species is classified according to a set of functional traits,
either ‘functional response types’, for example drought or frost resistance,
grazing tolerant or intolerant, or ‘functional effect types’ that affect ecosystem
processes such as N fixers or ecosystem engineers (Diaz & Cabido, 2001).
Ecosystem engineers are species that physically change biotic or abiotic
materials and therefore control resource availability to other species (Lawton,
1994; Jones et al., 1997). ‘Functional composition’ refers to the presence (or
absence) of certain plant functional types or traits (Diaz & Cabido, 2001). The
functional characteristics of dominant species, keystone species or ecological
engineers may be crucial for ecosystem functioning (Hooper et al., 2005).
Ecosystem function and processes are more-or-less equivalent to supporting
services.
Both biotic and abiotic factors underpin the diversity of all groups of organisms
particularly microbes, invertebrates and plants. Soil microbial diversity may be
driven by soil heterogeneity (Young et al., 1998; Bardgett et al., 2005) or
intermediate levels of productivity and disturbance (Rainey et al., 2005).
Invertebrate diversity may be driven by botanical composition, habitat structure
or sward height, soil moisture, temperature and food supply (Curry, 1994). Plant
species richness is often explained by the underlying productivity of an
ecosystem, a hypothesised hump-backed relationship with biodiversity peaking

Biodiversity and ecosystem services Chapter 2
7
at intermediate levels of ecosystem productivity (Grime, 1973; Gough et al.,
2000; Mittelbach et al., 2001).
2.3 Wider evidence - biodiversity measures, ecosystem function and multiple
ecosystem service provision
The likelihood of biodiversity, functional diversity or functional composition of
an ecosystem influencing ecosystem service provision depends on the
ecosystem service under consideration, ecosystem type and the way in which
biodiversity is measured. For example, most studies focus on supporting
services that are easy to quantity such as primary productivity and aspects of
nutrient cycling. Furthermore, the vast majority of biodiversity - ecosystem
service research is from grassland habitats using plant diversity as a proxy for
total ecosystem biodiversity (Balvanera et al., 2006). In addition, research
focusing on one particular ecosystem function or service and its relationship to
biodiversity may underestimate the diversity required to sustain a multi
functional ecosystem (Hector & Bagchi, 2007). There is also a need for caution,
if ecosystem service protection is put forward as the main reason for
biodiversity protection then any evidence of ecosystem services being provided
by low diversity habitats may lead to less support for nature conservation
(Ridder, 2008).
There are several examples of an overlap between biodiversity and multiple
ecosystem service provision (Odling-Smee, 2005). These associations, however,
do not necessarily indicate causality. Where areas of priority biodiversity
conservation were compared to areas providing major ecosystem services a
positive association between the two was seen for the provisioning service of
fresh water, regulating services of carbon (C) storage and flood control, and the
cultural service of outdoor recreation (Marxan model - Chan et al., 2006).
Biodiversity and provision of ecosystem services such as pollination, C
sequestration, water quality and tourism were also highly correlated in Oregon,
USA (Integrated Valuation of Ecosystem Services and Tradeoffs (InVEST) model:
Nelson et al., 2009). Scenarios that enhanced biodiversity conservation also

Biodiversity and ecosystem services Chapter 2
8
enhanced production of ecosystem services. Balvanera et al. (2006) presented a
meta-analysis of the relationship between biodiversity and ecosystem
functioning using data from experimental studies over the past fifty years. They
analysed 446 measures of biodiversity effects, 252 from grasslands, 319 of
which involved plant manipulations or measurements. They found that
increasing biodiversity at one trophic level generally increased productivity, a
key supporting ecosystem service, at that level. Plant diversity also appeared to
enhance below ground plant and microbial biomass, leading to an increase in
decomposer activity. The BIODEPTH project examined plant diversity and
ecosystem properties in eight grassland plots across Europe (Hector & Bagchi,
2007). As more ecosystem processes or supporting services such as primary
productivity and decomposition or nutrient cycling, were included in their
analysis, more species were found to affect overall functioning. Srivastava &
Vellend (2005) compiled one hundred biodiversity and ecosystem function
studies, half from grasslands and many from mesocosm experiments, and found
that 71 % found a positive effect on diversity on at least one ecosystem function
such as primary productivity, decomposition or invasion resistance.
There is also evidence of a relationship between functional diversity or
composition and ecosystem function or service provision. MacGillivray et al.
(1995) showed that the difference between plant communities in response to
burning, drought and frost were linked to functional plant traits not plant
diversity. Mokany et al. (2008) found that mean functional trait values of plants
explained a larger proportion of variation in five out of eight ecosystem services
than either species diversity or functional diversity. Fornara & Tilman (2008)
demonstrated that in grassland plants, plant functional complementarity, such
as the planting of C4 grass and legume combinations increased the regulating
service of C sequestration via a greater accumulation of soil C. Diaz & Cabido
(2001) looked at 24 mainly grassland systems where species richness, functional
richness and functional composition were related to ecosystem processes.
Functional composition was most likely to influence supporting services such as
above-ground primary productivity. The introduction of an invasive species is a
Biodiversity and ecosystem services Chapter 2
9
common way in which functional composition is altered, with potential
implications for ecosystem service provision. Most ecosystem services rely more
on functional composition than either biodiversity or functional diversity (Wall
et al., 2004; Phoenix et al., 2008; De Deyn et al., 2009; Lavorel & Grigulis, 2012).
2.4 Selected habitats – salt marshes and sand dunes
Salt marshes (Figure 2.1) and coastal sand dunes (Figure 2.2) were chosen as
model habitats for this thesis for three reasons. Firstly, as they are examples of
semi-natural systems where diversity is seen as a ‘good’ or ‘natural’ aspect
worthy of conservation (Jones et al., 2011), particularly in salt marshes
monitored following managed realignment (Garbutt & Boorman, 2009).
Secondly, as coastal habitats they have the potential to provide both terrestrial
and marine ecosystem services. Thirdly, despite the fact they often occur
alongside each other and are examples of successional habitats they vary
enormously in terms of productivity, diversity, potential ecosystem service
provision and available scientific literature. Salt marshes are characterised by
high productivity, low botanical diversity, quantified ecosystem service
provision and plentiful scientific literature (Adam, 1990; Vernberg, 1993; Zedler
& Kercher, 2005). Sand dunes, in contrast, are typified by low productivity, high
botanical and invertebrate diversity, and a largely un-quantified potential to
provide ecosystem services, partly due to the predominance of published sand
dune research within grey literature as opposed to peer-reviewed journals
(Everard et al., 2010).
Salt marshes, along with beaches and mudflats, occur in the temperate coastal
intertidal zone (Figure 2.3), whereas in tropical or sub tropical intertidal zones
mangrove ecosystems predominate (Vernberg, 1993; Mitsch & Gosselink,
2000). They develop where the shore has sufficient shelter to ensure the build
up of sediment from either rivers or the reworking of coastal shelf sediment.
Salt marshes are highly productive, successional, vegetated habitats
characterised by anaerobic conditions during tidal inundation, fluctuating
salinity linked to variable fresh water and salt water inputs and daily and

Biodiversity and ecosystem services Chapter 2
10
seasonal fluctuations of temperature (Mitsch & Gosselink, 2000). Salt marshes
are often typified by low plant diversity, increased slightly with elevation and
grazing management (Daan et al., 2002). Upper and therefore drier zones of
saltmarshes share some characteristics of semi-natural grasslands, such as the
presence of particular grass species also characteristic of terrestrial grasslands
and the occurrence of some generalist grassland invertebrates.
Figure 2.1 Dyfi estuary salt marsh, Wales.
Coastal sand dunes occur at all latitudes from the poles to the tropics (Figure
2.3) but this review deals only with those that fall within the temperate zone.
Sand dunes form where there is a plentiful supply of loose, sandy sediment that
is transported inland by the wind. They form adjacent to sandy beaches above
the storm water level and include the dunes themselves and dune slacks,
sunken areas between dunes that are flooded in winter and spring (Martínez et
al., 2004). Coastal dune systems, like salt marshes, are successional habitats
characterised by particular stresses. Foredune plants need to be capable of
withstanding strong winds, salt spray and sand burial. Further inland succession
begins with sand tolerant grasses and forbs (Wiedemann & Pickart, 2004). Dune

Biodiversity and ecosystem services Chapter 2
11
systems tend to be lacking in nutrients such as N, phosphorus (P) and potassium
(K) leading to low productivity (Willis, 1989). Partly as a result of these stresses,
coastal sand dunes are noted for exceptional plant diversity. For example, sand
dunes in the Netherlands contain 66 % of all recorded Dutch flora (de Vries et
al., 1994). This high species richness may be due to the wide range of ecological
niches present within a dynamic dune system (Willis, 1989). Low levels of
nutrients such as N also allow survival of many stress tolerant plants (Packham
& Willis, 1997). Fixed dune grasslands share some characteristics of other high
diversity semi-natural grasslands (Bullock et al., 2011).
Figure 2.2 Newborough Warren coastal sand dunes, Wales.
Coastal habitats such as salt marshes and sand dunes are at risk from habitat
change, over exploitation, invasive species, pollution and climate change
(Martínez et al., 2004; MA, 2005). They are therefore in need of effective
protection and management. These habitats are often converted to land for
agriculture, forestry, golf courses, housing developments and tourism (Dijkema,
1990; French, 2001; Martínez et al., 2004). Both habitats are also vulnerable to
coastal erosion, particularly where the construction of sea defences interferes

Biodiversity and ecosystem services Chapter 2
12
with sand or sediment supplies (Lee, 2001). Exploitation for ground water, oil,
gas or sediment or sand removal also threatens coastal marshes and dunes
(French, 2001; Kennish, 2001). The introduction of non-natives such as Spartina
anglica for coastal defence has altered the natural communities of many salt
marshes (Gedan et al., 2009). Invasive wetland species tend to form a tall
monoculture leading to a decrease in both plant and animal biodiversity, an
increase in productivity and litter and changes in nutrient cycling (Zedler &
Kercher, 2004). N and P pollution of salt marsh systems has been common over
recent decades (Bakker et al., 1993). Nutrient enrichment may increase
production of vegetation, decrease species richness and lead to eutrophication
(Zedler & Kercher, 2005). Most sand dunes in the UK exceed the critical N load
of 10 kg N ha-1 year-1 due to atmospheric N deposition (Grootjans et al., 2004;
JNCC 2004; Jones et al., 2004). N addition to dune grasslands tends to increase
grass and reduce legume biomass (de Vries et al., 1994; Heijden et al., 2008).
Climate change leading to sea level rise and an increase in temperature or
carbon dioxide (CO2) levels could alter both salt marsh and sand dune habitats
(Pye, 1998; IPCC, 2007).
Coastal dune habitats are considered a ‘priority habitat’ and salt marshes a
‘general habitat in need of conservation’ under annex I of the EU Habitat
Directive (1992). In the US, state laws preserve salt marshes (Vernberg, 1993).
Salt marsh and sand dune management, in common with other semi-natural
grassland habitats, focuses on biodiversity management, particularly for plants
and breeding birds, and specific ecosystem services such as flood defence as
opposed to general ecosystem service provision (Hofstede, 2003; Jones et al.,
2011). Until the 1980s, the majority of coastal dunes throughout Europe were
managed in line with ‘stabilisation’ policies. Dunes were often stabilized via
marram grass, scrub or tree planting. However, management has now shifted
towards a more ‘dynamic approach’ involving grazing and scrub cutting
(Houston, 2005).

Biodiversity and ecosystem services Chapter 2
13
Figure 2.3 Salt marsh and sand dune distribution, based upon Long & Mason (1983), Yang &
Chen (1995) and Martínez et al. (2004).
2.5 Ecosystem services of salt marshes and sand dunes
Salt marsh and sand dune habitats provide a wide variety of ecosystem services.
Ecosystem service provision will be assessed using the framework of the MA
(2005). The evidence relating to the influence of ‘biodiversity’, ‘functional
diversity’ or ‘functional composition’ on service provision will be considered, as
summarised in Table 2.1. Salt marshes are very important for ecosystem service
delivery as they link land, freshwater habitats and the marine environment. Salt
marshes provide ‘supporting services’ (soil formation and nutrient cycling),
‘provisioning services’ (grazing land, haymaking, edible plants, fish and shellfish,
salt and chemical production), ‘regulating services’ (flood and erosion control,
improvement of water quality, C sequestration) and ‘cultural services’
(recreation and education) (Adam, 1990; Vernberg, 1993; Levin et al., 2001;
Zedler & Kercher, 2005; Gedan et al., 2009). Sand dune ecosystem service
provision has been less well studied. But Jones et al. (2011) have identified
several important ecosystem services such as soil formation, flood prevention
and recreation.

Biodiversity and ecosystem services Chapter 2
14
2.5.1 Supporting services
Evidence relating to three supporting services was reviewed: soil formation,
primary productivity and nutrient cycling. Salt marshes and sand dunes are both
successional habitats with the ability to build up and stabilise soil. Soil formation
is essential as without it other services such as nutrient cycling, climate
regulation via soil C storage and flood prevention would not be possible. The
formation of soil is dependent on soil biota (European Academies Science
Advisory Council; EASAC, 2009), an incredibly diverse group (Young et al., 1998),
but it is difficult to directly relate microbial diversity to soil formation. Soil
formation is linked to soil stability. The stabilization of salt marsh and sand dune
sediment or soil relies on microalgal, bacterial, fungal and plant root exudates,
and the physical structure provided by root hairs and algal, fungal and
mycorrhizal filaments (Packham & Willis, 1997; Read, 1989; Underwood, 1997;
Underwood, 2000). Waid (1999) argues that ‘metabiosis’ the theory that one
functional group modifies the environment for another functional group,
increases soil biodiversity and leads to stabilised, functioning soil communities.
Primary productivity is fundamental to all other ecosystem services (EASAC,
2009). Salt marshes are among the most productive habitats in the world
(Vernberg, 1993; Mitsch & Gosselink, 2000; Figure 2.4). Sand dunes, in
comparison, are low productivity systems. Plants tend to be viewed as the main
primary producers, however within salt marshes microphytobenthos, seaweed
and phytoplankton are also important (Simas & Ferreira, 2007) and in sand
dune habitats the algal or microbial mats present in dune slacks also contribute
to primary productivity (Vázquez, 2004). Callaway et al. (2003) experimentally
planted an area of restored Californian salt marsh with 0, 1, 3 or 6 species of salt
marsh plants. They found that communities containing 6 species were most
productive, based upon biomass measurements. However, Salicornia virginica,
when planted alone was comparably productive to multi species plots. C4 plants
such as Spartina anglica, a common invasive plant species, also tend to
photosynthesize rapidly and produce more biomass than native communities
dominated by species such as Juncus gerardii or Festuca rubra (Bakker et al.,

Biodiversity and ecosystem services Chapter 2
15
1993; Packham & Willis, 1997). Even the C3 invasive species of European salt
marshes, Elytrigia athericus, had significantly higher annual net primary
productivity than the original, more diverse, plant communities (Valery et al.,
2004). It is very difficult to find evidence of how plant diversity influences
primary productivity in sand dunes, but the evidence from salt marshes
suggests that functional composition may be more important for the supporting
service of primary productivity than biodiversity.
Figure 2.4 ‘Supporting service’, productive salt marsh habitat, Condor Green marsh, UK.
Nutrient cycling (of N), often measured via the mineralisation of nitrogen by the
soil microbial community, is important as it determines plant available nitrogen
in most habitats, a limiting factor for plant primary productivity (Bardgett et al.,
2011). Decomposition may influence nitrogen cycling positively or negatively,
dependent on the C:N ratio of organic matter substrate available to microbes
(Bardgett, 2005). Decomposition in all soil types, including salt marsh and sand
dune, is carried out by a diverse detrital food web of fungi, bacteria and soil
fauna (Hopkins & Gregorich, 2005; Setälä et al., 2005). In fertile conditions
where plants tend to allocate a large proportion of their C resources to rapid

Biodiversity and ecosystem services Chapter 2
16
growth, the litter produced tends to be high in nitrogen favouring a bacterial
based food web and rapid cycling of nutrients. In less fertile conditions, litter
tends to contain a lower proportion of N, fungi are more able than bacteria to
break down this substrate, so a slow cycling fungal based food web develops
(Wardle, 2005). Soil fauna detritivores, mainly nematodes, mites and
collembola, fragment plant litter whilst feeding on the microflora of fungi and
bacteria present on the litter surface (Schowalter, 2006). Breakdown of organic
matter is rapid in a healthy mature salt marsh; in contrast, detritus in anaerobic
water-logged salt marsh soil decomposes more slowly (Brady & Weil, 1996;
Hazelden & Boorman, 1999). Coastal dunes tend to be characterized by a fairly
low level of decomposition (Kooijman, 2004). As earthworms were only recently
discovered to be part of the decomposer community of coastal dunes, this
illustrates how little is known about the dynamics of the decomposer
community in this habitat (Chamberlain & Butt, 2008).
Wardle (2005) developed the hypothesis that as plant diversity increases, litter
diversity and root exudate diversity will also increase, leading to a rise in
decomposer diversity. Buth (1987) studied root decomposition in Dutch salt
marshes using litter bags. He found that the more species rich root mix from
Puccinellia maritima community decomposed more rapidly than monoculture
stands of Atriplex portulacoides or Spartina anglica. Decomposition rate may
also be influenced by type of dominant vegetation and presence or absence of
invasive species, with high lignin content and low N content indicative of slow
decomposition (Hemminga & Buth, 1991; Koojiman, 2004; Valery et al., 2004).
For the soil detritivore community, soil microcosm experiments indicated
functional dissimilarity amongst detritivore species was positively correlated
with leaf litter loss (Heemsbergen et al., 2004). Plant species composition,
chemical composition of plant litter, microbial abundance and detritivore type
are probably more likely to alter decomposition rates than species richness or
functional diversity per se. The importance of microbial diversity to nutrient
cycling is largely unknown but various molecular techniques involving rRDA,
rDNA and analysis of phospholipid fatty acids (PLFAs; Chapter 6) are being

Biodiversity and ecosystem services Chapter 2
17
increasingly used in an attempt to answer this question (Torsvik & Øvreas,
2002), by linking taxonomic or functional microbial groups to specific soil
processes (Bardgett, 2005).
2.5.2 Provisioning services
Evidence for three provisioning services was reviewed: fresh water, food &
materials, and bio-chemicals & genetic resources. Salt marshes, as saline inter-
tidal environments, do not provide fresh water. Sand dunes, however,
accumulate ground water and can be a potential source of fresh water. Fresh
water can be used for drinking and irrigation. Most notably, The Amsterdam
Water Supply Dunes of The Netherlands have been managed as a drinking
water catchment area since 1874 (Meulen et al., 2004).
Salt marshes provide livestock grazing land for provision of lamb and beef
(Bouchard et al., 2003; Doody, 2008; Figure 2.5) and nursery grounds for fish
such as mullet and sea bass (Mathieson et al., 2000; Veiga et al., 2006). Marsh
plants such as Salicornia europaea may also be collected and eaten (King &
Lester, 1995). Salt marshes were also traditionally used for turf cutting, salt pans
and provision of hay, thatch and rope (Adam, 2000; Bouzille et al., 2001). Sand
dunes are used for grazing, commercial forestry or opportunistic wild food
collecting (Everard et al., 2010). Historically, machair, the coastal grassland
confined to north-west Scotland and north-west Ireland, was used for crops and
grazing, and marram grass was used for animal bedding, basket weaving and
thatching (Angus, 1998; Power et al., 1998). Most products such as food or fibre
harvested from salt marshes or sand dunes are more likely to be influenced by
presence of particular species than biodiversity, particularly in the short term.
At present bio-chemicals and genetic resources are not provided by salt
marshes and sand dune habitats but certain coastal species are currently under
investigation e.g. Sea holly Eryngium maritimum for biomedical use (Everard et
al., 2010; Jones et al., 2011). As sand dunes in particular are diverse habitats
there is potential for exploiting this service in the future.

Biodiversity and ecosystem services Chapter 2
18
Figure 2.5 ‘Provisioning service’, sheep grazing at Ynys Hir marsh, UK.
2.5.3 Regulating services
Four regulating services were investigated: climate regulation, pollution control
and detoxification, flood prevention, and pollination and pest regulation.
Climate regulation refers to the capacity of ecosystems to regulate levels of
greenhouse gases such as CO2, methane (CH4) and nitrous oxide (N2O) (EASAC,
2009). Soils store three times as much carbon as vegetation and are therefore
important in terms of reducing carbon fluxes to the atmosphere (Fitter, 2005;
Hopkins & Gregorich, 2005). Because of their high rates of carbon sequestration
and low CH4 emissions, salt marshes could be very valuable C sinks (Choi &
Wang, 2004; Hussein et al., 2004). It is known, however, that specific wetland
plant species such as Juncus (rushes) vent CH4 via their aerenchyma into the
atmosphere (Adam, 1990; Roslev & King, 1996; Chapter 5). The greenhouse gas
fluxes of sand dune habitats have not been reported, although as dunes are
successional habitats C accumulation is high (Jones et al., 2008; Jones et al.,
2011). It is largely unknown how climate regulation is influenced by biodiversity.
It is more likely that the moisture content, temperature, salinity and

Biodiversity and ecosystem services Chapter 2
19
composition of plant community within salt marsh or sand dune soils will be
more important to greenhouse gas fluctuations than biodiversity.
Salt marshes may improve water quality by acting as a sink of excess nutrients
such as N and P and pollutants such as herbicides, pesticides and heavy metals
(Jickells et al., 2003; Defra / EA, 2005; Alvarez-Rogel et al., 2006; Andrews et al.,
2008). While wetland sediments can act as a sink for certain metals, plants may
transform them to a more bio-available form, making metals available to other
organisms in the food chain (King et al., 2002; Hwang et al., 2008). Even if plants
are effective in sequestering metals in the short term, after the plant dies the
metals may become available again to detritus feeders (Weis & Weis, 2004). It is
often assumed that wetlands provide the best nutrient removal service where
diversity is low and invasive species or fast growing native species dominate
(Zedler & Kercher, 2005). Most studies have focused on the comparison of a
limited number of species, usually the dominant native and the invasive species.
A mesocosm experiment carried out by Herr-Turoff & Zedler (2005) compared
grassland communities with and without the invasive species Phalaris
arundinacea and found that both were equally effective in removing N from
discharged water. Weis & Weis (2004) found that Phragmites australis, an
invasive species in the US sequesters more metal in its roots and releases less
via leaf excretion than the native Spartina alterniflora. In addition, Ravit et al.
(2005) found that S. alterniflora is more likely to make a specific flame retardant
chemical more bioavailable than P. australis due to the greater surface area of
Spartina roots providing an increased habitat for microbial communities that
include those that biotransform contaminants. One particular salt marsh plant,
Atriplex portulacoides, appears to be more mercury tolerant than other salt
marsh species, it retains mercury in root cell walls, effectively immobilizing it
(Valega et al., 2009). Functional composition of plants and the microbial
community seem much more important to the provision of pollution control
and detoxification than biodiversity.
Coastal ecosystems such as salt marshes and sand dunes are very important for
flood control as they form a physical barrier between the land and the sea

Biodiversity and ecosystem services Chapter 2
20
(French, 2001; Doody, 2008; Jones et al., 2011; Figure 2.6). Saltmarshes are
around 30 % more effective at dissipating wave energy than mud flats due to
the presence of vegetation (Möller et al., 1999; Möller et al., 2001; Cooper,
2005). Height, flexibility or leaf pattern of macrophytes are important for wave
attenuation. For example, Spartina anglica was shown to dissipate wave energy
three times more than Zostera anglica due to the stiffness of Spartina leaves,
this is more likely to do with physical characteristics than species diversity
(Bouma et al., 2005). In addition, the value of coastal protection afforded by salt
marsh vegetation is likely to vary seasonally, especially if storms occur when
plant biomass or density are low (Koch et al., 2009). Many coastal dunes in
North America and Europe were planted with marram grass, Ammophilia
arenaria, in place of the natural flora of the foredune, for stabilisation and flood
prevention (Wiedemann & Pickart, 2004). Vegetation type and structure, as
opposed to biodiversity, are more likely to influence the regulating service of
flood prevention.
Figure 2.6 ‘Regulating service’ of flood prevention, Glasson marsh, UK.
Invertebrates are very important for the provision of pollination and pest
regulation (Losey & Vaughan, 2006). Although salt marshes and sand dunes are
not used for commercial crop production, these habitats provide a refuge for a
range of invertebrate pollinators and pest control species, such as spiders and
carabid beetles that may travel to adjacent agricultural areas. Salt marshes

Biodiversity and ecosystem services Chapter 2
21
support an abundant invertebrate community of medium diversity (Chapter 4),
whereas sand dunes support a less abundant but more diverse population
(Chapter 3). The presence of bee pollinators with different functional traits,
related to flower visiting time and behaviour, was found to increase seed set
and crop yield in pumpkins (Hoehn et al., 2008), and wild bee diversity was
linked to effective pollination services for organic crops in California (Kremen et
al., 2002). Biological control of pests is provided by generalist and specialist
predators and parasitoids including spiders, beetles, wasps, nematodes, fungi
and bacteria (Beattie & Ehrlich, 2001; Balmford et al., 2008). The abundance
and diversity of pollinators and invertebrate pest regulators are both likely to be
important in the potential provision of this service (Balmford et al., 2008).
2.5.4 Cultural services
Cultural services include recreation and tourism, education, conservation,
spiritual and aesthetic values (Figure 2.7). These are likely to be enhanced by
bio-diverse habitats (Church et al., 2011). Salt marshes and sand dunes are
important for recreational activities such as bird watching, wildfowling and dog
walking, and as educational models of successional habitats. Salt marshes
provide habitat for a number of bird species such as redshank, lapwing,
oystercatcher, skylark, reed bunting and meadow pipit which use them for
roosting, feeding and breeding (Vernberg, 1993; Defra / EA, 2005; Doody, 2008).
Vegetation sward height is a more important feature of habitat quality for
breeding redshank than the presence of particular plant species (Norris et al.,
1997). Dune systems also provide valuable habitat for breeding birds and
endangered species such as sand lizards, Lacerta agilis, and natterjack toads,
Bufo calamita (Bonte & Hoffmann, 1998; Edmondson & Velmans, 1998).
Spiritual values are more difficult to define although sand dunes are important
to the Maori of New Zealand (Martínez et al., 2004). Visitors to salt marsh or
dune habitats may not always value the natural habitat as might be expected.
Sefton coast visitors put a greater value on an introduced habitat, pinewoods
and their associated red squirrel population than on the ‘natural’ dune habitat
(Edmondson & Velmans, 1998). And within the Meijendel dunes of the

Biodiversity and ecosystem services Chapter 2
22
Netherlands visitors rated an ‘unnatural’ feature most highly, the lakes
constructed for drinking water (Meulen et al., 2004).
Figure 2.7 ‘Cultural services’ of education, recreation and conservation, a break from soil and
vegetation sampling at Crossens marsh, UK.
2.6 Conclusions
Salt marshes are important habitats for the provision of many ecosystem
services, primary productivity, pollution control, flood regulation and
recreational value in particular (Table 2.1). Soil formation, nutrient cycling,
provision of food and fibre and climate regulation services are also provided.
Sand dunes are key habitats for soil formation, climate regulation, flood
prevention and recreation services. Most ecosystem services, ‘supporting’,
‘provisioning’, ‘regulating’ or ‘cultural’ rely more explicitly upon functional
composition rather than either biodiversity or functional diversity for their
delivery. Current evidence highlights two services likely to depend upon
biodiversity, the provisioning service of bio-chemicals and genetic resources and
the regulating services of pollination and pest control.

Biodiversity and ecosystem services Chapter 2
23
Table 2.1 Ecosystem services provided by salt marsh and sand dune habitat ( = low, = medium, = high, composition = functional composition) following the framework of the MA (2005), information based on results of literature review and Jones et al. (2011).
Service Provision by salt marshes
Provision by sand dunes
Importance of biodiversity
How service could be measured
Supporting Soil formation Unknown Amount of top soil formed Primary Productivity Composition Above and below ground net productivity Nutrient cycling Unknown /
Composition N mineralisation
Provisioning Fresh water Unknown Water quantity and quality
Food and materials Composition Total biomass Bio-chemicals and genetic resources
Biodiversity potential
Total amount of useful substances that could be extracted
Regulating Climate regulation Unknown /
Composition Greenhouse gas balance, C stock
Pollution control and detoxification
Composition Accumulation of pollutants in sediment
Flood prevention Composition Water storage capacity, wave dissipation capacity Pollination and pest regulation
Biodiversity / Abundance
Abundance of pollinators or pest regulators, distance to arable fields
Cultural services Recreation, education and spiritual values
Biodiversity Presence of landscape features, number of visitors

Biodiversity and ecosystem services Chapter 2
24
2.7 References
Adam, P. (1990) Saltmarsh ecology. Cambridge University Press, Cambridge.
Adam, P. (2000) Morecambe Bay saltmarshes: 25 years of change. In: British
Saltmarshes (eds B.R. Sherwood, B.G. Gardiner & T. Harris) pp 81-107. Forrest
Text, UK.
Alvarez-Rogel, J., Jimenez-Carceles, F.J. & Nicolas, C.E. (2006) Phosphorus and
nitrogen content in the water of a coastal wetland in the Mar Menor Lagoon (SE
Spain): Relationships with effluents from urban and agricultural areas. Water,
Air and Soil Pollution 173, 21-38.
Andrews, J. E., Samways, G. & Shimmield, G.B. (2008) Historical storage budgets
of organic carbon, nutrient and contaminant elements in saltmarsh sediments:
Biogeochemical context for managed realignment, Humber Estuary, UK. Science
of the Total Environment 405, 1-13.
Angus, S. (1998) The conservation of machair in Scotland: working with people.
In: Coastal dune management. Shared experience of European conservation
practice. Proceedings of the European Symposium Coastal Dunes of the Atlantic
Biogeographical Region. (eds J.A. Houston, S.E. Edmondson & P.J. Rooney) pp
177-191. Liverpool University Press.
Bakker, J.P., Leeuw, J., Dijkema, K.S., Leendertse, P.C., Prins, H.H.T. & Rozema, J.
(1993) Salt marshes along the coast of the Netherlands. Hydrobiologia 265, 73-
95.
Balmford, A., Rodrigues, A., Walpole, M., ten Brink, P., Kettunen, M., Braat, L. &
de Groot, R. (2008) Review on the economics of biodiversity loss: scoping the
science. European Commission.
Balvanera, P., Pfisterer, A.B., Buchmann, N., He, J.-S., Nakashizuka, T., Raffaelli,
D. & Schmid, B. (2006) Quantifying the evidence for biodiversity effects on
ecosystem functioning and services. Ecology Letters 9, 1146-1156.

Biodiversity and ecosystem services Chapter 2
25
Bardgett, R.D. (2005) The Biology of soil: A community and ecosystem approach.
Oxford University Press, Oxford, UK.
Bardgett, R.D., Campbell, C.D., Emmett, B.A., Jenkins, A. & Whitmore, A.P.
(2011) Chapter 13: Supporting services. In: The UK National Ecosystem
Assessment Technical Report, UK National Ecosystem Assessment, UNEP-
WCMC, Cambridge, UK.
Bardgett, R.D., Yeates, G.W. & Anderson, J.M. (2005) Patterns and
derterminants of soil biological diversity. In: Biological diversity and function in
soils (eds R.D. Bardgett, M.B. Usher & D.W. Hopkins) pp 100-118. Cambridge
University Press, UK.
Beattie, A. & Ehrlich, P. (2001) Wild solutions. How biodiversity is money in the
bank. Yale University Press, New Haven and London.
Bonte, D. & Hoffman, M. (1998) A GIS study of breeding bird habitats in the
Flemish coastal dunes and its implications for nature management. In: Coastal
dune management. Shared experience of European conservation practice.
Proceedings of the European Symposium Coastal Dunes of the Atlantic
Biogeographical Region. (eds J.A. Houston, S.E. Edmondson & P.J. Rooney) pp
128-139. Liverpool University Press.
Bonte, D. & Hoffmann, M. (2005) Are coastal dune management actions for
biodiversity restoration and conservation underpinned by internationally
published scientific research? In: Proceedings ‘Dunes and Estuaries 2005’ –
International Conference on Nature Restoration Practices in European Coastal
Habitats, Koksijde, Belgium, 19-23 September 2005 (eds J.-L. Herrier, J. Mees, A.
Salman, J. Seys, H. Van Nieuwenhuyse & I. Dobbelaere) pp 165-178. VLIZ Special
Publication 19.
Bouchard, V., Tessier, M., Digaire, F., Vivier, J., Valery, L., Gloguen, J. & Lefeuvre,
J. (2003) Sheep grazing as management tool in western European saltmarshes.
Comptes Rendus Biologies 326, 148-157.

Biodiversity and ecosystem services Chapter 2
26
Bouma, T. J., De Vries, M.B. Low, E., Peralta, G., Tanczos, I.C., Koppel, J. &
Herman, P.M.J (2005) Trade-offs related to ecoysystem engineering: a case
study on stiffness of emerging macrophytes. Ecology 86, 2187-2199.
Bouzille, J.B., Kerneis, E., Bonis, A. & Touzard, B. (2001) Vegetation and
ecological gradients in abandoned salt pans in western France. Journal of
Vegetation Science 12, 269-278.
Boyd, J. & Banzhaf, S. (2007) What are ecosystem services? The need for
standardized environmental accounting units. Ecological Economics 63, 616-
626.
Brady, N.C. & Weil, R.R. (1996) Nature and properties of soils. Prentice-Hall, Inc.
New Jersey, US.
Bullock, J.M., Jefferson, R.G., Blackstock, T.H., Pakeman, R.J., Emmett, B.A.,
Pywell, R.J., Grime, J.P. & Silverton, J. (2011) Chapter 6: Semi-natural grasslands.
In: The UK National Ecosystem Assessment Technical Report, UK National
Ecosystem Assessment, UNEP-WCMC, Cambridge, UK.
Buth, G.J.C. (1987) Decomposition of roots of three plant communities in a
Dutch salt marsh. Aquatic Botany 29, 123-138.
Callaway, J. C., Sullivan, G. & Zedler, J.B. (2003) Species-rich plantings increase
biomass and nitrogen accumulation in a wetland restoration experiment.
Ecological Applications 13, 1626-1639.
CBD (Convention on Biological Diversity) (1992) Convention on biological
diversity (with annexes). Concluded at Rio de Janeiro on 5 June 1992.
Secretariat of the Convention on Biological Diversity.
CBD (2000) Sustaining life on Earth. How the Convention on Biological Diversity
promotes nature and human well-being. Secretariat of the Convention on
Biological Diversity.

Biodiversity and ecosystem services Chapter 2
27
Chamberlain, E.J. & Butt, K.R. (2008) Distribution of earthworms and influence
of soil properties across a successional sand dune ecosystem in NW England.
European Journal of Soil Biology 44, 554-558.
Chan, K.M.A., Shaw, M.R., Cameron, D.R., Underwood, E.C. & Daily, G.C. (2006)
Conservation planning for ecosystem services. PLoS Biology 4, 2138-2152.
Chapin, F.S., Zavaleta, E.S., Eviner, V.T., Naylor, R.L., Vitousek, P.M., Reynolds,
H.L., Hooper, D.U., Lavorel, S., Sala, O.E., Hobbie, S.E., Mack, M.C. & Diaz, S.
(2000) Consequences of changing biodiversity. Nature 405, 234-242.
Chapman, P. M. (2008) Ecosystem services - assessment endpoints for scientific
investigations. Marine Pollution Bulletin 56, 1237-1238.
Choi, Y. & Wang, Y. (2004) Dynamics of carbon sequestration in a coastal
wetland using radiocarbon measurements. Global Biogeochemical Cycles 18, 1-
12.
Church, A., Burgess, J., Ravenscroft, N., Bird, W., Blackstock, K., Brady, E., Crang,
M., Fish, R., Gruffudd, P., Mourato, S., Pretty, J., Tolia-Kelly, D., Turner, K. &
Winter M. (2011) Chapter 16: Cultural services. In: The UK National Ecosystem
Assessment Technical Report, UK National Ecosystem Assessment, UNEP-
WCMC, Cambridge, UK.
Costanza, R., d’Arge, R., Groot, R., Farber, S., Grasso, M., Hannon, B., Limburg,
K., Naeem, S., O’Neill, R.V., Paruelo, J., Raskin, R.G., Sutton, P. & Belt, M. (1997)
The value of the world’s ecosystem services and natural capital. Nature 387,
253-260.
Cooper, N.J. (2005) Wave dissipation across intertidal surfaces in the Wash tidal
inlet, eastern England. Journal of Coastal Research 21, 28-48.
Curry, J.P. (1994) Grassland invertebrates. Ecology, influence on soil fertility and
effects on plant growth. Chapman & Hall, London.

Biodiversity and ecosystem services Chapter 2
28
Daan, B., Bakker, J.P., de Vries, Y. & van Lieshout, S. (2002) Long-term
vegetation changes in experimentally grazed and ungrazed back-barrier
marshes in the Wadden Sea. Applied Vegetation Science 5, 45-54.
De Deyn, G.B., Quirk, H., Yi, Z., Oakley, S., Ostle, N.J. & Bardgett, R.D. (2009)
Vegetation composition promotes carbon and nitrogen storage in model
grassland communities of contrasting soil fertility. Journal of Ecology 97, 864-
875.
Defra / EA (2005) Joint Defra / EA Flood and Coastal Erosion Risk Management R
& D Programme. Saltmarsh Management Manual. Environment Agency, UK.
Diaz, S. & Cabido, M. (2001) Vive la différence: plant functional diversity matters
to ecosystem processes. Trends in Ecology & Evolution 16, 646-655.
Dijkema, K.S. (1990) Salt and brackish marshes around the Baltic Sea and
adjacent parts of the North Sea: Their vegetation and management. Biological
Conservation 51, 191-209.
Doody, J.P. (2008) Saltmarsh Conservation, Management and Restoration.
Springer.
EASAC (European Academies Science Advisory Council) (2009) Ecosystem
Services and biodiversity in Europe. The Royal Society, London.
Edmondson, S.E. & Velmans, C. (1998) Public perception of nature management
on a sand dune system. In: Coastal dune management. Shared experience of
European conservation practice. Proceedings of the European Symposium
Coastal Dunes of the Atlantic Biogeographical Region. (eds J.A. Houston, S.E.
Edmondson & P.J. Rooney) pp 206-218. Liverpool University Press.
Egoh, B., Rouget, M., Reyers, B., Knight, A.T., Cowling, R.M., Jaarsveld, A.S. &
Welz, A. (2007) Integrating ecosystem services into conservation assessments: A
review. Ecological Economics 63, 714-721.

Biodiversity and ecosystem services Chapter 2
29
Ehrlich, P.R. & Ehrlich, A.H. (1981) Extinction: The causes and consequences of
the disappearance of species. Random House, New York, USA.
EU Habitat Directive (1992) Council Directive 92/43/EEC of 21 May 1992 on the
conservation of natural habitats and of wild fauna and flora.
Everard, M., Jones, L. & Watts, B. (2010) Have we neglected the societal
importance of sand dunes? An ecosystem services perspective. Aquatic
Conservation: Marine and Freshwater Ecosystems 20, 476-487.
Fitter, A.H. (2005) Darkness visible: reflections on underground ecology. Journal
of Ecology 93, 231-243.
Fornara, D.A. & Tilman, D. (2008) Plant functional composition influences rates
of soil carbon and nitrogen accumulation. Journal of Ecology 96, 314-322.
French, P.W. (2001) Coastal Defences. Processes, problems and solutions.
Routledge, London and New York.
Garbutt, A. & Boorman, L.A. (2009) Managed Realignment: Re-creating
intertidal habitats on formerly reclaimed land. In: Coastal Wetlands, an
integrated ecosystem approach (eds G.M.E. Perillo, E. Welanski, D.R. Cahoon &
M.M. Brinson) pp 763-785. Elsevier, Oxford, UK.
Gaston, K.J. & Spicer, J.I. (1998) Biodiversity, an Introduction. Blackwell Science
Ltd.
Gedan, K.B., Silliman, B.R. & Bertness, M.D. (2009) Centuries of human-driven
change in salt marsh ecosystems. Annual Review of Marine Science 1, 117-141.
Gough, L., Osenberg, C.W., Gross, K.L. & Collins, S.L. (2000) Fertilization effects
on species density and primary productivity in herbaceous plant communities.
Oikos 89, 428-439.
Grime, J.P. (1973) Control of species density in herbaceous vegetation. Journal
of Environmental Management 1, 151–167.

Biodiversity and ecosystem services Chapter 2
30
Grootjans, A.P., Adema, E.B., Bekker, R.M. & Lammerts, E.J. (2004) Why Young
Coastal Dune Slacks Sustain a High Biodiversity. In: Coastal Dunes, Ecology and
Conservation (eds M.L. Martínez & N.P. Psuty) pp 85-101. Springer.
Hazelden, J. & Boorman, L.A. (1999) The role of soil and vegetation processes in
the control of organic and mineral fluxes in some western European salt
marshes. Journal of Coastal Research 15, 15-31.
Herr-Turoff, A. & Zedler, J. (2005) Does wet prairie vegetation retain more
nitrogen with or without Phalaris arundinacea invasion? Plant and Soil 277, 19-
34.
Hector, A. & Bagchi, R. (2007) Biodiversity and ecosystem multifunctionality.
Nature 448, 188-191.
Heemsbergen, D.A., Berg, M.P., Loreau, M., van Hal, J.R., Faber, J.H. & Verhoef,
H.A. (2004) Biodiversity effects on soil processes explained by interspecific
functional dissimilarity. Science 306, 1019-1020.
Heijden, M.G.A., Verkade, S. & Bruin, S.J. (2008) Mycorrhizal fungi reduce the
negative effects of nitrogen enrichment on plant community structure in dune
grassland. Global Change Biology 14, 2626-2635.
Hemminga, M.A. & Buth, G.J.C. (1991) Decomposition in salt marsh ecosystems
of the S.W. Netherlands: the effects of biotic and abiotic factors. Vegetatio 92,
73-83.
Hoehn, P., Tscharntke, T., Tylianakis, J.M. & Steffan-Dewenter, I. (2008)
Functional group diversity of bee pollinators increases crop yield. Proceedings of
the Royal Society B 275, 2283-2291.
Hofstede, J.L.A. (2003) Integrated management of artificially created salt
marshes in the Wadden Sea of Schleswig-Holstein, Germany. Wetlands Ecology
and Management 11, 183-194.
Biodiversity and ecosystem services Chapter 2
31
Hooper, D. U., Chapin, F.S., Ewel, J.J., Hector, A., Inchausti, P., Lavorel, S.,
Lawton, J.H., Lodge, D.M., Loreau, M., Naeem, S., Schmid, B., Setala, H.,
Symstad, A.J., Vandermeer, J. & Wardle, D.A. (2005) Effects of biodiversity on
ecosystem functioning: A consensus of current knowledge. Ecological
Monographs 75, 3-35.
Hopkins, D.W. & Gregorich, E.G. (2005) Carbon as a substrate for soil organisms.
Biological Diversity and Function in Soils (eds R.D. Bardgett, M.B. Usher & D.W.
Hopkins) pp 57-82. Cambridge University Press, UK.
Houston, J. (2005) The conservation of sand dunes in the Atlantic
Biogeographical Region: the contribution of the LIFE programme. In:
Proceedings ‘Dunes and Estuaries 2005’ – International Conference on Nature
Restoration Practices in European Coastal Habitats, Koksijde, Belgium, 19-23
September 2005 (eds J.-L. Herrier, J. Mees, A. Salman, J. Seys, H. Van
Nieuwenhuyse & I. Dobbelaere) pp 165-178. VLIZ Special Publication 19.
Hussein, A.H., Rabenhorst, M.C. & Tucker, M.L. (2004) Modeling of carbon
sequestration in coastal marsh soils. Soil Science Society of America Journal 68,
1786-1795.
Hwang, H.M., Green, P.G. & Young, T.M. (2008) Tidal salt marsh sediment in
California, USA: Part 3. Current and historic toxicity potential of contaminants
and their bioaccumulation. Chemosphere 71, 2139-2149.
IPCC (2007) Climate change 2007: Synthesis report. Contribution of working
groups I, II and III to the fourth assessment report of the intergovernmental
panel on climate change (eds R.K. Pachauri & A. Reisinger). IPCC, Geneva,
Switzerland, 104pp.
Isbell, F., Calcagno, V., Hector, A., et al (2011). High plant diversity is needed to
maintain ecosystem services. Nature 477, 199-202.
Jickells, T., Andrews, J., Cave, R. & Parkes, D. (2003) A Case Study of the Humber
Estuary. In: Wetland valuation: State of the Art and Opportunities for Further

Biodiversity and ecosystem services Chapter 2
32
Development. Proceedings of a workshop organised for the Environment
Agency by Environmental Futures Ltd and CSERGE, pp 61-72. University of East
Anglia, Norwich, UK.
JNCC (2004) Common Standards Monitoring Guidance for Sand dune Habitats.
Version August 2004. Joint Nature Conservation Committee. ISSN 1743-8160
(online).
Jones, C.G., Lawton, J.H. & Shachak, M. (1997) Positive and negative effects of
organisms as physical ecosystem engineers. Ecology 78, 1946-1957.
Jones, L., Angus, S., Cooper, A., Doody, P., Everard, M., Garbutt, A., Gilchrist, P.,
Hansom, J., Nicholls, R., Pye, K., Ravenscroft, N., Rees, S., Rhind, P. &
Whitehouse, A. (2011) Chapter 11: Coastal margins. In: The UK National
Ecosystem Assessment Technical Report, UK National Ecosystem Assessment,
UNEP-WCMC, Cambridge, UK.
Jones, M.L.M., Sowerby, A., Williams, D.L. & Jones, R.E. (2008) Factors
controlling soil development in sand dunes: evidence from a coastal dune soil
chronosequence. Plant and Soil 307, 219-234.
Jones, M.L.M, Wallace, H.L., Norris, D., Brittain, A., Haria, S., Jones, R.E., Rhind,
P.M., Reynolds, B.R. & Emmett, B.A. (2004) Changes in vegetation and soil
characteristics in coastal sand dunes along a gradient of atmospheric nitrogen
deposition. Plant Biology 6, 598-605.
Kennish, M.J. (2001) Coastal salt marsh systems in the U.S.: A review of
anthropogenic impacts. Journal of Coastal Research 17, 731-748.
Kettunen, M. & ten Brink, P. (2006) Value of biodiversity. Documenting EU
examples where biodiversity loss has led to the loss of ecosystem services. Final
report for the European Commission. Institute for European Environmental
Policy (IEEP) Brussels, Belgium.

Biodiversity and ecosystem services Chapter 2
33
King, J.K., Harmon, S.M., Fu, T.T. & Gladden, J.B. (2002) Mercury removal,
methylmercury formation, and sulfate-reducing bacteria profiles in wetland
mesocosms. Chemosphere 46, 859-870.
King, S.E. & Lester, J.N. (1995) The value of salt marsh as a sea defence. Marine
Pollution Bulletin 30, 180-189.
Koch, E.W., Barbier, E.B., Silliman, B.R., Reed, D.J., Perillo, G.M.E., Hacker, S.D.,
Granek, E.F., Primavera, J.H., Muthiga, N., Polasky, S., Halpern, B.S., Kennedy,
C.J., Kappel, C.V. & Wolanski, E. (2009) Non-linearity in ecosystem services:
temporal and spatial variability in coastal protection. Frontiers in Ecology and
the Environment 7, 29-37.
Kooijman, A.M. (2004) Environmental Problems and Restoration Measures in
Coastal Dunes in The Netherlands. In: Coastal Dunes, Ecology and Conservation
(eds M.L. Martínez & N.P. Psuty) pp 243-258. Springer.
Kremen, C., Williams, N.M. & Thorp, R.W. (2002) Crop pollination from native
bees at risk from agricultural intensification. Proceedings of the National
Academy of Science 99, 16812-16816.
Lawton, J.H. (1994) What do species do in ecosystems? Oikos 71, 367-374.
Lavorel, S. & Grigulis, K. (2012) How fundamental plant functional trait
relationships scale-up to trade-offs and synergies in ecosystem services. Journal
of Ecology 100, 128–140.
Lee, M. (2001) Coastal defence and the Habitats Directive: predictions of habitat
change in England and Wales. The Geographical Journal 167, 39-56.
Levin, L. A., Boesch, D.F., Covich, A., Dahm, C., Erseus, C., Ewel, K.C., Kneib, R.T.,
Moldenke, A., Palmer, M.A., Snelgrove, P., Strayer, D. & Weslawski, J.M. (2001)
The function of marine critical transition zones and the importance of sediment
biodiversity. Ecosystems 4, 430-451.

Biodiversity and ecosystem services Chapter 2
34
Long, S.P. & Mason, C.F. (1983) Saltmarsh ecology. Blackie and son limited,
London.
Losey, J. E. & Vaughan, M. (2006) The economic value of ecological services
provided by insects. Bioscience 56, 311-323.
MacGillivray, C.W. & Grime, J.P. (1995) Testing predictions of the resistance and
resilience of vegetation subjected to extreme events. Functional Ecology 9, 640-
649.
Martínez, M.L., Psuty, N.P. & Lubke, R.A. (2004) A perspective on coastal dunes.
In: Coastal Dunes, Ecology and Conservation (eds. M.L. Martínez & N.P. Psuty)
pp 3-10. Springer.
Mathieson, S., Cattrijsse, A., Costa, M.J., Drake, P., Elliott, M., Gardner, J. &
Marchand, J. (2000) Fish assemblages of European tidal marshes: a comparison
based on species, families and functional guilds. Marine Ecology-Progress Series
204, 225-242.
Millenium Ecosystem Assessment (2005) Ecosystems and human well-being:
Synthesis Millennium Ecosystem Assessment. Island Press, Washington DC.
Meulen, F., Bakker, T.W.M. & Houston, J.A. (2004) The costs of Our coasts:
examples of dynamic dune management from western Europe. Coastal Dunes,
Ecology and Conservation (eds M.L. Martínez & N.P. Psuty) pp 259-277.
Springer.
Mitsch, W.J. & Gosselink, J.G. (2000) Wetlands. John Wiley & Sons, Inc.
Mittelbach, G.G., Steiner, C.F., Scheiner, S.M., Gross, K.L., Reynolds, H.L., Waide,
R.B., Willig, M.R., Dodson, S.I. & Gough, L. (2001) What is the observed
relationship between species richness and productivity? Ecology 82, 2381-2396.
Mokany, K., Ash, J. & Roxburgh, S. (2008) Functional identity is more important
than diversity in influencing ecosystem processes in a temperate native
grassland. Journal of Ecology 96, 884-893.

Biodiversity and ecosystem services Chapter 2
35
Möller, I., Spencer, T., French, J.R., Leggett, D.J. & Dixon, M. (1999) Wave
transformation over salt marshes: A field and numerical modelling study from
north Norfolk, England. Estuarine Coastal and Shelf Science 49, 411-426.
Möller, I., Spencer, T., French, J.R., Leggett, D.J. & Dixon, M. (2001) The sea-
defence value of salt marshes: field evidence from north Norfolk. Journal of the
Chartered Institution of Water and Environmental Management 15, 109-116.
Nelson, E., Mendoza, G., Regetz, J., Polasky, S., Tallis, H., Cameron, D.R., Chan,
K.M.A., Daily, G.C., Goldstein, J., Kareiva, P.M., Lonsdorf, E., Naidoo, R., Ricketts,
T.H. & Shaw, M.R. (2009) Modelling multiple ecosystem services, biodiversity
conservation, commodity production, and tradeoffs at landscape scales.
Frontiers in Ecology and the Environment 7, 4-11.
Norris, K., Bailey, M. et al. (2011) Chapter 4: Biodiversity in the Context of
Ecosystem Services. In: The UK National Ecosystem Assessment Technical
Report, UK National Ecosystem Assessment, UNEP-WCMC, Cambridge, UK.
Norris, K., Cook, T., O'Dowd, B. & Durbin, C. (1997) The density of redshank
Tringa totanus breeding on the salt-marshes of the Wash in relation to habitat
and its grazing management. Journal of Applied Ecology 34, 999-1013.
Odling-Smee, L. (2005) Dollars and sense. Nature 437, 614-616.
Packham, J.R. & Willis, A.J. (1997) Ecology of Dunes, Salt Marsh and Shingle.
Chapman & Hall, London.
Phoenix, G.K., Johnson, D., Grime, J.P. & Booth, R.E. (2008) Sustaining
ecosystem services in ancient limestone grassland: importance of major
component plants and community composition. Journal of Ecology 96, 894-902.
Power, J., Cooper, J.A.G., McGourty, J., McKenna, J., MacLeod, M.J. & Convie, G.
(1998) A LIFE-ICZM demonstration project for Irish beaches and sand dunes. In:
Coastal dune management. Shared experience of European Conservation
Practice. Proceedings of the European Symposium Coastal Dunes of the Atlantic
Biodiversity and ecosystem services Chapter 2
36
Biogeographical Region. (eds J.A. Houston, S.E. Edmondson & P.J. Rooney) pp
24-33. Liverpool University Press.
Pye, K. (1998) Long-term geomorphological changes and how they may affect
the dune coasts of Europe. In: Coastal dune management. Shared experience of
European Conservation Practice. Proceedings of the European Symposium
Coastal Dunes of the Atlantic Biogeographical Region. (eds J.A. Houston, S.E.
Edmondson & P.J. Rooney) pp 17-23. Liverpool University Press.
Rainey, P.B., Brockhurst, M., Buckling, A., Hodgson, D.J. & Kassen, R. (2005) The
use of model Pseudomonas florescens populations to study the causes and
consequences of microbial diversity. In: Biological diversity and function in soils
(eds R.D. Bardgett, M.B. Usher & D.W. Hopkins) pp 83-99. Cambridge University
Press, UK.
Ravit, B., Ehrenfeld, J.G. & Haggblom, M.M. (2005) Salt marsh rhizosphere
affects microbial biotransformation of the widespread halogenated
contaminant tetrabromobisphenol-A (TBBPA). Soil Biology & Biochemistry 37,
1049-1057.
Read, D.J. (1989) Mycorrhizas and nutrient cycling in sand dune ecosystems.
Symposium on coastal sand dunes, May 17-19, 1989, Edinburgh, Scotland.
Proceedings of the Royal Society of Edinburgh Section B – Biological Sciences 96,
89-110.
Ridder, B. (2008) Questioning the ecosystem services argument for biodiversity
conservation. Biodiversity Conservation 17, 781-790.
Roslev, P. & King, G.M. (1996) Regulation of methane oxidation in a freshwater
wetland by water table changes and anoxia. FEMS Microbiology Ecology 19,
105–115.
Ruffo, S. & Kareiva, P.M. (2009) Using science to assign value to nature.
Frontiers in Ecology and the Environment 7, 3-3.

Biodiversity and ecosystem services Chapter 2
37
Schowalter, T.D. (2006) Insect ecology an ecosystem approach. Elsevier,
London.
Setälä, H., Berg, M.P. & Jones, T.H. (2005) Trophic structure and functional
redundancy in soil communities. Biological diversity and function in soils (eds
R.D. Bardgett, M.B. Usher & D.W. Hopkins) pp 236-249. Cambridge University
Press, UK.
Simas, T. C. & Ferreira, J.G. (2007) Nutrient enrichment and the role of salt
marshes in the Tagus estuary (Portugal). Estuarine Coastal and Shelf Science 75,
393-407.
Srivastava, D. S. & Vellend, M. (2005) Biodiversity-ecosystem function research:
is it relevant to conservation? Annual Review of Ecology, Evolution, and
Systematics 36, 267-294.
Sutherland, W.J, Armstrong-Brown et al. (2006) The identification of 100
ecological questions of high policy relevance in the UK. Journal of Applied
Ecology 43, 617-627.
Tilman, D. & Lehman, C. (2001) Biodiversity, composition, and ecosystem
processes: theory and concepts. In: The functional consequences of biodiversity:
empirical progress and theoretical extensions. (eds A.P. Kinzig, S.W. Pacala & D.
Tilman) pp 9-41. Princeton University Press, Princeton and Oxford.
Underwood, G.J.C. (1997) Microalgal colonization in a saltmarsh restoration
scheme. Estuarine Coastal and Shelf Science 44, 471-481.
Underwood, G.J.C. (2000) Changes in microalgal species composition,
biostabilisation potential and succession during saltmarsh restoration. In: British
Saltmarshes (eds B.R. Sherwood, B.G. Gardiner & T. Harris) pp 143-154. Forrest
Text, UK.
United Nations Environment Programme (2008) The economics of ecosystems &
biodiversity loss. An interim report. European communities, A Banson
Production, Cambridge, UK.

Biodiversity and ecosystem services Chapter 2
38
United Nations Environment Programme (2010) Analysis of the assessment
landscape for biodiversity and ecosystem service, Executive summary. Third ad
hoc intergovernmental and multi-stakeholder meeting on an intergovernmental
science- policy platform on biodiversity and ecosystem services. Busan, Republic
of Korea, 7–11 June 2010.
Válega, M., Lima, A.I.G., Figueira, E.M.A.P., Pereira, E., Pardal, M.A. & Duarte,
A.C. (2009) Mercury intracellular partitioning and chelation in a salt marsh
plant, Halimione portulacoides (L.) Aellen: Strategies underlying tolerance in
environmental exposure. Chemosphere 74, 530-536.
Valery, L., Bouchard, V. & Lefeuvre, J-C. (2004) Impact of the invasive native
species Elymus athericus on carbon pools in a salt marsh. Wetlands 24, 268-276.
Vázquez, G. (2004) The role of algal mats on community succession in dunes and
dune slacks. In: Coastal Dunes, Ecology and Conservation (eds M.L. Martínez &
N.P. Psuty) pp 189-203. Springer.
Vernberg, F.J. (1993) Salt-marsh processes – a review. Environmental Toxicology
and Chemistry 12, 2167-2195.
de Vries, W., Klijn, J.A. & Kros, J. (1994) Simulation of the long-term impact of
atmospheric deposition on dune ecosystems in the Netherlands. The Journal of
Applied Ecology 31, 59-73.
Waid, J. S. (1999) Does soil biodiversity depend upon metabiotic activity and
influences? Applied Soil Ecology 13, 151-158.
Walker, B. H. (1992) Biodiversity and ecological redundancy. Conservation
Biology 6, 18-23.
Wall, D.H., Bardgett, R.D., Covich, A.P. & Snelgrove, P.U.R. (2004) Understanding
the functions of biodiversity in soils and sediments will enhance global
ecosystem sustainability and societal well-being. In: Sustaining biodiversity and
ecosystem services in soils and sediments (ed D.H. Wall) pp 249-254. Island
Press, USA.

Biodiversity and ecosystem services Chapter 2
39
Wardle, D.A. (2005) How plant communities influence decomposer
communities. In: Biological diversity and function in soils (eds R.D. Bardgett,
M.B. Usher & D.W. Hopkins) pp 119-138. Cambridge University Press, UK.
Weis, J.S. & Weis, P. (2004) Metal uptake, transport and release by wetland
plants: implications for phytoremediation and restoration. Environment
International 30, 685-700.
Wiedemann, A.M. & Pickart, A.J. (2004) Temperate zone coastal dunes. In:
Coastal Dunes, Ecology and Conservation (eds M.L. Martínez & N.P. Psuty) pp
53-65. Springer.
Willis, A.J. (1989) Coastal sand dunes as biological-systems. Symposium on
coastal sand dunes, May 17-19, 1989, Edinburgh, Scotland. Proceedings of the
Royal Society of Edinburgh Section B – Biological Sciences 96, 17-18.
Wright, J. P., Naeem, S., Hector, A., Lehman, C., Reich, P.B., Schmid, B. & Tilman,
D. (2006) Conventional functional classification schemes underestimate the
relationship with ecosystem functioning. Ecology Letters 9, 111-120.
Yang, S. & Chen, J. (1995) Coastal salt marshes and mangrove swamps in China.
Chinese Journal of Oceanological Limnology 13, 318-324.
Young, I.M., Blanchart, E., Chenu, C., Dangerfield, M., Fragoso, C., Grimaldi, M.,
Ingram, J. & Monrozier, L.J. (1998) The interaction of soil biota and soil structure
under global change. Global Change Biology 4, 703-712.
Zedler, J. B. & Kercher, S. (2004) Causes and consequences of invasive plants in
wetlands: opportunities, opportunists, and outcomes. Critical Reviews in Plant
Sciences 23, 431-452.
Zedler, J.B. & Kercher, S. (2005) Wetland resources: Status, trends, ecosystem
services, and restorability. Annual Review of Environment and Resources 30, 39-
74.

Grassland grazing and ecosystem services Chapter 3
40
Chapter 3: Impacts of grazing abandonment on ecosystem service
provision: coastal grassland as a model system
Hilary Ford, Angus Garbutt, Davey L. Jones & Laurence Jones
Accepted for publication in Agriculture, Ecosystems & Environment
http://dx.doi.org/10.1016/j.agee.2012.09.003
3.1 Abstract
A coastal grassland was used as a model system to examine how grazing
management, un-grazed (for six years), rabbit grazed or fully grazed (ponies 0.2 ha-
1, cattle 0.05 ha-1 and rabbits 45 ha-1), affected biodiversity and ecosystem service
provision, by measuring an extensive suite of biophysical variables as proxies for
ecosystem services. For ‘supporting services’, nutrient cycling was greatest in un-
grazed grassland but primary productivity did not differ. The ‘provisioning service’
of food production was only provided by fully grazed grassland. For grazing effects
on ‘regulating services’ total carbon (C) stock did not differ and effects on pest
regulating invertebrates and pollinator abundance were variable. The potential for
flood control was considered greatest in the un-grazed grassland; with faster water
infiltration than in the fully grazed grassland. The ‘cultural service’ of environmental
appreciation was considered higher in fully grazed grassland due to significantly
greater plant species richness, more forb species and more forbs flowering than in
un-grazed grassland.
Key-words: biodiversity, conservation, ecosystem function, management, semi-
natural grassland, trade-offs

Grassland grazing and ecosystem services Chapter 3
41
3.2 Introduction
Grassland management for multiple ecosystem services often results in potential
conflicts or trade-offs (Macleod and McIvor, 2006). This is important as many
ecosystem services are delivered by semi-natural grasslands (Bullock et al., 2011;
Table 3.1); “supporting services” (primary productivity and nutrient cycling);
“provisioning services” (food production, preservation of the genetic diversity of
wild species and fresh water supply); “regulating services”, (maintenance of an
equable climate, water storage, pest regulation and pollination) and “cultural
services” (conservation status, environmental appreciation and recreation). In
managed grasslands, the basic trade-off is between intensive management to
maximise food production and extensive management resulting in lower
production, but increased biodiversity and a wider range of cultural services
(Power, 2010). Semi-natural, low productivity grasslands, traditionally used for low
intensity cattle and sheep farming, have declined by 90 % in the UK since 1945,
converted to intensive production by drainage and fertilisation (Bullock et al.,
2011). In many parts of Europe they now face a further threat, with managed
grazing of these habitats being ‘abandoned’ in both the uplands and lowlands due
to the removal of European Union (EU) subsidies (Strijker, 2005). Policy makers
have signed up to halt biodiversity loss and degradation of ecosystem services
within the EU by 2020 and to adopt an integrated approach to land use
management (Kleijn et al., 2011). It is therefore vital to assess how abandonment of
low productivity grazing land impacts on biodiversity, ecosystem function and
potential consequences for ecosystem service provision.
The effects of removing large herbivores (i.e. cattle, sheep or horses) are well
understood for grassland biodiversity and ecosystem function, but the implications
for wider ecosystem service provision have been poorly quantified, or not
quantified at all, especially for multiple services (Power, 2010). Grazing removal
decreases plant diversity (Pykälä, 2003), increases invertebrate and small mammal
abundance and diversity (Morris, 2000; Schmidt et al., 2005), and can either
increase or decrease bird abundance and diversity dependent on feeding and
nesting sward requirements (Vickery et al., 2001). Where large grazers are removed

Grassland grazing and ecosystem services Chapter 3
42
smaller grazers, particularly rabbits, may define habitat characteristics, keeping
patches of grassland fairly open, preventing declines in plant diversity but allowing
soil to become less compact (Isermann et al., 2010), creating a habitat with
characteristics of both grazed and un-grazed grassland, with likely mixed effects
upon ecosystem services. Voles and other small mammals are usually present, even
within ‘un-grazed’ areas and have different effects on vegetation and nutrient
cycling characteristics to large herbivores (Bakker, 2003). Cessation of cattle grazing
where rabbits are not present leads to the development of a plant community
dominated by highly competitive tall grasses or shrubs (Janišová et al., 2011) with
reduced soil compaction and possible implications for several variables linked to
ecosystem service provision.
Table 3.1 Ecosystem services (S = supporting, P = provisioning, R = regulating, C = cultural) with list of proxy measurements. Ecosystem service Proxy measurement Primary productivity (S) Annual net primary productivity (above ground) Nutrient turnover (S) N mineralisation rate
Detritivore feeding rate Root turnover rate
Food production (P) Number of cattle per hectare Genetic diversity (P) Plant species richness Equable climate (R) C stock Flood control potential (R) Water infiltration rate Pest regulation (R) Invertebrate biodiversity, spider and predatory beetle abundance Pollination (R) Nectar feeder biodiversity and abundance Conservation (C) Abundance of RDB or nationally scarce invertebrates Aesthetic appreciation (C) Plant biodiversity, vegetation structure, grass: forb ratio &
flowering
Above-ground primary productivity (ANPP), a key supporting service, may increase
or decrease with grazing intensity (De Mazancourt et al., 1998; Leriche et al., 2003).
Nutrient turnover, another supporting service, also shows variable effects with
grazing management (Bakker, 2003; Bardgett et al., 1998; Van Wijnen et al., 1999).
Coastal grasslands, particularly those adjacent to crop fields, may potentially
provide invertebrates for the twinned regulating services of pest control and
pollination (Everard et al., 2010; Losey and Vaughan, 2006). However, effects of
grazing intensity on these services are difficult to predict. Invertebrate pest

Grassland grazing and ecosystem services Chapter 3
43
regulators, such as spiders and beetles, are often more abundant on un-grazed
grassland (Morris, 2000) but pollinators may be most abundant on grazed grassland
due to a likely increase in floral resources (Potts et al., 2003; Sjödin et al., 2008). Soil
moisture and temperature changes may also affect the regulating service of
equable climate, via impacts upon C storage and greenhouse gas emissions (Luo
and Zhou, 2006). The cultural service of aesthetic appreciation is likely to be higher
in grazed grasslands due to expected greater plant diversity and abundance and
diversity of forbs (Pykälä, 2003).
To date, where links have been drawn between grazing intensity, impact upon
ecosystem characteristics, and multiple ecosystem service provision, these have
been largely based on literature reviews (Bullock et al., 2011; Kemp and Michalk,
2007). There have been few habitat case studies where these effects have been
quantified within an ecosystem services framework. The novelty of this study lies in
using a wide range of habitat measurements across different grazing intensities as
proxies for specific ecosystem services (Table 3.1). A managed grazing experiment
within a low fertility grazed coastal grassland was used as a model system to
examine how grazing affects ecosystem service provision, following the framework
of the Millennium Ecosystem Assessment (MA, 2005) and the UK National
Ecosystem Assessment (Bullock et al., 2011). The three grazing treatments used
were ‘fully grazed’ (i.e. extensively cattle, pony and rabbit grazed), ‘rabbit grazed’
and ‘un-grazed’ (i.e. abandoned). The overarching hypothesis of this study is that
‘changes in grazing will differentially affect individual services, and will alter the
balance of supporting, provisioning, regulating and cultural ecosystem service
provision of semi-natural grassland.
3.3 Materials and methods
3.3.1 Study site and experimental design
Fixed sand dune grasslands are low-productivity semi-natural grasslands, and a UK
Biodiversity Action Plan (BAP) priority habitat. Newborough Warren is a calcareous
coastal sand dune grassland, located in NW Wales (53° 8’ 59” N, 4° 21’ 1” W), noted
for its high biodiversity and designated as a National Nature Reserve, Site of Special

Grassland grazing and ecosystem services Chapter 3
44
Scientific Interest and Special Area of Conservation under the EC Habitats and
Species Directive 1992. The 389 ha site is managed by Countryside Council for
Wales (CCW). Managed grazing was introduced in 1987; stocking levels have varied
but the site is now grazed by ponies (Equus ferus caballus; 0.2 ha-1), cattle (Bos
taurus; 0.05 ha-1) and rabbits (Oryctolagus cuniculus; 45 ha-1), designed to maximise
plant diversity. Rare breed cattle, Belted Galloways and Dexters are stocked within
the fully grazed study area for 18 months before being ‘finished’ on improved
pasture and sold for meat (Graham Williams, pers. comm.). The predominant
vegetation in the experimental area is fixed dune Festuca rubra - Galium verum
grassland. In 2003, three replicate experimental blocks, each containing three 10 x
10 m experimental units, one fully grazed unit (unfenced), one rabbit grazed unit
(fenced with 10 x 10 cm mesh to exclude large grazers) and one un-grazed unit
(fenced with 10 x 10 cm mesh and an additional 2.7 x 3.7 cm mesh buried 20 cm
underground to prevent rabbit access) were set up. Experimental blocks are
separated from each other by hundreds of metres and by low dunes. Prior to
construction of grazing exclosures the vegetation was a uniform 4-6 cm height.
Small mammals such as field voles (Microtus agrestis) and invertebrate herbivores
were assumed to be present within all experimental units. All biophysical
measurements avoided a 1 m buffer zone adjacent to the fences for rabbit grazed
and un-grazed exclosures. Fully grazed units are denoted as PR1 - PR3 (PR stands
for pony & rabbit grazed); rabbit grazed units as R1 – R3 and un-grazed units as U1 -
U3.
3.3.2 Soil characteristics
Soil moisture content and temperature were recorded within each experimental
unit, at six locations, once a month from June to September 2009. Soil conductivity
was measured in direct volts using a Delta T Theta Meter HH1 across 6 cm depth
and converted to percentage soil moisture content using a calibration suitable for
mineral soils. Soil temperature was measured in the top 11 cm using a digital
thermometer. Samples to determine bulk density and soil organic matter content
were collected during September 2009 using three intact soil cores of 3.8 cm
diameter and 15 cm depth from each experimental unit. Cores were dried at 105 ⁰C

Grassland grazing and ecosystem services Chapter 3
45
for 72 h and the dry mass divided by the volume of the core to calculate bulk
density. Loss-on-ignition, at 375 ⁰C for 16 h was used to estimate organic matter
content. pH was determined using a Corning pH meter 220. Water infiltration rate
was measured using three single ring infiltrometers (Carroll et al., 2004) per
experimental unit. This method was used as vertical percolation flux dominates
water flow in sandy soil. These 10 cm diameter x 20 cm length cylinders were
hammered 5 cm into the ground and briefly filled with water to pre-saturate the
ground. Water was again poured into the infiltrometers up to 5 cm from the top.
The time taken for the water to move 5 cm down the infiltrometer was recorded
and converted into a water infiltration rate in mm min-1.
Plant available nitrogen (N) was measured by N mineralisation assays (Rowe et al.,
2011) calculated from three 15 cm depth soil cores per unit, taken in September
2009. Soil cores were taken using plastic corers, capped at both ends to minimise
soil disruption and stored intact at 4 °C. Accumulated inorganic N was flushed from
the cores by spraying with a solution of similar ionic concentration to UK rain over 7
d until 150 ml of leachate had been collected. Cores were incubated at 10 °C for 28
d, homogenised and a sub-sample extracted using 1M KCl for the analysis of
ammonium and nitrate content (Rowe et al., 2011). Net nitrification and
ammonification rates were calculated over these 28 d, assuming that all previous
inorganic N had been removed during the 7 d flushing period, and were expressed
as mg N g-1 dry wt d-1. Litter breakdown via mesofaunal detritivores was measured
in autumn using ten bait lamina (Terra Protecta GmbH, Germany) per unit (in two
lines of five, 50 cm apart).
3.3.3 Vegetation characteristics
During July, vegetation height was measured at five points within five 1 x 1 m
quadrats per experimental unit with a custom made drop disc of 20 cm diameter,
10 g mass. Within two quadrats from each unit above-ground live vegetation and
plant litter was collected from a 25 x 50 cm area cut to ground-level. One root core
of 5 cm diameter and 10 cm depth was also taken per quadrat and washed to
remove all soil. Above-ground vegetation, litter and roots were all dried at 80 °C for

Grassland grazing and ecosystem services Chapter 3
46
24 h and weighed to give indicators of above-ground shoot biomass, litter biomass
and below-ground root biomass respectively. C stock (t C ha-1) was measured for
four pools: soil, roots, plant litter and shoots, derived from biomass using the
following conversions: Soil C as 0.55 of soil organic matter; root C is 0.44 of root
biomass (dry wt) and plant litter and shoot C is 0.42 of biomass (dry wt) in
comparable UK fixed dune grasslands (unpublished data). ANPP, peak biomass from
three grazer excluded areas per experimental unit, was recorded as a direct
measure of primary productivity. During February 2009, vegetation was cut to
ground level in three 50 x 50 cm areas per experimental unit. Each cut area was
protected from pony, cattle and rabbit grazers by an 8 cm mesh gabion (50 x 50 x
50 cm) and vegetation allowed to re-grow until peak biomass at the end of August
when areas were re-cut within a central 25 x 25 cm area. Vegetation was dried at
80 °C for 72 h then weighed and converted to kg dry wt m-2 yr-1 to provide a
measure of ANPP. Autumnal fine root turnover was estimated by modifying the
method of Lukac and Godbold (2010). In mid September 2010 four nylon 1 mm root
turnover mesh strips (Normesh, UK), 2.5 cm wide x 15 cm long, were placed in
vertical cuts made in the soil with 2.5 cm overlap at the bottom and 2.5 cm
emerging from the soil, 50 cm apart, across a 2 m transect in each unit. After 28 d
the mesh strips were removed along with a slightly wider and deeper intact soil
core. Cores were pushed out and divided in two along the mesh line, the number of
fine roots penetrating each mesh depth zone (0 – 2.5; 2.5 – 5; 5 – 7.5; 7.5 – 10 cm)
were counted by eye as a proxy for fine root turnover.
3.3.4 Biodiversity of plants and invertebrates
Plant percentage cover, species richness and number of species flowering were
recorded during July in five 1 x 1 m quadrats from each experimental unit. For
functional group analysis, plant percentage cover data was standardised to 100 %
and divided into six broad phylogenetic functional groups: lichen, moss, forbs,
sedges, grass and shrubs.
Pitfall traps were used to sample ground dwelling invertebrates for 26 d in May and
28 in July. Six pitfall traps per experimental unit were set up in two lines of three, 2

Grassland grazing and ecosystem services Chapter 3
47
m apart. Each trap consisted of a plastic cup (80 mm diameter x 105 mm deep) a
third full with a 50/50 mix of ethylene glycol and water, to preserve invertebrates,
with a drop of washing up liquid to break the surface tension. Each trap was pushed
into a hole made by a soil auger until they were level with the soil surface. A rain
hat was placed over each trap and set at 3 cm from the ground. A wire basket of 5
cm mesh size was also placed over each rain hat and pegged down to prevent
interference by grazers. Most invertebrates caught in pitfall traps were identified to
species level, apart from Diptera and parasitic Hymenoptera, and assigned to a
functional group: predatory, zoophagous (predatory and scavenging),
phytophagous (herbivore or granivorous), detritivore (feed on detritus and
associated decomposer community of fungi and bacteria), or an additional category
‘not assigned’.
Nectar feeding invertebrates were sampled by bait-less pan traps, six per
experimental unit (2 blue, 2 white, 2 yellow), for 72 h during June and again in July
2009. In each experimental unit two triangles, 5 m apart, consisting of one pan trap
of each colour, 1.5 m apart, was set up. Traps of the same colour were pooled to
give three samples per experimental unit. Each trap consisted of 203 mm diameter
shallow bowls sprayed yellow, blue or white, half filled with water containing a
drop of washing detergent to break the surface tension. Wire baskets of 5 cm mesh
size were placed over all traps to prevent damage by grazing animals. The contents
of the pitfalls and pan traps were preserved in 70 % Industrial strength methylated
spirits (IMS) or ethanol.
3.3.5 Analysis
The effect of grazing on each measured variable was analysed using an ANOVA on
linear mixed effects model (lme) output in R (R Development Core Team, 2011) e.g.
lme (temperature ~ grazing, random = ~1|block/grazing). This approach was used
to enable the raw data to be analysed accounting for replication at the level of the
experimental unit or block (n=3). Variables were log, square root, or arcsine square
root transformed as appropriate to improve model fit. Results of best model fit
were presented here based on lowest Akaike information criterion (AIC) number

Grassland grazing and ecosystem services Chapter 3
48
and quantile probability plot (qqnorm) with most normal distribution. Where
ANOVA results showed a significant grazing effect, differences between pairs of
grazing treatments (PR & R; PR & U), were reported directly from the lme summary
output. As the remaining treatment pair (R & U) could not be ‘read’ directly from
the lme summary, the difference between values for R and U in relation to PR was
divided by the standard error to give a number (#) for the following calculation
‘2*(1 – pt(#,df=4))’ This gives a probability value for the difference between R and U
for a two-tailed test where d.f. = 4.
3.4 Results
3.4.1 Soil and vegetation characteristics
Soil temperature was significantly higher on the fully grazed than the un-grazed
grassland. Vegetation height was significantly different between all treatment pairs
with the lowest sward height in the fully grazed, intermediate in the rabbit grazed
and highest in the un-grazed grassland (Table 3.2). Root biomass was significantly
greater in the rabbit grazed than the un-grazed grassland. Plant litter was
significantly higher in the un-grazed and rabbit grazed compared to the fully grazed
grassland. Water infiltration rate, was significantly higher in the un-grazed and
rabbit grazed than fully grazed grassland. Soil pH, moisture content, bulk density,
organic matter content and above-ground shoot biomass were not significantly
different between grazing treatments. Total C stock did not differ significantly with
grazing. As separate C pools ‘soil’ and ‘shoots’ (above-ground live biomass) were
not significantly different between grazing treatments (Figure 3.1). Root C stock
was significantly greater for rabbit grazed than un-grazed grassland, contributing
around 20 % of the total C pool. Plant litter C stock was significantly greater in un-
grazed and rabbit grazed than grazed grassland.
ANPP and soil organic matter content (soil surface organic layer ~6 cm thick) did not
differ significantly with grazing treatment (Table 3.2). Net nitrification rate was
significantly higher in the un-grazed than the fully grazed grassland but net
ammonification rate did not differ significantly with grazing treatment (Figure 3.2).
Mesofaunal feeding rate was significantly greater for rabbit grazed in depth zone 1

Grassland grazing and ecosystem services Chapter 3
49
and for un-grazed in depth zone 2 and 3 compared to fully grazed grassland (Figure
3.3). Fine root turnover at 0-2.5 cm was significantly greater in un-grazed and rabbit
grazed than fully grazed grassland (Figure 3.4).
Table 3.2 Soil and vegetation characteristics, grazing treatment means ± standard deviations with
bold letters indicating significant differences at *(p < 0.05) or ***(p < 0.001), ns = non-significant.
Fully grazed Rabbit grazed Un-grazed ANOVA Soil
pH 6.21 ± 0.37 6.16 ± 0.45 6.01 ± 0.33 ns Moisture content (%)x 13.02 ± 8.12 8.28 ± 2.62 6.26 ± 5.42 ns Temperature (°C)x 18.08 ± 2.90 a 17.20 ± 0.39 ab 16.93 ± 2.20 b * Bulk density (g cm-3) 1.01 ± 0.07 1.02 ± 0.09 0.93 ± 0.10 ns Organic matter content (%)
3.11 ± 0.71 3.23 ± 0.64 3.57 ± 0.92 ns
Infiltration rate (mm min-
1) 6.60 ± 1.94 a 22.74 ± 14.7 b 37.27 ± 28.8 b *
Vegetation Vegetation height (cm) 5.27 ± 1.03 a 19.43 ± 7.68 b 37.63 ± 7.94 c *** Root biomass (kg dry wt m-2)
1.24 ± 0.55 ab 1.22 ± 0.36 a 0.71 ± 0.26 b *
Litter biomass (kg dry wt m-2)
0.12 ± 0.03 a 0.22 ± 0.08 b 0.28 ± 0.04 b *
Shoot biomass (kg dry wt m-2)
0.83 ± 0.29 0.80 ± 0.29 0.59 ± 0.25 ns
ANPP (kg dry wt m-2 y-1) 0.34 ± 0.09 0.35 ± 0.07 0.34 ± 0.10 ns x Mean values of 4 months data, June-September

Grassland grazing and ecosystem services Chapter 3
50
Figure 3.1 Effect of grazing (PR = fully grazed, R = rabbit grazed, U = un-grazed) on C stock. Bold
text indicates significant differences between grazing treatments for each component, * (p < 0.05),
** (p < 0.01).
Figure 3.2 Effect of grazing (PR = fully grazed, R = rabbit grazed, U = un-grazed) on N
mineralisation. Bold text indicates significant differences between grazing treatments for each
component, * (p < 0.05).

Grassland grazing and ecosystem services Chapter 3
51
Figure 3.3 Effect of grazing (PR = fully grazed, R = rabbit grazed, U = un-grazed) on below-ground
mesofaunal feeding rate in autumn. Bold text indicates significant differences between grazing
treatments for each depth zone (d1 – d4), *(p < 0.05).
Figure 3.4 Effect of grazing (PR = fully grazed, R = rabbit grazed, U = un-grazed) on number of new
fine roots produced per month, as a proxy for potential fine root turnover. Bold text shows
significant differences between grazing treatments for each soil depth * (p < 0.05).

Grassland grazing and ecosystem services Chapter 3
52
3.4.2 Biodiversity
Cumulative plant species richness, for un-grazed, rabbit grazed and fully grazed
plots was 45, 49 and 61 species (per 15 m2) respectively. At the experimental unit
level, fully grazed grassland was significantly more species rich, particularly for
forbs, than un-grazed grassland (Table 3.3). Graminoids were equally species rich
regardless of grazing intensity. Forb cover was significantly higher in fully and rabbit
grazed grassland than in un-grazed habitat. In contrast, grass cover was significantly
lower in fully grazed than rabbit or un-grazed grassland (Figure 3.5). Total number
of species flowering, particularly forbs, and percentage of forb species flowering
were all significantly greater in fully grazed than un-grazed habitat.
Table 3.3 Plant species richness and flowering, grazing treatment means ± standard deviations
with bold letters indicating significant differences at *(p < 0.05), ns = non-significant.
Variable Fully grazed Rabbit grazed Un-grazed ANOVA Mean species richness (spp per 1 x 1 m)
All species 22.93 ± 4.04 a
18.93 ± 4.51 ab
16.20 ± 2.27 b *
Graminoid (grasses & sedges) 7.33 ± 1.50 7.20 ± 0.86 6.60 ± 0.83 ns Forb 11.13 ± 2.45
a 7.80 ± 2.81 ab 5.47 ± 1.36 b *
Number of species flowering All species 10.53 ± 3.36
a 8.93 ± 2.15 a 6.33 ± 1.84 b *
Graminoid 4.40 ± 1.50 5.67 ± 0.98 4.60 ± 1.24 ns Forb 6.13 ± 2.20 a 3.27 ± 1.83 ab 1.73 ± 1.22 b *
Percentage species flowering Graminoid 59.89 ± 16.8
a 79.02 ± 11.6 b 69.40 ± 16.4
ab *
Forb 54.36 ± 14.6 a
41.92 ± 15.1 ab
32.29 ± 21.2 b *
Forb / forb + graminoid pc. Forb percentage 21.25 ± 0.07
a 16.65 ± 0.08 a 6.90 ± 0.05 b *
Of nearly ten thousand invertebrates sampled from pitfalls, 40 % were predatory
spiders of 62 species and 3 % predatory and zoophagous beetles, mainly carabids
and Staphylinidae of 43 species. Pan traps sampled 14 bee species. Predatory
Coleoptera were more abundant (ANOVA; F = 5.2, d.f. = 4, p < 0.05) and species rich
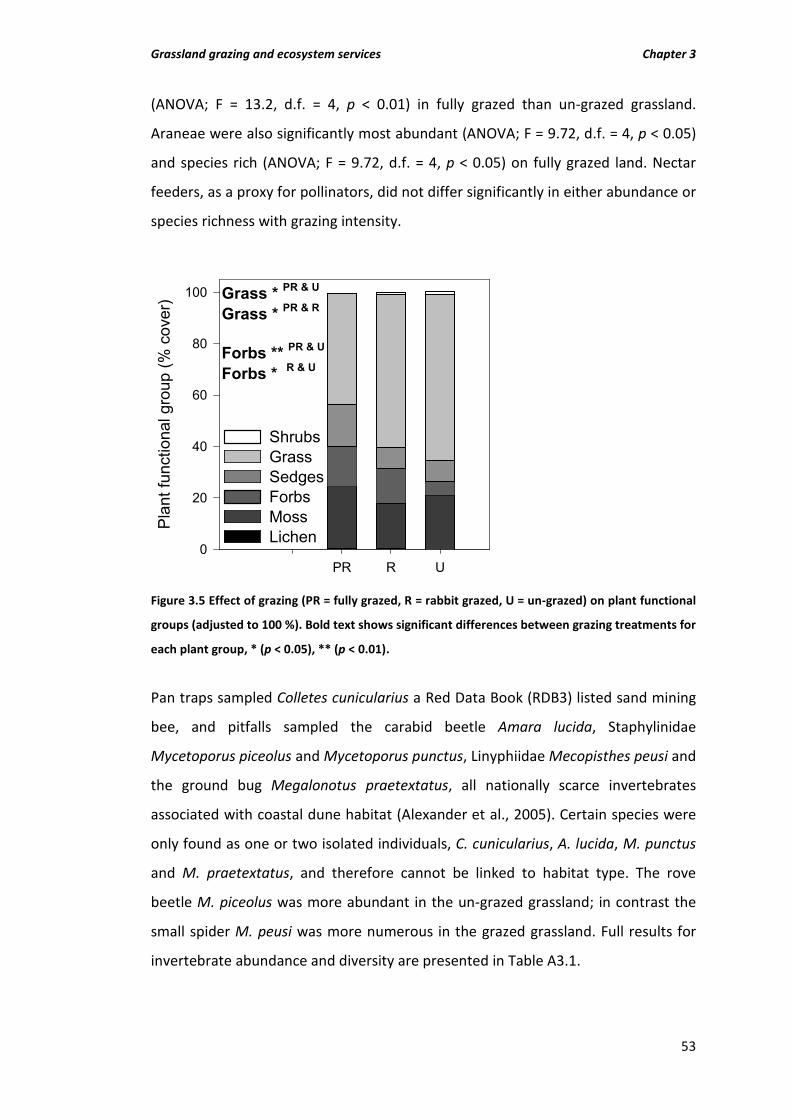
Grassland grazing and ecosystem services Chapter 3
53
(ANOVA; F = 13.2, d.f. = 4, p < 0.01) in fully grazed than un-grazed grassland.
Araneae were also significantly most abundant (ANOVA; F = 9.72, d.f. = 4, p < 0.05)
and species rich (ANOVA; F = 9.72, d.f. = 4, p < 0.05) on fully grazed land. Nectar
feeders, as a proxy for pollinators, did not differ significantly in either abundance or
species richness with grazing intensity.
Figure 3.5 Effect of grazing (PR = fully grazed, R = rabbit grazed, U = un-grazed) on plant functional
groups (adjusted to 100 %). Bold text shows significant differences between grazing treatments for
each plant group, * (p < 0.05), ** (p < 0.01).
Pan traps sampled Colletes cunicularius a Red Data Book (RDB3) listed sand mining
bee, and pitfalls sampled the carabid beetle Amara lucida, Staphylinidae
Mycetoporus piceolus and Mycetoporus punctus, Linyphiidae Mecopisthes peusi and
the ground bug Megalonotus praetextatus, all nationally scarce invertebrates
associated with coastal dune habitat (Alexander et al., 2005). Certain species were
only found as one or two isolated individuals, C. cunicularius, A. lucida, M. punctus
and M. praetextatus, and therefore cannot be linked to habitat type. The rove
beetle M. piceolus was more abundant in the un-grazed grassland; in contrast the
small spider M. peusi was more numerous in the grazed grassland. Full results for
invertebrate abundance and diversity are presented in Table A3.1.
Shrubs Grass Sedges Forbs Moss Lichen
PR R U
Pla
nt fu
nctio
nal g
roup
(% c
over
)
0
20
40
60
80
100 Grass * PR & U
Grass * PR & R
Forbs ** PR & U
Forbs * R & U

Grassland grazing and ecosystem services Chapter 3
54
3.5 Discussion
Most European semi natural grasslands, including coastal grasslands, have suffered
a decline in traditional grazing, with marginal grasslands being ‘abandoned’ or
replaced by ‘conservation grazing’ to address conservation priorities such as plant
diversity or provision of habitat for breeding birds (GAP, 2012). The relationships
between grazing impacts on biophysical measures in this study and probable
impacts on ecosystem services are summarised in Figure 6, supplemented by
additional information from the literature for some services. We acknowledge that
for some of these services, particularly the cultural services, they are proxies of
‘potential’ ecosystem services, rather than ‘realised’ ecosystem services. From the
results of this study, it is clear that different grazing regimes favour different
ecosystem services, and management decisions necessitate trade-offs in delivery of
those ecosystem services, or changes in the way grazing management is applied.
Here, the widely held view that low intensity grazing is always the ‘best’
management option for the conservation of semi-natural grasslands is challenged.
3.5.1 Supporting services
Primary productivity and nutrient cycling are key supporting services of semi-
natural grasslands. These underlie regulating services such as equable climate by
greater plant biomass leading to higher C sequestration rates (Soussana et al.,
2004), and provisioning services such as forage production and quality (Bullock et
al., 2011). Nutrient cycling is important as it determines plant available N, a limiting
factor for plant primary productivity (Bardgett et al., 2011). Decomposition may
influence N cycling positively or negatively, dependent on the C:N ratio of organic
substrate available to microbes (Bardgett, 2005). Generally, faster decomposition
rates will be detrimental for C storage as soil respiration will increase (Luo and
Zhou, 2006). Classic theory suggests that more intensively grazed land will be
dominated by faster bacterial nutrient cycling and un-grazed or lightly grazed
grassland by slower fungal cycling (Bardgett et al., 1998; McNaughton et al., 1997).
However, in this study one aspect of nutrient cycling, net nitrification rate, was
greatest in un-grazed grassland, supporting an opposing view that grazing by large
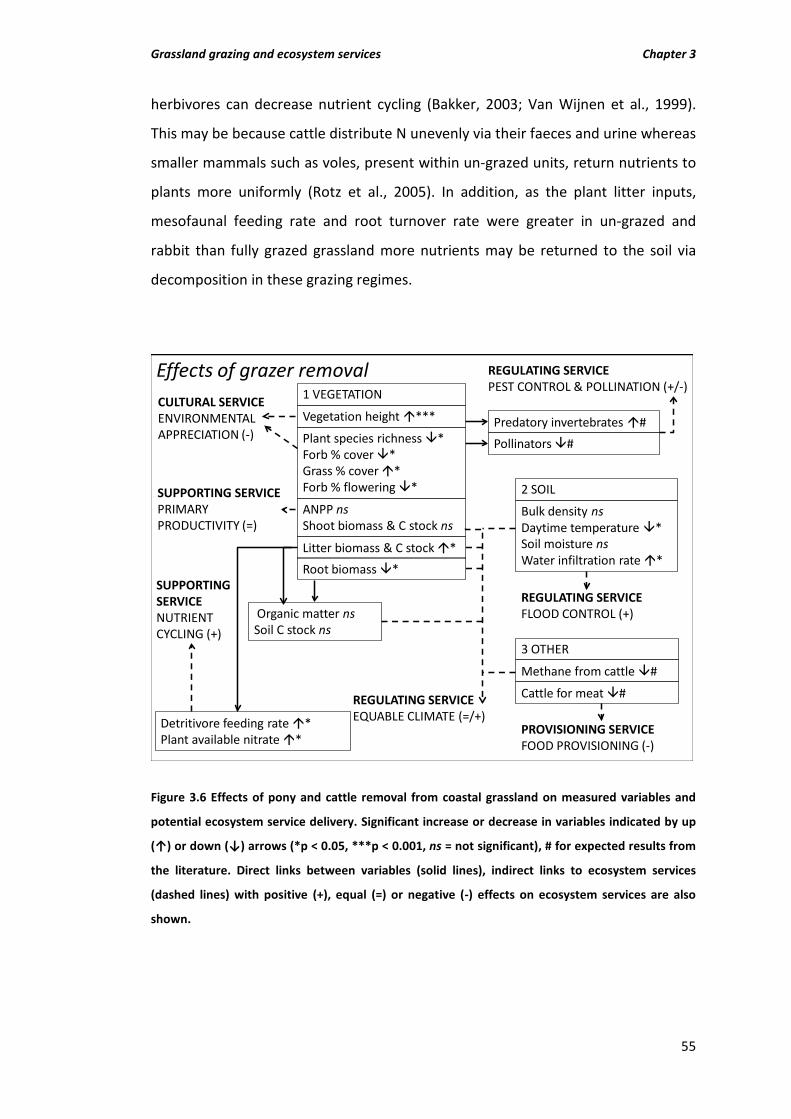
Grassland grazing and ecosystem services Chapter 3
55
herbivores can decrease nutrient cycling (Bakker, 2003; Van Wijnen et al., 1999).
This may be because cattle distribute N unevenly via their faeces and urine whereas
smaller mammals such as voles, present within un-grazed units, return nutrients to
plants more uniformly (Rotz et al., 2005). In addition, as the plant litter inputs,
mesofaunal feeding rate and root turnover rate were greater in un-grazed and
rabbit than fully grazed grassland more nutrients may be returned to the soil via
decomposition in these grazing regimes.
SUPPORTING SERVICEPRIMARY PRODUCTIVITY (=)
REGULATING SERVICEEQUABLE CLIMATE (=/+)
Organic matter nsSoil C stock ns
Detritivore feeding rate *Plant available nitrate *
Root biomass*Litter biomass & C stock *
ANPP nsShoot biomass & C stock ns
Plant species richness *Forb % cover *Grass % cover *Forb % flowering *
Vegetation height***
Bulk density nsDaytime temperature *Soil moisture nsWater infiltration rate*
2 SOIL
SUPPORTING SERVICENUTRIENT CYCLING (+)
PROVISIONING SERVICEFOOD PROVISIONING (-)
CULTURAL SERVICE ENVIRONMENTAL APPRECIATION (-)
REGULATING SERVICEPEST CONTROL & POLLINATION (+/-)
Predatory invertebrates #Pollinators #
3 OTHER
1 VEGETATION
Methane from cattle #
Cattle for meat #
Effects of grazer removal
REGULATING SERVICEFLOOD CONTROL (+)
Figure 3.6 Effects of pony and cattle removal from coastal grassland on measured variables and
potential ecosystem service delivery. Significant increase or decrease in variables indicated by up
(↑) or down (↓) arrows (*p < 0.05, ***p < 0.001, ns = not significant), # for expected results from
the literature. Direct links between variables (solid lines), indirect links to ecosystem services
(dashed lines) with positive (+), equal (=) or negative (-) effects on ecosystem services are also
shown.

Grassland grazing and ecosystem services Chapter 3
56
3.5.2 Provisioning services
It can be argued that the low intensity grazed coastal grassland is more important
than other grassland management types for the provisioning service of food supply,
with good quality beef or lamb produced at low stocking levels (Wood et al., 2007).
This service would be lost upon removal of grazing. However, as grazing
abandonment is not a static state, with natural succession shrubs and trees will
dominate and non-commercial food sources such as nuts and berries may become
important to some people, but these benefits are difficult to quantify (Everard et
al., 2010). Genetic diversity of wild species may be enhanced by the use of rare
breeds of cattle for conservation grazing and seed from semi-natural grassland used
to create species-rich grasslands under agri-environmental schemes (Bullock et al.,
2011). This service may be enhanced by extensive grazing management to
maximise plant biodiversity.
Fresh drinking water supply, via recharge of aquifers under grassland is another key
provisioning service. This service is also provided by both chalk aquifers underlying
semi-natural grasslands and vast swathes of UK upland grasslands that are major
water catchments (Holland et al., 2011; Koo and O’Connell, 2006). In this study
water infiltration rates increased when large herbivores were removed, regardless
of the presence or absence of rabbits, as large grazers are responsible for soil
compaction (Elliott and Carlson, 2004). Even though the study coastal grassland is
largely level, in sloping habitats it is likely that high water infiltration rates will
improve water storage and reduce run-off (Marshall et al., 2009). It may therefore
be proposed that rabbit grazed or un-grazed grasslands should be promoted on
hillsides where water storage is important for land managers. If primary succession
continues in the un-grazed or ‘abandoned’ grassland, shrubs are likely to dominate
and the pattern of water infiltration and water storage may be reversed, with
greater water storage in the grazed grassland due to lower evapo-transpiration
rates (Chartier et al., 2011).

Grassland grazing and ecosystem services Chapter 3
57
3.5.3 Regulating services
Regulating services include maintenance of an equable climate, control of flooding
and water quality and pest regulation and pollination. Semi-natural grasslands play
an important part in maintenance of an equable climate as they are a valuable C
store, according to current evidence emit little nitrous oxide and have lower
methane emissions than intensively managed grasslands due to lower stocking
levels (Bullock et al., 2011; Jones and Donnelly, 2004; Soussana et al., 2004). There
is currently little consensus on the role of grazing in grassland C sequestration.
Light, moderate or heavy grazing can all increase soil C, depending on grassland
type (Kemp and Michalk, 2007). Conversely extensive grazing or no grazing may
also increase C storage (Campbell et al., 1997; Soussana et al., 2004) and lead to
increased C storage. This study found that total C stock from four combined pools,
soil, roots, litter and shoots, did not differ with grazing intensity but that root C was
greatest in fully and rabbit grazed, while litter C was greatest in rabbit and un-
grazed grassland. As root-derived C contributed more to total C stock than litter or
shoot-derived C and root-derived C has a residence time of 2.5 times that of litter
or shoot derived C (Rasse et al., 2005) there is potential for greater C storage in the
grazed grassland.
Water storage within grassland groundwater also maintains regulating functions
such as moderating overland flow, reducing flooding and improving water quality
by reducing nutrients and pathogenic bacteria than often contaminate surface
waters (Bullock et al., 2011; Kemp and Michalk, 2007). The decreased infiltration
rates due to compaction caused by grazing of cattle or other large herbivores leads
to higher runoff and N contamination via faeces or urine (Cheng-Zhang and Squires,
2010; Rotz et al., 2005). By contrast, grazing abandonment increases infiltration
rates with significant potential as a tool to manage flood risk (Carroll et al., 2004).
Invertebrate abundance and diversity, particularly of large predatory spiders,
carabids and staphylinids is often higher in un-grazed grasslands (Ford et al., 2012a;
Morris, 2000), with potential implications for pest regulation where semi-natural
grasslands border arable fields. Our results show the opposite, with greatest

Grassland grazing and ecosystem services Chapter 3
58
abundance and diversity of predatory invertebrates in the fully grazed grassland. As
catch size was consistently greatest in fully grazed, intermediate in rabbit grazed
and smallest in un-grazed it is likely that increased structural complexity of
vegetation in the rabbit grazed and un-grazed treatments resulted in reduction of
catch (Melbourne, 1999), therefore these results may not capture true abundance
and diversity of predatory invertebrates. Nectar feeders and therefore pollinators,
including bumble bees, hoverflies and butterflies, tend to be driven by floral
abundance, floral richness, availability of nectar resources and sward structure
(Potts et al., 2003; Sjödin et al., 2008), all factors influenced by grazing intensity.
Grazing also affects soil microbial diversity, with clear effects on microbial
composition in both sand dunes and saltmarsh (Ford et al., 2012b), although the
implications for ecosystem services provision are unclear.
3.5.4 Cultural services
Proof of the importance of coastal grasslands to cultural services includes the
conservation status of coastal grasslands as a UK Biodiversity Action Plan (UK BAP)
listed priority habitat with some important plants, nationally scarce invertebrates
(Alexander et al., 2005), birds such as RDB3 skylarks (Alauda arvensis) and BAP
listed priority amphibian, natterjack toad (Epidalea calamita). Environmental
appreciation and recreation are also key cultural services in semi-natural grasslands
and coastal sand dunes in particular attract significant numbers of tourists (Bullock
et al., 2011; Jones et al., 2011). Aesthetic appreciation of the environment is likely
to improve with reduction in grass in favour of increased abundance of flowering
plants (Mitteager et al., 2006; Paar et al., 2008). In this study plant species richness,
particularly for forbs, and flower abundance were significantly greater in fully than
in un-grazed habitat. Tall grasses were more dominant in the un-grazed areas,
indeed Arrhenatherum elatius, a negative indicator species of fixed dune grassland,
was present only within rabbit grazed and un-grazed grassland. Plassmann et al.
(2010) also found that the number of positive indicator species was lower in un-
grazed grassland. Therefore a tentative conclusion could be drawn that aesthetic
appreciation is greater in extensively grazed than un-grazed grassland.

Grassland grazing and ecosystem services Chapter 3
59
3.5.5 Grazing management for conservation
Mixed grazing is often recommended as grazing with both horses and cattle can
lead to enhanced control of competitive grass species, opening up gaps for other
plant species and increases in structural diversity compared to cattle grazing alone
(Loucougaray, 2004). Welsh mountain ponies graze on poor quality forage and
avoid flowering heads, with potential positive results for plant diversity, flowering
and aesthetics, as argued in this study. Sheep will graze a sward shorter than either
cattle or ponies and may select high quality plant parts such as flowers, pods and
young shoots (Rook et al., 2004), making them less suitable for conservation
grazing. Despite the majority of north–west European grassland managers
promoting low intensity grazing by ponies and/or cattle, Newton et al. (2009), in a
systematic review of grazing management, found that the presence of grazers
consistently lead to a decline in ‘tussocky’ vegetation with negative effects on
reptile and invertebrate habitat. Rotational grazing, where animals are moved at
regular time intervals allowing vegetation time to ‘recover’, often has favourable
effects on plant, bird and invertebrate diversity (Söderström et al., 2001; Wrage et
al., 2011). It is also recognised that un-grazed vegetative buffer zones adjacent to
riparian or arable fields, can allow spatial co-delivery of multiple ecological services,
although these are rarely quantified (Olson & Wäckers, 2007). Where large grazers
are removed rabbit grazing may define habitat characteristics, keeping patches of
grassland fairly open, with a lower mean sward height than un-grazed grassland,
preventing major declines in plant or forb diversity but allowing soil to become less
compact (Isermann et al., 2010) with greater infiltration rates, results mirrored by
this study. However, rabbits are often dependent on large herbivores to maintain
the short vegetation they prefer, and these effects may not persist.
3.5.6 Ecosystem service tradeoffs
In the light of abandonment of low productivity grazing land throughout Europe, in
addition to biodiversity measures of ‘success’ in conservation, ecosystem service
measures and trade-offs need to be taken into account when choosing an
appropriate grassland management scheme. Results from this case study and the

Grassland grazing and ecosystem services Chapter 3
60
wider scientific literature indicate that extensively cattle grazed or mixed
pony/cattle grazed grassland should be conserved for the ecosystem services of
plant genetic diversity, food provision, cultural environmental appreciation and
potential pollination services. Un-grazed grassland should be conserved for the
ecosystem services of invertebrate biodiversity, water storage and flood control
(particularly on hill-side slopes), nutrient cycling and the potential for pest
regulation. Rabbit grazed grasslands provide slightly lower plant biodiversity and
cultural services than grazed grasslands but similar water infiltration dynamics to
un-grazed grasslands. Grazing management should depend on the conservation
objectives for a particular habitat but should take into account likely trade-offs with
other ecosystem services. Perhaps grassland managers, whilst maintaining
extensively grazed areas, could trial the introduction of rabbit grazed or un-grazed
‘buffer strips’ next to water courses, natural boundaries or arable fields, to
minimise biodiversity and ecosystem service trade-offs.
3.6 Acknowledgements
This study was funded as part of a NERC - Centre for Ecology and Hydrology project
- NECO3610. Thanks to CCW for access to field site, Rhian Walsh and Aled Roberts
for fieldwork assistance, David Cooper for statistical advice and Dick Loxton for
invertebrate identification.
3.7 References
Alexander, K., Archer, M., Colenutt, S., Denton, J., Falk, S., Godfrey, A., Hammond,
P., Ismay, J., Lee, P., Macadam, C., Morris, M., Murray, C., Plant, C., Ramsay, A.,
Schulten, B., Shardlow, M., Stewart, A., Stubbs, A., Sutton, P., Tefler, M., Wallace, I.,
Willing, M., Wright, R., 2005. Habitat section 8: Coastal sand dunes. In: Managing
Priority Habitats for Invertebrates, Buglife The Invertebrate Conservation Trust,
Peterborough, UK.
Bakker, E.S., 2003. Herbivores as mediators of their environment: the impact of
large and small species on vegetation dynamics. PhD-thesis Wageningen University,
Wageningen, The Netherlands. ISBN 90-5808-878-2; pp. 1-184.

Grassland grazing and ecosystem services Chapter 3
61
Bakker, E.S., Olff, H., Gleichman, J.M., 2009. Contrasting effects of large herbivore
grazing on smaller herbivores. Basic Appl. Ecol. 10 (2), 141-150.
Bardgett, R.D., 2005. The Biology of Soil: A Community and Ecosystem Approach.
Oxford University Press, Oxford, UK.
Bardgett, R.D., Campbell, C.D., Emmett, B.A., Jenkins, A., Whitmore, A.P., 2011.
Chapter 13: Supporting services. In: The UK National Ecosystem Assessment
Technical Report, UK National Ecosystem Assessment, UNEP-WCMC, Cambridge,
UK.
Bardgett, R.D., Wardle, D.A., Yeates, G.W., 1998. Linking above-ground and below-
ground interactions: how plant responses to foliar herbivory influence soil
organisms. Soil Biol. Biochem. 30 (14), 1867-1878.
Bullock, J.M., Jefferson, R.G., Blackstock, T.H., Pakeman, R.J., Emmett, B.A., Pywell,
R.J., Grime, J.P., Silverton, J., 2011. Chapter 6: Semi-natural grasslands. In: The UK
National Ecosystem Assessment Technical Report, UK National Ecosystem
Assessment, UNEP-WCMC, Cambridge, UK.
Campbell, B.D., Stafford-Smith, D.M., McKeon, G.M., 1997. Elevated CO2 and water
supply interactions in grasslands: a pastures and rangelands management
perspective. Global Chan. Biol. 3 (3), 177-187.
Carroll, Z.L., Bird, S.B., Emmett, B.A., Reynolds, B., Sinclair, F.L., 2004. Can tree
shelterbelts on agricultural land reduce flood risk? Soil Use Manage. 20 (3), 357-
359.
Chartier, M.P., Rostagno, C.M., Pazos, G.E., 2011. Effects of soil degradation on
infiltration rates in grazed semiarid rangelands of northeastern Patagonia,
Argentina. J. Arid Environ. 75 (7), 656-661.
Cheng-Zhang, Z., Squires, V., 2010. Biodiversity of plants and animals in mountain
ecosystems. In: Squires, V., Hua, L., Li, G., Zhang, D. (Eds), Towards Sustainable Use
of Rangelands in north-west China. Springer, London, UK, pp. 101-125.

Grassland grazing and ecosystem services Chapter 3
62
De Mazancourt, C., Loreau, M., Abbadie, L., 1998. Grazing optimization and nutrient
cycling: when do herbivores enhance plant production? Ecology 79 (7), 2242–2252.
Elliott, A.H., Carlson, W.T., 2004. Effects of sheep grazing episodes on sediment and
nutrient loss in overland flow. Aust. J. Soil Res. 42 (2), 213-220.
Everard, M., Jones, L., Watts, B., 2010. Have we neglected the societal importance
of sand dunes? An ecosystem services perspective. Aquatic Conserv: Mar. Freshw.
Ecosyst. 20 (4), 476-487.
Ford, H., Garbutt, A., Jones, L., Jones D.L., 2012a. Grazing management in saltmarsh
ecosystems drives invertebrate diversity, abundance and functional group
structure. Insect Conserv. Diver. (2012) doi: 10.1111/j.1752-4598.2012.00202.x.
Ford, H., Rousk, J., Garbutt, A., Jones, L., Jones D.L., 2012b. Grazing effects on
microbial community composition, growth and nutrient cycling in salt marsh and
sand dune grasslands. Biol. Fertil. Soils. doi 10.1007/s00374-012-0721-2.
GAP: Grazing Advice Partnership, 2012. http://www.grazinganimalsproject.org.uk
Holland, R.A., Eigenbrod, F., Armsworth, P.R., Anderson, B.J., Thomas, C.D.,
Heinemeyer, A., Gillings, S., Roy, D.B., Gaston, K.J., 2011. Spatial covariation
between freshwater and terrestrial ecosystem services. Ecol. Appl. 21 (6), 2034–
2048.
Isermann, M., Koehler, H., Mühl, M., 2010. Interactive effects of rabbit grazing and
environmental factors on plant species-richness on dunes of Norderney. J. Coastal
Conserv. 14 (2), 103-114.
Janišová, M., Bartha, S., Kiehl, K., Dengler, J., 2011. Advances in the conservation of
dry grasslands: Introduction to contributions from the seventh European dry
grassland meeting. Plant Biosyst. 145 (3), 507–513.
Jones, L., Angus, S., Cooper, A. Doody, P., Everard, M., Garbutt, A., Gilchrist, P.
Hansom, J., Nicholls, R., Pye, K., Ravenscroft, N., Rees, S. Rhind, P., Whitehouse, A.,
2011. Chapter 11: Coastal margins. In: The UK National Ecosystem Assessment

Grassland grazing and ecosystem services Chapter 3
63
Technical Report, UK National Ecosystem Assessment, UNEP-WCMC, Cambridge,
UK.
Jones, M.B., Donnelly, A., 2004. Carbon sequestration in temperate grassland
ecosystems and the influence of management, climate and elevated CO2. New
Phytol. 164 (3), 423–439.
Kemp, D.R. & Michalk, D.L., 2007. Towards sustainable grassland and livestock
management. J. Agri. Sci. 145, 543-564.
Kleijn, D., Rundlo, M. Scheper, J., Smith, H.G., Tscharntke, T., 2011. Does
conservation on farmland contribute to halting the biodiversity decline? Trends
Ecol. Evol. 26 (9), 474-481.
Koo, B.K., O’Connell, P.E., 2006. An integrated modelling and multicriteria analysis
approach to managing nitrate diffuse pollution: 2. A case study for a chalk
catchment in England. Sci. Total Environ. 358 (1-3), 1-20.
Koyani, P.T., Bossuyt, B., Bonte, D., Hoffmann, M., 2008. Grazing as a management
tool in dune grasslands: Evidence of soil and scale dependence of the effect of large
herbivores on plant diversity. Biol. Conserv. 141 (6), 1687-1694.
Leriche, H., Le Roux, X., Desnoyers, F., Benest, D., Simioni, G., Abbadie, L., 2003.
Grass response to clipping in an African savanna: Testing the grazing optimization
hypothesis. Ecol. Appl. 13 (5), 1346-1354.
Losey, J.E., Vaughan, M., 2006. The economic value of ecological services provided
by insects. BioScience 56 (4), 311-323.
Loucougaray, G., Bonis, A., Bouzillé, J-B., 2004. Effects of grazing by horses and/or
cattle on the diversity of coastal grasslands in western France. Biol. Conserv. 116,
59-71.
Lukac, M., Godbold, D.L., 2010. Fine root biomass and turnover in southern taiga
estimated by root inclusion nets. Plant Soil 331 (1-2), 505-513.

Grassland grazing and ecosystem services Chapter 3
64
Luo, Y., Zhou, X., 2006. Soil Respiration and the Environment. Academic Press,
London, Elsevier.
MA, 2005. Ecosystems and Human Well-being: Synthesis. Washington DC: Island
Press.
MacLeod, N.D., McIvor, J.G., 2006. Reconciling economic and ecological conflicts for
sustained management of grazing lands. Ecol. Econ. 56 (3), 386-401.
Marshall, M.R., Francis, O.J., Frogbrook, Z.L., Jackson, B.M., McIntyre, N., Reynolds,
B., Solloway, I., Wheater, H.S., Chell, J., 2009. The impact of upland land
management on flooding: results from an improved pasture hillslope. Hydrological
Processes 23, 464-475.
McNaughton, S.J., Banyikwa, F.F., McNaughton, M.M., 1997. Promotion of the
cycling of diet-enhancing nutrients by African grazers. Science 278 (5344), 1798-
1800.
Melbourne, B.A., 1999. Bias in the effects of habitat structure on pitfall traps: An
experimental evaluation. Aust. J. Ecol. 24 (3), 228-239.
Mitteager, W.A., Burke, A., Nordstrom, K.F., 2006. Landscape features and
restoration potential on private shorefront lots in New Jersey, USA. J. Coastal Res.
Special Issue 39, 891-898.
Morris, M.G., 2000. The effects of structure and its dynamics on the ecology and
conservation of arthropods in British grasslands. Biol. Conserv. 95, 129-142.
Newton, A.C., Stewart, G.B., Myers, G., Diaz, A., Lake, S., Bullock, J.M., Pullin, A.S.,
2009. Impacts of grazing on lowland heathland in north-west Europe. Biol. Conserv.
142, 935-947.
Olson, D.M., Wäckers, F.L., 2007. Management of field margins to maximize
multiple ecological services. J. Appl. Ecol. 44, 13-21.
Grassland grazing and ecosystem services Chapter 3
65
Paar, P., Röhricht, W., Schuler, J., 2008. Towards a planning support system for
environmental management and agri-environmental measures – The Colorfields
study. J. Environ. Manage. 89, 234-244.
Plassmann, K., Edwards-Jones, G., Jones, M.L.M., 2010. Effects of long-term grazing
management on sand dune vegetation of high conservation interest. Appl. Veg. Sci.
13 (1), 100-112.
Potts, S.G., Vulliamy, B., Dafni, A., Ne’aman, G., Willmer, P., 2003. Linking bees and
flowers: How do floral communities structure pollinator communities? Ecology 84
(10), 2628-2642.
Power, A.G., 2010. Ecosystem services and agriculture: tradeoffs and synergies.
Philos. T. Roy. Soc. B 365 (1554), 2959-2971.
Pykälä, J., 2003. Effects of restoration with cattle grazing on plant species
composition and richness of semi-natural grasslands. Biodivers. Conserv. 12 (11),
2211-2226.
R Development Core Team, 2011. R: A language and environment for statistical
computing. R Foundation for Statistical Computing, Vienna, Austria. ISBN 3-900051-
07-0, URL http://www.R-project.org.
Rasse, D.P., Rumpel, C., Dignac, M., 2005. Is soil carbon mostly root carbon?
Mechanisms for a specific stabilisation. Plant Soil 269 (1-2), 341–356.
Rook, A.J., Dumont, B., Isselstein, J., Osoro, K., WallisDeVries, M.F., Parente, G.,
Mills, J., 2004. Matching type of livestock to desired biodiversity outcomes in
pastures – a review. Biol. Conserv. 119, 137-150.
Rotz, C.A., Taube, F., Russelle , M.P., Oenema, J., Sanderson, M. A., Wachendorf,
M., 2005. Whole-farm perspectives of nutrient flows in grassland agriculture. Crop
Sci. 45 (6), 2139-2159.

Grassland grazing and ecosystem services Chapter 3
66
Rowe, E.C., Emmett B.A., Smart, S.M., Frogbrook, Z.L., 2011. A new net
mineralisable nitrogen assay improves predictions of floristic composition. J. Veg.
Sci. 22 (2), 251-261.
Schmidt, N.M., Olsen, H., Bildsoe, M., Sluydts, V. & Leirs, H., 2005. Effects of grazing
intensity on small mammal population ecology in wet meadows. Basic Appl. Ecol. 6
(1), 57-66.
Sjödin, N.E., Bengtsson, J., Ekbom, B., 2008. The influence of grazing intensity and
landscape composition on the diversity and abundance of flower-visiting insects. J.
Appl. Ecol. 45, 763-772.
Söderström, B., Pärt, T., Linnarsson, E., 2001. Grazing effects on between-year
variation of farmland bird communities. Ecol. Appl. 11 (4), 1141-1150.
Soussana, J.F., Loiseau, P., Vuichard, N., Ceschia, E., Balesdent, J., Chevallier, T.,
Arrouays, D., 2004. Carbon cycling and sequestration opportunities in temperate
grasslands. Soil Use Manage. 20 (2), 219-230.
Strijker, D., 2005. Marginal lands in Europe – causes of decline. Basic Appl. Ecol. 6
(2), 99-106.
Van Wijnen, N.J., Wal, R. & Bakker, J.P., 1997. The impact of herbivores on nitrogen
mineralization rate: consequences for salt-marsh succession. Oecologia 118 (2),
225-231.
Vickery, J.A., Tallowin, J.R., Feber, R.E., Asteraki, E.J., Atkinson, P.W., Fuller, R.J.,
Brown, V.K., 2001. The management of lowland neutral grasslands in Britain: Effects
of agricultural practices on birds and their food resources. J. Appl. Ecol. 38 (3), 647-
664.
Wood, J.D., Richardson, R.I., Scollan, N.D., Hopkins, A., Dunn, R., Buller, H.,
Whittington, F.M., 2007. Quality of meat from biodiverse grassland. In: Hopkins, J.J.,
Duncan, A.J., McCracken, D.I., Peel, S., Tallowin, J.R.B. (Eds.), High Value Grassland,
British Grassland Society, Cirencester, pp. 107-116.
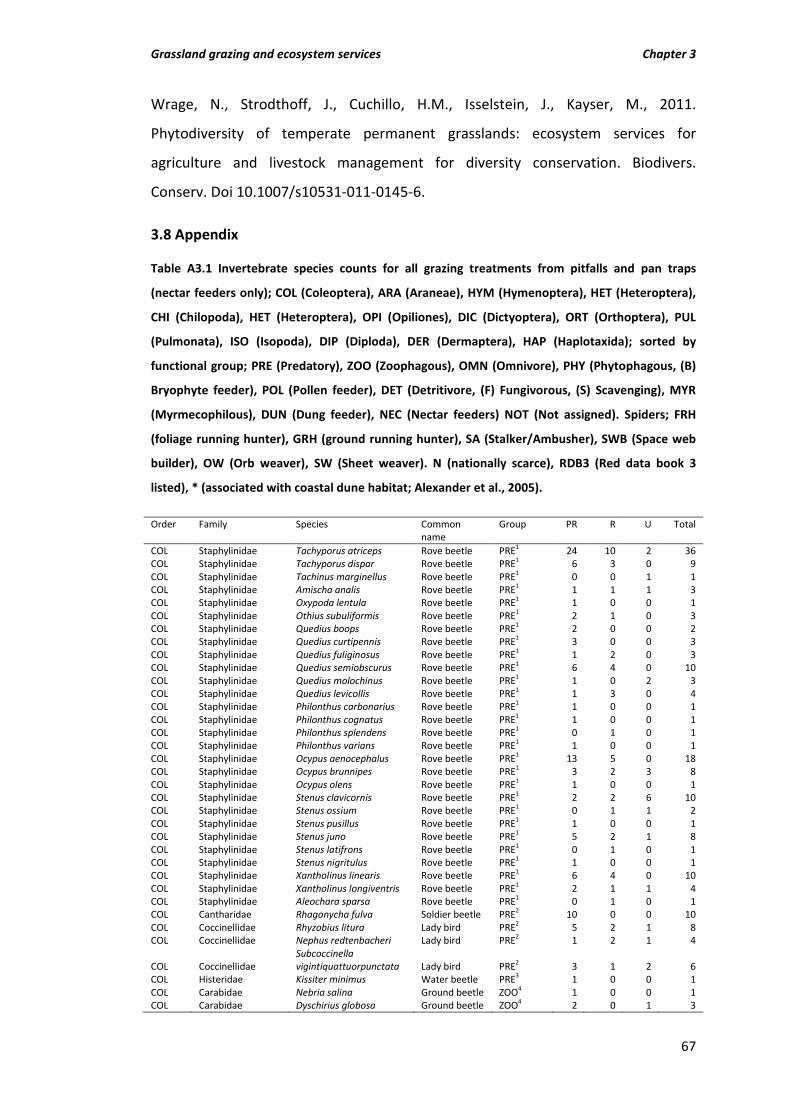
Grassland grazing and ecosystem services Chapter 3
67
Wrage, N., Strodthoff, J., Cuchillo, H.M., Isselstein, J., Kayser, M., 2011.
Phytodiversity of temperate permanent grasslands: ecosystem services for
agriculture and livestock management for diversity conservation. Biodivers.
Conserv. Doi 10.1007/s10531-011-0145-6.
3.8 Appendix
Table A3.1 Invertebrate species counts for all grazing treatments from pitfalls and pan traps
(nectar feeders only); COL (Coleoptera), ARA (Araneae), HYM (Hymenoptera), HET (Heteroptera),
CHI (Chilopoda), HET (Heteroptera), OPI (Opiliones), DIC (Dictyoptera), ORT (Orthoptera), PUL
(Pulmonata), ISO (Isopoda), DIP (Diploda), DER (Dermaptera), HAP (Haplotaxida); sorted by
functional group; PRE (Predatory), ZOO (Zoophagous), OMN (Omnivore), PHY (Phytophagous, (B)
Bryophyte feeder), POL (Pollen feeder), DET (Detritivore, (F) Fungivorous, (S) Scavenging), MYR
(Myrmecophilous), DUN (Dung feeder), NEC (Nectar feeders) NOT (Not assigned). Spiders; FRH
(foliage running hunter), GRH (ground running hunter), SA (Stalker/Ambusher), SWB (Space web
builder), OW (Orb weaver), SW (Sheet weaver). N (nationally scarce), RDB3 (Red data book 3
listed), * (associated with coastal dune habitat; Alexander et al., 2005).
Order Family Species Common name
Group PR R U Total
COL Staphylinidae Tachyporus atriceps Rove beetle PRE1 24 10 2 36 COL Staphylinidae Tachyporus dispar Rove beetle PRE1 6 3 0 9 COL Staphylinidae Tachinus marginellus Rove beetle PRE1 0 0 1 1 COL Staphylinidae Amischa analis Rove beetle PRE1 1 1 1 3 COL Staphylinidae Oxypoda lentula Rove beetle PRE1 1 0 0 1 COL Staphylinidae Othius subuliformis Rove beetle PRE1 2 1 0 3 COL Staphylinidae Quedius boops Rove beetle PRE1 2 0 0 2 COL Staphylinidae Quedius curtipennis Rove beetle PRE1 3 0 0 3 COL Staphylinidae Quedius fuliginosus Rove beetle PRE1 1 2 0 3 COL Staphylinidae Quedius semiobscurus Rove beetle PRE1 6 4 0 10 COL Staphylinidae Quedius molochinus Rove beetle PRE1 1 0 2 3 COL Staphylinidae Quedius levicollis Rove beetle PRE1 1 3 0 4 COL Staphylinidae Philonthus carbonarius Rove beetle PRE1 1 0 0 1 COL Staphylinidae Philonthus cognatus Rove beetle PRE1 1 0 0 1 COL Staphylinidae Philonthus splendens Rove beetle PRE1 0 1 0 1 COL Staphylinidae Philonthus varians Rove beetle PRE1 1 0 0 1 COL Staphylinidae Ocypus aenocephalus Rove beetle PRE1 13 5 0 18 COL Staphylinidae Ocypus brunnipes Rove beetle PRE1 3 2 3 8 COL Staphylinidae Ocypus olens Rove beetle PRE1 1 0 0 1 COL Staphylinidae Stenus clavicornis Rove beetle PRE1 2 2 6 10 COL Staphylinidae Stenus ossium Rove beetle PRE1 0 1 1 2 COL Staphylinidae Stenus pusillus Rove beetle PRE1 1 0 0 1 COL Staphylinidae Stenus juno Rove beetle PRE1 5 2 1 8 COL Staphylinidae Stenus latifrons Rove beetle PRE1 0 1 0 1 COL Staphylinidae Stenus nigritulus Rove beetle PRE1 1 0 0 1 COL Staphylinidae Xantholinus linearis Rove beetle PRE1 6 4 0 10 COL Staphylinidae Xantholinus longiventris Rove beetle PRE1 2 1 1 4 COL Staphylinidae Aleochara sparsa Rove beetle PRE1 0 1 0 1 COL Cantharidae Rhagonycha fulva Soldier beetle PRE2 10 0 0 10 COL Coccinellidae Rhyzobius litura Lady bird PRE2 5 2 1 8 COL Coccinellidae Nephus redtenbacheri Lady bird PRE2 1 2 1 4
COL Coccinellidae Subcoccinella vigintiquattuorpunctata Lady bird PRE2 3 1 2 6
COL Histeridae Kissiter minimus Water beetle PRE3 1 0 0 1 COL Carabidae Nebria salina Ground beetle ZOO4 1 0 0 1 COL Carabidae Dyschirius globosa Ground beetle ZOO4 2 0 1 3

Grassland grazing and ecosystem services Chapter 3
68
COL Carabidae Pterostichus versicolor Ground beetle ZOO4 1 0 0 1 COL Carabidae Calathus fuscipes Ground beetle ZOO4 24 7 0 31 COL Carabidae Calathus melanocephalus Ground beetle ZOO4 23 8 0 31 COL Carabidae Badister bipustulatus Ground beetle ZOO4 8 5 5 18 COL Carabidae Metabletus foveatus Ground beetle ZOO4 2 1 0 3 COL Carabidae Notiophilus aquaticus Ground beetle ZOO4 1 0 0 1 COL Carabidae Trechus obtusus Ground beetle ZOO4 0 0 1 1 COL Carabidae Pterostichus niger Ground beetle ZOO4 0 2 0 2 COL Carabidae Amara aenea Ground beetle PHY4 4 3 0 7 COL Carabidae Amara communis Ground beetle PHY4 0 4 0 4 COL Carabidae Amara lucida Ground beetle PHY4 N 1 3 0 4 COL Carabidae Amara lunicollis Ground beetle PHY4 2 4 3 9 COL Carabidae Amara ovata Ground beetle PHY4 0 0 1 1 COL Carabidae Amara tibialis Ground beetle PHY4 3 1 0 4 COL Carabidae Harpalus tardus Ground beetle PHY4 2 1 1 4 COL Leiodidae Leiodes rugosa Fungus beetle PHY5 2 0 0 2 COL Leiodidae Leiodes rufipennis Fungus beetle PHY5 12 10 2 24 COL Leiodidae Sciodrepoides watsoni Fungus beetle PHY5 1 0 0 1 COL Leiodidae Catops fuliginosus Fungus beetle PHY5 0 0 8 8 COL Leiodidae Catops morio Fungus beetle PHY5 0 2 2 4 COL Leiodidae Agathidium laevigatum Fungus beetle PHY5 1 0 0 1 COL Byrrhidae Simplocaria semistriata Pill beetle PHY5 (B) 0 2 0 2
COL Dryopidae Dryops ernesti Long-toed water beetle PHY5 2 0 0 2
COL Dryopidae Dryops luridus Long-toed water beetle PHY5 0 0 1 1
COL Tenebrionidae Lagria hirta Darkling beetle PHY5 2 0 2 4
COL Tenebrionidae Melanimon tibialis Darkling beetle PHY5 7 5 1 13
COL Tenebrionidae Phylan gibbus Darkling beetle PHY5 2 2 1 5
COL Tenebrionidae Cteniopus suphureus Darkling beetle PHY5 1 1 0 2
COL Chrysomelidae Chrysomela populi Leaf beetle PHY5 2 0 0 2 COL Chrysomelidae Galerucella tenella Leaf beetle PHY5 1 0 0 1 COL Chrysomelidae Lochmaea capreae Leaf beetle PHY5 1 3 0 4 COL Chrysomelidae Longitarsus gracilis Leaf beetle PHY5 1 2 0 3 COL Chrysomelidae Longitarsus luridus Leaf beetle PHY5 6 5 0 11 COL Chrysomelidae Longitarsus jacobaea Leaf beetle PHY5 39 1 0 40 COL Chrysomelidae Cassida prasina Leaf beetle PHY5 0 0 1 1 COL Chrysomelidae Chaetocnema hortensis Leaf beetle PHY5 1 0 0 1
COL Chrysomelidae Neocrepidodera ferruginea Leaf beetle PHY5 20 13 1 34
COL Chrysomelidae Neocrepidodera transversa Leaf beetle PHY5 1 0 0 1
COL Curculionidae Otiorrhynchus ovatus Weevil PHY5 1 2 1 4 COL Curculionidae Philopedon plagiatus Weevil PHY5 10 12 4 26 COL Curculionidae Sitona lineellus Weevil PHY5 3 1 0 4 COL Curculionidae Hypera plantaginis Weevil PHY5 7 3 0 10 COL Curculionidae Apion pubescens Weevil PHY5 3 0 0 3 COL Elateridae Agrypnus murinus Click beetle POL6 33 20 3 56 COL Elateridae Agriotes obscurus Click beetle POL6 11 5 0 16 COL Hydrophilidae Megasternum concinnum Water beetle DET7 19 10 6 35 COL Staphylinidae Anotylus tetracarinatus Rove beetle DET1 1 0 0 1 COL Staphylinidae Ischnosoma splendidum Rove beetle DET1 (F) 0 1 5 6 COL Staphylinidae Mycetoporus piceolus Rove beetle DET1 (F) N 5 9 13 27 COL Staphylinidae Mycetoporus punctus Rove beetle DET1 (F) N 0 1 0 1 COL Staphylinidae Atheta brunneipennis Rove beetle DET1 (F) 0 0 1 1
COL Staphylinidae Micropeplus staphylinoides Rove beetle DET1 (F) 0 1 0 1
COL Latridiidae Corticaria minuta Scavenger beetle DET8 (F) 0 0 1 1
COL Staphylinidae Drusilla caniculatata Rove beetle MYR1 0 6 0 6 COL Staphylinidae Zyras collaris Rove beetle MYR1 0 0 1 1 COL Staphylinidae Platydracus stercorarius Rove beetle MYR1 9 6 0 15 COL Scarabaeidae Aphodius prodromus Dung beetle DUN9 0 1 0 1 COL Scarabaeidae Onthophagus similis Dung beetle DUN9 5 0 1 6 COL Scarabaeidae Geotrupes stercorarius Dung beetle DUN9 0 0 2 2 COL Scarabaeidae Aphodius fimetarius Dung beetle DUN9 1 0 0 1 COL Scarabaeidae Aphodius rufipes Dung beetle DUN9 1 0 0 1

Grassland grazing and ecosystem services Chapter 3
69
COL Scarabaeidae Sericea brunnea Dung beetle DUN9 0 1 0 1
COL Carabidae Philorhizus melanocephalus Ground beetle NOT 0 1 2 3
COL Staphylinidae Mocyta fungi Rove beetle NOT 23 13 12 48 COL Staphylinidae Pella limbata Rove beetle NOT 0 0 1 1 COL Staphylinidae Bisnius sordidus Rove beetle NOT 4 0 0 4 COL Staphylinidae Badura macrocera Rove beetle NOT 1 0 0 1 COL Staphylinidae Megalinus glabratus Rove beetle NOT 3 0 0 3 COL Lampyridae Lampyris noctiluca Glow worm NOT 3 1 1 5 ARA Clubionidae Cheiracanthium virescens Foliage spider PRE10
(FRH) 1 0 0 1
ARA Clubionidae clubionid juveniles Foliage spider PRE10 (FRH)
3 1 0 4
ARA Gnaphosidae Drassodes cupreus Ground spider PRE10 (GRH)
10 3 2 15
ARA Gnaphosidae Haplodrassus signifer Ground spider PRE10 (GRH)
0 2 0 2
ARA Gnaphosidae Zelotes electus Ground spider PRE10 (GRH)
19 6 0 25
ARA Gnaphosidae Zelotes latreillei Ground spider PRE10 (GRH)
4 19 16 39
ARA Gnaphosidae Micraria pulicaria Ground spider PRE10 (GRH)
0 0 1 1
ARA Gnaphosidae Gnaphosid juveniles Ground spider PRE10 (GRH)
2 12 1 15
ARA Lycosidae Pardosa monticola Wolf spider PRE10 (GRH)
643 371 5 1019
ARA Lycosidae Pardosa palustris Wolf spider PRE10 (GRH)
33 2 0 35
ARA Lycosidae Pardosa armentata Wolf spider PRE10 (GRH)
2 0 0 2
ARA Lycosidae Pardosa pullata Wolf spider PRE10 (GRH)
103 360 269 732
ARA Lycosidae Pardosa nigriceps Wolf spider PRE10 (GRH)
15 52 145 212
ARA Lycosidae Alopeosa barbipes Wolf spider PRE10 (GRH)
1 0 0 1
ARA Lycosidae Alopecosa pulverulenta Wolf spider PRE10 (GRH)
49 27 7 83
ARA Lycosidae Trochosa ruricola Wolf spider PRE10 (GRH)
1 0 0 1
ARA Lycosidae Trochosa terricola Wolf spider PRE10 (GRH)
10 6 2 18
ARA Lycosidae lycosid juveniles Wolf spider PRE10 (GRH)
122 98 44 264
ARA Thomisidae Xysticus cristatus Crab spider PRE10 (SA) 11 2 0 13 ARA Thomisidae Xysticus erraticus Crab spider PRE10 (SA) 17 4 0 21 ARA Thomisidae Xysticus kochi Crab spider PRE10 (SA) 11 1 0 12 ARA Thomisidae Ozyptila atomaria Crab spider PRE10 (SA) 1 0 0 1 ARA Thomisidae thomisid juveniles Crab spider PRE10 (SA) 9 3 2 14 ARA Salticidae Euophys frontalis Jumping
spider PRE10 (SA) 0 0 1 1
ARA Salticidae Heliophanus flavipes Jumping spider
PRE10 (SA) 0 0 1 1
ARA Theridiidae Enoplognatha thoracica Comb spider PRE10 (SWB)
1 0 0 1
ARA Dictynidae Argenna subnigra Mesh webbed spider
PRE10 (SWB)
58 60 4 122
ARA Tetragnathidae Pachygnatha degeeri Orb weaver PRE10 (OW)
473 212 25 710
ARA Linyphiidae Ceratinella brevipes Sheet weaver PRE10 (SW) 1 0 0 1 ARA Linyphiidae Ceratinella brevis Sheet weaver PRE10 (SW) 0 0 2 2 ARA Linyphiidae Walckenaeria acuminata Sheet weaver PRE10 (SW) 0 2 9 11 ARA Linyphiidae Walckenaeria antica Sheet weaver PRE10 (SW) 11 14 6 31 ARA Linyphiidae Walckenaeria atrotibialis Sheet weaver PRE10 (SW) 0 3 1 4 ARA Linyphiidae Walckenaeria monoceros Sheet weaver PRE10 (SW) 18 2 1 21 ARA Linyphiidae Walckenaeria vigilax Sheet weaver PRE10 (SW) 0 1 0 1 ARA Linyphiidae Dicymbium nigrum Sheet weaver PRE10 (SW) 8 3 0 11 ARA Linyphiidae Peponocranium ludicrum Sheet weaver PRE10 (SW) 0 0 1 1 ARA Linyphiidae Oedothorax fuscus Sheet weaver PRE10 (SW) 4 0 1 5 ARA Linyphiidae Oedothorax retusus Sheet weaver PRE10 (SW) 5 0 0 5

Grassland grazing and ecosystem services Chapter 3
70
ARA Linyphiidae Pelecopsis parallela Sheet weaver PRE10 (SW) 2 0 0 2 ARA Linyphiidae Pocadicnemis pumila Sheet weaver PRE10 (SW) 1 0 3 4 ARA Linyphiidae Mecopisthes peusi Sheet weaver PRE10 (SW)
N 13 3 1 17
ARA Linyphiidae Trichopterna thorelli Sheet weaver PRE10 (SW) 0 2 0 2 ARA Linyphiidae Cnephalocotes obscurus Sheet weaver PRE10 (SW) 0 2 1 3 ARA Linyphiidae Erigone atra Sheet weaver PRE10 (SW) 5 0 0 5 ARA Linyphiidae Erigone dentipalpis Sheet weaver PRE10 (SW) 3 0 0 3 ARA Linyphiidae Tiso vagans Sheet weaver PRE10 (SW) 95 69 12 176 ARA Linyphiidae Troxochrus scabriculus Sheet weaver PRE10 (SW) 0 1 3 4 ARA Linyphiidae Tapinocyba praecox Sheet weaver PRE10 (SW) 11 0 2 13 ARA Linyphiidae Gongylidiellum vivum Sheet weaver PRE10 (SW) 15 9 6 30 ARA Linyphiidae Erigonella hiemalis Sheet weaver PRE10 (SW) 0 1 0 1 ARA Linyphiidae Agyneta decora Sheet weaver PRE10 (SW) 5 1 1 7 ARA Linyphiidae Centromerita concinna Sheet weaver PRE10 (SW) 3 6 0 9 ARA Linyphiidae Centromerus prudens Sheet weaver PRE10 (SW) 0 0 1 1 ARA Linyphiidae Stemonyphantes lineatus Sheet weaver PRE10 (SW) 2 1 0 3 ARA Linyphiidae Bathyphantes gracilis Sheet weaver PRE10 (SW) 3 2 0 5 ARA Linyphiidae Bathyphantes parvulus Sheet weaver PRE10 (SW) 4 1 0 5 ARA Linyphiidae Lepthyphantes tenuis Sheet weaver PRE10 (SW) 23 10 2 35 ARA Linyphiidae Lepthyphantes mengei Sheet weaver PRE10 (SW) 0 6 1 7 ARA Linyphiidae Lepthyphantes pallidus Sheet weaver PRE10 (SW) 6 23 5 34
ARA Linyphiidae Lepthyphantes zimmermani Sheet weaver PRE10 (SW) 1 2 0 3
ARA Linyphiidae juveniles Linyphiidae* Sheet weaver PRE10 (SW) 55 33 6 94 HYM Formicidae Lasius fuliginosus Ant PRE11 (P) 0 0 1 1 HYM Formicidae Lasius mixtus Ant PRE12 (P) 3 8 9 20 HYM Formicidae Lasius umbratus Ant PRE13 (P) 1 0 0 1 HET Nabidae Nabis flavomarginatus Damsel bug PRE14 0 1 0 1 CHI Lithobiidae Lithobius microps Centipede PRE15 0 1 2 3
HET Dipsocoridae Ceratocombus coleoptratus PRE16 0 0 8 8
OPI Nemastomatidae Nemastoma bimaculata Harvestmen ZOO15 0 0 1 1 OPI Phalangiinae Lacinius ephippiatus Harvestmen ZOO15 0 5 2 7 OPI Phalangiinae Platybunus triangularis Harvestmen ZOO15 5 7 2 14 OPI Phalangiinae Lophopilio palpinalis Harvestmen ZOO15 0 3 0 3 OPI Phalangiinae Oligolophus tridens Harvestmen ZOO15 1 0 0 1 OPI Phalangiinae Phalangium opilio Harvestmen ZOO15 204 53 4 261 OPI Phalangiinae Opilio saxatilis Harvestmen ZOO15 20 22 10 52 OPI Leiobunidae Leiobunum blackwalli Harvestmen ZOO15 0 0 1 1 OPI Leiobunidae Leiobunum rotundum Harvestmen ZOO15 0 1 0 1 OPI immature harvesters* Harvestmen ZOO15 36 23 20 79 HYM Formicidae Formica fusca Ant OMN2 3 2 2 7 HYM Formicidae Lasius niger Ant OMN17 36 47 77 160 HYM Formicidae Myrmica rubra Ant OMN2 1 30 10 41 HYM Formicidae Myrmica ruginodis Ant OMN17 9 34 23 66 HYM Formicidae Myrmica sabuleti Ant OMN17 165 124 4 293 HYM Formicidae Myrmica scabrinodis Ant OMN17 21 10 34 65 DIC Ectobiinae Ectobius panzeri Cockroach OMN18 11 2 1 14 HET Tingidae Acalypta parvula Lace bug PHY14 71 34 38 143 HET Berytidae Berytinus minor Stilt bug PHY14 4 3 0 7 HET Berytidae Berytinus montivagus Stilt bug PHY14 3 2 0 5 HET Tingidae Kalama tricornis Lace bug PHY14 204 110 9 323
HET Lygaeidae Megalonotus praetextatus Ground bug PHY14 N 0 1 0 1
HET Lygaeidae Stygnocoris sabulosus Ground bug PHY14 2 0 1 3 HET Lygaeidae Plinthiscus brevipennis Ground bug PHY14 0 0 1 1 HET Rhopalidae Myrmus miriformis PHY14 0 1 1 2 ORT Acrididae Chorthippus brunneus Grasshopper PHY15 * 0 0 1 1 ORT Acrididae Omocestus viridulus Grasshopper PHY15 * 0 2 0 2
ORT Acrididae Myrmeleotettix maculatus Grasshopper PHY15 * 1 1 0 2
PUL Snails & slugs PHY15 150 153 80 383 ISO Trichoniscidae Trichoniscus pusillus Woodlouse DET15 (S) 0 1 0 1 ISO Philosciidae Philoscia muscorum Woodlouse DET15 (S) 295 1251 136 1682 ISO Armadillidiidae Armadillidium vulgare Woodlouse DET15 (S) 52 347 37 436 ISO Porcellionidae Porcellio scaber Woodlouse DET15 (S) 71 123 116 310 DIP Julidae Cylindroiulus latestriatus Millipede DET15 (S) 354 196 137 687 DIP Julidae Julus scandinavius Millipede DET15 (S) 0 0 1 1 DIP Julidae Ophyiulus pilosus Millipede DET15 (S) 20 1 3 24 DIP Julidae Brachyiulus pusillus Millipede DET15 (S) 15 7 8 30

Grassland grazing and ecosystem services Chapter 3
71
DIP Julidae Omatoiulus sabulosus Millipede DET15 (S) 0 1 0 1 DIP Polydesmidae Polydesmus angustatus Millipede DET15 (S) 2 3 1 6 DER Forficulidae Forficula auricularia Earwig DET15 (S) * 14 4 1 19 HAP Lumbricidae. Earthworm DET15 53 30 11 94
HYM Colletidae Colletes cunicularius Mining bee NEC2 RDB3 0 0 2 2
HYM Colletidae Colletes fodiens Solitary bee NEC2 1 0 0 1 HYM Andrenidae Andrena nigroaenea Mining bee NEC2 0 0 1 1 HYM Halictidae Lasioglossum albipes Solitary bee NEC2 4 2 1 7 HYM Megachilidae Osmia aurulenta Mason bee NEC2 0 0 4 4
HYM Megachilidae Osmia rufa Red mason bee NEC2 0 0 1 1
HYM Colletidae Hylaeus communis Yellow face bee NEC2 2 4 3 9
HYM Apinae Bombus hortorum Bumble bee NEC2 3 6 0 9 HYM Apinae Bombus lapidarius Bumble bee NEC2 0 5 13 18 HYM Apinae Bombus pascuorum Bumble bee NEC2 5 4 6 15 HYM Apinae Bombus terrestris Bumble bee NEC2 0 7 0 7 HYM Apinae Bombus bohemicus Bumble bee NEC2 3 0 0 3 HYM Apinae Bombus lucorum Bumble bee NEC2 0 0 11 11 HYM Apidae Apis mellifera Honey bee NEC2 0 0 5 5 1 Clough, Y., Kruess, A. & Tscharntke (2007). Organic versus conventional arable
farming systems: Functional grouping helps understand staphylinid response.
Agriculture Ecosystems & Environment, 118, 285-290.
2 Chinery, M. (1986) Collins guide to the insects of Britain and Western Europe.
HarperCollins Publishers, London, UK.
3 Watford Coleoptera Group, www.thewcg.org.uk (last accessed 02.11.11).
4 Vanbergen, A. J. et al. (2010) Trophic level modulates carabid beetle responses to
habitat and landscape structure: a pan-European study. Ecological Entomology, 35,
226-235.
5 Eyre, M.D. & Luff, M.L. (2005) The Distribution of Epigeal Beetle (Coleoptera)
Assemblages on the North-East England Coast. Journal of Coastal Research, 215,
982-990.
6 Elateridae of the British Isles, www.elateridae.co.uk (last accessed 02.11.11).
7 Lassau, S.A., Hochuli, D.F., Cassis, G. & Reid, C.A.M. (2005) Effects of habitat
complexity on forest beetle diversity: do functional groups respond consistently?
Diversity and Distributions, 11, 73-82.
8 Latridiidae, www.tolweb.org/Latridiidae (last accessed 02.11.11).

Grassland grazing and ecosystem services Chapter 3
72
9 Lobo, J.M., Hortal, J. & Cabrero-Sanudo F.J. (2006) Regional and local influence of
grazing activity on the diversity of a semi-arid dung beetle community. Diversity and
Distributions, 12, 111-123.
10 Uetz, G.W., Halaj, J. & Cady, A.B. (1999) Guild Structure of Spiders in Major Crops.
The Journal of Arachnology, 27, 270-280.
11 Akino, T. (2002) Intrusion on the host ant species Lasius japonicus by queens of
the shining black ant Lasius fulginosus (Hymenoptera: Formicidae). Entomological
Science, 5, 179-186.
12 Schlick-Steiner, B.C., Steiner, F.M. & Seifert, B. (2002) Lasius flavus - A host
species of Lasius mixtus (Hymenoptera : Formicidae). Sociobiology, 39, 141-143.
13 Myrmecos.net, http://www.myrmecos.net/formicinae (last accessed 02.11.11).
14 British bugs, http://www.britishbugs.org.uk (last accessed 02.11.11).
15 Tilling, S.M. (1987) A key to the major groups of British Terrestrial Invertebrates.
Field Studies, 6, 695-766.
16 http://delta-intkey.com (last accessed 02.11.11).
17 O'Grady, A., Schmidt, O. & Breen, J. (2010) Trophic relationships of grassland ants
based on stable isotopes. Pedobilogia, 53, 221-225.
18 Orthoptera, www.orthoptera.org.uk. (last accessed 02.11.11).

Grazing and saltmarsh invertebrates Chapter 4
73
Chapter 4: Grazing management in saltmarsh ecosystems drives
invertebrate diversity, abundance and functional group structure
Hilary Ford, Angus Garbutt, Laurence Jones & Davey L. Jones
Accepted for publication in Insect Conservation and Diversity
http://dx.doi.org/10.1111/j.1752-4598.2012.00202.x
4.1 Abstract
1. Saltmarsh conservation management often involves livestock grazing to
maximise plant diversity and provide suitable breeding habitat for over-wintering
coastal birds. The effect of grazing on invertebrates is rarely quantified, but results
from limited studies of terrestrial and coastal grasslands demonstrate greater
abundance and species richness in un-grazed grassland.
2. The impact of short sward (< 8 cm) cattle grazing on the ground dwelling
invertebrate community was assessed on an English inter-tidal upper salt marsh
using pitfall traps. Abundance, species richness, functional group structure,
abundance of coastal specialists, environmental factors that influence invertebrate
habitat choice and food web composition were compared for grazed and un-grazed
marsh.
3. In total, 90000 invertebrates were sampled. Predatory, zoophagus and
detritivorous Coleoptera were significantly more abundant on the un-grazed marsh.
In contrast, predatory Hemiptera and Araneae were significantly more abundant on
the grazed marsh. Sheet weaver spiders were significantly more abundant on the
grazed marsh, foliage running hunters and space web builders more abundant on
the un-grazed marsh. Most inter-tidal coastal specialist species exhibited clear
habitat preference for the grazed marsh. Total species richness was not significantly
different between grazing treatments.

Grazing and saltmarsh invertebrates Chapter 4
74
4. RDA analysis showed that two environmental variables influenced by grazing
intensity, soil temperature and vegetation height, significantly explained the
composition of invertebrate functional groups. Larger bodied invertebrates
dominated the un-grazed food web.
5. We conclude that both short sward cattle grazed and un-grazed saltmarsh
habitat should be maintained to maximise invertebrate abundance and diversity
and provide suitable habitat for coastal specialists.
Key words Araneae, biodiversity, body size, Coleoptera, Hemiptera, food web,
insects, pitfall, prey capture method, spiders.
4.2 Introduction
European salt marshes are highly productive and were traditionally managed as
agricultural livestock grazing land (Bouchard et al., 2003; Doody, 2008). Grazing is
still common place within the salt marshes of North West Europe and is often
maintained with the twin conservation aims of maximising plant and bird diversity
(Chatters, 2004; Milsom et al., 2000). It is well known that intermediate grazing
pressure maximises plant diversity on Northern European marshes (Adam, 1990;
Bakker et al., 1993). Birds, however, show a variable response to grazing intensity
as each species exhibits a particular habitat preference (Daan et al., 2002; Bouchard
et al., 2003). Salt marshes are also an important coastal habitat for both highly
specialised inter-tidal invertebrates (Pétillon et al., 2005), certain Red Data Book
(RDB) listed or Biodiversity Action Plan (BAP) species (Alexander et al., 2005; Webb
et al., 2010) and other invertebrates common to grasslands.
The effects of saltmarsh grazing management on invertebrate diversity and
abundance are poorly understood. Previous saltmarsh invertebrate studies have
tended to focus on the zonation of particular groups, especially carabid beetles and
spiders, with marsh elevation. Irmler et al. (2002) and Finch et al. (2007) both found
that species richness of carabid beetles and Araneae increased with distance above
mean high tide. British carabid and Staphylinidae saltmarsh communities have also
been well documented (Hammond, 2000; Luff & Eyre, 2000). Most studies report

Grazing and saltmarsh invertebrates Chapter 4
75
higher invertebrate species richness and abundance in un-grazed systems for both
salt marshes and other grasslands (Bakker et al., 1993; Gibson et al., 1992a; Morris,
2000; Kruess & Tscharntke, 2002). Pétillon et al. (2007) found that although this
was true for spiders, for Coleoptera species richness was higher on grazed marsh.
Short sward, livestock grazed marshes provide a suitable habitat for inter-tidal
coastal specialist species (Andresen et al., 1990).
We define invertebrate coastal specialists as those species that are only found in
inter-tidal or estuarine habitats. These species are habitually or physiologically
adapted to cope with tidal inundation and variable salinity. Some species, such as
the saltmarsh spider Pardosa purbeckensis avoid flooding by moving vertically in tall
vegetation, but if submerged in saline water they survive longer than related
terrestrial wolf spiders (Pétillon et al., 2011). Another saltmarsh spider, Arctosa
fulvolineata, withstands submersion by entering a hypoxic coma (Pétillon et al.,
2009). Some invertebrate species can osmoregulate in saline environments,
controlling the water balance within their bodies (Williams & Hamm, 2002). Other
marine invertebrates take advantage of plastron respiration (Flynn & Bush, 2008).
Terrestrial invertebrates that occur in habitats likely to flood are often opportunists
able to migrate horizontally to higher ground, enter a dormant stage underwater or
reproduce rapidly to take advantage of flood free periods (Adis & Junk, 2002).
Livestock grazing reduces above-ground biomass and vegetation height, causes a
rapid turnover of plant material via the production of fresh leaves, reduces plant
litter build up and has direct effects on plant species composition and structure via
preference or avoidance of particular plant species by livestock (Adam, 1990; Bos,
2002). Sheep provide a uniform short sward whereas cattle, as more selective
feeders, often produce a more ‘tussocky’ sward (Adam, 1990; Lambert, 2000). With
high stocking density cattle can however produce a short, even sward of high
quality forage, attractive for feeding geese, or provide variable structure, suitable
for breeding birds (Bakker, 1989; Bos, 2002). In contrast, either in historically un-
grazed or abandoned upper salt marshes tall unpalatable grasses, such as Elytrigia
athericus dominate (Bakker et al., 1993; Van Wijnen & Bakker, 1997; Bakker et al.,
2002). Livestock grazing also impacts upon abiotic marsh characteristics. Short

Grazing and saltmarsh invertebrates Chapter 4
76
grazed vegetation leads to greater and more variable soil temperatures than un-
grazed grassland (Curry, 1994). Cattle disturbance generally results in a
topographically variable soil surface whereas sheep evenly compact it, but both can
lead to waterlogged ground with high soil salinity (Lambert, 2000). Grazing
herbivores also return nutrients to the soil via dung input (Bakker et al., 1993).
Abundance and diversity of terrestrial invertebrate fauna is greatest on un-grazed
marshes, with a food web dominated by detritivores, as tall vegetation and
increased litter layer depth increase available niches, food provision and provide
cover from predators (Adam, 1990; Curry, 1994). The grazed marsh invertebrate
food web is dominated by warmth seeking inter-tidal coastal specialists and
phytophagus individuals dependent upon particular plant species (Andresen et al.,
1990; Bakker et al., 1993). If grazing intensity is very high phytophagus
invertebrates also decline (Meyer et al., 1995). The marsh invertebrate food web
can be characterised using functional groups (Blondel, 2003), in our study different
trophic categories. ‘Bottom-up’ processes such as resource limitation or ‘top-down’
processes such as population limitation by predators can be studied using a
functional group approach (Chen & Wise, 1999). Few studies have looked at the
response of saltmarsh invertebrate functional groups to grazing. Meyer et al. (1995)
described how the European saltmarsh invertebrate food web differed with sheep
grazing intensity but most studies focus on either the macro-invertebrate
community of the lower marsh (Salgado et al., 2007) or American saltmarsh food
webs (Zimmer et al. 2004). As the marshes of North America differ from European
marshes in terms of productivity, dominant plant species, effect of livestock grazing
upon plant species richness and invertebrate community (Bazely & Jeffries, 1986;
Adam, 1990; Ford & Grace, 1998; Garbutt & Boorman, 2009), it is difficult to relate
North American food web studies to European marshes.
Coleoptera communities are affected by moisture, temperature, salinity, vegetation
height, trampling and soil compaction (Lassau et al., 2005; Pétillon et al., 2008;
Hofmann & Mason, 2006; Morris, 2000). Spider species assemblages are
particularly sensitive to moisture, vegetation height and vegetation structure
(Bonte et al., 2000; Uetz et al., 1999; Bell et al., 2001; Pétillon et al., 2008). In a

Grazing and saltmarsh invertebrates Chapter 4
77
Californian saltmarsh a positive relationship was found between plant species
richness, vegetation tip height diversity and spider family richness due to increased
potential of nesting and web building sites (Traut, 2005). Hemiptera, phytophagus
Auchenorrhyncha leafhoppers in particular, increase in abundance and diversity
with greater plant diversity, vegetation height and structural complexity
(Biedermann et al., 2005). E. atherica invasion of salt marshes, characteristic of un-
grazed marshes, correlates to an increase in non coastal spider species leading to
an overall increase in biodiversity but a decrease in abundance of coastal specialist
species (Pétillon et al., 2005; Pétillon et al., 2010). Spider coastal specialists may
decline as E. atherica stands tend to create drier more terrestrial conditions than
other saltmarsh vegetation. Un-grazed inland salt meadows also exhibited a lower
abundance of coastal specialist spider species than grazed meadows (Zulka et al.,
1997).
The existing evidence suggests that un-grazed marshes may provide suitable habitat
for a diverse invertebrate community, but that cattle grazed marshes with a
uniform short sward may support a narrower range of saltmarsh specialist species.
Prey selection within food webs may be influenced by body size of invertebrates;
however, no published work has been carried out relating saltmarsh food web
structure to body size of invertebrates. This study aims to assess the impact of
grazing on abundance, diversity and functional group structure of the entire ground
dwelling invertebrate community using pitfall sampling. Specifically addressing how
grazing influences: abundance, species richness and functional group structure of
Coleoptera, Hemiptera and Araneae; abundance and functional group structure of
all other invertebrates; abundance of invertebrate coastal specialists;
environmental factors that influence invertebrate habitat choice; and saltmarsh
food web in relation to functional group and body size. The three main orders
focused on within this study, Coleoptera, Hemiptera and Araneae, were chosen as
they are well studied, easy to identify to species level, include important predators,
often include larger bodied individuals and are used as bio-indicators of grassland
ecosystem health (Biedermann et al., 2005; Pearce & Venier, 2006).

Grazing and saltmarsh invertebrates Chapter 4
78
4.3 Methods
4.3.1 Site description
The salt marshes of the Ribble estuary cover around 2000 ha in total. The study
area, Crossens Marsh (53⁰ 41’ 15” N, 2⁰ 57’ 4” W), is located on the southern edge
of the Ribble estuary in North-West England and is part of the Sefton Coast Special
Protection Area managed by Natural England, the statutory conservation body. The
marsh was historically un-grazed but was split into two management types over 40
years ago, un-grazed and cattle grazed (Figure 4.1). The grazed marsh is
characterised by predominantly Festuca rubra saltmarsh NVC community (SM16d)
and the un-grazed marsh by Elytrigia repens saltmarsh (SM28; Rodwell, 2000). E.
repens replaces E. atherica on UK west coast. The grazed part of the marsh covers
517 ha and is uniformly grazed by around 100 bullocks from late May to early
October, approximately 0.2 cattle per hectare, and provides a consistent short
sward (< 8 cm) for overwintering pink-footed geese (Anser brachyrhynchus) to feed.
Small herbivores such as field voles are also present, particularly on the un-grazed
marsh.
Figure 4.1 Crossens Marsh field site with fence line marking boundary between un-grazed
vegetation on the left, dominated by a tall sward (20 – 30 cm) of Elytrigia repens, and consistently
short cattle grazed vegetation on the right (< 8 cm).

Grazing and saltmarsh invertebrates Chapter 4
79
4.3.2 Experimental design
All experimental units were selected within the high marsh zone where numerous
creeks are present but tidal inundations are relatively rare, limited to around eight
events a year on high equinox tides. A paired experimental design was used with six
experimental units of approximately 10 m x 10 m set up on each side of a 600 m
long section of the fence line, 100-150 m apart, in a ‘mirror image’ formation, giving
six grazed (G1-G6) and six un-grazed (U1-U6) units (Figure 4.2). Each experimental
unit was located between 20 m and 50 m from the fence line to ensure an
adequate buffer zone and checked for standard elevation within ±10 cm. All
measurements were carried out within these experimental units.
G1
Grazed
Un-grazed
Fence line (600 m)20 m ‘buffer’ zone
G2
G3
G4
G5
G6
U6
U5
U4U2
U3
U1
30 m
Figure 4.2 Experimental design at Crossens Marsh, G1–G6 were grazed experimental units, U1-U6
were un-grazed units.
4.3.3 Soil and vegetation characteristics
Soil samples were collected during September 2009 from the top 15 cm of soil to
measure salinity and pH. Soil was sieved to 2 mm and a sub sample of 10 g was
Grazing and saltmarsh invertebrates Chapter 4
80
taken from each sample and shaken with 25 ml of deionised water (1:2.5 dilution
factor). A Hanna pH209 pH meter was used to measure pH and a Jenway 4520
Conductivity meter to measure electrical conductivity (mS cm-1) as a proxy for
salinity (Douaik, Van Meirvenne & Tóth, 2007). Samples to determine bulk density
and soil organic matter content were collected during September 2009 using intact
soil cores of 3.8 cm diameter and 15 cm depth. Cores were dried at 105 ⁰C for 72
hours and the dry mass divided by the volume of the core to calculate bulk density.
Loss-on-ignition was used to estimate organic matter content (Ball, 1964). Soil
moisture content and temperature were recorded at six locations within each
experimental unit during September. Soil conductivity was measured in direct volts
using a Delta T Theta Meter HH1 (four probes of 6 cm) and converted to percentage
soil moisture content using a calibration suitable for organic soils. Soil temperature
was measured using a digital thermometer (single 11 cm probe).
Plant species richness and percentage cover were estimated by eye during July
2009 in five 1 m x 1 m quadrats placed 3 m apart within each experimental unit.
Within each quadrat a 25 cm x 50 cm corner was allocated and above-ground living
vegetation collected. Plant litter was collected separately from the same area. One
root core of 5 cm diameter and 10 cm depth was also taken per quadrat and
washed to remove all soil. Above-ground vegetation, litter and roots were all dried
at 80 °C for 24 hours and weighed to give indicators of above-ground live plant
biomass, litter biomass and below-ground root biomass respectively. Vegetation
height was measured in May and September at ten random positions within 1 m of
each pitfall trap with a custom made drop disc of 20 cm diameter, 10 g mass.
Vegetation height diversity was also calculated. All plant nomenclature follows
Stace (2010).
4.3.4 Ground dwelling invertebrates - pitfall traps
Pitfall traps were used to sample ground dwelling invertebrates in spring and
autumn. The traps were put in place for 28 days from 5th May to 2nd June 2009 and
for 30 days between 4th September and 9th October 2009 (excluding 5 days where
traps were removed due to high tides). Six pitfall traps per experimental unit were

Grazing and saltmarsh invertebrates Chapter 4
81
set up in two lines of three, 5 m apart. Each trap consisted of a plastic cup (80 mm
diameter x 105 mm deep) a third full with a 50/50 mix of ethylene glycol and water,
recommended for preservation of invertebrates (Schmidt et al., 2006), with a drop
of washing up liquid to break the surface tension. Each trap was pushed into a hole
made by a soil auger until they were flush with the soil surface. A rain hat was
placed over each trap and set at 3 cm from the ground. A wire basket of 5 cm mesh
size was also placed over each rain hat and pegged down to prevent interference by
cattle. Pitfalls were emptied and replaced with new ethylene glycol mixture half
way through the spring and autumn sampling periods to aid preservation of
invertebrates. The contents of the pitfalls were preserved in 70 % Industrial
strength methylated spirits (IMS).
4.3.5 Invertebrate classification - functional groups & coastal specialists
All invertebrates caught in the pitfall traps from Coleoptera, Hemiptera and
Araneae were identified to species level, all other invertebrates were identified to
family or order level. All invertebrates were also classified according to the
following functional groups: predatory, zoophagus (predatory and scavenging),
phytophagus (herbivore or granivorous), detritivore (feed on detritus and
associated decomposer community of fungi and bacteria) (Kreeger & Newell, 2000),
or an additional category ‘not assigned’ on the basis of species, family or order level
information (Table A4.1). Invertebrate species authorities listed in Table A4.1.
Spiderlings were excluded from the analysis as they were only counted in
September. Larvae belonging to all other groups were assigned a functional group
where possible. Araneae are all predators but were further grouped by prey
capture method as proposed by Uetz et al. (1999).
Coastal specialist carabid beetles were defined by Luff (1998), Araneae by Harvey et
al. (2002). Nationally scarce invertebrates associated with coastal saltmarsh were
defined by Buglife – The Invertebrate Conservation Trust (Alexander et al. 2005),
these species are not necessarily coastal specialists but are nationally scarce
invertebrates only found in particular habitats. The UK distribution of coastal
specialist species were also checked using the National Biodiversity Network

Grazing and saltmarsh invertebrates Chapter 4
82
interactive map (http://data.nbn.org.uk/imt, 2011). Invertebrate nomenclature
follows Duff (2008) for Coleoptera and Fauna Europea (2004) for Araneae,
Hemiptera and all other groups.
4.3.6 Statistical Analysis – soil and vegetation characteristics
Differences between grazing treatments for soil and vegetation characteristics were
analysed using linear mixed effects models (lme) analysed by ANOVA using R
v.2.12.1 (2010 As lme (salinity ~ grazing, random = ~1|block/grazing). This approach
was used to enable the raw data to be analysed accounting for replication at the
level of the experimental unit or block (n=6). Vegetation height diversity for the
grazed and un-grazed marsh was calculated from the Coefficent of variance (CoV;
Standard Deviation/Mean*100) of each set of ten heights from around each pitfall.
4.3.7 Statistical Analysis – ground dwelling invertebrates
For each of the twelve experimental units, the contents of the six pitfalls within
each unit were pooled to give a total invertebrate count per unit. As trends in
invertebrate community composition appeared similar between the May and
September sampling periods the data were combined to give one measure of
abundance to represent the year 2009. At the level of the experimental unit (n=6)
differences in functional group abundance and species richness, within Coleoptera,
Hemiptera, Araneae and all other invertebrate groups, between grazed and un-
grazed treatments were tested for statistical significance using Wilcoxon matched
pairs test, Genstat v.10 (Payne et al., 2007). Box plots were produced using Minitab
v.15 Statistical Software (2007).
4.3.8 Statistical Analysis – relationship between environmental variables and
functional group occurrence
Linear direct gradient analysis (RDA) was carried out to examine the relationship
between all environmental variables listed in Table 4.1 (mean at unit level), and the
distribution of pitfall functional groups and prey capture methods from the six
grazed and six un-grazed experimental units of the salt marsh. ‘Species’ data were
entered into the analysis in the form log transformed count data (total for

Grazing and saltmarsh invertebrates Chapter 4
83
experimental unit) of functional groups or Araneae prey capture methods, RDA
scaling was focused on inter-species correlations and centred by species, grazing
treatment of each unit was included in the final RDA triplot but was not used to
influence the analysis. The significance of environmental variables was tested using
automatic forward selection (Monte Carlo test, 500 permutations). All multivariate
analysis was carried out in Canoco v.4.5 (Ter Braak and Šmilauer, 2003).
4.3.9 Food web analysis
The most abundant groups of invertebrates on the grazed or un-grazed marsh (≥ 1%
of total abundance on one marsh type) were used to create a food web for the salt
marsh based on taxonomy, functional group, body size and prey selection
preferences. Body size was divided into three size classes based on body length,
large (≤ 30 mm), medium (≤ 20 mm) and small (≤ 10 mm). Body size was
determined for Coleoptera (Unwin, 1988), Hemiptera (Burrows, 2009; Bantock &
Botting, 2010), Araneae (Jones-Walters, 1989) and other invertebrates (Chinery,
1986; Tilling, 1987). Food web prey preferences, both for particular invertebrate
groups and body size, were based on Lövei & Sunderland (1996), Clough et al.
(2007), Rickers (2005) and Landis & Werf (1997) for predatory beetles and
Hemiptera; Nyffeler (1999), Jones-Walters (1989) and Enders (1975) for spiders;
Dias & Hassal (2005) for woodlice and sand hoppers.
4.4 Results
4.4.1 Soil properties and vegetation characteristics
Soil bulk density, percentage moisture content and temperature were all
significantly higher on the grazed marsh; soil pH was significantly higher on the un-
grazed marsh (Table 4.1). Plant species richness; percentage cover of Agrostis
stolonifera, Glaux maritima, Puccinellia maritima and Triglochin maritima; and
below-ground plant biomass were all significantly greater on the grazed marsh.
Percentage cover of Elytrigia repens, above-ground plant biomass, litter biomass,
vegetation height in May and September were all significantly higher on the un-
grazed marsh. Soil salinity, soil organic matter content, percentage cover of Festuca

Grazing and saltmarsh invertebrates Chapter 4
84
rubra and vegetation height diversity were not significantly different between
grazing treatments.
4.4.2 Invertebrate summary
This study captured nearly 90,000 ground dwelling invertebrates, around two thirds
on the un-grazed marsh. Predators were one and a half times more abundant on
the grazed than the un-grazed marsh, but not significantly so, 19 % and 9 %
respectively of the total invertebrate count per grazing treatment. Zoophagus
invertebrates were three times more abundant on the un-grazed marsh (Wilcoxon;
w = 0, d.f. = 5, p < 0.05) and phytophagus individuals were equal between
treatments, both groups only accounted for 1 - 3 % of total count per treatment.
There were twice as many detritivores on the un-grazed than the grazed marsh, 78
% compared to 55 % of the total. There were twice as many not assigned
invertebrates on the grazed marsh, 23 % to 9 % on the un-grazed. Coleoptera
accounted for 6 %, Hemiptera 1 % and Araneae 9% of the total invertebrate count.
For Coleoptera, Hemiptera and Araneae combined species richness was not
significantly different between grazing treatments.
4.4.3 Abundance, species richness and functional group structure of Coleoptera
Coleoptera were around three times more abundant and significantly more species
rich (Wilcoxon; w = 0, d.f. = 5, p < 0.05, Table 4.2) on the un-grazed marsh.
Predatory, Zoophagus and Detritivorous Coleoptera were all significantly more
abundant on the un-grazed marsh (Test statistics for each: Wilcoxon; w = 0, d.f. = 5,
p < 0.05; Figure 4.3a). The most abundant species on the un-grazed marsh were
zoophagus Bembidion iricolor (14 % of total Coleoptera), predatory Cantharis rufa
(14 %) and predatory Cordalia obscura (11 %). The most abundant species on the
grazed marsh were zoophagus Bembidion aeneum (20 %), not assigned Brundia
marina (14 %) and C. rufa (14 %).

Grazing and saltmarsh invertebrates Chapter 4
85
Table 4.1 Soil properties and vegetation characteristics measured from the grazed and un-grazed
marsh. Sampling depths are presented alongside treatment means ± standard errors, ANOVA
results (n = 6), number of replicate samples per experimental unit and month sampled. For
vegetation height, for each of the 6 replicates per treatment the mean of 10 measurements was
used in the analysis. For vegetation height diversity, CoV = coefficient of variance.
Depth (cm)
Grazed Un-grazed Reps Month
Soil Salinity (mS cm-1) 0-15 4.2 ± 0.4 3.4 ± 0.3 ns 3 Sept. pH 0-15 7.6 ± 0.1 7.9 ± 0.1 * 3 Sept. Bulk density (g cm-3) 0-15 0.8 ± 0.0 0.7 ± 0.0 * 3 Sept. Organic matter content (%) 0-15 7.4 ± 0.7 6.3 ± 0.4 ns 3 Sept. Moisture content (%) 0-6 52.6 ± 0.1 44.5 ± 1.2 * 6 Sept. Temperature (⁰C) 0-11 14.9 ± 0.1 14.2 ± 0.0 * 6 Sept.
Vegetation Plant species richness (species m-2) n/a 6.6 ± 0.3 3.7 ± 0.2 * 5 July % cover
Agrostis stolonifera L. n/a 20.0 ± 5.3 0.0 ± 0.0 * 5 July Elytrigia repens L. n/a 0.7 ± 0.5 58.0 ± 6.0 ** 5 July Festuca rubra L. n/a 25.4 ± 4.7 31.2 ± 5.4 ns 5 July Glaux maritima L. n/a 6.0 ± 1.4 0.0 ± 0.0 ** 5 July Puccinellia maritima Parl. n/a 28.3 ± 5.7 0.0 ± 0.0 * 5 July Triglochin maritima L. n/a 11.3 ± 2.4 3.2 ± 2.8 * 5 July
Above ground biomass (kg dwt m-2) n/a 0.3 ± 0.0 0.7 ± 0.1 * 5 July Litter biomass (kg dwt m-2) n/a 0.0 ± 0.0 0.3 ± 0.0 * 5 July Below ground biomass (kg dwt m-2) 0-10 3.4 ± 0.2 1.0 ± 0.1 *** 5 July Vegetation height (cm) n/a 8.1 ± 0.5 29.2 ± 0.8 *** 6 May Vegetation height (cm) n/a 8.2 ± 0.4 19.2 ± 0.7 *** 6 Sept. Vegetation height diversity (CoV) (%) n/a 31.5 ± 4.6 29.9 ± 3.2 ns 6 May Vegetation height diversity (CoV) (%) n/a 29.1 ± 3.7 32.6 ± 3.8 ns 6 Sept.
Significant differences between grazing treatments indicated by *(p < 0.05), **(p < 0.01) and ***(p < 0.001). Non significant results recorded as ns (p > 0.05).
4.4.4 Abundance, species richness and functional group structure of Hemiptera
Hemiptera were around five times more abundant on the grazed than the un-
grazed marsh but total species richness did not differ (Table 4.2). Predatory
Hemiptera were significantly more abundant on the grazed marsh (Wilcoxon; w = 0,
p < 0.05, Figure 4.3b), phytophagus Hemiptera did not differ with grazing. On the
grazed marsh the predatory shore bug Salda littoralis accounted for 67 % of total
Hemipteran abundance. Phytophagus aphids accounted for 18 % of total
abundance on the grazed marsh, 61 % on the un-grazed marsh.

Grazing and saltmarsh invertebrates Chapter 4
86
Table 4.2 Invertebrate species richness comparison between grazed and un-grazed marsh;
Coleoptera, Hemiptera and Araneae combined, separated into orders and at a functional group or
prey capture method level. Species richness data are shown by treatment medians ± inter-quartile
range, n = 6 in all cases.
Invertebrate group Functional group / prey capture
method Grazed Un-grazed
Coleoptera, Hemiptera, Araneae
All 51.0 ± 6.8 60.5 ± 7.3 ns
Coleoptera All 28.0 ± 6.5 37.0 ± 1.5 * Coleoptera Predatory 10.0 ± 3.5 13.0 ± 1.5 ns Coleoptera Zoophagus 8.0 ± 0.8 9.0 ± 0.8 ns Coleoptera Phytophagus 5.0 ± 1.5 5.0 ± 1.5 ns Coleoptera Detritivore 3.0 ± 0.8 7.0 ± 2.8 ns Coleoptera Not assigned 2.0 ± 0.0 2.0 ± 0.0 ns Hemiptera All 6.0 ± 1.5 5.5 ± 2.5 ns Hemiptera Predatory 2.0 ± 0.0 1.0 ± 0.8 ns Hemiptera Phytophagus 4.5 ± 1.8 4.0 ± 1.5 ns Araneae All / Predatory 17.5 ± 1.8 20.0 ± 2.3 ns Araneae Foliage running hunter 0.5 ± 0.0 1.0 ± 0.0 ns Araneae Ground running hunter 4.5 ± 1.0 6.0 ± 0.8 ns Araneae Space web builder 0.0 ± 0.0 1.0 ± 0.0 * Araneae Sheet weavers 12.7 ± 0.5 12.0 ± 0.8 ns Significant differences between grazing treatments indicated by *(p < 0.05), non significant results as ns (p > 0.05), Wilcoxon Matched-Pairs test.
4.4.5 Abundance, species richness and prey capture methods of Araneae
As an entirely predatory group Araneae were significantly more abundant on the
grazed marsh (Wilcoxon; w = 0, d.f. = 5, p < 0.05, Figure 4.4a) but species richness
did not differ (Table 4.2). Foliage running hunters were significantly more abundant
on the un-grazed marsh (Wilcoxon; w = 0, d.f. = 5, p < 0.05, Figure 4.4b). Ground
running hunter abundance was not significantly different between the grazed and
un-grazed marsh. Space web builders were more abundant on the un-grazed marsh
(Wilcoxon; w = 0, d.f. = 5, p < 0.05). Sheet weavers were significantly more
abundant (Wilcoxon; w = 0, d.f. = 5, p < 0.05) but not more species rich on the
grazed marsh. The grazed marsh was numerically dominated by two sheet weaver
Linyphiidae species, Erigone longipalpis (42 % of total Araneae for grazing
treatment) and Oedothorax fuscus (21 %). The wolf spider P. purbeckensis (9 %)
were also common on the grazed marsh. The un-grazed marsh was characterised by
the Linyphiidae Allomengea scopigera (39 %) and P. purbeckensis (20 %).

Grazing and saltmarsh invertebrates Chapter 4
87
4.4.6 Abundance and functional group structure of other invertebrates
For all other invertebrates total abundance was twice as high on the un-grazed
marsh. Zoophagus invertebrates, all harvestmen, were significantly more abundant
on the un-grazed marsh (Wilcoxon; w = 0, d.f. = 5, p < 0.05, Figure 4.5a). Predatory
(all parasitoid wasps), phytophagus, detritivore and not assigned functional groups
did not differ significantly with grazing treatment (Figure 4.5a, 4.5b). Even though
the abundance of all detritivores did not differ between grazing treatments their
composition did. On the un-grazed marsh Orchestia gammerella (68 %) and
woodlice (23 %) were most abundant. On the grazed marsh Collembola (69 %) and
O. gamerella (30 %) were common. Of particular interest within the not assigned
category are the Tipulidae, these were caught fifty times more frequently on the
grazed marsh.
4.4.7 Abundance of coastal specialist species
Coastal specialist ground beetles, Bembidion minimum and Dicheirotrichus gustavii,
rove beetle B. marina and nationally scarce saltmarsh shore bug Saluda opacula
were found predominantly on the grazed side of the marsh (Table A4.1). As were
Araneae coastal specialist species Silometopus ambiguus and E. longipalpis. The
coastal spider P. purbeckensis was found almost equally on both the grazed and the
un-grazed marsh. The carabid B. iricolor was recorded mainly on the un-grazed side.
Even though D. gustavii and S. opacula show clear habitat preferences they are only
found in low numbers compared to the other coastal specialist species listed. Three
species, B. marina, S. ambiguus and E. longipalpis were sampled in greater
abundances in G5, the most saline experimental unit, than any of the other units.
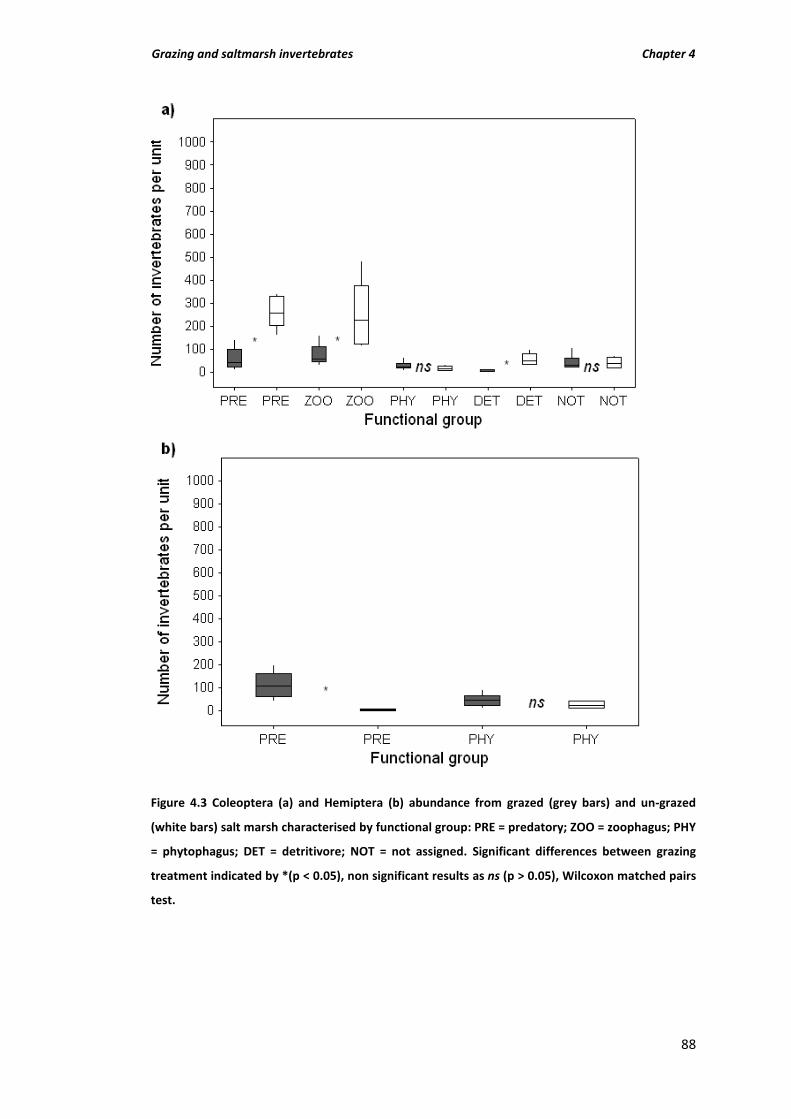
Grazing and saltmarsh invertebrates Chapter 4
88
Figure 4.3 Coleoptera (a) and Hemiptera (b) abundance from grazed (grey bars) and un-grazed
(white bars) salt marsh characterised by functional group: PRE = predatory; ZOO = zoophagus; PHY
= phytophagus; DET = detritivore; NOT = not assigned. Significant differences between grazing
treatment indicated by *(p < 0.05), non significant results as ns (p > 0.05), Wilcoxon matched pairs
test.

Grazing and saltmarsh invertebrates Chapter 4
89
Figure 4.4 Araneae abundance from grazed (grey bars) and un-grazed (white bars) salt marsh
characterised by functional group (a): PRE = predatory and further classified by prey capture
method (b): FRH = foliage running hunter; GRH = ground running hunter; SWB = space web
builder; SW = sheet weaver. Significant differences between grazing treatment indicated by *(p <
0.05), non significant results as ns (p > 0.05), Wilcoxon matched pairs test.

Grazing and saltmarsh invertebrates Chapter 4
90
Figure 4.5 All other invertebrates (not Coleoptera, Hemiptera or Araneae) abundance from grazed
(grey bars) and un-grazed (white bars) salt marsh characterised by functional group: a) PRE =
predatory; ZOO = zoophagus & PHY = phytophagus; b) DET = detritivore & NOT = not assigned.
Significant differences between grazing treatment indicated by *(p < 0.05), non significant results
as ns (p > 0.05), Wilcoxon matched pairs test.

Grazing and saltmarsh invertebrates Chapter 4
91
4.4.8 Environmental factors that influence invertebrate habitat choice
The RDA triplot (Figure 4.6) shows a visual interpretation of the relationship
between eight environmental variables, selected by Monte Carlo forward selection,
and the distribution of functional groups or prey capture methods. Axis 1 explained
79 % of the variation in functional group or prey capture method occurrence, axis 1
and 2 combined explained 89 % of the variation. The Monte Carlo test for all axes
was significant for three environmental variables; temperature (positively
correlated with axis 1: F-ratio = 23.73, P < 0.01), vegetation height (negatively
correlated with axis 2: F-ratio = 3.59, P < 0.05) and salinity (positively correlated
with axis 2: F-ratio = 2.38, P < 0.05), all other environmental variables either
correlated with these three or did not describe a significant proportion of the
variation in functional group occurrence. Grazing intensity was clearly separated
out by axis 1, with all grazed experimental units positively associated with and all
un-grazed units negatively associated with axis 1. Predatory, zoophagus, and
detritivorous Coleoptera were all negatively associated with axis 1, as were foliage
running hunters, space web builders and zoophagus and phytophagus other
invertebrates. Predatory Hemiptera and sheet weaving spiders were positively
associated with axis 1. Phytophagus Hemiptera and ground running hunter spiders
were negatively associated with axis 2, not assigned Coleoptera and other
detritivores were positively associated with axis 2.
4.4.9 Food web analysis
Large detritivores, mainly Orchestia and woodlice, accounted for 71 % of all the
invertebrates sampled on the un-grazed marsh, 17 % on the grazed marsh (Figure
4.7). Small detritivores, predominantly collembola, accounted for only 6 % on the
un-grazed marsh compared to 38 % on the grazed marsh. Large crane flies were
more numerous on the grazed marsh (7 %). Small flies and mites were abundant in
both grazing treatments. Large and medium predatory beetles accounted for 6 % of
all invertebrates on the un-grazed marsh, 2 % on the grazed marsh. Medium
hunting spiders were present in equal proportions on both marsh types (2 %). Small
Linyphiidae were much more abundant, both in total and proportional abundance,

Grazing and saltmarsh invertebrates Chapter 4
92
on the grazed marsh (13 %) compared to the un-grazed marsh (3 %). Predatory
shore bugs were only present on the grazed marsh (2 %).
-1.5 1.5
-1.0
1.0
FRH
GRH
SWB
SW
H_PRE
H_PHYO_PRE
O_ZOO
O_PHY
O_DET
O_NOT
C_PRE
C_ZOOC_PHY
C_DET
C_NOT
Vegetation height
Above-ground biomassLitter biomass
Plant species richness
Moisture content
Temperature
Salinity
Below-ground biomass
G1
G2
G3G4
G5
G6
U1U2
U3
U4
U5
U6
Figure 4.6 RDA triplot showing the relationship between eight environmental variables and the
distribution of sixteen functional groups and prey capture methods. Environmental variables were
selected by forward selection (Canoco v.4.5; Monte Carlo test, 500 permutations); the three
significant ones, temperature, vegetation height and salinity are shown in bold. Grazed
experimental units (G1-G6) are displayed as grey circles, un-grazed units (U1-U6) as white circles.

Grazing and saltmarsh invertebrates Chapter 4
93
GRAZED
UN-GRAZED
S flies (12%)
S DET Collembola (38%)
L DET Orchestia (17%)
S PHY aphids (1%)
S mites (3%)
L Crane flies (7%)
L DET Orchestia (53%)
L DET Woodlice (18%)
S DET Collembola (6%)
S mites (1%)
S flies (8%)
S PRE Shore bugs (2%)
L PRE beetles (2%)
S PRE Linyphiidae (13%)
M PRE hunting spiders (2%)
S PRE Linyphiidae (3%)
L PRE beetles (5%)
M PRE hunting spiders (2%)
M PRE beetles (1%)
Figure 4.7 Ground dwelling invertebrate food web for cattle grazed and un-grazed salt marsh.
Body length of invertebrates: L (large ≤ 30 mm), M (medium ≤ 20 mm), S (small ≤ 10 mm).
Functional group of invertebrates: DET = detritivore, PHY = phytophagus, PRE = predatory (L PRE
beetles also include zoophagus beetles). Invertebrate abundance is expressed as percentage of
total invertebrates per grazing treatment.
4.5 Discussion
4.5.1 Overview
This study focused on the impact of cattle grazing on the abundance, diversity and
functional group structure of the entire ground dwelling saltmarsh invertebrate
community. Our results indicate that overall invertebrate abundance was greater
on the un-grazed marsh. This finding is in line with evidence from other grassland
and saltmarsh systems (Andresen et al. 1990; Bakker et al. 1993; Morris 2000).
Coastal specialist abundance was greatest on the uniformly short sward cattle
grazed salt marsh. European saltmarsh conservation often involves livestock grazing
to improve plant diversity and provide a suitable habitat for over-wintering

Grazing and saltmarsh invertebrates Chapter 4
94
breeding birds and invertebrate coastal specialists. Here we argue that un-grazed
areas of marsh also have a conservation value in their own right. As well as higher
invertebrate abundance the functional structure of the un-grazed marsh is also
different from the grazed marsh, with many large predators and detritivores
present. The grazed marsh was characterised by high plant species richness, short
vegetation, limited plant litter and warm compact soil prone to water-logging. The
un-grazed marsh was dominated by E. repens, leading to a deep plant litter layer
and drier less compact soil than the grazed marsh. Vegetation height diversity did
not differ between grazing treatments.
4.5.2 Coleoptera, Hemiptera & Araneae
Coleoptera abundance and species richness was much higher on the un-grazed
marsh. This may be due to reduced physical disturbance of the habitat. Duffey
(1975) showed that even moderate trampling by humans of five treads a month, to
simulate cattle treading, reduced Coleoptera abundance by 82 % after a year
compared to an un-trampled control. Coleoptera also lack submersion resistance
(Rothenbücher & Schaefer, 2006), relevant as un-grazed marshes are drier habitats
than grazed marshes due to plant litter build up and reduced waterlogging. Large
and medium sized predatory, zoophagus and detritivorous beetles were very
abundant on the tall un-grazed marsh, in contrast small predatory Hemiptera
preferred the short, moist vegetation of the grazed marsh. Large invertebrates
favour the un-grazed marsh as birds select larger invertebrates when feeding so tall
vegetation is likely to provide cover from this type of predation, small predatory
invertebrates prefer the grazed marsh due to reduced competition from larger
invertebrate predators (Enders, 1975; Lassau et al., 2005). Detritivorous beetles are
associated with the un-grazed marsh due to the availability of greater amounts of
plant detritus than the grazed marsh.
Overall spider abundance was greater on the grazed marsh due to the
predominance of small sheet weaving Linyphiidae spiders. Foliage running hunters
and space web builders were more abundant on the un-grazed marsh. Ground
running hunters were slightly more abundant on the un-grazed marsh. These

Grazing and saltmarsh invertebrates Chapter 4
95
differences can largely be explained by structural differences between the two
marsh types. Erigone atra, Oedothorax fuscus, Oedothorax retusus and Savignya
frontata, all active Linyphiidae aeronauts, are found in much greater numbers on
the grazed marsh than the un-grazed marsh, partly due to their ability to disperse
into open or disturbed habitats, such as grazed land, where competition from larger
invertebrate predators is low (Bell et al., 2001; Gibson et al., 1992b). Prey
availability and preference for wetter habitats may also explain why Linyphiidae
prefer the grazed marsh. Erigonine Linyphiidae, around half the sheet weavers
sampled from the grazed marsh, are less than 2 mm long and feed on Collembola
and small flies, an abundant food source on the grazed marsh (Enders, 1975; Figure
4.6). Another sheet weaver, Hypomma bituberculatum, was very abundant on the
grazed marsh, it survives submersion in fresh water (Harvey et al., 2002) and can
therefore compete with other spider species in waterlogged plots. The comb spider
Robertus lividus, a space web builder, was found only on the un-grazed marsh
where litter levels were greatest as in Harvey et al. (2002). The foliage running
hunter, Clubiona stagnatilis, was more abundant on tall un-grazed marsh. The most
common ground running hunter species, P. purbeckensis, did not show a clear
habitat preference but two other Lycosids, Pardosa pullata and Pirata piraticus
were more abundant on the un-grazed marsh. It is worth noting that the use of
pitfall traps to sample ground dwelling invertebrates will lead to under
representation of certain spider groups, such as orb weavers, dependent upon the
vertical structure of upper foliage layers.
4.5.3 Other invertebrates
Previously mentioned predatory groups, Coleoptera, Hemiptera and Araneae were
often closely associated with a particular marsh type. In contrast, all other
predatory invertebrates, parasitoid wasps, were equally abundant between grazing
treatments. Parasitoid wasps are a diverse group providing a key ecosystem service
in the regulation of insect populations (Fraser et al., 2008), as active fliers this group
was less influenced by ground level environmental variables. Zoophagus
invertebrates were significantly more abundant on the un-grazed marsh. Dennis et
al. (2001) found that in upland grasslands most harvestmen tended to prefer un-

Grazing and saltmarsh invertebrates Chapter 4
96
grazed or sheep grazed to cattle grazed swards. The crane flies, Tipulidae, were
much more abundant on the grazed marsh, in line with Cole et al.’s findings (2010)
from grazed uplands. Large detritivores such as woodlice and the sand hopper, O.
gammerella, were much more abundant on the un-grazed marsh due to the high
level of plant detritus available as combined food source and shelter. Small
detritivores such as Collembola were most abundant on the grazed marsh as in
Meyer et al. (1995). They are able to proliferate here as they can survive anoxia in
water-logged habitats by utilising passive drifting, a dormant egg stage and plastron
respiration (Marx et al., 2009).
4.5.4 Abundance of coastal specialist species
For carabid inter-tidal coastal specialists B. minimum and D. gustavii the grazed
marsh provided a more suitable habitat than the un-grazed marsh, as in Pétillon et
al. (2007; 2008). The rove beetle B. marina also preferred the grazed marsh. In
contrast, B. iricolor was more abundant on the un-grazed marsh. The Hemipteran
nationally scarce invertebrate Saldula opacula was only present on the grazed
marsh. For Araneae, coastal Linyphiidae specialists, E. longipalpis and S. ambiguuus,
were much more abundant on the grazed marsh, as in Pétillon et al. (2005; 2007).
4.6 Conclusion
Soil temperature, bulk density and moisture content were higher on the grazed
marsh. Plant species richness and below-ground root biomass were greater on the
grazed marsh. Percentage cover of E. repens, above-ground plant biomass and litter
biomass, were all significantly higher on the un-grazed marsh. Management of salt
marshes for the conservation of invertebrates should aim to strike a balance
between preserving maximum invertebrate diversity and abundance and
maintaining a habitat suitable for coastal specialists. Un-grazed salt marshes
provide a suitable habitat for an abundant and diverse invertebrate community, but
cattle grazed marshes with short swards support a greater abundance and diversity
of nationally scarce saltmarsh or inter-tidal coastal specialist species. The saltmarsh
food web also differs markedly with grazing intensity. The un-grazed marsh is
dominated by large detritivores and predatory beetles; the grazed marsh by smaller

Grazing and saltmarsh invertebrates Chapter 4
97
detritivores and Linyphiidae spiders adapted to open or disturbed habitats. Grazing
intensity influences two key drivers of invertebrate habitat choice, vegetation
height and soil temperature, via vegetation removal and soil compaction. Particular
species, functional groups or coastal specialists respond differently to these
variables. Therefore, the provision of both un-grazed and short sward cattle grazed
habitat is important to salt marsh invertebrate conservation management.
4.7 Acknowledgements
This study was funded as part of a NERC - Centre for Ecology and Hydrology project
- NECO3610. Thanks to Ylva Olsen, Rhian Walsh and Aled Roberts for fieldwork
assistance, Ed Rispin for invertebrate identification and Ben Woodcock for
comments on early drafts.
4.8 References
Adam, P. (1990) Saltmarsh Ecology, Cambridge University Press, UK.
Adis, J. & Junk, W. (2002) Terrestrial invertebrates inhabiting lowland river
floodplains of Central Amazonia and Central Europe: a review. Freshwater Biology
47, 711-731.
Alexander, K., Archer, M., Colenutt, S., Denton, J., Falk, S., Godfrey, A., Hammond,
P., Ismay, J., Lee, P., Macadam, C., Morris, M., Murray, C., Plant, C., Ramsay, A.,
Schulten, B., Shardlow, M., Stewart, A., Stubbs, A., Sutton, P., Tefler, M., Wallace, I.,
Willing, M. & Wright, R. (2005) Managing priority habitats for invertebrates, habitat
section 7, coastal saltmarsh. Buglife The Invertebrate Conservation Trust,
Peterborough, UK.
Andresen, H., Bakker, J.P., Brongers, M., Heydemann, B. & Irmler, U. (1990) Long-
term changes of salt marsh communities by cattle grazing. Vegetatio 89, 137-148.
Ball, D.F. (1964) Loss-on-ignition as an estimate of organic matter and organic
carbon in non-calcareous soils. Journal of Soil Science 15, 84-92.

Grazing and saltmarsh invertebrates Chapter 4
98
Bakker, J.P. (1989) Nature management by grazing and cutting. Kluwer Academic
Publishers, Dordrecht.
Bakker,J.P., Esselink,P., Dijkema, K.S., van Duin, W.E. & de Jong, D.J. (2002)
Restoration of salt marshes in the Netherlands. Hydrobiologia 478, 29–51.
Bakker, J.P., Leeuw, J., Dijkema, K.S., Leendertse, P.C., Prins, H.H.T. & Rozema, J.
(1993) Salt marshes along the coast of the Netherlands. Hydrobiologia 265, 73-95.
Bantock, T. & Botting, J. (2010) British Bugs: An online identification guide to UK
Hemiptera <http://www.britishbugs.org.uk> 4th July 2011.
Bazely, D.R. & Jefferies, R.L. (1986) Changes in the Composition and Standing Crop
of Salt-Marsh Communities in Response to the Removal of a Grazer. Journal of
Ecology 74, 693-706.
Bell, J.R., Wheater, P. & Cullen, W.R. (2001) The implications of grassland and
heathland management for the conservation of spider communities: a review.
Journal of Zoology (London) 255, 377-387.
Biedermann, R., Achtziger, R., Nickel, H. & Stewart, A.J.A. (2005) Conservation of
grassland leafhoppers: a brief review. Journal of Insect Conservation 9, 229–243.
Blondel, J. (2003) Guilds or functional groups: does it matter? Oikos 100, 223-231.
Bonte, D., Maelfait, J-P & Hoffman, M. (2000) The impact of grazing on spider
communities in a mesophytic calcareous dune grassland. Journal of Coastal
Conservation 6, 135-144.
Bos, D. (2002) Grazing in coastal grasslands Brent Geese and facilitation by
herbivory. University of Groningen PhD thesis, Groningen, the Netherlands
<http://ub.rug.nl/eldoc/dis/science/d.bos/> 14th November 2011.
Bouchard, V., Tessier, M., Digaire, F., Vivier, J., Valery, L., Gloguen, J. & Lefeuvre, J.
(2003) Sheep grazing as management tool in Western European saltmarshes.
Competes Rendus Biologies 326, 148-157.

Grazing and saltmarsh invertebrates Chapter 4
99
Burrows, M. (2009) Jumping strategies and performance in shore bugs (Hemiptera,
Heteroptera, Saldidae). Journal of Experimental Biology 212, 106-115.
Chatters, C. (2004) Grazing domestic animals on British saltmarshes. British Wildlife
15, 392-400.
Chen, B. & Wise, D.H. (1999) Bottom-up limitation of predaceous arthropods in a
detritus-based terrestrial food web. Ecology, 80, 761-772.Chinery, M. (1986) Collins
guide to the insects of Britain and Western Europe. HarperCollins Publishers,
London.
Clough, Y., Kruess, A. & Tscharntke, T. (2007) Organic versus conventional arable
farming systems: Functional grouping helps understand staphylinid response.
Agriculture Ecosystems & Environment 118, 285-290.
Cole, L.J, Pollock, M.L., Robertson, John, D., Holland, P., McCracken, D.I. & Harrison,
W. (2010) The influence of fine-scale habitat heterogeneity on invertebrate
assemblage structure in upland semi-natural grassland. Agriculture, Ecosystems and
Environment 136, 69–80.
Curry, J.P. (1994) Grassland invertebrates: Ecology, influence on soil fertility and
effects on plant growth. Chapman & Hall, London.
Daan, B., Bakker, J.P., de Vries, Y. & van Lieshout, S. (2002) Long-term vegetation
changes in experimentally grazed and ungrazed back-barrier marshes in the
Wadden Sea. Applied Vegetation Science 5, 45-54.
Dennis, P., Young, M.R. & Bentley, C. (2001) The effects of varied grazing
management on epigeal spiders, harvestmen and pseudoscorpions of Nardus stricta
grassland in upland Scotland. Agriculture, Ecosystems and Environment 86, 39-57.
Dias, N. & Hassall, M. (2005) Food, feeding and growth rates of peracarid macro-
decomposers in a Ria Formosa salt marsh, southern Portugal. Journal of
Experimental Marine Biology and Ecology 325, 84-94.
Doody, J.P. (2008) Saltmarsh Conservation, Management and Restoration. Springer.

Grazing and saltmarsh invertebrates Chapter 4
100
Douaik, A., Van Meirvenne, M. & Tóth, T. (2007) Statistical Methods for Evaluating
Soil Salinity Spatial and Temporal Variability. Soil Science Society of America Journal
71, 1629-1635.
Duff, A.G. (2008) Checklist of Beetles of the British Isles.
<http://www.coleopterist.org.uk/checklist2008%20AH.pdf> 14th November 2011.
Duffey, E. (1975) The effects of human trampling on the fauna of grassland litter.
Biological Conservation 7, 255-274.
Enders, F. (1975) The influence of hunting manner on prey size, particularly in
spiders with long attack distances (Araneidae, Linyphiidae, and Salticidae). The
American Naturalist 109, 737-763.
Fauna Europea (2004) Fauna Europea, Taxonomic Hierarchy version 4.1
<http://www.faunaeur.org/about_fauna_standards.php> 14th November 2011.
Finch, O-D, Krumen, H., Plaisier, F. & Schultz, W. (2007) Zonation of spiders
(Araneae) and carabid beetles (Coleoptera: Carabidae) in island salt marshes at the
North Sea coast. Wetlands Ecology and Management 15, 207-228.
Flynn, M.R. & Bush, J.W.M. (2008) Underwater breathing: the mechanics of
plastron respiration. Journal of Fluid Mechanics 608, 275-296.
Ford, M.A. & Grace, J.B. (1998) The interactive effects of fire and herbivory on a
coastal marsh in Louisiana. Wetlands 18, 1-8.
Fraser, S.E.M., Dytham, C. & Mayhew, P.J. (2008) The effectiveness and optimal use
of Malaise traps for monitoring parasitoid wasps. Insect Conservation and Diversity
1, 22-31.
Garbutt, A. & Boorman, L.A. (2009) Managed Realignment: Re-creating Intertidal
Habitats. In: Coastal Wetlands: an integrated ecosystem approach (eds G.M.E.
Perillo, E. Wolanski, D.R.Cahoon & M.M. Brinson), pp 763-785. Elsevier, London, UK.
Gibson, C. W. D., Brown, V.K, Losito, L. & McGavin, G.C. (1992a). The response of
invertebrate assemblies to grazing. Ecography 15, 166-176.

Grazing and saltmarsh invertebrates Chapter 4
101
Gibson C. W. D., Hambler, C. & Brown, V.K. (1992b) Changes in Spider (Araneae)
Assemblages in relation to succession and grazing management. Journal of Applied
Ecology 29, 132-142.
Hammond, P.M. (2000) Coastal Staphylinidae (rove beetles) in the British Isles, with
special reference to saltmarshes. British Saltmarshes (ed by B.R. Sherwood, B.G.
Gardiner & T. Harris) pp 247-302. Forrest Text, London UK.
Harvey, P.R., Nellist, D.R. & Tefler, M.G. (2002) Provisional Atlas of British Spiders
(Arachnida, Araneae), Volume 1 & 2. Huntingdon: Biological Records Centre,
Huntingdon, UK.
Hofmann, T.A. & Mason, C.F. (2006) Importance of management on the distribution
and abundance of Staphylinidae (Insecta: Coleoptera) on coastal grazing marshes.
Agriculture, Ecosystems and Environment 114, 397-406.
Irmler, U., Heller, K., Meyer, H. & Reinke, H-D. (2002) Zonation of ground beetles
(Coleoptera: Carabidae) and spiders (Araneida) in salt marshes at the North and the
Baltic Sea and the impact of the predicted sea level increase. Biodiversity and
Conservation 11, 1129-1147.
Jones-Walters, L.M. (1989) Keys to the families of British Spiders. Field studies 9,
365-443.
Kreeger, D.A. & Newell, R.I.E. (2000) Trophic complexity between producers and
invertebrate consumers in salt marshes. In: Concepts and Controversies in Tidal
Marsh Ecology (eds M.P. Weinstein & D.A. Kreeger), pp 187-220. Kluwer Academic
Publishers, London, UK.
Kruess, A. & Tscharntke, T. (2002) Contrasting responses of plant and insect
diversity to variation in grazing intensity. Biological Conservation, 106, 293-302.
Lambert, R. (2000) Practical management of grazed saltmarshes. In: British
Saltmarshes (eds B.R. Sherwood, B.G. Gardiner & T. Harris) pp 333-340. Forrest
Text, London, UK.

Grazing and saltmarsh invertebrates Chapter 4
102
Landis, D.A. & Werf, V. (1997) Early-season predation impacts the establishment of
aphids and spread of beet yellows virus in sugar beet. Entomophaga 42, 499-516.
Lassau, S.A., Hochuli, D.F., Cassis, G. & Reid, C.A.M. (2005) Effects of habitat
complexity on forest beetle diversity: do functional groups respond consistently?
Diversity and Distributions 11, 73-82.
Lövei, G.L. & Sunderland, K.D. (1996) Ecology and behaviour of ground beetles
(Coleoptera: Carabidae) Annual Reviews Entomology 41, 231–256.
Luff, M.L. (1998) Provisional atlas of the ground beetles (Coleoptera, Carabidae) of
Britain, Biological Records Centre, Huntingdon, UK.
Luff, M.L. & Eyre, M.D. (2000) Factors affecting the ground beetles (Coleoptera:
Carabidae) of some British coastal habitats. British Saltmarshes (ed by B.R.
Sherwood, B.G. Gardiner & T. Harris) pp. 235-246. Forrest Text, London, UK.
Marx, M.T., Wild, A., Knollmann, U., Kamp, G., Wegener, G. & Eisenbeis, G. (2009)
Responses and adaptations of collembolan communities (Hexapoda: Collembola) to
flooding and hypoxic conditions. Pesquisa Agropecuária Brasileira 44, 1002-1010.
Meyer, H., Fock, H., Haase, A., Reinke, H.D. & Tulowitzki, I. (1995) Structure of the
invertebrate fauna in salt marshes of the Wadden Sea coast of Schleswig-Holstein
influenced by sheep-grazing. Helgoländer Meeresunters 49, 563-589.
Milsom, T.P., Langton, S.D., Parkin, W.K., Peel, S., Bishop, J.D., Harts, J.D. & Moore,
N.P. (2000) Habitat models of bird species’ distribution: an aid to the management
of coastal grazing marshes. Journal of Applied Ecology 37, 706-727.
Minitab 15 Statistical Software (2007). [Computer software]. State College, PA:
Minitab, Inc. <http://www.minitab.com> 1st July 2011.
Morris, M.G. (2000) The effects of structure and its dynamics on the ecology and
conservation of arthropods in British grasslands. Biological Conservation 95, 129-
142.

Grazing and saltmarsh invertebrates Chapter 4
103
National Biodiversity Network interactive map (2011) National Biodiversity
Network’s Gateway <http://data.nbn.org.uk/imt> 4th July 2011.
Nyffeler, M. (1999) Prey selection of spiders in the field. The Journal of Arachnology
27, 317-324.
Payne, R.W., Murray, D.A., Harding, S.A., Baird, D.B. & Soutar, D.M. (2007). GenStat
for Windows (10th Edition). VSN International, Hemel Hempstead.
Pearce, J.L. & Venier, L.A. (2006) The use of ground beetles (Coleoptera: Carabidae)
and spiders (Araneae) as bioindicators of sustainable forest management: A review.
Ecological Indicators 6, 780-793.
Pétillon, J. , George, A., Canard, A., & Ysnel, F. (2007) Impact of cutting and sheep
grazing on ground-active spiders and carabids in intertidal salt marshes (Western
France). Animal Biodiversity and Conservation 30, 201-209.
Pétillon, J., George, A., Canard, A., Lefeuvre, J-C., Bakker, J.P. & Ysnel, F. (2008).
Influence of abiotic factors on spider and ground beetle communities in different
salt-marsh systems. Basic and Applied Ecology 9, 743-751.
Pétillon, J., Lambeets, K., Ract-Madoux, B, Vernon, P & Renault, D. (2011) Saline
stress tolerance partly matches with habitat preference in ground-living spiders.
Physiological Entomology 36, 165-172.
Pétillon, J. Lasne, E., Lambeets, K., Canard, A., Vernon, P. & Ysnel, F. (2010) How do
alterations in habitat structure by an invasive grass affect salt-marsh resident
spiders? Annales Zoologici Fennici 47, 79-89.
Pétillon, J., Montaigne, W. & Renault, D. (2009) Hypoxic coma as a strategy to
survive inundation in a salt-marsh spider. Biology Letters 5, 442-445.
Pétillon, J., Ysnel, F., Canard, A. & Lefeuvre, J-C. (2005) Impact of an invasive plant
(Elymus athericus) on the conservation value of tidal salt marshes in western France
and implications for management: Responses of spider populations. Biological
Conservation 126, 103-117.
Grazing and saltmarsh invertebrates Chapter 4
104
R version 2.12.1 (2010) R: A language and environment for statistical computing,
The R Foundation for Statistical Computing, Vienna, Austria
<http://www.R.project.org> 15th March 2012.
Rickers, S. (2005) Regulation of wolf spider populations: The role of habitat
structure, autochthonous and allochthonous prey. PhD thesis, Darmstadt
University, Darmstadt, Germany.
Rodwell, J.S. (2000) British Plant Communities, Volume 5. Maritime communities
and vegetation of open habitats. Cambridge University Press, UK.
Rothenbücher, J. & Schaefer, M. (2006) Submersion tolerance in floodplain
arthropod communities. Basic and Applied Ecology 7, 398-408.
Salgado, J.P., Cabral, H.N. & Costa, M.J. (2007) Spatial and temporal distribution
patterns of the macrozoobenthos assemblage in the salt marshes of Tejo estuary
(Portugal). Hydrobiologia 587, 225-239.
Schmidt, M.H., Clough, Y., Schulz, W., Westphalen, A. & Tscharntke, T. (2006)
Capture efficiency and preservation attributes of different fluids in pitfall traps.
Journal of Arachnology 34, 159-162.
Stace, C. (2010) New Flora of the British Isles, third edition. Cambridge University
Press, UK.
Ter Braak, C.J.F. & Šmilauer, P. (2003) CANOCO for Windows Version 4.5. Biometris
– Plant Research International, Wageningen.
Tilling, S.M. (1987) A key to the major groups of British Terrestrial Invertebrates.
Field Studies 6, 695-766.
Traut, B.H. (2005) The role of coastal ecotones: a case study of the salt marsh /
upland transition zone in California. Journal of Ecology 93, 279–290.
Uetz, G.W., Halaj, J. & Cady, A.B. (1999) Guild Structure of Spiders in Major Crops.
Journal of Arachnology 27, 270-280.

Grazing and saltmarsh invertebrates Chapter 4
105
Unwin, D.M. (1988) A key to the families of British Coleoptera. Field Studies 6, 149-
197.
Van Wijnen, N.J., Wal, R. & Bakker, J.P. (1997) The impact of herbivores on nitrogen
mineralization rate: consequences for salt-marsh succession. Oecologia 118, 225-
231.
Webb, J.R., Drewitt, A.L. & Measures, G.H. (2010) Managing for species: integrating
the needs of England’s priority species into habitat management. Part 1 report.
Natural England Research Reports, Number 024, Sheffield, UK.
Williams, D. & Hamm, T. (2002) Insect community organisation in estuaries: the role
of the physical environment. Ecography 25, 372-384.
Witteveen, J., Verboef, A. & Letschert, J.P.W. (1987) Osmotic and ionic regulation in
marine littoral Collembola. Journal of Insect Physiology 33, 59-66.
Zimmer, M., Pennings, S., Buck, T.L. & Carefoot, T.H. (2004) Salt Marsh Litter and
Detritivores: A Closer Look at Redundancy. Estuaries 27, 753-769.
Zulka, K.P., Milasowszky, N. & Lethmayer, C. (1997) Spider biodiversity potential of
an ungrazed and a grazed inland salt meadow in the National Park ‘Neusiedler See-
Seewinkel’ (Austria): implications for management (Arachnida: Araneae).
Biodiversity and Conservation 6, 75-88.
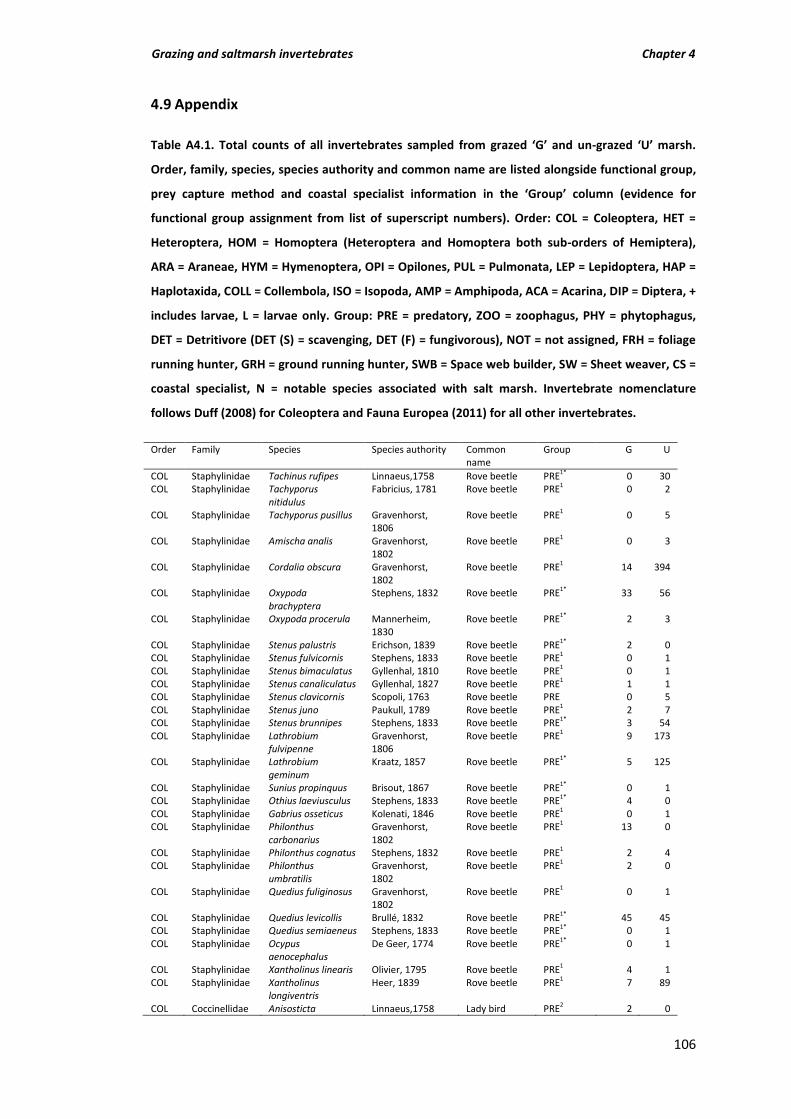
Grazing and saltmarsh invertebrates Chapter 4
106
4.9 Appendix
Table A4.1. Total counts of all invertebrates sampled from grazed ‘G’ and un-grazed ‘U’ marsh.
Order, family, species, species authority and common name are listed alongside functional group,
prey capture method and coastal specialist information in the ‘Group’ column (evidence for
functional group assignment from list of superscript numbers). Order: COL = Coleoptera, HET =
Heteroptera, HOM = Homoptera (Heteroptera and Homoptera both sub-orders of Hemiptera),
ARA = Araneae, HYM = Hymenoptera, OPI = Opilones, PUL = Pulmonata, LEP = Lepidoptera, HAP =
Haplotaxida, COLL = Collembola, ISO = Isopoda, AMP = Amphipoda, ACA = Acarina, DIP = Diptera, +
includes larvae, L = larvae only. Group: PRE = predatory, ZOO = zoophagus, PHY = phytophagus,
DET = Detritivore (DET (S) = scavenging, DET (F) = fungivorous), NOT = not assigned, FRH = foliage
running hunter, GRH = ground running hunter, SWB = Space web builder, SW = Sheet weaver, CS =
coastal specialist, N = notable species associated with salt marsh. Invertebrate nomenclature
follows Duff (2008) for Coleoptera and Fauna Europea (2011) for all other invertebrates.
Order Family Species Species authority Common name
Group G U
COL Staphylinidae Tachinus rufipes Linnaeus,1758 Rove beetle PRE1* 0 30 COL Staphylinidae Tachyporus
nitidulus Fabricius, 1781 Rove beetle PRE1 0 2
COL Staphylinidae Tachyporus pusillus Gravenhorst, 1806
Rove beetle PRE1 0 5
COL Staphylinidae Amischa analis Gravenhorst, 1802
Rove beetle PRE1 0 3
COL Staphylinidae Cordalia obscura Gravenhorst, 1802
Rove beetle PRE1 14 394
COL Staphylinidae Oxypoda brachyptera
Stephens, 1832 Rove beetle PRE1* 33 56
COL Staphylinidae Oxypoda procerula Mannerheim, 1830
Rove beetle PRE1* 2 3
COL Staphylinidae Stenus palustris Erichson, 1839 Rove beetle PRE1* 2 0 COL Staphylinidae Stenus fulvicornis Stephens, 1833 Rove beetle PRE1 0 1 COL Staphylinidae Stenus bimaculatus Gyllenhal, 1810 Rove beetle PRE1 0 1 COL Staphylinidae Stenus canaliculatus Gyllenhal, 1827 Rove beetle PRE1 1 1 COL Staphylinidae Stenus clavicornis Scopoli, 1763 Rove beetle PRE 0 5 COL Staphylinidae Stenus juno Paukull, 1789 Rove beetle PRE1 2 7 COL Staphylinidae Stenus brunnipes Stephens, 1833 Rove beetle PRE1* 3 54 COL Staphylinidae Lathrobium
fulvipenne Gravenhorst, 1806
Rove beetle PRE1 9 173
COL Staphylinidae Lathrobium geminum
Kraatz, 1857 Rove beetle PRE1* 5 125
COL Staphylinidae Sunius propinquus Brisout, 1867 Rove beetle PRE1* 0 1 COL Staphylinidae Othius laeviusculus Stephens, 1833 Rove beetle PRE1* 4 0 COL Staphylinidae Gabrius osseticus Kolenati, 1846 Rove beetle PRE1 0 1 COL Staphylinidae Philonthus
carbonarius Gravenhorst, 1802
Rove beetle PRE1 13 0
COL Staphylinidae Philonthus cognatus Stephens, 1832 Rove beetle PRE1 2 4 COL Staphylinidae Philonthus
umbratilis Gravenhorst, 1802
Rove beetle PRE1 2 0
COL Staphylinidae Quedius fuliginosus Gravenhorst, 1802
Rove beetle PRE1 0 1
COL Staphylinidae Quedius levicollis Brullé, 1832 Rove beetle PRE1* 45 45 COL Staphylinidae Quedius semiaeneus Stephens, 1833 Rove beetle PRE1* 0 1 COL Staphylinidae Ocypus
aenocephalus De Geer, 1774 Rove beetle PRE1* 0 1
COL Staphylinidae Xantholinus linearis Olivier, 1795 Rove beetle PRE1 4 1 COL Staphylinidae Xantholinus
longiventris Heer, 1839 Rove beetle PRE1 7 89
COL Coccinellidae Anisosticta Linnaeus,1758 Lady bird PRE2 2 0
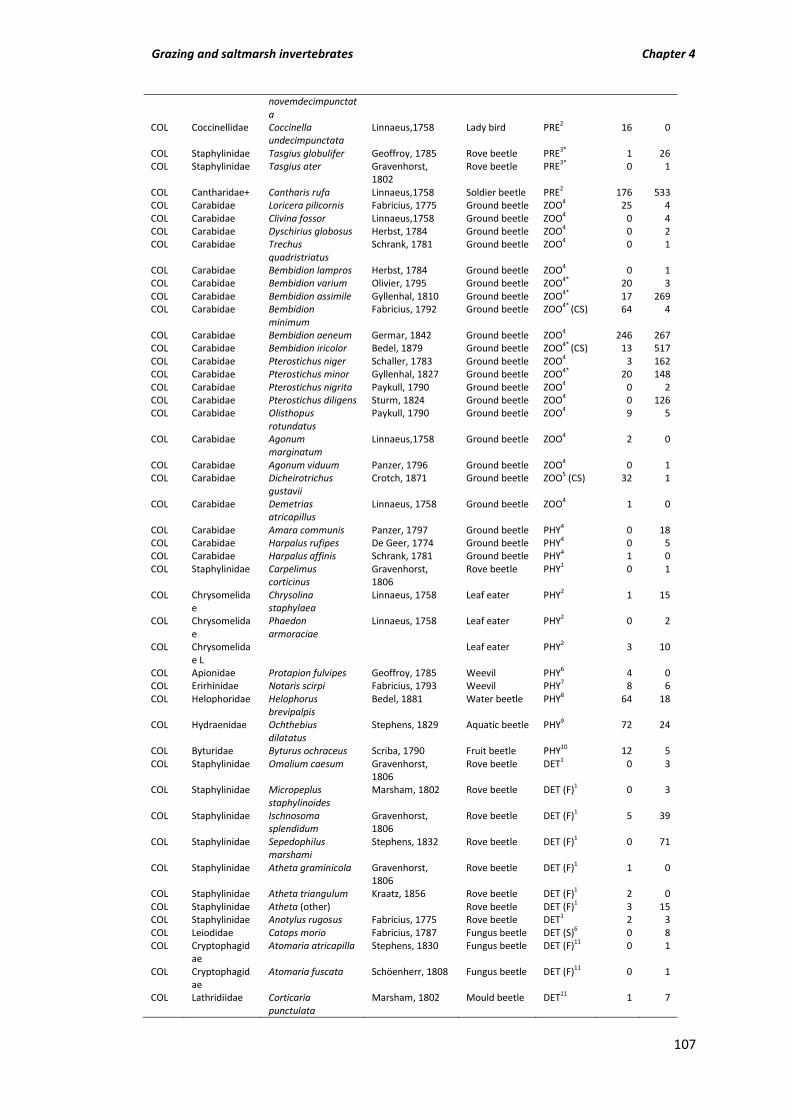
Grazing and saltmarsh invertebrates Chapter 4
107
novemdecimpunctata
COL Coccinellidae Coccinella undecimpunctata
Linnaeus,1758 Lady bird PRE2 16 0
COL Staphylinidae Tasgius globulifer Geoffroy, 1785 Rove beetle PRE3* 1 26 COL Staphylinidae Tasgius ater Gravenhorst,
1802 Rove beetle PRE3* 0 1
COL Cantharidae+ Cantharis rufa Linnaeus,1758 Soldier beetle PRE2 176 533 COL Carabidae Loricera pilicornis Fabricius, 1775 Ground beetle ZOO4 25 4 COL Carabidae Clivina fossor Linnaeus,1758 Ground beetle ZOO4 0 4 COL Carabidae Dyschirius globosus Herbst, 1784 Ground beetle ZOO4 0 2 COL Carabidae Trechus
quadristriatus Schrank, 1781 Ground beetle ZOO4 0 1
COL Carabidae Bembidion lampros Herbst, 1784 Ground beetle ZOO4 0 1 COL Carabidae Bembidion varium Olivier, 1795 Ground beetle ZOO4* 20 3 COL Carabidae Bembidion assimile Gyllenhal, 1810 Ground beetle ZOO4* 17 269 COL Carabidae Bembidion
minimum Fabricius, 1792 Ground beetle ZOO4* (CS) 64 4
COL Carabidae Bembidion aeneum Germar, 1842 Ground beetle ZOO4 246 267 COL Carabidae Bembidion iricolor Bedel, 1879 Ground beetle ZOO4* (CS) 13 517 COL Carabidae Pterostichus niger Schaller, 1783 Ground beetle ZOO4 3 162 COL Carabidae Pterostichus minor Gyllenhal, 1827 Ground beetle ZOO4* 20 148 COL Carabidae Pterostichus nigrita Paykull, 1790 Ground beetle ZOO4 0 2 COL Carabidae Pterostichus diligens Sturm, 1824 Ground beetle ZOO4 0 126 COL Carabidae Olisthopus
rotundatus Paykull, 1790 Ground beetle ZOO4 9 5
COL Carabidae Agonum marginatum
Linnaeus,1758 Ground beetle ZOO4 2 0
COL Carabidae Agonum viduum Panzer, 1796 Ground beetle ZOO4 0 1 COL Carabidae Dicheirotrichus
gustavii Crotch, 1871 Ground beetle ZOO5 (CS) 32 1
COL Carabidae Demetrias atricapillus
Linnaeus, 1758 Ground beetle ZOO4 1 0
COL Carabidae Amara communis Panzer, 1797 Ground beetle PHY4 0 18 COL Carabidae Harpalus rufipes De Geer, 1774 Ground beetle PHY4 0 5 COL Carabidae Harpalus affinis Schrank, 1781 Ground beetle PHY4 1 0 COL Staphylinidae Carpelimus
corticinus Gravenhorst, 1806
Rove beetle PHY1 0 1
COL Chrysomelidae
Chrysolina staphylaea
Linnaeus, 1758 Leaf eater PHY2 1 15
COL Chrysomelidae
Phaedon armoraciae
Linnaeus, 1758 Leaf eater PHY2 0 2
COL Chrysomelidae L
Leaf eater PHY2 3 10
COL Apionidae Protapion fulvipes Geoffroy, 1785 Weevil PHY6 4 0 COL Erirhinidae Notaris scirpi Fabricius, 1793 Weevil PHY7 8 6 COL Helophoridae Helophorus
brevipalpis Bedel, 1881 Water beetle PHY8 64 18
COL Hydraenidae Ochthebius dilatatus
Stephens, 1829 Aquatic beetle PHY9 72 24
COL Byturidae Byturus ochraceus Scriba, 1790 Fruit beetle PHY10 12 5 COL Staphylinidae Omalium caesum Gravenhorst,
1806 Rove beetle DET1 0 3
COL Staphylinidae Micropeplus staphylinoides
Marsham, 1802 Rove beetle DET (F)1 0 3
COL Staphylinidae Ischnosoma splendidum
Gravenhorst, 1806
Rove beetle DET (F)1 5 39
COL Staphylinidae Sepedophilus marshami
Stephens, 1832 Rove beetle DET (F)1 0 71
COL Staphylinidae Atheta graminicola Gravenhorst, 1806
Rove beetle DET (F)1 1 0
COL Staphylinidae Atheta triangulum Kraatz, 1856 Rove beetle DET (F)1 2 0 COL Staphylinidae Atheta (other) Rove beetle DET (F)1 3 15 COL Staphylinidae Anotylus rugosus Fabricius, 1775 Rove beetle DET1 2 3 COL Leiodidae Catops morio Fabricius, 1787 Fungus beetle DET (S)6 0 8 COL Cryptophagid
ae Atomaria atricapilla Stephens, 1830 Fungus beetle DET (F)11 0 1
COL Cryptophagidae
Atomaria fuscata Schöenherr, 1808 Fungus beetle DET (F)11 0 1
COL Lathridiidae Corticaria punctulata
Marsham, 1802 Mould beetle DET11 1 7

Grazing and saltmarsh invertebrates Chapter 4
108
COL Lathridiidae Corticarina minuta Fabricius, 1792 Mould beetle DET11 0 2 COL Staphylinidae Lesteva sicula heeri Fauvel, 1871 Rove beetle DET (S)12 0 5 COL Staphylinidae Lesteva
longoelytrata Goeze, 1777 Rove beetle DET (S)12 1 0
COL Hydrophilidae Cercyon impressus Fabricius, 1775 Water beetle DET13 0 2 COL Hydrophilidae Megasternum
concinnum Marsham, 1802 Water beetle DET13 17 111
COL Hydrophilidae Sphaeridium scarabaeoides
Linnaeus,1758 Water beetle DET13 1 0
COL Ptiliidae Ptenidium Sp. Feather beetle
DET (F)13 0 1
COL Ptiliidae Acrotrichis Sp. Feather beetle
DET (F)13 2 67
COL Staphylinidae Brundinia marina Mulsant & Rey, 1853
Rove beetle NOT (CS) 172 111
COL Staphylinidae Mocyta fungi Gravenhorst, 1806
Rove beetle NOT 58 25
COL Carabidae L NOT 32 3 COL Staphylinidae
L NOT 0 108
HET Nabidae Stalia major Costa, 1841 Damsel bug PRE14 0 1 HET Nabidae Nabis lineatus Dahlbom, 1851 Damsel bug PRE14 0 3 HET Dipsocoridae Ceratocombus
coleoptratus Zetterstedt, 1819 PRE11 0 13
HET Saldidae Saldula opacula Zetterstadt, 1838 Shore bug PRE15* (N) 28 0 HET Saldidae Saldula pallipes Fabricius, 1794 Shore bug PRE15* 4 0 HET Saldidae+ Salda littoralis Linnaeus, 1758 Shore bug PRE16 638 2 HOM Cicadellidae Aphrodes albifrons Linnaeus, 1758 Leaf hopper PHY17 0 1 HOM Cicadellidae Aphrodes bicinctus Schrank, 1776 Leaf hopper PHY17 1 5 HOM Cicadellidae Arthaldeus
pascuellus Fallen, 1826 Leaf hopper PHY17 5 1
HOM Cicadellidae Psammotettix putoni
Then, 1898 Leaf hopper PHY17 12 0
HOM Cicadellidae Conosanus obsoletus
Kirshbaum, 1858 Leaf hopper PHY17 6 3
HOM Cicadellidae Streptanus sordidus Zetterstedt, 1828 Leaf hopper PHY17 7 0 HOM Cicadellidae Macrosteles
viridigriseus Edwards, 1922 Leaf hopper PHY17 5 0
HOM Delphacidae Javesella dubia Kirschbaum, 1868 Leaf hopper PHY17 1 2 HOM Delphacidae+ Javesella pellucida Fabricius, 1794 Leaf hopper PHY17 0 29 HOM Stenorrhynch
a Aphids only PHY17 173 102
HET Miridae Megaloceraera recticornis
Geoffroy, 1785 Mirid bug PHY15 0 1
HOM Cicadellidae L Cicadellidae larvae PHY17 66 5 ARA Clubionidae Clubiona stagnatilis Kulczynski, 1897 Foliage spider PRE
(FRH)18 3 25
ARA Gnaphosidae Micaria pulicaria Sundevall, 1831 Ground spider PRE
(GRH)18 0 15
ARA Lycosidae Trochosa ruricola De Geer, 1778 Wolf spider PRE (GRH)18
12 49
ARA Lycosidae Pardosa purbeckensis
Cambridge, 1895 Wolf spider PRE (GRH)
18 (CS) 454 515
ARA Lycosidae Pardosa pullata Clerck, 1757 Wolf spider PRE (GRH)18
2 22
ARA Lycosidae Pirata piraticus Clerck, 1757 Wolf spider PRE (GRH)18
5 73
ARA Tetragnathidae
Pachygnatha clercki Sundevall, 1823 - PRE (GRH)21
73 153
ARA Tetragnathidae
Pachygnatha degeeri
Sundevall, 1830 - PRE (GRH)21
106 1
ARA Theridiidae Robertus lividus Blackwall, 1836 Comb spider PRE (SWB)18
0 153
ARA Linyphiidae Walckenaeria nudipalpis
Westring, 1851 Money spider PRE (SW)18
0 1
ARA Linyphiidae Walckenaeria vigilax
Blackwall, 1853 Money spider PRE (SW)18
33 9
ARA Linyphiidae Walckenaeria incisa Cambridge, 1871 Money spider PRE (SW)18
1 0
ARA Linyphiidae Walckenaeria kochi Cambridge, 1873 Money spider PRE (SW)18
21 37
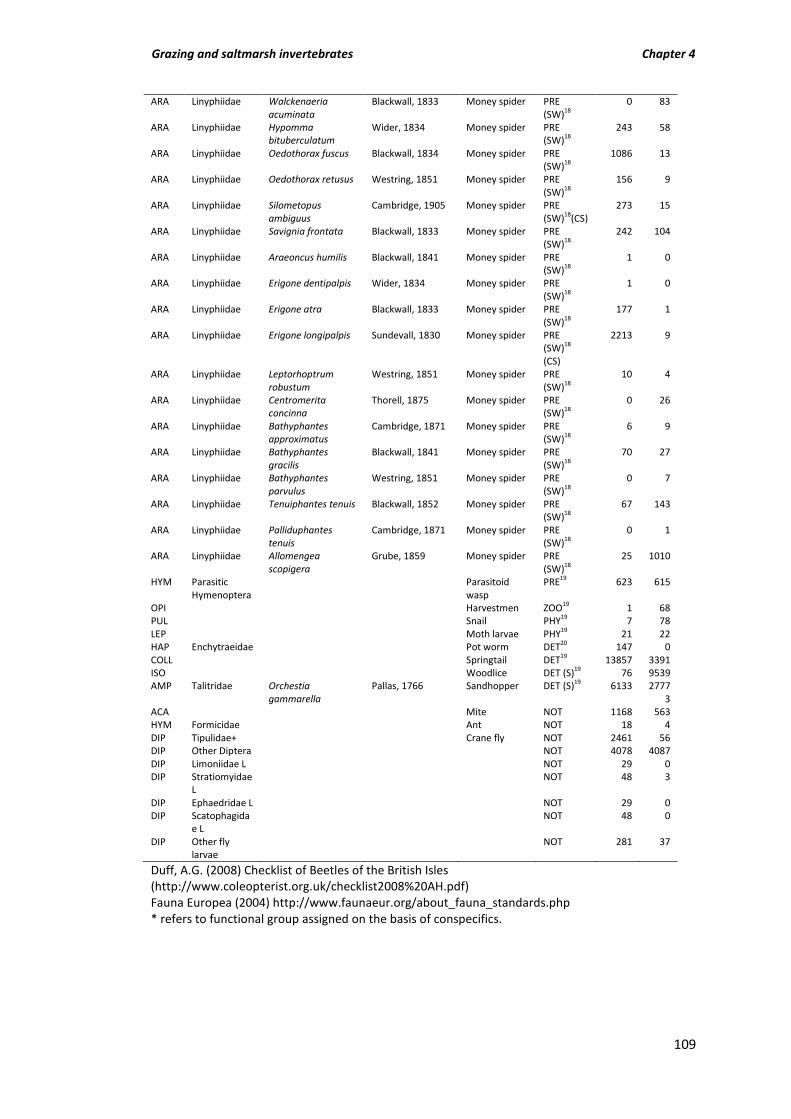
Grazing and saltmarsh invertebrates Chapter 4
109
ARA Linyphiidae Walckenaeria acuminata
Blackwall, 1833 Money spider PRE (SW)18
0 83
ARA Linyphiidae Hypomma bituberculatum
Wider, 1834 Money spider PRE (SW)18
243 58
ARA Linyphiidae Oedothorax fuscus Blackwall, 1834 Money spider PRE (SW)18
1086 13
ARA Linyphiidae Oedothorax retusus Westring, 1851 Money spider PRE (SW)18
156 9
ARA Linyphiidae Silometopus ambiguus
Cambridge, 1905 Money spider PRE (SW)18(CS)
273 15
ARA Linyphiidae Savignia frontata Blackwall, 1833 Money spider PRE (SW)18
242 104
ARA Linyphiidae Araeoncus humilis Blackwall, 1841 Money spider PRE (SW)18
1 0
ARA Linyphiidae Erigone dentipalpis Wider, 1834 Money spider PRE (SW)18
1 0
ARA Linyphiidae Erigone atra Blackwall, 1833 Money spider PRE (SW)18
177 1
ARA Linyphiidae Erigone longipalpis Sundevall, 1830 Money spider PRE (SW)18 (CS)
2213 9
ARA Linyphiidae Leptorhoptrum robustum
Westring, 1851 Money spider PRE (SW)18
10 4
ARA Linyphiidae Centromerita concinna
Thorell, 1875 Money spider PRE (SW)18
0 26
ARA Linyphiidae Bathyphantes approximatus
Cambridge, 1871 Money spider PRE (SW)18
6 9
ARA Linyphiidae Bathyphantes gracilis
Blackwall, 1841 Money spider PRE (SW)18
70 27
ARA Linyphiidae Bathyphantes parvulus
Westring, 1851 Money spider PRE (SW)18
0 7
ARA Linyphiidae Tenuiphantes tenuis Blackwall, 1852 Money spider PRE (SW)18
67 143
ARA Linyphiidae Palliduphantes tenuis
Cambridge, 1871 Money spider PRE (SW)18
0 1
ARA Linyphiidae Allomengea scopigera
Grube, 1859 Money spider PRE (SW)18
25 1010
HYM Parasitic Hymenoptera
Parasitoid wasp
PRE19 623 615
OPI Harvestmen ZOO19 1 68 PUL Snail PHY19 7 78 LEP Moth larvae PHY19 21 22 HAP Enchytraeidae Pot worm DET20 147 0 COLL Springtail DET19 13857 3391 ISO Woodlice DET (S)19 76 9539 AMP Talitridae Orchestia
gammarella Pallas, 1766 Sandhopper DET (S)19 6133 2777
3 ACA Mite NOT 1168 563 HYM Formicidae Ant NOT 18 4 DIP Tipulidae+ Crane fly NOT 2461 56 DIP Other Diptera NOT 4078 4087 DIP Limoniidae L NOT 29 0 DIP Stratiomyidae
L NOT 48 3
DIP Ephaedridae L NOT 29 0 DIP Scatophagida
e L NOT 48 0
DIP Other fly larvae
NOT 281 37
Duff, A.G. (2008) Checklist of Beetles of the British Isles (http://www.coleopterist.org.uk/checklist2008%20AH.pdf) Fauna Europea (2004) http://www.faunaeur.org/about_fauna_standards.php * refers to functional group assigned on the basis of conspecifics.

Grazing and saltmarsh invertebrates Chapter 4
110
1Clough, Y., Kruess, A. & Tscharntke (2007) Organic versus conventional arable farming systems: Functional grouping helps understand staphylinid response. Agriculture Ecosystems & Environment 118, 285-290.
2Chinery, M. (1986) Collins guide to the insects of Britain and Western Europe. HarperCollins Publishers, London.
3http://markgtelfer.co.uk (2011).
4Vanbergen, A. J., Woodcock, B. A., Koivula, M., Niemela, J., Kotze, D. J., Bolger, T., Golden, V., Dubs, F., Boulanger, G., Serrano, J., Lencina, J. L., Serrano, A., Aguiar, C., Grandchamp, A. C., Stofer, S., Szel, G., Ivits, E., Adler, P., Markus, J. & Watt, A. D. (2010). Trophic level modulates carabid beetle responses to habitat and landscape structure: a pan-European study. Ecological Entomology 35(2), 226-235.
5Treherne, J.E. & Foster, W.A. (1977) Diel activity of an intertidal beetle, Dicheirotrichus gustavi Crotch. Journal of Animal Ecology 46, 127-138.
6http://canacoll.org (2011).
7www.bioinfo.org.uk (2011).
8www.fifecoastandcountrysidetrust.co.uk (2011).
9http://en.wikipedia.org/wiki/Hydraenidae.
10 www.thewcg.org.uk (2011); 11 http://delta-intkey.com (2011).
12http://edoc.mpg.de (2011).
13Lassau, S.A., Hochuli, D.F., Cassis, G. & Reid, C.A.M. (2005) Effects of habitat complexity on forest beetle diversity: do functional groups respond consistently? Diversity and Distributions 11, 73-82.
14http://mint.ippc.orst.edu (2011).
15www.britishbugs.org.uk (2011).
16pers. comm. Roel Van Klink (2011).
17http://www.brc.ac.uk/DBIF (2011).
18Uetz, G.W., Halaj, J. & Cady, A.B. (1999) Guild Structure of Spiders in Major Crops. Journal of Arachnology, 27, 270-280.
19Tilling, S.M. (1987) A key to the major groups of British Terrestrial Invertebrates. Field Studies 6, 695-766.
20Begon, M., Townsend, C.R. & Harper, J.L. (1986) Ecology: from individuals to ecosystems. Blackwell Publishing Limited, UK.
21Levi, H.W. (1980) The orb-weaver genus Mecynogea, the subfamily Metinae and the genera Pachygnatha, Glenognatha and Azilia of the subfamily Tetragnathinae north of Mexico (Araneae: Araneidae). Bulletin of the Museum of Comparative Zoology 149, 1–75.

Grazing and saltmarsh greenhouse gas emissions Chapter 5
111
Chapter 5: Methane, carbon dioxide and nitrous oxide fluxes from a
temperate salt marsh: grazing management does not alter Global
Warming Potential
Hilary Ford, Angus Garbutt, Laurence Jones & Davey L. Jones
Accepted for publication in Estuarine, Coastal and Shelf Science
http://dx.doi.org/10.1016/j.ecss.2012.08.002
5.1 Abstract
Soil greenhouse gas emissions from cattle grazed and un-grazed temperate upper
salt marsh were measured using dark static chambers, monthly for one year.
Additionally, below-ground gas sampling tubes were used to measure soil methane
(CH4) concentrations. CH4 efflux from grazed and un-grazed salt marsh did not
differ significantly, however grazing did lead to ‘hotspots’ of underground CH4 (up
to 6 % of total air volume) and CH4 efflux (peak of 9 mg m-2 h-1) significantly linked
to high soil moisture content, low soil temperatures and the presence of Juncus
gerardii. Carbon dioxide (CO2) efflux was greater from the un-grazed marsh (mean
of 420 mg m-2 h-1) than the grazed marsh (mean of 333 mg m-2 h-1) throughout most
of the year and was positively correlated with deeper water table and greater soil
temperatures. Grazing was not a significant predictor of nitrous oxide (N2O) soil
emissions. Global Warming Potential (GWP; over 100 years), calculated from mean
yearly chamber fluxes for CH4 and CO2, did not differ significantly with grazing
treatment. Seasonal variation in the key drivers of soil greenhouse gas efflux; soil
temperature, moisture and water table, plus the presence or absence of
aerenchymatous plants such as J. gerardii were more important to the magnitude
of greenhouse gas emissions than grazing management per se.

Grazing and saltmarsh greenhouse gas emissions Chapter 5
112
Key words: chamber flux measurements, greenhouse gases, salt marshes, livestock
grazing, UK: Ribble estuary
5.2 Introduction
Methane (CH4), carbon dioxide (CO2), and nitrous oxide (N2O) are all major
greenhouse gases. Despite natural wetlands accounting for a third of global CH4
flux, their contribution to Global Warming Potential (GWP) may be off-set by their
carbon sink capabilities and minimal N2O emissions (Dassonville & Renault, 2002;
Denman et al., 2007; Lai, 2009). Managing wetlands to minimise their GWP is
therefore crucial. Most previous research focuses on freshwater wetlands such as
peatlands (Le Mer & Roger, 2001; Limpens et al., 2008; Lai, 2009) with the GWP of
coastal habitats such as tidal flats and salt marshes remaining less well quantified
(Pacyna & ManØ, 2006). European salt marshes are often managed by livestock
grazing to provide a suitable habitat for over-wintering bird species (Adam, 1990;
Milsom et al., 2000; Chatters, 2004), however, the impact of this management on
the GWP of this habitat is not well known. Grazing management is expected to have
clear implications for GWP as soil moisture content, soil temperature and plant
community composition, all key drivers of soil greenhouse gas emissions, often
differ with grazing intensity (Bakker et al., 1993; Curry, 1994; Lambert, 2000).
Despite the fact that salt marshes are by definition inter-tidal wetlands, their upper
zones share many characteristics of semi-natural grasslands due to infrequent
inundation. Aerated grassland soils are large carbon stores, produce little CH4 and
emit significant amounts of N2O only under intensive grazing or fertiliser input
regimes (Soussana et al., 2007; Allard et al., 2007; Del Grosso, 2010). Upper
temperate salt marshes, common throughout Europe and characteristic of the vast
area behind summer dykes in the Wadden Sea area of Germany (Bakker et al.,
1993), may therefore have a similar GWP to terrestrial grasslands during the
summer months if tidal inundation is rare.
CH4 is produced by methanogenic archaea from either CO2 or acetic acid when soil
conditions are suitably anoxic (Denman et al., 2007). Where an oxic soil layer exists
above an anoxic layer up to 88 % of CH4 produced can be oxidised by

Grazing and saltmarsh greenhouse gas emissions Chapter 5
113
methanotrophs (Calhoun & King, 1997). CH4 leaves the soil via three pathways,
diffusion, ebullition and through the aerenchyma of certain plant species (Van der
Nat & Middelburg, 2000). In wetland soils, CH4 production is increased by standing
water or waterlogged soil, high soil temperatures and increased organic matter or
substrate availability (Le Mer & Roger, 2001; Ding et al., 2004; Kankaala et al.,
2005). In the sulphate rich marine environment sulphate reducing bacteria typically
out-compete methanogenic archaea in the anaerobic decomposition of organic
matter, a process governed by the redox potential (Piker et al., 1998). As
saltmarshes are tidal it is assumed that CH4 emissions from this habitat are
relatively insignificant. Bartlett et al. (1985) reported that North American coastal
saltmarshes do not contribute significantly to CH4 emissions. However, in a recent
review of CH4 emissions from temperate tidal marshes Poffenbarger et al. (2011)
reported that while polyhaline tidal marshes had lower CH4 emissions than fresh
water marshes, oligohaline marshes had the highest and most variable emissions.
To our knowledge, CH4 efflux has not been measured for the upper zone of the salt
marsh that may only be tidally inundated a dozen times a year. Cattle grazing may
increase soil CH4 emissions directly via the input of animal dung, a moderate CH4
source, and indirectly via CH4 ebullition caused by cattle trampling (IPCC, 1996; Lin
et al., 2009; Herbst et al., 2011). In addition, grazed salt marshes may be prone to
water-logged ground, have greater plant species richness than un-grazed marshes
and are often characterised by Juncus species (rushes) that are known to vent CH4
via their aerenchyma (Adam, 1990; Roslev & King, 1996; Lambert, 2000).
CO2 efflux is comprised of microbial (soil) and plant respiration. Soil respiration
requires aerobic decomposition conditions, intermediate soil moisture and
becomes faster with increased soil temperature and ecosystem productivity (Luo &
Zhou, 2006). Both European and North American saltmarshes have high levels of
primary productivity (Vernberg, 1993; Mitsch & Gosselink, 2000) but exhibit
variable redox potential and soil moisture regimes due to differences in timing and
duration of tidal inundation. Regularly inundated salt marshes and mudflats are
likely to show very different soil characteristics to upper salt marshes that are less
frequently inundated. Studies of grazing and CO2 efflux have largely concentrated
Grazing and saltmarsh greenhouse gas emissions Chapter 5
114
upon grassland systems. In Soussana et al. (2007) grasslands under widely differing
grazing and fertiliser addition regimes were all net sinks of CO2. However, livestock
grazing may reduce plant respiration directly via removal of above-ground plant
biomass by herbivores and also reduce soil respiration indirectly via decreased
supply of readily available carbon to roots and microbes (Luo & Zhou, 2006).
Despite this effect, ‘hotspots’ of CO2 emissions from livestock dung, up to 50 %
higher than control plots have been recorded (Lin et al., 2009) and should also be
taken into account. Grazing intensity also influences soil carbon storage. Light,
moderate or heavy grazing can all increase soil carbon, depending on grassland
type (Kemp & Michalk, 2007). Conversely, extensively grazed or un-grazed
grasslands may store more carbon than intensively managed grassland (Campbell et
al., 1997; Soussana et al., 2004).
N2O soil emissions occur where an aerobic soil surface layer coupled with an
anaerobic layer immediately beneath provides suitable conditions for aerobic
nitrifying bacteria to produce nitrate, from which anaerobic denitrifying bacteria
produce N2O (Mitsch & Gosselink, 2000). Nitrification may also occur in the
oxidised root zone of plants. N2O soil emissions are increased by high nitrate
availability and compacted, waterlogged, warm soil (Van Groenigen et al., 2005; Lin
et al., 2009; Del Grosso, 2010). In general, N2O emissions are considered
detrimental as they increase atmospheric pollution. However, in coastal systems,
denitrification leading to increased N2O efflux may be seen as environmentally
beneficial, when this prevents the release of nitrate into the marine environment
that can lead to eutrophication (Brin et al., 2010). There are very few studies
concerning N2O emissions from freshwater or saltwater wetland soils (Poffenbarger
et al., 2011). Most studies from grasslands record greater soil N2O emissions with
increased livestock grazing intensities. Animal trampling leads to compact, warm,
waterlogged soils, and the addition of animal waste a nitrate source, providing ideal
conditions for soil N2O efflux (Van Groenigen et al., 2005; Saggar et al., 2007; Lin et
al., 2009; Del Grosso, 2010). However, Wolf et al. (2010) provides conflicting
evidence, soil N2O emissions were highest in un-grazed steppe grasslands and
lowest in grasslands with highest stocking densities.

Grazing and saltmarsh greenhouse gas emissions Chapter 5
115
In this study we examine the effect of cattle grazing on greenhouse gas efflux and
estimated GWP of a temperate upper saltmarsh. The following three hypotheses
were examined: 1) Soil CH4 efflux will be greater in the cattle grazed than the un-
grazed salt marsh due to differences in compaction and soil moisture content; 2)
Combined soil and plant CO2 efflux will be greater in the un-grazed (aerobic, free
draining soil with a large above-ground plant biomass) than the grazed marsh; 3)
Soil N2O efflux will be greater in the grazed than the un-grazed marsh due to
differences in compaction, waterlogging and nitrate supply.
5.3 Study area, materials and methods
5.3.1 Crossens marsh
The salt marshes of the Ribble estuary cover 2000 ha in total. The study area,
Crossens Marsh (53⁰ 41’ 15” N, 2⁰ 57’ 4” W), is located on the southern edge of the
Ribble estuary in north-west England and is part of the Sefton Coast Special
Protection Area managed by Natural England. The marsh has been arbitrarily split
into two management types by a fence line that has been in situ for at least forty
years, running more-or-less perpendicular to the shore. The grazed marsh is
characterised by predominantly Festuca rubra saltmarsh National Vegetation
Community (NVC; SM16d) and the un-grazed marsh by Elytrigia repens saltmarsh
(SM28; Rodwell, 2000). The grazed part of the marsh covers 517 ha and is grazed
uniformly by around 100 bullocks from late May to early October (0.2 cattle per
hectare) to provide an overwintering feeding habitat for pink-footed geese (Anser
brachyrhynchus). All experimental units were selected within the oligohaline
(salinity = 0.5 – 5 PSU (practical salinity units)) high marsh zone where numerous
creeks are present but tidal inundations are relatively rare, limited to around eight
events a year on high equinox tides. A paired experimental design was used with six
experimental units of approximately 10 m x 10 m set up on each side of a 600 m
long section of the fence line, 100-150 m apart, in a ‘mirror image’ formation, giving
six grazed (G1-G6) and six un-grazed (U1-U6) units (Figure 5.1). Each experimental
unit was located between 20 m and 50 m from the fence line to ensure an

Grazing and saltmarsh greenhouse gas emissions Chapter 5
116
adequate buffer zone and checked for comparable elevation within ±10 cm. All
measurements were carried out within these experimental units.
G1
Grazed
Un-grazed
Fence line 600 m
G2
G3
G4
G5
G6
U6
U5
U4U2
U3
U1
30 m
SALT MARSH
U1
G1
Un-grazed units
Cattle grazed units
Block 1 Block 5 Block 6Block 2 Block 3 Block 4
Buffer zone 20 m
Figure 5.1 Experimental design at Crossens Marsh. All units are 10 m x 10 m square at 20 - 30 m, 30
- 40 m or 40 - 50 m from the fence line. Not to scale.
5.3.2 Marsh characterisation
The following measurements were taken for saltmarsh characterisation in 2009.
Soil samples were collected during September from the top 15 cm of soil to
measure salinity and pH. Soil was sieved to 2 mm and a sub sample of 10 g was
taken from each sample and shaken with 25 ml of deionised water (1:2.5 dilution
factor). A Hanna pH209 pH meter was used to measure pH and a Jenway 4520
Conductivity meter to measure electrical conductivity (mS cm-1) as a proxy for
salinity. Samples to determine bulk density and soil organic matter content were
also collected using intact soil cores of 3.8 cm diameter and 15 cm depth. Cores
were dried at 105 ⁰C for 72 hours and the dry mass divided by the volume of the
core to calculate bulk density. Loss-on-ignition was used to estimate organic matter
content (Ball, 1964). Soil carbon stock in kg C m-2 was calculated from bulk density
and the conversion factor of soil carbon as 0.55 of soil organic matter (Emmett et
al., 2010). Soil moisture content and temperature were recorded at six locations
within each experimental unit during September. Soil conductivity was measured in
direct volts using a Delta T Theta Meter HH1 (four probes of 6 cm) and converted to

Grazing and saltmarsh greenhouse gas emissions Chapter 5
117
percentage soil moisture content using a calibration suitable for organic soils. Soil
temperature was measured using a digital thermometer (single 11 cm probe).
Vertical water infiltration rate, inversely related to waterlogged soil conditions, was
measured using three single ring infiltrometers (Carroll et al., 2004) per
experimental unit.
The potential for nutrient cycling by microbes was assessed using a measure of
mineralisable N (Rowe et al., 2011). Three N mineralisation cores, 3.8 cm diameter
and 15 cm depth, were taken from each experimental unit, during September. Soil
cores were taken using plastic corers, capped at both ends to minimise soil
disruption, and stored intact at 4 °C. Accumulated inorganic N was flushed from the
cores by spraying with a solution of similar ionic concentration to UK rain over 7
days until 150 ml of leachate had been collected. Cores were incubated at 10 °C for
28 days, homogenised and a sub-sample extracted using 1 M KCl for the analysis of
ammonium and nitrate content (Rowe et al., 2011). N mineralization rate was
calculated over these 28 days assuming that all previous inorganic N had been
removed during the 7 day flushing period. Mineralisable N was expressed as μg N g-
1 day -1 on both a dry soil weight and organic matter basis. The biological activity of
soil meso-faunal decomposers, a proxy for aerobic soil activity, was measured using
custom made bait lamina (Terra Protecta GmbH, Germany), 15 cm long with 16
holes filled with cellulose, bran and charcoal. Ten bait lamina per experimental unit
were set up in two lines of five, 50 cm apart, pushed vertically into the ground so
the top hole was 1 cm below the soil surface. Strips were placed in the ground in
late June for 44 days and again in mid September for 34 days until 10 – 40 % of the
bait had been degraded. Strips were removed, washed and each hole assessed for
biological activity or ‘feeding rate’. Feeding rates were standardised to percentage
bait removed per 7 days.
Above-ground net primary productivity (ANPP), peak biomass from three grazer
excluded areas per experimental unit, was recorded as a direct measure of primary
productivity. At the beginning of March, vegetation was cut to ground level in three
50 cm x 50 cm areas per experimental unit. Each cut area was protected from cattle
by an 8 cm mesh gabion (50 x 50 x 50 cm) and vegetation allowed to re-grow until

Grazing and saltmarsh greenhouse gas emissions Chapter 5
118
peak biomass at the end of August when areas were re-cut within a central 25 cm x
25 cm area. Vegetation was dried at 80 °C for 72 hours then weighed and converted
to kg dry wt m-2 yr-1 to provide a measure of ANPP. Above-ground living plant
material and plant litter were collected for five 25 cm x 50 cm quadrats per
experimental unit in July, one root core of 5 cm diameter and 10 cm depth was also
taken per quadrat and washed to remove all soil. Above-ground vegetation, litter
and roots were all dried at 80 °C for 72 hours and weighed to give indicators of
above-ground live plant biomass, litter biomass and below-ground root biomass
respectively. Above-ground biomass can be linked to dark chamber respiration
rates.
5.3.3 CH4, CO2 and N2O chamber fluxes
Above-ground greenhouse gas fluxes were measured by a closed dark static
chamber method. Each chamber consisted of a polyvinyl chloride (PVC) pipe of 15
cm height (30 cm internal diameter) with a rubber Septa sampling point located
half way up, sealed to a 2 mm acrylonitrile butadiene styrene (ABS) lid, painted
silver to reflect heat . These chambers were of similar diameter to those commonly
used, but lower in height, and were chosen to increase the likelihood of measuring
minor fluxes of CH4 and N2O by increasing the surface area to volume ratio. During
measurement periods each static chamber was attached by a rubber seal to an in
situ PVC pipe base (0.71 m2). The base was placed firmly in the soil to a depth of 5
cm with 10 cm visible above-ground in June 2010, to give a combined chamber and
base volume of 0.018 m3. Vegetation and plant litter were not removed from within
the chambers.
Two chambers per experimental unit, with bases 3 m apart, were used to measure
daytime (between 11am and 3pm) greenhouse gas fluxes once a month for twelve
months from September 2010 to August 2011. Gas samples were taken with a 30
ml syringe at 0, 30, 60, 90 and 120 minutes after chamber placement and
immediately transferred to a 22 ml vial, over pressurised in the field but returned to
lab pressure prior to analysis. Internal chamber temperature was recorded in two
grazed and two un-grazed chambers per month using Tinytag data loggers (TGP-

Grazing and saltmarsh greenhouse gas emissions Chapter 5
119
4017 -40 to +85°C; Gemini Data Loggers). Gas analysis was carried out over the
following three days using a Perkin Elmer Clarus 500 Gas Chromatograph (GC) with
a Porapaq QS (80 – 100 mesh) analytical column and Turbomatrix 40 headspace
autoanalyser. CO2 and CH4 were detected by FID, N2O by ECD (at 375 °C, sample
oven at 40 °C) to give ppm and peak area (mV) measurements for the three gases.
The following standard gases were used to calibrate the GC, A: N2O 1 ppm, CH4 3.9
ppm, CO2 995.5 ppm; B: N2O 5.1 ppm, CH4 50.4 ppm, CO2 510.8 ppm; and C: N2O 2
ppm, CH4 20.3 ppm, CO2 257.7 ppm. Samples were run after a calibration was
achieved with an r2 of > 0.99 for all three gases.
5.3.4 Flux calculation
Greenhouse gas fluxes were calculated from ppm and peak area measurements for
each chamber using a GCflux model (Levy et al., 2011) run on Genstat 13.1 (Payne
et al., 2011). For CO2 and N2O, fluxes were calculated for the full 0 to 120 minutes
time scale (5 time points). For CH4 fluxes the first time point (time 0) was excluded
as it was often high compared with ambient air concentration (~1.8 ppm) due to
probable ebullition from disturbance in placing the chamber as in Alm et al. (2007).
The GCflux model calculated fluxes, with chamber volume and temperature
accounted for, by five methods: 1) Simple averaging; 2) Linear regression; 3)
Intercept method; 4) Negative exponential regression; 5) Asymptotic regression.
Final model selection, and therefore flux output for further analysis, was based on
the highest r2 value. Within this study method 2) ‘Linear regression’ was
consistently the best model fit for each data set. Regression values of r2 < 0.7 were
excluded unless they were indicative of low level or zero fluxes as in Waddington et
al. (2010). Flux output in nmol m-2 s-1 was converted to mg m-2 h-1 for statistical
analysis.
5.3.5 CH4 soil concentration
Underground soil CH4 concentrations were measured using plastic gas sampling
tubes, 10 cm long, with an internal diameter of 16.5 mm, with 8 small holes (2.5
mm diameter) drilled at either 2.5 cm, 5 cm or 7.5 cm along the tube, depth when
inserted in soil (Figure 5.2), to allow soil air at this depth to enter the tube. A

Grazing and saltmarsh greenhouse gas emissions Chapter 5
120
silicone bung was used to seal the base of the tube, a 17.5 mm Septa suba seal was
attached to the top of each tube to allow gas sampling via syringe. The gas sampling
tubes were installed in the field in July 2010, flush with the soil surface, three per
experimental unit, one 2.5 cm, 5 cm and 7.5 cm, 5 cm apart in a triangle formation.
Each set of tubes was protected by a rain hat and wire basket to prevent
interference by cattle. The gas sampling tubes were allowed to equilibrate for one
month to allow measurement of gas from the tubes to accurately reflect the soil
concentration of CH4 at each soil depth. Gas was sampled from each tube once in
October 2010, January and July 2011 using a 30 ml syringe. Samples were
immediately transferred to a pre-evacuated 22 ml glass vial, over pressurised in the
field but returned to lab pressure prior to analysis. Gas analysis was carried out
using the GC. CH4 was detected using FID to give ppm and peak area
measurements. As many measurements were higher than the lab standard CH4
concentrations of A (3.9 ppm), B (50.4 ppm) and C (20.3 ppm), additional standards
of 0.1 % (1000 ppm), 1 % (10,000 ppm) and 10 % CH4 (100,000 ppm) were used to
calculate ppm from area measurements more accurately. Soil CH4 percentages for
underground gas samples were calculated directly from soil CH4 concentrations in
ppm.
2.5 cm
7.5 cm
5 cm
Gas sampling point – Septa suba seal
Silicone bung
10 cm
16.5 mm
2 mm holes
Hypothesis: Anoxic layer below ~ 5 cm on grazed marsh
Soil surface
Figure 5.2 Schematic representation of the underground gas sampling tubes.

Grazing and saltmarsh greenhouse gas emissions Chapter 5
121
5.3.6 Environmental measurements as predictors of chamber gas fluxes
As soil temperature, soil moisture content and water table level are common
drivers of soil greenhouse gas emissions these were measured monthly for twelve
months alongside gas chamber measurements to provide possible predictive data
for the size of greenhouse gas efflux. In addition plant community composition,
particularly the presence of Juncus species, can influence the production of CH4 via
aerenchyma; this was therefore recorded in the middle of the twelve month
sampling period and used in later predictive models (2.7). Soil temperature and soil
moisture content were recorded adjacent to each chamber immediately prior to
monthly gas measurements (with the same equipment as in section 2.2). It was also
recorded if chambers or experimental units appeared waterlogged. Water table
measurements were taken monthly at the same time as gas measurements from
dip wells, one per experimental unit, located between the two chambers. The dip
wells, 1 m depth, 35 mm internal diameter, PVC slotted screen (Stuart Well Services
Ltd., Norfolk, UK), were installed in October 2010. Water table measurements were
therefore not available for September or October. Plant species percentage cover
was assessed by eye for each experimental unit during May 2011 for three 1 m x 1
m quadrats and within the two gas measurement collar areas.
5.3.7 Statistical analysis
Differences between grazing treatments for all environmental variables and flux
measurements were analysed using ANOVAs on linear mixed effects (lme) models
using R (R Development Core Team, 2011) taking into account the effect of
sampling month ‘lme (CO2flux ~ grazing*month, random =
~1|block/grazing/month’. This approach was used to enable the raw data to be
analysed accounting for replication at the level of the experimental unit (n=6;
Crawley, 2007). In addition, lme models were used to assess the influence of water
table level, soil moisture and soil temperature, all recorded alongside chamber
measurements; percentage cover of Agrostis stololinifera, Aster tripolium, E.
repens, F. rubra, Glaux maritima, Juncus gerardii, Puccinellia maritima and
Triglochin maritima recorded from chambers and experimental units; and salinity,

Grazing and saltmarsh greenhouse gas emissions Chapter 5
122
bulk density, organic matter content, above ground biomass, litter biomass, all
measured prior to chamber measurements; on underground soil CH4 concentration
and above-ground CO2 and CH4 fluxes. Results of best model fit are presented here
based on lowest Akaike information criterion (AIC) and quantile probability plot
(qqnorm) with most normal distribution.
5.3.8 Up-scaling conceptual diagram
A conceptual diagram was produced to compare the GWP of greenhouse gas fluxes
from the grazed and un-grazed salt marsh over the Crossens marsh study site.
Mean greenhouse gas fluxes from chamber measurements over the study year, for
grazed versus un-grazed marsh (n = 6), were converted to CO2 equivalents (g CO2e
m-2 yr-1) for a 100 year GWP (CO2 = 1, CH4 = 25, N2O = 298; Denman et al., 2007)
and expressed as a comparative flux estimate for grazing type. Carbon stored in
plant biomass for the grazed and un-grazed salt marsh, over one year, was
calculated from mean ANPP for each treatment using a shoot carbon value of 42 %
(unpublished data) to give a value in g C m-2 yr-1. This was then converted to CO2
equivalents in g CO2 m-2 yr-1 using a conversion factor of x 3.67 (molar mass of CO2
= 44, molar mass of C = 12, 44/12 = 3.67). CO2 allocated to roots was not calculated.
In addition to variables directly measured within this study, CH4 efflux via cattle,
enteric (i.e. microbial fermentation within rumen and large intestine), from waste
and via trampling were also estimated to provide a more realistic comparison
between grazing regimes. CH4 efflux via cattle was calculated based on 100 bullocks
on Crossens Marsh over 517 ha for 1/3 of the year (beef cattle emit 48 kg CH4 hd-1
yr-1 enteric CH4 & 6 kg CH4 hd-1 yr-1 CH4 from waste; IPCC 1996). CH4 efflux via
ebullition caused by cattle trampling was not directly measured but was included in
the diagram as an additional factor that may influence greenhouse gas emissions as
in (Herbst et al., 2011). The effect of grazing on GWP (CH4 soil efflux + CH4 cattle
efflux + CO2 efflux – ANPP = GWP (g C02e m-2 yr-1)) was analysed by ANOVA on an
lme model using R as in section 2.7.
5.4 Results
5.4.1 Marsh characterisation

Grazing and saltmarsh greenhouse gas emissions Chapter 5
123
Bulk density, soil carbon stock, soil moisture content, soil temperature and below-
ground plant biomass were all significantly higher on the grazed marsh in
comparison to the un-grazed marsh. Soil pH, water infiltration rate, ANPP, above-
ground plant biomass, litter biomass and vegetation height were all significantly
greater on the un-grazed marsh (Table 5.1). Soil salinity and organic matter content
were not significantly different between treatments although salinity showed
greater spatial variability (between experimental units) on the grazed marsh.
Nitrate mineralisation rate was significantly greater for the un-grazed marsh but
ammonium mineralisation rate was significantly greater on the grazed marsh. Total
nitrogen mineralisation was not significantly different between grazing treatments
(Table 5.1). Below-ground meso-faunal feeding activity (Figure 5.3), a proxy for
aerobic soil conditions, was significantly greater in un-grazed than grazed marsh
(ANOVA; F = 37.37, d.f. = 5, p < 0.01). Within each marsh type feeding activity was
faster in summer than autumn (ANOVA; F = 18.89, d.f. = 10, p < 0.01). On the
grazed marsh no feeding activity was recorded below 4.5 cm in summer and 3 cm in
the autumn, indicating possible anaerobic conditions.
5.4.2 CH4 chamber fluxes
CH4 fluxes were recorded monthly from September 2010 to August 2011 (Figure
5.4). Mean CH4 fluxes fell within the range of 0.01 to 1.27 mg m-2 h-1 (GCflux model
2: linear flux, mean r2 = 0.68). Peak CH4 fluxes of up to 9.82 mg m-2 h-1 on the
grazed marsh and 0.28 mg m-2 h-1 on the un-grazed marsh were recorded in
February, one of the most water-logged months. CH4 production showed high
spatial heterogeneity between experimental units with chambers within G1 and G2
exhibiting consistently larger fluxes than other grazed units. There were no
significant differences in CH4 fluxes with grazing treatment, either for one year’s
data (Figure 5.4) or for each month separately but there were significant
differences between months (ANOVA; F = 3.22, d.f. = 98, p < 0.01). For the grazed
marsh soil moisture content and the presence of J. gerardii both positively
increased CH4 soil flux whereas increased temperature significantly decreased CH4
flux (moisture ANOVA; F = 6.73, d.f. = 50, p < 0.05, Juncus ANOVA; F = 14.34, d.f. =
4, p < 0.05, temp ANOVA; F = 8.10, d.f. = 50, p < 0.01). For the un-grazed marsh no

Grazing and saltmarsh greenhouse gas emissions Chapter 5
124
soil or vegetation factors were significant for CH4 flux, indicative of the negligible
flux recorded for this treatment.
Table 5.1 Soil properties and vegetation characteristics measured from the grazed and un-grazed
marsh. Sampling depths are presented alongside treatment means ± 95% confidence intervals,
ANOVA results (n = 6) and number of replicate samples per experimental unit. For vegetation
height, for each of the 6 replicates per treatment the mean of 10 measurements was used in the
analysis. Org. mt indicates organic matter. This table includes some results previously published in
Ford et al. (2012).
Depth (cm)
Grazed Un-grazed
F statistic Rep
Soil Salinity (PSU) 0-15 2.5 ± 1.0 2.0 ± 0.7 1.78 ns 3 pH 0-15 7.6 ± 0.2 7.9 ± 0.2 7.49 * 3 Bulk density (g cm-3) 0-15 0.8 ± 0.1 0.7 ± 0.0 11.56 * 3 Organic matter content (%) 0-15 7.4 ± 1.5 6.3 ± 0.8 0.48 ns 3 Carbon stock (kg C m-2) 0-15 4.74 ±
0.7 3.69 ± 0.3
7.51 * 3
Moisture content (%) 0-6 52.6 ± 0.2
44.5 ± 2.5
10.32 * 6
Water infiltration rate (mm min-1) n/a 0.02 ± 0.01
8.52 ± 2.06
182.98 ***
2
Temperature (⁰C) 0-11 14.9 ± 0.1
14.2 ± 0.1
37.52 ** 6
Nitrogen mineralisation rates NO3
- (μg N g-1 dry wt day-1) 0-15 0.04 ± 0.03
0.25 ± 0.15
32.87 ** 3
NH4+ (μg N g-1 dry wt day-1) 0-15 0.08 ±
0.03 0.02 ± 0.02
24.59 ** 3
NO3- & NH4
+ (μg N g-1 dry wt day-1) 0-15 0.12 ± 0.05
0.28 ± 0.15
2.50 ns 3
NO3- (μg N g-1 org. mt day-1) 0-15 0.54 ±
0.48 3.75 ± 2.16
52.37 ***
3
NH4+
(μg N g-1 org. mt day-1) 0-15 1.19 ± 0.57
0.34 ± 0.28
18.34 ** 3
NO3- & NH4
+ (μg N g-1 org. mt day-1) 0-15 1.73 ± 0.76
4.10 ± 2.21
5.56 ns 3
Vegetation Above-ground net primary productivity (kg dry wt m-2 yr-1)
n/a 0.58 ± 0.10
1.20 ± 0.16
9.09 * 3
Above-ground biomass (kg dry wt m-2) n/a 0.3 ± 0.1 0.7 ± 0.1 24.15 ** 5 Litter biomass (kg dry wt m-2) n/a 0.0 ± 0.0 0.3 ± 0.1 24.68 ** 5 Below-ground biomass (kg dry wt m-2) 0-10 3.4 ± 0.4 1.0 ± 0.2 73.86 **
* 5
Vegetation height (cm) n/a 8.2 ± 0.8 19.2 ± 1.4
103.28 ***
6
Significant differences between grazing treatments indicated by *(P < 0.05), **(P < 0.01) and ***(P < 0.001). Non significant results recorded as ns (P > 0.05).

Grazing and saltmarsh greenhouse gas emissions Chapter 5
125
Figure 5.3 Below-ground meso-faunal bait lamina feeding activity for both grazing treatments (G =
grazed; U = un-grazed) in summer and autumn 2009 as a function of soil depth. Values represent
means ± 95% confidence intervals. Significant differences denoted by ** (P < 0.01), non-significant
by ns.
5.4.3 CO2 chamber fluxes
Mean monthly CO2 fluxes of 74 to 949 mg m-2 h-1 were recorded, up to a peak of
2570 mg m-2 h-1 on the grazed and 1811 mg m-2 h-1 on the un-grazed marsh in June,
one of the warmest months (GCflux model 2: linear flux, mean r2 = 0.83). Grazing,
month and grazing: month interaction all had significant effects on CO2 fluxes
(Figure 5.4) with warmer weather linked to larger fluxes, more often on the un-
grazed than the grazed marsh (grazing ANOVA; F = 16.572, d.f. = 5, p < 0.05, month
ANOVA; F = 22.68, d.f. = 110, p < 0.001, month:grazing ANOVA; F = 2.406, d.f. = 110,
p < 0.05). High soil temperatures and deeper water table led to greater CO2 fluxes
for both grazing management treatments (temp ANOVA; F = 127.19, d.f. = 117, p <
0.001, water ANOVA; F = 14.885, d.f. 105, p < 0.001). For both the grazed and un-
grazed salt marsh CO2 fluxes were most spatially variable (between experimental
units) over the summer months.

Grazing and saltmarsh greenhouse gas emissions Chapter 5
126
Figure 5.4 Monthly methane and carbon dioxide fluxes, comparison with grazing treatment (G =
grazed; U = un-grazed) for September 10 to August 11. Values in left hand panels represent means
± 95% confidence intervals. Values in right hand panels represent mean of 2 gas chambers for
grazed (G1-G6) and un-grazed (U1-U6) experimental units. Significant differences between grazing
treatments, month or grazing: month interaction indicated by *(P < 0.05), **(P < 0.01) and ***(P <
0.001). Non significant results recorded as ns (P > 0.05).
5.4.4 N2O chamber fluxes
N2O fluxes of between -0.003 and 0.050 mg m-2 h-1 for the grazed and -0.040 and
0.005 mg m-2 h-1 for the un-grazed marsh were recorded over four months;
September, November, December and January (model 2: linear flux, mean r2 =
0.47); other months were excluded due to accidental moisture collection within
vials leading to false peak area output on the GC. There were no significant
differences in flux with grazing (ANOVA; F = 4.47, d.f. = 5, ns) and recorded fluxes
were very low with a mean of 0.003 mg m-2 h-1.

Grazing and saltmarsh greenhouse gas emissions Chapter 5
127
5.4.5. CH4 soil concentration
During the waterlogged months of October and January, underground soil CH4
concentrations were spatially variable (between experimental units), particularly on
the grazed marsh, representing between 0.002 % and 6.29 % of the total soil air
volume (Figure 5.5). In line with the results from the static chamber fluxes, the
highest percentage of CH4 was recorded from experimental units G1 and G2. The
un-grazed marsh did not accumulate high levels of CH4, 0.001 % to 0.081 %. CH4
was only detectable in very low concentrations in July due to the very dry
conditions. Underground soil CH4 concentration was significantly different between
time periods (month ANOVA; F = 24.24, d.f. = 22, p < 0.001) but not significantly
different between grazing treatments. For the grazed salt marsh, lower soil
temperatures and the presence of J. gerardii (saltmarsh rush) within units
correlated significantly with soil CH4 concentration (temp ANOVA; F = 4.56, d.f. =
35, p < 0.05, Juncus ANOVA; F = 7.64, d.f. = 4, p < 0.05). For the un-grazed salt
marsh low soil temperatures and high soil moisture content correlated with high
soil CH4 concentration (temp ANOVA; F = 89.210, d.f. = 22, p < 0.001, Moisture
ANOVA; F = 4.618, d.f. = 22, p < 0.05).
Figure 5.5 Influence of grazing on underground soil methane concentrations, expressed as
percentage on a volumetric basis for October 2010, January and July 2011 on a log scale. Values
shown for all grazed (G1-G6) and un-grazed (U1-U6) experimental units. Significant differences
between grazing treatments, month or grazing: month interaction indicated by ***(P < 0.001).
Non significant results recorded as ns (P > 0.05).

Grazing and saltmarsh greenhouse gas emissions Chapter 5
128
5.4.6 Environmental measurements as predictors of chamber gas fluxes
Soil temperature, measured adjacent to chambers, was significantly affected by
grazing (ANOVA; F = 8.08, d.f. = 5, p < 0.05) and month (ANOVA; F = 3962.765, d.f. =
110, p < 0.001). As the interaction between grazing and month was also significant
(ANOVA; F = 19.931, d.f. = 110, p < 0.001) this indicates that daytime soil
temperature was higher on the grazed marsh during the spring and summer and
higher on the un-grazed marsh in winter (Figure 5.6). Soil moisture adjacent to
chambers, within the top 6 cm of soil, did not significantly alter with grazing
(ANOVA; F = 1.75, d.f. = 5, ns) despite a trend towards higher moisture content in
grazed soils in most months (Figure 5.6). The effect of month was significant
(ANOVA; F = 1.87, d.f. = 98, p < 0.05). Water table level, measured within dipwells,
was not significantly different between grazing treatments (ANOVA; F = 0.02, d.f. =
5, ns) but effect of sampling month was highly significant (ANOVA; F = 57.99, d.f. =
97, p < 0.001). Temperature, soil moisture, water table level and the presence of J.
gerardii were all significant indicators of either CH4 efflux, CO2 efflux or soil CH4
concentration as detailed in sections 3.2, 3.3 and 3.5.
5.4.7 Up-scaling conceptual diagram
The up-scaling conceptual diagram (Figure 5.7) shows no significant difference in
GWP over 100 years for the grazed and un-grazed salt marsh (ANOVA; F = 0.41, d.f.
= 5, ns). The GWP of the upper saltmarsh was estimated to be ~2000g CO2e m-2 yr-1,
regardless of grazing management.
5.5 Discussion
5.5.1 Marsh characterisation
The grazed marsh was characterised, in 2009, by compact, moist soil, anaerobic
below ~5 cm with high available ammonium characteristic of reduced conditions,
probably caused by cattle trampling. Below ground root biomass and soil carbon
stock were also greater on the grazed marsh. The un-grazed marsh had more
aerobic, free draining soil, experienced a smaller range in temperature, with greater
available nitrate and faster below-ground meso-faunal feeding rate than the grazed

Grazing and saltmarsh greenhouse gas emissions Chapter 5
129
Figure 5.6 Influence of grazing on soil moisture, water table depth and soil temperature, measured
monthly alongside gas measurements. Values represent means ± 95% confidence intervals.
Significant differences between grazing treatments, month or grazing:month interaction indicated
by *(P < 0.05), **(P < 0.01) and ***(P < 0.001). Non significant results recorded as ns (P > 0.05).
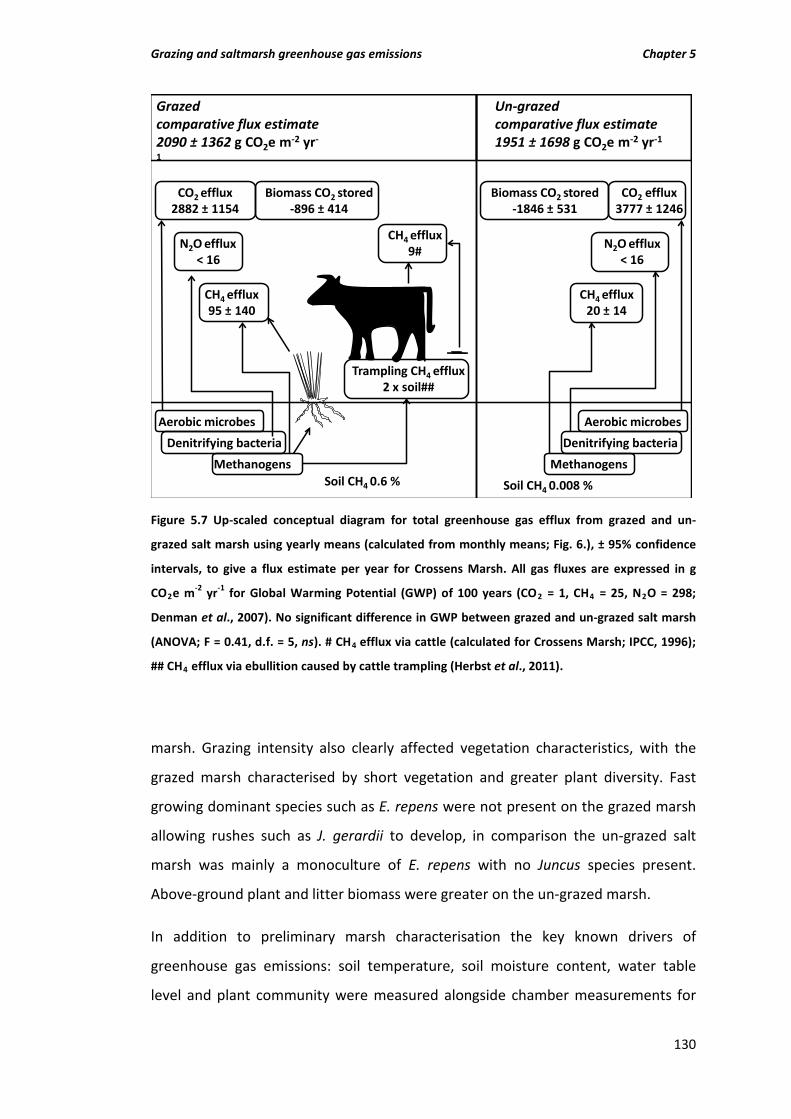
Grazing and saltmarsh greenhouse gas emissions Chapter 5
130
Grazedcomparative flux estimate 2090 ± 1362 g CO2e m-2 yr-
1
Un-grazedcomparative flux estimate 1951 ± 1698 g CO2e m-2 yr-1
CO2 efflux3777 ± 1246
Biomass CO2 stored -896 ± 414
Biomass CO2 stored -1846 ± 531
N2O efflux < 16
N2O efflux < 16
CH4 efflux 95 ± 140
CH4 efflux 20 ± 14
CH4 efflux 9#
Trampling CH4 efflux 2 x soil##
Soil CH4 0.6 % Soil CH4 0.008 %
Aerobic microbesDenitrifying bacteria
Methanogens
CO2 efflux 2882 ± 1154
MethanogensDenitrifying bacteria
Aerobic microbes
Figure 5.7 Up-scaled conceptual diagram for total greenhouse gas efflux from grazed and un-
grazed salt marsh using yearly means (calculated from monthly means; Fig. 6.), ± 95% confidence
intervals, to give a flux estimate per year for Crossens Marsh. All gas fluxes are expressed in g
CO2e m-2 yr-1 for Global Warming Potential (GWP) of 100 years (CO2 = 1, CH4 = 25, N2O = 298;
Denman et al., 2007). No significant difference in GWP between grazed and un-grazed salt marsh
(ANOVA; F = 0.41, d.f. = 5, ns). # CH4 efflux via cattle (calculated for Crossens Marsh; IPCC, 1996);
## CH4 efflux via ebullition caused by cattle trampling (Herbst et al., 2011).
marsh. Grazing intensity also clearly affected vegetation characteristics, with the
grazed marsh characterised by short vegetation and greater plant diversity. Fast
growing dominant species such as E. repens were not present on the grazed marsh
allowing rushes such as J. gerardii to develop, in comparison the un-grazed salt
marsh was mainly a monoculture of E. repens with no Juncus species present.
Above-ground plant and litter biomass were greater on the un-grazed marsh.
In addition to preliminary marsh characterisation the key known drivers of
greenhouse gas emissions: soil temperature, soil moisture content, water table
level and plant community were measured alongside chamber measurements for

Grazing and saltmarsh greenhouse gas emissions Chapter 5
131
the 2010-2011 experimental period. This allowed us to measure the effect of
grazing and season on both environmental characteristics and greenhouse gas
efflux. Results indicated that despite differences in temperature and soil moisture
content between grazing treatments, the effect of month of measurement was a
more important determinant of environmental characteristics than grazing
treatment per se. For example, soil temperature spanned a range of ~15 °C over the
measurement year but differences between grazing treatments were rarely greater
than ~2 °C except in the summer months. Also, water table depth ranged from <30
cm over winter and spring to >80 cm in summer but remained constant across
grazing treatments.
5.5.2 CH4
Grazing intensity was not a significant predictor of either soil CH4 concentration or
CH4 soil efflux. However, for the grazed salt marsh both under-ground and soil
efflux CH4 were spatially variable, with ‘hotspots’ occurring in conditions of high soil
moisture content, low soil temperature and presence of J. gerardii. During the
waterlogged autumn and winter months, underground soil CH4 concentrations of
up to 6 % and a peak CH4 flux of 9.82 mg m-2 h-1 were recorded from the grazed
marsh. In contrast, the highest recorded soil CH4 level from the un-grazed marsh
was 0.08 %, with a peak flux of 0.28 mg m-2 h-1. Over the one year study period,
mean monthly CH4 fluxes across both grazing treatments varied from 0.01 to 1.27
mg m-2 h-1 in line with fluxes recorded from North American and Australian salt
marshes, a temperate tidal lagoon and a European flooded coastal meadow
(Priemé, 1994; Deborde et al., 2010; Chmura et al., 2011; Livesley & Andrusiak,
2012) but greater than those recorded from a UK salt marsh (Dausse et al., 2012).
Our variable soil CH4 fluxes support the recent review by Poffenbarger et al. (2011),
that oligohaline marshes have more temporally and spatially variable emissions
than previously thought.
It is well known that CH4 efflux is increased by anaerobic waterlogged soils (Ding et
al., 2004; Kankaala et al., 2005). It is more unusual for soil CH4 flux to be correlated
with low temperatures, as in this study. In fact, high soil temperatures are usually

Grazing and saltmarsh greenhouse gas emissions Chapter 5
132
indicative of high CH4 efflux (Le Mer & Roger, 2001). This unexpected result can be
explained by high temperatures being correlated to drier summer months, where
CH4 flux was minimal or absent. The positive relationship between Juncus within
plots and CH4 flux may be due to Juncus itself, or the conditions it needs to grow.
Roslev and King (1996) found that Juncus effusus stems, growing in a freshwater
marsh, act as a conduit for CH4 release from soil. In addition, the largest CH4 efflux
from a North American salt marsh was recorded from a mixed Juncus – Carex plant
community (Magenheimer et al., 1996). Plant mediated CH4 transport, via
aerenchyma, may account for up to 90 % of total soil CH4 efflux in vegetated
marshes (Livingston & Hutchinson, 1995; Van der Nat & Middelburg, 1998; Van der
Nat & Middelburg, 2000). Methanogens are usually most active at neutral or
slightly alkaline conditions (Le Mer & Roger, 2001), as provided by both grazing
treatments in this study. Soil organic matter content was not found to be indicative
of CH4 efflux in the study salt marsh. As peak CH4 soil efflux was relatively low
compared to the high CH4 concentration found under the soil on the grazed upper
salt marsh, it is likely that the majority of CH4 produced is subsequently oxidised by
methanotrophs at the soil surface or rhizosphere where oxic conditions exist (Ma &
Lu, 2011). As livestock grazed salt marshes are often characterised by compact soil,
prone to waterlogging, and the presence of Juncus species (Bakker et al., 1993;
Lambert, 2000; Bos et al., 2002) it is possible that this management may increase
soil CH4 efflux.
5.5.3 CO2
Grazing was a significant predictor of CO2 efflux, with greater fluxes recorded from
the un-grazed marsh throughout summer, autumn and winter but from the grazed
marsh during spring. CO2 efflux was of greater magnitude than the CH4 efflux. With
mean annual fluxes of 420 mg m-2 h-1 for un-grazed and 333 mg m-2 h-1 for the
grazed marsh, up to a peak of 2570 mg m-2 h-1 in summer, these values are broadly
comparable to both UK and North American salt marshes (Chmura et al., 2011;
Dausse et al., 2012), and illustrate the importance of season to the magnitude of
CO2 flux. We can infer from biomass and ANPP measurements that above-ground
carbon storage was greater in un-grazed salt marsh. In contrast, root and soil

Grazing and saltmarsh greenhouse gas emissions Chapter 5
133
carbon stocks were greater in the grazed marsh as in Allard et al. (2007). High rates
of CO2 efflux, from both grazing treatments, were positively predicted by a deeper
water table, indicative of aerobic soil and higher soil temperatures as in Luo & Zhou
(2006). Studies from grasslands, tidal flats and saltmarshes show that soil CO2 efflux
is consistently amplified by increasing soil or air temperature (Raich, 1992; Klassen
& Spilmont, 2012). We therefore suggest that temperature fluctuation due to
seasonal trends and future climate change are more important to the carbon
budget of temperate salt marshes than grazing management.
5.5.4 N2O
Grazing was not a significant predictor of N2O soil emissions throughout the winter
months. The grazed marsh had higher ammonium mineralisation rates but lower
nitrate mineralisation rates than the un-grazed salt marsh. As nitrates are more
readily converted to N2O than ammonium it might be expected that the un-grazed
marsh would produce more N2O than the grazed marsh but this was not the case.
Higher fluxes of N2O, up to 0.05 mg m-2 h-1 were recorded from the grazed marsh,
compared to a maximum of 0.005 mg m-2 h-1 from the un-grazed marsh. These
results are comparable to cattle grazed and un-grazed New Zealand grassland
(Saggar et al., 2007) but lower than values recorded for a UK saltmarsh (Blackwell et
al., 2010). As the recorded fluxes were very low and not predicted by any measured
soil or vegetation characteristics we regard the upper saltmarsh as neither a source
nor sink of N2O.
5.5.5 Validity of up-scaling
Static chambers are perhaps not the best way to measure overall greenhouse gas
budgets for a habitat such as a saltmarsh due to temporal and spatial flux variations
(Denman et al., 2007). However, they are an essential tool in the measurement of
treatment differences such as grazing intensity that would be largely impossible
with the eddy covariance technique (Sullivan et al., 2010), which is more applicable
to catchment scale measurements. Within this study we provided a conceptual
diagram (Figure 5.7) of mean comparative yearly flux estimates of GWP for grazed
and un-grazed saltmarsh and found that grazing management does not significantly

Grazing and saltmarsh greenhouse gas emissions Chapter 5
134
alter GWP. This comparative approach was justified as sampling monthly for one
year provided a fuller picture of soil greenhouse gas efflux than sampling just once
or twice as was common in previous saltmarsh studies (Lindau & Delaune, 1991;
Wang et al., 2007; Dausse et al., 2012). In order to make this up-scaling exercise
more realistic, in addition to directly measured soil greenhouse gas emissions and
ANPP, CH4 efflux via cattle (enteric and waste) was also estimated based on cattle
intensity at the study site. Cattle may also increase soil CH4 efflux via trampling.
Herbst et al. (2011) found that CH4 flux doubled from background ‘soil’ levels when
cows grazed in the vicinity of an eddy covariance tower, although part of this effect
may be due to CH4 released directly from the cows, it is also likely that part of this
effect is CH4 ebullition via trampling. This potential CH4 source would be greatest
when livestock were present on the salt marsh during waterlogged times of year. In
this study CO2 soil efflux was responsible for a much larger proportion of GWP than
CH4 efflux, only partially offset by the CO2 ‘locked up’ in plant biomass (Figure 5.7).
The conditions needed for high rates of soil respiration, a low water table and warm
soil, were the opposite of the cooler waterlogged soil conditions that stimulated
soil CH4 efflux. Where N2O soil efflux was measured it did not contribute markedly
to GWP. As GWPs for grazed and un-grazed saltmarsh were estimated from a
combination of chamber measurements and ANPP it is not possible to directly
compare the estimated GWP of ~2000 g CO2e m-2 yr-1, regardless of grazing
intensity, to the GWP of other habitats. However this flux was of comparative
magnitude to a North American peat land (Strack & Waddington, 2007).
5.6 Conclusion
In this study it was hypothesised that livestock grazing management would
influence soil physical characteristics (e.g. soil temperature and moisture content)
and plant community composition (e.g. presence of Juncus species) that would in
turn regulate the CH4, CO2 and N2O fluxes of saltmarsh habitats. Our results
showed that soil temperature, soil moisture content, water table depth and the
presence of J. gerardii were the most significant predictors of saltmarsh greenhouse
gas flux. However, the effect of grazing intensity on these variables was small
compared to the much greater impact of seasonal variability. Our first hypothesis
Grazing and saltmarsh greenhouse gas emissions Chapter 5
135
was refuted, as soil methane efflux was not consistently greater in the cattle grazed
than the un-grazed salt marsh. However, ‘hot spots’ of both underground soil
methane concentration and soil methane efflux were only present on the grazed
marsh, occurring under conditions of high soil moisture content, low soil
temperatures and the presence of J. gerardii. Our second hypothesis, that
combined soil respiration and plant carbon dioxide efflux would be greater in the
un-grazed marsh, was partially substantiated as CO2 efflux was greater from the un-
grazed marsh throughout the majority of the year and was positively correlated
with deeper water table and higher soil temperatures. Our third hypothesis, that
soil nitrous oxide efflux would be consistently greater from the grazed salt marsh
was refuted due to lack of evidence. Grazing was not a significant predictor of N2O
soil emissions. The GWP (100 years) of a temperate upper salt marsh, calculated
from mean yearly chamber fluxes of greenhouse gases (CH4 and CO2) and offset by
ANPP, was not significantly altered by livestock grazing management.
5.7 Acknowledgements
Funded by CEH project, NECO3610. Thanks to Rachel Kingham for fieldwork
assistance, Annette Burden, Rob Mills and Steve Hughes for technical training,
troubleshooting and tips.
5.8 References
Adam, P. (1990) Saltmarsh Ecology. Cambridge University Press, Cambridge.
Allard, V., Soussana, J., Falcimagne, R., Berbigier, P., Bonnefond, J.M., Ceschia, E.,
D’hour, P., Henault, C., Laville, P., Martin, C. & Pinares-Patino (2007) The role of
grazing management for the net biome productivity and greenhouse gas budget
(CO2, N2O and CH4) of semi-natural grassland. Agriculture, Ecosystems and
Environment 121, 47-58.
Alm, J., Shurpali, N. J., Tuittila, E. S., Laurila, T., Maljanen, M., Saarnio, S. &
Minkkinen, K. (2007) Methods for determining emission factors for the use of peat
and peatlands - flux measurements and modelling. Boreal Environment Research
12, 85-100.

Grazing and saltmarsh greenhouse gas emissions Chapter 5
136
Bakker, J.P., Leeuw, J., Dijkema, K.S., Leendertse, P.C., Prins, H.H.T. & Rozema, J.
(1993) Salt marshes along the coast of the Netherlands. Hydrobiologia 265, 73-95.
Ball, D.F. (1964) Loss-on-ignition as an estimate of organic matter and organic
carbon in non-calcareous soils. Journal of Soil Science 15, 84-92.
Bartlett, K.B., Harriss, R.C. & Sebacher, D.I. (1985) CH4 flux from coastal salt
marshes. Journal of Geophysical Research 90, 5710-5720.
Blackwell, M.S.A, Yamulki, S. & Bol, R. (2010) N2O production and denitrification
rates in estuarine intertidal saltmarsh and managed realignment zones. Estuarine,
Coastal and Shelf Science 87, 591-600.
Bos, D., Bakker, J.P., de Vries, Y., van Lieshout, S. (2002) Long-term vegetation
changes in experimentally grazed and ungrazed back-barrier marshes in the
Wadden Sea. Applied Vegetation Science 5, 45-54.
Brin, L.D., Valiela, I., Goehringer, D. & Howes, B. (2010) Nitrogen interception and
export by experimental salt marsh plots exposed to chronic nutrient addition.
Marine Ecology Progress Series 400, 3-17.
Calhoun, A. & King, G.M. (1997) regulation of root-associated methanotrophy by
oxygen availability in the rhizosphere of two aquatic macrophytes. Applied and
Environmental Microbiology 63, 3051-3058.
Campbell, B.D., Stafford-Smith, D.M. & McKeon, G.M. (1997) Elevated CO2 and
water supply interactions in grasslands: a pastures and rangelands management
perspective. Global Change Biology 3, 177-187.
Carroll, Z.L., Bird, S.B., Emmett, B.A., Reynolds, B. & Sinclair, F.L. (2004) Can tree
shelterbelts on agricultural land reduce flood risk? Soil Use and Management 20,
357-359.
Chatters, C. (2004) Grazing domestic animals on British saltmarshes. British Wildlife
15, 392-400.

Grazing and saltmarsh greenhouse gas emissions Chapter 5
137
Chmura, G.L., Kellman, L. & Glenn R Guntenspergen, G.R. (2011) The greenhouse
gas flux and potential global warming feedbacks of a northern macrotidal and
microtidal salt marsh. Environmental Research Letters. doi:10.1088/1748-
9326/6/4/044016.
Curry, J.P. (1994) Grassland Invertebrates: Ecology, influence on soil fertility and
effects on plant growth. Chapman & Hall, London, UK.
Dassonville, F. & Renault, P. (2002) Interactions between microbial processes and
geochemical transformations under anaerobic conditions: a review. Agronomie 22,
51–68.
Dausse, A., Garbutt, A., Norman, L., Papadimitriou, S., Jones, L.M., Robins, P.E. &
Thomas, D.N. (2012) Biogeochemical functioning of grazed estuarine tidal marshes
along a salinity gradient. Estuarine, Coastal and Shelf Science 100, 83-92.
Deborde, J., Anschutz, P., Guérin, F., Poirier, D., Marty, D., Boucher, G., Thouzeau,
G., Canton, M. & Abril, G. (2010) CH4 sources, sinks and fluxes in a temperate tidal
Lagoon: The Arcachon lagoon (SW France). Estuarine, Coastal and Shelf Science 89,
256-266.
Denman, K.L., Brasseur, G. Chidthaisong, A., Ciais, P. Cox, P.M., Dickinson, R.E.,
Hauglustaine, D., Heinze, C. Holland, E., Jacob, D., Lohmann, U., Ramachandran, S.,
Silva Dias P.L., Wofsy, S.C. & Zhang, X. (2007) Couplings Between Changes in the
Climate System and Biogeochemistry. In: Climate Change 2007: The Physical
Science Basis. Contribution of Working Group I to the Fourth Assessment Report of
the Intergovernmental Panel on Climate Change [Solomon, S., D. Qin, M. Manning,
Z. Chen, M. Marquis, K.B. Averyt, M.Tignor and H.L. Miller (eds.)]. Cambridge
University Press, Cambridge, United Kingdom.
Del Grosso, S.J. (2010) Grazing and N2O. Nature 464, 843-844.
Ding, W., Cai, Z. & Wang, D. (2004) Preliminary budget of CH4 emissions from
natural wetlands in China. Atmospheric Environment 38, 751–759.

Grazing and saltmarsh greenhouse gas emissions Chapter 5
138
Emmett, B.A., Reynolds, G., Chamberlain, P.M., Rowe, E., Spurgeon, D., Brittain,
S.A., Frogbrook, Z., Hughes, S., Lawlor, A.J., Poskitt, J., Potter, E., Robinson, D.A.,
Scott, A., Wood, C. & Woods, C. (2010) Countryside Survey: Soils Report from 2007.
Technical Report No. 9/07 NERC/Centre for Ecology & Hydrology, 192pp (CEH
Project Number: CO3259), http://www.countrysidesurvey.org.uk/outputs/soils-
report-from-2007.
Ford, H., Garbutt, A., Jones, L. & Jones, D.L. (2012) Grazing management in
saltmarsh ecosystems drives invertebrate diversity, abundance and functional
group structure. Insect Conservation and Diversity doi: 10.1111/j.1752-
4598.2012.00202.x
Herbst, M., Friborg, T., Ringgaard, R., & Soegaard H. (2011) Interpreting the
variations in atmospheric CH4 fluxes observed above a restored wetland.
Agricultural and Forest Meteorology 151, 841–853.
IPCC (1996) Revised 1996 IPCC Guidelines for National Greenhouse Gas Inventories
(IPCC Guidelines).
Kankaala P, Kaki T, Makela S, Ojala A, Pajunen H & Arvola L. (2005) CH4 efflux in
relation to plant biomass and sediment characteristics in stands of three common
emergent macrophytes in boreal mesoeutrophic lakes. Global Change Biology 11,
145–153.
Kemp, D.R. & Michalk, D.L. (2007) Towards sustainable grassland and livestock
management. Journal of Agricultural Science 145, 543-564.
Klaassen, W. & Spilmont, N. (2012) Inter-annual variability of CO2 exchanges
between an emersed tidal flat and the atmosphere. Estuarine, Coastal and Shelf
Science 100, 18-25.
Kroon, P.S. (2008) The importance of reducing the systematic error due to non-
linearity in N2O flux measurements by static chambers. Nutrient Cycling in
Agroecosystems 82, 175-186.
Grazing and saltmarsh greenhouse gas emissions Chapter 5
139
Laanbroek, H.J. (2010) CH4 emission from natural wetlands: interplay between
emergent macrophytes and soil microbial processes. Annals of Botany 105, 141–
153.
Lambert, R. (2000) Practical management of grazed saltmarshes. In: British
Saltmarshes (eds B.R. Sherwood, B.G. Gardiner & T. Harris) pp 333-340. Forrest
Text, London, UK.
Lai, D.Y.F. (2009) CH4 dynamics in northern peatlands: A review. Pedosphere 19,
409-421.
Le Mer, J. & Roger, P. (2001) Production, oxidation, emission and consumption of
CH4 by soils: A review. European Journal of Soil Science 37, 25-50.
Levy, P.E., Gray, A., Leeson, S.R., Gaiawyn, J., Kelly, M.P.C., Cooper, M.D.A. Cooper,
Dinsmore, K.J., Jones, S.K. & Sheppard, L.J. (2011) Quantification of uncertainty in
trace gas fluxes measured by the static chamber method. European Journal of Soil
Science 62, 811-821.
Limpens, J., Berendse, F., Blodau, C., Canadell, J.G., Freeman, C., Holden, J., Roulet,
N., Rydin, H. & Schaepman-Strub, G. (2008) Peatlands and the carbon cycle: from
local processes to global implications – a synthesis. Biogeosciences Discussions 5,
1379–1419.
Lin, X., Wang, S., Ma, X., Xu, G., Luo, C., Li, Y., Jiang, G. & Xie, Z. (2009) Fluxes of
CO2, CH4 and N2O in an alpine meadow affected by jak excreta on the Qinghai-
Tibetan plateau during summer grazing periods. Soil Biology and Biochemistry 41,
718-725.
Lindau, C.W. & DeLaune, R.D. (1991) Dinitrogen and N2O emission and entrapment
in Spartina alterniflora saltmarsh soils following addition of N-15 labelled
ammonium and nitrate. Estuarine and Coastal Shelf Science 32, 161-172.
Livesley, S.J. & Andrusiak, S.M. (2012) Temperate mangrove and salt marsh
sediments are a small CH4 and N2O source but important carbon store. Estuarine,
Coastal and Shelf Science 97, 19-27.

Grazing and saltmarsh greenhouse gas emissions Chapter 5
140
Livingston, G.P. & Hutchinson, G.L. (1995) Enclosure-based measurement of trace
gas exchange: applications and sources of error. In: Biogenic Trace Gases.
Measuring Emissions from Soil and Water (eds Matson, P.A., Harriss, R.C.), pp. 14-
51. Blackwell Science, Oxford, UK.
Luo, Y. & Zhou, X. (2006) Soil respiration and the environment. Academic Press,
London, Elsevier.
Ma, K., & Lu, Y.H. (2011) Regulation of microbial CH4 production and oxidation by
intermittent drainage in rice field soil. FEMS Microbiology Ecology 75, 446-456.
Magenheimer, J.F., Moore, T.R., Chmura, G.L. & Daoust, R.J. (1996) CH4 and CO2
flux from a macrotidal Salt Marsh, Bay of Fundy, New Brunswick. Estuaries 19, 139-
145.
Middelburg, J.J., Nieuwenhuize, J., Iversen, N., Hogh, N., DeWilde, H., Helder, W.,
Seifert, R. & Christof, O. (2002) CH4 distribution in European tidal estuaries.
Biogeochemistry 59, 95-119.
Milsom, T.P., Langton, S.D., Parkin, W.K., Peel, S., Bishop, J.D., Harts, J.D. & Moore,
N.P. (2000) Habitat models of bird species’ distribution: an aid to the management
of coastal grazing marshes. Journal of Applied Ecology 37, 706-727.
Mitsch, W.J. & Gosselink, J.G. (2000) Wetlands, Third Edition. John Wiley & Sons,
Inc.
Pacyna, J.M. & Manø, S. (2006) Preface: Trace gases in the European coastal zone.
Estuarine, Coastal and Shelf Science 70, 335-337.
Payne, R.W., Murray, D.A., Harding, S.A., Baird, D.B. & Soutar, D.M. (2011). GenStat
for Windows (13th Edition). VSN International, Hemel Hempstead.
Piker, L., Schmaljohann, R. & Imhoff, J.F. (1998) Dissimilatory sulfate reduction and
CH4 production in Gotland Deep sediments (Baltic Sea) during a transition period
from oxic to anoxic bottom water (1993- 1996). Aquatic Microbial Ecology 14, 183-
193.

Grazing and saltmarsh greenhouse gas emissions Chapter 5
141
Priemé, A. (1994) Production and emission of CH4 in a brackish and a freshwater
wetland. Soil Biology and Biochemistry 26, 7-18.
Poffenbarger, H.J., Needelman, B.A. & Megonigal, J.P. (2011) Salinity influence on
CH4 emissions from tidal marshes. Wetlands 31, 831-842.
R Development Core Team (2011) R: A language and environment for statistical
computing. R Foundation for Statistical Computing, Vienna, Austria. ISBN 3-900051-
07-0, URL http://www.R-project.org
Raich, J.W. (1992) The global carbon dioxide flux in soil respiration and its
relationship to vegetation and climate. Tellus 44B, 81-99.
Rodwell, J.S. (2000) British Plant Communities, Volume 5. Maritime communities
and vegetation of open habitats. Cambridge University Press, UK.
Roslev, P. & King, G.M. (1996) Regulation of CH4 oxidation in a freshwater wetland
by water table changes and anoxia. FEMS Microbiology Ecology 19, 105–115.
Rowe, E.C., Emmett B.A., Smart, S.M. & Frogbrook, Z.L. (2011) A new net
mineralisable nitrogen assay improves predictions of floristic composition. Journal
of Vegetation Science 22, 251-261.
Saggar, S., Hedley, C.B., Giltrap, D.L. & Lambie, S.M. (2007) Measured and modelled
estimates of N2O emission and CH4 consumption from a sheep-grazed pasture.
Agriculture, Ecosystems and Environment 122, 357-365.
Soussana, J., Jones, M. & Van Amstel, A. (2007) The greenhouse gas balance of
grasslands in Europe. Agriculture, Ecosystems and Environment 121, 1-4.
Soussana, J.F., Loiseau, P., Vuichard, N., Ceschia, E., Balesdent, J., Chevallier, T. &
Arrouays, D. (2004) Carbon cycling and sequestration opportunities in temperate
grasslands. Soil Use and Management 20, 219-230.
Strack, M. & Waddington, J.M. (2007) Response of peatland carbon dioxide and
methane fluxes to a water table drawdown experiment. Global Biogeochemical
Cycles 21, GB1007, doi:10.1029/2006GB002715.

Grazing and saltmarsh greenhouse gas emissions Chapter 5
142
Sullivan, B.W., Dore, S., Kolb, T.E., Hart, S.C. & Montes-Helu, M.C. (2010) Evaluation
of methods for estimating soil CO2 efflux across a gradient of forest disturbance.
Global Change Biology 16, 2449–2460.
Van der Nat, F. & Middelburg, J.J. (1998) Effects of two common macrophytes on
CH4 dynamics in freshwater sediments. Biogeochemistry 43, 79–104.
Van der Nat, F. & Middelburg, J.J. (2000) CH4 emission from tidal freshwater
marshes. Biogeochemistry 49, 103–121.
Van Groenigen, J.W., Velthof, G.L., Van der Bolt, F.J.E., Vos, A. & Kuikman, P.J.
(2005) Seasonal variation in N2O emissions from urine patches: Effects of urine
concentration, soil compaction and dung. Plant and Soil 273, 15–27.
Vernberg, F.J. (1993) Salt-marsh processes – a review. Environmental Toxicology
and Chemistry 12, 2167-2195.
Waddington, J.M., Strack, M. & Greenwood, M.J. (2010) Toward restoring the net
carbon sink function of degraded peatlands: Short-term response in CO2 exchange
to ecosystem-scale restoration. Journal of Geophysical research 115, G01008,
doi:10.1029/2009JG001090.
Wang, D., Chen, Z., Wang, J., Xu, S., Yang, H., Chen, H., Yang, L. & Hu, L. (2007)
Summer-time denitrification and N2O exchange in the intertidal zone of the Yangtze
Estuary. Estuarine, Coastal and Shelf Science 73, 43-53.

Grazing and soil microbes Chapter 6
143
Chapter 6: Grazing effects on microbial community composition,
growth and nutrient cycling in salt marsh and sand dune grasslands
Hilary Ford, Johannes Rousk, Angus Garbutt, Laurence Jones and Davey L. Jones
A modified version of this paper has been accepted by Biology and Fertility of Soils
http://dx.doi.org/10.1007/s00374-012-0721-2
6.1 Abstract
The effect of grazing by large herbivores on the microbial community, and the
ecosystem functions they provide is relatively unknown in grassland systems.
Therefore, the impact of grazing upon the size, composition and activity of the soil
microbial community was measured in field experiments established in two coastal
grasslands: ‘Grazed’ (cattle grazed) and historically ‘un-grazed’ salt marsh; ‘fully
grazed’ (ponies 0.2 ha-1, cattle 0.05 ha-1 and rabbits 45 ha-1), ‘rabbit grazed’ and
‘un-grazed’ (for 8 years) sand dune grassland. Total fatty acid phospholipids (PLFAs),
bacterial and fungal PLFA concentrations, proxies for microbial biomass, were all
significantly greater in grazed than un-grazed salt marsh (p < 0.05) and showed a
trend towards greatest biomass in the rabbit grazed sand dune soil. Fungal-to-
bacterial ratio did not differ with grazing for either habitat. Redundancy analysis
(RDA) showed that soil moisture, bulk density and root biomass significantly
explained the distribution of PLFA markers (p < 0.05) with a clear distinction
between the saltmarsh and sand dune grassland habitats along axis 1 (89 %), driven
by the soil moisture gradient. Grazing explained the separation of PLFA markers
along axis 2 (7 %). Gram-positive bacteria and actinomycetes were more
proportionally abundant in un-grazed, while Gram-negative bacteria dominated

Grazing and soil microbes Chapter 6
144
more in grazed grasslands. Bacterial growth rate (Leucine incorporation) was
greater in un-grazed salt marsh, possibly reflecting the more rapid nitrification rate,
but did not differ with grazing in sand dune grassland. Grazing alters carbon (C) and
nitrogen (N) soil inputs via changes in dung, plant litter, root exudates and root
turnover rate. This in turn affects microbial biomass, composition and activity.
Keywords: Livestock grazing, decomposer ecology, bacterial growth rate, PLFAs,
nutrient cycling
6.2 Introduction
Many types of semi-natural grasslands, including coastal grasslands, have been
traditionally managed by low intensity cattle or sheep grazing. However, in the light
of removal of European Union (EU) subsidies for marginal grazing land (Strijker,
2005; Taylor, 2006) it is not known how grazing abandonment will affect these
habitats. The effects of large herbivore removal are relatively well studied for plant,
invertebrate and bird communities (Morris, 2000; Vickery et al., 2001; Pykälä,
2003). However, effects upon the soil microbial community, and therefore soil
ecosystem functions such as plant nutrient availability and organic matter
decomposition, are less well known (Smith et al., 2003). Characteristic features of
grazed and un-grazed grassland habitats are likely to have direct impacts upon soil
microbial biomass, growth rates and community composition.
Cessation of livestock grazing leads to the gradual development of a plant
community dominated by highly competitive tall grasses or shrubs with an
increased plant litter layer (Bakker et al., 1993; Janišová et al., 2011) and has
variable effects on root biomass, turnover and exudation (Piñeiro et al., 2010). Soil
microbial activity and abundance are directly related to the quantity and quality of
food sources such as plant litter, senescent roots and root exudates (Beare et al.,
1991; Mawdsley & Bardgett, 1997; Grayston et al., 2001). Bacteria may benefit
from higher quality litter with a lower C / N ratio and therefore a higher N nutrient
Grazing and soil microbes Chapter 6
145
input. Grazing intensity also affects abiotic factors. Short grazed vegetation leads to
greater and more variable soil temperatures than un-grazed grassland (Curry, 1994).
Even a small increase in soil temperature may increase microbial activity and
growth (Anderson, 1992) but is unlikely to affect community composition
(Strickland & Rousk, 2010). Cattle compact the soil surface via treading leading to
waterlogged ground (Lambert, 2000) and return nutrients to the soil via dung input
(Bakker et al., 1993). Soil compaction will change soil structure and aeration with
effects upon microbial community composition (Clegg, 2006). Grazing animals also
return nutrients to the soil via dung input (Bakker et al., 1993) that greatly
influences microbial activity in the soil. For instance, cattle faeces are a source of
soil C and can increase microbial biomass and respiration (Lovell & Jarvis, 1996;
Hatch et al., 2000) and livestock urine is a source of utilizable N linked to increases
in respiration, nitrous oxide (N2O) emissions and microbial biomass (Ritz et al.,
2004).
Salt marshes differ from other terrestrial systems due to regular cycles of
inundation by tides that transiently saturate the soil with water, and thereby limit
oxygen availability. In these systems, the overriding influence of soil moisture
(Waksman & Gerrettsen, 1931) is particularly emphasized. While microbial activity
increases with higher water availability in dry conditions (Iovieno & Baath, 2008;
Bapiri et al., 2010), the relationship changes at high water availabilities, and
waterlogged soils exhibit reduced soil respiration (Luo & Zhou, 2006).
While it has been shown that factors including tillage (Six et al., 2006; Van
Groeningen et al., 2010), N fertilization (de Vries et al., 2006) and grazing intensity
(Bardgett et al., 2001; Klumpp et al., 2009; Lopez-Sangil et al., 2011) can affect the
size and composition of the soil microbial community, the precise changes within
the microbial community between different systems have not been addressed, and
to date insights have been mostly limited to individual case-studies (Strickland &
Rousk, 2010). For the microbial community, land-use factors are arbitrary, while

Grazing and soil microbes Chapter 6
146
the direct influence of the micro-scale environment and growth conditions will be
all important. That is, we will only be able to generalize effects of land-use to the
extent that they expose microbial communities to selective pressures such as pH
changes (Rousk et al., 2010) or organic matter quality (Rousk & Bååth, 2007).
In this study I investigated the impact of grazing intensity on the active soil
decomposer community of temperate upper saltmarsh and fixed sand dune
grasslands. These coastal grasslands are priority habitats under the Agri-
Environment Scheme (Natural England, 2009). By including two independent
grazing systems, we aimed to assess and relate the influence of grazing on the soil
microbial community to the system specific differences inherent between
ecosystems. Microbial biomass concentrations and community composition were
measured using fatty acid phospholipids (PLFAs; Sundh et al., 1997) and bacterial
growth rate by protein synthesis (Leucine incorporation; Kirchman et al., 1985). For
the salt marsh two grazing treatments were used, ‘grazed’ (i.e. moderately cattle
grazed) and ‘un-grazed’ (historically un-grazed). For the sand dune grassland three
grazing treatments were used, ‘fully grazed’ (i.e. extensively cattle, pony and rabbit
grazed), ‘rabbit grazed’ and ‘un-grazed’ (i.e. abandoned). We hypothesized the
main source of variation in the microbial composition would occur between the
two systems based on key environmental drivers such as soil moisture and nutrient
availability, but that we would also find a secondary effect of grazing intensity.
6.3 Methods
6.3.1 Salt marsh
The study area, Crossens Marsh (53⁰ 41’ 15” N, 2⁰ 57’ 4” W), is a salt marsh located
on the southern edge of the Ribble estuary in North-West England and is part of
the Sefton Coast Special Protection Area managed by Natural England, the
statutory conservation body. The marsh was historically un-grazed but was split
into two management types over 40 years ago, un-grazed and cattle grazed by an

Grazing and soil microbes Chapter 6
147
arbitrarily placed boundary fence. The grazed marsh is characterised by
predominantly Festuca rubra saltmarsh NVC community (SM16d) and the un-
grazed marsh by Elytrigia repens salt marsh (SM28; Rodwell, 2000). The grazed part
of the marsh covers 517 ha and is uniformly grazed by around 100 bullocks from
late May to early October, approximately 0.2 cattle (Bos Taurus) ha-1, and provides
a consistent short sward height (< 8 cm) for overwintering pink-footed geese (Anser
brachyrhynchus) to feed. Small herbivores such as field voles are also present,
particularly on the un-grazed marsh. All experimental units were selected within
the high marsh zone where numerous creeks are present but tidal inundations are
relatively rare, limited to around eight events a year on high equinox tides. A paired
experimental design was used with six experimental units of approximately 10 m x
10 m set up on each side of a 600 m long section of the fence line, 100-150 m apart,
in a ‘mirror image’ formation, giving six grazed (G1-G6) and six un-grazed (U1-U6)
units (Figure 6.1). Each experimental unit was located between 20 m and 50 m
from the fence line to ensure an adequate buffer zone and checked for standard
elevation within ±10 cm. All measurements were carried out within these
experimental units.
G1
Grazed
Un-grazed
Fence line (600 m)20 m ‘buffer’ zone
G2
G3
G4
G5
G6
U6
U5
U4U2
U3
U1
30 m
Figure 6.1 Experimental design at Crossens Marsh salt marsh, grazed experimental units (G1-G6)
and un-grazed units (U1-U6). All units are 10 m x 10 m square at 20 - 30 m, 30 - 40 m or 40 - 50 m
from the fence line. Not to scale.

Grazing and soil microbes Chapter 6
148
6.3.2 Sand dune grassland
Newborough Warren is a calcareous coastal sand dune grassland, located in NW
Wales (53° 8’ 59” N, 4° 21’ 1” W), noted for its high biodiversity and designated as a
National Nature Reserve, Site of Special Scientific Interest and Special Area of
Conservation under the EC Habitats and Species Directive 1992 (Plassmann et al.,
2010). The 389 ha site is managed by Countryside Council for Wales (CCW) and
grazed by Welsh mountain ponies (Equus ferus caballus; 0.2 ha-1), rare breed cattle,
Belted Galloways and Dexters (Bos Taurus; 0.05 ha-1), and rabbits (Oryctolagus
cuniculus; 45 ha-1) (Plassmann et al., 2009), designed to maximise plant diversity.
Grazed vegetation is characteristic of NVC SD12 and SD8 (Rodwell, 2000). In 2003,
three replicate experimental units, each containing three 10 m x 10 m experimental,
one fully grazed unit (unfenced), one rabbit grazed unit (fenced with 10 cm x 10 cm
mesh to exclude large grazers) and one un-grazed unit (fenced with 10 cm x 10 cm
mesh and an additional 2.7 cm x 3.7 cm mesh buried 20 cm underground to
prevent rabbit access) were set up (Figure 6.2; Plassmann et al., 2009). Small
mammals and invertebrate herbivores were assumed to be present within all
experimental units. Fully grazed units are denoted as PR1 - PR3 (PR stands for pony
& rabbit grazed); rabbit grazed units as R1 – R3 and un-grazed units as U1 - U3.
Block 1
Block 3
Block 2
PR3
R3
U3
PR2
U2 R2U1
R1PR1
10 m
10 m
All experimental units within a block are 10 – 20 m apart
~100 m
~100 m
U1
R1
PR1
Un-grazed units
Rabbit grazed units
Pony & rabbit (fully) grazed units
Figure 6.2 Experimental design at Newborough Warren sand dune grassland, three replicated
blocks of three grazing treatments, fully grazed, rabbit grazed and un-grazed. Not to scale.

Grazing and soil microbes Chapter 6
149
6.3.3 Soil and vegetation analyses
In November 2010, four soil cores (5 cm depth, 5 cm diameter) per experimental
unit were taken, vegetation, roots and stones were removed and the remaining soil
was sieved to ≤ 2 mm and stored for 1 week at 5 °C before further analyses. For soil
respiration, 10 g sub-samples, four per experimental unit, were weighed into 50 ml
polypropylene centrifugation vials and soil respiration rate at 22 °C measured
continuously on a multichannel IR respirometer (PP-systems Ltd, Hitchin, UK). The
reported soil respiration rate was the 4 hour average measurement taken after
reaching a stable rate. Gravimetric soil moisture was estimated by determining the
weight loss of samples dried initially at 105⁰C for 72 hours. Subsequently, organic
matter (OM) content was estimated by loss-on-ignition from soil sub samples (375
⁰C for 16 hours; Ball, 1964). Soil pH (5 g soil: 12.5ml water dilution factor) was
determined using a Corning pH meter 220. Samples to determine bulk density were
collected during September 2009 using three intact soil cores of 3.8 cm diameter
and 15 cm depth from each experimental unit. Cores were dried at 105 ⁰C for 72
hours and the dry mass divided by the volume of the core to calculate bulk density.
Soil cores for total soil C and N were air dried, thoroughly homogenised and dried
at 105 ⁰C for 3 hours prior to analysis. Samples were analysed on an Elementar
Vario-EL elemental analyser (Elementar Analysensysteme GmbH, Hanau, Germany),
using oxidative combustion to detect C and N. The C / N ratio was also calculated
using a weight ratio.
The potential for nutrient cycling by microbes was measured by N mineralisation.
Three N mineralisation cores, 3.8 cm diameter and 15 cm depth, were taken from
each experimental unit, during September 2009. Soil cores were taken using plastic
corers, capped at both ends to minimise soil disruption, and stored intact at 4 °C.
Accumulated inorganic N was flushed from the cores by spraying with a solution of
similar ionic concentration to UK rain over 7 days until 150 ml of leachate had been

Grazing and soil microbes Chapter 6
150
collected. Cores were incubated at 10 °C for 28 days, homogenised and a sub-
sample extracted using 1 M KCl for the analysis of ammonium and nitrate content
(Rowe et al., 2011). Mineralisable N was expressed as mg N g-1 OM (organic matter)
for plant and microbial available N. Above-ground live vegetation (shoot) and plant
litter were collected from five (two in sand dunes) 25 cm x 50 cm zones, cut to
ground-level, in July 2009. One root core of 5 cm diameter and 10 cm depth was
also taken per quadrat and washed to remove all soil. Above-ground vegetation,
litter and roots were all dried at 80 °C for 24 hours and weighed to give indicators
of above-ground shoot biomass, litter biomass and below-ground root biomass
respectively. Root turnover was measured during September 2010 via four nylon 1
mm root turnover mesh strips (Normesh, UK), 2.5 cm wide x 15 cm long, placed in
vertical cuts made in the soil with 2.5 cm overlap at the bottom and 2.5 cm
emerging from the soil, 50 cm apart, across a 2 m transect in each unit. After 28
days the mesh strips were removed along with a slightly wider and deeper intact
soil core. Cores were pushed out and divided in two along the mesh line, the
number of fine roots penetrating each mesh depth zone (0 – 2.5 cm; 2.5 – 5 cm; 5 –
7.5 cm; 7.5 – 10 cm) were counted by eye as a proxy for fine root turnover (Lukac &
Godbold, 2010).
6.3.4 PLFAs
The PLFA composition from a 1 g fresh soil sub-sample was determined according
to Frostegård et al. (1993) with modifications (Nilsson et al., 2007). An internal
standard (methyl nonadecanoate fatty acid 19:0) was added before the
methylation step. To obtain indications of bacterial and fungal biomass specific
PLFA markers were summed (Frostegård and Bååth 1996; Table 6.3). PLFAs were
also grouped according to Gram-negative, Gram-positive bacteria and
actinomycetes.

Grazing and soil microbes Chapter 6
151
6.3.5 Bacterial growth rate and turnover times
Bacterial growth was estimated by measuring the incorporation of leucine (Leu)
into bacteria (Kirchman et al., 1985) extracted from 1 g soil sub-samples (stored at
5 °C) using the homogenization / centrifugation technique (Bååth, 1994), with
modifications (Bååth et al., 2001; Rousk & Bååth, 2011). We added 2 µl [3H]Leu (37
MBq ml-1, 5.74 TBq mmol-1, Perkin Elmer) that was combined with non-labelled Leu,
resulting in a final concentration of 275 nM Leu in the bacterial suspensions. The
samples were then incubated for 2 h at 22 °C in the dark. Bacterial growth was
estimated from the amount of Leu incorporated into extracted bacteria per hour
and gram of soil. A rough index for bacterial turnover time was calculated by
dividing the bacterial biomass (nmol PLFAs g-1) by bacterial growth rate (nmol Leu
incorporation g-1 h-1).
6.3.6 Statistical analysis
Differences between pairs of grazing treatments (Salt marsh: G & U; Sand dune: PR
& R, R & U, or PR & U) for all variables were analysed using linear mixed effects
models (lme) in R v.2.12.1 (2010), e.g. lme (pH ~ grazing, random =
~1|block/grazing). This approach was used to enable the raw data to be analysed
accounting for replication at the level of the experimental unit or block (Salt marsh
n = 6; Sand dune n = 3). Where necessary, variables were log-, square root- or
arcsine square root transformed. Results of best model fit are presented here
based on lowest Akaike information criterion (AIC) number and quantile probability
plot (qqnorm) with most normal distribution. For overall grazing effect, results are
presented as an Analysis of Variance (ANOVA) of the lme model. For the sand dune
data, significant differences between treatment pairs (e.g. PR & R) were reported
directly from the lme analysis.
The relationship between salt marsh and sand dune grassland PLFA composition
(mol-% of the 30 most abundant PLFAs; standardized to unit variance) and

Grazing and soil microbes Chapter 6
152
environmental variables (soil parameters from Table 6.1 & 6.2) from grazed and un-
grazed experimental units was analyzed with a redundancy analysis (RDA). RDA
scaling was focused on inter-‘species’ (PLFAs) correlations and centered by species.
Grazing treatment of each unit was included in the final RDA tri-plot but was not
used to influence the analysis. The significance of environmental variables was
tested using automatic forward selection (Monte Carlo test, 500 permutations). All
multivariate analysis was carried out in Canoco v.4.5 (Ter Braak and Šmilauer,
2003). The RDA tri-plot shows a visual interpretation of the relationship between
environmental variables and the distribution of PLFA markers for both salt marsh
and sand dune grassland.
6.4 Results
6.4.1 Soil and vegetation characteristics
Organic matter content, bulk density, C/N ratio, net ammonification rate, root
turnover and root biomass were all significantly greater on the grazed salt marsh
grassland (Table 6.1). Net nitrification rate, soil pH, litter and shoot biomass were
all significantly greater on the un-grazed salt marsh. Salt marsh soil basal
respiration rate did not differ with grazing treatment. For the sand dune grassland,
the majority of soil and vegetation variables did not differ significantly with grazing
intensity (Table 6.2). Soil basal respiration rate and root biomass were greater in
the fully and rabbit grazed than the un-grazed sand dune grassland. Litter biomass
was greater in the rabbit and un-grazed than the fully grazed sand dune grassland.
Net nitrification rate was greatest in the un-grazed sand dune soil.

Grazing and soil microbes Chapter 6
153
Table 6.1 Soil and vegetation characteristics of the salt marsh in grazed and un-grazed
experimental units (n = 6).
Grazed Un-grazed Model SE Soil
Organic matter content (%) 15.60 12.05 (1.16) * Basal respiration rate (μg C g-1 org. mt h-1) 23.92 23.35 (2.75) ns pH 7.15 8.07 (0.12) *** Gravimetric soil moisture content (%) 126 111 (10.6) ns Bulk density (g cm-3) 0.81 0.72 (0.03) * C/N ratio 15:1 13:1 (0.55) * N mineralisation rate
NO3- (μg N g-1 org. mt day-1) 0.54 3.75 (1.29) ***
NH4+(μg N g-1 org. mt day-1) 1.19 0.34 (0.29) **
Vegetation Root turnover (no. fine roots month-1) 53.67 36.28 (3.98) ** Root biomass (kg dry wt m-2) 3.37 0.96 (0.29) *** Litter biomass (kg dry wt m-2) 0.01 0.34 (0.07) * Shoot biomass (kg dry wt m-2) 0.32 0.69 (0.07) *
Treatment means and model standard error from linear mixed effects model (ANOVA) output org. mt = organic matter Significant differences between grazing treatments *(p < 0.05), **(p < 0.01) ***(p < 0.001) Non significant results ns
Table 6.2 Soil and vegetation characteristics of the coastal grassland for three grazing treatments
(PR = fully grazed, R = rabbit grazed, U = un-grazed; n = 3).
PR R U Model SE Soil
Organic matter content (%) 9.65 10.83 8.27 (0.96) ns Basal respiration rate (μg C g-1 org. mt h-1) 17.92 a 16.13 a 9.08 b (2.31) * pH 6.21 6.16 6.01 (0.21) ns Gravimetric soil moisture content (%) 35.73 41.25 31.79 (3.73) ns Bulk density (g cm-3) 1.01 1.02 0.93 (0.04) ns C/N ratio 12:1 12:1 11:1 (0.31) ns N mineralisation rate
NO3- (μg N g-1 org. mt day-1) 0.85 a 1.89 3.59 b (0.91) *
NH4+(μg N g-1 org. mt day-1) 2.28 2.85 1.44 (1.00) ns
Vegetation Root turnover (no. fine roots month-1) 43.36 a 54.83 b 49.17 a (3.84) * Root biomass (kg dry wt m-2) 1.24 a 1.22 a 0.71 b (0.21) * Litter biomass (kg dry wt m-2) 0.12 a 0.22 b 0.28 b (0.04) * Shoot biomass (kg dry wt m-2) 0.83 0.80 0.59 (0.20) ns
Treatment means and model standard error from linear mixed effects model (ANOVA) output org. mt = organic matter Significant differences between grazing treatments (a is different from b) *(p < 0.05), **(p < 0.01) Non significant results ns

Grazing and soil microbes Chapter 6
154
6.4.2 PLFAs Total PLFA, bacterial and fungal PLFA concentrations, proxies for microbial biomass,
were all significantly greater in grazed than un-grazed salt marsh but did not differ
with grazing treatment in sand dune soils (Figure 6.3). The relative abundances of
both bacterial and fungal PLFA markers did not differ significantly with grazing
treatment for either salt marsh or sand dune grassland; consequently the fungal-to-
bacterial ratio did not differ between treatments (Tables 6.4 & 6.5). Gram-negative
bacterial PLFAs were proportionally more abundant in the grazed, actinomycetes in
the un-grazed salt-marsh soil. Gram-positive bacterial PLFAs were proportionally
more abundant in the un-grazed than the fully grazed sand dune grassland.
Table 6.3 PLFA markers used for taxonomic groups.
Taxonomic group PLFA group Specific PLFA markers Reference PLFA biomarkers
Bacteria Multiple groups i15:0, a15:0, 15:0, i16:0, 16:1ω9, 16:1ω7c, 10Me16:0, cy17:0, a17:0, 18:1ω7, cy19:0
Frostegård & Bååth, 1996
Gram-positive bacteria
Branched PLFAs i15:0, a15:0, i16:0, i17:0, a17:0 O’Leary & Wilkinson, 1988
Gram-negative bacteria
Cyclopropyl and mono PLFAs
cy17:0, 16:1w7c, 16:1w7t and 18:1w7
Wilkinson, 1988
Actinomycetes 10Me-PLFAs 10Me16:0a, 10Me16:0b, 10Me17:0, 10Me 18:0
Kroppenstedt, 1985
Fungi Polyunsaturated PLFAs
18:2ω6,9 Frostegård & Bååth, 1996
Fungal / bacterial ratio
Multiple groups Fungi / Bacteria Frostegård & Bååth, 1996
Table 6.4 Relative proportions of PLFA markers for grazed and un-grazed saltmarsh soil (n = 6).
Grazed Un-grazed Model SE Bacteria (%) 60.2 59.7 (0.53) ns Fungi (%) 1.9 1.8 (0.23) ns Gram-positive bacteria (%) 15.4 15.9 (0.47) ns Gram-negative bacteria (%) 33.0 30.5 (0.85) * Actinomycetes (%) 6.4 8.2 (0.37) ** Fungal/bacterial ratio 0.03 0.03 (0.01) ns Treatment means and model standard error from linear mixed effects model (ANOVA) output Significant differences between grazing treatments *(p < 0.05), **(p < 0.01), non significant results ns

Grazing and soil microbes Chapter 6
155
Table 6.5 Relative proportions of PLFA markers for sand dune grassland soil (PR = fully grazed, R =
rabbit grazed, U = un-grazed; n = 3).
PR R U Model SE Bacteria (%) 52.2 51.2 53.2 (1.19) ns Fungi (%) 5.5 6.0 4.7 (0.01) ns Gram-positive bacteria (%) 16.4 a 15.3 a 19.2 b (0.84) * Gram-negative bacteria (%) 25.6 25.9 23.0 (1.07) ns Actinomycetes (%) 8.9 8.8 10.1 (0.48) ns Fungal/bacterial ratio 0.11 0.12 0.09 (0.02) ns Treatment means and model standard error from linear mixed effects model (ANOVA) output Significant differences between grazing treatments *(p < 0.05), non significant results ns
Sand dune grassland
Tot PLFAs Bac PLFAs Fun PLFA
PLF
As
(nm
ol g
-1)
0
100
200
300 PRRU
Salt marsh
PLF
As
(nm
ol g
-1)
0
100
200
300GU
*
*
*
ns
ns
ns
Figure 6.3 Total, bacterial and fungal PLFA concentrations for salt marsh (G = grazed; U = un-
grazed) and sand dune grassland (PR = fully grazed; R = rabbit grazed; U = un-grazed). Treatment
means and model standard error from linear mixed effects model (ANOVA) output. Significant
differences between grazing treatments indicated by *(p < 0.05), non significant results by ns.

Grazing and soil microbes Chapter 6
156
6.4.3 PLFAs and environmental variables
The RDA tri-plot (Figure 6.4) shows the relationship between environmental
variables and the distribution of PLFA markers for both salt marsh and sand dune
grassland. Axis 1, and axes 1 and 2 combined, explained 89 % and 96 % of the
variation in relative abundance of PLFA markers respectively. The Monte Carlo test
for the first and all axes was significant for three environmental variables;
gravimetric soil moisture (F-ratio = 48.86, p < 0.01), bulk density (F-ratio = 4.95, p <
0.01) and root biomass (F-ratio = 4.37, p < 0.01). All other environmental variables
either correlated with these three or did not describe a significant proportion of
PLFA marker occurrence. The RDA plot shows a clear distinction between the salt
marsh and sand dune grassland habitats along axis 1, related to the soil moisture
gradient. Grazing intensity, although not included within the analysis as an
environmental variable, is related to separation of PLFA markers along axis 2. Un-
grazed salt marsh and sand dune experimental units were all positively associated
and grazed units negatively associated with axis 2. Using the PLFA markers
composition to indicate how grazing intensity affected the microbial community
composition we found that markers associated with Gram-positive bacteria (i.e.
i17:0, i15:0) and actinomycetes (i.e. 10Me16:0a, 10Me 18:0) were relatively more
abundant in soils with lower grazing pressures, while markers associated with
Gram-negative bacteria i.e. (16:1w7t, 16:1w7c, 18:1w7) were relatively more
abundant in systems with higher grazing pressures.
6.4.4 Bacterial growth rate and turnover times
Bacterial growth rate was significantly faster in un-grazed than grazed salt marsh,
possibly reflecting the higher total soil N (Figure 6.5; Table 6.1). Bacterial growth
rate was not significantly different between the sand dune grassland grazing
treatments. The bacterial turnover time was also significantly quicker in un-grazed
compared to the grazed salt marsh (ANOVA; F = 16.99, d.f. = 5, p < 0.01). Bacterial

Grazing and soil microbes Chapter 6
157
turnover time did not differ significantly with grazing treatment for the sand dune
grassland. Possible explanations of bacterial biomass, growth rate and turnover
times in relation to nutrient cycling for the salt marsh and sand dune grasslands are
proposed two conceptual diagrams (Figures 6.6 & 6.7).
-1.5 1.5
-1.0
1.0
i14:0
14:0
i15:0
a15:0
15:0
i16:0
16:1w9
16:1w7c
16:1w7t
16:1w5
16:0
10Me16:0a
10Me16:0b
i17:0
a17:0
17:1w8cy17:0
17:0
br18:0
10Me17:0
x3
18:2w6.9
18:1w9
18:1w7
18:1
18:0
19:1a
10Me18:0
cy19:020:0
pH
Soil moistureOrganic matter
C/N
Bulk densityRoot biomass
Root turnover G1G2
G3
G4G5
G6
U1U2
U3U4U5
U6
PR1PR2
PR3
R1
R2R3
N_U1
N_U2
N_U3
Gram-positive bacterial PLFA markersGram-negative bacterial PLFA markersActinomycete PLFA markersFungal PLFA marker
Figure 6.4 RDA triplot showing relationship between environmental variables and distribution of
PLFA markers for both salt marsh and sand dune grassland experimental units (Salt marsh: G1-G6
= grazed, U1-U6 = un-grazed; Sand dune grassland: PR1-PR2 = fully, R1-R3 = rabbit grazed, N_U1-
N_U3 = un-grazed; black circles = grazed or fully grazed, grey circles = rabbit grazed, white circles =
un-grazed). Significant environmental variables (Canoco v.4.5; Monte Carlo test, 500 permutations)
have larger, bold font.

Grazing and soil microbes Chapter 6
158
Salt marshLe
u in
c. in
to e
xtra
cted
bac
teria
(nm
ol g
-1 h
-1)
0.0
0.2
0.4
0.6G U
Sand dunegrassland
Leu
inc.
into
ext
ract
ed b
acte
ria(n
mol
g-1
h-1
)
0.0
0.2
0.4
0.6PR RU
*
ns
Figure 6.5 Bacterial growth rate for salt marsh (G = grazed; U = un-grazed) and sand dune
grassland (PR = fully grazed; R = rabbit grazed; U = un-grazed). Treatment means, error bars as
standard deviation of the mean. Significant differences between grazing treatments indicated by
*(p < 0.05), non significant results by ns.

Grazing and soil microbes Chapter 6
159
Grazed Un-grazed
Higher nutrient cyclingLower nutrient cycling
C, N and bacterial input via dung and urine
Aerobic microbes
Anaerobic microbes
High C input via root exudates & decomposition
C and N input via litter
Aerobic microbes
Low C input via root exudates & decomposition
High C/N ratio (High C %) Low C/N ratio (High N %)
Large bacterial biomass with low growth rate and slow turnover
Smaller bacterial biomass with high growth rate and rapid turnover
Figure 6.6 Conceptual diagram explaining differences in microbial biomass, activity and nutrient
cycling between cattle grazed and un-grazed salt marsh.
Pony & rabbit grazed Rabbit grazed
C and N input via dung and urine
Aerobic microbes
Large C input via roots
C and N input via litter
Un-grazed
C and N input via dung, urine and plant litter
Aerobic microbes Aerobic microbes
Slow nutrient cycling Rapid nutrient cycling (nitrogen mineralisation & root turnover)
Rapid nutrient cycling (nitrogen mineralisation)
Intermediate bacterial biomass & intermediate growth rate (ns)
Large C input via roots
Small C input via roots
Large bacterial biomass & rapid growth rate (ns)
Small bacterial biomass & slower growth rates (ns)
Figure 6.7 Conceptual diagram explaining differences in microbial biomass, activity and nutrient
cycling for sand dune grassland grazing treatments (ns = non significant differences).

Grazing and soil microbes Chapter 6
160
6.5 Discussion
6.5.1 Salt marsh microbial biomass, activity and nutrient cycling
In this study, saltmarsh microbial biomass was positively influenced by grazing as in
other grassland soils (Bardgett et al., 1997; 2001) and was of a comparative
magnitude to other salt marshes (Córdova-Kreylos et al., 2006). The fungal-to-
bacterial balance was not altered by grazing intensity. Bacterial and fungal PLFA
concentrations were both greater for grazed than un-grazed saltmarsh grassland,
probably as a result of greater soil organic matter and C availability from dung input
(Bardgett et al., 1998) and increased mycorrhizal fungi due to large root biomass
and rapid root turnover rates. Paradoxically, despite the input of nutrient rich dung
and urine into the grazed salt marsh soil the un-grazed salt marsh exhibited more
rapid nutrient cycling in the form of greater N mineralization, possibly due to the
greater plant litter input or better soil aeration. In addition, the un-grazed salt
marsh soil exhibited a lower C / N ratio than the grazed marsh, indicative of high
available soil N and potentially faster microbial cycling. This may explain the fact
that both bacterial growth rate and estimated bacterial turnover times were faster
in un-grazed than grazed salt marsh. It is often assumed that there is a direct
positive relationship between bacterial growth rate and respiration rate. However,
in this study the saltmarsh soil basal respiration rate did not differ with grazing
treatment showing that this assumed relationship can be uncoupled (Iovieno &
Bååth, 2008). Aerated lab samples may have artificially increased soil respiration
recorded from the grazed salt marsh compared to true field conditions where the
grazed marsh is often waterlogged and anaerobic (Chapter 5). An explanation of
grazing effects on saltmarsh bacterial biomass, activity and nutrient cycling is
illustrated in Figure 6.6.

Grazing and soil microbes Chapter 6
161
6.5.2 Sand dune microbial biomass, activity and nutrient cycling
Total microbial biomass for our sand dune grassland soil was comparable to similar
habitats (Chang et al., 2011). Bacterial and fungal PLFA concentrations did not
differ significantly between fully, rabbit or un-grazed sand dune grassland. The
fungal-to-bacterial ratio was also un-altered by grazing intensity. Bacterial growth
rate and turnover time did not differ significantly with grazing treatment in this
habitat, however a possible trend towards a more rapid growth rate in the rabbit
grazed grassland was identified. The rabbit grazed or un-grazed (except by small
mammals) soils exhibited more rapid nutrient cycling in the form of greater N
mineralization, possibly due to the greater input of plant litter and more even
distribution of small droppings. Soil organic matter content and root turnover rates
were also greatest in the rabbit grazed habitat. Soil respiration rate was
significantly greater in the fully and rabbit grazed sand dune grassland than the un-
grazed grassland tentatively mirroring bacterial growth rate patterns. An
explanation of grazing effects on sand dune grassland bacterial biomass, activity
and nutrient cycling is illustrated in Figure 6.7.
6.5.3 Microbial composition patterns
Most of the variation, 89 % of the microbial PLFA composition, was related to site
differences, clearly separating the salt marsh and sand dune communities on a soil
moisture gradient. A smaller proportion of the total variation, 7 %, was consistently
related to grazing intensity for both habitats and was partly explained by measured
environmental variables including bulk density and root biomass. Using the PLFA
markers composition to indicate how grazing intensity affected the microbial
community composition we found that markers associated with Gram-positive
bacteria and actinomycetes were relatively more abundant in soils with lower
grazing pressures, while markers associated with Gram-negative bacteria were
relatively more abundant in systems with higher grazing pressures.

Grazing and soil microbes Chapter 6
162
Gram-positive bacteria may be aerobic or anaerobic (Paul & Clark, 1996),
consequently it is difficult to assign this group a definite soil function. There is some
evidence that they are fast growing (Bardgett et al., 1999) and are more reliant
upon a C supply dominated by the soil organic matter from plant litter rather than
the labile plant root exudates (Treonis et al., 2004; Olsson & Johnson, 2005; Bird et
al., 2011). Actinomycetes are chemorganotrophic, filamentous bacteria (Paul &
Clark, 1996). ~90% of soil actinomycetes are Streptomyce, capable of rapidly
degrading less readily decomposable soil organic matter components (Tate, 2000),
more common in un-grazed plant litter (Valery et al., 2004; Vargas Gil et al., 2009).
Actinomycetes are adapted to water stress by resisting plasmolysis (Killham, 1994),
allowing them to thrive in the un-grazed dry sand dune grassland. Actinomycete
biomarkers are also common in unsaturated salt marsh sediment (Córdova-Kreylos
et al., 2006).
Gram-negative bacteria, from our results proportionally more abundant in grazed
grasslands, form close associations with the plant rhizosphere (Söderberg et al.,
2004; Wardle et al., 2004), correlated with the presence of labile C resources, a
result common to many habitats (Steer & Harris, 2000; Bird et al., 2011).
Considering other PLFA markers, a denitrification marker, cy19:0 (Jackson et al.,
2003), was very closely correlated with high soil moisture content and therefore
occurred most frequently on the grazed salt marsh. An anaerobic bacterial marker,
16:0 (Findlay et al., 1990), was also characteristic of grazed plots. A greater relative
abundance of monounsaturated fatty acids and the aerobic bacterial marker
18:1w9 (Findlay et al., 1990) on the un-grazed compared to the grazed marsh was
indicative of more aerobic conditions.
6.6 Conclusions
This study explored the impact of grazing management on two coastal grassland
soil microbial communities. Bacterial biomass was greatest in cattle grazed salt

Grazing and soil microbes Chapter 6
163
marsh and rabbit grazed sand dune grassland, potentially due to the presence of a
large root biomass, sometimes associated with rapid root turnover and a ready
source of C from both root degradation and dung. Bacterial activity (growth rates
and turnover times) was most rapid in un-grazed salt marsh and rabbit grazed sand
dune grassland. Un-grazed salt marsh grassland had a much greater nitrification
rate and potential decomposition rate than the grazed marsh due to potentially
more aerobic soil conditions and the input of plant litter. Rabbit grazed sand dune
grassland also had rapid nutrient cycling and C and N inputs from dung, urine and
plant litter combined. These features explain the greater bacterial activity in un-
grazed or rabbit grazed soils. Higher grazing intensity across both grassland
habitats stimulated PLFA markers associated with Gram-negative bacteria,
associated with the use of labile C resources from root exudates, while lower
grazing intensity favoured a dominance of Gram-positive bacteria and
actinomycetes, more dependent on the decomposition of plant litter. This study is
an early step in assessing the consequences of land-use change on nutrient cycling
driven by the soil microbial community.
6.7 Acknowledgements
This study was funded as part of a NERC - Centre for Ecology and Hydrology project
- NECO3610. Johannes Rousk was supported by grants from the Swedish Research
Council (Vetenskapsrådet; Project No. 623-2009-7343). Thanks to CCW and Natural
England for access to field sites. We thank Inma Robinson for assistance with the
respiration analyses and Adam Vanbergen for nematode analyses.
6.8 References
Anderson, J.M. (1992) Responses of soil to climate change. Advances in Ecological
Research 22, 163-210.

Grazing and soil microbes Chapter 6
164
Bååth, E. (1994) Measurement of protein synthesis by soil bacterial assemblages
with the leucine incorporation technique. Biology and Fertility of Soils 17, 147-153.
Bååth, E., Pettersson, M. & Söderberg, K.H. (2001) Adaptation of a rapid and
economical microcentrifugation method to measure thymidine and leucine
incorporation by soil bacteria. Soil Biology & Biochemistry 33, 1571-1574.
Bakker, J.P., Leeuw, J., Dijkema, K.S., Leendertse, P.C., Prins, H.H.T. & Rozema, J.
(1993) Salt marshes along the coast of the Netherlands. Hydrobiologia 265, 73-95.
Bapiri, A., Bååth, E. & Rousk, J., (2010) Drying-rewetting cycles affect fungal and
bacterial growth differently in an arable soil. Microbial Ecology 60, 419-428.
Bardgett, R.D., Jones, A.C., Jones, D.L., Kemmitt, S.J., Cook, R. & Hobbs, P.J. (2001)
Soil microbial community patterns related to the history and intensity of grazing in
sub-montane ecosystems. Soil Biology and Biochemistry 33, 1653-1664.
Bardgett, R.D., Kandeler, E., Tscherko, D., Hobbs, P.J., Bezemer, T.M., Jones, T.H. &
Thompson, L.J. (1999) Below-ground microbial community development in a high
temperature world. Oikos 85, 193-203.
Bardgett, R.D., Keiller, S., Cook, R. & Gilburn, A.S. (1998) Dynamic interactions
between soil animals and microorganisms in upland grassland soils amended with
sheep dung: a microcosm experiment. Soil Biology and Biochemistry 30, 531-539.
Bardgett, R.D., Leemans, D.K., Cook, R. & Hobbs, P.J. (1997) Seasonality of the soil
biota of grazed and ungrazed hill grasslands. Soil Biology and Biochemistry 29,
1285-1294.
Beare, M.H., Neely, C.L., Coleman, D.C. & Hargrove, W.L. (1991) Characterization of
a substrate-induced respiration method for measuring fungal, bacterial and total
microbial biomass on plant residues. Agriculture, Ecosystems and Environment 34,
65-73.

Grazing and soil microbes Chapter 6
165
Ball, D.F. (1964) Loss-on-ignition as an estimate of organic matter and organic C in
non-calcareous soils. Journal of Soil Science 15, 84-92.
Bird, J.A., Herman, D.J. & Firestone, M.K. (2011) Rhizosphere priming of soil organic
matter by bacterial groups in a grassland soil. Soil Biology and Biochemistry 43,
718-725.
Chang, E.-H., Chen, C.-T., Chen, T.-H. & Chiu, C.-Y. (2011) Soil microbial communities
and activities in sand dunes of subtropical coastal forests. Applied Soil Ecology 49,
256– 262.
Clegg, C.D. (2006) Impact of cattle grazing and inorganic fertiliser additions to
managed grasslands on the microbial community composition of soils. Applied Soil
Ecology 31, 73–82.
Córdova-Kreylos, A.L., Yiping, C.Y. et al. (2006) Diversity, composition, and
geographical distribution of microbial communities in California salt marsh
sediments. Applied and Environmental Microbiology 72, 3357-3366.
Curry, J.P. (1994) Grassland invertebrates: Ecology, influence on soil fertility and
effects on plant growth. Chapman & Hall, London.
De Vries, F.T., Hoffland, E., van Eekeren, N., Brussaard, L. & Bloem, J. (2006)
Fungal/bacterial ratios in grasslands with contrasting N management. Soil Biology
and Biochemistry 38, 2092-2103.
Findlay, R.H., Trexler, M.B., Guckert, J.B. & White, D.C. (1990) Laboratory study of
disturbance in marine sediments: response of a microbial community. Marine
Ecology Progress Series 62, 121-133.
Frostegård, Å., Tunlid, A. & Bååth, E. (1993) Phospholipid fatty acid composition,
biomass, and activity of microbial communities from 2 soil types experimentally
Grazing and soil microbes Chapter 6
166
exposed to different heavy metals. Applied and Environmental Microbiology 59,
3605-3617.
Frostegård, Å. & Bååth, E. (1996) The use of phospholipid fatty acid analysis to
estimate bacterial and fungal biomass in soil. Biology and Fertility of Soils 22, 59-65.
Grayston, S.J., Griffith, G.S., Mawdsley, J.L., Campbell, C.D., Bardgett, R.D. (2001)
Accounting for variability in soil microbial communities of temperate upland
grassland ecosystems. Soil Biology and Biochemistry 33, 533-551.
Hatch, D.J., Lovell, R.D., Antil, R.S., Jarvis, S.C. & Owen, P.M. (2000) N mineralization
and microbial activity in permanent pastures amended with N fertilizer or dung.
Biology and Fertility of Soils 30, 288–293.
Iovieno, P. & Bååth, E. (2008) Effect of drying and rewetting on bacterial growth
rates in soil. FEMS Microbiology Ecology 65, 400–407.
Jackson, L.E., Calderon, F.J., Steenwerth, K.L., Scow, K.M. & Rolston, D.E. (2003)
Responses of soil microbial processes and community structure to tillage events
and implications for soil quality. Geoderma 114, 305– 317.
Janišová, M., Bartha, S., Kiehl, K. & Dengler, J. (2011) Advances in the conservation
of dry grasslands: Introduction to contributions from the seventh European Dry
Grassland Meeting. Plant Biosystems 145, 507–513.
Killham, K. (1994) Soil ecology. Cambridge Univ. Press, Melbourne.
Kirchman, D., Knees, E. & Hodson, R. (1985) Leucine incorporation and its potential
as a measure of protein synthesis by bacteria in natural aquatic systems. Applied
and Environmental Microbiology 49, 599-607.
Klumpp, K., Fontaine, S., Attard, E., Le Roux, X., Gleixner, G. & Soussana, J.F. (2009)
Grazing triggers soil C loss by altering plant roots and their control on soil microbial
community. Journal of Ecology 97, 876-885.

Grazing and soil microbes Chapter 6
167
Kroppenstedt, R. (1985) Fatty acid and menaquinone analysis of actinomycetes and
related organisms. In: Chemical methods in bacterial systematic (eds M.
Goodfellow & D. Minnikin (eds) pp 173–199. Academic, London.
Lambert, R. (2000) Practical management of grazed saltmarshes. In: British
Saltmarshes (eds B.R. Sherwood, B.G. Gardiner & T. Harris) pp 333-340. Forrest
Text, UK.
Lopez-Sangil, L., Rousk, J., Wallander, H. & Casals, P. (2011) Microbial growth rate
measurements reveal that land-use abandonment promotes a fungal dominance of
SOM decomposition in grazed Mediterranean ecosystems. Biological Fertility of
Soils 47, 129-138.
Luo, Y. & Zhou, X. (2006) Soil respiration and the environment. Academic Press,
London, Elsevier.
Lovell, R.D. & Jarvis, S.C. (1996) Effect of cattle dung on soil microbial biomass C
and N in a permanent pasture soil. Soil Biology and Biochemistry 28, 291–299.
Mawdsley, J.L. & Bardgett, R.D. (1997) Continuous defoliation of perennial ryegrass
(Lolium perenne) and white clover (Trifolium repens) and associated changes in the
composition and activity of the microbial population of an upland grassland soil.
Biology and Fertility of Soils 24, 52-58.
Morris, M.G. (2000) The effects of structure and its dynamics on the ecology and
conservation of arthropods in British grasslands. Biological Conservation 95, 129-
142.
Natural England (2009) Agri-environment schemes in England 2009, A review of
results and effectiveness. (www.naturalengland.org.uk - last accessed 24.02.12)

Grazing and soil microbes Chapter 6
168
Nilsson, L.O., Bååth, E., Falkengren-Grerup, U. & Wallander, H. (2007) Growth of
ectomycorrhizal mycelia and composition of soil microbial communities in oak
forest soils along a N deposition gradient. Oecologia 153, 375-384.
O’leary, W. & Wilkinson, S. (1988) Gram-Positive bacteria. In: Microbial Lipids (eds
C. Ratledge & S.C. Wilkinson) pp 117–202. Academic Press, London.
Olsson, P.A. & Johnson, N.A. (2005) Tracking C from the atmosphere to the
rhizosphere. Ecology Letters 8, 1264-1270.
Paul, E.A. & Clark, F.E. (1996) Soil Microbiology and Biochemistry. Second Edition.
Academic Press, UK.
Piñeiro, G., Paruelo, J.M., Oesterheld, M. & Jobbagy, E.G. (2010) Pathways of
grazing effects on soil organic C and N. Rangeland Ecology and Management 63,
109-119.
Plassmann, K., Edwards-Jones, G. & Jones, M.L.M. (2009) The effects of low levels
of N deposition and grazing on dune grassland. Science of the Total Environment
407, 1391-1404.
Plassmann, K., Edwards-Jones, G. & Jones, M.L.M. (2010) Effects of long-term
grazing management on sand dune vegetation of high conservation interest.
Applied Vegetation Science 13, 100-112.
Pykälä, J. (2003) Effects of restoration with cattle grazing on plant species
composition and richness of semi-natural grasslands. Biodiversity and Conservation
12, 2211-2226.
R version 2.12.1 (2010) The R Foundation for Statistical Computing.
Ritz, K., McNicol, J.W. et al. (2004) Spatial structure in soil chemical and
microbiological properties in an upland grassland. FEMS Microbiology Ecology 49,
191–205.

Grazing and soil microbes Chapter 6
169
Rodwell, J.S. (2000) British Plant Communities, Volume 5. Maritime communities
and vegetation of open habitats. Cambridge University Press, UK.
Rousk, J. & Bååth, E. (2007) Fungal biomass production and turnover in soil
estimated using the acetate-in-ergosterol technique. Soil Biology & Biochemistry
39, 2173–2177.
Rousk, J. & Bååth, E. (2011) Growth of saprotrophic fungi and bacteria in soil. FEMS
Microbiology Ecology 78, 17-30.
Rousk, J., Bååth, E., Brookes, P.C., Lauber, C.L., Lozupone, C., Caporaso, J.G., Knight,
R. & Fierer, N. (2010) Soil bacterial and fungal communities across a pH gradient in
an arable soil. ISME Journal 4, 1340-1351.
Six, J., Frey, S.D., Thiet, R.K. & Batten, K.M. (2006) Bacterial and fungal
contributions to C sequestration in agroecosystems. Soil Science Society of America
Journal 70, 555-569.
Smith, R.S., Shiel, R.S., Bardgett, R.D., Millward, D., Corkhill, P., Rolph, G., Hobbs,
P.J. & Peacock, S. (2003) Soil microbial community, fertility, vegetation and
diversity as targets in the restoration management of a meadow grassland. Journal
of Applied Ecology 40, 51–64.
Söderberg, K.H., Probanza, A., Jumpponen, A. & Bååth, E. (2004) The microbial
community in the rhizosphere determinerd by community level physiological
profiles (CLPP) and direct soil – and cfu—PLFA techniques. Applied Soil Ecology 25,
135-145.
Steer, J., & Harris, J.A. (2000) Shifts in the microbial community in rhizosphere and
non-rhizosphere soils during the growth of Agrostis stolonifera. Soil Biology and
Biochemistry 32, 869-878.

Grazing and soil microbes Chapter 6
170
Strickland, M.S. & Rousk, J .(2010) Considering fungal:bacterial dominance in soils -
Methods, controls, and ecosystem implications. Soil Biology & Biochemistry 42,
1385-1395.
Strijker, D. (2005) Marginal lands in Europe – causes of decline. Basic and Applied
Ecology 6, 99-106.
Sundh, I., Nilsson, M., Borga, P. (1997) Variation in microbial community structure
in two boreal peatlands as determined by analysis of phospholipid fatty acid
profiles. Applied and Environmental Microbiology 63, 1476–1482.
Tate, R.L. (2000) Soil microbiology, Second Edition. John Wiley & Sons, USA.
Taylor, P. (2006) Beyond conservation: shifting the paradigm of upland land use.
ESRC Trans-disciplinary Seminar Series: Sustaining Upland Landscapes, Exeter
University, UK.
Ter Braak, C.J.F. & Šmilauer, P. (2003) CANOCO for Windows Version 4.5. Biometris
– Plant Research International, Wageningen.
Treonis, A.M., Ostle, N.J., Stott, A.W., Primrose, R., Grayston, S.J. & Ineson, P. (2004)
Identification of groups of metabolically active rhizosphere microorganisms by
stable isotope probing. Soil Biology and Biochemistry 36, 533-537.
Valery, L., Bouchard, V. & Lefeuvre, J-C. (2004) Impact of the invasive native species
Elymus athericus on C pools in a salt marsh. Wetlands 24, 268-276.
Van Groenigen, K.J., Bloem, J., Bååth, E., Boeckx, P., Rousk, J., Bodé, S., Forristal, P.D.
& Jones, M.B. (2010) Abundance, production and stabilization of microbial biomass
under conventional and reduced tillage. Soil Biology and Biochemistry 42, 48-55.
Vargas Gil, S., Becker, A., Oddino, C., Zuza, M., Marinelli, A. & March, G. (2009) Field
trial assessment of biological, chemical, and physical responses of soil to tillage
intensity, fertilization, and grazing. Environmental Management 44, 378–386.

Grazing and soil microbes Chapter 6
171
Vickery, J.A., Tallowin, J.R., Feber, R.E., Asteraki, E.J., Atkinson, P.W., Fuller, R.J. &
Brown, V.K. (2001) The management of lowland neutral grasslands in Britain:
effects of agricultural practices on birds and their food resources. Journal of
Applied Ecology 38, 647-664.
Waksman, S.A. & Gerretsen, F.C. (1931) Influences of temperature and moisture
upon the nature and extent of decomposition of plant residues by micro-
organisms. Ecology 12, 33-60.
Wardle, D.A., Bardgett, R.D., Klironomos, J.N., Setälä, H., vad der Putten, W.H. &
Wall, D.H. (2004) Ecological linkages between aboveground and belowground
biota. Science 304, 1629-1633.
Wilkinson, S.C. (1988) Gram-negative bacteria. In: Microbial Lipids (eds C. Ratledge
& S.C. Wilkinson) pp 299–488. Academic Press, London.

Thesis discussion Chapter 7
172
Chapter 7: Thesis discussion
Hilary Ford
7.1 Overview
In this thesis I have studied biodiversity, ecosystem function and ecosystem service
provision in saltmarsh and sand dune grasslands. Firstly in the form of a literature
review (Chapter 2) and secondly via four experimental research papers (Chapters
3–6) assessing the effect of land – use change via grazing introduction or grazing
abandonment. It is clear from Chapter 3 that sand dune grassland grazing
management involves trade-offs between the potential for ecosystem service
provision provided by grasslands with different grazing intensities. Extensively
cattle & pony grazed grassland was important for food provision, cultural
environmental appreciation and potential pollination services, un-grazed or
‘abandoned’ grassland for potential pest regulation and nutrient cycling, rabbit
grazed for a balance between the two. Chapter 6 provided a more in depth look at
the soil microbial community composition in relation to the supporting service of
nutrient cycling.
So far in this thesis the evidence for ecosystem service provision by cattle grazed
and un-grazed saltmarsh grasslands has not been discussed. Evidence from the
saltmarsh invertebrate paper (chapter 4) could be used to generate hypotheses
concerning provision of food for wetland birds. For example, as large bodied
invertebrates are more abundant on the un-grazed marsh and large detritivores an
important food source for birds such as the endangered redshank (Tringa tetanus),

Thesis discussion Chapter 7
173
this habitat may offer greater availability of food for wetland birds than grazed salt
marshes. Provision of habitat for wetland birds is of conservation interest and links
to the cultural services of bird watching and wildfowling. In addition, the greater
abundance of predatory spiders on the grazed marsh and in contrast, the greater
abundance of predatory Coleoptera on the un-grazed marsh may have implications
for the regulating service of pest control, especially where salt marshes border
agricultural crop land, although at present this is untested and therefore
speculative. The saltmarsh greenhouse gas balance chapter links directly to the
regulating service of ‘equable climate’. Chapter 6 also provides information on the
relationship between the soil microbial community and nutrient cycling for salt
marsh grasslands.
In order to assess how sand dune and saltmarsh grassland grazing management
compare in the potential provision of ecosystem services evidence from chapters 3
(sand dune), 4 & 5 (salt marsh) and 6 (both habitats) have been combined,
alongside supplementary data from the salt marsh analysed and presented in Table
A7.1 and Figure A7.1. Two conceptual diagrams were created to compare the effect
of livestock grazing on two contrasting coastal ecosystems, the ‘high productivity –
low biodiversity’ salt marsh grassland and the ‘low productivity – high biodiversity’
sand dune grassland (Figure 7.1a & 7.1b). Salt marsh and sand dune grasslands
provide many ecosystem services; environmental appreciation (cultural service),
primary productivity and nutrient cycling (supporting services), pest control,
pollination, equable climate, flood prevention or water storage (regulating
services), and food production (provisioning service). Many of these overlap with
services provided by semi-natural grasslands. Despite the differences in
biodiversity, productivity and soil moisture content between the two experimental
coastal grasslands, salt marshes and sand dunes, it is remarkable how similarly
they react to the presence of large herbivore grazers in terms of potential
ecosystem service provision (Figure 7.1). Grazing by large herbivores has two main
ecosystem effects; a decrease in vegetation height and an increase in soil
compaction. These in turn influence other ecosystem characteristics and functions
that affect final ecosystem service provision.

Thesis discussion Chapter 7
174
SUPPORTING SERVICEPRIMARY PRODUCTIVITY (-)
REGULATING SERVICE EQUABLE CLIMATE (=)
Organic matter ns Soil C stock *
Detritivore feeding rate**Plant available nitrate ***Bacterial activity *Bacterial biomass *
Root biomass & C stock***
Litter biomass & C stock*
ANPP *Shoot biomass & C stock *
Plant sp. richnessForb % cover *Grass % cover *Flowering ?
CATTLE GRAZING1 VEGETATION EFFECTS
Temperature *Soil moisture*Bulk density *Water infiltration ***Redox potential **Salinity ns
CATTLE GRAZING2 SOIL EFFECTS
SUPPORTING SERVICENUTRIENT CYCLING (-)
PROVISIONING SERVICE FOOD PROVISIONING (+)
CULTURAL SERVICE ENVIRONMENTAL APPRECIATION (+)
REGULATING SERVICEFLOOD PREVENTION (-)
REGULATING SERVICEPEST CONTROL & POLLINATION (+/-)
Predatory invertebratesColeoptera *Spiders *
Pollinators ns
CATTLE GRAZING3 OTHER EFFECTS
a) Salt marsh
CO2*CH4 nsN2O ns
Veg. height ***
Cattle for meat#Methane from cattle #
Figure 7.1 Effects of saltmarsh cattle grazing (a) and sand dune coastal grassland cattle and pony
grazing (b) on vegetation, soil and other measured ecosystem characteristics as proxies for
ecosystem service delivery. Measured ecosystem characteristics are shown in italics with a
significant increase or decrease indicated by arrows (*p < 0.05, **p < 0.1, ***p < 0.001, ns p > 0.05)
with grazer removal indicated by arrows, # for expected results from the literature. Solid lines
show direct effects between variables, dashed lines show indirect effects to ecosystem services
with positive, equal or negative effects indicated within brackets.
SUPPORTING SERVICEPRIMARY PRODUCTIVITY (=)
REGULATING SERVICEEQUABLE CLIMATE (=/-)
Organic matter nsSoil C stock ns
Detritivore feeding rate *Plant available nitrate *
Root biomass*Litter biomass & C stock *
ANPP nsShoot biomass & C stock ns
Plant species richness *Forb % cover *Grass % cover *Forb % flowering *
Vegetation height***
Bulk density nsDaytime temperature *Soil moisture nsWater infiltration rate*
CATTLE & PONY GRAZING2 SOIL EFFECTS
SUPPORTING SERVICENUTRIENT CYCLING (-)
PROVISIONING SERVICEFOOD PROVISIONING (+)
CULTURAL SERVICE ENVIRONMENTAL APPRECIATION (+)
REGULATING SERVICEPEST CONTROL & POLLINATION (+/-)
Predatory invertebrates #Pollinators #
CATTLE & PONY GRAZING3 OTHER EFFECTS
CATTLE & PONY GRAZING1 VEGETATION EFFECTS
Cattle for meat #
Methane from cattle #
b) Sand dune

Thesis discussion Chapter 7
175
Reduced vegetation height favours an increase in species richness as dominant tall
grasses are reduced and percentage cover of forbs and flowering of forbs increases.
These factors infer an enhanced aesthetic environmental appreciation or ‘cultural
service’. Short grazed vegetation supports more small spiders but fewer large
predatory Coleoptera than longer un-grazed vegetation, with variable effects on
potential pest control, a ‘regulating service’ and possible implications for food
provision for birds. For primary productivity and nutrient cycling, ‘supporting
services’, the trend is towards reduced service provision for grazed grasslands due
to decreased above ground net primary productivity (ANPP), detritivore feeding
rate and plant and microbial available nitrogen. Large herbivore soil compaction
leads to increased soil moisture content, reduced water infiltration rate and
reduced aerobicity of the soil leading to a negative effect on flood prevention, a
‘regulating service’. For equable climate, another ‘regulating service’, grazing has
mixed effects. Root and soil carbon storage increases with grazing, a positive effect.
But methane efflux from soil, via grazed salt marsh ‘hotspots’, and via cattle is also
increased, a negative effect. Finally direct food production, a ‘provisioning service’,
is only provided by livestock grazed coastal grasslands.
7.2 Conclusion
Extensive grazing management is often recommended for conservation of coastal
grasslands as it maximises plant diversity and provides a suitable breeding habitat
for particular bird species. In the light of abandonment of marginal grazing land
throughout Europe, including salt marsh and sand dune grasslands, we suggest that
in addition to biodiversity measures of ‘success’ in conservation, ecosystem service
trade-offs need to be taken into account when choosing an appropriate grassland
management scheme. Extensively or moderately cattle grazed coastal grasslands
should be conserved for food provision, cultural environmental appreciation and
pollination services, un-grazed grassland for flood prevention, pest regulation,
primary productivity and nutrient cycling. The impact of grazing on equable climate,
across different coastal grasslands, is not clear. This thesis conclusion highlights the
fact that comprehensive measurement of management effects on both biodiversity
Thesis discussion Chapter 7
176
and ecosystem service provision needs to take place to inform a ‘best compromise’
for managers of all coastal and terrestrial habitats.
7.3 Future research questions
What are the trade-offs in management for biodiversity and ecosystem
service provision in other habitats?
What are the biodiversity and ecosystem service benefits of Elytrigia repens
un-grazed salt marshes? Are they always ‘bad’ for conservation as often
assumed by conservation management bodies such as Natural England and
RSPB?
Large bodied invertebrates appear to be more abundant in un-grazed
Elytrigia repens saltmarsh than conservation grazed marsh. What
implications does this have for food provision for birds such as the
redshank?
Do other grazed saltmarshes experience methane hotspots linked to
waterlogged soil and presence of Juncus species? Do saltmarsh creeks emit
methane? What are the implications for greenhouse gas balance
management?

Thesis discussion Chapter 7
177
7.4 Appendix
Table A7.1 Soil properties and vegetation characteristics measured from the grazed and un-grazed
salt marsh (Crossens Marsh; Figure 4.2). Treatment means, lme model SE and ANOVA results (n =
6) are presented as in chapter 4. Nectar feeders were analysed with paired t tests in Genstat.
Grazed Un-grazed Model SE Vegetation
ANPP (kg dry wt m-2 yr-1) 0.58 1.20 0.20 * Graminoid species richness 3.40 1.97 0.24 ** Forb species richness 3.17 1.73 0.59 * Forb percentage 11.63 3.45 3.06 *
C stock Shoot C stock (t C ha-1) 1.36 2.90 0.28 ** Litter C stock (t C ha-1) 0.04 1.43 0.28 ** Root C stock (t C ha-1) 14.82 4.24 1.27 *** Total C stock (above & soil C stock) (t C ha-1)
63.98 45.14 4.52 **
Nectar feeders (pollinators) Abundance 72.17 84.67 11.03 ns Species richness 9.00 8.17 0.95 ns
Significant differences between grazing treatments indicated by *(p < 0.05), **(p < 0.01) and ***(p < 0.001). Non significant results recorded as ns (p > 0.05).
7.4.1 Methods for Table A7.1
7.4.1.1 Vegetation
Above ground net primary productivity (ANPP), peak biomass from three grazer
excluded areas per experimental unit, was recorded as a direct measure of primary
productivity. During early March 2009, vegetation was cut to ground level in three
50 cm x 50 cm areas per experimental unit. Each cut area was protected from pony,
cattle and rabbit grazers by an 8 cm mesh gabion (50 x 50 x 50 cm) and vegetation
allowed to re-grow until peak biomass at the end of August when areas were re-cut
within a central 25 cm x 25 cm area. Vegetation was dried at 80 °C for 72 hours
then weighed and converted to kg dry wt m-2 yr-1 to provide a measure of ANPP.
Plant percentage cover and species richness were recorded by eye during July in
five 1 m x 1 m quadrats from each experimental unit.
7.4.1.2 C stock
Carbon stock measurements (t C ha-1) were derived from soil or biomass
measurements (Chapter 4; section 4.3.3) for four pools: soil, roots, plant litter and

Thesis discussion Chapter 7
178
shoots, using the following conversions; Soil carbon is 0.55 of soil organic matter
(Emmett et al., 2010); Root carbon is 0.44 of root biomass (dry wt) and plant litter
and shoot carbon are 0.42 of biomass (dry wt) in grassland habitats (Jones et al.,
2002; Jones et al., 2005).
7.4.1.3 Nectar feeders (pollinators)
Pollination was indirectly quantified by pan trap sampling of nectar feeders. Six
baitless pan traps of three colours (2 blue, 2 white, 2 yellow) to attract nectar
feeders were set for 72 hours during June and again in July 2009. In each
experimental unit two triangles, 5 m apart, consisting of one pan trap of each
colour, 1.5 m apart, was set up. Traps of the same colour were pooled to give three
samples per experimental unit. Each trap consisted of 203 mm diameter bulb bowls
sprayed yellow, blue or white, half filled with water containing a drop of washing up
liquid to break the surface tension. Wire baskets of 5 cm mesh size were placed
over all traps to prevent damage by grazing animals. The contents of the pitfalls and
pan traps were preserved in 70 % Industrial strength methylated spirits (IMS) or
ethanol and nectar feeders as potential pollinators were identified.
7.4.1.4 References
Emmett, B.A., Reynolds, G., Chamberlain, P.M., Rowe, E., Spurgeon, D., Brittain,
S.A., Frogbrook, Z., Hughes, S., Lawlor, A.J., Poskitt, J., Potter, E., Robinson, D.A.,
Scott, A., Wood, C., Woods, C., 2010. Countryside Survey: Soils Report from 2007,
Centre for Ecology & Hydrology, NERC, UK.
Jones, M.L.M., Hayes, F., Brittain, S.A., Haria, S., Williams, P.D., Ashenden, T.W.,
Norris, D.A., Reynolds, B., 2002. Changing nutrient budget of sand dunes:
Consequences for the nature conservation interest and dune management 2. Field
survey. Centre for Ecology & Hydrology, UK.
Jones, M.L.M., Pilkington, M.G., Healey, M., Norris, D.A., Brittain, S.A., Tang, S.Y.,
Jones, M., Reynolds, B., 2005. Determining a nitrogen budget for Merthyr Mawr
sand dune system. Centre for Ecology and Hydrology, UK.

Thesis discussion Chapter 7
179
Figure A7.1 Bulk soil electrical conductivity (ECa), a combined measure of soil saturation, salinity
and texture for 0-30 cm soil depth, mapped by geophysical electromagnetic induction (EMI)
imaging in October 2010 by David Robinson (CEH). Methods as in Moffett et al. (2010). This map is
a close up of the Crossens marsh field site (inset shows wider area) with the fence line marked by
a black dashed line and grazed experimental units (G) by G1-G6 and un-grazed (U) by U1-U6.
Moffett, K.B., Robinson, D.A. & Gorelick, S.M. (2010) Relationship of Salt Marsh Vegetation Zonation
to Spatial Patterns in Soil Moisture, Salinity and Topography. Ecosystems 13, 1287-1302.