bangladesh maternal mortality and health care survey 2016 bmms 2016... · quality control pathway...
TRANSCRIPT

Bangladesh Maternal Mortality and Health Care Survey 2016
Preliminary Report


BANGLADESH MATERNAL MORTALITY AND HEALTH CARE SURVEY
(BMMS) 2016
Preliminary Report
National Institute of Population Research and Training
International Centre for Diarrhoeal Disease Research, Bangladesh
MEASURE Evaluation
Funded by:
Government of the People’s Republic of Bangladesh
U.S. Agency for International Development, Bangladesh
Department for International Development
This publication was produced with the support of the United States Agency for International Development (USAID) under the terms of MEASURE Evaluation cooperative agreement AID-OAA-L-14-00004. MEASURE Evaluation is implemented by the Carolina Population Center, University of North Carolina at Chapel Hill in partnership with ICF International; John Snow, Inc.; Management Sciences for Health; Palladium; and Tulane University. TR-17-218 ISBN 978-1-9433-6484-8

Cover Illustration: Denise Todloski, MEASURE Evaluation
Bangladesh Maternal Mortality and Health Care Survey (BMMS) 2016 was implemented under the
authority of the National Institute of Population Research and Training (NIPORT), Ministry of Health
and Family Welfare. The survey was implemented by Associates for Community and Population Research
and Mitra and Associates. The funding for the BMMS 2016 was provided by the Government of the
People’s Republic of Bangladesh, the United States Agency for International Development
(USAID)/Bangladesh and the Department for International Development (DFID). MEASURE
Evaluation and the International Centre for Diarrhoeal Disease Research, Bangladesh (icddr,b) provided
technical assistance. The opinions expressed in this report are those of the authors and do not necessarily
reflect the views of USAID.
Information about the BMMS 2016 may be obtained from NIPORT, 13/1 Sheikh Shaheb Bazar,
Azimpur, Dhaka 1205, Bangladesh (Telephone: 02-5861-1206; Web: www.niport.gov.bd).
Suggested citation:
National Institute of Population Research and Training (NIPORT), International Centre for Diarrhoeal
Disease Research, Bangladesh (icddr,b), and MEASURE Evaluation. (2017). Bangladesh Maternal Mortality
and Health Care Survey 2016: Preliminary Report. Dhaka, Bangladesh, and Chapel Hill, NC, USA: NIPORT,
icddr,b, and MEASURE Evaluation.

Bangladesh Maternal Mortality and Health Care Survey 2016 | 3
Foreword
Bangladesh Maternal Mortality and Health Care Survey (BMMS) 2016 is the third national survey designed to estimate the national maternal mortality ratio (MMR) in Bangladesh. The survey also aims to identify causes of maternal and non-maternal deaths to adult women and to provide health care utilization information including women’s experience with antenatal, delivery, postnatal, emergency obstetric care and family planning.
The MMR in Bangladesh declined between 2001 and 2010 but has now stalled. The MMR estimate from the BMMS 2016 is 196 maternal deaths per 100,000 live births, almost identical to the estimate of BMMS 2010. Hemorrhage and eclampsia account for 55 percent of maternal deaths. The risk of dying from these causes remained unchanged between BMMS 2010 and BMMS 2016.
Considerable progress has been made in increasing the utilization of key maternal health services in Bangladesh. The percentage of births in health facilities increased from 23 percent in BMMS 2010 to 47 percent in BMMS 2016. The percentage of women receiving the complete continuum of maternity care (antenatal care, delivery care, and postnatal care from medically trained providers) has increased significantly from 19 percent in 2010, and to 43 percent in 2016. Seeking facility-based care for reported maternal complications has also increased from 29 percent to 46 percent between 2010 and 2016. However, delivery by C-section in Bangladesh is increasing at an alarming rate and substantially exceed WHO recommendations. C-section delivery increased from 12 percent in 2010 to 31 percent in 2016.
The information and interpretations presented in this report will be instrumental in determining strategic directions for the fourth Health, Population, and Nutrition Sector Program (4th HPNSP) and global commitment for Sustainable Development Goals (SDGs). This report presents the preliminary results for the major findings of the survey. More comprehensive report with policy implications of the findings will be published later.
BMMS 2016 has been conducted successfully due to the dedicated support and involvement of a large number of individuals and institutions. I am deeply indebted and grateful to all those who contributed to BMMS 2016. Because of their efforts, data could be made available in a timely fashion. I would like to put on record my sincere appreciation for the members of Stakeholder Advisory Committee and Technical Working Group, field staff, the data processing team, and particularly the survey respondents. I am thankful to MEASURE Evaluation, USA, icddr,b and USAID, Bangladesh for their technical assistance at every stages of survey. I sincerely extend my thanks to Mitra and Associates, and ACPR for completing the data collection on time. Government of Bangladesh, USAID and DFID funded BMMS 2016 and we acknowledge their contributions in accomplishing the entire survey.
(Rownaq Jahan)

4 | Bangladesh Maternal Mortality and Health Care Survey 2016
PEOPLE INVOLVED IN THE BANGLADESH MATERNAL MORTALITY AND HEALTH CARE SURVEY 2016
National Institute of Population Research and Training
Mohammed Ahsanul Alam
Shaheena Alam
Subrata Kumar Bhadra
Rita Farah Naz
Rafiqul Islam Sarker
Shahin Sultana
International Centre for Diarrhoeal Disease Research, Bangladesh
Atik Ahsan
Anadil Alam Shajratul Alam
Shams El Arifeen
Sk Masum Billah
Mahbub Elahi Chowdhury
Quamrun Nahar
Ahmed Ehsanur Rahman
Abu Bakkar Siddique
Peter Kim Streatfield
MEASURE Evaluation
Saifuddin Ahmed (Consultant)
Karar Zunaid Ahsan
Gustavo Angeles
Aimee Benson
Nitai Chakraborty (Consultant)
Siân Curtis
Kathy Doherty
Gabriela Escudero
William Frazier
Aiko Hattori
Kenneth Hill (Consultant)
Wayne Hoover
Rashida E Ijdi
Nahid Kamal
Shusmita Khan
Peter Lance
Han Raggers (Consultant)
Mizanur Rahman
Ahmed Al-Sabir (Consultant)
Associates for Community and Population Research (Data collection)
Abu Pasha Md. Shafiur Rahman
Mitra and Associates (Data collection)
Shahidul Islam
United States Agency for International Development
Kanta Jamil
Bangladesh Maternal Mortality and Health Care Survey 2016 | 5
CONTENTS
Foreword ....................................................................................................................................................................... 3
People involved in the Bangladesh Maternal Mortality and Health Care Survey 2016 .................................... 4
Abbreviations ............................................................................................................................................................. 10
Section 1: Background .............................................................................................................................................. 11
Introduction ................................................................................................................................................................ 11
Methodology ...................................................................................................................................................... 11
Survey Sample ............................................................................................................................................... 12
Questionnaires .............................................................................................................................................. 13
Fieldwork ....................................................................................................................................................... 14
Quality Control ............................................................................................................................................. 14
Implementing Organizations ...................................................................................................................... 14
Funding Sources ........................................................................................................................................... 15
Section 2: Background Characteristics ................................................................................................................... 16
Section 3: Maternal Mortality ................................................................................................................................... 24
Maternal Mortality in Bangladesh: Levels and Causes ................................................................................ 27
Overall Adult Mortality .................................................................................................................................... 34
Section 4: Antenatal Care ......................................................................................................................................... 39
Section 5: Delivery Care ............................................................................................................................................ 50
Section 6: Postnatal Care .......................................................................................................................................... 62
Section 7: Care Seeking For Maternal Complications .......................................................................................... 70
Section 8: Delivery Expenditure .............................................................................................................................. 83
Section 9: Birth Planning Among Pregnant Women ........................................................................................... 87
Section 10: Key Findings .......................................................................................................................................... 93
Background ................................................................................................................................................................. 93
Key Findings of the 2016 Survey ............................................................................................................................ 93
Stalling of Maternal Mortality Ratio: Possible Explanations ............................................................................... 95
Measurement Aspects ...................................................................................................................................... 95
Experience of Other Countries ...................................................................................................................... 96
Importance of Quality of Care ....................................................................................................................... 97
Readiness and Quality of Maternal Care in Health Facilities ..................................................................... 98
Public Health Sector Performance ............................................................................................................ 99
Private Health Sector Performance ........................................................................................................... 99
Readiness to Address Obstetric Emergencies ....................................................................................... 100
Dangers of Unnecessary C-Sections ............................................................................................................ 102

6 | Bangladesh Maternal Mortality and Health Care Survey 2016
Conclusion ................................................................................................................................................................ 103
References ................................................................................................................................................................. 104
Appendix ................................................................................................................................................................... 106

Bangladesh Maternal Mortality and Health Care Survey 2016 | 7
FIGURES
Figure 1.1. BMMS 2016 sample segregation ......................................................................................................... 12
Figure 1.2. Quality control pathway using mobile device and dashboard ........................................................ 14
Figure 2.1. Trends in age of ever-married women who responded, BMMS 2001, 2010 and 2016 .............. 19
Figure 2.2. Trends in respondents’ education (ever-married women ages 15–49), BMMS 2001, 2010,
and 2016 ...................................................................................................................................................................... 20
Figure 2.3. Trends in household socioeconomic indicators: BMMS 2001, 2010, and 2016 .......................... 21
Figure 2.4. Trends in socioeconomic indicators among households in the two lowest wealth quintiles:
BMMS 2001, 2010, and 2016 ................................................................................................................................... 22
Figure 2.5. Access to communication channels: BMMS 2010 and 2016 .......................................................... 23
Figure 3.1. Verbal autopsy determinations ............................................................................................................ 25
Figure 3.2. The cause of death review process ...................................................................................................... 26
Figure 3.3. Age-specific maternal mortality ratios per 100,000 live births........................................................ 29
Figure 3.4. Pregnancy-related maternal mortality ratio (PRMR) and maternal mortality ratio (MMR)
(per 100,000 live births): Comparison between BMMS 2001, BMMS 2010, and BMMS 2016 .................... 30
Figure 3.5. Maternal mortality ratios (MMR) (per 100,000 live births) by timing of death—during
pregnancy, during delivery, and postpartum: Comparison between BMMS 2001, BMMS 2010,
and BMMS 2016 .......................................................................................................................................................... 30
Figure 3.6. Maternal Mortality Ratios (MMR) (per 100,000 live births) by previous parity, Bangladesh 2016 .... 31
Figure 3.7. Percentage distribution of causes of maternal deaths, Bangladesh, 2016 ..................................... 31
Figure 3.8. Percentage distribution of causes of maternal deaths: Comparison between BMMS 2010
and BMMS 2016 ........................................................................................................................................................ 32
Figure 3.9. Cause-specific maternal mortality ratios: Comparison between BMMS 2010 and BMMS 2016 .. 33
Figure 3.10. Age-specific mortality rates in the three years preceding the survey, by sex, Bangladesh, 2016 ...... 35
Figure 3.11. Age-specific (15–49 years) female mortality rates per 100,000, Bangladesh, 2016 ................... 35
Figure 3.12. Percentage distribution of cause of death among women of reproductive age
(15–49 years), Bangladesh, 2016 .............................................................................................................................. 36
Figure 3.13. Percentage distribution of cause of death among women of reproductive age
(15–49 years): Comparison between BMMS 2010 and BMMS 2016 ................................................................ 38
Figure 4.1. Trends in ANC from a medically trained provider, BMMS 2001, 2010, and 2016 ..................... 42
Figure 4.2. Trends in women who receive four or more antenatal care visits, BMMS 2001, 2010, and 2016 ..... 44
Figure 4.3. Trends in components of ANC, BMMS 2010 and 2016 ................................................................. 48
Figure 4.4. Trends in ANC from a medically trained provider, by wealth quintile, BMMS 2001, 2010,
and 2016 ...................................................................................................................................................................... 49
Figure 5.1. Trends in deliveries by medically trained provider, 2001–2016 ..................................................... 54
Figure 5.2. Trends in births delivered in a health facility 2001–2016 ................................................................ 54
Figure 5.3. Change in facility deliveries by type of facility .................................................................................. 55
Figure 5.4. Trends in facility delivery in the past 4 years ..................................................................................... 55
Figure 5.5. Trends in deliveries by C-section, 2001–2016 ................................................................................... 57
Figure 5.6. Proportion of facility deliveries performed by C-section by type of facility ................................ 57
Figure 5.7. Poor-rich inequity in use of health facilities for delivery, 2001–2016 ........................................... 59
Figure 5.8. Prearrangements for emergency during pregnancy and delivery, 2010–2016 .............................. 61
Figure 6.1. Trends in postnatal care for mothers within two days of delivery, 2013–2016 ........................... 64
Figure 6.2 Trends in postnatal care for mothers within two days of delivery, BMMS 2001, 2010, and 2016 ...... 67
Figure 6.3. Completeness of maternity care: BMMS 2016 .................................................................................. 68

8 | Bangladesh Maternal Mortality and Health Care Survey 2016
Figure 6.4. Trends in completeness of maternity care from a medically trained provider, BMMS 2001,
2010, and 2016 ............................................................................................................................................................ 69
Figure 7.1. Percentage of women reporting maternal complications, BMMS 2010 and BMMS 2016 ........ 71
Figure 7.2. Percentage of women by number of reported maternal complications, BMMS 2010
and BMMS 2016 ........................................................................................................................................................ 72
Figure 7.3. Path diagram of treatment-seeking behavior for maternal complications, BMMS 2016 ........... 74
Figure 7.4. Trends in treatment-seeking for maternal complications ................................................................ 75
Figure 7.5. Number of places where health care was sought among those who sought care for
maternal complications, BMMS 2016 ..................................................................................................................... 76
Figure 7.6. First source where treatment was sought for maternal complications among women
sought care, BMMS 2010 and BMMS 2016 .......................................................................................................... 78
Figure 7.7. Care-seeking from health facility for maternal complications by wealth quintiles,
BMMS 2001, 2010, and 2016 ................................................................................................................................... 81
Figure 7.8. Care-seeking from health facility for maternal complications by women’s education,
BMMS 2001, 2010, and 2016 ................................................................................................................................... 81
Figure 8.1. Distribution of normal/C-section deliveries by place of delivery .................................................. 84
Figure 8.2. Median delivery expenditures in Taka for normal delivery and C-section, BMMS 2016 ........... 85
Figure 9.1. Trends in family discussion about place of delivery, BMMS 2010 and 2016 ............................... 89
Figure 9.2. Trends in key indicators of birth planning among pregnant women at the third trimester
of pregnancy, BMMS 2010 and 2016 ..................................................................................................................... 91
Figure 10.1. Trends in delivery by medically trained provider and by facility type, 2001–2016 ................... 94
Figure 10.2 Trends in MMR in Bangladesh from different data sources, 2001–2016 .................................... 95
Figure 10.3. Trends in MMR and facility delivery in Ghana and the Philippines, 1990–2015 ...................... 97
Figure 10.4. Facilities offering normal delivery services having service readiness, BHFS 2014 ................... 98
Figure 10.5. Facilities with specific items to provide high-quality maternal health care, BHFS 2014 ....... 100
Figure 10.6. facilities offering normal delivery services have at least one staff trained (ever) on
emergency obstetric care, BHFS 2014 ................................................................................................................ 101
Figure 10.7. Facilities providing C-section and have CEmOC signal functions............................................ 101

Bangladesh Maternal Mortality and Health Care Survey 2016 | 9
TABLES
Table 1.1. Results of the household and individual interviews ........................................................................... 13
Table 2.1. Household population by age, sex, and residence ............................................................................. 17
Table 2.2. Background characteristics of respondents ......................................................................................... 18
Table 3.1. Pregnancy-related mortality ratios per 100,000 live births in the three years preceding
the survey, by maternal age, Bangladesh, 2016 ..................................................................................................... 27
Table 3.2. Maternal mortality ratios per 100,000 live births in the three years preceding the survey,
by maternal age, Bangladesh, 2016. ......................................................................................................................... 28
Table 3.3. Cause-specific maternal death rates for the three years before the survey, by age,
Bangladesh 2016 ......................................................................................................................................................... 32
Table 3.4. Age-specific mortality rates per person in the three years preceding the survey, by sex,
Bangladesh, 2016 ........................................................................................................................................................ 34
Table 3.5. Cause-specific mortality rates for the three years before the survey, by age, Bangladesh, 2016 ..... 37
Table 4.1. Antenatal care .......................................................................................................................................... 40
Table 4.2. Number of antenatal care visits and timing of first visit ................................................................... 43
Table 4.3. Place of antenatal care ............................................................................................................................ 45
Table 4.4. Components of antenatal care............................................................................................................... 47
Table 5.1. Place of delivery ....................................................................................................................................... 51
Table 5.2. Assistance during delivery ...................................................................................................................... 52
Table 5.3. Prearrangements for emergency during pregnancy and delivery ..................................................... 60
Table 6.1. Timing of first postnatal checkup for the mother ............................................................................. 63
Table 6.2. Type of provider of first postnatal checkup for the mother ............................................................ 65
Table 6.3. Type of provider of PNC for the mother by place of delivery ........................................................ 67
Table 7.1. Women reporting recent maternal complications .............................................................................. 71
Table 7.2. Care seeking for complications ............................................................................................................. 73
Table 7.3. Number of places where health care was sought by type of complications .................................. 76
Table 7.4. First source where treatment was sought for maternal complications ........................................... 77
Table 7.5. Reasons for not seeking treatment for complications ....................................................................... 79
Table 7.6. Health care seeking for maternal complications by place of care and wealth quintiles ............... 80
Table 7.7. Health care seeking for maternal complications by place of care and women’s education ........ 80
Table 8.1. Delivery expenditures by place of delivery .......................................................................................... 84
Table 8.2. Source of fund for facility delivery by wealth status .......................................................................... 86
Table 9.1. Family discussion/decision about place of delivery .......................................................................... 88
Table 9.2. Pregnant women discussing preparedness for emergency with family members ......................... 90
Table 9.3. Knowledge of maternal complications among pregnant women .................................................... 92

10 | Bangladesh Maternal Mortality and Health Care Survey 2016
ABBREVIATIONS
ACPR Associates for Community and Population Research
AMTSL active management of the third stage of labor
ANC antenatal care
ASFR age-specific fertility rate
ASMMR age-specific maternal mortality ratio
BEmOC basic emergency obstetric care
BHFS Bangladesh health facility survey
BMMS Bangladesh Maternal Mortality and Health Care Survey
C-section Cesarean section
CEmOC comprehensive emergency obstetric care
CSBA community skilled birth attendant
DC delivery care
FWA family welfare assistant
FWV family welfare visitor
GFR general fertility rate
HA health assistant
HPNSDP Health, Population and Nutrition Sector Development Program
HPNSP Health, Population, Nutrition Sector Program
iccdr,b International Centre for Diarrhoeal Disease Research, Bangladesh
MA medical assistant
MDG Millennium Development Goal
MMEIG United Nations Maternal Mortality Estimation Inter-Agency Group
MMR maternal mortality ratio
MOHFW Ministry of Health and Family Welfare
NIPORT The National Institute of Population Research and Training
NGO nongovernmental organization
PNC postnatal care
PRMR pregnancy related mortality ratio
SACMO sub-assistant community medical officer
SDG sustainable development goal
UNDP The United Nations Development Program
USAID United States Agency for International Development

Bangladesh Maternal Mortality and Health Care Survey 2016 | 11
INTRODUCTION
The Government of Bangladesh is committed to achieving its targets for Millennium Development Goal
(MDG) 5: reducing the maternal mortality ratio (MMR) to 143 deaths per 100,000 live births by 2015 and
increasing skilled attendance at birth to 50 percent by 2015 (United Nations Development Program
[UNDP], 2015). The decline in MMR between 2001 and 2010 indicates remarkable progress. This
progress is linked to fertility reduction, access to qualified maternal health care, and overall care seeking
during the antenatal period and during delivery (UNDP, 2015). With the MDGs phasing out and the
Sustainable Development Goals (United Nations, 2015) phasing in, the 4th Health, Population and
Nutrition Sector Program 2017–2022 has set the target of reaching an MMR of 105 per 100,000 live
births in 2022 (Ministry of Health and Family Welfare, 2017). Within this context, the 2016 Bangladesh
Maternal Mortality and Health Care Survey (BMMS 2016) was carried out to assess how well the country
is progressing toward these targets.
The BMMS 2016 was an activity under the Operational Plan of Training, Research and Development of
the National Institute of Population Research and Training (NIPORT) under the Health, Population and
Nutrition Sector Development Program (HPNSDP) 2011–2016 (Ministry of Health and Family Welfare,
2011).
The BMMS 2016 had the following objectives:
• Estimate the national level MMR in Bangladesh
• Identify the specific causes of maternal and non-maternal deaths among adult women
• Assess the pattern of antenatal, delivery, and postnatal care practices
• Assess maternal complications experience and care seeking
• Estimate childhood mortality rates
• Measure the level of selected maternal morbidities (obstetric fistula and pelvic organ prolapse)
• Provide district level socioeconomic, demographic, family planning and health care utilization
indicators
Methodology
The BMMS 2016 sample size was designed to estimate the MMR with a similar level of relative precision
to the estimate obtained in the 2010 BMMS, assuming that the MDG target of 143 per 100,000 live births
had been met.
The BMMS 2016 used a multistage sampling procedure, using sampling frames derived from the 2011
census (Bangladesh Bureau of Statistics, 2011). In the first stage, wards and unions were used as the
primary sample units in urban and rural areas, respectively. The second stage of sampling involved
selecting two mohallas in each ward selected in the first stage and two mouzas in each union selected in the
first stage.
Each selected mohalla and mouza was segmented into clusters, and one of these was selected from each
selected mohalla and mouza. A total of 1,922 urban and 2,826 rural clusters were selected, for a total of
4,748 clusters overall. Of these clusters, 4,739 were successfully interviewed. Sixty-five households were
randomly selected in each cluster to receive a household questionnaire. All ever-married women of these
SECTION 1: BACKGROUND

12 | Bangladesh Maternal Mortality and Health Care Survey 2016
households received a women’s questionnaire. In addition, the women of 42 of these households were
randomly assigned to receive a subset of questionnaire A, and the women of the remaining 23 households
were assigned to receive a subset of questionnaire B. The sample segregation of BMMS 2016 is presented
below:
Figure 1.1. BMMS 2016 sample segregation
Survey Sample
Table 1.1 shows response rates for the survey. A total of 306,961 households were selected for the
sample, and out of those, 298,284 households were successfully interviewed (a household response rate of
99 percent).
A total of 335,896 ever-married women ages 13–49 were eligible for the interview, of whom 321,214 were
successfully interviewed (a response rate of 96 percent).
Community sample: 4,748
• Community
questionnaire Death of women ages 13–49
years: 1,524
• Verbal autopsy
Subset (A) 207,581 respondents
• Maternal Morbidity
• (obstetric fistula and
pelvic organ
prolapse)
Subset (B) 113,633 respondents
• Birth planning
• Pregnancy, delivery, and
postnatal care
• Care seeking for maternal
complication
• Expenditure for maternal care
Total Sample: 298,284 households
• Household schedule
• Household characteristics
• Household death information
Total ever married women (13–49 years): 321,214
respondents
• Respondents background
• Reproduction
• Child mortality
• Family planning

Bangladesh Maternal Mortality and Health Care Survey 2016 | 13
Table 1.1. Results of the household and individual interviews
Number of households, number of interviews, and response rates, according to residence
(unweighted), Bangladesh 2016
Residence
Result Urban Rural Total
Household interviews Household selected 123,988 182,973 306,961
Household occupied 121,144 179,842 300,986
Household interviewed 119,726 178,558 298,284
Household response rate 98.8 99.3 99.1
Individual interviews with women age 13–49 Eligible women 134,801 201,095 335,896
Eligible women interviewed 129,249 191,965 321,214
Eligible women response rate 95.9 95.5 95.6
Questionnaires
The survey employed six questionnaires, each based on the 2010 BMMS questionnaire design, in order to
insure maximum comparability with 2010 estimates.
The Household Questionnaire gathered information on the age, sex, and education among all usual
household members and the environmental circumstances of the household (household materials, water
sources, etc.) and household ownership of assets. The household questionnaire asked about any deaths of
household members in the five years preceding the survey, to identify adult female deaths (ages 13–49
years).
The Women’s Questionnaire gathered information on respondents’ background, reproduction, child
mortality, and family planning from 321,214 ever-married women (weighted) ages 13–49 years.
The Subset A Questionnaire was used to gather data from 207,581 eligible women (weighted)
concerning their maternal morbidity—focusing on obstetric fistula and pelvic organ prolapse.
The Subset B Questionnaire was used to gather data from 113,633 eligible women (weighted)
concerning the following:
• Birth planning
• Pregnancy, delivery, and postnatal care
• Care seeking for maternal complication
• Expenditure for maternal care
The Verbal Autopsy Questionnaire was used to collect information on causes of death for all female
adult deaths in the household in the three years preceding the survey. The questionnaire included both
structured (pre-coded questions) and unstructured (open-ended) questions, which were answered by the
most knowledgeable member of the household.
The Community Questionnaire was used to collect data on the socioeconomic condition of the
community as well as data on the accessibility and availability of health and family planning services. One
community questionnaire was completed for each selected cluster. Subsequently, this questionnaire was
supplied to the interviewer teams for the main survey for identifying the specific sources of services used
by respondents.

14 | Bangladesh Maternal Mortality and Health Care Survey 2016
Fieldwork
Field data collection started on 22 August 2016 and was completed on 10 February 2017. The survey was
carried out by 90 interviewing teams in six phases. All interviewers were trained for 23 days. Each data-
collection team consisted of one male supervisor, one female editor, and five female interviewers.
Quality Control
The data-collection agencies for BMMS 2016 fielded quality control teams to check on the fieldwork and
ensure the quality of the data. The National Institute of Population Research and Training also deployed
seven, and the International Centre for Diarrhoeal Disease Research, Bangladesh (icddr,b) deployed three,
quality control teams to monitor and observe the interviewer activities to ensure data quality. The
MEASURE Evaluation team visited at least eight clusters in each phase to observe the quality of data
collection. In addition, icddr,b developed a mobile dashboard for real-time data monitoring. The
schematic diagram of the mobile monitoring system used in BMMS 2016 is presented below:
Figure 1.2. Quality control pathway using mobile device and dashboard
The BMMS 2016 technical working group also monitored the data coming from the field through
different computer-based consistency checks. Feedback was given to teams through a debriefing session
after each phase of the survey, to improve the quality of data.
Implementing Organizations
The 2016 Bangladesh Maternal Mortality and Health Care Survey was conducted under the authority of
NIPORT of the Ministry of Health and Family Welfare. MEASURE Evaluation and icddr,b provided
technical assistance in all phases of the survey. Moreover, two local research firms (Mitra and Associates
and Associates for Community and Population Research) were employed for field data collection, data
editing, and data entry.
Data collector collecting data
Quality control team at icddr,b checking data quality
Supervisor editing in field and entering data in mobile device every night
Feedback to supervisor for any anomaly
Data coming to monitoring server the next day
Daily analytics

Bangladesh Maternal Mortality and Health Care Survey 2016 | 15
Funding Sources
BMMS 2016 was funded by the Government of People’s Republic of Bangladesh, the United States
Agency for International Development, and the Department for International Development.

16 | Bangladesh Maternal Mortality and Health Care Survey 2016
SECTION 2: BACKGROUND CHARACTERISTICS
SUMMARY
• In 2016, 10 percent of ever-married women who responded to the survey were 15–19 years
old, compared to 15 percent in 2001. The proportion of ever-married women ages 35–49
increased from 32 percent, in BMMS 2001, to 37 percent, in BMMS 2016. The change in age
of women who responded to the survey, between BMMS 2010 and BMMS 2016, was very
slight.
• The level of education of women continues to increase. In the past six years, the
proportion of ever-married women ages 15–49 with no education decreased from 34
percent to 21 percent, while the proportion who attended secondary school has
increased from 36 percent to 47 percent.
• The economic status of Bangladeshi households continues to improve. Three indicators
reflect this improvement. Between 2010 and 2016, the number of households that had
electricity, access to improved toilet, and non-kacha dwelling walls increased from 55 to
79 percent, 60 to 83 percent, and 67 to 85 percent, respectively. Poor households (those in
the bottom two wealth quintiles) also had substantial improvements in these indicators in
the past six years.
• Nearly all households (94 percent) own a mobile phone. In 2010, two in three households
had a mobile phone.

Bangladesh Maternal Mortality and Health Care Survey 2016 | 17
Table 2.1. Household population by age, sex, and residence
• In 2016, almost one-third of the de facto household population (33 percent) were under 15 years
of age, and six percent were age 65 or over (Table 2.1).
• In 2010, 35 percent of the population were under age 15, and five percent were age 65 or
above—indicating that the Bangladesh population is slowly aging.
Percentage distribution of the de facto household population by five-year age groups, according to sex
and residence, Bangladesh 2016
Urban Rural Total
Age
group Male Female Total Male Female Total Male Female Total
0–4 10.3 9.6 9.9 11.1 10.0 10.5 10.9 9.9 10.4
5–9 10.6 9.9 10.2 11.7 10.5 11.1 11.4 10.3 10.8
10–14 10.9 10.3 10.6 12.0 11.3 11.6 11.7 11.0 11.3
15–19 9.9 11.5 10.7 9.8 10.9 10.4 9.8 11.1 10.5
20–24 7.6 10.9 9.3 6.7 9.7 8.2 6.9 10.0 8.5
25–29 8.7 10.1 9.4 7.1 8.8 8.0 7.5 9.1 8.4
30–34 7.6 8.5 8.0 6.2 7.7 6.9 6.6 7.9 7.2
35–39 7.8 7.0 7.4 6.8 6.3 6.5 7.1 6.5 6.8
40–44 5.9 5.5 5.7 5.2 5.4 5.3 5.4 5.4 5.4
45–49 5.4 5.3 5.4 4.9 5.8 5.4 5.1 5.6 5.4
50–54 4.1 1.8 2.9 4.2 1.7 2.9 4.1 1.7 2.9
55–59 3.0 3.1 3.1 3.3 3.6 3.5 3.2 3.4 3.3
60–64 2.9 2.6 2.8 3.4 3.2 3.3 3.3 3.0 3.1
65–69 2.0 1.5 1.7 2.5 1.8 2.2 2.4 1.8 2.1
70–74 1.6 1.1 1.4 2.4 1.5 1.9 2.2 1.4 1.8
75–79 0.7 0.5 0.6 1.1 0.6 0.8 1.0 0.6 0.8
80+ 0.9 1.0 1.0 1.6 1.4 1.5 1.4 1.3 1.4
Total 100.0 100.0 100.0 100.0 100.0 100.0 100.0 100.0 100.0
Number 176,027 184,407 360,435 450,495 488,007 938,502 626,523 672,414 1,298,937

18 | Bangladesh Maternal Mortality and Health Care Survey 2016
Table 2.2. Background characteristics of respondents
Percentage distribution of ever-married women ages 15–49 by selected background characteristics,
Bangladesh, 2016
Number of women
Background characteristic
Weighted
percentage Weighted Unweighted
Age 15–19 10.1 31,933 30,890
20–24 18.0 56,748 55,553
25-29 18.4 57,970 57,266
30–34 16.5 51,935 52,173
35–39 13.6 42,721 43,475
40–44 11.5 36,111 36,840
45–49 11.8 37,219 38,490
Residence Urban 28.1 88,323 126,833
Rural 71.9 226,314 187,854
Division Barisal 5.5 17,355 28,143
Chittagong 19.0 59,674 49,607
Dhaka 26.9 84,551 55,716
Khulna 11.4 35,744 40,621
Mymensingh 7.6 23,770 30,719
Rajshahi 12.8 40,160 42,526
Rangpur 11.4 35,899 40,195
Sylhet 5.6 17,484 27,160
Educational attainment No education 20.7 64,981 63,304
Primary incomplete 18.1 57,058 55,822
Primary complete 14.1 44,500 44,695
Secondary incomplete 31.2 98,061 97,062
Secondary complete or higher 15.9 50,037 53,804
Marital status Currently married 93.9 295,402 295,209
Separated 1.0 3,209 3,090
Deserted 0.4 1,327 1,262
Divorced 1.1 3,304 3,256
Widowed 3.6 11,395 11,870
Total 100.0 314,637 314,687

Bangladesh Maternal Mortality and Health Care Survey 2016 | 19
Figure 2.1. Trends in age of ever-married women who responded, BMMS 2001, 2010 and 2016
• Ever-married women ages 15–49 years who responded to BMMS 2016 were slightly older
compared to the BMMS 2001 respondents, reflecting the shift in overall age structure of the
population towards the older age group. In BMMS 2016, 10 percent of the respondents were 15–
19 years old, compared to 15 percent in BMMS 2001. On the other hand, the percentage of
respondents ages 35–49 was higher in BMMS 2010 (37 percent), compared to BMMS 2001 (32
percent) (Table 2.2, Figure 2.1).
• Dhaka constituted the largest proportion of the sample (27 percent) followed by Chittagong
(19 percent).
15
53
32
11
54
36
10
53
37
15–19 20–34 35–39
Pe
rce
nta
ge
Age
BMMS 2001 BMMS 2010 BMMS 2016
35–49

20 | Bangladesh Maternal Mortality and Health Care Survey 2016
Figure 2.2. Trends in respondents’ education (ever-married women ages 15–49), BMMS 2001,
2010, and 2016
• The proportion of ever-married women respondents with no education decreased from 34
percent to 21 percent between 2010 and 2016. In 2001, almost half of the respondents had no
education (Figure 2.2).
• The proportion of respondents who attended secondary school has increased from 36 percent to
47 percent in the past six years.
47
2825
34
30
36
21
32
47
No education Primary
(incomplete/complete)
At least any secondary
Pe
rce
nta
ge
BMMS 2001 BMMS 2010 BMMS 2016

Bangladesh Maternal Mortality and Health Care Survey 2016 | 21
Figure 2.3. Trends in household socioeconomic indicators: BMMS 2001, 2010, and 2016
• Economic status of households increased markedly between BMMS 2001 and BMMS 2010. A
similar trend continued between BMMS 2010 and BMMS 2016, which is reflected by three
indicators: whether a household had electricity, an improved toilet, or the dwelling had non-kacha
walls (Figure 2.3).
• Four out of five households in Bangladesh have access to electricity (national grid). During the
past six years, the proportion of households that had electricity increased by 24 percentage
points, from 55 percent in 2010 to 79 percent in 2016.
• A substantial proportion of Bangladeshi households (83 percent) now have access to an
improved toilet facility.
• In BMMS 2016, most dwellings (85 percent) had non-kacha walls. In BMMS 2010, 67
percent―and in BMMS 2001, 41 percent—had non-kacha walls.
31
24
41
5560
67
7983 85
Electricity (national grid) Toilet (improved) Wall (non-katcha)
Pe
rce
nta
ge
of
ho
use
ho
lds
BMMS 2001 BMMS 2010 BMMS 2016

22 | Bangladesh Maternal Mortality and Health Care Survey 2016
Figure 2.4. Trends in socioeconomic indicators among households in the two lowest wealth
quintiles: BMMS 2001, 2010, and 2016
• The economic status of poor households (those in bottom two wealth quintiles) has also
improved in the past six years.
• In 2016, more than half of poor households had access to electricity (national grid). In 2010, only
one in ten poor household had electricity (Figure 2.4).
• Seven out of ten poor households now have access to improved toilets, compared to four out of
ten households, six years ago.
• The quality of dwellings of poor households has also improved between 2010 and 2016,
measured by whether the walls of the dwelling were non-kacha.
4
22
1111
40
5053
7076
Electricity (national grid) Toilet (improved) Wall (non-kacha)
Pe
rce
nta
ge
of
ho
use
ho
lds
BMMS 2001 BMMS 2010 BMMS 2016

Bangladesh Maternal Mortality and Health Care Survey 2016 | 23
Figure 2.5. Access to communication channels: BMMS 2010 and 2016
• Sixty percent of women who responded to the survey are exposed to either television or radio
at least once a week. There was a slight increase in this exposure between 2010 and 2016
(Figure 2.5).
• Household ownership of a mobile phone has now become almost universal (94 percent).
In 2010, 63 percent of households had a mobile phone.
52
6360
94
Exposed to either TV or radio once a
week
Household owns at least one mobile
phone
Pe
rce
nta
ge
BMMS 2010 BMMS 2016

24 | Bangladesh Maternal Mortality and Health Care Survey 2016
SUMMARY
• The estimated maternal mortality ratio (MMR) in BMMS 2016 is 196 per 100,000 live
births; this rate has remained almost unchanged in Bangladesh since 2010.
• Maternal mortality now accounts for around 13% of all adult female deaths, with no
apparent change from the BMMS 2010 estimate (14%).
• For all age groups, the MMR was comparable between BMMS 2010 and BMMS 2016,
except in the youngest age group (15–19 years), where it was higher in 2016.
• The risk of maternal death is high among first-time mothers (215 per 100,000 live births)
as well as for parities 4 or higher.
• Hemorrhage was the most common cause of maternal mortality, followed by
eclampsia, indirect causes, and abortion-related complications.
• Hemorrhage and eclampsia account for 54% of all maternal deaths in BMMS 2016,
slightly higher than in BMMS 2010 (51%).
• The proportionate contribution of indirect causes of maternal death has declined
from 35% in BMMS 2010 to 20% in BMMS 2016.
• The major causes of adult female deaths are cancers (24%), circulatory diseases
(23%), and maternal (13%).
SECTION 3: MATERNAL MORTALITY

Bangladesh Maternal Mortality and Health Care Survey 2016 | 25
Figure 3.1. Verbal autopsy determinations
• The BMMS 2016 used the “household deaths” approach to measure maternal mortality. It used
both a time of death and a verbal autopsy approach to identify pregnancy-related and maternal
deaths, respectively, among deaths of women of reproductive age (13–49 years) reported by
households in the three years preceding the survey.
• The Household Questionnaire included a section about deaths of residents of the household
since October 2012.
• If any death was reported from a household, further details regarding the name, sex, age at death,
and month and year of death were collected.
• Subsequent verbal autopsy interviews were conducted for all deaths reported among women ages
13–49 years at the time of death. However, the analysis presented here was limited to women
ages 15–49 years. The interviews were conducted with the household member who knew the
most about the deceased person.

26 | Bangladesh Maternal Mortality and Health Care Survey 2016
Figure 3.2. The cause of death review process
• Cause of death was determined by physician review of the verbal autopsy questionnaire.
• Two physicians independently reviewed each case.
• If these physicians could not agree, the case was reviewed by a third physician.
• An expert committee of obstetricians helped assign a specific cause of maternal death when the
physicians agreed that the death was maternal but could not reach consensus to assign a specific
cause (#10). The remaining 46 non-maternal deaths for which consensus could not be reached
were categorized as unclassified.
• The International Classification of Diseases Revision 10 was used to assign causes of death.

Bangladesh Maternal Mortality and Health Care Survey 2016 | 27
Maternal Mortality in Bangladesh: Levels and Causes
Table 3.1. Pregnancy-related mortality ratios per 100,000 live births in the three years
preceding the survey, by maternal age, Bangladesh, 2016
Mortality Age-specific
fertility rate
(ASFR) and
age-specific
PRMR
Exposure
time
(women
years)
Deaths
during
pregnancy1
Deaths
during
delivery1
Deaths
post-
partum1
Total
pregnancy-
related deaths1
Pregnancy-
related mortality
rate2 ASFR3 ASPRMR4
Maternal
age
15–19 221,051.023 12.626 1.610 18.821 33.057 0.150 0.104 143.611
20–24 190,825.590 7.040 3.715 24.790 35.546 0.186 0.147 126.706
25–29 176,606.936 16.144 3.571 16.991 36.706 0.208 0.109 191.508
30–34 150,600.872 12.108 5.206 16.469 33.783 0.224 0.058 383.598
35–39 123,488.496 11.231 1.487 11.813 24.531 0.199 0.022 919.535
40–44 110,372.538 2.159 0.000 0.989 3.148 0.029 0.005 606.970
45–49 86,298.287 1.501 0.000 0.000 1.501 0.017 0.001 2,031.243
General
Total 1,059,243.740 62.809 15.589 89.873 168.271 0.157 2.227 -
GFR5 - - - - - - 0.076 -
PRMR6 - - - - - - - 205.5597
Note: Information from the Household and Verbal Autopsy Questionnaire, considers de jure female
household population in exposure, gets pregnancy-related deaths from a list of usual members who
died in the three years before the survey and from the verbal autopsy questionnaire, and assumes the
same fertility rates as de facto women interviewed.
1 Deaths are weighted, hence, the number of deaths is not a round number.
2 Deaths per 1,000 3 Births per women 4 Deaths per 100,000 live births 5 GFR=General fertility rate 6 PRMR=Pregnancy-related mortality ratio 7 95% confidence interval: 169 to 244
• The overall pregnancy-related mortality ratio (PRMR) is 206 per 100,000 live births (95%
confidence interval [CI]: 169–244) in BMMS 2016. This compares to 201 per 100,000 live births
(95% CI: 160–245) in BMMS 2010.
• The PRMR among the youngest women (15–19 years) is higher in BMMS 2016 (144 deaths per
100,000 live births) than in BMMS 2010 (75 deaths per 100,000 live births).
• The lowest PRMR is among women ages 20–24 years (127 per 100,000 live births).
• The PRMR increases with age among women age 30 years or more, with the highest PRMR
among women ages 45–49 (2031 per 100,000 live births).
• Although the pregnancy-related mortality ratio (deaths per 100,000 live births) has remained
unchanged, the pregnancy-related mortality rate (deaths per 1,000 years of exposure) has declined
by 11% between BMMS 2010 and BMMS 2016.
28 | Bangladesh Maternal Mortality and Health Care Survey 2016
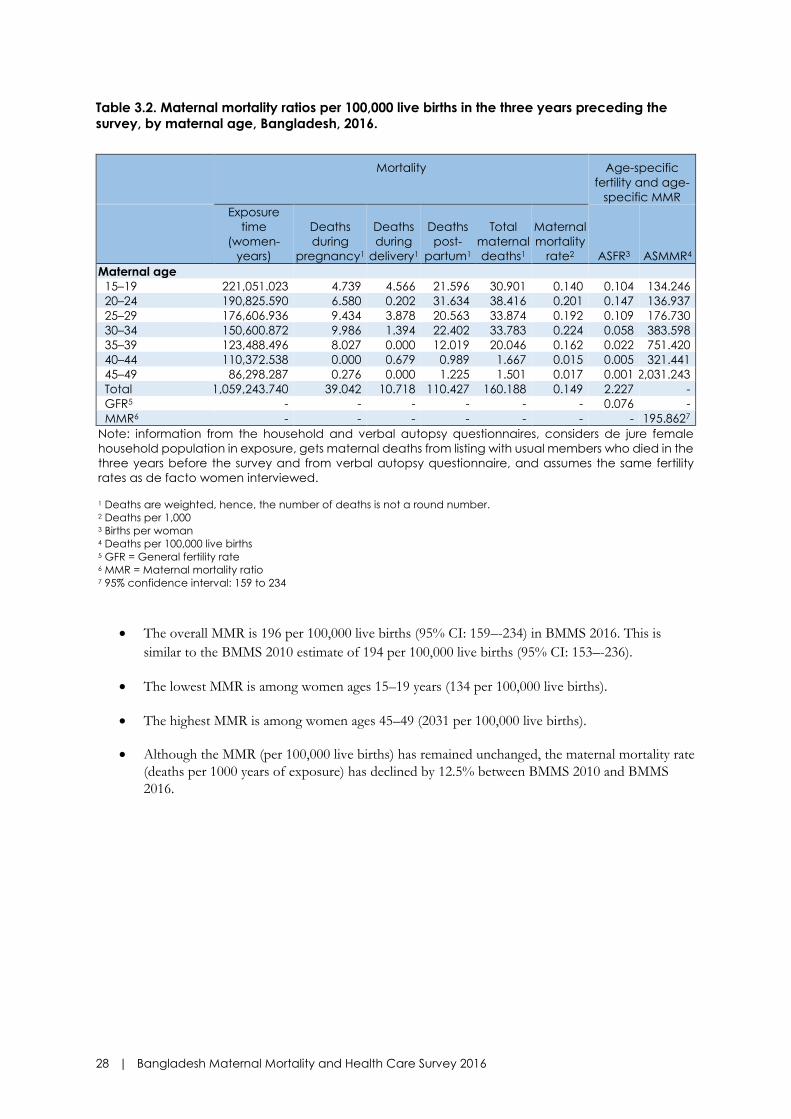
Table 3.2. Maternal mortality ratios per 100,000 live births in the three years preceding the
survey, by maternal age, Bangladesh, 2016.
Mortality Age-specific
fertility and age-
specific MMR
Exposure
time
(women-
years)
Deaths
during
pregnancy1
Deaths
during
delivery1
Deaths
post-
partum1
Total
maternal
deaths1
Maternal
mortality
rate2 ASFR3 ASMMR4
Maternal age
15–19 221,051.023 4.739 4.566 21.596 30.901 0.140 0.104 134.246
20–24 190,825.590 6.580 0.202 31.634 38.416 0.201 0.147 136.937
25–29 176,606.936 9.434 3.878 20.563 33.874 0.192 0.109 176.730
30–34 150,600.872 9.986 1.394 22.402 33.783 0.224 0.058 383.598
35–39 123,488.496 8.027 0.000 12.019 20.046 0.162 0.022 751.420
40–44 110,372.538 0.000 0.679 0.989 1.667 0.015 0.005 321.441
45–49 86,298.287 0.276 0.000 1.225 1.501 0.017 0.001 2,031.243
Total 1,059,243.740 39.042 10.718 110.427 160.188 0.149 2.227 -
GFR5 - - - - - - 0.076 -
MMR6 - - - - - - - 195.8627
Note: information from the household and verbal autopsy questionnaires, considers de jure female
household population in exposure, gets maternal deaths from listing with usual members who died in the
three years before the survey and from verbal autopsy questionnaire, and assumes the same fertility
rates as de facto women interviewed. 1 Deaths are weighted, hence, the number of deaths is not a round number.
2 Deaths per 1,000 3 Births per woman 4 Deaths per 100,000 live births 5 GFR = General fertility rate 6 MMR = Maternal mortality ratio 7 95% confidence interval: 159 to 234
• The overall MMR is 196 per 100,000 live births (95% CI: 159–-234) in BMMS 2016. This is
similar to the BMMS 2010 estimate of 194 per 100,000 live births (95% CI: 153–-236).
• The lowest MMR is among women ages 15–19 years (134 per 100,000 live births).
• The highest MMR is among women ages 45–49 (2031 per 100,000 live births).
• Although the MMR (per 100,000 live births) has remained unchanged, the maternal mortality rate
(deaths per 1000 years of exposure) has declined by 12.5% between BMMS 2010 and BMMS
2016.

Bangladesh Maternal Mortality and Health Care Survey 2016 | 29
Figure 3.3. Age-specific maternal mortality ratios per 100,000 live births
• MMR rises steeply with age, and the pattern is consistent in all three surveys (BMMS 2001,
BMMS 2010, and BMMS 2016).
• At almost all ages, the MMR in BMMS 2010 and BMMS 2016 are similar and lower than in
BMMS 2001.
170237
358
516492
1945
2435
49130
194
402
928
561
1798
134137
177
384
751
321
2031
15–19 20–24 25–29 30–34 35–39 40–44 45–49
De
ath
s p
er
10
0,0
00
liv
e b
irth
s
2001 2010 2016

30 | Bangladesh Maternal Mortality and Health Care Survey 2016
Figure 3.4. Pregnancy-related maternal mortality ratio (PRMR) and maternal mortality ratio
(MMR) (per 100,000 live births): Comparison between BMMS 2001, BMMS 2010, and BMMS
2016
• Figure 3.4. Demonstrates the stagnation of both PRMR and MMR, between BMMS 2010
and BMMS 2016, after significant declines from BMMS 2001.
Figure 3.5. Maternal mortality ratios (MMR) (per 100,000 live births) by timing of death—during
pregnancy, during delivery, and postpartum: Comparison between BMMS 2001, BMMS 2010,
and BMMS 2016
• The MMR is highest during the postpartum period. This pattern is consistent in BMMS 2001,
BMMS 2010, and BMMS 2016.
• The MMR during the delivery and postpartum periods is slightly lower in BMMS 2016 compared
to BMMS 2010.
71
36
216
3518
142
48
13
135
During pregnancy During delivery Postpartum
2001 2010 2016
382
322
201 194206 196
PRMR MMR
2001 2010 2016

Bangladesh Maternal Mortality and Health Care Survey 2016 | 31
Figure 3.6. Maternal Mortality Ratios (MMR) (per 100,000 live births) by previous parity,
Bangladesh 2016
• The risk of maternal death is the highest among women with parity 4 or higher.
• The lowest risk of maternal death is among women who have had one previous live birth.
Figure 3.7. Percentage distribution of causes of maternal deaths, Bangladesh, 2016
• Ante and postpartum hemorrhage (31%) and eclampsia and preeclampsia (24%) are the most
common causes of maternal death, followed by indirect causes (20%), abortions (7%), and
obstructed or prolonged labor (3%).
• One-fifth of the maternal deaths have indirect causes.
Obstructed or
prolonged labor
3%
Abortion
7%
Other direct
7%
Indirect
20%
Undetermined
8%
Hemorrhage
31%
Eclampsia
24%
215
146175
214
306
Category 1
0 1 2 3 4+

32 | Bangladesh Maternal Mortality and Health Care Survey 2016
Table 3.3. Cause-specific maternal death rates for the three years before the survey, by age,
Bangladesh 2016.
Direct obstetric death1
Maternal
age
Exposure
time
(women-
years)
Hemorrhage
(ante- and
postpartum) Eclampsia
Obstructed/
prolonged
labor
Abortion-
related
death
Other
direct
Indirect
obstetric
death1
Undetermined
maternal
death1
Maternal
mortality
rate1
15–19 221,051.023 0.023 0.049 0.011 0.000 0.020 0.024 0.013 0.140
20–24 190,825.590 0.060 0.056 0.000 0.019 0.018 0.033 0.015 0.201
25–29 176,606.936 0.057 0.025 0.005 0.011 0.024 0.045 0.025 0.192
30–34 150,600.872 0.086 0.047 0.009 0.027 0.000 0.035 0.019 0.224
35–39 123,488.496 0.062 0.042 0.000 0.007 0.000 0.051 0.000 0.162
40–44 110,372.538 0.015 0.000 0.000 0.000 0.000 0.000 0.000 0.015
45–49 86,298.287 0.000 0.000 0.000 0.014 0.000 0.003 0.000 0.017
Total 1,059,243.740 0.046 0.035 0.004 0.011 0.011 0.029 0.012 0.149
1Deaths per 1,000 woman-years of exposure
Figure 3.8. Percentage distribution of causes of maternal deaths: Comparison between BMMS
2010 and BMMS 2016
• Ante and postpartum hemorrhage is an important cause of death among women ages 20–39
years, particularly among women 30–34 years old.
• Eclampsia/preeclampsia is an important cause of death among women younger than 40 years.
• Obstructed or prolonged labor was most common among the youngest women (15–19 years).
• Abortion-related deaths peaked among women 30–34 years old.
• Indirect obstetric causes were most common among women ages 25–39 years.
31
20
71
5
35
1
3124
37 7
20
8
He
mo
rrh
ag
e
Ec
lam
psi
a
Ob
stru
cte
d o
r
pro
lon
ge
d la
bo
r
Ab
ort
ion
Oth
er
dire
ct
Ind
ire
ct
Un
de
term
ine
d
2010 2016

Bangladesh Maternal Mortality and Health Care Survey 2016 | 33
Figure 3.9. Cause-specific maternal mortality ratios: Comparison between BMMS 2010 and
BMMS 2016
• The proportionate contribution of hemorrhage among all maternal deaths remained unchanged
between BMMS 2010 and BMMS 2016. The cause-specific mortality ratios specific to
hemorrhage also did not change between the two periods.
• The cause-specific mortality ratio due to indirect causes decreased from 68 per 100,000 live births
in BMMS 2010 to 38 per 100,000 live births in BMMS 2016, resulting in a decrease in the
proportionate contribution of indirect causes from 35% to 20% among all maternal deaths.
• The cause-specific mortality ratio due to eclampsia increased from 39 per 100,000 live births in
BMMS 2010 to 46 per 100,000 live births in BMMS 2016; consequently, the proportionate
contribution of eclampsia increased from 20% to 24% among all maternal deaths.
• The contribution of abortion as a cause of death increased between 2010 and 2016: The cause-
specific mortality ratio increased from 2 to 15 per 100,000 live births, and the proportionate
contribution increased from 1% to 7%.
60
39
132
9
68
2
61
46
515 15
38
16
He
mo
rrh
ag
e
Ec
lam
psi
a
Ob
stru
cte
d o
r p
rolo
ng
ed
lab
or
Ab
ort
ion
Oth
er
dire
ct
Ind
ire
ct
Un
de
term
ine
d
2010 2016
De
ath
s p
er
10
0,0
00 liv
e b
irth

34 | Bangladesh Maternal Mortality and Health Care Survey 2016
Overall Adult Mortality
Table 3.4. Age-specific mortality rates per person in the three years preceding the survey, by
sex, Bangladesh, 2016
Male Female
Deaths Exposure
Mortality
rates
Deaths Exposure
Mortality
rates
Age group
< 1 1,822.2 36,951.9 0.04931 1,415.9 36,118.3 0.03920
1–4 369.2 166,264.6 0.00222 278.1 161,885.2 0.00172
5–9 167.7 220,122.6 0.00076 132.8 213,423.1 0.00062
10–14 148.8 216,800.3 0.00069 96.3 217,082.2 0.00044
15–19 217.9 176,158.4 0.00124 152.8 221,051.0 0.00069
20–24 164.8 145,167.3 0.00114 123.9 190,825.6 0.00065
25–29 236.8 158,047.3 0.00150 150.1 176,606.9 0.00085
30–34 192.1 137,993.0 0.00139 154.7 150,600.9 0.00103
35–39 227.2 125,500.8 0.00181 172.4 123,488.5 0.00140
40–44 322.2 99,137.9 0.00325 190.2 110,372.5 0.00172
45–49 478.4 93,170.5 0.00513 306.0 86,298.3 0.00355
50–54 577.6 68,936.7 0.00838 161.0 54,780.0 0.00294
55–59 615.5 70,054.8 0.00879 716.2 82,444.7 0.00869
60–64 1,280.6 53,211.2 0.02407 1,207.5 50,224.4 0.02404
65–69 1,299.6 48,611.8 0.02673 1,070.8 34,993.2 0.03060
70–74 2,000.1 26,187.2 0.07638 1,517.6 16,899.6 0.08980
75–79 1,115.2 21,693.2 0.05141 723.4 18,163.4 0.03983
80+ 4,209.5 15,305.3 0.27504 4,365.8 15,643.5 0.27908
Total
Total 15,445.4 1,879,315.0 0.00822 12,935.8 1,960,901.4 0.00660
Probability of dying
35q15 - - 0.07440 - - 0.04823
Note: Rates are based on data from the Household Questionnaire: deaths from the household listing
in the three years before the survey.
Bangladesh Maternal Mortality and Health Care Survey 2016 | 35
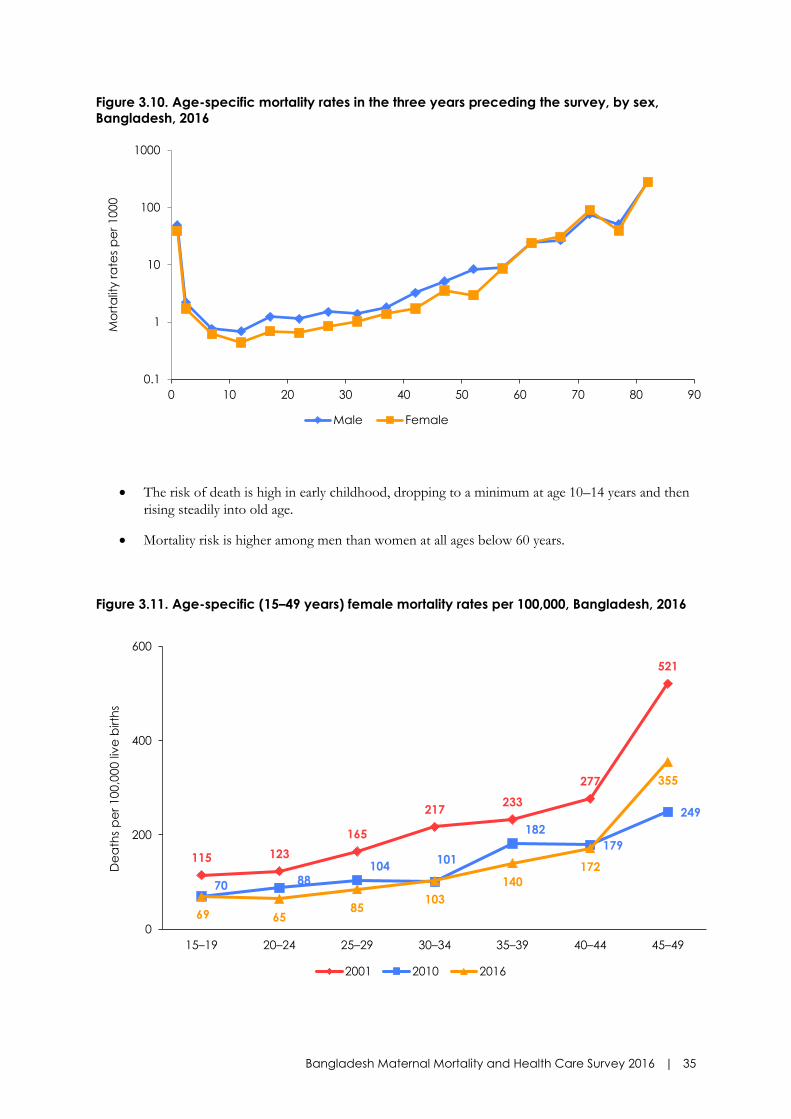
Figure 3.10. Age-specific mortality rates in the three years preceding the survey, by sex,
Bangladesh, 2016
• The risk of death is high in early childhood, dropping to a minimum at age 10–14 years and then
rising steadily into old age.
• Mortality risk is higher among men than women at all ages below 60 years.
Figure 3.11. Age-specific (15–49 years) female mortality rates per 100,000, Bangladesh, 2016
0.1
1
10
100
1000
0 10 20 30 40 50 60 70 80 90
Mo
rta
lity r
ate
s p
er
10
00
Male Female
115 123
165
217233
277
521
70 88104
101
182
179
249
69 6585
103
140
172
355
0
200
400
600
15–19 20–24 25–29 30–34 35–39 40–44 45–49
De
ath
s p
er
100,0
00 liv
e b
irth
s
2001 2010 2016
36 | Bangladesh Maternal Mortality and Health Care Survey 2016
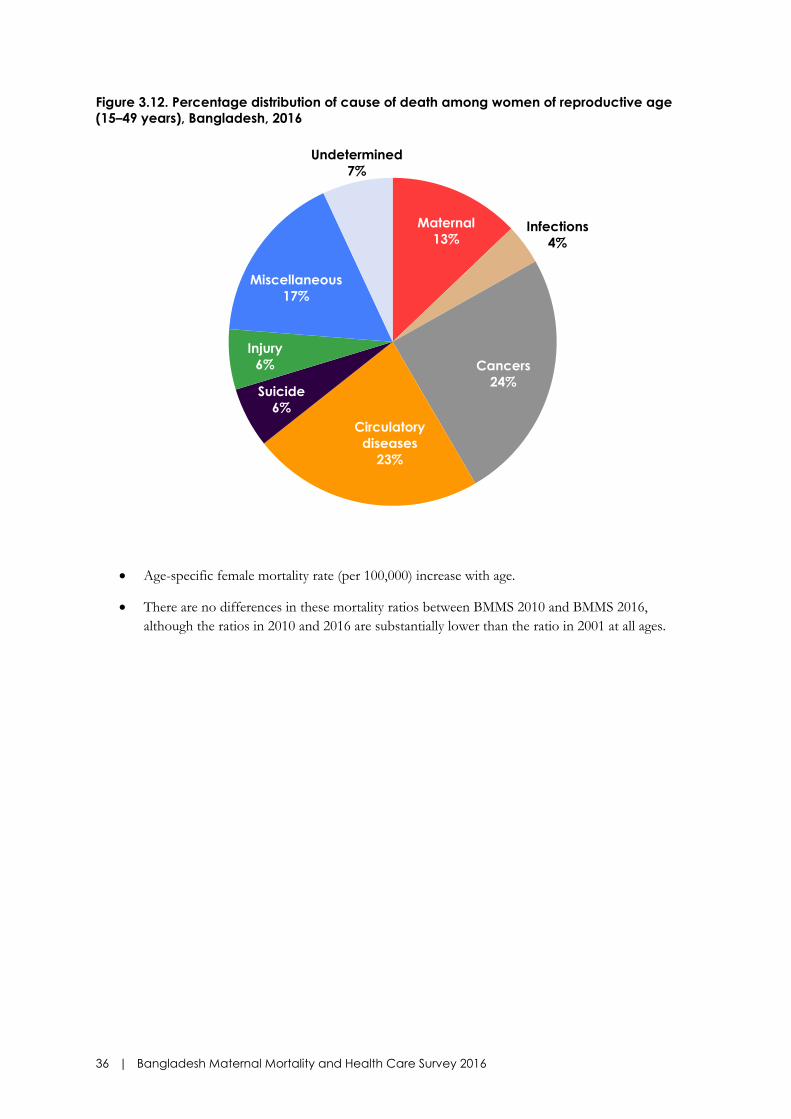
Figure 3.12. Percentage distribution of cause of death among women of reproductive age
(15–49 years), Bangladesh, 2016
• Age-specific female mortality rate (per 100,000) increase with age.
• There are no differences in these mortality ratios between BMMS 2010 and BMMS 2016,
although the ratios in 2010 and 2016 are substantially lower than the ratio in 2001 at all ages.
Maternal
13%Infections
4%
Cancers
24%
Circulatory
diseases
23%
Suicide
6%
Injury
6%
Miscellaneous
17%
Undetermined
7%

Bangladesh Maternal Mortality and Health Care Survey 2016 | 37
Table 3.5. Cause-specific mortality rates for the three years before the survey, by age,
Bangladesh, 2016.
• Cancers (24%) and circulatory diseases (23%) are the major causes of adult female deaths in
Bangladesh, particularly among women ages 35 years and above.
• Around 13% of all adult female deaths (15–49 years) are due to maternal causes. Maternal deaths
are most common among women ages 20–34 years.
• Injuries, infections, and suicide each account for less than 10% of adult female deaths. Suicide is
the second most common cause of adult female deaths among women ages 15–19 years after
maternal deaths.
Age
Exposure
time
(women-
years) Maternal1 Infections1 Cancers1
Circulatory
disease1 Suicide1
Other
violent
causes1
Miscellaneous
causes1
Not
classified1 Total1
15–19 221,051.023 0.145 0.037 0.063 0.061 0.124 0.058 0.132 0.067 0.686
20–24 190,825.590 0.201 0.026 0.055 0.109 0.070 0.059 0.100 0.018 0.639
25–29 176,606.936 0.192 0.048 0.129 0.082 0.069 0.079 0.154 0.095 0.848
30–34 150,600.872 0.230 0.026 0.278 0.177 0.025 0.032 0.176 0.082 1.025
35–39 123,488.496 0.162 0.069 0.362 0.404 0.074 0.062 0.220 0.040 1.392
40–44 110,372.538 0.026 0.082 0.617 0.504 0.045 0.082 0.288 0.075 1.719
45–49 86,298.287 0.017 0.053 1.223 1.190 0.035 0.135 0.629 0.256 3.537
Total 1,059,243.740 0.154 0.045 0.290 0.268 0.070 0.067 0.203 0.078 1.175
Note: Considers de jure female household population in exposure and gets cause-specific deaths from the verbal
autopsy questionnaire
1Deaths per 1,000 woman-years of exposure

38 | Bangladesh Maternal Mortality and Health Care Survey 2016
Figure 3.13. Percentage distribution of cause of death among women of reproductive age
(15–49 years): Comparison between BMMS 2010 and BMMS 2016
• The proportionate contributions of cancers and circulatory diseases among all adult female
deaths are higher in BMMS 2016 compared to BMMS 2010.
• The proportionate contribution of maternal causes of deaths among all adult female deaths has
largely remained unchanged.
• The proportionate contribution of infections and suicide are marginally lower in BMMS 2016
from the BMMS 2010 estimates.
14
9
21
16
9
6
16
9
13
4
24
23
6 6
17
7
2010 2016
Pe
rce
nta
ge

Bangladesh Maternal Mortality and Health Care Survey 2016 | 39
SECTION 4: ANTENATAL CARE
SUMMARY
• Almost three in every four (74 percent) women received at least one antenatal care
(ANC) visit from a medically trained provider. An additional nine percent of women
received ANC from nonmedically trained providers only.
• In the past six years, the uptake of ANC from medically trained providers increased rapidly,
by more than three percentage points per year.
• Thirty-seven percent of women received the recommended number of (4 or more)
antenatal checkups during pregnancy. In 2010, 23 percent had received four or more
ANC checkups.
• The private sector is now the most prominent source of ANC, both in urban and rural areas.
Overall, 58 percent of ANC seekers went to the private sector to receive checkups, while
36 percent used the public sector. The prominence of the public sector as a source of
ANC has declined between BMMS 2010 and 2016.
• A notable proportion of pregnant women (22 percent) were receiving ANC at home.
• Most women who received ANC were weighed (88 percent) and had their blood pressure
measured (91 percent) during pregnancy. Four out of five pregnant women who had ANC
had received an ultrasound. In comparison, women were less likely to have a blood test
(63 percent) or urine test (68 percent) done during ANC.
• The percentage of women who had blood or urine tests done during ANC increased
notably between BMMS 2010 and BMMS 2016, from 37 to 63 percent for blood test and
from 50 to 68 percent for urine test.
• Antenatal care service use has become more equitable. In 2001, the richest women were
3.4 times more likely than the poorest to receive ANC from a medically trained provider; in
2016, this ratio has declined to 1.8.

40 | Bangladesh Maternal Mortality and Health Care Survey 2016
Table 4.1. Antenatal care
Percentage distribution of women ages 15–49 who had a live birth in the three years preceding the survey, by ANC provider during pregnancy, for the most recent
birth, and the percentage receiving antenatal care (ANC) from a medically trained provider, for the most recent birth, according to background characteristics,
Bangladesh 2016
Medically trained provider Percentage receiving:
Background
characteristics
Qualified
doctor
Nurse/
midwife/
paramedic/
FWV CSBA
MA/
SACMO
Community
health
worker1 Other No one Missing Total Any ANC
ANC from
medically
trained
provider
Number
of
women
Mother's age at birth Below 15 56.9 11.0 0.0 0.0 14.2 0.5 17.3 0.0 100.0 82.7 68.0 182
15–19 69.8 5.8 0.2 0.2 8.8 0.7 14.3 0.1 100.0 85.6 76.0 7,307
20–24 69.9 5.2 0.2 0.2 7.7 0.4 16.4 0.1 100.0 83.5 75.5 9,080
25–29 68.6 5.4 0.2 0.2 8.0 0.7 16.8 0.2 100.0 83.1 74.3 6,503
30–34 66.9 4.1 0.4 0.1 9.1 0.7 18.6 0.1 100.0 81.4 71.6 3,043
35–39 61.8 3.0 0.2 0.0 8.3 0.6 25.8 0.2 100.0 74.0 65.0 840
40–44 45.4 5.1 0.0 0.0 11.4 0.0 38.1 0.0 100.0 61.9 50.5 163
45–49 * * * * * * * * * * * 14
Residence Urban 76.3 5.4 0.3 0.1 6.8 0.6 10.4 0.2 100.0 89.5 82.1 7,188
Rural 66.0 5.2 0.2 0.2 8.8 0.6 18.8 0.1 100.0 81.1 71.6 19,945
Division Barisal 58.8 4.5 0.1 0.3 8.8 0.4 27.2 0.0 100.0 72.8 63.7 1,525
Chittagong 70.5 7.2 0.3 0.2 4.2 0.9 16.6 0.1 100.0 83.3 78.2 6,261
Dhaka 73.6 4.4 0.1 0.1 7.8 0.7 13.0 0.2 100.0 86.9 78.3 6,862
Khulna 79.6 3.2 0.1 0.3 6.3 0.2 10.3 0.0 100.0 89.7 83.2 2,546
Mymensingh 55.7 4.4 0.4 0.1 14.9 0.9 23.5 0.1 100.0 76.4 60.7 2,273
Rajshahi 70.6 4.2 0.2 0.2 7.7 0.2 16.9 0.0 100.0 83.1 75.2 2,899
Rangpur 63.6 6.9 0.4 0.1 14.7 0.3 14.0 0.0 100.0 86.0 71.1 2,778
Sylhet 59.2 5.4 0.2 0.1 9.3 1.1 24.5 0.2 100.0 75.3 64.9 1,990

Bangladesh Maternal Mortality and Health Care Survey 2016 | 41
Percentage distribution of women ages 15–49 who had a live birth in the three years preceding the survey, by ANC provider during pregnancy, for the most recent
birth, and the percentage receiving antenatal care (ANC) from a medically trained provider, for the most recent birth, according to background characteristics,
Bangladesh 2016
Medically trained provider Percentage receiving:
Background
characteristics
Qualified
doctor
Nurse/
midwife/
paramedic/
FWV CSBA
MA/
SACMO
Community
health
worker1 Other No one Missing Total Any ANC
ANC from
medically
trained
provider
Number
of
women
Mother's education No education 41.8 6.3 0.1 0.1 13.1 0.8 37.5 0.3 100.0 62.2 48.3 2,293
Primary incomplete 52.5 6.7 0.2 0.4 12.5 0.8 26.6 0.2 100.0 73.2 59.8 4,195
Primary complete 58.3 6.9 0.5 0.1 11.2 1.0 22.0 0.1 100.0 77.9 65.7 4,103
Secondary incomplete 73.8 5.0 0.3 0.2 7.2 0.5 13.0 0.1 100.0 86.9 79.2 11,064
Secondary complete/
higher 89.9 3.1 0.1 0.1 3.1 0.3 3.5 0.0 100.0 96.5 93.2 5,478
Wealth quintile Lowest 43.4 7.3 0.5 0.2 14.2 1.1 33.3 0.1 100.0 66.6 51.3 5,451
Second 60.0 5.9 0.3 0.2 10.5 0.6 22.3 0.1 100.0 77.6 66.4 5,513
Middle 72.8 5.1 0.2 0.1 7.3 0.4 13.9 0.1 100.0 86.0 78.3 5,350
Fourth 78.2 4.7 0.2 0.2 6.1 0.7 9.9 0.1 100.0 90.0 83.2 5,592
Highest 90.1 3.1 0.1 0.1 3.2 0.2 3.1 0.1 100.0 96.8 93.4 5,227
Total 68.7 5.3 0.2 0.2 8.3 0.6 16.6 0.1 100.0 83.3 74.4 27,133
Note: If more than one source of ANC was mentioned, only the provider with the highest qualification is considered in the tabulation. 1Included community health care provider, health assistant (HA), family welfare assistance (FWA), and nongovernmental organization (NGO) health providers
FWV=family welfare visitor; CSBA = community skilled birth attendant; MA = medical assistant; SACMO = sub-assistant community medical officer.

42 | Bangladesh Maternal Mortality and Health Care Survey 2016
Figure 4.1. Trends in ANC from a medically trained provider, BMMS 2001, 2010, and 2016
• Three out of four women sought ANC from a medically trained provider in 2016 (Figure 4.1).
• Women in the age group 15–24 are most likely to seek ANC from a medically trained provider
(Table 4.1).
• The likelihood of receiving ANC from a medically trained provider was positively associated with
women’s education and household wealth.
• A higher proportion of urban women (82 percent) sought ANC from a medically trained
provider than their rural counterparts (72 percent).
• In the past six years, ANC from a medically trained provider increased by 3.1 percentage points
per year. In comparison, between BMMS 2001 and BMMS 2010, the increase in ANC from a
medically trained provider was slower, at 1.7 percentage points per year (Figure 4.1).
40
55
74
BMMS 2001 BMMS 2010 BMMS 2016
Pe
rce
nta
ge

Bangladesh Maternal Mortality and Health Care Survey 2016 | 43
Table 4.2. Number of antenatal care visits and timing of first visit
Percentage distribution of women ages 15–49 who had a live birth in the three years preceding the
survey by number of antenatal care visits for the most recent live birth and by the timing of first visit,
according to residence, Bangladesh 2016
Residence Number and timing of ANC visits Urban Rural Total
Number of ANC visits None 10.4 18.8 16.6
1 10.3 14.6 13.5
2 14.1 17.9 16.9
3 16.2 15.5 15.7
4+ 48.8 33.1 37.2
Don't know/missing 0.1 0.1 0.1
Total 100.0 100.0 100.0
Median number of visits (for those with ANC) 3.8 3.0 3.3
Number of women 7,188 19,945 27,133
Number of months pregnant at time of first ANC visit No antenatal care 10.4 18.8 16.6
<4 39.4 25.9 29.4
4–5 28.7 26.2 26.8
6–7 15.2 20.1 18.8
8+ 5.9 8.9 8.1
Don't know/missing 0.4 0.1 0.2
Total 100.0 100.0 100.0
Median months pregnant at first visit (for those with ANC) 3.9 4.7 4.5
Number of women with ANC1 6,435 16,182 22,617 1 Includes those with missing response about ANC provider

44 | Bangladesh Maternal Mortality and Health Care Survey 2016
Figure 4.2. Trends in women who receive four or more antenatal care visits, BMMS 2001, 2010,
and 2016
• Thirty-seven percent of women are receiving the recommended four or more ANC visits during
pregnancy.
• Almost half of urban women surveyed received at least four ANC visits, compared to one-third
of rural women.
• In urban areas, women received their first ANC a bit earlier (3.9 months) than their rural
counterparts (4.7 months).
• The percentage of women receiving four or more ANC increased by 14 percentage points in the
past six years (Figure 4.2).
12
23
37
BMMS 2001 BMMS 2010 BMMS 2016
Pe
rce
nta
ge

Bangladesh Maternal Mortality and Health Care Survey 2016 | 45
Table 4.3. Place of antenatal care
Among women ages 15-49 who had a live birth in the three years preceding the survey, the
percentage who received antenatal care (ANC) during the pregnancy associated with the most
recent birth, by place of ANC, according to background characteristics, Bangladesh 2016
Place of antenatal care1
Background characteristics Home
Public
sector
Private
sector
NGO
sector Other
Number of
women
(who
received
ANC)
Mother's age at birth Below 15 24.5 43.7 41.6 12.7 1.2 151
15–19 24.3 37.1 56.7 10.5 0.7 6,254
20–24 20.4 37.0 58.2 10.6 0.6 7,585
25–29 21.5 35.1 58.9 9.5 0.6 5,402
30–34 20.2 34.8 57.4 10.4 0.4 2,477
35–39 21.7 33.9 58.7 9.2 0.3 621
40–44 28.2 42.6 46.9 4.7 0.0 101
45–49 * * * * * 11
Birth order 1 21.0 36.7 60.2 10.7 0.7 9,283
2–3 21.8 35.9 57.3 10.1 0.6 11,094
4–5 25.1 36.4 50.8 8.8 0.5 1,941
6+ 26.2 41.5 40.1 9.8 0.6 284
Residence Urban 15.0 33.2 54.3 19.2 0.8 6,430
Rural 24.5 37.6 59.1 6.7 0.5 16,173
Division Barisal 19.4 45.0 48.6 5.4 0.1 1,111
Chittagong 11.7 28.4 64.9 10.5 1.0 5,214
Dhaka 12.9 31.2 60.6 13.0 0.7 5,961
Khulna 26.7 43.7 59.3 10.1 0.0 2,284
Mymensingh 38.5 38.1 49.9 8.1 0.3 1,737
Rajshahi 26.4 41.1 58.4 6.1 0.1 2,409
Rangpur 50.4 48.0 45.6 12.1 0.4 2,389
Sylhet 14.5 38.4 52.6 8.6 1.5 1,497
Mother's education No Education 28.7 36.8 40.5 14.7 1.2 1,427
Primary incomplete 27.1 41.7 44.2 11.4 0.5 3,071
Primary complete 24.7 39.2 49.1 11.1 1.0 3,197
Secondary incomplete 22.3 36.1 60.3 9.7 0.5 9,619
Secondary complete/higher 14.4 31.7 70.7 8.9 0.4 5,289
Wealth quintile Lowest 32.2 45.4 40.7 6.9 0.6 3,630
Second 30.8 41.5 52.2 8.4 0.4 4,277
Middle 23.4 39.1 59.0 8.3 0.7 4,602
Fourth 17.6 33.2 61.4 13.2 0.5 5,032
Highest 9.6 26.1 69.8 13.2 0.8 5,062
Total 21.8 36.3 57.7 10.3 0.6 22,603 1 Multiple responses possible

46 | Bangladesh Maternal Mortality and Health Care Survey 2016
• The private sector is the most prominent source of ANC, both in urban and rural areas. Overall,
almost three out of five women sought ANC from the private health sector (Table 4.3). Six years
ago, the public sector was the most prominent source of ANC for rural women, and the private
sector for urban women.
• Twenty-two percent of women received ANC at home; women in Rangpur Division are most
likely to receive ANC at home (50 percent). The percentage of women who received ANC at
home increased slightly since 2010.

Bangladesh Maternal Mortality and Health Care Survey 2016 | 47
Table 4.4. Components of antenatal care
Percentage of women ages 15–49 with a live birth in the three years preceding the survey, who
received specific antenatal care services for the most recent birth, according to background
characteristics, Bangladesh 2016
Procedure performed during antenatal care
Background characteristics
Blood
pressure
measured
Urine
tested
Blood
test
done Weighed Ultrasound
Number of
women
(who
received
ANC)
Mother's age at birth Below 15 86.0 59.1 47.6 81.8 65.9 151
15–19 90.1 67.1 62.4 87.1 80.1 6,254
20–24 91.8 68.5 63.4 88.1 80.4 7,585
25–29 92.4 68.7 63.8 88.1 81.3 5,402
30–34 91.8 68.8 62.9 86.8 79.2 2,477
35–39 91.9 65.5 62.2 88.8 78.3 621
40–44 90.1 61.2 53.3 86.6 69.3 101
45–49 * * * * * 11
Birth order 1 92.2 72.0 68.3 89.6 84.4 9,283
2–3 91.5 67.1 61.5 87.3 79.3 11,094
4–5 87.9 57.0 48.9 81.6 67.7 1,941
6+ 87.6 51.5 40.3 81.3 62.3 284
Residence Urban 94.0 74.9 71.5 90.4 84.7 6,430
Rural 90.4 65.2 59.6 86.6 78.4 16,173
Division Barisal 93.5 68.1 64.3 89.2 74.8 1,111
Chittagong 90.3 71.6 65.9 87.3 79.6 5,214
Dhaka 90.3 71.4 68.6 87.1 87.5 5,961
Khulna 92.5 66.6 64.0 91.4 85.9 2,284
Mymensingh 93.7 61.1 52.7 83.8 70.4 1,737
Rajshahi 87.6 59.1 55.3 87.3 84.3 2,409
Rangpur 96.5 62.5 55.4 89.6 69.0 2,389
Sylhet 92.0 75.1 64.3 86.2 71.1 1,497
Mother's education No education 87.8 53.3 44.5 78.5 62.1 1,427
Primary incomplete 88.0 55.3 48.3 81.7 65.6 3,071
Primary complete 88.5 60.4 52.8 84.0 73.0 3,197
Secondary incomplete 91.2 68.1 63.1 88.3 82.8 9,619
Secondary complete/higher 96.4 83.8 82.4 94.7 93.2 5,289
Wealth quintile Lowest 89.1 52.5 43.3 81.0 57.6 3,630
Second 89.0 57.9 51.3 84.4 73.4 4,277
Middle 89.8 66.3 61.2 87.0 81.4 4,602
Fourth 92.2 72.0 68.1 89.2 87.0 5,032
Highest 95.8 85.2 83.5 94.2 94.2 5,062
Total 91.4 68.0 63.0 87.7 80.2 22,603

48 | Bangladesh Maternal Mortality and Health Care Survey 2016
Figure 4.3. Trends in components of ANC, BMMS 2010 and 2016
• Most women (88 percent) were weighed and had blood pressure measured (91 percent)
during pregnancy (Table 4.4).
• Eight out of ten women reported having ultrasound done during pregnancy (Table 4.4).
• Interestingly, urine or blood testing were less likely to be done during pregnancy than
ultrasound. However, between BMMS 2010 and 2016, the percentage of women who had a
urine or blood test increased considerably, from 50 to 68 percent for urine tests and 37 to 63
percent for blood tests (Figure 4.3).
91
84
50
37
9188
6863
Blood pressure
measured
Weighed Urine tested Blood tested
Pe
rce
nta
ge
BMMS 2010 BMMS 2016

Bangladesh Maternal Mortality and Health Care Survey 2016 | 49
Figure 4.4. Trends in ANC from a medically trained provider, by wealth quintile, BMMS 2001,
2010, and 2016
• The poor-rich inequity (measured by the ratio of ANC use among women in the poorest wealth
quintile households to ANC use among women in the richest wealth quintile households) has
been declining.
• In 2001, the richest women were 3.4 times more likely to receive ANC from a medically trained
provider than the poorest; in 2016 the richest were 1.8 times more likely than the poorest to
receive ANC. The absolute gap in ANC use between the richest and the poorest has also reduced
between 2010 and 2016 (Figure 4.4).
22
31
51
75
82
93
BMMS 2001 BMMS 2010 BMMS 2016
Pe
rce
nta
ge
Poorest Richest
Richest 1.8
times higher
use than the
poorest
Richest 2.6
times higher
use than the
poorest
Richest 3.4
times higher
use than the
poorest

50 | Bangladesh Maternal Mortality and Health Care Survey 2016
SUMMARY
• Bangladesh achieved the HPNSDP target of 50 percent of births attended by a medically
trained provider by 2016.
• Delivery by trained providers increased from 27 percent in BMMS 2010 to 50 percent in
BMMS 2016; the increase was predominantly caused by the rise in facility deliveries from 23
percent to 47 percent.
• Facility deliveries increased at a rate of four percentage points per year between 2010
and 2016 surveys. The increase in facility delivery was much slower (1.6 percentage points
per year) between BMMS 2001 and BMMS 2010.
• Private health facilities account for 29 percent of all deliveries, while 14 percent and four
percent of births now occur at government and NGO facilities, respectively. In 2010, the
private and public health facilities accounted for similar percentages of deliveries, with 11
percent at private and 10 percent at public facilities. In 2016, deliveries at private facilities
were more than two times higher than deliveries at public sector health facilities (29
percent versus 14 percent).
• Deliveries by Cesarean section (C-section) increased from 12 percent to 31 percent in the
past six years.
• Thirty-one percent of all births are through C-section. Eighty-three percent of births in
private facilities are by C-section. The proportion of births in government and NGO facilities
that are by C-section is much lower: 35 percent in government and 39 percent in NGO
facilities.
• The poor-rich inequity in use of facilities for delivery has declined; yet women in the richest
quintile are 3.4 times more likely to deliver in a facility, compared to women in the poorest
quintile. The absolute percentage difference in use of facility for delivery between the
poorest and richest women is very large—54 percentage points.
• Birth planning among women who gave birth has improved between BMMS 2010 and
BMMS 2016. Prearrangement of money for emergency by households increased from 35
percent in 2010 to 54 percent in 2016, while prearrangement of transport for emergency
doubled from 10 percent in 2010 to 21 percent in 2016.
SECTION 5: DELIVERY CARE

Bangladesh Maternal Mortality and Health Care Survey 2016 | 51
Table 5.1. Place of delivery
Percentage distribution of live births in the three years preceding the survey by place of delivery and
percentage delivered in a health facility, according to background characteristics, Bangladesh 2016
Health facility
Background characteristics Public Private NGO Home
Other/
missing Total
Percentage
delivered in
a health
facility1
Number
of births
Mother's age at birth Below 15 18.0 19.0 1.1 61.7 0.2 100.0 38.1 202
15–19 15.1 28.6 3.5 52.3 0.4 100.0 47.2 7,821
20–24 14.2 30.2 3.9 51.3 0.4 100.0 48.3 9,561
25–29 13.8 29.6 3.5 52.8 0.3 100.0 46.9 6,772
30–34 13.8 29.1 3.3 53.1 0.6 100.0 46.3 3,144
35–39 11.9 27.5 3.1 56.8 0.8 100.0 42.4 868
40–44 16.8 16.1 3.0 63.6 0.5 100.0 35.9 167
45–49 * * * * * * * 14
Birth order 1 17.0 36.1 4.3 42.2 0.4 100.0 57.4 11,119
2–3 13.2 27.5 3.4 55.5 0.5 100.0 44.0 14,090
4-5 9.5 14.9 2.4 73.0 0.2 100.0 26.8 2,790
6+ 9.9 9.4 2.0 78.5 0.2 100.0 21.3 549
Residence Urban 17.8 33.5 8.2 39.9 0.6 100.0 59.5 7,477
Rural 13.0 27.7 2.0 56.9 0.4 100.0 42.7 21,071
Division Barisal 11.1 21.0 1.6 66.3 0.0 100.0 33.7 1,598
Chittagong 10.5 27.0 4.1 57.6 0.8 100.0 41.7 6,609
Dhaka 14.4 37.4 5.6 42.1 0.5 100.0 57.4 7,145
Khulna 18.6 40.1 3.0 38.0 0.2 100.0 61.8 2,650
Mymensingh 11.7 18.5 1.5 68.0 0.3 100.0 31.7 2,416
Rajshahi 17.1 31.6 1.9 49.3 0.1 100.0 50.6 3,030
Rangpur 17.7 25.0 3.4 53.6 0.3 100.0 46.1 2,915
Sylhet 16.4 16.2 2.8 63.9 0.6 100.0 35.5 2,186
Mother's education No education 9.5 10.6 3.9 75.3 0.6 100.0 24.1 2,447
Primary incomplete 11.8 14.0 3.4 70.4 0.5 100.0 29.2 4,455
Primary complete 12.8 19.0 3.4 64.3 0.4 100.0 35.3 4,350
Secondary incomplete 15.5 31.2 3.2 49.7 0.3 100.0 50.0 11,600
Secondary complete/higher 16.8 53.0 4.4 25.2 0.6 100.0 74.3 5,696
Wealth quintile Lowest 9.9 11.2 1.1 77.5 0.3 100.0 22.3 5,830
Second 14.2 20.8 1.6 63.0 0.5 100.0 36.5 5,836
Middle 14.8 29.3 2.7 53.0 0.2 100.0 46.8 5,607
Fourth 16.3 34.6 5.3 43.2 0.5 100.0 56.3 5,852
Highest 16.3 51.8 7.5 23.7 0.7 100.0 75.6 5,423
Total 14.3 29.2 3.6 52.5 0.4 100.0 47.1 28,548 1 Includes public, private & NGO facility but excludes other
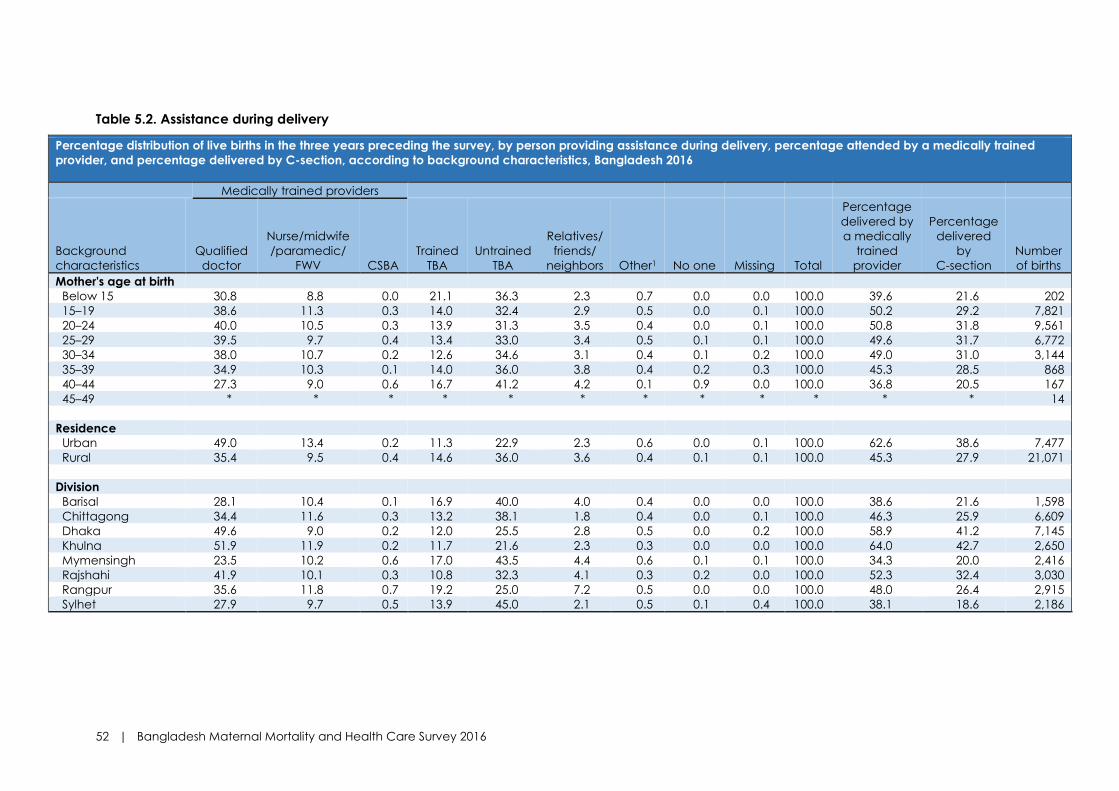
52 | Bangladesh Maternal Mortality and Health Care Survey 2016
Table 5.2. Assistance during delivery Percentage distribution of live births in the three years preceding the survey, by person providing assistance during delivery, percentage attended by a medically trained
provider, and percentage delivered by C-section, according to background characteristics, Bangladesh 2016
Medically trained providers
Background
characteristics
Qualified
doctor
Nurse/midwife
/paramedic/
FWV CSBA
Trained
TBA
Untrained
TBA
Relatives/
friends/
neighbors Other1 No one Missing Total
Percentage
delivered by
a medically
trained
provider
Percentage
delivered
by
C-section
Number
of births
Mother's age at birth Below 15 30.8 8.8 0.0 21.1 36.3 2.3 0.7 0.0 0.0 100.0 39.6 21.6 202
15–19 38.6 11.3 0.3 14.0 32.4 2.9 0.5 0.0 0.1 100.0 50.2 29.2 7,821
20–24 40.0 10.5 0.3 13.9 31.3 3.5 0.4 0.0 0.1 100.0 50.8 31.8 9,561
25–29 39.5 9.7 0.4 13.4 33.0 3.4 0.5 0.1 0.1 100.0 49.6 31.7 6,772
30–34 38.0 10.7 0.2 12.6 34.6 3.1 0.4 0.1 0.2 100.0 49.0 31.0 3,144
35–39 34.9 10.3 0.1 14.0 36.0 3.8 0.4 0.2 0.3 100.0 45.3 28.5 868
40–44 27.3 9.0 0.6 16.7 41.2 4.2 0.1 0.9 0.0 100.0 36.8 20.5 167
45–49 * * * * * * * * * * * * 14
Residence Urban 49.0 13.4 0.2 11.3 22.9 2.3 0.6 0.0 0.1 100.0 62.6 38.6 7,477
Rural 35.4 9.5 0.4 14.6 36.0 3.6 0.4 0.1 0.1 100.0 45.3 27.9 21,071
Division Barisal 28.1 10.4 0.1 16.9 40.0 4.0 0.4 0.0 0.0 100.0 38.6 21.6 1,598
Chittagong 34.4 11.6 0.3 13.2 38.1 1.8 0.4 0.0 0.1 100.0 46.3 25.9 6,609
Dhaka 49.6 9.0 0.2 12.0 25.5 2.8 0.5 0.0 0.2 100.0 58.9 41.2 7,145
Khulna 51.9 11.9 0.2 11.7 21.6 2.3 0.3 0.0 0.0 100.0 64.0 42.7 2,650
Mymensingh 23.5 10.2 0.6 17.0 43.5 4.4 0.6 0.1 0.1 100.0 34.3 20.0 2,416
Rajshahi 41.9 10.1 0.3 10.8 32.3 4.1 0.3 0.2 0.0 100.0 52.3 32.4 3,030
Rangpur 35.6 11.8 0.7 19.2 25.0 7.2 0.5 0.0 0.0 100.0 48.0 26.4 2,915
Sylhet 27.9 9.7 0.5 13.9 45.0 2.1 0.5 0.1 0.4 100.0 38.1 18.6 2,186

Bangladesh Maternal Mortality and Health Care Survey 2016 | 53
Percentage distribution of live births in the three years preceding the survey, by person providing assistance during delivery, percentage attended by a medically trained
provider, and percentage delivered by C-section, according to background characteristics, Bangladesh 2016
Medically trained providers
Background
characteristics
Qualified
doctor
Nurse/midwife
/paramedic/
FWV CSBA
Trained
TBA
Untrained
TBA
Relatives/
friends/
neighbors Other1 No one Missing Total
Percentage
delivered by
a medically
trained
provider
Percentage
delivered
by
C-section
Number
of births
Mother's education No Education 16.9 9.0 0.1 14.7 52.8 5.3 0.6 0.2 0.3 100.0 26.1 11.8 2,447
Primary incomplete 21.4 9.0 0.3 16.7 47.7 4.2 0.5 0.2 0.2 100.0 30.6 15.7 4,455
Primary complete 27.1 10.2 0.2 16.5 41.5 3.9 0.6 0.0 0.1 100.0 37.4 19.7 4,350
Secondary
incomplete 41.3 11.3 0.4 13.9 29.5 3.2 0.4 0.0 0.1 100.0 52.9 32.0 11,600
Secondary
complete/higher 66.6 11.1 0.4 8.6 11.6 1.4 0.1 0.0 0.1 100.0 78.2 56.4 5,696
Wealth quintile Lowest 16.4 7.7 0.5 17.3 53.1 4.6 0.3 0.1 0.1 100.0 24.6 11.5 5,830
Second 28.3 10.6 0.4 15.6 40.0 4.5 0.6 0.1 0.1 100.0 39.2 21.3 5,836
Middle 38.0 11.1 0.3 14.8 31.9 3.4 0.4 0.1 0.1 100.0 49.5 29.6 5,607
Fourth 46.7 12.5 0.3 12.7 24.5 2.5 0.5 0.1 0.2 100.0 59.5 36.9 5,852
Highest 67.4 10.7 0.2 7.9 12.0 1.3 0.4 0.0 0.1 100.0 78.3 56.0 5,423
Total 39.0 10.5 0.3 13.7 32.6 3.3 0.4 0.1 0.1 100.0 49.8 30.7 28,548
Note: If the respondent mentioned more than one person attending during delivery, only the most qualified person is considered in the tabulation. 1 'Other' includes MA/SACMO, community health care provider, HA, FWA, NGO workers, unqualified doctor, and 'other.'
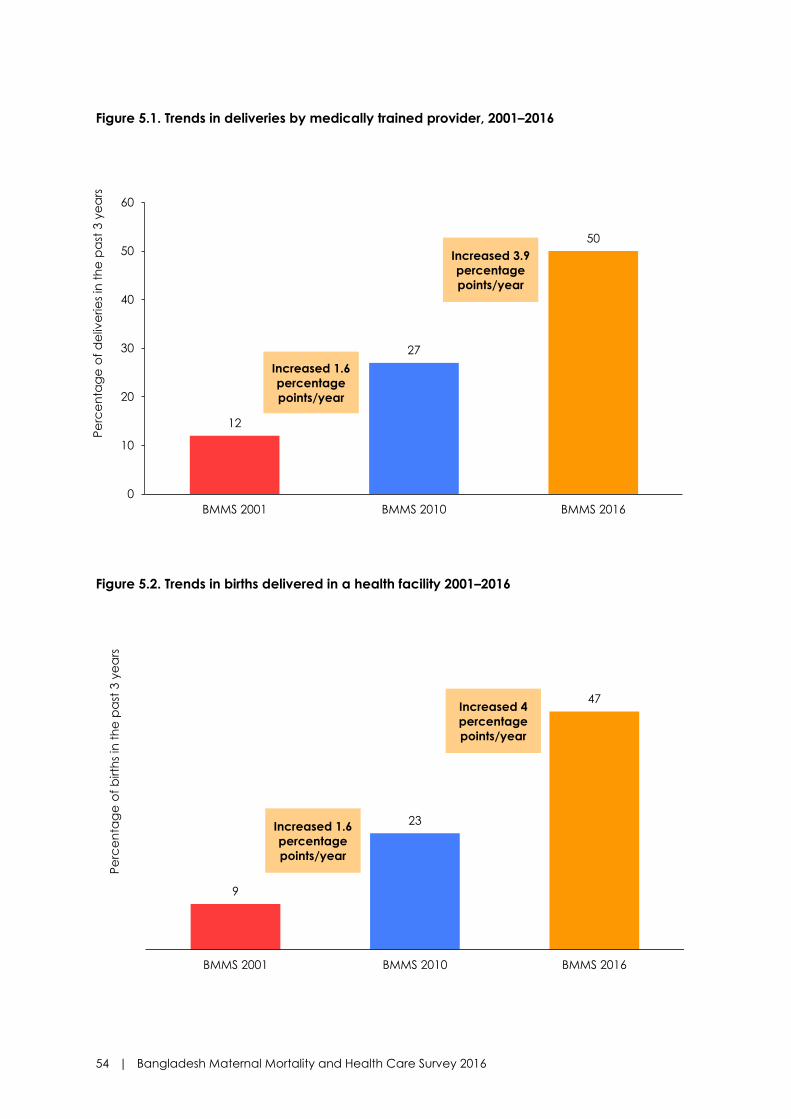
54 | Bangladesh Maternal Mortality and Health Care Survey 2016
Figure 5.1. Trends in deliveries by medically trained provider, 2001–2016
Figure 5.2. Trends in births delivered in a health facility 2001–2016
12
27
50
0
10
20
30
40
50
60
BMMS 2001 BMMS 2010 BMMS 2016
Pe
rce
nta
ge
of
de
live
rie
s in
th
e p
ast
3 y
ea
rs
Increased 3.9
percentage
points/year
Increased 1.6
percentage
points/year
9
23
47
BMMS 2001 BMMS 2010 BMMS 2016
Pe
rce
nta
ge
of
birth
s in
th
e p
ast
3 y
ea
rs
Increased 4
percentage
points/year
Increased 1.6
percentage
points/year

Bangladesh Maternal Mortality and Health Care Survey 2016 | 55
Figure 5.3. Change in facility deliveries by type of facility
Figure 5.4. Trends in facility delivery in the past 4 years
Public Private NGO
1014
11
29
2
4
BMMS 2010 BMMS 2016
Pe
rce
nta
ge
of
fac
ility
de
live
rie
s in
th
e p
ast
3 y
ea
rs
Public Private NGO
Increased 2
percentage points
Increased 18
percentage points
Increased 4
percentage points
14 14 15 14
2427
29 32
43
44
2013 2014 2015 2016
Pe
rce
nta
ge
of
fac
ility
de
live
rie
s
Public Private NGO
50 48
44 42
23
47

56 | Bangladesh Maternal Mortality and Health Care Survey 2016
• Delivery by medically trained providers in Bangladesh has reached 50 percent (Table 5.2).
• Births attended by medically trained provider were more common among women in urban areas
(63 percent), women who have completed secondary or higher education (78 percent), or women
in the highest wealth quintile (78 percent). Women of Khulna Division (64 percent) had the
highest proportion of births assisted by medically trained providers, while the proportion was the
lowest in Mymensingh Division (34 percent).
• Medically assisted births increased more rapidly in recent years—an average increase of about 4
percentage points per year between BMMS 2010 and BMMS 2016, compared to only 1.6
percentage points per year between BMMS 2001 and BMMS 2010 (Figure 5.1).
• Forty-seven percent of the births occurred at health facilities, mostly (29 percent) in private
facilities (Table 5.1).
• Facility delivery was more common among the first order births (57 percent), in urban areas (60
percent), or in Khulna Division (62 percent). Mothers’ educational level and household wealth
quintile are positively associated with facility delivery.
• The percentage of deliveries at health facilities doubled in the past six years, increasing from 23
percent to 47 percent (Figure 5.2).
• The private sector accounts for most of the increase in facility delivery in recent years. Between
the BMMS 2010 and BMMS 2016, delivery at private health facilities increased from 11 percent
to 29 percent (Figure 5.3).
• In 2010, the private and public health facilities accounted for similar percentages of deliveries,
11 percent at public and 10 percent at private facilities. In 2016, deliveries at private facilities were
more than two times higher than deliveries at public sector health facilities (29 percent versus
14 percent).
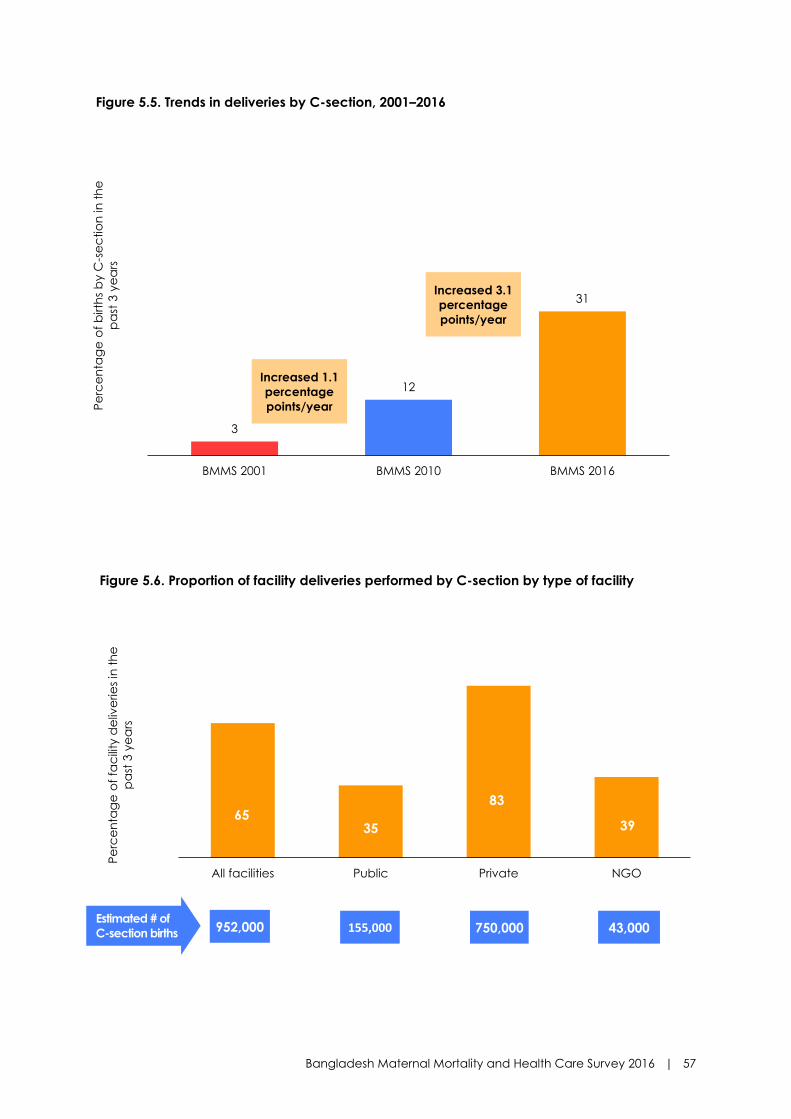
Bangladesh Maternal Mortality and Health Care Survey 2016 | 57
Figure 5.5. Trends in deliveries by C-section, 2001–2016
Figure 5.6. Proportion of facility deliveries performed by C-section by type of facility
3
12
31
BMMS 2001 BMMS 2010 BMMS 2016
Pe
rce
nta
ge
of
birth
s b
y C
-se
ctio
n in
th
e
pa
st 3
ye
ars
Increased 3.1
percentage
points/year
Increased 1.1
percentage
points/year
6535
83
39
All facilities Public Private NGO
Pe
rce
nta
ge
of
fac
ility
de
live
rie
s in
th
e
pa
st 3
ye
ars
43,000 750,000 155,000 952,000 Estimated # of
C-section births

58 | Bangladesh Maternal Mortality and Health Care Survey 2016
• Almost one in three deliveries was performed by C-section (Table 5.2).
• Rates of C-section rise with increase in household wealth and women’s education. More than half
(56%) of the women in the richest households, and those who have at least completed secondary
education, delivered by C-section. Rates of C-section were higher in urban than rural areas.
Among the eight divisions, C-section rates were the highest in Dhaka and Khulna Divisions, at
41% and 43%, respectively.
• Deliveries performed by C-section increased steeply in the past 6 years, from 12 percent to 31
percent. This translates into 3.1 percentage points increase per year between BMMS 2010 and
BMMS 2016. In comparison, C-section rate increase was slower, at 1.1 percentage point per year
between 2001 and 2010 (Figure 5.5).
• Two in three facility deliveries were performed by C-section (Figure 5.6).
• The private sector contributed the largest share of C-sections. More than four in five deliveries
(83 percent) performed in private hospitals and clinics were by C-section.
• Of the 3.1 million annual births in Bangladesh, 952,000 are conducted by C-section, of which
private hospitals and clinics performed 750,000 each year.

Bangladesh Maternal Mortality and Health Care Survey 2016 | 59
Figure 5.7. Poor-rich inequity in use of health facilities for delivery, 2001–2016
• The poor-rich inequity in use of health facilities for child delivery continues to decline.
Bangladesh has successfully achieved the HPNSDP target of narrowing the gap between the
poorest and the richest in using facility delivery to less than 1 to 4 (Figure 5.7).
• According to BMMS 2016, 22 percent of births by women in the poorest wealth quintile were in
a health facility, compared to 76 percent of births in the richest quintile. This translates to a poor-
rich ratio of 1 to 3.5. The corresponding ratios in 2001 and 2010 are 1 to 10 and 1 to 6.6,
respectively.
• However, the absolute gap in use of health facility for delivery between the poorest and richest
household is very large—a difference of 54 percentage points.
2.57.5
22.3
30.4
52.8
75.6
BMMS 2001 BMMS 2010 BMMS 2016
Pe
rce
nta
ge
of
fac
ility
de
live
rie
s in
th
e
pa
st 3
ye
ars
Poorest Richest
Richest 3.4
times higher
use than the
poorest
Richest 7
times higher
use than the
poorest
Richest 12.2
times higher
use than the
poorest

60 | Bangladesh Maternal Mortality and Health Care Survey 2016
Table 5.3. Prearrangements for emergency during pregnancy and delivery
Percentage of women who had prearranged funds, prearranged transport for emergency with delivery or
pregnancy for most recent live births in the three years preceding the survey, Bangladesh 2016
Background characteristics
Had prearranged funds for
emergency with delivery or
pregnancy
Had prearranged transport
for emergency with
delivery or pregnancy
Number of
women
Mother's age at birth
Below 15 53.0 18.0 182
15–19 51.2 19.2 7,307
20–24 54.4 20.8 9,080
25–29 56.2 23.1 6,503
30–34 52.5 20.1 3,043
35–39 50.7 18.0 840
40–44 39.4 10.3 163
45–49 * * 14
Birth order
1 56.2 23.0 10,398
2–3 54.6 20.9 13,506
4-5 42.5 12.7 2,697
6+ 31.7 9.3 532
Residence
Urban 61.0 23.4 7,188
Rural 50.8 19.7 19,945
Division
Barisal 47.6 18.5 1,525
Chittagong 51.6 19.5 6,261
Dhaka 59.3 22.0 6,862
Khulna 53.5 22.9 2,546
Mymensingh 53.1 18.2 2,273
Rajshahi 51.8 20.2 2,899
Rangpur 52.7 20.5 2,778
Sylhet 48.4 22.4 1,990
Mother’s education
No education 37.2 9.8 2,293
Primary incomplete 42.5 12.8 4,195
Primary complete 46.3 15.1 4,103
Secondary incomplete 55.2 21.6 11,064
Secondary complete/higher 70.9 33.6 5,478
Wealth quintile
Lowest 37.9 11.8 5,451
Second 43.3 15.4 5,513
Middle 52.6 20.0 5,350
Fourth 62.0 24.1 5,592
Highest 72.6 32.5 5,227
Total 53.5 20.7 27,133

Bangladesh Maternal Mortality and Health Care Survey 2016 | 61
Figure 5.8. Prearrangements for emergency during pregnancy and delivery, 2010–2016
• Over half of the women who delivered in past three years had prearranged funds to face an
emergency related to pregnancy and delivery (Table 5.3).
• Only one in five women who delivered had prearranged transport to meet an emergency need.
• Prearrangement of funds and transport are positively associated with household wealth and
women’s education. Urban households were more likely to prearrange funds and transport than
rural households. Households in Dhaka Division were more likely to prearrange funds (59
percent), while those in Barisal (47 percent) were least likely to do so. Prearrangement for
transport did not vary much by divisions. Prearrangement of funds and transport were both
higher for birth order 1–3 than 3+.
• Birth planning improved in the past six years. The proportion of women who reported having
prearranged funds for an emergency increased from 35 percent in 2010 to 54 percent in 2016.
While the proportion of women with prearranged transport for an emergency doubled from 10
percent in 2010 to 21 percent in 2016 (Figure 5.8).
35
10
54
21
Prearranged funds Prearranged transport
Pe
rce
nta
ge
of
mo
st r
ec
en
t b
irth
s in
th
e
pa
st 3
ye
ars
BMMS 2010 BMMS 2016

62 | Bangladesh Maternal Mortality and Health Care Survey 2016
SUMMARY
• About half (48 percent) of women who delivered a baby during 2014–2016 received PNC
from a medically trained provider within two days of delivery.
• Postnatal care coverage has been increasing sharply; PNC by a medically trained
provider has increased from 11 percent in 2001, to 23 percent in 2010, and to 48 percent
in 2016. Postnatal care by a nonmedically trained provider also increased from six
percent, to 10 percent, and to 18 percent during the same periods.
• Only six percent of women who delivered at home received PNC from a medically
trained provider.
• The percentage of women who received the complete maternity care (ANC, delivery
care, and PNC within two days, from a medically trained provider) has increased
significantly from five percent in BMMS 2001, to 19 percent in BMMS 2010, and to 43
percent in BMMS 2016.
SECTION 6: POSTNATAL CARE

Bangladesh Maternal Mortality and Health Care Survey 2016 | 63
Table 6.1. Timing of first postnatal checkup for the mother
Percentage distribution of women ages 15–49 who had a live birth in the three years preceding the survey, by time after delivery of the mother's first postnatal checkup for the last live birth, the percentage who had a postnatal checkup within two days of delivery from any provider, and the percentage who had a postnatal checkup within two days of delivery, from a medically trained provider, according to background characteristics, Bangladesh 2016
Timing after delivery of mother's first
postnatal checkup
Background
characteristics
<4
hours
4–23
hours
Within
1–2
days
Within 2
months1
Timing
missing
No
postnatal
checkup Total
Percentage
receiving
checkup
within 2 days
of delivery
from any
provider
Percentage
receiving
checkup
within 2 days
of delivery
from a
medically
trained
provider
Number
of
women
Mother's age
at birth
Below 15 50.2 5.5 4.5 3.5 0.6 35.6 100.0 60.3 37.9 182
15–19 55.8 6.2 5.0 2.8 0.4 29.8 100.0 67.0 48.6 7,307
20–24 56.2 7.2 3.7 3.2 0.3 29.4 100.0 67.2 49.1 9,080
25–29 53.5 7.1 4.0 3.3 0.3 31.8 100.0 64.6 47.2 6,503
30–34 53.8 6.6 4.5 3.3 0.1 31.7 100.0 64.9 47.5 3,043
35–39 54.3 6.1 3.4 2.6 0.3 33.3 100.0 63.8 43.3 840
40–44 42.0 9.6 3.0 2.3 0.0 43.2 100.0 54.5 35.4 163
45–49 * * * * * * * * * 14
Birth order 1 61.4 7.2 4.2 2.7 0.3 24.1 100.0 72.8 57.9 10,398
2–3 52.8 6.7 4.1 3.2 0.3 32.9 100.0 63.6 45.1 13,506
4–5 43.7 6.5 4.9 3.6 0.1 41.2 100.0 55.0 29.0 2,697
6+ 42.7 4.5 4.7 3.5 0.2 44.4 100.0 51.9 21.6 532
Residence Urban 61.3 8.6 5.0 3.0 0.3 21.8 100.0 74.8 59.1 7,188
Rural 52.7 6.2 4.0 3.1 0.3 33.8 100.0 62.9 44.0 19,945
Division Barisal 39.5 3.8 2.5 2.8 0.2 51.2 100.0 45.8 37.0 1,525
Chittagong 59.9 8.1 4.8 3.0 0.3 23.9 100.0 72.7 45.5 6,261
Dhaka 53.3 9.1 5.2 3.5 0.6 28.4 100.0 67.5 54.4 6,862
Khulna 61.8 5.0 1.8 2.0 0.1 29.3 100.0 68.6 62.3 2,546
Mymensingh 57.5 6.0 5.3 3.3 0.2 27.6 100.0 68.8 33.2 2,273
Rajshahi 49.3 5.9 2.4 2.4 0.1 39.9 100.0 57.6 51.4 2,899
Rangpur 56.1 3.5 3.4 3.0 0.0 33.9 100.0 63.0 47.1 2,778
Sylhet 52.5 6.6 6.3 4.4 0.3 29.9 100.0 65.4 36.9 1,990
Mother's
education No Education 38.9 5.9 4.2 3.6 0.5 46.9 100.0 49.0 24.5 2,293
Primary
incomplete 45.9 5.3 4.5 3.2 0.2 40.9 100.0 55.7 29.7 4,195
Primary
complete 47.2 5.7 4.2 3.6 0.2 39.1 100.0 57.1 35.6 4,103
Secondary
incomplete 57.1 6.7 4.3 3.1 0.3 28.4 100.0 68.1 50.8 11,064
Secondary
complete/
higher 70.2 9.6 3.9 2.3 0.2 13.8 100.0 83.7 75.4 5,478
Wealth quintile Lowest 40.1 4.3 4.2 3.5 0.2 47.7 100.0 48.6 23.6 5,451
Second 50.0 5.4 4.0 3.3 0.2 37.2 100.0 59.4 38.1 5,513
Middle 56.4 6.2 3.7 2.9 0.3 30.4 100.0 66.4 48.1 5,350
Fourth 60.0 8.5 3.8 3.2 0.4 24.1 100.0 72.2 56.5 5,592
Highest 69.1 9.9 5.4 2.5 0.2 12.9 100.0 84.4 74.5 5,227
Total 55.0 6.8 4.2 3.1 0.3 30.6 100.0 66.0 48.0 27,133 1 Defined as more than 2 days and within 60 days or 8 weeks

64 | Bangladesh Maternal Mortality and Health Care Survey 2016
Figure 6.1. Trends in postnatal care for mothers within two days of delivery, 2013–2016
• About half of the mothers received postnatal care (PNC) from a medically trained provider
within two days of delivery (Table 6.1; Table 6.2).
• An additional 18 percent of women received PNC only from a nonmedically trained provider.
Among those who received care from any provider, most received PNC within four hours of
delivery.
• In terms of differentials, relatively younger women are more likely to receive PNC from a
medically trained provider than older women, and first-parity women were much more likely to
receive PNC than those with higher parity. There is a strong positive association between PNC
and education and wealth quintiles.
• Urban women have higher PNC coverage than their rural counterparts.
• There is a strong regional variation of PNC by a medically trained provider. It is lowest in
Mymensingh (33 percent) and Sylhet and Barisal (37 percent) and highest in Khulna (62 percent).
63 6467 68
44 46 48 50
0
20
40
60
80
100
2013 2014 2015 2016
Pe
rce
nta
ge
Any provider Medically trained provider

Bangladesh Maternal Mortality and Health Care Survey 2016 | 65
Table 6.2. Type of provider of first postnatal checkup for the mother
Percentage distribution of women ages 15–49 who had live birth in the three years preceding the survey by type of provider for the mother's first postnatal
checkup, within two days of delivery of the most recent live birth, and the percentage who had a postnatal checkup within two days of delivery, by a
medically trained provider, according to background characteristics, Bangladesh 2016
Medically trained provider
Background characteristics
Qualified
doctor
Nurse/
midwife/
paramedic/
FWV CSBA
MA/
SACMO
Nonmedically
trained provider1 Missing
No postnatal
checkup2 Total
Percentage
receiving checkup
within 2 days of
delivery from a
medically trained
provider
Number of
women
Mother's age at birth Below 15 26.2 11.7 0.0 0.0 22.4 0.0 39.7 100.0 37.9 182
15–19 37.6 10.7 0.2 0.0 18.3 0.1 33.0 100.0 48.6 7,307
20–24 37.8 11.1 0.2 0.0 18.1 0.0 32.8 100.0 49.1 9,080
25–29 37.7 9.2 0.3 0.0 17.4 0.0 35.4 100.0 47.2 6,503
30–34 37.7 9.6 0.2 0.0 17.4 0.0 35.1 100.0 47.5 3,043
35–39 34.0 9.3 0.0 0.0 20.4 0.1 36.2 100.0 43.3 840
40–44 29.3 6.1 0.0 0.0 19.2 0.0 45.5 100.0 35.4 163
45–49 * * * * * * * * * 14
Birth order 1 46.3 11.4 0.2 0.0 14.8 0.1 27.2 100.0 57.9 10,398
2–3 34.9 10.0 0.2 0.0 18.4 0.0 36.4 100.0 45.1 13,506
4–5 20.9 7.8 0.3 0.0 26.0 0.0 45.0 100.0 29.0 2,697
6+ 13.6 7.7 0.2 0.0 30.4 0.0 48.1 100.0 21.6 532
Residence Urban 46.4 12.6 0.2 0.0 15.7 0.0 25.2 100.0 59.1 7,188
Rural 34.3 9.5 0.2 0.0 18.8 0.1 37.1 100.0 44.0 19,945
Division Barisal 27.9 8.8 0.1 0.1 8.9 0.0 54.2 100.0 37.0 1,525
Chittagong 34.3 11.0 0.1 0.0 27.2 0.1 27.3 100.0 45.5 6,261
Dhaka 44.8 9.5 0.1 0.0 13.1 0.1 32.5 100.0 54.4 6,862
Khulna 49.6 12.5 0.2 0.0 6.4 0.0 31.4 100.0 62.3 2,546
Mymensingh 23.4 9.4 0.4 0.0 35.6 0.0 31.2 100.0 33.2 2,273

66 | Bangladesh Maternal Mortality and Health Care Survey 2016
Percentage distribution of women ages 15–49 who had live birth in the three years preceding the survey by type of provider for the mother's first postnatal
checkup, within two days of delivery of the most recent live birth, and the percentage who had a postnatal checkup within two days of delivery, by a
medically trained provider, according to background characteristics, Bangladesh 2016
Medically trained provider
Background characteristics
Qualified
doctor
Nurse/
midwife/
paramedic/
FWV CSBA
MA/
SACMO
Nonmedically
trained provider1 Missing
No postnatal
checkup2 Total
Percentage
receiving checkup
within 2 days of
delivery from a
medically trained
provider
Number of
women
Rajshahi 41.2 10.0 0.2 0.0 6.1 0.0 42.4 100.0 51.4 2,899
Rangpur 35.2 11.5 0.4 0.0 15.9 0.0 37.0 100.0 47.1 2,778
Sylhet 27.8 8.9 0.2 0.0 28.4 0.1 34.6 100.0 36.9 1,990
Mother's education No Education 16.5 8.0 0.0 0.0 24.4 0.1 51.0 100.0 24.5 2,293
Primary incomplete 20.3 9.1 0.2 0.0 26.0 0.0 44.3 100.0 29.7 4,195
Primary complete 26.0 9.4 0.1 0.0 21.3 0.1 42.9 100.0 35.6 4,103
Secondary incomplete 39.7 10.7 0.3 0.0 17.3 0.0 31.9 100.0 50.8 11,064
Secondary complete/higher 63.5 11.8 0.1 0.0 8.3 0.0 16.3 100.0 75.4 5,478
Wealth quintile Lowest 16.2 7.0 0.4 0.0 24.9 0.0 51.4 100.0 23.6 5,451
Second 27.8 10.0 0.3 0.0 21.3 0.0 40.6 100.0 38.1 5,513
Middle 36.7 11.3 0.2 0.0 18.2 0.0 33.6 100.0 48.1 5,350
Fourth 43.9 12.5 0.1 0.0 15.7 0.0 27.8 100.0 56.5 5,592
Highest 63.8 10.7 0.1 0.0 9.6 0.2 15.6 100.0 74.5 5,227
Total 37.5 10.3 0.2 0.0 18.0 0.1 34.0 100.0 48.0 27,133
1 Includes Community Health Care Provider, HA, FWA, trained TBA, untrained TBA, unqualified doctor and 'other.' 2 Includes those who had postnatal care after two days of delivery and those whose information on timing is missing.

Bangladesh Maternal Mortality and Health Care Survey 2016 | 67
Figure 6.2 Trends in postnatal care for mothers within two days of delivery, BMMS 2001, 2010,
and 2016
Table 6.3. Type of provider of PNC for the mother by place of delivery
Percentage distribution of women ages 15–49 who had a live birth in the three years preceding the
survey, for which the mother received PNC within two days of delivery, for most recent live birth, by type
of provider, according to place of delivery, Bangladesh 2016
Place of delivery
Type of provider Facility Home Other Total2
Qualified doctor 76.2 2.0 47.2 37.5
Nurse/midwife/paramedic/FWV 17.7 3.4 21.1 10.3
CSBA 0.1 0.3 0.0 0.2
MA/SACMO 0.0 0.0 0.2 0.0
Community health worker1 0.6 4.1 0.3 2.4
Other 0.3 29.7 14.4 15.6
Missing 0.0 0.1 0.0 0.1
No postnatal checkup within two days 5.2 60.3 16.8 34.0
Total 100.0 100.0 100.0 100.0
Number of women 12,912 14,120 87 27,133 1 Community health worker includes Community Health Care Provider, HA, FWA, and NGO health worker 2 Total includes 14 missing cases
• Postnatal checkup from a medically trained provider has more than doubled between BMMS 2010
and BMMS 2016 (Figure 6.2).
• At the same time, postnatal checkup by a nonmedical provider also increased from 10 to 18 percent.
• In only six percent of home deliveries, the mothers received PNC from a medically trained provider
within two days of delivery (Table 6.3).
Pe
rce
nta
ge

68 | Bangladesh Maternal Mortality and Health Care Survey 2016
Figure 6.3. Completeness of maternity care: BMMS 2016

Bangladesh Maternal Mortality and Health Care Survey 2016 | 69
Figure 6.4. Trends in completeness of maternity care from a medically trained provider, BMMS
2001, 2010, and 2016
• More than two out of five women received complete maternity care (ANC, delivery care [DC],
and PNC within two days of delivery) from a medically trained provider (Figure 6.3).
• The percentage of women receiving the complete maternal health care has increased significantly,
from five percent in BMMS 2001 to 43 percent in BMMS 2016 (Figure 6.4).
5
52
19
4043
21
Received ANC, Delivery and PNC Did not receive any care
Pe
rce
nta
ge
BMMS 2001 BMMS 2010 BMMS 2016

70 | Bangladesh Maternal Mortality and Health Care Survey 2016
SUMMARY
• Almost half (49 percent) of women reported that they had at least one complication
during pregnancy/delivery or after delivery.
• Overall, 67 percent of women with complications sought care from any health provider.
• Among women reporting maternal complications, 46 percent sought care from a health
facility.
• The proportion seeking health care from any provider has not increased between BMMS
2010 (68 percent) and BMMS 2016 (67 percent). But there is a notable shift towards care
seeking from health facilities. Facility-based health care for maternal complications
increased, from 29 percent in BMMS 2010 to 46 percent in BMMS 2016.
• Home-based care for maternal complications declined from 15 percent to three percent
between BMMS 2010 and BMMS 2016—an encouraging trend.
• Women from the richest wealth quintile who had maternal complications are twice as
likely to seek care from a health facility compared to women from households in the
poorest wealth quintile. The poor-rich inequity in use of facility-based care for maternal
complication has declined in the past 15 years. In BMMS 2001, women from the richest
households were five times more likely to seek facility-based care than those in the
poorest household.
• Women who have completed at least secondary education were 1.9 times more likely to
seek facility-based care for maternal complications than those with no education. In the
past 15 years there has been a steady increase in seeking care from health facilities for
maternal complications among women with no education, from nine percent in BMMS
2001 to 32 percent in BMMS 2016, resulting in increased equity in this behavior by
educational status.
SECTION 7: CARE SEEKING FOR MATERNAL COMPLICATIONS

Bangladesh Maternal Mortality and Health Care Survey 2016 | 71
Table 7.1. Women reporting recent maternal complications
Percentage of last live births, in the three years preceding the survey, for which women reported
complications during pregnancy, during delivery, or after delivery, by type of complications and
timing of complications, Bangladesh 2016
Complications
Type of complications
During
pregnancy
During
delivery
After
delivery
Any
stage
Had no complication 62.4 74.1 79.0 50.4
Had at least 1 complication 37.4 25.7 20.7 49.3
Symptoms of preeclampsia1 31.5 14.4 14.0 36.5
Obstructed/prolonged labor2 8.1 11.4 0.0 17.1
Severe/heavy bleeding 1.3 2.2 5.8 7.9
Retained placenta 0.0 0.9 1.2 1.8
High fever with smelly discharge 0.0 0.0 1.1 1.1
Convulsion/fits 2.1 1.5 3.3 6.2
Number of women 27,133 27,133 27,133 27,133 1 Includes severe headache with blurred vision/high blood pressure/oedema face/feet/body. 2 Includes leaking membrane and no labor pain for >6 hours/ mal-presentation/ prolonged labor
(>12 hours).
Figure 7.1. Percentage of women reporting maternal complications, BMMS 2010 and BMMS
2016
53
40
28
20
49
37
26
21
1+ complication at any
stage
Pregnancy Delivery Post delivery
Pe
rce
nta
ge
BMMS 2010 BMMS 2016

72 | Bangladesh Maternal Mortality and Health Care Survey 2016
Figure 7.2. Percentage of women by number of reported maternal complications, BMMS 2010
and BMMS 2016
• Almost half (49 percent) of the women reported that they had at least one complication during
their last birth in the three years before the survey (Table 7.1; Figure 7.1). The pattern of
complication reporting in BMMS 2016 is similar to that reported in BMMS 2010.
• Women were more likely to experience complications during pregnancy. Almost two out of five
women reported experiencing complications during pregnancy; whereas one in four women had
complications during delivery, and one in five after delivery.
• Symptoms of preeclampsia (severe headache/blurry vision/some oedema) were the most
common complications experienced (37 percent), followed by prolonged/obstructed labor (17
percent), severe/heavy bleeding (eight percent) and convulsions (6 percent).
• In BMMS 2016, over one in five women reported that they experienced more than one
complication during pregnancy/delivery/after delivery (Figure 7.2).
30
14
9
28
13
8
1 2 3 or more
Pe
rce
nta
ge
Number of complications
BMMS 2010 BMMS 2016

Bangladesh Maternal Mortality and Health Care Survey 2016 | 73
Table 7.2. Care seeking for complications
• Overall, almost seven out of 10 women (67 percent) who experienced any maternal
complications sought treatment from a health provider (Table 7.2).
• Women who experienced convulsions or severe/heavy bleeding were most likely to seek
treatment (85 percent and 83 percent, respectively), while those who had symptoms of
preeclampsia were least likely to seek care (58 percent).
• There was no difference in care seeking among urban and rural women.
• Care seeking likelihood increased with women’s education and household wealth quintile.
• Women in Chittagong were most likely to seek treatment (72 percent), while those from Dhaka
were least likely to seek any health care for complications (63 percent).
Percentage of last live births, in the three years preceding the survey, with complications
during pregnancy, during delivery or after delivery, for which treatment was sought for last
complication, by type of complication and background characteristics, Bangladesh 2016
Background characteristics
Sought
treatment1
Number of women with
complication2
Type of complication Symptoms of preeclampsia 57.7 7,636
Obstructed/prolonged labor 79.0 2,983
Severe/heavy bleeding 83.1 1,520
Retained placenta 60.6 328
High fever with smelly discharge 79.8 192
Convulsion/fits 84.6 768
Residence Urban 67.9 3,707
Rural 67.0 9,720
Division Barisal 67.0 760
Chittagong 71.9 3,278
Dhaka 62.8 3,747
Khulna 68.6 1,155
Mymensingh 64.1 991
Rajshahi 65.6 1,339
Rangpur 69.4 1,109
Sylhet 70.1 1,048
Mother's education No education 57.4 1,085
Primary incomplete 60.4 2,120
Primary complete 62.5 1,987
Secondary incomplete 70.1 5,474
Secondary complete/higher 74.2 2,761
Wealth quintile Lowest 62.8 2,618
Second 64.7 2,683
Middle 67.7 2,623
Fourth 67.3 2,862
Highest 73.7 2,642
Total 67.2 13,427 1 Includes those who brought medicine to treat the complication. 2 Excludes 28 cases who had multiple complications and could not identify the complication
that occurred last.

74 | Bangladesh Maternal Mortality and Health Care Survey 2016
Figure 7.3. Path diagram of treatment-seeking behavior1 for maternal complications, BMMS 2016
1 Treatment places are hierarchically presented, because treatment was sought from multiple sources in some
cases. 2 May have received treatment at home as well 3 Did not seek treatment outside of home 4 Qualified providers include MBBS/nurse/paramedic/FWV/CSBA/MA/SACMO
Reference complication
(N=13,427)
Sought treatment
(N=9,2029)
(67.2%)
Did not seek treatment
(N=4,398)
(32.8%)
Sought home-based
treatment3
(N=431)
(3.2%)
Sought treatment outside home2
(N=8,176)
(60.9%)
Facility-based
provider
(N=6,163)
(45.9%)
Non-facility-
based qualified
provider4
(N=619)
(4.6%)
Non-facility-based
unqualified provider
(N=1,394)
(10.4%)
Bought medicine
(N=422)
(3.1%)

Bangladesh Maternal Mortality and Health Care Survey 2016 | 75
Figure 7.4. Trends in treatment-seeking for maternal complications
• Although the percentage of respondents who sought treatment for maternal complications
remains almost unchanged between BMMS 2016 and BMMS 2010 (67 percent and 68 percent
respectively), there has been a noticeable change in the source of care (Figures 7.3 and 7.4).
• In BMMS 2016, among women who had complications, 46 percent sought treatment from a
health facility. Seeking facility-based health care for maternal complications increased by 17
percentage points between BMMS 2010 and 2016.
• Home-based treatment for maternal complications declined from 15 percent in BMMS 2010 to
three percent in BMMS 2016.
68
29
15
67
46
3
Sought care from any provider Sought care from health
facility
Sought care from home
based treatment
Pe
rce
nta
ge
BMMS 2010 BMMS 2016

76 | Bangladesh Maternal Mortality and Health Care Survey 2016
Table 7.3. Number of places where health care was sought by type of complications
Percentage of last live births in the three years preceding the survey for which women had
complications during pregnancy, delivery, or after delivery, by type of complications and number of
places where treatment was sought, Bangladesh 2016
Number of places where care was sought
Type of complications
One
place
only
Two
places
Three or
more
places Total
Number of
women who
sought
treatment1
Symptoms of preeclampsia 74.8 15.7 9.5 100.0 4,151
Obstructed/prolonged labor 91.2 7.5 1.3 100.0 2,299
Severe/heavy bleeding 79.6 14.5 5.8 100.0 1,189
Retained placenta 89.6 7.3 3.1 100.0 195
High fever with smelly discharge 73.8 17.9 8.3 100.0 145
Convulsion/fits 81.9 13.3 4.8 100.0 629
Total 80.7 13.0 6.3 100.0 8,607 1 Excludes those who reported only getting medicine.
Figure 7.5. Number of places where health care was sought among those who sought care
for maternal complications, BMMS 2016
81
13
6
One place only Two places Three or more places
Pe
rce
nta
ge

Bangladesh Maternal Mortality and Health Care Survey 2016 | 77
Table 7.4. First source where treatment was sought for maternal complications
Percentage of last live births in the three years preceding the survey for which women had complications during
pregnancy, delivery, or after delivery and sought treatment, by type of complications and first source of care,
Bangladesh 2016
Type of
complications
Source of first care
Home
Govern-
ment
facility
NGO
facility
Private
facility
Private:
qualified
doctor
Private:
Pharmacy
or
unqualified
doctor Other Total
Number of
women
who sought
treatment3
Symptoms of
preeclampsia1 2.1 23.1 4.9 42.2 10.7 15.3 1.7 100.0 4,151
Obstructed
/Prolonged
labor2
9.1 28.5 5.5 42.0 2.1 10.7 2.0 100.0 2,299
Severe/heavy
bleeding 7.4 26.1 3.9 31.2 7.8 23.1 0.5 100.0 1,189
Retained
placenta 23.0 31.3 3.3 20.0 3.9 16.7 1.8 100.0 195
High fever
with smelly
discharge
6.8 24.1 3.4 31.7 9.2 24.0 0.7 100.0 145
Convulsion/fits 9.4 28.2 4.0 35.8 5.7 15.5 1.2 100.0 629
Total 5.8 25.5 4.8 39.5 7.5 15.4 1.6 100.0 8,607 1 Includes severe headache with blurred vision/high blood pressure/oedema face/feet/body 2 Leaking membrane and no labor pain for >6 hours/mal-presentation/prolonged labor (>12 hours)
3 Excludes those who reported only getting medicine

78 | Bangladesh Maternal Mortality and Health Care Survey 2016
Figure 7.6. First source where treatment was sought for maternal complications among
women sought care, BMMS 2010 and BMMS 2016
• Among women who sought care for maternal complications—most sought treatment from one
place. However, one in five women sought care from more than one source (Table 7.3).
• A private health facility was the most likely choice as the first source of care, followed by public
sector health facilities, among those who sought care for complications. Overall, seven out of 10
women’s first source of treatment was a health facility—public, NGO, or private (Table 7.4).
• It is encouraging to see that home-based care as the first source of care declined from 34 percent
to six percent, between BMMS 2010 and BMMS 2016, while facility-based care increased from 45
percent to 70 percent during the same period (Figure 7.6).
Pe
rce
nta
ge

Bangladesh Maternal Mortality and Health Care Survey 2016 | 79
Table 7.5. Reasons for not seeking treatment for complications
Percentage of last live births in the three years preceding the survey for which the last complications
occurred during pregnancy, delivery, or after delivery and for which treatment was not sought, by reasons
for not seeking treatment, according to type of complications, Bangladesh 2016
Reasons for not taking treatment
Number
of
women
Type of
complications
Not
necessary,
not serious
Cost
too
much,
lack of
money
Access
problem*
Family
didn't
allow
Poor
quality,
better
quality
at
home Others**
Not
customary
Symptoms of
preeclampsia1 83.0 15.4 1.3 2.3 1.6 1.8 1.3 3,229
Obstructed/
prolonged labor2 70.6 21.7 5.0 7.0 2.9 4.5 2.9 626
Severe/heavy
bleeding 67.3 30.0 1.1 4.8 4.1 3.2 1.6 257
Retained
placenta 73.8 24.1 2.5 3.0 2.5 0.7 1.6 129
High fever with
smelly discharge 71.8 33.6 0.0 4.3 4.3 6.6 0.0 39
Convulsion/fits 73.4 25.0 2.1 3.5 4.9 4.7 2.1 118
Total 79.7 17.8 1.8 3.2 2.1 2.3 1.5 4,398
* Access problem include 'too far', 'transport problem', 'no one to accompany', 'not known how to go’,
and 'not known where to go'.
** Others include 'no time to go', 'not want service from male provider', 'afraid to go', 'clinic / hospital insist
Cesarean’, ‘had sudden delivery’, and 'others'.
1 Includes Severe headache with blurred vision/high blood pressure/oedema face/feet/body 2 Leaking membrane and no labor pain for >6 hours/mal-presentation/prolonged labor (>12 hours)
• Four out of five women who did not seek treatment for complication cited that the reason for
not seeking care was the perception that the condition was not serious or that treatment for the
complication was not necessary. The second most common reason for not seeking care was
related to economics—cost of service was high or household did not have the means to pay for
service (Table 7.5).
• Family prohibition and poor service quality were not prominent reasons for not seeking care—
only three percent and two percent of women, respectively, cited these two reasons.

80 | Bangladesh Maternal Mortality and Health Care Survey 2016
Table 7.6. Health care seeking for maternal complications by place of care and wealth
quintiles
Table 7.7. Health care seeking for maternal complications by place of care and women’s
education
Percentage of last live births, in the three years preceding the survey, for which women had
complications during pregnancy/delivery/after delivery, for which treatment was sought, by place of
care and women’s education, Bangladesh 2016
Care-seeking behavior
Women’s education
No
education
Primary
incomplete
Primary
complete
Secondary
incomplete
Secondary
complete
or higher
Facility-based provider 31.9 33.5 38.3 48.3 61.5
Non-facility-based qualified provider 3.9 4.3 5.0 5.1 3.8
Non-facility-based unqualified
provider 17.6 18.8 15.5 13.4 6.8
Sought home-based treatment 4.0 3.8 3.7 3.2 2.1
Did not seek treatment 42.6 39.6 37.5 29.9 25.8
Total 100.0 100.0 100.0 100.0 100.0
Number 1,085 2,120 1,987 5,474 2,761 1 Includes ‘someone brought medicine’
Percentage of last live births in the three years preceding the survey for which women had
complications during pregnancy/delivery/after delivery, for which treatment was sought, by place of
care and household wealth quintile, Bangladesh 2016
Care-seeking behavior
Wealth quintile
Lowest Second Middle Fourth Highest
Facility-based provider 30.5 39.4 45.9 51.0 62.2
Non-facility-based qualified provider 5.2 5.5 4.6 4.2 3.5
Non-facility-based unqualified
provider 22.4 16.1 13.1 9.6 6.9
Sought home-based treatment 4.6 3.6 4.1 2.5 1.2
Did not seek treatment 37.2 35.3 32.3 32.7 26.3
Total 100.0 100.0 100.0 100.0 100.0
Number 2,618 2,683 2,623 2,862 2,642

Bangladesh Maternal Mortality and Health Care Survey 2016 | 81
Figure 7.7. Care-seeking from health facility for maternal complications by wealth quintiles,
BMMS 2001, 2010, and 2016
Figure 7.8. Care-seeking from health facility for maternal complications by women’s
education, BMMS 2001, 2010, and 2016
7
14.5
30.534
46.7
62.1
BMMS 2001 BMMS 2010 BMMS 2016
Pe
rce
nta
ge
Poorest Richest
Richest 2
times higher
use than the
poorest
Richest 3.2
times higher
use than the
poorest Richest 5
times higher
use than the
poorest
9
16.9
31.9
5652.1
61.5
BMMS 2001 BMMS 2010 BMMS 2016
Pe
rce
nta
ge
No education Secondary complete or higher
1.9 times higher
use among
women who
completed
secondary
education
3.1 times higher
use among
women who
completed
secondary
education
6.2 times higher
use among
women who
completed
secondary
education

82 | Bangladesh Maternal Mortality and Health Care Survey 2016
• As expected, the likelihood of seeking treatment for maternal complications increases with
household wealth and education of women (Table 7.6; Table 7.7).
• Even among the poorest households, or among women with no education, seeking treatment
from a health facility was the most common source of care for maternal complications. Almost
one-third of women in the poorest households, or with no education, sought care from a health
facility.
• Fewer than five percent of women sought home-based treatment for complications, even among
the poorest and women with no education. In BMMS 2010, home-based care was sought for
maternal complications by 18 percent of women in the poorest households and 14 percent of
women with no education.
• The poor-rich inequity in seeking facility care (measured by poorest-richest use ratio) for
maternal complications also declined. During the six-year period between BMMS 2016 and
BMMS 2010 the percentage of women from the poorest households who sought facility-based
care for treatment of complications doubled (from 15 percent to 31 percent); however, the
relative increase was less marked for the richest women (47 to 62 percent). In BMMS 2016,
women in the richest quintile were twice as likely to seek facility care for complications compared
to those in the poorest quintile. This ratio was 3.3 times higher in the 2010 survey and five times
higher in 2001 survey, indicating that the inequity in use of health facility for maternal
complications between the poorest and the richest has been declining steadily during the past 15
years (Figure 7.7).
• Between BMMS 2010 and BMMS 2016, treatment-seeking from a facility among women with no
education almost doubled (from 17 percent to 32 percent, respectively), while the increase was
less among women who completed secondary education (from 52 percent to 62 percent,
respectively). As a result, the inequity in health service use between these two education groups
declined over the past six-year period.
Bangladesh Maternal Mortality and Health Care Survey 2016 | 83
SECTION 8: DELIVERY EXPENDITURE
SUMMARY
• Three out of four normal delivers occur at home, and four out of five C-section deliveries
occur at private health facilities. The median cost for delivery varied considerably by the
type of location where the delivery occurred and whether the delivery was normal or by
C-section.
• The median expenditure related to normal deliveries at home is less than Taka 1,000. The
median expenditures for normal deliveries at a facility are four times greater than for home
delivery.
• Normal delivery costs the most at private facilities (around Taka 6,800). There was a small
difference in median expenditures between deliveries conducted in government and
NGO facilities (around Taka 3,000 and Taka 2,600 respectively).
• The median expenditure for C-section deliveries is five times higher than the median
expenditure associated with normal deliveries at facilities.
• The median expenditure associated with C-section deliveries at private facilities was
around Taka 20,000. In comparison, the median expenditure for C-section deliveries was
lowest in government facilities, around Taka 12,000.
• Family fund is the most common source to cover expenditures related to facility delivery.
Almost 20 percent of households had to take loan, and two percent sold or mortgaged
assets to cover the expenditures.
• Among women in households in the poorest two wealth quintiles who delivered in a
facility, one-third of the households took a loan; and five percent sold or mortgaged assets
to cover the cost of delivery. In addition, 28 percent of households received gifts from
relatives to help pay maternal care expenditures.

84 | Bangladesh Maternal Mortality and Health Care Survey 2016
Table 8.1. Delivery expenditures by place of delivery
Figure 8.1. Distribution of normal/C-section deliveries by place of delivery
76
1316
3 57
79
Normal Delivery C-section
Pe
rce
nta
ge
Home Public NGO Private
%
Percentage distribution of last live births in the three years preceding the survey, by amount spent for child delivery,
mean and median amount spent, by place of delivery, and by delivery procedure, BMMS 2016
Place of delivery
Amount spent for last delivery
Total Mean
Nothing <500
500–
999
1,000–
4,999
5,000–
9,999
10,000
or more Missing Median
Number
of births
Normal delivery
Public 0.6 1.8 6.3 57.5 24.2 8.5 1.0 100.0 4,130 2,997 2,490
Private 0.4 0.1 0.2 25.2 39.7 33.2 1.3 100.0 9,160 6,806 1,383
NGO 1.8 2.0 8.3 52.5 23.2 10.6 1.6 100.0 4,160 2,594 585
Home 3.8 20.2 24.2 45.2 4.7 1.0 0.9 100.0 1,459 993 14,120
Other/missing* 5.8 7.2 5.8 39.8 21.1 9.0 11.4 100.0 4,175 2,988 83
Total 3.1 15.6 19.5 45.6 10.5 4.7 1.0 100.0 2,479 1,008 18,662
C-section delivery
Public 1.8 0.8 0.1 8.3 20.7 67.2 1.3 100.0 15,447 12,381 1,384
Private 0.1 0.0 0.0 0.9 4.0 94.1 0.8 100.0 22,468 19,982 6,667
NGO 0.6 0.0 0.5 3.6 10.9 83.3 1.1 100.0 19,316 15,460 403
Other/missing* * * * * * * * * * * 18
Total 0.4 0.1 0.1 2.3 7.0 89.2 0.9 100.0 21,185 19,930 8,472
All deliveries
Public 1.0 1.4 4.1 39.9 23.0 29.4 1.1 100.0 8,167 4,960 3,874
Private 0.2 0.0 0.1 5.1 10.1 83.7 0.9 100.0 20,191 18,945 8,050
NGO 1.3 1.2 5.1 32.5 18.2 40.3 1.4 100.0 10,364 6,095 989
Home 3.8 20.2 24.2 45.2 4.7 1.0 0.9 100.0 1,459 993 14,120
Other/missing* 6.0 5.9 4.8 33.7 18.2 21.9 9.4 100.0 8,582 3,068 101
Total 2.2 10.8 13.4 32.0 9.4 31.1 1.0 100.0 8,324 2,481 27,133
* Place of delivery not known

Bangladesh Maternal Mortality and Health Care Survey 2016 | 85
Figure 8.2. Median delivery expenditures in Taka for normal delivery and C-section, BMMS
2016
• Expenditures related to childbirth depend upon whether the delivery occurred in a facility and
whether it was normal delivery or C-section.
• Seventy-six percent of the normal deliveries occurred at home, 13 percent in public, seven
percent in private and three percent in NGO facilities (Figure 8.1).
• For normal delivery, the median expenditures were the lowest for home delivery (around Taka
1,000) and the highest for delivery at private facilities—around Taka 6,800 (Table 8.1; Figure 8.2).
• The median cost related to normal delivery at a health facility was around Taka 4,000. There was
little difference in mean and median expenditures for normal deliveries in public and NGO
health facilities. The median cost associated with normal deliveries in a private facility was 2.3
times and 2.6 times higher than the median expenditures associated with deliveries at public
facilities (around Taka 3,000) and NGO facilities (around Taka 2,600).
• Seventy-nine percent of all C-section deliveries took place in private facilities, 16 percent in
public facilities, and five percent in NGO health facilities (Figure 8.1).
• The median expenditures associated with C-section delivery was around Taka 20,000—which is
five times higher than the median expenditure related to normal facility deliveries. Expenditures
related to C-section deliveries were the highest in private facilities (median around Taka 20,000;
mean around Taka 22,000) and the lowest in public facilities (median around Taka 12,000; mean
around 15,000) (Table 8.1; Figure 8.2).
2,997 2,594
6,806
12,381
15,460
19,982
Public NGO Private
Me
dia
n e
xp
en
ditu
re in
ta
ka

86 | Bangladesh Maternal Mortality and Health Care Survey 2016
Table 8.2. Source of fund for facility delivery by wealth status
Percentage of last live births in the three years preceding the survey that were delivered at a health
facility and incurred a cost for delivery, by source of fund for maternal health care related to
childbirth, according to household wealth status, BMMS 2016
Source of fund
Wealth status
Poor
(2 bottom wealth
quintiles)
Non-poor
(3 top wealth quintiles) All households
Family fund 68.4 85.2 81.0
Loan 33.1 15.1 19.7
Sold assets 3.8 1.0 1.7
Mortgaged assets 1.0 0.3 0.5
Gift from relatives 27.7 20.4 22.2
Gift from friends 0.3 0.4 0.3
Other source 0.6 0.3 0.4
Don’t know/missing 0.3 0.6 0.5
Number of births 3,239 9,606 12,846
Multiple responses possible
• The most common source of fund to cover expenditures related to childbirth at health facilities
was family fund. The second most common source was gifts from relatives. One in five
households had to take loan (Table 8.2).
• Among women in households in the poorest two wealth quintiles who delivered in a facility, one in three had to take a loan, while five percent sold or mortgaged assets. A substantial proportion (28 percent) also received gifts from relatives to cover expenditures related to childbirth in a health facility.

Bangladesh Maternal Mortality and Health Care Survey 2016 | 87
SUMMARY
• Appropriate birth planning is still not common in Bangladesh. However, birth planning has
improved between 2010 and 2016.
• Only 28 percent of pregnant women in their third trimester of pregnancy reported that the
family had discussed or decided to deliver at a health facility. In 2010, this proportion was
lower (13 percent).
• Eighteen percent of pregnant women in their third trimester of pregnancy reported that
their family had prearranged transport for emergency. There is very little change in this
aspect of birth planning between 2010 and 2016.
• Thirty-eight percent of pregnant women in BMMS 2016 reported that their family had
prearranged funds for delivery/emergency maternal care, compared to 31 percent in
2010.
• Twelve percent of pregnant women in their third trimester of pregnancy reported that their
family has arranged for sources of blood in case of emergency.
• Pregnant women’s knowledge of maternal complications was low. The most commonly
known complication was symptoms of preeclampsia—46 percent knew about it. Only one
in three pregnant women had mentioned severe/heavy bleeding or convulsions as
maternal complications.
SECTION 9: BIRTH PLANNING AMONG PREGNANT WOMEN

88 | Bangladesh Maternal Mortality and Health Care Survey 2016
Table 9.1. Family discussion/decision about place of delivery
Percentage of currently pregnant women in the third trimester of pregnancy at the time of interview, by
the place of delivery they have decided on, according to background characteristics, Bangladesh
2016
Background characteristics
Did not
decide
Decided place of delivery
Number
of
women Public NGO Private Home Other Total
Age
15–19 21.3 9.3 3.9 10.5 54.9 0.0 100.0 526
20–24 21.5 11.8 2.8 13.7 50.1 0.1 100.0 643
25–29 19.2 13.3 1.4 13.5 52.6 0.2 100.0 412
30–34 20.9 15.0 3.1 20.3 40.6 0.0 100.0 213
35–39 25.0 7.9 3.6 7.2 56.2 0.0 100.0 60
40–44 * * * * * * * 6
45–49 * * * * * * * 1
Duration of pregnancy
7 months 26.3 11.3 2.7 12.5 47.2 0.0 100.0 762
8 months 17.8 11.7 3.0 12.4 54.9 0.2 100.0 781
9 months 15.9 12.3 2.9 17.3 51.6 0.0 100.0 319
Birth order
1 23.3 10.5 3.7 13.4 49.1 0.0 100.0 750
2–3 18.3 14.5 2.1 15.0 49.9 0.1 100.0 899
4–5 21.5 4.5 2.8 5.7 65.7 0.0 100.0 166
6+ [32.2] [0.0] [4.6] [3.4] [59.7] [0.0] [100.0] 47
Residence
Urban 19.2 17.5 5.4 20.4 37.4 0.1 100.0 483
Rural 21.6 9.6 2.0 10.8 56.1 0.1 100.0 1,379
Division
Barisal 22.5 13.3 0.3 9.5 54.4 0.0 100.0 84
Chittagong 18.5 12.1 3.6 7.5 58.2 0.1 100.0 445
Dhaka 15.6 10.9 3.8 23.0 46.7 0.0 100.0 497
Khulna 15.8 18.7 0.6 22.8 42.1 0.0 100.0 170
Mymensingh 32.4 5.4 0.8 3.7 57.7 0.0 100.0 158
Rajshahi 24.2 14.9 2.2 11.6 47.1 0.0 100.0 167
Rangpur 26.6 9.9 4.0 11.5 47.9 0.0 100.0 204
Sylhet 28.4 8.9 2.7 3.0 56.4 0.6 100.0 137
Level of education
No education 27.2 6.0 2.9 4.2 59.8 0.0 100.0 141
Primary incomplete 26.7 3.1 2.8 3.2 64.2 0.0 100.0 272
Primary complete 22.6 12.2 4.4 5.3 55.4 0.0 100.0 239
Secondary incomplete 20.8 12.3 1.9 12.9 52.1 0.1 100.0 806
Secondary complete or higher 14.3 17.6 4.0 28.6 35.2 0.2 100.0 404
Wealth quintile
Lowest 27.5 5.5 .3 3.2 63.5 0.0 100.0 379
Second 22.4 7.1 1.5 6.4 62.7 0.0 100.0 401
Middle 23.3 9.9 2.8 9.2 54.8 0.0 100.0 345
Fourth 16.4 15.9 4.9 17.8 44.9 0.1 100.0 414
Highest 14.9 20.7 5.0 32.2 26.9 0.3 100.0 323
Total 21.0 11.6 2.9 13.3 51.2 0.1 100.0 1,862
Note: Birth order of the current pregnancy is derived as the sum of the total number of live births
plus one.

Bangladesh Maternal Mortality and Health Care Survey 2016 | 89
Figure 9.1. Trends in family discussion about place of delivery, BMMS 2010 and 2016
• One in five pregnant women in their third trimester of pregnancy reported that there was no
discussion/decision in the family on where the delivery would take place (Table 9.1; Figure 9.1).
• Fewer than one in three (28 percent) pregnant women in their third trimester of pregnancy
reported that the family discussed/decided that the delivery would be at a facility. This indicator
on appropriate birth planning shows some improvement in the past six years. In 2010, only one
in ten (13 percent) pregnant women at the same stage of pregnancy said that their family had
discussed/decided to deliver at a health facility.
• Discussion/decision about having the delivery at a facility was the highest (38 percent) among
women ages 30–34 and the lowest among women ages 35+ (19 percent); it was higher in urban
areas (43 percent) than rural areas (22 percent). It was the highest in Khulna Division (42
percent) and the lowest in Mymensingh Division (10 percent) followed by Sylhet Division (15
percent).
• There was positive and strong association between advance discussion/decision to deliver at a
health facility and both women’s education and household wealth quintile.
13
63
2528
51
21
Facility Home No Discussion
Pe
rce
nta
ge
of
wo
me
n a
t 3
rd t
rim
est
er
of
pre
gn
an
cy
BMMS 2010 BMMS 2016

90 | Bangladesh Maternal Mortality and Health Care Survey 2016
Table 9.2. Pregnant women discussing preparedness for emergency with family members
Percentage of women currently pregnant (in their third trimester) at the time of interview, who had
previous discussions with family members on emergency preparedness during pregnancy,
Bangladesh 2016
Discussed with family members
Background characteristics
Make
arrangement
for blood in
case of
emergency
Make
arrangement
for transport in
case of
emergency
Make
arrangement
for fund in
case of
emergency
Number
of women
Age 15–19 11.6 16.6 37.9 526
20–24 12.9 17.8 41.0 643
25–29 10.5 17.6 37.5 412
30–34 15.2 21.9 37.3 213
35–39 10.0 23.4 24.7 60
40–44 * * * 6
45–49 * * * 1 Duration of pregnancy 7 months 10.1 16.5 31.2 762
8 months 12.0 17.7 41.2 781
9+ months 17.2 23.0 48.2 319 Birth order of current pregnancy1 1 14.1 17.8 42.7 750
2–3 12.3 19.4 39.3 899
4–5 4.6 14.6 20.6 166
6+ [4.6] [10.4] [12.6] 47 Residence Urban 22.3 20.1 46.9 483
Rural 8.6 17.4 35.3 1,379
Division Barisal 14.0 16.5 43.6 84
Chittagong 6.8 16.7 35.8 445
Dhaka 21.3 21.5 43.9 497
Khulna 11.8 18.1 35.6 170
Mymensingh 9.0 19.5 33.2 158
Rajshahi 7.0 10.1 33.2 167
Rangpur 8.9 14.6 37.0 204
Sylhet 10.6 24.5 40.2 137
Level of education No education 2.9 8.3 14.7 141
Primary incomplete 3.6 10.5 22.9 272
Primary complete 4.9 14.2 26.7 239
Secondary incomplete 10.9 19.1 38.9 806
Secondary complete/higher 27.9 27.0 62.5 404
Wealth quintile Lowest 2.2 11.2 21.8 379
Second 4.4 12.6 29.1 401
Middle 7.7 11.3 32.4 345
Fourth 15.8 23.6 44.7 414
Highest 33.5 33.3 67.0 323
Total 12.1 18.1 38.3 1,862 1 Birth order of the current pregnancy is derived as the sum of the total number of live births plus one.

Bangladesh Maternal Mortality and Health Care Survey 2016 | 91
Figure 9.2. Trends in key indicators of birth planning among pregnant women at the third
trimester of pregnancy, BMMS 2010 and 2016
• Birth planning suggestions include the following: arranging funds for delivery or emergency,
transport, and a source of blood in case of emergency.
• Almost four in 10 pregnant women in their third trimester mentioned that the family had made
arrangements to fund maternal care. In 2010, three out of ten pregnant women reported having
done so (Table 9.2; Figure 9.2).
• A much smaller proportion of pregnant women in the third trimester reported that the family
had prearranged for transport (18 percent) or blood (12 percent). However, compared to 2010,
there was a slight improvement in planning for transport in case of a maternal delivery care
emergency.
31
16
38
18
Arrangement for fund Arrangement for transport
Pe
rce
nta
ge
BMMS 2010 BMMS 2016

92 | Bangladesh Maternal Mortality and Health Care Survey 2016
Table 9.3. Knowledge of maternal complications among pregnant women
• Pregnant women’s knowledge of maternal complications was categorized into the following
types: symptoms of preeclampsia, obstructed or prolonged labor, severe/heavy bleeding, retained
placenta, high fever with smelly discharge, convulsions/fits, and others.
• Less than one in two pregnant women had knowledge about symptoms of preeclampsia as a
maternal complication. Around one in three pregnant women had knowledge of convulsion or
obstructed labor as maternal complications (Table 9.3).
• Knowledge about different types of maternal complications hardly changed by duration of
pregnancy.
Percentage of pregnant women who had knowledge about possible complications during pregnancy, delivery, or
after delivery, by background characteristics, Bangladesh 2016
Background
characteristics
Complications
Number
of
women
Symptoms of
preeclampsia
Obstructed
or
prolonged
labor
Severe/
heavy
bleeding
Retained
placenta
High fever
with smelly
discharge
Convulsion
/fits
Other
symptoms
Age group
15–19 42.6 29.9 13.0 22.4 2.3 28.4 30.1 1,622
20–24 48.3 31.6 17.7 27.4 2.5 37.7 34.0 1,924
25–29 46.8 36.6 22.0 27.7 2.8 43.5 35.0 1,304
30+ 46.8 35.6 18.5 28.0 3.6 38.8 38.4 739
Trimester
1st 44.7 32.3 19.4 25.3 2.7 36.2 32.1 1,486
2nd 44.7 33.5 17.1 26.5 2.8 37.9 34.9 2,243
3rd 48.8 32.3 16.2 26.2 2.4 35.1 33.4 1,862
Residence
Urban 50.6 32.8 18.0 24.0 3.1 37.2 31.9 1,470
Rural 44.5 32.8 17.3 26.8 2.5 36.3 34.3 4,119
Level of
education
No education 38.5 29.3 11.8 26.5 1.7 25.0 25.2 385
Primary
incomplete 38.5 32.6 17.4 29.6 3.0 29.0 32.4 819
Primary
complete 39.3 34.0 14.1 27.8 2.2 36.9 30.6 771
Secondary
incomplete 46.3 30.7 17.0 24.4 2.3 36.0 33.3 2,346
Secondary
complete or
higher
57.1 37.1 22.1 25.8 3.5 45.6 39.6 1,268
Wealth quintile
Lowest 41.0 32.9 14.7 29.2 1.6 32.3 33.0 1,137
Second 40.3 30.3 15.5 26.0 2.6 34.9 33.0 1,119
Middle 45.3 33.1 18.5 24.8 3.0 35.0 36.2 1,053
Fourth 47.7 31.6 17.0 26.0 2.6 35.6 34.0 1,227
Highest 56.6 36.5 22.0 24.3 3.4 45.4 32.2 1,054
Total 46.1 32.8 17.4 26.1 2.6 36.5 33.7 5,590

Bangladesh Maternal Mortality and Health Care Survey 2016 | 93
BACKGROUND
The fourth Health, Population, and Nutrition Sector Programme (HPNSP) for 2017–2022 aims to reach
an MMR target of 105 per 100,000 live births by 2022. The 2016 Bangladesh Maternal Mortality and
Health Care Survey assesses the recent progress in maternal health and establishes the baseline for the
current health sector program and the United Nations’ Sustainable Development Goals.
Between BMMS 2001 and BMMS 2010, MMR declined significantly: from 322 to 194 maternal deaths per
100,000 live births. This decline was evidence of remarkable progress linked to fertility reduction; access
to qualified maternal health care; increased use of maternal health services in the antenatal, delivery, and
postpartum periods; and socioeconomic and infrastructural improvements (Arifeen, et. al, 2014).
KEY FINDINGS OF THE 2016 SURVEY
• The MMR in Bangladesh declined between 2001 and 2010 but has now stalled. The MMR
estimate from the BMMS 2016 is 196 maternal deaths per 100,000 live births, almost identical to
the estimate of BMMS 2010 (Figure 10.2).
• Bangladesh has made rapid progress in increasing the number of births attended by
medically trained attendants. In 2016, 50 percent of births were attended by medically trained
personnel, compared to 27 percent in 2010 (Figure 10.1).
▪ Between 2010 and 2016, more women across Bangladesh delivered their babies in
healthcare facilities. The percentage of births in health facilities increased from 23 percent
in BMMS 2010 to 47 percent in BMMS 2016. Now, about 1.46 million births occur in health
facilities every year.
▪ The private sector accounted for most of the increase in facility deliveries. Between
BMMS 2010 and 2016, the percentage of deliveries occurring in the public sector facilities
increased from 10 percent to 14 percent, while deliveries in private facilities jumped from 11
percent to 29 percent. Births at facilities run by nongovernmental organizations (NGOs)
increased from two to four percent. Medically trained attendance for home deliveries has
consistently been around three to four percent during 2001–2016.
SECTION 10: KEY FINDINGS

94 | Bangladesh Maternal Mortality and Health Care Survey 2016
Figure 10.1. Trends in delivery by medically trained provider and by facility type, 2001–2016
• Delivery by C-section increased dramatically, from 12 percent in 2010 to 31 percent in 2016.
The current rate means that more than 920,000 deliveries each year are by C-section. In private
facilities, C-sections accounted for 83 percent of deliveries, compared to 35 percent in public
facilities and 39 percent in facilities run by NGOs.
• The percentage of women receiving the complete continuum of maternity care (antenatal
care, delivery care, and postnatal care from medically trained providers) has increased
significantly from five percent in 2001, to 19 percent in 2010, and to 43 percent in 2016.
• Seeking facility-based care for reported maternal complications has increased. Although
overall care seeking for reported maternal complications remained almost the same between
BMMS 2010 (68 percent) and 2016 (67 percent), a much higher proportion of women who
reported maternal complications in BMMS 2016 sought facility-based care (46 percent),
compared to BMMS 2010 (29 percent).
• There have been notable improvements in the socioeconomic status of households
between 2010 and 2016. The proportion of respondents who attended secondary school
increased from 36 percent to 47 percent between BMMS 2010 and BMMS 2016. Household
socioeconomic status—as measured by “access to electricity,” “access to improved toilet,” and
“wall materials of dwellings”—shows substantial improvements.
9
23
47
3
4
3
BMMS 2001 BMMS 2010 BMMS 2016
Pe
rce
nta
ge
Facility Non-facility births by MTP
50
27
12
Between BMMS 2010 and BMMS 2016, considerable progress has been made in
increasing the utilization of key maternal health services in Bangladesh. Facility
deliveries more than doubled in six years and seeking care from facilities for
reported maternal complications increased from 29 to 46 percent in that period.
However, this behavior has had no apparent impact on MMR.

Bangladesh Maternal Mortality and Health Care Survey 2016 | 95
STALLING OF MATERNAL MORTALITY RATIO: POSSIBLE
EXPLANATIONS
Many would expect the continued strong progress in coverage of maternal health services to have led to
further decline in the MMR in Bangladesh—but it has not. To shed light on this apparent paradox, it is
useful to examine the following.
Measurement Aspects
• Typically, underreporting of maternal deaths is more of a concern than overreporting of deaths,
and there is no evidence of significant levels of either kind of misreporting. Patterns of deaths by
age and socioeconomic variables are consistent with trends observed in the 2001 and 2010
rounds of BMMS. The 2016 BMMS data on births are consistent with other data sources.
• Survey estimates of MMR, like most other estimates, have a margin of error. The margin of error
(95 percent confidence interval) for the 2016 BMMS MMR leads to an estimate of 159 to 234.
Other recent estimates of MMR in Bangladesh, such as the estimate from the Bangladesh Bureau
of Statistic’s Sample Vital Registration System and the United Nations Maternal Mortality
Estimation Inter-Agency Group (MMEIG) modeled estimate, are within this margin of error
(Bangladesh Bureau of Statistics, 2017) (World Health Organization, 2015) (Figure 10.2).
Figure 10.2. Trends in MMR in Bangladesh from different data sources, 2001–2016
322
194 196
0
50
100
150
200
250
300
350
400
1995 2000 2005 2010 2015 2020
BMMS
2001
BMMS
2010
UN 176BBS 178BMMS
2016
No measurement issues were identified that can explain the apparent stall in MMR between BMMS 2010 and BMMS 2016.

96 | Bangladesh Maternal Mortality and Health Care Survey 2016
Experience of Other Countries
• An analysis of 37 countries in sub-Saharan Africa and South and Southeast Asia found a weak
association between the MMR and the percentage of deliveries occurring in a health facility
(World Health Organization, 2014). The association was particularly weak in the nine South and
Southeast Asian countries, most of which had an MMR of around 200 per 100,000 live births. It
was somewhat stronger in sub-Saharan African countries with higher MMRs. This suggests that a
higher level of facility delivery is important but not sufficient to lower MMR across countries.
• There is international precedence for a stall in MMR decline. An analysis of MMEIG estimates of
MMR worldwide revealed that 13 of 53 middle-income countries showed stalls in MMR decline.
In some of these countries, the apparent stall in MMR occurred despite increases in coverage of
medically trained provider and health facility deliveries (for example, Ghana and the Philippines–
Figure 10.3). Therefore, Bangladesh is not the only country to experience stalling of MMR with
increase in use of maternal health services.

Bangladesh Maternal Mortality and Health Care Survey 2016 | 97
Figure 10.3. Trends in MMR and facility delivery in Ghana and the Philippines, 1990–2015
Importance of Quality of Care
• Maternal complications can happen any time (during pregnancy, delivery, or the postpartum
period) that require urgent medical attention. Increased coverage of maternal health services is
expected to reduce maternal mortality by increasing the likelihood that complications are
recognized early and ensuring that women get life-saving medical care should complications arise.
• Several studies in other countries have highlighted the importance of the quality of care in
translating use of maternal health services into improved health outcomes.
1. Analysis of multi-country, cross-sectional data indicates that coverage of interventions needs to
be matched with comprehensive emergency obstetric care (CEmOC) and high-quality maternal
health services to achieve reductions in maternal mortality (Souza, et. al, 2013).
2. Evidence from India demonstrates that quality of maternal health services is crucial for the
safe motherhood programs to succeed (Randive, San Sebastian, De Costa, & Lindholm,
2014). (Goli & Jaleel, 2014) (Hurst, Semrau, Gawande, & Hirschhorn, 2015) Impact
evaluation of two programs in Gujarat and Karnataka also found that low quality of services,
coupled with lack of motivation and incentives among the service providers, is the main
reason for the programs for not being able to extend healthcare availability and utilization,
and reduce maternal mortality (Mohanan, Miller, La Forgia, Shekhar, & Singh, 2016).
• There is consensus that quality of health care is generally poor in Bangladesh. Although there is
some qualitative and anecdotal information on quality of maternal care, there is a lack of
quantitative data on this topic, with the exception of service readiness data for health facilities
and a few small-scale hospital studies.
Between 2011 and 2015 increase in facility
delivery had no impact on MMR level in
Ghana
MMR level stayed the same in the Philippines
though facility delivery nearly doubled during
1995–2012
Bangladesh is not the only country that has experienced the paradox of increasing utilization of maternal services with no impact on MMR.

98 | Bangladesh Maternal Mortality and Health Care Survey 2016
Readiness and Quality of Maternal Care in Health Facilities
• The 2014 Bangladesh Health Facility Survey (BHFS) (National Institute of Population Research
and Training, Associated for Community and Population Health research, and ICF International)
provides valuable information on preparedness of health facilities to provide high-quality
maternal care. The survey found multiple weaknesses in health system readiness to provide
delivery care. For example,
1. Only 39 percent of facilities that provide normal delivery services had a delivery care
provider on call or on site around the clock.
2. Only three percent of facilities providing delivery care had service readiness1 to provide
normal delivery services (eight percent in higher-level public facilities (district hospitals,
maternal and child welfare centers, and UHCs) and zero percent in private hospitals)
(Figure 10.4).
• All public facilities at the upazila level and above are designated to provide basic emergency
obstetric care (BEmOC) services, but only 36 percent reported performing the seven signal
functions for BEmOC. Similarly, 96 percent of the private hospitals were conducting C-section
delivery, but only 32 percent provided all seven BEmOC signal functions/services (Figure 10.5).
• A functional referral systems is necessary to ensure effective EmOC service. BMMS 2016
reported that 18 percent of maternal deaths occurred in transit indicating failure in the referral
system.
Figure 10.4. Facilities offering normal delivery services having service readiness, BHFS 2014
MCWC: mother and child welfare centre
1 i.e., having 1. Guideline on BEmOC or CEmOC; 2. At least one staff ever trained in IMPAC at any time;
3. Examination light; 4. Delivery pack; 5. Suction apparatus; 6. Neonatal bag and mask; 7. Partograph;
8. Gloves; 9. Injectable uterotonic oxytocin; 10. Injectable antibiotic; 11. Magnesium sulphate; 12. Skin
disinfectant; 13. Intravenous fluids with infusion set.
Quality of care is fundamental to improving maternal health outcomes.
38
0
10
0
All facilties
(excluding CC)
Public
(UHC+DH+MCWC)
Public (union level) NGO Private hospitals &
clinics
Pe
rce
nt
of
fac
ilitie
s p
rov
ide
d
no
rma
l d
eliv
ery
se
rvic
es
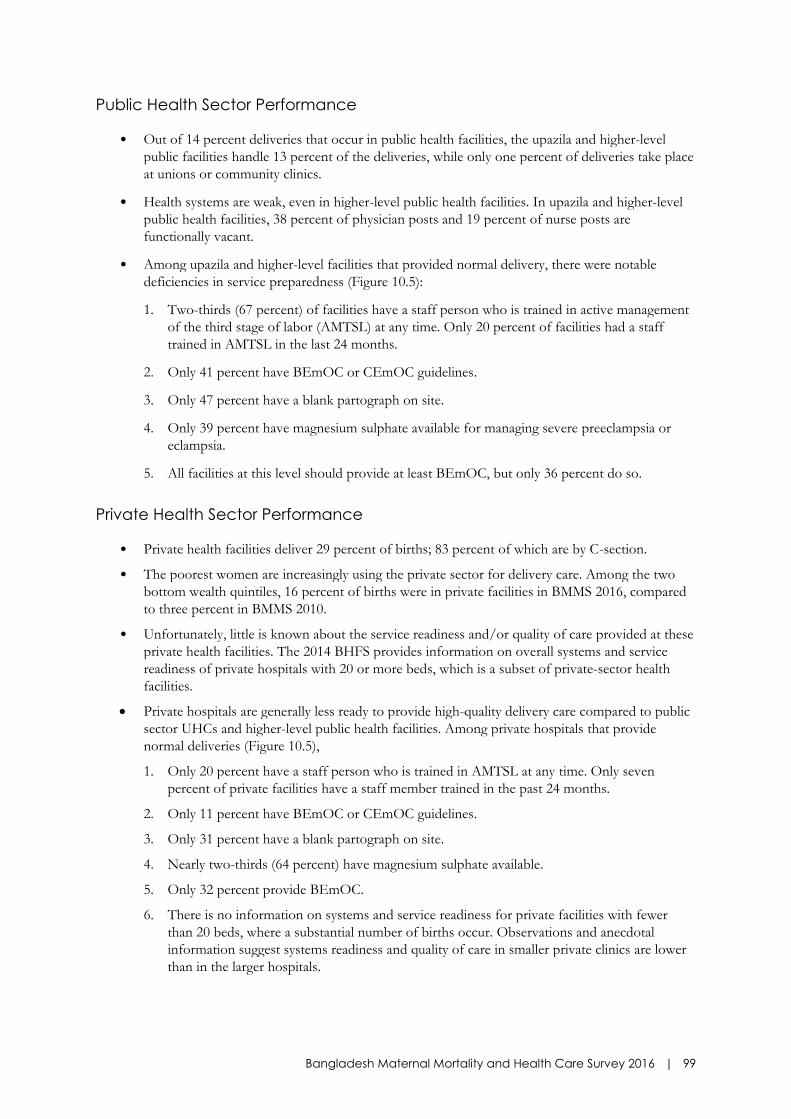
Bangladesh Maternal Mortality and Health Care Survey 2016 | 99
Public Health Sector Performance
• Out of 14 percent deliveries that occur in public health facilities, the upazila and higher-level
public facilities handle 13 percent of the deliveries, while only one percent of deliveries take place
at unions or community clinics.
• Health systems are weak, even in higher-level public health facilities. In upazila and higher-level
public health facilities, 38 percent of physician posts and 19 percent of nurse posts are
functionally vacant.
• Among upazila and higher-level facilities that provided normal delivery, there were notable
deficiencies in service preparedness (Figure 10.5):
1. Two-thirds (67 percent) of facilities have a staff person who is trained in active management
of the third stage of labor (AMTSL) at any time. Only 20 percent of facilities had a staff
trained in AMTSL in the last 24 months.
2. Only 41 percent have BEmOC or CEmOC guidelines.
3. Only 47 percent have a blank partograph on site.
4. Only 39 percent have magnesium sulphate available for managing severe preeclampsia or
eclampsia.
5. All facilities at this level should provide at least BEmOC, but only 36 percent do so.
Private Health Sector Performance
• Private health facilities deliver 29 percent of births; 83 percent of which are by C-section.
• The poorest women are increasingly using the private sector for delivery care. Among the two
bottom wealth quintiles, 16 percent of births were in private facilities in BMMS 2016, compared
to three percent in BMMS 2010.
• Unfortunately, little is known about the service readiness and/or quality of care provided at these
private health facilities. The 2014 BHFS provides information on overall systems and service
readiness of private hospitals with 20 or more beds, which is a subset of private-sector health
facilities.
• Private hospitals are generally less ready to provide high-quality delivery care compared to public
sector UHCs and higher-level public health facilities. Among private hospitals that provide
normal deliveries (Figure 10.5),
1. Only 20 percent have a staff person who is trained in AMTSL at any time. Only seven
percent of private facilities have a staff member trained in the past 24 months.
2. Only 11 percent have BEmOC or CEmOC guidelines.
3. Only 31 percent have a blank partograph on site.
4. Nearly two-thirds (64 percent) have magnesium sulphate available.
5. Only 32 percent provide BEmOC.
6. There is no information on systems and service readiness for private facilities with fewer
than 20 beds, where a substantial number of births occur. Observations and anecdotal
information suggest systems readiness and quality of care in smaller private clinics are lower
than in the larger hospitals.

100 | Bangladesh Maternal Mortality and Health Care Survey 2016
Figure 10.5. Facilities with specific items to provide high-quality maternal health care, BHFS
2014
Readiness to Address Obstetric Emergencies
• Only 46 percent of upazila and higher-level public facilities, and 20 percent of private hospitals,
had at least one staff member who had ever received training on emergency obstetric care (Figure
10.6). Only 15 percent of higher-level public facilities, and seven percent of private hospitals, had
a staff member trained in the past 24 months.
• Thirty percent of public facilities at the upazila level and above perform C-section deliveries, but
only 10 percent have comprehensive EmOC services–the WHO recommended nine signal
functions. Almost all (96 percent) private hospitals conducted C-sections, but only 16 percent
perform the nine signal functions (Figure 10.7).
• The current national standards (Maternal Health Strategy 2017) for a true 24x7 CEmOC facility
suggest availability of four pairs of obstetricians and anesthesiologists. Very few facilities other
than the medical college hospitals meet the standard.
67
41
47
3936
20
11
31
64
32
Staff member
trained in AMTSL
BEmOC or
CEmOC guidelines
Partograph Magnesium
sulphate
Provide BEmOC
Pe
rce
nta
ge
of
fac
ilitie
s
Public (DH, MCWC,UHC) Private

Bangladesh Maternal Mortality and Health Care Survey 2016 | 101
Figure 10.6. facilities offering normal delivery services have at least one staff trained (ever) on
emergency obstetric care, BHFS 2014
Figure 10.7. Facilities providing C-section and have CEmOC signal functions
• The two main causes of maternal deaths are hemorrhage and eclampsia, accounting for 54
percent of maternal deaths. The readiness of the health system to address these and other
complications in maternal health is not sufficient.
1. Just 40 percent of all facilities (excluding community clinics) have supplies of injectable
oxytocin to stop hemorrhage, and even fewer (28 percent) have injectable magnesium
sulphate to treat eclampsia. Private hospitals are more likely to have these lifesaving
commodities (82 percent) than the public sector’s facilities at the upazila level and above (64
percent).
30
96
1016
Public (UHC+DH+MCWC) Private Hospitals
Pe
rce
nta
ge
of
fac
ilitie
s
Provided CS service Had all 9 CmOC signal functions
Pe
rce
nta
ge
of
fac
ilitie
s o
ffe
rin
g n
orm
al
de
live
ry s
erv
ice
102 | Bangladesh Maternal Mortality and Health Care Survey 2016
2. Injectable antibiotics are available in 69 percent of upazila and higher level public facilities
and at 76 percent of private hospitals.
3. Still, 53 percent of deliveries are occurring at home, mostly without skilled birth attendants.
Community distribution of misoprostol for prevention of postpartum hemorrhage only
covered about 17 percent of births in Bangladesh during 2015–2016 (Government of
Bangladesh, 2016).
• Conservatively, 18 percent of maternal deaths result from or are associated with
noncommunicable diseases. Health facilities in Bangladesh are poorly equipped to deal with these
cases.
Dangers of Unnecessary C-Sections
• WHO suggests that a reasonable rate of medically necessary C-section is between 10 percent and
15 percent of all births. In Bangladesh, the C-section rate is twice as high (31%) as the WHO-
recommended rate. Among the highest quintile, more than half deliver by C-Section.
• Of all C-sections in Bangladesh, 79 percent are in private facilities which accounts for about
2,000 C-sections per day in private facilities. According to BHFS 2014, only 16 percent of private
facilities had the nine signal functions for CEmOC while 96 percent reported that they provided
C-Section deliveries.
• Although data and research on implications of unnecessary C-Sections in Bangladesh are not
available, there are lessons to learn from experiences of other countries.
1. Increased C-section–related morbidity and mortality have been confirmed by a multi-centre
study of 100,000 births in Latin America (Villar, et. al, 2007).
2. An international multi-centre study showing that women who were submitted for C-section
without a clear medical need, presented increased risk of immediate complications, including
admission to an intensive care unit, blood transfusion, hysterectomy, and death (Souza, et. al,
2010).
3. A recent study in Brazil also found that the risk of postpartum maternal death is almost
three-fold higher with C-section than vaginal delivery, mainly due to deaths from postpartum
hemorrhage and complications of anesthesia (Esteves-Pereira, et. al, 2016).
Most of the public and private facilities are not fully ready to provide quality maternity care.
Increase in facility delivery between BMMS 2010 and BMMS 2016 is mostly driven by increase in the private sector; service readiness for maternal care is poorer at private facilities compared to upazila and higher-level public facilities.
Almost one in five maternal deaths occurs in transit, indicating delays in decision making and absence of a functional referral system.
The prevalence of C-sections is increasing at an alarming rate in Bangladesh, and the level now greatly exceeds the levels expected to be medically necessary. There is convincing evidence that unnecessary C-sections have an adverse effect on maternal morbidity and mortality.

Bangladesh Maternal Mortality and Health Care Survey 2016 | 103
CONCLUSION
Bangladesh has made remarkable progress in increasing demand for and utilization of maternal health
services. However, the MMR has stagnated in the past six years, after a significant decline between BMMS
2001 and BMMS 2010. While further research is needed to fully understand this stall in MMR in
Bangladesh, there is evidence of substantial deficiencies in the readiness to provide high-quality maternity
care in both the public and private sectors. Rates of C-section have increased dramatically and now
substantially exceed WHO recommendations, especially in the private sector where most facility deliveries
occur. Such high rates of C-section increase the risks to women.
The findings serve as a timely reminder that decreasing maternal mortality requires attention to both
demand and supply side factors; maternal deaths will only be prevented if women go to facilities and
facilities are fully prepared to handle obstetric emergencies when they occur.

104 | Bangladesh Maternal Mortality and Health Care Survey 2016
REFERENCES
Arifeen, S. E., Hill, K., Ahsan, K. Z., Jamil, K., Nahar, Q., & Streatfield, P. K. (2014). Maternal mortality
in Bangladesh: a Countdown to 2015 country case study. The Lancet, 384(9951), 1366–1374.
Bangladesh Bureau of Statistics. (2011). Bangladesh Population and Housing Census 2011. Retrieved
from http://catalog.ihsn.org/index.php/catalog/4376
Bangladesh Bureau of Statistics. (2017). Report on Bangladesh Sample Vital Statistics 2016. Statistics and
Informatics Division, Ministry of Planning.
Esteves-Pereira, A. P., Deneux-Tharaux, C., Nakamura-Pereira, M., Saucedo, M., Bouvier-Colle, M. H., &
do Carmo Leal, M. (2016). Cesarean delivery and postpartum maternal mortality: a population-based case
control study in Brazil. PloS One, 11(4), e0153396.
Goli, S., & Jaleel, A. C. (2014). What is the cause of the decline in maternal mortality in India? Evidence
from time series and cross-sectional analyses. Journal of Biosocial Science, 46(3), 351–365.
Ministry of Health and Family Welfare. (2016). Program Management and Monitoring Unit, Planning
Wing, Annual Program Implementation Report: July 2015–June 2016, September 2016.
Hurst, T. E., Semrau, K., Gawande, A., & Hirschhorn, L. R. (2015). Demand-side interventions for
maternal care: evidence of more use, not better outcomes. BMC pregnancy and childbirth, 15(1),
297–311.
Ministry of Health and Family Welfare (MOHFW) (2011). Population and Nutrition Sector Development
Program (HPNSDP) 2011–2016. Government of Bangladesh: MOHFW. Retrieved from
http://www.mohfw.gov.bd/index.php?option=com_content&view=article&id=166&Itemid=150&lang=en
Ministry of Health and Family Welfare (MOHFW). (2017). 4th Health, Population and Nutrition Sector
Program 2017–2022. Government of Bangladesh: MOHFW.
Mohanan, M., Miller, G., La Forgia, G., Shekhar, S., & Singh, K. (2016). Improving maternal and child
health in India: evaluating demand and supply strategies. 3ie Impact Evaluation Report 30. International
Initiative for Impact Evaluation (3ie).
National Institute of Population Research and Training (NIPORT), Associated for Community and
Population Health research (ACPR), and ICF International. 2016. Bangladesh Health Facility Survey 2014.
Dhaka, Bangladesh: NIPORT, ACPR and ICF International.
Randive, B., San Sebastian, M., De Costa, A., & Lindholm, L. (2014). Inequalities in institutional delivery
uptake and maternal mortality reduction in the context of cash incentive program, Janani Suraksha
Yojana: results from nine states in India. Social Science & Medicine, 123, 1–6.
Souza, J. P., Gülmezoglu, A. M., Lumbiganon, P., Laopaiboon, M., Carroli, G., Fawole, B., & Ruyan, P.
(2010). Cesarean section without medical indications is associated with an increased risk of adverse short-
term maternal outcomes: the 2004-2008 WHO Global Survey on Maternal and Perinatal Health. BMC
Medicine, 8(1), 71–81.
Souza, J. P., Gülmezoglu, A. M., Vogel, J., Carroli, G., et al. (2013). Moving beyond essential
interventions for reduction of maternal mortality (the WHO Multicountry Survey on Maternal and
Newborn Health): a cross-sectional study. The Lancet, 381(9879), 1747–1755.
United Nations, General Assembly. (2015). Transforming our world: The 2030 agenda for sustainable development.
Resolution adopted by the General Assembly, 70 § 1. Retrieved from
http://www.un.org/ga/search/view_doc.asp?symbol=A/RES/70/1&Lang=E

Bangladesh Maternal Mortality and Health Care Survey 2016 | 105
United Nations Development Programme (UNDP). (2015) The millennium development goals report
2015. United Nations, UNDP. Retrieved from
http://www.undp.org/content/undp/en/home/librarypage/mdg/the-millennium-development-goals-
report-2015.html
Villar, J., Carroli, G., Zavaleta, N., Donner, A., et al. (2007). Maternal and neonatal individual risks and
benefits associated with Cesarean delivery: multicentre prospective study. BMJ, 335(7628), 1025–36.
World Health Organization (WHO). (2015). Trends in maternal mortality: 1990 to 2015: Estimates by
WHO, UNICEF, UNFPA, World Bank Group and the United Nations Population Division. WHO.
World Health Organization (WHO). (2014). Authors’ calculation based on data from: Trends in maternal
mortality: 1990 to 2013: Estimates by WHO, UNICEF, UNFPA, the World Bank and the United
Nations Population Division. WHO.

106 | Bangladesh Maternal Mortality and Health Care Survey 2016
SUMMARY INDICATORS
Indicators
Bangladesh Maternal Mortality and
Health Care Survey (BMMS)
2001 2010 2016
Maternal Mortality
Maternal Mortality Ratio (MMR) per 100,000 live births 322 194 196
Pregnancy-related Maternal Mortality Ratio (PrMR)
per 100,000 live births
382 201 205
Proportion of adult female deaths due to maternal causes 20.2 14.1 13.1
Antenatal Care (ANC)
Percentage of last live births in the three years preceding
the survey for which women received at least one ANC visit
from a medically trained provider
40.1 53.7 74.4
Percentage of last live births in the three years preceding
the survey for which women received 4 or more ANC visits
11.6 23.4 37.2
Skilled Assistance at Delivery
Percentage of births in the three years preceding the
survey attended by medically trained provider
12 26.5 49.8
Percentage of births in the three years preceding the
survey delivered at a health facility
All facilities
Public facilities
Private facilities
NGO facilities
9.1
5.8
2.7
0.6
23.4
10.0
11.3
2.0
47.1
14.3
29.2
3.6
Delivery by C-Section
Percentage of births in the three years preceding the
survey delivered by C-section
2.6 12.2 30.7
Postnatal Care
Percentage of last live births in the three years preceding
the survey for which the mother received postnatal care
checkup within 2 days of delivery from a medically trained
provider
10.6 22.5 48.0
Complete Maternal Care
Percentage of last live births in the three years preceding
the survey for which the mother received at least one ANC
visit and delivery care and postnatal care checkup from a
medically trained provider
4.8 19.0 43.0
Care Seeking for Complications
Percentage of last live births in the three years preceding
the survey that had complications for which women sought
any care
52.7 67.9 67.2
Percentage of last live births in the three years preceding
the survey that had complications for which women sought
care in a health facility
15.6 28.5 46.0
APPENDIX

Bangladesh Maternal Mortality and Health Care Survey 2016 | 107
MEASURE Evaluation Carolina Population CenterUniversity of North Carolina123 W Franklin St, Suite 330Chapel Hill, NC 27516
TR-17-218 ISBN 978-1-9433-6484-8