bang & olufsen group annual report...
TRANSCRIPT

Bang & Olufsen Group
ANNUAL REPORT 2003/04
CVR-No. 41257911

17
ANNUAL REPORT 2003/04
This document is a translation of the Danish original.
In the event of any inconsistencies the Danish version shall apply.

19
21 Dear Bang & Olufsen shareholder
22 Bang & Olufsen – a brief history
24 Corporate information etc.
25 Announcements sent to the Copenhagen Stock Exchange
26 Group structure
28 Structure and management
29 Directorships in other danish and foreign companies
31 Five-year summary, main and key fi gures
33 Shareholder information
35 Directors’ report, Bang & Olufsen a/s - Group
37 Branded business
41 Non-branded business
42 Expectations for the fi nancial year 2004/05
44 Corporate Governance
45 Environmental statement
47 Knowledge resources
49 The Group’s management of fi nancial risks
51 Financial report
54 Statement by the Management on the annual report
55 Auditors’ report
57 Accounting principles applied
65 Profi t and loss account
66 Balance sheet
69 Cash fl ow statement
70 Statement of changes in equity
72 Segment information
75 Notes
CONTENTS
Click on a section title to go directly to a specifi c page...

Courage to constantly question the ordinary in search of surprising,
long-lasting experiences.
23705 Årsregnskab_UK.indd 123705 Årsregnskab_UK.indd 1 26.08.04 10:30:2526.08.04 10:30:25

BEOCENTER 2
The following pages present BeoCenter 2, Bang & Olufsen’s
latest complete entertainment system. The BeoCenter 2 story also
refl ects Bang & Olufsen’s visions and values and, in particular,
the company’s commitment to perfection.
23705 Årsregnskab_UK.indd 323705 Årsregnskab_UK.indd 3 26.08.04 10:30:3726.08.04 10:30:37

23705 Årsregnskab_UK.indd 423705 Årsregnskab_UK.indd 4 26.08.04 10:30:4326.08.04 10:30:43

INTEGRATIONA TV, a radio, a music system and a video player. For decades, this met the demands of viewers and hi-fi enthusiasts for a full range of audio and visual sources. Recent years, however, have witnessed an explosive rise in the number of sources for home entertainment as DVD and the Internet have opened up a multitude of new options. At the same time, of course, the number of boxes and cables have increased accordingly.For Bang & Olufsen’s concept developers the challenge was straightforward: to integrate and clean up! In other words: to create a single source for the provision of CD, radio, DVD and MP3 sound files from the Internet.This would have been a relatively easy assignment if not for the fact that the developers had to find a discreet, elegant and user-friendly solution within Bang & Olufsen’s rich tradition for product quality and advanced, yet timeless, design. Bridging the gap between a technical prototype the size of a jukebox and the genuine Bang & Olufsen product was, therefore, not only a question of achieving full integration. Separation became another crucial component.
23705 Årsregnskab_UK.indd 523705 Årsregnskab_UK.indd 5 26.08.04 10:31:1226.08.04 10:31:12

SEPARATIONDuring the early stages, the concept developers consistently failed to meet their own high standards. The prototype was too large and it seemed impossible to do away with the plethora of cables for TV, speakers, aerials and computers. In their quest for the perfect solution the concept developers were eventually forced to drop the single integrated concept and divide the product into two – a control unit and socket panel. The user, therefore, now sees only 50% of the BeoCenter 2 in operation. The elegant control unit, that operates all the available sources, can now be positioned wherever the user requires. A simple black cable leads to the socket panel where the signals are split and channelled into the appropriate locations and can be placed almost anywhere.
23705 Årsregnskab_UK.indd 623705 Årsregnskab_UK.indd 6 26.08.04 10:31:4026.08.04 10:31:40

23705 Årsregnskab_UK.indd 723705 Årsregnskab_UK.indd 7 26.08.04 10:32:3626.08.04 10:32:36

23705 Årsregnskab_UK.indd 823705 Årsregnskab_UK.indd 8 26.08.04 10:33:2426.08.04 10:33:24

INSPIRATIONDavid Lewis, Bang & Olufsen’s Chief Designer, found his inspiration from an unexpected quarter after he and the concept developers had worked on the design of BeoCenter 2 for some time without achieving the desired result. One day, however, when leafing through a hotel magazine, Lewis came across a profile of the hotel’s architect accompanied by a photo of a pink, elliptical sculpture. David Lewis immediately realised that he had found the perfect shape for BeoCenter 2. With its soft, rounded edges the shape would be ideal for the circular DVD and CD format where wing-shaped covers would form a perfect circle when, silently, they moved aside.David Lewis had little doubt that the surface should be polished aluminium, smooth as silk and asking to be touched. The buttons should be part of the surface – yet another technical challenge for Bang & Olufsen’s engineers!
23705 Årsregnskab_UK.indd 923705 Årsregnskab_UK.indd 9 26.08.04 10:36:4126.08.04 10:36:41

MILLED EDGESAlthough Bang & Olufsen’s engineering factory ranks among the global leaders within the world of aluminium processing, BeoCenter 2 posed a massive test of skill. To ensure that the two aluminium wings, which form a perfect oval, are in total synthesis, they are cut from the same sheet – although not until after the surface has been polished so that all details from the polishing are replicated in both wings. The wings are subsequently subjected to identical treatments. When the edges are milled, a milling machine calculates and adjusts at a scale of 1/100 mm to ensure a perfect oval.Following the anodising process, which opens up the tiny pores in the aluminium, colour is injected into the aluminium to allow for the imprint of icons and fi gures. A hardening process to guarantee a level of durability where it is virtually impossible for the imprints to wear away, even with constant use, follows this “silk-screen printing”.
Finally, the wings are exposed to the most diffi cult process of all:
23705 Årsregnskab_UK.indd 1023705 Årsregnskab_UK.indd 10 26.08.04 10:40:1326.08.04 10:40:13

PAPER THIN ALUMINIUMThe aim was to achieve an effect where the slightest pressure on the smooth aluminium surface opens up the wings, activates the DVD and adjusts the volume. To achieve this, however, was no easy matter. Theoretically, the task is simple. After the aluminium is milled down to 0.5 mm, a foil of sensitive conducting material is placed underneath the aluminium sheet. This registers when the aluminium bends slightly to the touch and activates the electrical circuits for the relevant function. The volume control, Bang & Olufsen’s characteristic “wheel”, however, requires a further thin layer to be removed so that the aluminium is reduced to 0.4 mm here. In practice, this demands precision tooling of the very highest order because using aluminium of such delicacy incurs the risk that even a slight movement can damage the wings. In their search for a solution, the experts in the Engineering Department spent countless hours experimenting with methods and tools. The resulting process is now the most sensitive part of BeoCenter 2 production in as much as any errors may mean that both wings must be discarded, so negating the entire process.
23705 Årsregnskab_UK.indd 1123705 Årsregnskab_UK.indd 11 26.08.04 10:42:2826.08.04 10:42:28

MAGICA light click and the wings slide silently aside while the loader rises to receive the DVD or the CD. By pressing “load” again, everything slides back into place – effortlessly and with no visible mechanical parts. Behind the magic, however, lie endless hours of demanding engineering work. Several small mechanisms and extremely precise gearing make it all possible – a soft start, maximum speed midway and a soft ending make for movements that are both elegant and effortless. In fact, the Listening Panel often sent the engineers back to the drawing board because the noise from the moving parts failed to match the visual picture. Bang & Olufsen’s Listening Panel consists of ordinary people – albeit with extremely sensitive hearing. They not only evaluate Bang & Olufsen’s loudspeakers and general sound quality, but also the sound emanating from operating panels and mechanical movements. The clicks must sound right and the wings produce the desired, almost imperceptible, swoosh. Only after endless experiments and adjustments did the engineers obtain the Listening Panel’s approval.
23705 Årsregnskab_UK.indd 1223705 Årsregnskab_UK.indd 12 26.08.04 10:43:5426.08.04 10:43:54

23705 Årsregnskab_UK.indd 1323705 Årsregnskab_UK.indd 13 26.08.04 10:45:1326.08.04 10:45:13

23705 Årsregnskab_UK.indd 1423705 Årsregnskab_UK.indd 14 26.08.04 10:45:4126.08.04 10:45:41

QUALITYWhen all the parts of BeoCenter 2 are ready, the fi nal assembly takes place by hand. This demands experienced and careful handling, and cannot be done by machine. Each specifi c part is inspected and assessed to ensure that it meets Bang & Olufsen’s rigorous quality requirements. In addition, all the individual parts of the product are coded to provide data regarding the materials they contain. Assembly itself is designed to make for easy dismantling of the product. BeoCenter 2 weighs 7 kg including 5.3 kg metal and 0.4 kg plastic with the remainder consisting of glass. When the product eventually reaches the end of its life, the vast majority of the materials can be recycled. This is greatly assisted by the special assembly procedures and the marking of the parts. As a result, very little ever goes to waste.
23705 Årsregnskab_UK.indd 1523705 Årsregnskab_UK.indd 15 26.08.04 19:28:2726.08.04 19:28:27
THE EXAMPLE
The story behind BeoCenter 2 is not unique – it is one out of
many examples of how Bang & Olufsen works with ideas, product
development and production.
Thus the story exemplifi es the knowledge, resources and the
commitment of the staff that underpin Bang & Olufsen’s success
as a business – and as a provider of innovative and inspiring
technological solutions for the audio-visual market worldwide.
Every single Bang & Olufsen product tells a similar story...
23705 Årsregnskab_UK.indd 1623705 Årsregnskab_UK.indd 16 26.08.04 10:49:4826.08.04 10:49:48

17
ANNUAL REPORT 2003/04
This document is a translation of the Danish original.
In the event of any inconsistencies the Danish version shall apply.

95

19
21 Dear Bang & Olufsen shareholder
22 Bang & Olufsen – a brief history
24 Corporate information etc.
25 Announcements sent to the Copenhagen Stock Exchange
26 Group structure
28 Structure and management
29 Directorships in other danish and foreign companies
31 Five-year summary, main and key fi gures
33 Shareholder information
35 Directors’ report, Bang & Olufsen a/s - Group
37 Branded business
41 Non-branded business
42 Expectations for the fi nancial year 2004/05
44 Corporate Governance
45 Environmental statement
47 Knowledge resources
49 The Group’s management of fi nancial risks
51 Financial report
54 Statement by the Management on the annual report
55 Auditors’ report
57 Accounting principles applied
65 Profi t and loss account
66 Balance sheet
69 Cash fl ow statement
70 Statement of changes in equity
72 Segment information
75 Notes
CONTENTS
Click on a section title to go directly to a specifi c page...

20
Torben Ballegaard Sørensen
Peter Thostrup

21
DEAR BANG & OLUFSEN SHAREHOLDER,
Last year we stated that we expected the 2003/04 financial year to be a year of substantial challenges in respect of turnover and revenue generation – for each shop, each sales subsidiary and all Danish departments. The year, indeed, proved to be a major challenge with turnover in several of the Bang & Olufsen Group’s markets falling below last year’s level.
While economic conditions have curbed consumer spending the sale of TVs has been influenced by the rapid switch in demand from tube TVs to flat-screen based TVs, a change in technology and form the size of which the sector has not experienced for many years. The change has been particularly pronounced on the Southern and Central European markets, while our classical TVs’ high quality and unique design causes the sale on other markets e.g. in Scandinavia and the UK to continue satisfactory.
On the backdrop of this important technological development and the opportunities arising from it, we have allocated more resources to product development. Consequently, we are in these years launching a substantial number of new products especially within the field of TV. We expect the new flat-screen TVs to offer important, long-term growth potential for the Bang & Olufsen Group, although for the current year, the many new launches will together with the traditional product programme ensure a stable sale and ensure Bang & Olufsen’s position as the leading supplier of quality TVs.
Within the area of product development, we shall also focus more broadly on the transition from analogue to digital technology. The rapidly increasing range of digitally transmitted entertainment enables the development of new concepts where conventional audio/video technologies are combined with computer technologies. Our aim is to be at the cutting edge of this development and ensure that our customers will benefit from the digitalisation processes without affecting quality, taste and simplicity.
In tandem with our other important activities, product development must be funded from revenues. It is, therefore, pleasing to note that we have succeeded in achieving the planned revenue targets despite the lower turnover.
On the market side, we are preparing to exploit the opportunities arising from our many product launches. Intensive endeavours aim at strengthening
the marketing operations and the activities in the individual Bang & Olufsen shops. The qualitative development of our overall distribution is also being maintained.
China is poised to become a new and important market. In the coming financial year we will open three new B1 shops on the Chinese market, which is currently experiencing rapid development. We are confident that there is now a market for Bang & Olufsen’s products in China and initially, we shall open two shops – one in the Guangdong province and one in Shanghai. A shop in Beijing will follow later in the year.
We expect positive sales trends in the UK, Asia, Scandinavia, Southern Europe, Eastern Europe and the Middle East.
Spearheaded by Switzerland and Germany, Central Europe continues to present challenges. We believe, however, that the results of the endeavours aimed at improving the quality of the distribution in these two markets will materialise over the slightly longer term. We are working determinedly to re-establish growth in Germany and Switzerland although we are aware that this requires substantial commitment.
The US also continues to pose challenges. In the past financial year, however, we succeeded in creating greater stability and reducing our losses. In the fourth quarter, the operating result in the US market was positive. We expect to see growth in the US market in the coming financial year and will continue with the measures aimed at improving the situation, which we initiated a few years ago.
In view of our sound financial situation and the new product launches, we are confident that we are well poised to maintain the positive development – even though market uncertainties are greater than they have been for many years.
Bang & Olufsen’s excellent results are primarily due to the efforts of our 2,300 committed employees and we wish to thank them for this. We would also like to express our thanks to our dealers and loyal customers around the world as well as to our faithful shareholders.
Torben Ballegaard Sørensen President & CEO
Peter ThostrupExecutive Vice President

22
BANG & OLUFSEN - A BRIEF HISTORY
Although in global terms, Bang & Olufsen’s size is relatively modest, the company has achieved world renown for its spectacular, idea-based and enduring electronic products. The company develops and manufactures a broad range of products from TVs, audio systems, loudspeakers, telephones and digital amplifier units to products for the medical technology industry.
Almost all development, product maturation and production are centred at the Group’s head office in Struer in Western Jutland. Bang & Olufsen’s vision is expressed in the sentence: “Courage to constantly question the ordinary in search of surprising, long lasting experiences” – a sentence with which Bang & Olufsen’s 2,300 employees across the world identify with pride.
HistoryBang & Olufsen was founded in 1925 by two young Danish engineers, Peter Bang and Svend Olufsen. They had gotten to know each other during their studies, and shared an enthusiasm for the new phenomenon of the age: The radio.
The early beginnings were modest indeed. In the first few years, Peter Bang and Svend Olufsen worked out of the attic at the Olufsen family’s manor house, Quistrup, just outside Struer. Here the two young men undertook the majority of tasks themselves, aided by the estate’s workers when required. Svend’s mother, Anna Olufsen, supported them financially.
The first pioneering product, however, was not the radio, which they dreamed about, but the “Eliminator” – a mains receiver that did away with the need for batteries. The timing was perfect – the Eliminator entered the market as electricity began to become the norm in Danish households. It, therefore, provided Bang & Olufsen with the badly needed start-up capital, which allowed the business to move into its own factory in the village of Gimsing, which at the time was outside Struer, but which today is part of the town.
In the final months of the Second World War, however, the factory was destroyed by Danish Nazi sympathisers as revenge for Bang & Olufsen’s refusal to work for the German occupying forces and because many of its employees were involved in the Danish Resistance. In the subsequent years, Bang & Olufsen not only fought to survive in the marketplace, but also fought to rebuild the factory.
During the 1950s and 60s, Bang & Olufsen successfully established a recognised name in the Danish market as “The Danish Quality Brand”.
When, at the end of the 1960s, competition from Asian manufacturers forced scores of Danish and European radio and TV factories to close, Bang & Olufsen allied itself with a group of architects and designers and set about focusing on the ideas and the design behind the products as well as on quality. The strategy proved hugely successful and the company had now found the niche that enabled it to survive. Around the same time, Bang & Olufsen started the exports that today account for more than 80% of its revenue.
In the late 1980s and early 90s, dark clouds once again gathered over Bang & Olufsen. Earnings did not match the turnover and the Group had insufficient funds to weather the storm. A largescale disposal of its non-core activities was executed and a new distribution strategy launched: No longer should Bang & Olufsen’s products be sold through general radio/TV stores, which sold a variety of brands, but through dedicated outlets, which only dealt in Bang & Olufsen products and, therefore, had a special loyalty to the brand as well as specialised knowledge of the products.
The renewed focus on the core business and a fresh distribution strategy proved so successful that towards the end of the 90s, Bang & Olufsen once again enjoyed growth in both turnover and revenue – on the strength of a sound financial base.
DistributionTight focus on core skills and the commitment to the dedicated Bang & Olufsen distribution continues to this day where sales take place through two types of dedicated Bang & Olufsen shops: - B1 shops, which only sell Bang & Olufsen products - Shop in shop outlets (SIS) where a significant area of the shop is designed for, and exclusively allocated to, Bang & Olufsen’s products.
Bang & Olufsen’s products are currently available from 642 B1 shops and 670 shop in shops. The B1 shops account for 70% of the total turnover while the shop in shop outlets account for 24%.

23
Bang & Olufsen will continue to focus on these two types of shops with the B1 shops as the most important and the shop in shop outlets as an important distribution channel in areas where the demographics do not yet justify a B1 shop.
MarketsBang & Olufsen’s products are today available around the world and 83% of the Group’s turnover derives from exports. In a number of markets, operations are handled by Bang & Olufsen’s own subsidiaries, c.f. the review on page 27, while sales and distribution-development in certain overseas markets is organised by highly qualified business partners.
ProductionMost of Bang & Olufsen’s production is centred in Struer where the factories are located alongside the Development Department, Administration and the Group’s Head Office. Many parts and a few finished products are, however, manufactured by suppliers across the world. A carefully considered in- and outsourcing process continually aims at optimising efficiency as well as quality.
During the past financial year, Bang & Olufsen decided to transfer its electronics factory in Skive to the international electronics group, Flextronics International Ltd., in order to focus the resources on core skills and to strengthen the electronics factory’s competitiveness by being part of the world’s leading manufacturer. Bang & Olufsen will maintain close ties with the factory in Skive with regard to development and production and the Development Department will have access to a substantially larger global range of advanced technologies.
During the year, Bang & Olufsen also decided to set up the first own production abroad of parts and processes that cannot be outsourced to a third party. The choice fell on the Czech Republic where Bang & Olufsen expects to create approximately 200 jobs over the next few years.
Bang & Olufsen is an order-producing company, which means that production of individual products only begins once the customer has submitted his/her order. This negates the need for large quantities of stock and minimises the risk of overstocking. In addition, it offers more flexibility and significantly increases opportunities for adapting the product to the individual customer’s requirements.
Most of Bang & Olufsen’s products are manufactured in a very large number of varieties, depending on the customer’s specific wishes.
Product development“Idealand” is Bang & Olufsen’s incubator for new concepts and products. Just below the roof in the old, rebuild Factory 1, the concept developers work in close collaboration with both external designers and with engineers and technicians in the Development Department to give substance to the ideas. “Synthesis” is the key word – as technology and design not only go hand in hand, but add a new dimension to each other. The objective is for Bang & Olufsen to launch between three and five new groundbreaking products each year.
The factories in Struer play a major role with regard to quality assurance in the assembly and finishing of the products as well as during their development. For the 500 engineers and technicians involved in the development of Bang & Olufsen products, the opportunities for direct interaction with the production departments are of the utmost importance in order to ensure that the finished products contain the desired features and quality.
Branded and non-branded businessBesides the development, production and sales of audio/video products and telephones, designated the “branded business”, Bang & Olufsen is engaged in the development, production and sales of compact, digital amplifier units and the development and production of products for the medical technology industry, i.e. the “non-branded business”.
Bang & Olufsen ICEpower a/s is a subsidiary responsible for development, production and sales of digital amplifier modules based on the Bang & Olufsen patented ICEpower technology – a technology that enables very small digital amplifiers to provide extremely high performance with particularly low heat output.
Bang & Olufsen Medicom a/s is a subsidiary responsible for the development and production of products for the medical technology industry. These products require a superior degree of production precision - “intelligent products” - such as tablet dispensers that register and indicate whether the patient has remembered to take his/her medicine.
24
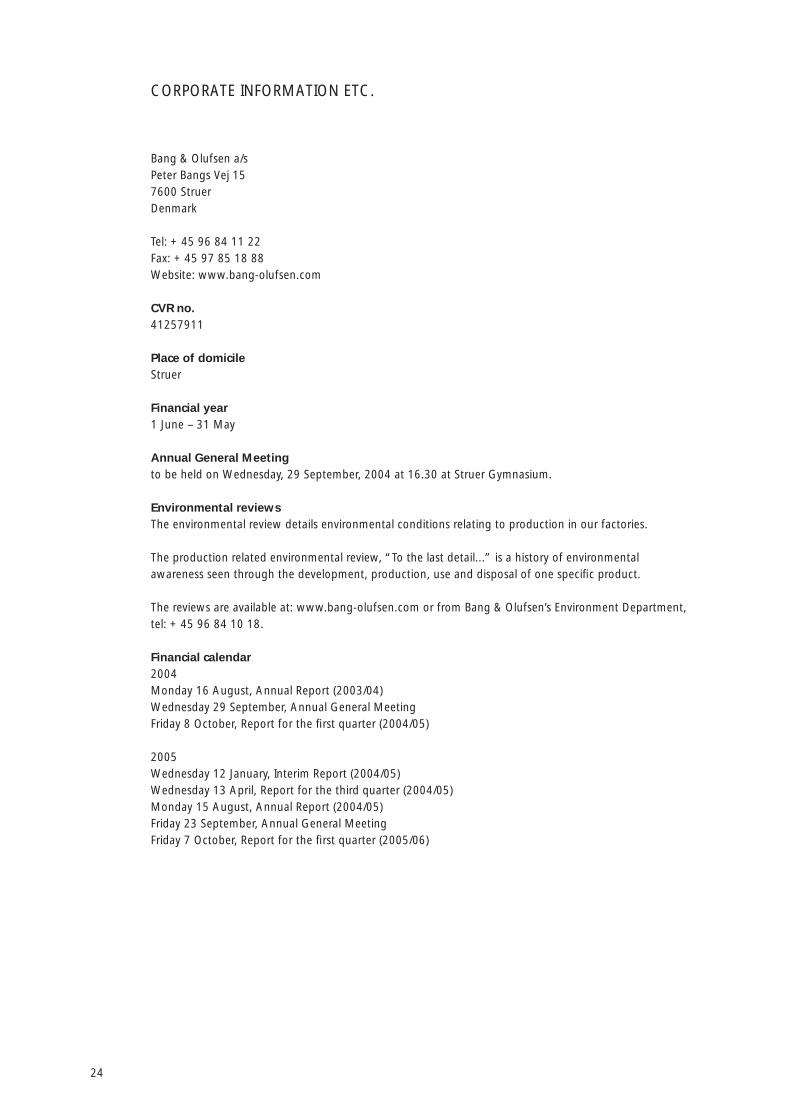
Bang & Olufsen a/sPeter Bangs Vej 157600 StruerDenmark
Tel: + 45 96 84 11 22Fax: + 45 97 85 18 88Website: www.bang-olufsen.com
CVR no. 41257911
Place of domicile Struer
Financial year1 June – 31 May
Annual General Meeting to be held on Wednesday, 29 September, 2004 at 16.30 at Struer Gymnasium.
Environmental reviewsThe environmental review details environmental conditions relating to production in our factories.
The production related environmental review, “To the last detail...” is a history of environmental awareness seen through the development, production, use and disposal of one specifi c product.
The reviews are available at: www.bang-olufsen.com or from Bang & Olufsen’s Environment Department, tel: + 45 96 84 10 18.
Financial calendar2004Monday 16 August, Annual Report (2003/04)Wednesday 29 September, Annual General MeetingFriday 8 October, Report for the fi rst quarter (2004/05)
2005Wednesday 12 January, Interim Report (2004/05)Wednesday 13 April, Report for the third quarter (2004/05)Monday 15 August, Annual Report (2004/05)Friday 23 September, Annual General MeetingFriday 7 October, Report for the fi rst quarter (2005/06)
CORPORATE INFORMATION ETC.

25
15 August, 2003 Financial statement for the fi nancial year 2002/03
4 September, 2003 Holding of own shares
18 September, 2003 Notice of Annual General Meeting
10 October, 2003 Report for the 1st quarter (2003/04)
10 October, 2003 Resolutions taken at the Annual General Meeting
11 December, 2003 Employee shares
14 January, 2004 Interim Report (2003/04)
18 March, 2004 Sale of the factory in Skive to Flextronics International Ltd.
20 April, 2004 Report for the 3rd quarter (2003/04)
3 June, 2004 Financial calendar and new employee representative on the Board of Directors
10 June, 2004 Reduction of capital in Bang & Olufsen a/s
The announcements can be read in full at www.bang-olufsen.com under Corporate Info (Investors).
ANNOUNCEMENTS SENT TO THE COPENHAGEN STOCK EXCHANGE BETWEEN AUGUST 2003 - AUGUST 2004

26
Bang & Olufsen a/s
Brand building, Group staff functions.
Bang & Olufsen AudioVisual a/s *
100% owned
Development and sales of
Bang & Olufsen’s audio/video products with
focus on global distribution development.
Bang & Olufsen Operations a/s
100% owned
Purchasing, production and logistics
for the Bang & Olufsen Group.
Bang & Olufsen Telecom a/s
100% owned
Develops and markets new telephony
concepts as dynamic part of the electronic
communication in the home.
Bang & Olufsen New Business a/s**
100% owned
Develops new business areas based
on Bang & Olufsen’s competencies
and market position.
Bang & Olufsen ICEpower a/s
90% owned
Develops, produces and markets products
based on highly effective amplifier
technologies.
Bang & Olufsen Medicom a/s
100% owned
Exploits Bang & Olufsen’s competencies
within the medico area in co-operation
with current as well as new partners.
* All companies in Bang & Olufsen AudioVisual a/s are 100% owned.
** From 1 June, 2004, the activities have been carried out by other Group companies. The company was subsequently dissolved.
Bang & Olufsen a/s now owns the shares of Bang & Olufsen ICEpower a/s.
Dormant companies have not been included.
Branded business Non-branded business
GROUP STRUCTURE

27
Scandinavia
Management: Lars Kirstein Andersen
Denmark
Bang & Olufsen Danmark a/s
Kalvebod Brygge 43, 1560 Copenhagen V.
Management: Lars Kirstein Andersen
Carsten Schulz Sander
Norway
Bang & Olufsen AS
Drammensveien 123, Postboks 645
Skøyen, 0214 Oslo
Management: Hans Olav Hole
Sweden
Bang & Olufsen Svenska AB
Drottninggatan 57, 111 21 Stockholm
Management: Tommie Lindberg
Central Europe
Management: Peter Dalm
Germany
Bang & Olufsen Deutschland G.m.b.H.
Rudolf-Diesel-Strasse 8, 82205 Gilching,
München
Management: Peter Dalm
Switzerland
Bang & Olufsen AG
Grindelstrasse 15, 8303 Bassersdorf
Management: Heinz Müller
Austria
Bang & Olufsen Ges.m.b.H.
Hauptplatz 7, 3430 Tulln
Management: Peter Dalm
Rest of Europe
The UK/Benelux
Management: Derek Mottershead
United Kingdom
Bang & Olufsen United Kingdom Ltd.
UNIT 630, Wharfedale Road,
Winnersh Triangle, Berkshire RG41 5TP
Management: Derek Mottershead
Belgium
S.A. Bang & Olufsen Belgium N.V.
Heide 9, 1780 Wemmel
Management: Peter Sommer
Holland
Bang & Olufsen b.v.
Postbus 111, Franciskasweg 291
1200 AC Hilversum
Management: Derek Mottershead
France
Bang & Olufsen France S.A.
141 rue Jules Guesde,
92300 Levallois-Perret
Management: Alberto de Lucio
Spain
Bang & Olufsen Espana S.A.
Avenida Europa 2,
Parque Empresarial La Moraleja,
28108 Alcobendas, Madrid
Management: Alberto de Lucio
Italy
Bang & Olufsen Italia S.p.A.
Via Meravigli 2, 20123 Milano
Management: Francesco Canale
North America
The US
Bang & Olufsen America Inc.
780 West Dundee Road,
Arlington Heights, IL-60004
Management: Michael Aagaard Andersen
Kim Gravesen
Asia
Management: Lars Myrup
Japan
Bang & Olufsen Japan K. K.
Shiba Boat Building 9th floor, 3-1-15,
Shiba, Minato-Ku, Tokyo 105-0014
Management: Lars Myrup
Singapore
Bang & Olufsen Asia Pte Ltd.
23, Ubi Road 4, 5th floor,
Olympia Industrial Building,
Singapore 408620
Management: Lars Myrup

28
Company Board of Directors Board of Management
Bang & Olufsen a/s Jørgen Worning (Chairman) Torben Ballegaard Sørensen
Struer. Torsten Erik Rasmussen (Deputy Chairman) (President & CEO)
CVR no. 41257911 Lars Brorsen Peter Thostrup
Knud Olesen*
John Svejgaard Christoffersen*
Thorleif Krarup
Ole Kristian Olesen*
Peter Leschly
Peter Skak Olufsen
Bang & Olufsen AudioVisual a/s Jørgen Worning (Chairman) Torben Ballegaard Sørensen (CEO)
Struer. (100% owned) Torsten Erik Rasmussen Peter Thostrup
CVR no. 26035384 Peter Leschly Peter Eckhardt
Torben Ballegaard Sørensen
Peter Thostrup
Bang & Olufsen Telecom a/s Torben Ballegaard Sørensen (Chairman) Peter Thostrup (CEO)
Struer. (100% owned) Peter Thostrup
CVR no. 24062112 John Christian Bennett-Therkildsen
Bang & Olufsen New Business a/s** Peter Thostrup (Chairman) Torben Ballegaard Sørensen (CEO)
Struer. (100% owned) Torben Ballegaard Sørensen
CVR no. 25051637 Flemming Møller Pedersen
Bang & Olufsen Operations a/s Peter Thostrup (Chairman) John Christian Bennett-Therkildsen
Struer. (100% owned) Torben Ballegaard Sørensen (CEO)
CVR no. 26035406 John Christian Bennett-Therkildsen
Bang & Olufsen Medicom a/s Peter Thostrup (Chairman) Henrik Kagenow (CEO)
Struer. (100% owned) Torben Ballegaard Sørensen Jens Peter Zinck
CVR no. 24053415 Henrik Kagenow
Bang & Olufsen ICEpower a/s** Torben Ballegaard Sørensen (Chairman) Poul Henrik Søjberg (CEO)
Lyngby-Tårbæk. (90% owned) Henrik Mouritsen
CVR no. 25053591 Karsten Nielsen
Jens Peter Zinck
* Elected by the employees
** From 1 June, 2004, the activities have been carried out by other Group companies. The company was subsequently dissolved.
Bang & Olufsen a/s now owns the shares of Bang & Olufsen ICEpower a/s.
Main banker for all companies
Danske Bank A/S
Auditors for all companies
PricewaterhouseCoopers, Statsautoriseret Revisionsinteressentskab
Deloitte, State-Authorised Public Accounting Company
STRUCTURE AND MANAGEMENT

29
Jørgen Worning
FLS Industries A/S (CM)
Chr. Hansen Holding A/S (CM)
Dansk Toksikologi Center (CM)
Torsten Erik Rasmussen
Coloplast A/S
JAI A/S (DCM)
Vola Holding A/S
Best Buy Group A/S (CM)
Uni-Chains A/S (CM)
Bekaert Handling Group A/S (CM)
Vestas Wind Systems A/S
A/S Det Østasiatiske Kompagni (DCM)
TK Development A/S (DCM)
Amadeus Invest A/S (CM)
Louis Poulsen Holding A/S
Bison A/S
ECCO SKO A/S
Scandinavian International Management
Institute Fonden, København
Schur International A/S
Acadia Pharmaceuticals Inc.
NatImmune A/S
Outdoor Holding A/S
Oase Outdoors ApS (CM)
Lars Brorsen
Vorsitzender der Geschäftsführung
von Jorst-World GmbH
Thorleif Krarup
TDC A/S (CM)
Group 4 Securicor
H. Lundbeck A/S (DCM)
Scion DTU
Lundbeckfonden
LFI A/S (DCM)
Danmark Amerika Fonden
CM = Chairman
DCM = Deputy Chairman
Peter Leschly
Cimbria A/S (DCM)
Energiens Hus ApS
Jernstøberiet Dania A/S
Sahva A/S (CM)
Tinglev Elementfabrik A/S (CM)
Trip Trap Danmark A/S (CM)
Trip Trap Woodcare A/S (DCM)
Trelleborg Hadsten A/S (CM)
KPC BYG A/S (CM)
SDC DanDisc A/S (DCM)
Agramkow A/S (CM)
ALO Danmark A/S (CM)
dfi - dansk formplade industri a/s
Omada A/S (CM)
JKE Design A/S
Licentia Holding A/S (CM)
Peter Skak Olufsen
A/S Fiil-Sø (CM)
Fiilsø Svineavl A/S (CM)
Hunsballe Frø A/S (CM)
Hedeselskabet A/S (CM)
JP/Politikens Hus A/S
Zelder BV
Torben Ballegaard Sørensen
SimCorp A/S
Peter Thostrup
Nordic Bioscience A/S (CM)
CCBR A/S
DIRECTORSHIPS IN OTHER DANISH AND FOREIGN COMPANIES WITH THE EXCEPTION OF WHOLLY-OWNED SUBSIDIARIES

30
The key figures are defined
as follows:
Profit ratio:
Operating profit x 100Net turnover
Rate of return:
Operating profit x 100 Average operational assets
Return on equity:
Ordinary result after tax x 100Average equity
Current ratio:
Current assets Current liabilities
Equity ratio:
Equity at year-end x 100Liabilities at year-end
Earnings per share (nominal DKK 10):
Ordinary result after tax Average number of circulating shares
Intrinsic value (nominal DKK 10):
Equity at year-end No. of shares at year-end
Price/earnings:
Quoted share price Earnings per share (nom. DKK 10)
DKK million
400
300
200
100
0
99/0
0
00/0
1
01/0
2
02/0
3
03/0
4
Operating profit
%
40
30
20
10
0
99/0
0
00/0
1
01/0
2
02/0
3
03/0
4
Return on equity
DKK million
400
200
0
-200
-400
99/0
0
00/0
1
01/0
2
02/0
3
03/0
4
Cash flow
DKK million
400
300
200
100
0
99/0
0
00/0
1
01/0
2
02/0
3
03/0
4
Result from ordinary operations
31
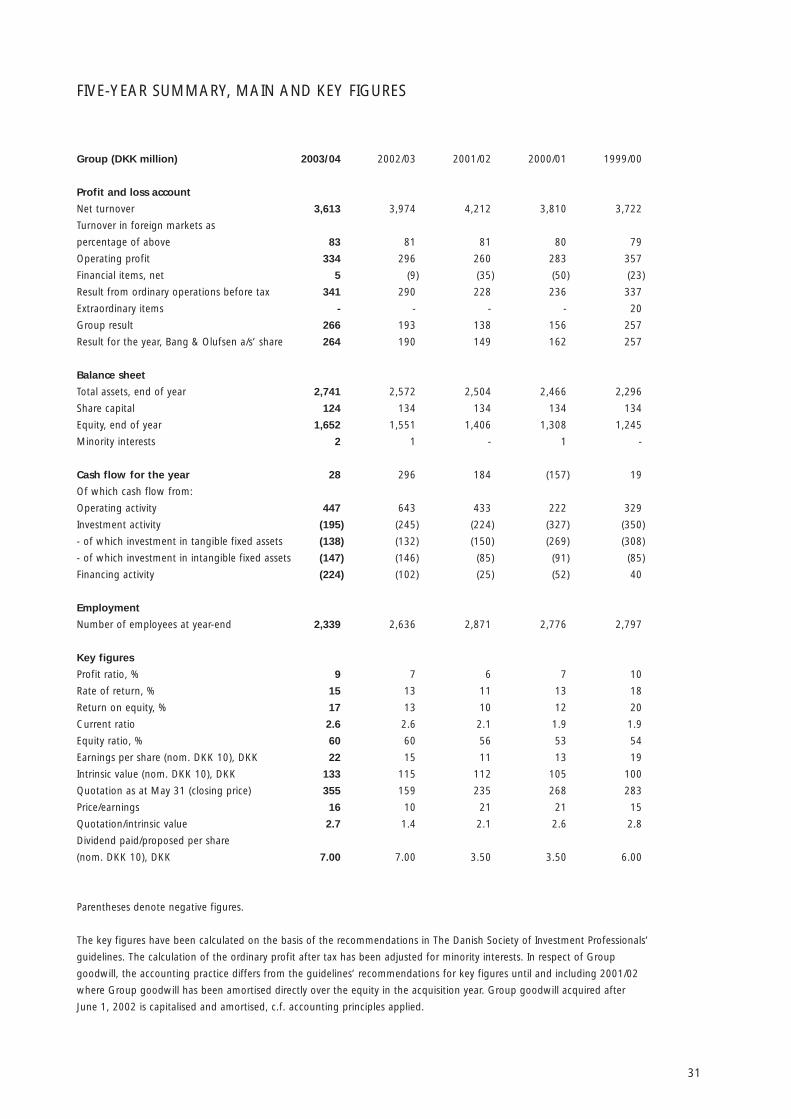
Group (DKK million) 2003/04 2002/03 2001/02 2000/01 1999/00
Profit and loss account
Net turnover 3,613 3,974 4,212 3,810 3,722
Turnover in foreign markets as
percentage of above 83 81 81 80 79
Operating profit 334 296 260 283 357
Financial items, net 5 (9) (35) (50) (23)
Result from ordinary operations before tax 341 290 228 236 337
Extraordinary items - - - - 20
Group result 266 193 138 156 257
Result for the year, Bang & Olufsen a/s’ share 264 190 149 162 257
Balance sheet
Total assets, end of year 2,741 2,572 2,504 2,466 2,296
Share capital 124 134 134 134 134
Equity, end of year 1,652 1,551 1,406 1,308 1,245
Minority interests 2 1 - 1 -
Cash flow for the year 28 296 184 (157) 19
Of which cash flow from:
Operating activity 447 643 433 222 329
Investment activity (195) (245) (224) (327) (350)
- of which investment in tangible fixed assets (138) (132) (150) (269) (308)
- of which investment in intangible fixed assets (147) (146) (85) (91) (85)
Financing activity (224) (102) (25) (52) 40
Employment
Number of employees at year-end 2,339 2,636 2,871 2,776 2,797
Key figures
Profit ratio, % 9 7 6 7 10
Rate of return, % 15 13 11 13 18
Return on equity, % 17 13 10 12 20
Current ratio 2.6 2.6 2.1 1.9 1.9
Equity ratio, % 60 60 56 53 54
Earnings per share (nom. DKK 10), DKK 22 15 11 13 19
Intrinsic value (nom. DKK 10), DKK 133 115 112 105 100
Quotation as at May 31 (closing price) 355 159 235 268 283
Price/earnings 16 10 21 21 15
Quotation/intrinsic value 2.7 1.4 2.1 2.6 2.8
Dividend paid/proposed per share
(nom. DKK 10), DKK 7.00 7.00 3.50 3.50 6.00
Parentheses denote negative figures.
The key figures have been calculated on the basis of the recommendations in The Danish Society of Investment Professionals’
guidelines. The calculation of the ordinary profit after tax has been adjusted for minority interests. In respect of Group
goodwill, the accounting practice differs from the guidelines’ recommendations for key figures until and including 2001/02
where Group goodwill has been amortised directly over the equity in the acquisition year. Group goodwill acquired after
June 1, 2002 is capitalised and amortised, c.f. accounting principles applied.
FIVE-YEAR SUMMARY, MAIN AND KEY FIGURES

32
Bang & Olufsen share price
KFX - index
Development in quoted share price for
Bang & Olufsen’s ordinary shares compared
to the KFX index as at 31 May
Market value of shares
Equity
Market value of shares compared
to equity as at 31 May
Share price
500
400
300
200
100
0
99/0
0
00/0
1
01/0
2
02/0
3
03/0
4
DKK million
6.000
5.000
4.000
3.000
2.000
1.000
0
99/0
0
00/0
1
01/0
2
02/0
3
03/0
4
Ordinary shares (multiple voting shares) not listed on the
Copenhagen Stock Exchange are included at the same
price as the ordinary shares.
33
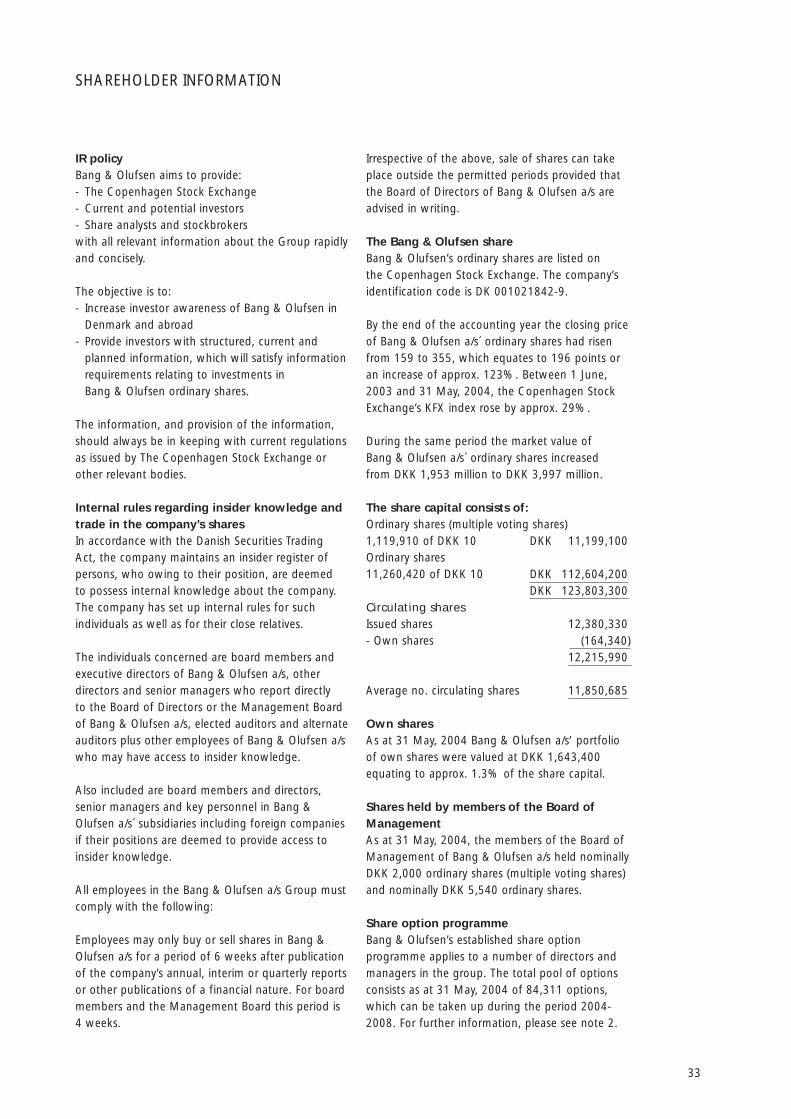
IR policyBang & Olufsen aims to provide:- The Copenhagen Stock Exchange- Current and potential investors- Share analysts and stockbrokerswith all relevant information about the Group rapidly and concisely.
The objective is to:- Increase investor awareness of Bang & Olufsen in Denmark and abroad- Provide investors with structured, current and planned information, which will satisfy information requirements relating to investments in Bang & Olufsen ordinary shares. The information, and provision of the information, should always be in keeping with current regulations as issued by The Copenhagen Stock Exchange or other relevant bodies.
Internal rules regarding insider knowledge and trade in the company’s sharesIn accordance with the Danish Securities Trading Act, the company maintains an insider register of persons, who owing to their position, are deemed to possess internal knowledge about the company. The company has set up internal rules for such individuals as well as for their close relatives.
The individuals concerned are board members and executive directors of Bang & Olufsen a/s, other directors and senior managers who report directly to the Board of Directors or the Management Board of Bang & Olufsen a/s, elected auditors and alternate auditors plus other employees of Bang & Olufsen a/s who may have access to insider knowledge.
Also included are board members and directors, senior managers and key personnel in Bang & Olufsen a/s´ subsidiaries including foreign companies if their positions are deemed to provide access to insider knowledge.
All employees in the Bang & Olufsen a/s Group must comply with the following:
Employees may only buy or sell shares in Bang & Olufsen a/s for a period of 6 weeks after publication of the company’s annual, interim or quarterly reports or other publications of a financial nature. For board members and the Management Board this period is 4 weeks.
Irrespective of the above, sale of shares can take place outside the permitted periods provided that the Board of Directors of Bang & Olufsen a/s are advised in writing.
The Bang & Olufsen shareBang & Olufsen’s ordinary shares are listed on the Copenhagen Stock Exchange. The company’s identification code is DK 001021842-9.
By the end of the accounting year the closing price of Bang & Olufsen a/s´ ordinary shares had risen from 159 to 355, which equates to 196 points or an increase of approx. 123%. Between 1 June, 2003 and 31 May, 2004, the Copenhagen Stock Exchange’s KFX index rose by approx. 29%.
During the same period the market value of Bang & Olufsen a/s´ ordinary shares increased from DKK 1,953 million to DKK 3,997 million.
The share capital consists of: Ordinary shares (multiple voting shares)1,119,910 of DKK 10 DKK 11,199,100 Ordinary shares11,260,420 of DKK 10 DKK 112,604,200 DKK 123,803,300Circulating sharesIssued shares 12,380,330 - Own shares (164,340) 12,215,990
Average no. circulating shares 11,850,685
Own sharesAs at 31 May, 2004 Bang & Olufsen a/s’ portfolio of own shares were valued at DKK 1,643,400 equating to approx. 1.3% of the share capital.
Shares held by members of the Board of ManagementAs at 31 May, 2004, the members of the Board of Management of Bang & Olufsen a/s held nominally DKK 2,000 ordinary shares (multiple voting shares) and nominally DKK 5,540 ordinary shares.
Share option programmeBang & Olufsen’s established share option programme applies to a number of directors and managers in the group. The total pool of options consists as at 31 May, 2004 of 84,311 options, which can be taken up during the period 2004-2008. For further information, please see note 2.
SHAREHOLDER INFORMATION

34
Dividend policyThe Group’s dividend policy aims at paying one third of the profits after tax as dividend.
Dividend paymentDividend payment is planned for Tuesday 5 October, 2004. The following share analysts covered Bang & Olufsen at the end of the financial yearAlfred Berg ABN AMRO (Klaus Madsen)Alm. Brand Børs (David Schøndorff Hansen)Carnegie Bank A/S (Lars Topholm)Cheuvreux (Frans Høyer)Danske Securities (Peter Kondrup Jensen)Enskilda Securities (Niels Leth)Handelsbanken (Kenneth Leiling)HSH Gudme (Peter Moltke)Jyske Bank (Rune Møller)Nordea Securities (Maiken Lausen)Oppenheim Research (Anne Gronski)Spar Nord Bank A/S (Mikkel Duus Hansen)Sydbank (Jacob Pedersen)
Annual General MeetingThe Annual General Meeting will be held on Wednesday 29 September, 2004 at 16.30 at Struer Gymnasium.
Financial calendar2004Monday 16 August, Annual Report (2003/04)Wednesday 29 September, Annual General MeetingFriday 8 October, Report for the first quarter (2004/05)
2005Wednesday 12 January, Interim Report (2004/05)Wednesday 13 April, Report for the third quarter (2004/05)Monday 15 August, Annual Report (2004/05)Friday 23 September, Annual General MeetingFriday 7 October, Report for the first quarter (2005/06)
WebsiteBang & Olufsen recommends investors and other interested parties to visit the company’s website: www.bang-olufsen.com, where you will find extensive information of interest to investors, including stock exchange announcements, annual reports, interim/quarterly reports, financial calendar as well as Bang & Olufsen’s history and a presentation of its products.
Investor [email protected]
List of shareholders in accordance with the Financial Statements Act, section 104(Individuals or corporations owning 5% or more of the company’s nominal capital or the share capital’s voting rights)
As at 31 May, 2004, Bang & Olufsen a/s had approx. 12,500 registered shareholders corresponding to an ownership interest of approx. 91% of the share capital. Of these, as at 31 May, 2004, the following shareholders are entered in the company’s register in accordance with the Financial Statements Act, section 104.
Nominal amount Capital Votes DKK (1,000) % %
Lønmodtagernes Dyrtidsfond, Vendersgade 28, 1, 1363 Copenhagen K 12,094 9.77 15.93Nordea Companies Danmark A/S, Torvegade 2, 1786 Copenhagen V 7,466 6.03 11.34ATP, Kongens Vænge 8, 3400 Hillerød 9,301 7.51 4.14J P Morgan Chase Bank, Damien Kefford /Asset Recon., Dorset BH7 7DB, Great Britain 8,657 6.99 3.85

35
DIRECTORS’ REPORT, BANG & OLUFSEN A/S - GROUP
The Group’s pre-tax result showed an improvement of DKK 51 million, or 17%, on the year. The year was characterised by stagnating or declining turnover in a number of markets.
Turnover for the 2003/04 fi nancial year for the Bang & Olufsen a/s Group was DKK 3,613 million against DKK 3,974 million last year. This equates to a decline of DKK 361 million or 9%.
The following key factors impacted on the year’s turnover:
- The UK, the US, Sweden, Norway and the Asian markets made up the markets, which saw increases in turnover. Turnover was maintained in the Danish market.
- Germany, Switzerland, Holland and Italy accounted for an overall decrease in turnover of DKK 220 million of which the re-organisation of the distribution in the German market accounted for DKK 60 million.
- Weaker exchange rates, mainly for USD, GBP and CHF, accounted for a decrease in turnover of DKK 100 million compared to last year.
- Bang & Olufsen Medicom a/s’ turnover declined by DKK 84 million compared to last year.
Despite the lack of turnover growth, earnings from primary operations were satisfactory as a result of an improved gross margin as well as rationalisation and efficiency measures throughout the Group. At the same time, the Group maintained its focus on product development and marketing.
Operating profi t was DKK 334 million against DKK 296 million last year, i.e. a growth of DKK 38 million or 13%.
The result from ordinary operations before tax was DKK 341 million against DKK 290 million last year, equating to an increase of DKK 51 million or 17%. This is satisfactory and slightly above the expectations for a result in the region of DKK 300-330 million. Consequently, the Group achieved its fi nancial objectives from April 2002 for earnings growth of 10-15% per annum.
Turnover for the fourth quarter totalled DKK 954 million against DKK 891 million for the same period last year. This is an improvement of DKK 63 million or 7%. The result from ordinary operations before tax rose by DKK 31 million – at DKK 70 million against DKK 39 million for the fourth quarter last year.
The gross margin for the year was 3.2 percentage points above last year due to the successful implementation of a range of effi ciency measures in the production, lower purchasing prices and a changed product mix in which the Group’s audio and acoustic products weighted higher.
Overall, these factors as planned all contributed to the Group’s profi table performance during a period characterised by considerable uncertainty.
Development costs totalled DKK 328 million against DKK 321 million last year. Development costs thus account for 9% of the year’s turnover against 8% last year.
Distribution and marketing costs decreased by DKK 84 million DKK, i.e. 9%, primarily owing to structural rationalisations in the US and in Central Europe. Again this year, the Group incurred losses from operating own shops. To reverse this trend, Bang & Olufsen has maintained its focus on making its own shops profi table and disposing of them, alternatively closing them down.
During the year under review, administration costs were unchanged at DKK 136 million against DKK 133 million last year.
Due to the Group’s positive liquidity situation, fi nancial items developed favourably.
The year’s overall tax rate was 22%, corresponding to expensed tax of DKK 75 million. The low tax rate is owing to the capitalisation of previous years’ tax losses in ICEpower and to debt conversions of outstanding accounts with the US subsidiary.
The Group result after tax for the year was DKK 266 million against DKK 193 million the previous year.
The balance sheet increased by DKK 169 million, from DKK 2,572 million to DKK 2,741 million. The increase is partly attributable to trade receivables due to increased sales in the fourth quarter.

36
As at 31 May, 2004 capitalised development projects totalled DKK 236 million against DKK 200 million last year.
Investments (net) totalled DKK 201 million against DKK 230 million last year. Of this, investments in development projects account for DKK 129 million against DKK 116 million last year. Capital investments (net) totalled DKK 58 million, which is DKK 26 million below the previous year, partly due to the disposal of the electronics factory in Skive. Tangible fi xed assets fell by DKK 137 million net – from DKK 795 million to DKK 658 million.
The inventories was reduced by DKK 39 million during the year while trade receivables increased by DKK 81 million due to the increase in turnover in the fourth quarter.
Like last year, no debts were raised during the fi nancial year. Re-payments on long-term debt totalled DKK 56 million against DKK 59 million last year. During the year, dividends of DKK 94 million were paid.
Cash fl ow for the year was positive at DKK 28 million against DKK 296 million the year before. Shareholder-directed initiatives such as dividend payment and repurchase of own shares totalled DKK 192 million for the year against DKK 47 million last year. The Group’s cash fl ow from operating activities totalled DKK 447 million against DKK 643 million last year.
Bang & Olufsen’s dividend policy stipulates that one third of the year’s result after tax will be paid as dividend to the Group’s shareholders. For this year, this corresponds to DKK 7 per nominal DKK 10 share. Last year an extraordinarily large dividend was paid, i.e. approx. half of the year’s profi ts (corresponding to DKK 7.00 per nominal DKK 10 share).
In addition, the Group intends to make use of the current authorisation to purchase own shares up to a value of approx. DKK 100 million.
As part of a 3-year programme, the Board of Directors has decided to allocate 70,000 share options to the Board of Management and 35,000 share options to the company’s senior managers, who also benefi t from a bonus programme. The strike price will be determined as the average price on the ten trading days following the publication of the annual accounts and will be increased by 5% per annum adjusted for any dividend payment. The maturity of the options is fi ve years from the date of allocation. The options cannot be exercised before August 2006 and will run until August 2009. Calculated in accordance with the Black-Scholes model, the value of the pool is approx. DKK 12 million.
As in previous years, the Board of Directors has decided to issue employee shares. The subscription price will be set at 120 for a maximum issue of 47,000 employee shares.
Equity totalled DKK 1,652 million against DKK 1,551 million last year.

37
BRANDED BUSINESS
The Group’s branded business comprises the activities marketed under the Bang & Olufsen brand.
The result from ordinary operations before tax for the Group’s branded business was DKK 344 million against DKK 308 million last year. This is a satisfactory improvement of DKK 36 million or 12%. The improvement derives from the increased gross margin and the structural rationalisations in the US and Central Europe.
Overall turnover in the Group’s branded business amounted to DKK 3,472 million against DKK 3,761 million last year. This represents a decline in turnover of DKK 289 million or 8%.
Developments in the marketsPercentage changes are calculated in local currency.
The UK/BeneluxDuring the financial year, a new region, the UK/Benelux Region was formed comprising the UK, Belgium and Holland. The new region is headed by Derek Mottershead, Market Director for the UK market.
The region was established in connection with Bang & Olufsen’s takeover of the Dutch activities from the former distributor. Subsequently, the Group has set up a new, wholly-owned subsidiary with responsibility for distribution in the Dutch market. The takeover was implemented in agreement with the former distributor. However, the parties have not yet reached agreement with regard to the value of any goodwill. If agreement cannot be reached, the issue will be settled by arbitration.
The UK recorded a turnover of DKK 584 million against DKK 582 million last year, i.e. an increase of DKK 2 million. Turnover was affected by the negative development in the GBP exchange rate. In local currency, the UK saw an increase in turnover of 6%. The increase for the fourth quarter was 11%.
Developments in the Dutch and Belgian markets were disappointing with turnover declining by 15% and 16% respectively.
ScandinaviaThe Danish market recorded a turnover of DKK 483 million against DKK 494 million last year, i.e. a decline of DKK 11 million or 2%. Turnover in Norway and Sweden grew by 3% and 6% respectively (in local currency).
Central EuropeThe German market experienced a decrease in turnover of DKK 102 million, or 21%, to DKK 384 million against DKK 486 million last year. In the fourth quarter, turnover in the German market fell by DKK 9 million or 9%, from DKK 103 million to DKK 94 million.
As planned, extensive restructuring of the distribution was implemented so that 150 ”other” multi-brand shops ceased selling Bang & Olufsen products. This resulted in a decrease in turnover of DKK 60 million. B&O’s products are now available in 240 German shops.
Recording a turnover of DKK 216 million against DKK 264 million last year, i.e. a decline of DKK 48 million or 14%, the Swiss market proved disappointing. The Group will focus on continuous qualitative improvements in its Swiss distribution.
The Austrian market recorded a turnover for the year of DKK 52 million against DKK 60 million last year, i.e. a decline of DKK 8 million or 13%.
Spain/Portugal, France and ItalyThe transition from CRT technology to flat-screen technology has occurred quite rapidly, not least in Southern European markets. Despite the new launches, the Group’s flat-screen programme did not compensate for the slackening sales of CRT products.
The Spanish/Portuguese market achieved a turnover of DKK 197 million against DKK 211 million last year, a decrease of DKK 14 million or 7%.
The French market recorded a turnover of DKK 180 million against DKK 193 million last year i.e. DKK 13 million or 7% lower.
In the year under review, the Italian market recorded a turnover of DKK 196 million against DKK 231 million the previous year, corresponding to a decrease of DKK 35 million or 15%.
The USTurnover in the American market increased 3% in local currency. The turnover was DKK 279 million against DKK 314 million the previous year, corresponding to a decrease of DKK 35 million.

38
B1 SIS Other
No. of shops per segment
Turnover share per segment
(active shops at the end of each year)
31/5 2003
31/5 2004
Definitions of shop segments:
B1 Shops which are dedicated retailers of Bang & Olufsen products
SIS Shop in shop with a sales area dedicated for Bang & Olufsen products
No. of shops
700
600
500
400
300
200
100
0
B1 SIS Other
2002/03
2003/04
%
70
60
50
40
30
20
10
0

39
The Group’s overall loss in the US market totalled DKK 17 million of which DKK 5 million derives from non-recurring costs relating to shop closures while operating losses constitute DKK 12 million. During the last financial year, the Group’s total losses in the US were DKK 73 million of which DKK 31 million was non-recurring costs while DKK 42 million was operating losses. The operating result in the US market therefore showed an improvement of DKK 30 million, whereas non-recurring costs were DKK 26 million lower.
In the fourth quarter, the US market recorded a positive operating result of DKK 3 million before non-recurring costs.
During the financial year, the US organisation was trimmed and renewed focus was directed at the retail level where increased marketing efforts and action plans for the individual shops proved successful.
AsiaThe Far Eastern markets are gathered in the region ”Asia”, which comprises Singapore, Hong Kong, Malaysia, Korea, Taiwan, Thailand, Indonesia, Australia and Japan. The head office is in Singapore.
The Asian markets recorded a turnover of DKK 231 million against DKK 194 million last year – an advance of DKK 37 million.
The Asian retail sector developed positively in 2004 after having been affected by the repercussions of the SARS outbreak in 2003. A major order for the Grand Hyatt hotel in Singapore and sales of BeoLab 5 and BeoSound 3200 made a positive contribution to the increased turnover.
Seen in isolation, the Japanese market recorded a turnover of DKK 62 million against DKK 51 million the previous year. This equates to a growth in turnover of DKK 11 million or 29%.
The Japanese market – where the Group only sells audio and acoustic products – benefited from the launches of the loudspeakers, BeoLab 3 and BeoLab 5, which have both been very well received. BeoSound 3200 also made a positive contribution to turnover in the Japanese market.
Expansion MarketsExpansion Markets comprise the Middle East, South America, Africa, Greece, Russia and other Eastern European markets. Expansion Markets achieved a turnover of DKK 122 million, which was unchanged from last year’s DKK 121 million.
Distribution developmentAt the beginning of the financial year, the Group intended to continue its focus on improving the quality of its distribution and only open new shops at a moderate pace. Equally, the Group expected a reduction in the overall number of retail outlets during the year.
There are currently 642 B1 shops worldwide, 7 more than at the beginning of the financial year. 51 new B1 shops were opened, while 44 were closed down. The closures are owing to a combination of specific financial circumstances and the Group’s wish to carry out ongoing qualitative improvements to its distribution. Turnover levels in B1 shops, which have been operating for two years or more, were unchanged on the year.
In addition, Bang & Olufsen products are available at 670 shop in shop outlets and at 215 ”other” multibrand shops. The latter segment has been reduced by 253 outlets of which some have been upgraded to shop in shops while 208 have ceased selling B&O products. These 208 shops represented a turnover of DKK 87 million in the previous financial year.
In total, as at 31 May, 2004, Bang & Olufsen products were sold in 1,527 shops worldwide.
ProductionDuring the financial year, a number of initiatives were taken aimed at enhancing productivity and profitability in the production. A targeted effort with regard to the purchasing of raw materials and parts has also had a positive effect.
In the fourth quarter, Bang & Olufsen sold its electronics factory in Skive to Flextronics International Ltd. The sale took place in order to focus on the Group’s core business areas, to ensure competitive purchase prices and to gain access to a broader range of technologies. The sale also means that the factory in Skive will now be part of a stronger organisation within its field.

40
The Group has decided to site a Bang & Olufsen owned production in the town of Koprivnice in the eastern part of the Czech Republic in order to improve profitability through a reduction in wage costs within the field of pre-assembly and light final assembly. The production in leased premises will start in September 2004. Purchase of land and construction of own production facilities will take place in 2004/05.
The disposal of the electronics production and the start-up in the Czech Republic is expected to make a positive contribution to profitability over the coming years.
During the financial year, the Group’s inventories remained at last year’s level due to substantial activity in connection with the launch of new products, especially within the fields of LCD and plasma screens. Due to the disposal of the electronics production in Skive to Flextronics (as of 31 May, 2004) inventories have been reduced.
Product launches during the financial year Towards the end of the first quarter of the financial year, the first deliveries of the highly advanced loudspeaker, BeoLab 5, took place.
At the end of the second quarter, the Group launched, as planned, BeoVision 6, which is Bang & Olufsen’s most recent flat-screen TV based on 22” LCD technology.
BeoCenter 2, a new, and in terms of design and mechanics, sensational AV Center product, was launched in the third quarter. BeoCenter 2 integrates the playing of DVD, CD, radio and digital music files.
The third quarter also saw the launch of BeoLab 3, a compact loudspeaker based also on both ICEpower technology and acoustic lens technology.
All new launches have been well received by both dealers and customers and by the trade and lifestyle press in the Group’s markets.
In addition, the Group launched a series of product updates during the financial year:
BeoVision MX 4200, a technological update within the classic MX family, was launched in the first quarter.
BeoVision 3 – 28”, a 28 inch version of the table top TV, BeoVision 3, was launched in the second quarter.
BeoCom 1, a two-line telephone for the US market, was launched towards the end of November and BeoCom 2 US was launched at the end of the year.
In the fourth quarter, the Group launched, as planned, BeoVision 4, a 42 inch module-based flat-screen TV based on the same plasma technologies and the same high quality as BeoVision 5.
The fourth quarter also saw the launch of the Earset 1 Mobile which, in terms of technology and design, is based on Earset 1 Home, but is aimed at selected mobile telephones.

41
The Group’s non-branded business comprises activities marketed independently of the Bang & Olufsen brand, i.e. Bang & Olufsen Medicom a/s and Bang & Olufsen ICEpower a/s.
Bang & Olufsen Medicom a/s develops and manufactures products for the medical technology industry, while Bang & Olufsen ICEpower a/s develops and manufactures effective, compact and intelligent amplifier modules, for Bang & Olufsen as well as for external partners.
Bang & Olufsen Medicom a/sThe turnover for Bang & Olufsen Medicom totalled DKK 135.4 million for the year under review against DKK 219.7 million the previous year. This represents a decline of DKK 84 million.
The result of ordinary operations before tax was a loss of DKK 9 million against a loss of DKK 8 million last year.
This development is owing to a substantial decrease in order and production levels, due to inventory adjustments and changed purchasing requirements at Bang & Olufsen Medicom’s largest customer.
During the second half of the year, the company performed slightly above expectations, partly due to a more rapid realisation of individual projects’ milestones and to continued cost adjustments.
The supply of services within the development and preparation of new products increased during the financial year and Bang & Olufsen Medicom continues to develop new products within the medical technology sector.
Bang & Olufsen ICEpower a/sThe turnover for Bang & Olufsen ICEpower was DKK 43 million against DKK 31 million last year, equating to an advance of DKK 12 million. The turnover is based on sales of ICEpower standard modules and sales of development services as well as revenue realised in connection with licence agreements.
The result of ordinary operations before tax was a profit of DKK 6 million against a loss of DKK 10 million last year, i.e. an improvement of DKK 16 million. The company continues to invest significantly in technology development and the acquisition of new customers remains a focus area. In addition to Sanyo and Sony, ICEpower has entered into a new partnership with Samsung.
NON-BRANDED BUSINESS

42
EXPECTATIONS FOR THE FINANCIAL YEAR 2004/05
Product launchesThe financial year 2004/05 will see the launch of a number of important products.
- During the 2nd quarter, the TV portfolio will be expanded by a further flat-screen TV. Based on LCD technology in a 26” widescreen format with unique picture and sound performance, this exciting new product will take its place as the ultimate TV for the main room.
- The second quarter will also see the launch of a new digital video recorder, based on hard disc technology. Besides extremely high quality in recording and playing, this product will offer the option for simultaneous recording and playback so that, for instance, TV viewing can be interrupted and resumed at random.
- In the third quarter, the Group will launch another new, important TV concept based on the most advanced 32” LCD technology. The concept will set new standards in its expression and finish. The product is an integrated video system with built-in DVD player with sound and picture performance of the highest quality. With B&O’s simple operation, a flexible stand programme and superb sound reproduction, this new video system is poised to become the natural centre of the home cinema.
- In addition, during the third quarter, the Group intends to launch two new plasma based TVs in the BeoVision 4 family: A 37” version which can be flexibly positioned on a wall or table and a 65” large screen TV for wall placement, which will provide an impressive cinema experience in particularly large rooms.
- Finally, the Group plans to launch the BeoLink Media with integrated PC technology in the second half of the year. This is an extension of BeoLink, which will further enhance web use in the B&O system. The new product will among other things allow for easy and convenient use of internet music and electronic photo albums.
Market developmentIn recent years, the Group has faced substantial uncertainty and unpredictability in individual markets. However, in several markets, expectations are for a positive sales development, including the UK, Southern Europe, Scandinavia and the Group’s markets in Asia.
Expectations for the Central European markets and for Holland and Belgium are moderate. In Switzerland the restructuring of the distribution is expected to lead to a decline in turnover.
In the US, an important long-term growth market, positive sales development is expected, especially for larger home theatre installations.
In all markets, Bang & Olufsen continues to streamline its marketing activities in the individual shop, e.g. by strengthening the dialogue with customers/customer prospects and increasing marketing activities in the shop.
The Group will continue to improve its global distribution and expects to open new shops at a higher rate than last year while maintaining focus on quality. The aim is for a net increase of 30-40 new B1 shops. The Group is also expected to upgrade a number of multibrand shops to shop in shops or, alternatively, cease partnership with them. Overall, the total number of retail outlets is expected to see a moderate decline.
During the year, the Group established itself in the Chinese market. Contracts have been signed for the opening of two new B1 shops in China, one in the Guangdong province and one in Shanghai at the end of August 2004. During the 2004/05 financial year, a further B1 shop will be opened in Beijing. The Group’s sales activities in the Chinese market are of a long-term nature to be based on partnerships and managed from the Asian headquarters in Singapore.
New business developmentsThe Group intends to strengthen its global efforts within the field of sales of audio/video equipment to the hotel sector. During the financial year, a global contract was signed with the Hyatt International hotel group under which Bang & Olufsen is named the preferred supplier of AV equipment. Furthermore, contracts have been signed for the delivery of complete solutions for leading hotels in France, Spain, the UK, the US, and the Middle East.

43
The Group has maintained its focus on CarFi in the form of advanced prototypes for a Bang & Olufsen in-car sound system for a few selected car makes. It is expected that an agreement for the delivery of a sound system to a manufacturer of a European top class car will be signed during the year. Work relating to product and sales development within CarFi continues, and the segment is expected to make a positive contribution to the Group’s growth and market position in the course of some years.
Bang & Olufsen Medicom a/s and Bang & Olufsen ICEpower a/sFor the coming financial year, Bang & Olufsen Medicom expects to achieve a modest, yet positive result due to new contracts and new development projects.
Bang & Olufsen ICEpower expects to see the continuation of the positive development in both turnover and result, although the market for audio-video components remains weak.
Overall turnover and resource allocationBesides the market-specific conditions mentioned above, the uncertainty regarding sales also relates to the ongoing transition from CRT TV to flat-screen products. In the longer term, new flat-screen TVs offer good potential for growth for the Group although, in the current year, the many new launches will primarily compensate for the expected slowdown in sales of traditional CRT TVs. Overall, the outlook is for a modest growth in turnover.
The Group will focus on maintaining the satisfactory gross margin and its flexibility with regard to capacity costs. Consequently, the activities within re-engineering, platform solutions, competitive purchasing and structural improvements will be maintained. In addition, there are new activities such as the relocation of certain labour-intensive production processes to the Czech Republic and the disposal of electronics production to Flextronics International Ltd. The two latter activities, however, will have no overall positive effect during the 2004/05 financial year.
The 2003/04 financial year was characterised by a favourable sales mix with a relatively large share of new audio and loudspeaker products offering a high gross margin. As mentioned, the 2004/05 financial year will see the launch of a range of new TV-products for which the gross margin is at the low end. Accordingly, the Group’s gross margin is therefore expected to show a small decline during the year.
Development costs are set to increase due to the development of new, important design solutions within the TV portfolio and through the continued efforts relating to the switch from analogue to digital technology. In addition, there will be extraordinary development costs over the next two years when the entire product portfolio will be adjusted in keeping with the new RoHS directive coming into force from January 2006 (c.f. page 46).
Distribution and marketing costs will continue to be subject to structural adjustments and rationalisation measures. Other costs are expected to increase moderately. Financial items are expected to show a slight fall.
Investments are expected to remain at 2003/04 levels although with a possible increase towards the end of the financial year owing to the construction of the factory in the Czech Republic.
If market conditions and earnings allow, the Group will further strengthen its activities within new growth areas.
Expectations for the Group’s resultTurnover and earnings for the first quarter 2004/05 will be above the same period last year. On the background of a moderate growth in turnover, the Group expects pre-tax profits in the region of DKK 360-390 million, which holds the 3-year objective of 10-15% annual growth in earnings.
Presentation of accounts in accordance with IFRS
From the 2005/06 financial year, Bang & Olufsen’s
consolidated accounts must be presented in accordance
with the International Financial Reporting Standards
(IFRS). The company has initiated the preparations for
the changeover IFRS and, at the present time, does not
expect this to have any significant effect on the Group’s
accounting figures.

44
CORPORATE GOVERNANCE
In March 2001, the Danish Ministry of Trade and Industry set up a committee tasked with assessing the need for recommendations for good corporate governance in Denmark and to suggest concrete proposals for the formulation of such recommendations.
The Committee’s work resulted in ”The Nørby Committee’s report on Corporate Governance in Denmark – Recommendations for Good Corporate Governance in Denmark.”
On the basis of the Nørby Committee’s report, the Board of Directors of Bang & Olufsen a/s considered the general level of Corporate Governance implementation in the company.
The general principles behind the report’s specifi c recommendations have, for several years, been part of the Board’s work.
In its report, the Nørby Committee recommends that the Board of Directors assesses the expediency of any articles of association concerning voting rights differentiation and, in the annual report, consider whether a revocation of this differentiation is desirable and possible.
Bang & Olufsen a/s’ share capital is divided into A shares and B shares (multiple voting shares and ordinary shares respectively). The Board is of the opinion that the current division into two share classes at the present is appropriate for securing the company’s continued and stable development. The Board of Directors will continually assess the expediency of the aforementioned division.
In its report, the Nørby Committee recommends that information relating to individual directors and members of the Management Board’s share-based incentive schemes should be published in the company’s annual report.
Members of the Bang & Olufsen Board of Directors do not benefi t from incentive schemes. In view of the size of the incentive-based remuneration of the Board of Management’s members, the Board of Directors regards it as suffi cient to publish the options pool at Group level.
The Nørby Committee’s reportcontains recommendations concerning members of the Management Board’s directorships and management positions in other companies.
The Board of Bang & Olufsen a/s previously decided that members of the Management Board are permitted to have up to two directorships of other companies.
With regard to other specifi c recommendations in the second part of the Nørby Committee’s report, the Board of Directors will continually assess these in its considerations on good corporate governance in order to safeguard the company’s and stakeholders’ interests in the best possible way.

45
ENVIRONMENTAL STATEMENT
Environmental policyAll human activity has an impact on the surrounding environment. This also applies to the production and use of Bang & Olufsen’s products.
Bang & Olufsen, therefore, continually strives to minimise environmental impact and to establish a balance between such impact and regard for our products’ useful qualities, economy, lifetime and aesthetics in order to be a leader in our fi eld.
We communicate openly about environmental issues and every year we publish an annual environmental statement as well as a life cycle description of one of our products.
We wish to contribute to a globally sustainable development and assess our activities from a life cycle perspective.
Development: (concept, design and construction)In this creative phase, the product’s environmental properties are determined, and our aim is to reduce environmental impact within the following life cycle phases.
Raw materials:Our choice of materials aims at avoiding components, which can be problematic to the environment.
Production:In our choice of production methods and production equipment we give cleaner technology high priority.
We prioritise the near environment and the creation of a safe and healthy working environment for our employees. Our aim is to improve the physical as well as the psychological working environment.
When selecting suppliers we ensure that they act responsibly with regard to the environment. It is our aim to maintain a dialogue with each individual supplier to create the right environmental conditions for the part of the product’s life cycle for which that supplier is responsible.
Transport:We make environmental demands to our transport companies in terms of a high degree of utilisation and optimum application of technology for the transport units.
Application:Our aim is for our products to be enjoyed without any problems in the customer’s home environment, that the products last for a long time, and that they have a low consumption of energy.
Disposal:Our aim is that product parts are suitable for recycling, and that major parts can be identifi ed when dismantled in order to achieve appropriate disposal and recycling.
Environmental issuesThe Bang & Olufsen logo is a guarantee of quality. We want our customers to buy Bang & Olufsen products in the knowledge that we have made intelligent decisions on their behalf – also in respect of environmental issues.
In keeping with Bang & Olufsen’s environmental policy we look at the environment from a life cycle perspective and are, therefore, able to establish the product’s total environmental impact right from development, via production and application to disposal when no longer used by the customer. This life cycle perspective enables us to predict the environmental effects of a new product even at the drawing board stage and take steps to counter them.
The biggest environmental impact from Bang & Olufsen products is energy consumption when in use. Consequently, it has been natural to focus on a reduction of energy consumption during stand-by. This has resulted in a cut in the products’ sales weighted stand-by consumption of 47% for TV sets and 19% for audio products between 2000 and 2003.
The challenge over the coming years will be to comply with the two EU directives WEEE and RoHS*. With effect from August 2005, WEEE introduces manufacturer responsibility for electrical and electronic scrap within the EU. This means that the manufacturer will be responsible for the collection and reprocessing of electronic scrap as well as being fi nancially responsible for the collection and reprocessing of their own products. We expect to be able to fulfi l these requirements by entering into a collective collection scheme. The scope and fi nancial consequences of the new regulations are, however, not yet known.

46
The RoHS directive prohibits the use of four heavy metals from July 2006, including lead in solderings as well as two brominated fl ame retardants. We have found alternatives to the traditional lead solderings and are constantly working with our suppliers to ensure that their components comply with the requirements of RoHS. The two brominated fl ame retardants were phased out of our products at the beginning of the 90s.
No external environmental conditions have or could have signifi cant impact on Bang & Olufsen’s fi nancial position. Bang & Olufsen’s Mechanics Factory has been approved in accordance with the Danish Environmental Protection Act’s section 5. In connection with changes to processes or production layouts the objective is to avoid or limit pollution whenever possible. We maintain a constant dialogue with the authorities to fi nd the best solutions and minimise pollution, e.g. by using cleaner technologies (BAT**).
Bang & Olufsen prepares an annual environmental review, which details environmental aspects in relation to production in our factories, including consumption of raw materials, electricity, water and heat as well as waste volumes. We also include issues relating to the working environment. Furthermore, we prepare a product related environment statement ”To the last detail ...”, which sets out environmental aspects of development, production, use and disposal of a product. ”To the last detail ...” has been prepared for BeoCenter 1, BeoSound 3200, BeoLab 1 and BeoCenter 2.
Both ”To the last detail ...” and the environmental review can be obtained by contacting the Environment Department on +45 96 84 10 18.
* RoHS is an abbreviation of the directive’s English title Restriction
of Hazardous Substances 2002/95/EF. With regard to the
electronics industry, this primarily relates to the switch to
unleaded solderings.
** BAT is an environmental term ”Best Available Technology”
(easiest accessible or cleaner technology).

47
KNOWLEDGE RESOURCES
Bang & Olufsen’s current and future business is based on the development, production and sale of advanced audio, video and telephony products in global markets. The company’s vision is to constantly question the ordinary in search of surprising, long-lasting experiences.
The capacity to develop pioneering concepts and products – in terms of technology as well as design – to be at the cutting edge of the customers’ requirements and preferences is crucial for Bang & Olufsen’s future profi tability. Our products must be carefully considered solutions that embrace aesthetics and quality as well as functionality, operation and integration.
This requires continued focus on the maintenance and development of the competencies, the experience, and, indeed, the spirit that is at the root of our innovative skills and that we constantly explore the limits of the possible. We do this through internal and external training programmes for the employees as well as through exchange of knowledge and other forms of partnerships with a range of organisations and institutes of learning. Moreover, we have designed our internal organisation to provide total solutions to the customers’ overall needs by exploiting the full range of professional skills available across our organisation - and by staying in close contact with our customers.
The development of new, innovative products is further supported by Bang & Olufsen’s comprehensive insight into – and knowledge of – how people perceive sound and images. Our research within this specialised fi eld contributes signifi cantly to the development of products that meet our customers’ wishes and needs.
Our products’ outstanding quality and advanced features, require the use of production machinery and technologies that operate with a high level of precision and, therefore, place considerable demands on the skill and experience of our employees. We have special competencies within the production and design of high-standard, reliable electronic components as well as surface treatment of aluminium and the development of durable mechanical parts.
Supported by the quality and features of the product, the Bang & Olufsen brand is a crucial competitive parameter. The brand is further maintained and enhanced by the Group’s centrally co-ordinated retail concept and a brand strategy aimed at providing a consistent view of our company and products - in each shop and at each customer’s home.

48
The year’s net flow in key currencies DKK million
900
800
700
600
500
400
300
200
100
0
-100
-200
EUR
GBP
CH
F
SEK
USD

49
The Bang & Olufsen Group’s extensive international activities mean that its Profit & Loss account, balance sheet and equity are continually exposed to some degree of financial risk.
These risks are:- Foreign exchange risk- Interest rate risk- Credit risk- Liquidity risk
Bang & Olufsen continuously assesses these risks at Group level.
Foreign exchange risk83% of the Group’s turnover derives from abroad. However, this figure does not express the Group’s foreign exchange risk as it is part of the Group’s purchasing policy to match purchasing and sales currencies to the greatest extent possible.
The Group has net inflows in EUR, GBP and CHF while the most significant exposure on the outflow side is in USD.
Foreign exchange risks are managed centrally and forward contracts are used to cover positions whenever necessary. Forward contracts are used for commercial transactions only.
The Group’s net monetary items in foreign currencies are given in note 28.
Interest rate riskAs the interest-bearing assets are insignificant, the Group’s interest rate risk relates mainly to the interest-bearing debt.
At year end, the Group’s interest-bearing debt totalled DKK 317 million corresponding to 12% of the balance sheet total.
The interest-bearing debt is of a medium-term nature and further information is given in note 21.
Due to the low debt level and the fact that borrowings are almost exclusively in fixed interest loans, the Group’s interest rate risks are minimal and are not expected to significantly impact the Group’s result.
During the past financial year, the Group had positive liquidity. This is expected to continue over the coming financial years.
Credit riskThe Group’s most important primary financial instruments comprise trade receivables and bank deposits. The amounts at which these balance sheet items are recognised are identical to the maximum credit risk.
At year-end the Group sells its products via 1,527 dealers worldwide. In view of the large number of dealers and the significant geographical spread of the dealer network, the Group believes that the credit risk in relation to receivables is limited.
The individual dealers, including their geographical location, are subject to continual review. When deemed necessary, the Group employs bank guarantees or debtor insurance against outstanding debts.
Losses on receivables have been at a reasonable level over the past three years, and the Group sees no significant credit risk attached to these.
Liquid funds are placed with financial institutions with high credit ratings. Derivatives, including foreign exchange forward contracts, are entered into only with such institutions.
Liquidity risk The financial stand-by is continually assessed and managed by the parent company’s finance department. It is ensured that, at any given time, there is sufficient, flexible and unused stand-by credit available provided by major, reputable financial institutions. On the basis of its financial stand-by arrangements, the Group believes that there are no grounds for expecting liquidity problems.
THE GROUP’S MANAGEMENT OF FINANCIAL RISKS

50

51
FINANCIAL REPORT
The Profit and Loss account
Decline in turnover of DKK 361 millionThe Group’s turnover for 2003/04 decreased by DKK 361 million to DKK 3,613 million, or 9%.
The decrease in turnover occurred in the branded core business (DKK 289 million) and in Bang & Olufsen Medicom a/s (DKK 84 million). Bang & Olufsen ICEpower a/s recorded an advance in turnover of DKK 12 million during the year under review.
The decline in turnover of DKK 289 million in the branded core business equaled 8%. The markets showed significant variation. The UK again achieved an increase in turnover. This year it was DKK 2 million to DKK 584 million, i.e. up 6% in local currency. The US, Swedish, Norwegian and Asian markets also continued their positive growth with advances in turnover (measured in local currencies). Germany, Switzerland and Holland accounted for a decline in turnover of DKK 185 million, while the Southern European markets, Italy, France and Spain/Portugal, saw a decline in turnover of DKK 62 million. Measured in DKK, the US experienced a decrease in turnover of DKK 35 million, although in local currency this amounted to an increase of 3%.
Looking at turnover in terms of product groups, the Group’s turnover has increased within the audio and acoustic product groups, while the sale of video products declined. On a group level the telephone turnover has decreased. Also other products’ share of the turnover decreased.
Gross margin increased 3.2 percentage pointsBang & Olufsen a/s’ gross margin increased 3.2 percentage points, from 42.2% to 45.4%. The increase was driven by efficiency measures in production and changes to the product mix in favour of audio and acoustic products, which are characterised by a high contribution margin.
The costs in relation to turnoverCosts pertaining to development, distribution and marketing and administration fell by DKK 75 million, i.e. 5%, in 2003/04 and now account for 36.1% of the turnover against 34.7% in 2002/03.
Development costs increased by DKK 7 million to DKK 328 million, i.e. 9% of the turnover against 8% in 2002/03. The costs were, in part, incurred in connection with the development of the new flat-screen TV portfolio.
Distribution and marketing costs fell by DKK 84 million, i.e. 9%, primarily due to structural rationalisations in the US and Central Europe. In the US, a reduction in non-recurring costs by DKK 26 million also played a role as these were reduced from DKK 31 million in 2002/03 to DKK 5 million in 2003/04.
Result of ordinary operations in associated companyBang & Olufsen a/s holds a 33% stake in John Bjerrum Nielsen A/S. The impact on the result from this was DKK 1.7 million before tax against DKK 3.0 million last year.
FinancingFinancial items (net) improved by DKK 14 million from a net expenditure of DKK 9 million in 2002/03 to a net gain of DKK 5 million in 2003/04. Foreign exchange gains deriving from changes in exchange rates totalled DKK 8 million in 2003/04 against a loss of DKK 1 million last year. In addition, interest-related items improved due to the Group’s positive cash flow.
Tax rateThe overall tax rate for the year fell to 22% against 34% last year. The low tax rate was partly due to the capitalisation of the previous years’ tax losses in Bang & Olufsen ICEpower a/s and partly to the debt conversion of outstanding accounts with the US subsidiary. Again, the Group decided not to capitalise deferred tax relating to the US.
Of the expensed tax of DKK 75 million, DKK 89 million related to the branded business. A refund for corporation tax to Bang & Olufsen Medicom of DKK 3 million has been paid, and the tax effect in Bang & Olufsen ICEpower a/s resulting from the capitalisation of the previous years’ losses was positive at DKK 11 million.
Minority interestThe item pertains to the 10% minority interest in Bang & Olufsen ICEpower a/s.

52
Purchase of intangible fixed assets
and amortisation
Purchase of tangible fixed assets
and depreciation
Amortisation
Purchase of intangible fixed assets
DKK million
150
100
50
0
99/0
0
00/0
1
01/0
2
02/0
3
03/0
4
Depreciation
Purchase of tangible fixed assets
DKK million
350
300
250
200
150
100
50
0
99/0
0
00/0
1
01/0
2
02/0
3
03/0
4

53
Balance sheet
Fixed assetsFixed assets decreased by DKK 112 million to DKK 968 million against DKK 1,080 million the previous year. The decline covers opposing trends for intangible and tangible fixed assets.
Intangible fixed assetsIntangible fixed assets increased by DKK 30 million to DKK 269 million. Of this, DKK 36 million related to development projects and should be seen within the context of the Group’s product launches during the 2003/04 financial year, including the sustained focus on development work. Due to amortisations exceeding new investments, aquired rights declined by DKK 11 million. Acquired rights include amongst other things the Group’s investments in software. Goodwill has increased by DKK 5 million mainly as a result of the acquisition of the Dutch market operations from the previous distributor.
Tangible fixed assetsTangible fixed assets decreased by DKK 137 million. The Group’s investments in fixed assets was DKK 138 million against last year’s DKK 132 million. This is in line with the Group’s stated expectations that investments in 2003/04 would remain unchanged from the previous year. Depreciation on tangible fixed assets totalled DKK 169 million. Fixed assets of DKK 80 million were disposed of, including the assets sold in connection with the sale of the electronics factory in Skive.
Current assetsCurrent assets increased by DKK 280 million, from DKK 1,492 million to DKK 1,772 million.
The increase is primarily owing to an increase in the binding of liquidity in trade receivables as a result of the increased turnover in the fourth quarter, and an increase in other receivables of DKK 188 million. The increase in other receivables relates to an increase in tax receivable of DKK 99 million and a receivable relating to the sale of the electronics factory of DKK 82 million. The inventories were reduced by DKK 39 million as a result of the disposal of the electronics factory. Liquid funds totalled DKK 473 million at 31 May, 2004 against DKK 445 million the previous year.
EquityThe equity totalled DKK 1,652 million against DKK 1,551 million last year. The proposed dividend is DKK 87 million against DKK 94 million last year.
Cash Flow StatementThe cash flow for the year was positive at DKK 28 million against DKK 296 million in 2002/03. The Group’s cash flow from operating activities was DKK 447 million against DKK 643 million last year. The difference can be attributed to the changes in the Group’s working capital, which have a negative effect on the cash flow of the year of DKK 31 million, whereas the impact the previous year was positive at DKK 209 million as a result of the declining liquidity binding in inventories and receivables.
Liquidity requirements for investments amounted to DKK 201 million net against DKK 230 million last year. The investments in intangible fixed assets were DKK 143 million against DKK 146 million in 2002/03, while investments in tangible fixed assets remained at the same level as last year. However, as a result of the disposal of the electronics factory, the net investment in tangible fixed assets fell to DKK 58 million against DKK 84 million the previous year.
During the financial year, DKK 56 million was repaid on the Group’s long-term liabilities against DKK 59 million the year before. Like last year, no loans were raised during the financial year.
During the year dividends totalling DKK 94 million were paid to shareholders. Repurchase of own shares for DKK 98 million was undertaken so that shareholder-related initiatives total DKK 192 million against DKK 47 million in 2002/03. This corresponds to an increase of DKK 145 million.

54
STATEMENT BY THE MANAGEMENT ON THE ANNUAL REPORT
The Management has today considered and adopted the annual report for 2003/04 for Bang & Olufsen a/s.
The annual report has been presented in accordance with the Danish Financial Statements Act, Danish Accounting Standards as well as the requirements otherwise imposed by the Copenhagen Stock Exchange on the presentation of financial statements for listed companies.
We consider the applied accounting policies appropriate for the annual report to provide a true and fair view of the Group’s and Parent Company’s assets, equity and liabilities, financial position and result as well as the Group’s cash flow.
We recommend the annual report for adoption at the Annual General Meeting.
Struer, 16 August, 2004
Board of Management
Torben Ballegaard Sørensen (President and CEO)
Peter Thostrup
Board of Directors
Jørgen Worning (Chairman)
Torsten Erik Rasmussen (Chairman)
Lars Brorsen
John Christoffersen
Thorleif Krarup
Peter Leschly
Knud Olesen
Ole Kristian Olesen
Peter Skak Olufsen

55
AUDITORS’ REPORT
Struer, 16 August, 2004
PricewaterhouseCoopersStatsautoriseret Revisionsinteressentskab
Carsten Gerner State Authorised Public Accountant
Jesper Lund State Authorised Public Accountant
DeloitteState Authorised Public Accounting Company
Erik Holst Jørgensen State Authorised Public Accountant
Henrik Z. HansenState Authorised Public Accountant
To the shareholders of Bang & Olufsen a/sWe have audited the annual report of Bang & Olufsen a/s for 2003/04.
The annual report is the responsibility of the Company’s Management. Our responsibility is to express an opinion on the annual report based on our audit.
Basis of opinionWe conducted our audit in accordance with Danish and International Auditing Standards. Those standards require that we plan and perform the audit to obtain reasonable assurance that the annual report is free of material misstatement. An audit includes examining, on a test basis, evidence supporting the amounts and disclosures in the annual report. An audit also includes assessing the accounting policies used and significant estimates made by the Management, as well as evaluating the overall annual report presentation.
We believe that our audit provides a reasonable basis for our opinion.
Our audit has not resulted in any qualification.
OpinionIn our opinion, the annual report gives a true and fair view of the Group’s and the Parent Company’s assets, equity and liabilities and financial position at 31 May, 2004 and of the results of their operations as well as the consolidated cash flows for the financial year 1 June, 2003 - 31 May, 2004 in accordance with the Danish Financial Statements Act, Danish Accounting Standards as well as the requirements imposed by the Copenhagen Stock Exchange on the presentation of financial statements for listed companies.

56

57
ACCOUNTING PRINCIPLES APPLIED
Basic principlesThe Annual Report for Bang & Olufsen a/s has been prepared in accordance with the requirements of the Danish Financial Statements Act for class D companies, Danish accounting standards and the requirements imposed by the Copenhagen Stock Exchange on the presentation of fi nancial statements for listed companies.
The accounting principles applied are unchanged from the previous year.
General information about recognition and measuringAssets are recognised in the balance sheet, when it is probable that future economic benefi ts will fl ow to the company, and the value of the asset can be measured reliably.
Liabilities are recognised in the balance sheet, when it is probable that the company will give up future economic benefi ts as a consequence of a legal or actual obligation resulting from an event occurring before, or on, the balance sheet date, and the value of the liability can be measured reliably.
Initial recognition of assets and liabilities is done at cost price. Subsequently assets and liabilities are measured as described below for each item. Certain fi nancial assets and liabilities are measured at amortised cost price, by which a constant true interest is recognised over the duration. Amortised cost price is calculated as initial cost price less instalments and addition/deduction of the accumulated depreciation of the difference between the cost price and nominal value. Consequently the profi t due to appreciation/loss due to depreciation is allocated over the duration of the asset/liability.
When recognizing and measuring, due consideration is made for predictable losses and risks that arise before the fi nancial statements are fi nalized and which confi rm or negate conditions, which exist on the balance sheet date.
Income is recognised in the Profi t & Loss account when it is earned. Furthermore all costs incurred to achieve the earnings of the year, hereunder depreciation, write downs and provisions are recognized in the Profi t & Loss account as well as reversal of amounts due to change in accounting judgments and estimates, if these amounts have previously been recognised in the Profi t & Loss account.
Consolidation
Consolidation practiceThe consolidated fi nancial statements comprise the parent company, Bang & Olufsen a/s, and the subsidiaries in which the Group holds more than 50 per cent of the voting rights or, in other ways, has a deciding infl uence.
The consolidated fi nancial statements have been prepared on the basis of the audited fi nancial statements of the parent company and its subsidiaries as an aggregation of similar items from the fi nancial statements of the individual companies. In the process of consolidation, intra-group income and expenses, shareholdings, dividends, outstanding accounts and unrealised intra-group profi ts and losses have been eliminated. The accounting principles applied in the foreign subsidiaries have been adjusted to the Group’s accounting principles unless they only differ insignifi cantly.
The parent company’s shares in the consolidated subsidaries are netted against the parent company’s share of the subsidiaries’ intrinsic value.
Recently acquired subsidiaries are included in the consolidated fi nancial statements as from the date of acquisition. Companies sold are included until the date of sale.
Comparative fi gures are not adjusted for recently acquired or sold companies.
Group goodwill is calculated at the time of the acquisition as the difference between the cost price and the market value of the assets and the liabilities acquired. Group goodwill acquired as from 1 June, 2002 is recognised in the balance sheet and amortised on a straight-line basis over the expected economic lifetime, which is determined on the basis of the Management Board’s experience of the individual business areas, although a maximum of 20 years applies.
For acquisitions before 1 June, 2002 Group goodwill was calculated at the time of the acquisition as the difference between the cost price and the acquired company’s intrinsic value calculated in accordance with the Group’s accounting principles. Group goodwill was amortised directly over the equity.

58
Companies, which are not subsidiaries, but in which the Bang & Olufsen Group holds 20 per cent or more of the voting right or in other ways has a signifi cant infl uence on the operational or fi nancial management, are regarded as associated companies. Associated companies are consolidated in the lines “Result from investment in associated company before tax” and “Tax on ordinary result”.
Minority interestsMinority interests include third party shareholders’ share of the intrinsic value and the result for the year in subsidiaries, which are not 100 per cent owned.
In the consolidated result, the share of the subsidiaries’ result, which can be ascribed to minority interests, is disclosed separately. Minority interests’ share of the equity is disclosed in a separate item between “Equity” and “Provisions”.
When minority interests constitute an asset, these are recognised under other receivables. Write-downs for expected losses are based on an individual assessment.
Foreign exchange
The Profi t & Loss accountTransactions in foreign currency are during the year booked at the exchange rate effective on the transaction date. Gains and losses arising from the difference between the exchange rate on the transaction date and the exchange rate prevailing at the balance sheet date are recognised in the Profi t & Loss account as fi nancial income/expense.
Receivables and payablesReceivables, payables and other monetary items in foreign currency, which exist at the balance sheet date, have been booked at the exchange rates prevailing at this date. Unrealised and realised currency gains and losses due to differences between the exchange rate prevailing at the balance sheet date and the exchange rate prevailing at the transaction date are included in the Profi t & Loss account under fi nancial income and costs.
Translation of accounts of foreign subsidiariesThe foreign subsidiaries of the company are treated according to the net investment method, since the subsidiaries are sales organizations with limited tangible fi xed assets.
The profi t & loss accounts are translated using average foreign exchange rates, while balance sheet items are translated using the exchange rates prevailing on the balance sheet date. Differences deriving from translation of the foreign companies’ initial equity to the exchange rates prevailing on the balance sheet date, and the differences owing to the translation of the Profi t & Loss accounts of the foreign companies into average exchange rates are adjusted in the equity.
Hedging of investments in foreign subsidiaries is also adjusted in the equity.
Derivative fi nancial instrumentsDerivative fi nancial instruments are initially recognised in the balance sheet at cost price and are subsequently measured at market value. Derivative fi nancial instruments are included in other receivables and other debt.
Changes to the market value of derivative fi nancial instruments, which meet the conditions for hedging the market value of a recognised asset or a recognised liability, are included in the Profi t & Loss account together with any changes in the market value of the hedged asset or the hedged liability.
Changes to the market value of derivative fi nancial instruments, which meet the conditions for hedging future assets or liabilities, are recognised in the equity under retained earnings. Earnings and costs relating to hedge-transactions are transferred from the equity when the hedged position is realised, and are included in the value of the hedged assets or liabilities. For derivative fi nancial instruments, which do not qualify as hedging instruments, changes to the market value are included on a continuing basis in the Profi t & Loss account.
The Profi t & Loss account
Net turnoverRevenue from sales of goods is recognized in the Profi t & Loss account when delivery and transfer of ownership have taken place. Revenue is recognised net of value added tax and rebates related to the sale.
Production costsProduction costs comprise wage, stock consumption and indirect costs, including salaries and depreciation/amortisation, which are incurred for the purpose of achieving the net turnover for the year.

59
Development costsDevelopment costs, which do not meet the criteria for capitalisation, are recognised in the Profi t & Loss account as development costs along with amortisation on and impairment write-downs of capitalized development projects.
Distribution and marketing costsDistribution and marketing costs comprise costs relating to sales and distribution of the Group’s products, including salaries for sales personnel, advertising and exhibition costs and depreciation/amortisation. Costs in subsidiaries, which are responsible exclusively for sales of the Group’s products, are attributed to distribution and marketing costs.
Administration costsAdministration costs comprise costs for administrative personnel, management and offi ce costs etc. incl. depreciation/amortisation.
Result in subsidiaries and associated companiesThe parent company’s share of the subsidiaries’ pre-tax results after full elimination of intra-group profi ts and losses and deducted amortisation of Group goodwill acquired after 1 June, 2002 is recognised in the Profi t & Loss account of the parent company under the item “Result from investment in subsidiaries before tax”, while the parent company’s share of the subsidiaries’ tax is included under “Tax on ordinary result”.
In the Profi t & Loss account of the Group and parent company the share of profi ts before tax in the associated company after proportional elimination of intra-group profi ts and losses and deducted amortisation of Group goodwill acquired after 1 June, 2002 is included under the item “Result from investment in associated company before tax”, while the share of the associated company’s tax is included under “Tax on ordinary result.”
Leasing/rentalRent and leasing payments relate to operational leasing of operating equipment, vehicles and administrative equipment as well as renting of buildings. Rent and leasing payments are recognised in the Profi t & Loss account in the year in which they incur. Leasing liabilities are disclosed in the notes.
Financial itemsFinancial items include interest, cash discounts, amortising additions and deductions, market value adjustments and realised and unrealised foreign exchange gains and losses.
TaxTax for the year, which includes the anticipated tax liability on taxable earnings and changes in deferred tax for the year, is recognized in the Profi t & Loss account with the share that is directly attributable to the result for the year and directly on equity with the share, which can be attributed to entries made directly to the equity.
The parent company is jointly taxed with some of its wholly owned subsidiaries. The calculated tax due in Denmark is divided between the jointly taxed companies in proportion to their taxable income (full distribution with reimbursement for tax defi cits).
The Group pays tax according to the instalment principle. Any allowances, deductions or refunds related to tax are included in fi nancial items.
The balance sheet
Intangible fi xed assets
Development projectsDevelopment projects that are clearly defi ned and identifi able and are expected to be marketed as new products within potential future markets are recognised as intangible fi xed assets.
Development projects are recognised at cost price and are amortised over the expected useful life when the criteria for capitalisation have been met. Development costs that do not meet the criteria for capitalisation in the balance sheet are included as costs in the Profi t & Loss account when incurred.
Development projects with a cost price below DKK 1 million are recognised in the Profi t & Loss account. Development projects comprise salaries, wages, materials, services and depreciation of fi xtures & fi ttings and plant and machinery that directly or indirectly relate to the Group’s development activities.
Interest related to fi nancing development projectsis recognised in the Profi t & Loss account.

60
Capitalised development projects are measured at cost price less accumulated amortisation and impairment write-downs or recoverable amount if this is lower.
Following the completion of the development work, development projects are amortised on a straight-line basis over the estimated economic useful life. The amortisation period is normally 3-6 years.
Acquired rightsAcquired rights include software, key money and patents. These are measured at cost price less accumulated amortisation.
Software with a cost price below DKK 100,000 is recognised directly in the Profi t & Loss account in the year of acquisition.
Acquired rights are amortised on a straight-line basis over the expected lifetime or the contractual duration if this is shorter, though not exceeding 10 years.
Tangible fi xed assetsTangible fi xed assets are measured at cost price with deduction of accumulated depreciation and impairment write-downs.
Leasehold improvements comprise refurbishment of shops, offi ces and warehouses and are measured at cost less accumulated depreciation.
The cost price comprises acquisition price and costs directly related to the acquisition until the time when the asset is ready for use. For fi xed assets produced by the company the cost price comprises direct and indirect costs for wage consumption, materials, components and sub-contractors.
Subsidies concerning tangible fi xed assets are deducted in the cost price.
Interests related to fi nancing the production of tangible fi xed assets are recognised in the Profi t & Loss account.
Tangible fi xed assets with a cost price less than DKK 25,000 are recognised directly in the Profi t & Loss account in the year of acquisition.
DepreciationDepreciation is carried out on a straight-line basis over the expected useful life of the asset. The following depreciation periods are used:
Land and buildings: Land None Buildings 40 years Interior refurbishment/special installations 10 years
Plant and machinery: Single purpose production tools 3 - 6 years Other plant and machinery 8 - 10 years
Other equipment, fi xture and furniture 3 - 10 years
Leasehold improvements are depreciated on a straight-line basis over the term of the lease, though not exceeding 10 years.
Write-down of fi xed assetsThe value of intangible and tangible fi xed assets is reviewed each quarter to determine if there are indications of decreases in value not refl ected by ordinary depreciation/amortisation. If this is the case the recoverable value of the asset is determined and if this value is lower than book value, a write-down is recognised. The recoverable value for an asset is the highest value of the net sales price and the capital value. If it is not possible to set a recoverable value for one asset, the asset is assessed within the smallest group of assets for which a reliable recoverable value can be set.
Financial fi xed assetsInvestments in subsidiaries are recognized in the balance sheet of the parent company at the intrinsic value according to the Group’s accounting principles applied, with additions or deductions of intra-group profi ts or losses and not amortised Group goodwill relating to business combinations after 1 June, 2002. Group goodwill relating to business combinations before 1 June, 2002 has been amortised directly over the equity.
Investment in associated company is measured in the balance sheet of the Group and the parent company following the equity method in accordance with the latest published annual fi nancial statements or periodic fi nancial statements adapted to the Group’s accounting principles applied, after proportional elimination of intra-group profi ts and losses and with the addition of not amortised Group goodwill acquired after 1 June, 2002.
61
Subsidiaries with negative intrinsic value are measured at DKK 0. A possible receivable in these companies is written down with the parent company’s share of the negative intrinsic value to the extent the receivable is assessed uncollectable. If the intrinsic value exceeds the receivable the remaining amount is recognised as a provision to the extent the parent company has a legal or actual obligation to cover the obligations of the subsidiaries.
The proportion of the results from subsidiaries and associated company, which has not been paid out as dividend, is transferred to the reserves for net revaluation according to the equity method.
Other fi nancial receivablesOther fi nancial receivables comprise primarily loans to external parties and are measured at amortised cost price corresponding to face value less write down for expected losses.
Write-down for expected losses are based on an individual assessment of each account outstanding.
InventoriesInventories are measured at cost price using the FIFO principle, or at the net realization value, if this is lower.
Cost price for raw materials, consumables and purchased goods comprises the invoice price with added delivery costs. The cost price of fi nished goods and work in progress comprises the purchase price of materials and direct labour costs, plus additional indirect production costs.
Indirect production costs include indirect materials and wages, maintenance and depreciation on plant and equipment used for production, factory buildings and other equipment as well as costs for factory administration and management.
Costs of fi nancing are not included in the cost price.
ReceivablesReceivables are measured in the balance sheet at amortised cost price corresponding to face value less write downs for expected losses. Write-downs for expected losses are based on an individual assessment of each account outstanding and for trade receivables also with a general write-down based on the company’s experience.
Equity
DividendDividend is recognised as a liability in the accounts when approved by the Annual General Meeting. Proposed dividend is shown as a separate item under equity.
Own sharesAcquisition fees, fees received in connection with the disposal of own shares and dividends received on own shares are recognised under retained earnings.
Incentive programmesThe Group’s obligation according to the share option programme and other share based programmes is not recognised as a provision in the balance sheet since the obligation is effectively covered by the Group’s supply of own shares, which have been recognised directly to equity.
Payments related to these programmes are recognised directly over the equity and do not affect the Profi t & Loss account.
Liabilities
PensionsWhen the provision for pension is not covered, it is recognised at the current value of the expected future payments less any associated assets.
Provision for warrantyProvision for warranty comprises obligations for repairing products within the warranty period. Provision for warranty is recognised and measured on the basis of the company’s experience with warranty repairs.
Deferred tax and corporation taxProvision for deferred tax is calculated according to the liability method on the basis of all temporary differences between the tax and accounting values of assets and liabilities. The tax value of assets is determined considering the planned use of the asset.
In the calculation of deferred tax, the tax value of any losses and provisions etc. is entered if it is likely to be included in future tax results. If the deferred tax constitutes a positive amount, this is recognised in the balance sheet as a deferred tax asset.

62
Corporation tax is recognised as the tax expected to be liable on the year’s taxable income less tax on account.
Financial liabilitiesFixed interest loans, such as mortgage debt or bank debt, are recognised at the date of the loan at the received proceeds less transaction costs. In subsequent periods, the loans are measured at amortised cost price corresponding to the capitalized value using the true rate of interest, so that the difference between the proceeds and the nominal value is recognised in the profi t and loss over the term of the loan.
Other fi nancial liabilities are measured at amortised cost price, which is practically the same as the nominal value.
Prepayments and deferred incomePrepayments comprise incurred costs related to the following fi nancial year.
Deferred income comprises received payments related to income in the following fi nancial year.
Cash fl ow statementThe presentation of the consolidated cash fl ow statement follows the indirect method, based on the result for the year.
The cash fl ow statement shows the Group’s cash fl ow for the year, the year’s change in liquid assets and the Group’s liquid assets at the beginning and end of the year.
Cash fl ow statement for the parent company has not been prepared as this is included in the cash fl ow statement for the Group.
Cash fl ow from operating activitiesCash fl ow from operating activities is stated as the result for the year adjusted for non-liquid result items, paid fi nancial items, paid corporation taxes and changes to working capital. The working capital comprises current assets less short-term liabilities, excluding such items, which are recognised as liquid assets.
Cash fl ow from investment activitiesCash fl ow from investment activities comprises the acquisition and sale of intangible, tangible and fi nancial fi xed assets.
Cash fl ow from fi nancing activitiesCash fl ow from fi nancing activities comprises borrowings and instalments of mortgage debt and other long-term debt and dividend and proceeds from increases in the share capital as well as sale and repurchase of own shares.
Liquid assetsLiquid assets comprise liquid funds less short-term bank debt, which form part of the Group’s ongoing cash fl ow management. Cash fl ow in foreign currency, including cash fl ow in foreign subsidiaries, is translated at average monthly exchange rates, which do not deviate materially from the exchange rate prevailing on the date of payment.
The consolidated cash fl ow statement cannot be established solely on the basis of the published accounts.
Segment informationThe Group’s main activities and primary segments are:- Branded business- Non-branded business – Medicom- Non-branded business – ICEpower
The Group’s geographical areas and secondary segments are:- Scandinavia- Central Europe- Rest of Europe- North America- Asia- Rest of the world
Scandinavia comprises Denmark, Sweden, Norway and Finland.
Central Europe comprises Germany, Switzerland and Austria.
The secondary segments are broken down according to the location of customers and activities.
The division into segments is, in all material respects, in accordance with the Group’s management structure and the internal fi nancial management.
The segment fi gures have been prepared using the same accounting principles applied as for the Group fi nancial statements.
63
Segment income and costs and segment assets and liabilities comprise those items, which can be directly allocated to the segment. Intra-group trade takes place on market terms.
Fixed assets in the segment comprise those fi xed assets, which are used directly in the operations of the segment, including intangible fi xed assets and investments in subsidiaries.
Current assets in the segment comprise those current assets, which are used directly in the operations of the segment, including inventories, trade receivables, other receivables, prepayments and liquid assets.
Segment liabilities comprise liabilities derived from the operations of the segment, including trade payables and other payables.

64

65
PROFIT AND LOSS ACCOUNT
Notes ...
1 ...
2 ...
2 ...
2 ...
2 ...
3 ...
4 ...
5 ...
6 ...
7 ...
Bang & Olufsen a/s Group Parent company
(DKK million) 2003/04 2002/03 2003/04 2002/03
Net turnover 3,612.7 3,974.2 263.6 272.0
Production costs (1,973.4) (2,297.3) (270.9) (257.0)
Gross profit 1,639.3 1,676.9 (7.3) 15.0
Development costs (327.6) (320.7) - -
Distribution and marketing costs (842.5) (926.7) - -
Administration costs etc. (135.7) (133.1) (22.0) (20.8)
Operating profit 333.5 296.4 (29.3) (5.8)
Result from investment in subsidiaries before tax - - 354.8 244.3
Result from investment in associated company before tax 1.7 3.0 1.7 3.0
Financial income 33.5 25.2 34.5 73.5
Financial costs (28.2) (34.5) (21.7) (27.8)
Financial items, net 5.3 (9.3) 12.8 45.7
Result from ordinary operations before tax 340.5 290.1 340.0 287.2
Tax on ordinary result (74.7) (97.4) (75.9) (97.4)
Group result 265.8 192.7
Minority interests’ share of the year’s result (1.7) (2.9)
Result for the year, Bang & Olufsen a/s’ share 264.1 189.8 264.1 189.8
Proposed profit distribution:
Reserve for net revaluation according to the equity method 20.6 148.4
Retained earnings 156.8 (52.6)
Proposed dividend for the financial year 86.7 94.0
264.1 189.8
The proposed dividend corresponds to a dividend of DKK 7 per share (DKK 7 per share in 2002/03).
Parentheses denote negative figures or amounts to be deducted.
Notes: see pages 77 - 93

66
BALANCE SHEETASSETS
Bang & Olufsen a/s Group Parent company
(DKK million) 31/5 04 31/5 03 31/5 04 31/5 03
Intangible fixed assets
Completed development projects 154.0 117.0 - -
Acquired rights 22.2 32.9 13.7 22.9
Goodwill 11.1 6.6 - -
Development projects in progress 82.1 83.2 - -
Total intangible fixed assets 269.4 239.7 13.7 22.9
Tangible fixed assets
Land and buildings 288.0 315.8 197.0 219.7
Plant and machinery 216.3 277.5 1.9 1.4
Other equipment 52.7 90.0 16.0 35.6
Leasehold improvements 36.6 46.1 0.8 0.7
Tangible fixed assets in progress and
pre-payments for tangible fixed assets 64.6 65.3 12.5 5.0
Total tangible fixed assets 658.2 794.7 228.2 262.4
Financial fixed assets
Investment in subsidiaries - - 1,030.0 951.4
Investment in associated company 8.6 9.5 8.6 9.5
Other financial receivables 32.2 36.2 0.2 -
Total financial fixed assets 40.8 45.7 1,038.8 960.9
Total fixed assets 968.4 1,080.1 1,280.7 1,246.2
Inventories
Raw materials 158.1 191.6 - -
Work in progress 26.0 40.4 - -
Spare parts 112.7 110.4 - -
Finished goods 193.6 187.2 0.4 0.4
Total inventories 490.4 529.6 0.4 0.4
Receivables
Trade receivables 519.6 438.3 - -
Receivables from subsidiaries - - 199.6 301.7
Other receivables 243.9 56.1 97.8 15.7
Deferred tax assets 23.0 9.2 0.5 -
Accruals 22.3 14.0 4.0 1.6
Total receivables 808.8 517.6 301.9 319.0
Liquid funds 473.0 445.0 403.1 387.8
Total current assets 1,772.2 1,492.2 705.4 707.2
Total assets 2,740.6 2,572.3 1,986.1 1,953.4
Notes ...
8 ...
9 ...
10 ...
11 ...
12 ...
13 ...
14 ...
15 ...
Notes: See pages 77 - 93

67
BALANCE SHEETEQUITY AND LIABILITIES
Notes: see pages 77 - 93
Bang & Olufsen a/s Group Parent company
(DKK million) 31/5 04 31/5 03 31/5 04 31/5 03
Equity
Share capital 123.8 134.3 123.8 134.3
Premium on share issue 5.7 3.5 5.7 3.5
Reserve for net revaluation according to the equity method - - 208.6 188.0
Retained earnings 1,435.7 1,319.3 1,227.1 1,131.3
Proposed divided for the financial year 86.7 94.0 86.7 94.0
Total equity 1,651.9 1,551.1 1,651.9 1,551.1
Minority interests 2.3 0.6 - -
Provisions
Pensions 1.2 0.3 - -
Deferred tax 65.8 78.5 - 10.6
Other provisions 67.5 44.3 - 15.0
Total provisions 134.5 123.1 - 25.6
Long-term liabilities
Mortgage loans 134.9 135.7 91.7 82.7
Loans from banks, etc. 139.1 193.9 112.5 162.5
Total long-term liabilities 274.0 329.6 204.2 245.2
Short-term liabilities
Repayment on long-term borrowing in the coming year 42.9 42.9 37.4 38.7
Trade payables 183.8 157.4 12.5 13.8
Pre-payments from customers 19.4 17.7 0.1 0.1
Corporation tax 9.6 8.6 - -
Other payables 422.2 341.3 80.0 78.9
Total short-term liabilities 677.9 567.9 130.0 131.5
Total liabilities 951.9 897.5 334.2 376.7
Total equity and liabilities 2,740.6 2,572.3 1,986.1 1,953.4
Notes ...
16 ...
17 ...
18 ...
19 ...
20 ...
21 ...
21 ...
22 ...
23 ...

68

69
Bang & Olufsen a/s Group
(DKK million) 2003/04 2002/03
Result for the year 264.1 189.8
Depreciation and write-downs 284.2 262.2
Adjustments 134.5 120.4
Change in working capital (30.5) 209.1
Cash flow from operating activities before financial items 652.3 781.5
Interest received etc. 33.5 25.2
Interest paid etc. (28.2) (34.5)
Cash flow from ordinary operations 657.6 772.2
Corporation tax paid (210.6) (129.7)
Cash flow from operating activities 447.0 642.5
Purchase of intangible fixed assets (146.5) (146.3)
Purchase of tangible fixed assets (138.2) (131.9)
Sale of intangible fixed assets 3.6 -
Sale of tangible fixed assets 80.1 47.7
Dividend received from associated company 2.0 -
Change in financial receivables 4.0 (14.1)
Cash flow from investment activities (195.0) (244.6)
Repayment of long-term loans (55.6) (59.3)
Dividend paid (94.0) (46.9)
Repurchase of own shares (98.1) -
Increase of share capital used for employee shares 2.6 0.9
Tax relating to capital increase used for employee shares 1.0 0.6
Dividend, own shares 9.3 3.1
Sale of own shares 10.8 -
Cash flow from financing activities (224.0) (101.6)
Change in liquid funds - cash flow for the year 28.0 296.3
Liquid funds 1 June 445.0 148.7
Liquid funds 31 May 473.0 445.0
Liquid funds are calculated as follows:
Liquid funds 473.0 445.0
473.0 445.0
CASH FLOW STATEMENT
Notes ...
24 ...
25 ...
Parentheses denote capital expenditure.
Notes: see pages 77 - 93

70
Parentheses denote negative figures or amounts to be deducted.
Bang & Olufsen a/s, Group
Premium on Retained Proposed
(DKK million) Share capital share issue earnings dividend Total
Equity 1 June 2003 134.3 3.5 1,319.3 94.0 1,551.1
Capital increase used for employee shares 0.4 2.2 - - 2.6
Tax on employee shares - - 1.0 - 1.0
Capital reduction (10.9) - 10.9 - -
Purchase of own shares - - (98.1) - (98.1)
Sale of own shares - - 10.8 - 10.8
Exchange rate adjustment, subsidiaries - - 4.7 - 4.7
Unrealised exchange gain on derivative
financial instrument - - 0.4 - 0.4
Dividend paid - - - (94.0) (94.0)
Dividend, own shares - - 9.3 - 9.3
Proposed dividend for the financial year - - - 86.7 86.7
Retained earnings - - 177.4 - 177.4
Equity 31 May 2004 123.8 5.7 1,435.7 86.7 1,651.9
Equity 1 June 2002 134.1 2.8 1,107.2 - 1,244.1
Accumulated effect at the beginning of the
year from changes to accounting principles - - 115.0 46.9 161.9
Adjusted equity 1 June 2002 134.1 2.8 1,222.2 46.9 1,406.0
Capital increase used for employee shares 0.2 0.7 - - 0.9
Tax on employee shares - - 0.6 - 0.6
Exchange rate adjustment, subsidiaries - - (1.0) - (1.0)
Equity adjustments in subsidiaries - - (0.8) - (0.8)
Unrealised exchange loss on derivative
financial instrument - - (0.6) - (0.6)
Dividend paid - - - (46.9) (46.9)
Dividend, own shares - - 3.1 - 3.1
Proposed dividend for the financial year - - - 94.0 94.0
Retained earnings - - 95.8 - 95.8
Equity 31 May 2003 134.3 3.5 1,319.3 94.0 1,551.1
STATEMENT OF CHANGES IN EQUITY

71
Bang & Olufsen a/s, parent company
Reserve for
net revalution
Premium on according to the Retained Proposed
(DKK million) Share capital share issue equity method earnings dividend Total
Equity 1 June 2003 134.3 3.5 188.0 1,131.3 94.0 1,551.1
Capital increase used for employee shares 0.4 2.2 - - - 2.6
Tax on employee shares - - - 1.0 - 1.0
Capital reduction (10.9) - - 10.9 - -
Purchase of own shares - - - (98.1) - (98.1)
Sale of own shares - - - 10.8 - 10.8
Exchange rate adjustment, subsidiaries - - - 4.7 - 4.7
Unrealised exchange gain on derivative
financial instrument - - - 0.4 - 0.4
Dividend paid - - - - (94.0) (94.0)
Dividend, own shares - - - 9.3 - 9.3
Proposed dividend for the financial year - - - - 86.7 86.7
Retained earnings - - 20.6 156.8 - 177.4
Equity 31 May 2004 123.8 5.7 208.6 1,227.1 86.7 1,651.9
The capital reduction was approved before 31 May, but registered subsequently.
Equity 1 June 2002 134.1 2.8 39.6 1,067.6 - 1,244.1
Accumulated effect at the beginning of the
year from changes to accounting principles - - - 115.0 46.9 161.9
Adjusted equity at 1 June 2002 134.1 2.8 39.6 1,182.6 46.9 1,406.0
Capital increase used for employee shares 0.2 0.7 - - - 0.9
Tax on employee shares - - - 0.6 - 0.6
Exchange rate adjustment, subsidiaries - - - (1.0) - (1.0)
Equity adjustments in subsidiaries - - - (0.8) - (0.8)
Unrealised exchange loss on derivative
financial instrument - - - (0.6) - (0.6)
Dividend paid - - - - (46.9) (46.9)
Dividend, own shares - - - 3.1 - 3.1
Proposed dividend for the financial year - - - - 94.0 94.0
Retained earnings - - 148.4 (52.6) - 95.8
Equity 31 May 2003 134.3 3.5 188.0 1,131.3 94.0 1,551.1
Specification of movements in share capital: 2003/04 2002/03 2001/02 2000/01 1999/00
Share capital at the beginning of the year 134.3 134.1 133.9 133.9 133.6
Capital increase 0.4 0.2 0.2 - 0.3
Capital reduction (10.9) - - - -
Share capital at the end of the year 123.8 134.3 134.1 133.9 133.9
STATEMENT OF CHANGES IN EQUITY
Parentheses denote negative figures or amounts to be deducted.

72
SEGMENT INFORMATION
Branded business Non-branded business
Bang & Olufsen Bang & Olufsen Medicom a/s
(DKK million) 2003/04 2002/03 2003/04 2002/03
Primary segment - activities
Net turnover 3,472.2 3,761.0 135.4 219.7
Internal turnover (20.4) (27.7) - (2.1)
External turnover 3,451.8 3,733.3 135.4 217.6
Gross profit 1,606.0 1,648.9 25.8 34.4
Earnings before interest and tax (EBIT) 333.8 310.7 (6.4) (4.7)
Result from ordinary operations before tax 343.5 308.4 (8.8) (8.2)
Group result 254.8 209.1 (6.2) (5.8)
Fixed assets 974.0 1,062.0 81.9 99.5
Current assets 1,724.9 1,424.4 62.2 55.1
Total assets 2,698.9 2,486.4 144.1 154.6
Equity 1,651.9 1,551.1 69.6 75.8
Minority interests 2.3 0.6 - -
Subordinate loan capital - - - -
Provisions 137.3 120.2 0.1 2.8
Liabilities 907.4 814.5 74.4 76.0
Total liabilities 2,698.9 2,486.4 144.1 154.6
Average number of employees
in Denmark 2,051 2,053 129 234
abroad 513 493 - -
2,564 2,546 129 234
Parentheses denote negative figures or amounts to be deducted.

73
Non-branded business Bang & Olufsen a/s
Bang & Olufsen ICEpower a/s Other/eliminations Group
2003/04 2002/03 2003/04 2002/03 2003/04 2002/03
43.1 30.9 (38.0) (37.4) 3,612.7 3,974.2
(17.6) (7.6) 38.0 37.4 - -
25.5 23.3 - - 3,612.7 3,974.2
22.4 11.9 (14.9) (18.3) 1,639.3 1,676.9
6.1 (9.6) - - 333.5 296.4
5.8 (10.1) - - 340.5 290.1
17.2 (10.6) - - 265.8 192.7
11.1 5.9 (98.6) (87.3) 968.4 1,080.1
29.6 37.6 (44.5) (24.9) 1,772.2 1,492.2
40.7 43.5 (143.1) (112.2) 2,740.6 2,572.3
23.1 5.9 (92.7) (81.7) 1,651.9 1,551.1
- - - - 2.3 0.6
5.9 5.6 (5.9) (5.6) - -
0.2 0.1 (3.1) - 134.5 123.1
11.5 31.9 (41.4) (24.9) 951.9 897.5
40.7 43.5 (143.1) (112.2) 2,740.6 2,572.3
24 23 - - 2.204 2.310
- - - - 513 493
24 23 - - 2,717 2,803
Secondary segment - geography
Total fixed assets Total liabilities Net turnover
2003/04 2002/03 2003/04 2002/03 2003/04 2002/03
Scandinavia 2,174.3 2,178.4 1,448.3 1,501.9 817.1 931.4
Central Europe 26.0 34.4 113.6 141.4 657.9 830.4
Rest of Europe 38.8 33.9 210.7 113.3 1,531.4 1,598.8
North America 44.4 57.8 90.8 179.9 293.4 321.9
Asia 2.1 4.2 56.4 41.9 239.6 202.0
Rest of the world - - - - 73.3 89.7
Eliminations (1,317.2) (1,228.6) (833.4) (957.8) - -
Total 968.4 1,080.1 1,086.4 1,020.6 3,612.7 3,974.2
Export share 83% 81%

74

75
Notes to the profit and loss account
77 1. Net turnover
78 2. Employees
80 3. Result from investment in subsidiaries before tax
80 4. Financial income
80 5. Financial costs
81 6. Tax on ordinary result
81 7. Minority interests’ share of the year’s result
Notes to the balance sheet
82 8. Intangible fi xed assets
84 9. Tangible fi xed assets
86 10. Investment in subsidiaries
86 11. Investment in associated company
87 12. Other fi nancial receivables
87 13. Other receivables
87 14. Deferred tax assets
87 15. Accruals
88 16. Share capital
88 17. Minority interests
89 18. Pensions
89 19. Deferred tax
90 20. Other provisions
90 21. Short and long-term liabilities
91 22. Corporation tax
91 23. Other payables
Notes to the cash fl ow statement
91 24. Adjustments
91 25. Change in working capital
Notes – without cross-reference
91 26. Fees to the auditors elected at the Annual
General Meeting
92 27. Contingent liabilities and other fi nancial commitments
93 28. Financial instruments
93 29. Related parties
NOTES

76

77
Group Parent company
(DKK million) 2003/04 2002/03 2003/04 2002/03
Net turnover
Denmark 630.9 744.3 263.6 272.0
Norway 64.9 70.6 - -
Sweden 112.1 104.4 - -
Finland 11.1 12.1 - -
Scandinavia 819.0 931.4 263.6 272.0
Germany 391.2 499.8 - -
Switzerland 216.6 271.0 - -
Austria 51.6 59.6 - -
Central Europe 659.4 830.4 - -
The UK 617.8 588.5 - -
France 183.7 195.0 - -
Spain 204.2 213.3 - -
Italy 196.2 231.4 - -
Belgium 82.4 97.5 - -
Holland 199.5 235.3 - -
Rest of Europe 44.2 37.8 - -
Rest of Europe 1,528.0 1,598.8 - -
The US 293.4 321.9 - -
North America 293.4 321.9 - -
Japan 61.8 50.9 - -
Singapore 35.7 23.9 - -
Rest of Asia 142.1 127.2 - -
Asia 239.6 202.0 - -
Rest of world 73.3 89.7 - -
Rest of world 73.3 89.7 - -
Total 3,612.7 3,974.2 263.6 272.0
Notes ...
1 ...

78
Group Parent company
(DKK million) 2003/04 2002/03 2003/04 2002/03
Employees
Remuneration to Board of Directors of parent company 2.7 2.2 2.7 2.2
Remuneration to Board of Management of parent company 6.5 5.8 6.5 5.8
Wages, salaries, fees 820.7 828.6 87.0 81.2
Pensions 42.8 38.1 4.9 4.5
Other statutory contributions 40.1 43.7 1.1 1.6
912.8 918.4 102.2 95.3
Average number of full-time employees:
Denmark 2,204 2,310 270 267
Abroad 513 493 - -
2,717 2,803 270 267
The Bang & Olufsen Group’s share option programme comprises a number of directors and senior managers in the Group.
The allocation of options is dependent on employment during the qualifying periods.
As at 31 May, 2004, the pool of unexercised options totals 84,311 options, which can be exercised between 2004-2008.
The exercise prices, which are linked to earnings in the financial years 2001/02, 2002/03 and 2003/04, are determined
as the average price for the 10 days subsequent to the publication of the annual accounts in August 1999, 2000 and 2001.
To cover the options programme, Bang & Olufsen a/s has purchased own shares, which cover the full commitment.
The shares are recognised directly in the equity.
Other
Share options in Board of Board of directors and Total number Exercise price Exercise
Bang & Olufsen a/s Directors Management managers of shares per option period
Outstanding 1 June, 2002 - 70,000 52,295 122,295
Terminated 2002/03 - - (1,880) (1,880) 270
Terminated 2002/03 - - (1,880) (1,880) 305
Terminated 2002/03 - - (1,880) (1,880) 177
Allocated 2002/03 - 500 1,801 2,301 305 August 2003 - August 2007
Allocated 2002/03 - 500 1,801 2,301 177 August 2004 - August 2008
Outstanding 31 May, 2003 - 71,000 50,257 121,257
Notes ...
2 ...
Parentheses denote negative figures or amounts to be deducted.

79
(DKK million)
Employees (cont.)
Other
Share options in Board of Board of directors and Total number Exercise price Exercise
Bang & Olufsen a/s Directors Management managers of shares per option period
Outstanding 1 June, 2003 - 71,000 50,257 121,257
Terminated 2003/04 - - (628) (628) 270
Terminated 2003/04 - - (688) (688) 305
Terminated 2003/04 - - (688) (688) 177
Exercised 2003/04 - - (20,000) (20,000) 270
Exercised 2003/04 - (10,000) - (10,000) 201
Exercised 2003/04 - (12,500) - (12,500) 270
Allocated 2003/04 - 2,500 732 3,232 270 August 2002 - August 2006
Allocated 2003/04 - 2,000 - 2,000 305 August 2003 - August 2007
Allocated 2003/04 - 2,000 326 2,326 177 August 2004 - August 2008
Outstanding 31 May, 2004 - 55,000 29,311 84,311
As at 31 May, 2004,
the share options Other
are broken down Board of Board of directors and Total number Exercise price Exercise
as follows: Directors Management managers of shares per option period
Qualification period:
Financial year 2000/01 - 30,000 - 30,000 201 august 2002 - august 2006
Financial year 2001/02 - - 8,989 8,989 270 august 2002 - august 2006
Financial year 2002/03 - 12,500 9,998 22,498 305 august 2003 - august 2007
Financial year 2003/04 - 12,500 10,324 22,824 177 august 2004 - august 2008
Outstanding 31 May, 2004 - 55,000 29,311 84,311
Other
Share options in Board of Board of directors and
Bang & Olufsen a/s Directors Management managers Total
Market value 31 May, 2004 - 9,577 4,772 14,349
Market value 31 May, 2003 - 2,463 1,335 3,798
The market value has been calculated on the basis of the Black-Scholes model for determining the value of options. For 2001/02,
2002/03 and 2003/04 calculations, the average dividend for the Bang & Olufsen a/s share for the previous five years has been used,
a volatility of 38.9%, 42.7% and 53.2%. The risk-free interest rate (swap interest, mid-price) has for 2003/04 been calculated for
the 2nd year at 2.9%, 3rd year 3.29%, 4th year 3.61%, 5th year 3.87%, and the expected term is fixed for the expiry of the
maturity period.
Calculated on the basis of the closing rate of 355 as at 31 May, 2004, the intrinsic value totals DKK 10.6 million.
Notes ...
2 ...
Parentheses denote negative figures or amounts to be deducted.

80
Parentheses denote negative figures or amounts to be deducted.
Group Parent company
(DKK million) 2003/04 2002/03 2003/04 2002/03
Result from investment in subsidiaries before tax
Share of profits in subsidiaries - - 365.0 261.6
Share of losses in subsidiaries - - (12.4) (23.9)
Change in unrealised consolidated gross profit - - 2.2 6.6
- - 354.8 244.3
Financial income
Interest income from banks etc. 7.7 7.3 7.2 6.4
Interest income from subsidiaries - - 12.1 27.9
Exchange rate gains, net 7.9 - 8.8 33.6
Cash discounts 6.3 8.3 - -
Other financial income 11.6 9.6 6.4 5.6
33.5 25.2 34.5 73.5
Financial costs
Interest on bank loans etc. 10.1 14.2 9.9 11.7
Interest on mortgage loans 10.3 10.3 6.0 6.8
Interest costs to subsidiaries - - 3.4 7.9
Exchange rate loss, net - 0.6 - -
Cash discounts 3.0 4.7 - -
Other financial costs 4.8 4.7 2.4 1.4
28.2 34.5 21.7 27.8
Notes ...
3 ...
4 ...
5 ...

81
Notes ...
6 ...
7 ...
Parentheses denote negative figures or amounts to be deducted.
Group Parent company
(DKK million) 2003/04 2002/03 2003/04 2002/03
Tax on ordinary result
Parent company:
Current tax 6.5 10.5 6.5 10.5
Change in deferred tax (11.4) 1.4 (11.4) 1.4
Adjustment previous years, current and deferred tax 0.8 (21.8) 0.8 (21.8)
Parent company, total (4.1) (9.9) (4.1) (9.9)
Subsidiaries and associated company:
Current tax 109.0 106.3 110.2 106.3
Change in deferred tax (13.8) (3.7) (13.8) (3.7)
Adjustment previous years, current and deferred tax (16.4) 4.7 (16.4) 4.7
Subsidiaries and associated company, total 78.8 107.3 80.0 107.3
Tax on ordinary result, total 74.7 97.4 75.9 97.4
Tax on the year’s result can be explained as follows:
Danish corporation tax 30.0% 30.0%
Tax effect of:
Non-deductible costs and non-taxable income - 0.4%
Differing tax rate in foreign subsidiaries 2.3% 1.4%
Adjustment of tax relating to previous years (1.3%) (5.9%)
Non-capitalised tax losses 1.4% 7.3%
Tax losses not previously capitalised (3.7%) -
Deduction of loss on conversion of debt in subsidiaries (6.8%) -
Other - 0.4%
The year’s effective tax rate 21.9% 33.6%
Corporation tax paid in the parent company including tax
paid on an instalment basis amounts to DKK 179.9 million.
The parent company pays current tax for
jointly taxed Danish companies.
Minority interests’ share of the year’s result
Bang & Olufsen ICEpower a/s (1.7) 5.5
Bang & Olufsen Retail East LLC. - (8.4)
Minority interests’ share of the year’s result, total (1.7) (2.9)

82
(DKK million)
Intangible fixed assets
Completed Development
development Acquired projects in
Group projects rights Goodwill progress Total
Cost price 1 June 611.9 93.5 6.9 83.2 795.5
Exchange rate adjustment to year-end rate - 0.1 0.2 - 0.3
Additions during the year 82.3 10.0 8.0 46.2 146.5
Disposals during the year - (4.5) - - (4.5)
Completed development projects 47.3 - - (47.3) -
Cost price 31 May 741.5 99.1 15.1 82.1 937.8
Amortisation and write-downs 1 June 494.9 60.6 0.3 - 555.8
The year’s amortisation 79.1 18.7 2.0 - 99.8
Reversed amortisation on disposals - (2.4) - - (2.4)
The year’s write-downs 13.5 - 1.7 - 15.2
Amortisation and write-downs 31 May 587.5 76.9 4.0 - 668.4
Book value 31 May 154.0 22.2 11.1 82.1 269.4
Amortisation on intangible fixed assets is expensed under the following items:
Production costs 1.6
Development costs 97.5
Distribution and marketing costs 7.7
Administration costs etc. 8.2
115.0
In 1997/98 the Group acquired a capital share in the then Bang & Olufsen a/s. In accordance with the Group’s
accounting principles at the time, Group goodwill was determined at DKK 296.3 million, which was immediately
amortised over the equity.
Notes ...
8 ...
Parentheses denote negative figures or amounts to be deducted.

83
(DKK million)
Intangible fixed assets (cont.)
Completed Development
development Acquired projects in
Parent company projects rights Goodwill progress Total
Cost price 1 June - 63.1 - - 63.1
Additions during the year - 4.3 - - 4.3
Cost price 31 May - 67.4 - - 67.4
Amortisation 1 June - 40.2 - - 40.2
The year’s amortisation - 13.5 - - 13.5
Amortisation 31 May - 53.7 - - 53.7
Book value 31 May - 13.7 - - 13.7
Amortisation on intangible fixed assets is expensed under the following items:
Production costs 1.3
Development costs 2.0
Distribution and marketing costs 2.1
Administration costs etc. 8.1
13.5
Notes ...
8 ...
Parentheses denote negative figures or amounts to be deducted.

84
Parentheses denote negative figures or amounts to be deducted.
(DKK million)
Tangible fixed assets
Tangible fixed
Land and Plant and Other Leasehold assets in
Group buildings machinery equipment improvements progress Total
Cost price 1 June 531.7 1,257.2 303.5 87.3 65.3 2,245.0
Exchange rate adjustment to year-end rate 0.5 - 0.4 (0.6) - 0.3
Reclassification - - (0.1) 0.1 - -
Additions during the year 5.0 51.7 19.9 7.2 54.4 138.2
Completed assets - 54.3 - - (54.3) -
Disposals during the year (48.0) (305.9) (81.4) (23.3) (0.8) (459.4)
Cost price 31 May 489.2 1,057.3 242.3 70.7 64.6 1,924.1
Depreciation 1 June 215.9 979.7 213.5 41.2 - 1,450.3
Exchange rate adjustment to year-end rate - - 0.5 0.1 - 0.6
Reclassification - - (0.1) 0.1 - -
The year’s depreciation 20.3 98.3 41.3 9.3 - 169.2
Reversed depreciation on disposals (35.0) (237.0) (65.6) (16.6) - (354.2)
Depreciation 31 May 201.2 841.0 189.6 34.1 - 1,265.9
Book value 31 May 288.0 216.3 52.7 36.6 64.6 658.2
The cash value of property in Denmark according to the most recent valuation is DKK 287.3 million.
The cost price for property abroad is DKK 39.1 million.
Depreciation on tangible fixed assets is expensed under the following items:
Production costs 112.2
Development costs 14.0
Distribution and marketing costs 19.3
Administration costs etc. 23.7
169.2
Notes ...
9 ...

85
(DKK million)
Tangible fixed assets (cont.)
Tangible fixed
Land and Plant and Other Leasehold assets in
Parent company buildings machinery equipment improvements progress Total
Cost price 1 June 411.0 5.4 89.8 1.2 5.0 512.4
Additions during the year 4.8 1.1 8.9 0.3 7.5 22.6
Disposals during the year (45.7) (0.9) (11.7) (0.1) - (58.4)
Cost price 31 May 370.1 5.6 87.0 1.4 12.5 476.6
Depreciation 1 June 191.3 4.0 54.2 0.5 - 250.0
The year’s depreciation 16.8 0.3 27.7 0.2 - 45.0
Reversed depreciation on disposals (35.0) (0.6) (10.9) (0.1) - (46.6)
Depreciation 31 May 173.1 3.7 71.0 0.6 - 248.4
Book value 31 May 197.0 1.9 16.0 0.8 12.5 228.2
The cash value of property in Denmark according to the most recent valuation is DKK 287.3 million.
Depreciation of tangible fixed assets is expensed under the following items:
Production costs 10.9
Development costs 8.6
Distribution and marketing costs 3.0
Administration costs etc. 22.5
45.0
Notes ...
9 ...
Parentheses denote negative figures or amounts to be deducted.

86
Parentheses denote negative figures or amounts to be deducted.
Group Parent company
(DKK million) 2003/04 2002/03 2003/04 2002/03
Investment in subsidiaries
Cost price 1 June 763.4 763.4
Additions during the year 58.0 -
Cost price 31 May 821.4 763.4
Value adjustment 1 June 188.0 (75.9)
Accumulated effect at the beginning of the year
from changes to the accounting principles - 115.5
Adjusted value adjustment 1 June 188.0 39.6
Exchange rate adjustment, opening 4.7 (1.0)
Equity adjustments - (0.7)
Unrealised gain/(loss) on derivative financial instrument 0.4 (0.6)
Change in unrealised consolidated gross profit 2.2 6.6
Net result for the year after tax 273.1 131.3
Reversal of negative equity offset in receivables
from subsidiaries (24.8) (2.2)
Dividend paid (220.0) -
Reversal of negative equity included under provisions (15.0) 15.0
Value adjustment 31 May 208.6 188.0
Book value 31 May 1,030.0 951.4
Investment in associated company
Cost price 1 June 17.0 17.0 17.0 17.0
Cost price 31 May 17.0 17.0 17.0 17.0
Value adjustment 1 June (7.5) (9.0) (7.5) (9.0)
Accumulated effect at the beginning of the year
from changes to the accounting principles - (0.5) - (0.5)
Adjusted value adjustment 1 June (7.5) (9.5) (7.5) (9.5)
Adjustment, opening - (0.1) - (0.1)
Net result for the year after tax 1.1 2.1 1.1 2.1
Dividend paid (2.0) - (2.0) -
Value adjustment 31 May (8.4) (7.5) (8.4) (7.5)
Book value 31 May 8.6 9.5 8.6 9.5
Bang & Olufsen’s share
Name and registered Ownership Share Result Ordinary result Result
office interest capital Equity for the year Equity before tax for the year
John Bjerrum Nielsen A/S
Bramming 33% 10.0 25.9 3.4 8.6 1.7 1.1
Notes ...
10 ...
11 ...

87
Parentheses denote negative figures or amounts to be deducted.
Group Parent company
(DKK million) 2003/04 2002/03 2003/04 2002/03
Other financial receivables
Balance 1 June 36.2 22.1 - -
Exchange rate adjustment to year-end rate (0.7) 2.7 - -
The year’s movements (3.3) 11.4 0.2 -
Balance 31 May 32.2 36.2 0.2 -
Other receivables
Corporation tax receivable 121.2 22.5 96.3 6.5
Other receivables 122.7 33.6 1.5 9.2
Book value 31 May 243.9 56.1 97.8 15.7
Of other receivables, the following amounts fall
due for payment after 1 year 4.0 4.6 - -
Deferred tax assets
Deferred tax assets 1 June 9.2 7.0 - 1.8
Exchange rate adjustment to year-end rate - (0.1) - -
The year’s change 13.8 2.3 - (1.8)
Transferred from deferred tax - - 0.5 -
Deferred tax assets 31 May 23.0 9.2 0.5 -
Intangible fixed assets 4.4 - (3.5) -
Tangible fixed assets 1.9 0.6 4.6 -
Financial fixed assets 0.1 0.2 - -
Inventories 0.7 0.3 (2.6) -
Receivables 3.4 3.1 2.0 -
Provisions 3.7 3.4 - -
Retaxation balance 8.5 0.6 - -
Other 0.3 1.0 - -
23.0 9.2 0.5 -
Deferred tax assets relate to the subsidiaries in Denmark, Holland, Germany, Austria, the UK, France, Italy and Singapore.
Deferred tax assets have been accrued at prevailing local tax rates.
Tax assets relating to the subsidiaries in the US and Japan have not been recognised.
Accruals
Accruals are made up of prepaid costs relating to rent, deposits, insurance premiums, subscriptions and interest etc.
Notes ...
12 ...
13 ...
14 ...
15 ...

88
Group Parent company
(DKK million) 2003/04 2002/03 2003/04 2002/03
Share capital
As at 31 May, 2004, the share capital consists of:
1,119,910 shares of DKK 10 (Ordinary shares
(multiple voting shares)) 11.2 11.5 11.2 11.5
11,260,420 shares of DKK 10 (Ordinary shares) 112.6 122.8 112.6 122.8
123.8 134.3 123.8 134.3
Number of own shares
Shares (Ordinary shares (multiple voting shares)) 6,840 27,590 6,840 27,590
Shares (Ordinary shares) 157,500 867,361 157,500 867,361
164,340 894,951 164,340 894,951
Nominal value in DKK million 1.6 8.9 1.6 8.9
% of capital 1.3 6.7 1.3 6.7
The year’s acquisitions:
Number 407,120 - 407,120 -
Nominal value 4.1 - 4.1 -
% of share capital, year-end 3.3 - 3.3 -
Total acquisition sum 98.1 - 98.1 -
The acquisition was undertaken in accordance with the
authority from the Annual General Meeting for the purpose
of repaying shareholders.
The year’s sale:
Number 42,500 - 42,500 -
Nominal value 0.4 - 0.4 -
% of share capital, year-end 0.3 - 0.3 -
Total sales sum 10.8 - 10.8 -
The sale was undertaken in connection with the use of
the options programme.
Minority interests
Balance 1 June 0.6 -
Capital increase - 6.2
Minority interests’ share of the year’s result (3.9) (11.8)
Reversed provisions on negative receivables - (3.2)
Transferred to other receivables 5.6 9.4
Balance 31 May 2.3 0.6
Notes ...
16 ...
17 ...
Parentheses denote negative figures or amounts to be deducted.
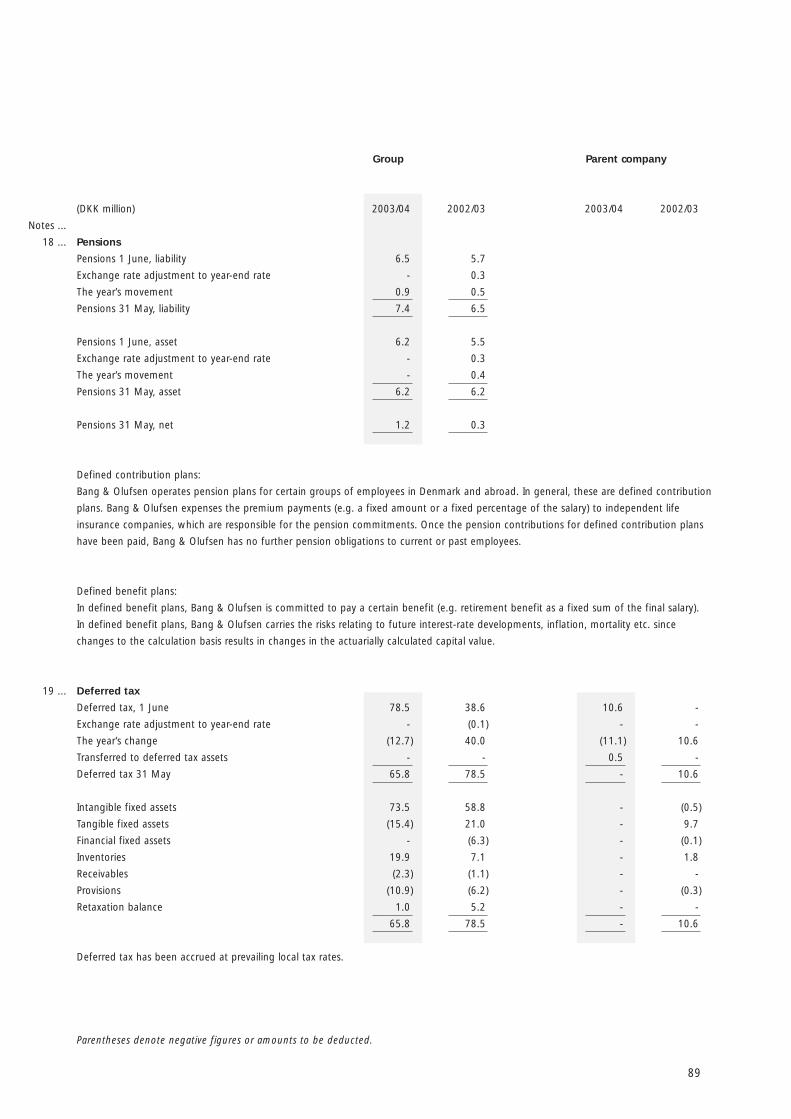
89
Group Parent company
(DKK million) 2003/04 2002/03 2003/04 2002/03
Pensions
Pensions 1 June, liability 6.5 5.7
Exchange rate adjustment to year-end rate - 0.3
The year’s movement 0.9 0.5
Pensions 31 May, liability 7.4 6.5
Pensions 1 June, asset 6.2 5.5
Exchange rate adjustment to year-end rate - 0.3
The year’s movement - 0.4
Pensions 31 May, asset 6.2 6.2
Pensions 31 May, net 1.2 0.3
Defined contribution plans:
Bang & Olufsen operates pension plans for certain groups of employees in Denmark and abroad. In general, these are defined contribution
plans. Bang & Olufsen expenses the premium payments (e.g. a fixed amount or a fixed percentage of the salary) to independent life
insurance companies, which are responsible for the pension commitments. Once the pension contributions for defined contribution plans
have been paid, Bang & Olufsen has no further pension obligations to current or past employees.
Defined benefit plans:
In defined benefit plans, Bang & Olufsen is committed to pay a certain benefit (e.g. retirement benefit as a fixed sum of the final salary).
In defined benefit plans, Bang & Olufsen carries the risks relating to future interest-rate developments, inflation, mortality etc. since
changes to the calculation basis results in changes in the actuarially calculated capital value.
Deferred tax
Deferred tax, 1 June 78.5 38.6 10.6 -
Exchange rate adjustment to year-end rate - (0.1) - -
The year’s change (12.7) 40.0 (11.1) 10.6
Transferred to deferred tax assets - - 0.5 -
Deferred tax 31 May 65.8 78.5 - 10.6
Intangible fixed assets 73.5 58.8 - (0.5)
Tangible fixed assets (15.4) 21.0 - 9.7
Financial fixed assets - (6.3) - (0.1)
Inventories 19.9 7.1 - 1.8
Receivables (2.3) (1.1) - -
Provisions (10.9) (6.2) - (0.3)
Retaxation balance 1.0 5.2 - -
65.8 78.5 - 10.6
Deferred tax has been accrued at prevailing local tax rates.
Notes ...
18 ...
19 ...
Parentheses denote negative figures or amounts to be deducted.

90
Group Parent company
(DKK million) 2003/04 2002/03 2003/04 2002/03
Other provisions
Other provisions 1 June 44.3 46.0 15.0 -
Exchange rate adjustment to year-end rate 0.2 (1.9) - -
Provision for negative investment - - - 15.0
The year’s change in other provisions 23.0 0.2 (15.0) -
Other provisions 31 May 67.5 44.3 - 15.0
Provision for warranty liabilities 67.5 29.3 - -
Provision for negative investment - 15.0 - 15.0
67.5 44.3 - 15.0
The company gives 2-5 years warranty on certain products and thereby undertakes the liability to repair or replace products,
which do not function satisfactorily.
Other provisions of DKK 67.5 million are included (2002/03 DKK 29.3 million) for expected warranty claims based on previous experience
relating to the level of repair and returned goods.
Short and long-term liabilities
Falls due Falls due Falls due Falls due after
Group within 1 year 1 - 5 years after 5 years 1 year, total
Long-term liabilities:
Fixed rate loan, interest rate level 5.9 - 6.4% 29.4 117.5 14.7 132.2
Fixed rate loan, interest rate level 5.0% 9.7 39.8 75.4 115.2
Floating rate loan, interest rate level 4.2% 3.8 26.6 - 26.6
Book value 31 May, 2004 42.9 183.9 90.1 274.0
Book value 31 May, 2003 42.9 197.5 132.1 329.6
Parent company
Long-term liabilities:
Fixed rate loan, interest rate level 5.9 - 6.4% 29.4 117.5 14.7 132.2
Fixed rate loan, interest rate level 5.0% 8.0 32.0 40.0 72.0
Book value 31 May, 2004 37.4 149.5 54.7 204.2
Book value 31 May, 2003 38.7 153.2 92.0 245.2
The Group has entered into an interest swap with a fixed interest rate for the purpose of achieving the desired duration
and reducing the interest rate risk.
The unrealised loss on derivative financial instruments in the interest swap agreement amounted to DKK 0.2 million as at
31 May, 2004 (31 May, 2003 DKK 0.6 million), which is recognised under the equity.
Notes ...
20 ...
21 ...
Parentheses denote negative figures or amounts to be deducted.

91
Group Parent company
(DKK million) 2003/04 2002/03 2003/04 2002/03
Corporation tax
Accrued corporation tax 1 June 8.6 68.4 - 27.0
Exchange rate adjustment to year-end rate 0.4 (0.8) - -
Adjustment previous year (17.1) (58.0) - (34.5)
The year’s current tax incl. jointly taxed subsidiaries 121.3 114.8 - 74.8
Corporation tax paid during the year (210.6) (115.8) - (73.8)
Transferred to corporation tax receivable 10.7 - - -
Transferred to other receivables 96.3 - - 6.5
Accrued corporation tax 31 May 9.6 8.6 - -
Other payables
Payroll-related items 113.2 119.9 12.7 11.1
Taxes and levies 94.1 67.3 47.8 44.0
Other 214.9 154.1 19.5 23.8
Total other payables 422.2 341.3 80.0 78.9
Adjustments
Change in other provisions 24.1 (1.6)
Financial income etc. (33.5) (25.2)
Financial costs etc. 28.2 34.5
Share in associated company’s result before tax (1.7) (3.0)
Loss on sale of fixed assets 23.6 4.5
Tax on the year’s result 74.7 97.4
Minority interests 0.5 0.6
Various adjustments 18.6 13.2
134.5 120.4
Change in working capital
Change in receivables (178.7) 67.4
Change in inventories 39.2 122.8
Change in accounts payable etc. 109.0 18.9
(30.5) 209.1
Fees to the auditors elected at the
Annual General Meeting
Statutory audit
PricewaterhouseCoopers 3.0 2.8 0.1 0.1
Deloitte 1.1 1.1 0.1 0.1
4.1 3.9 0.2 0.2
Other services
PricewaterhouseCoopers 1.7 2.4 0.4 0.4
Deloitte 0.9 1.0 0.3 0.1
2.6 3.4 0.7 0.5
Fees to the auditors elected at the Annual
General Meeting, total 6.7 7.3 0.9 0.7
Notes ...
22 ...
23 ...
24 ...
25 ...
26 ...
Parentheses denote negative figures or amounts to be deducted.

92
Group Parent company
(DKK million) 2003/04 2002/03 2003/04 2002/03
Contingent liabilities and other financial commitments
Rental and leasing commitments etc.
Leasing commitments relating to plant and machinery etc. 31.1 20.5 19.9 13.0
Leasing commitments relating to establishment of shops 236.6 282.5 - -
Leasing commitments relating to office and factory property 72.3 74.0 8.9 12.4
Total 340.0 377.0 28.8 25.4
Which can be specified as follows:
for payment within 1 year 76.0 76.3 11.9 18.9
for payment between 1 and 5 years 173.6 177.1 16.9 6.5
for payment after more than 5 years 90.4 123.6 - -
340.0 377.0 28.8 25.4
Rental and leasing costs for the year 72.5 86.3 16.6 23.1
In connection with the establishment of shops in previous
financial years, the Group has entered into a number of
long-term rental agreements. The agreements include
conditions concerning the right to sublet.
Guarantees
As at 31 May, guarantees total 55.4 62.8 2.9 4.2
None of the guarantees are expected to result in any losses.
A guarantee has been issued on behalf of the US
subsidiary for a total of USD 5 million.
Letters of intent
Bang & Olufsen AudioVisual a/s has issued letters of intent to
the foreign subsidiaries’ bank connections for: 69.3 88.4
Bank debts as at 31 May 0.0 0.0
Joint taxation
The Danish companies in the Group, except for Bang & Olufsen ICEpower a/s, share common registration and are jointly
and severally liable for tax on total taxable income.
VAT and other taxes
The Danish companies in the Group share common registration and are jointly and severally liable for VAT and other taxes.
Security for mortgage debt
Security of DKK 282.4 million (DKK 313.0 million as at 31 May, 2003) has been given in land and buildings for a mortgage debt
of DKK 148.9 million (DKK 178.6 million as at 31 May, 2003). Other tangible assets related to the land and buildings are included
in the security. The book value of land and buildings is DKK 257.4 million (DKK 307.2 million as at 31 May, 2003).
Notes ...
27 ...
a ...
b ...
c ...
d ...
e ...
f ...
Parentheses denote negative figures or amounts to be deducted.

93
(DKK million)
Financial instruments
The extent and type of the Group and parent company’s financial instruments are given in the Profit & Loss account, balance sheet
and notes in accordance with the accounting principles applied. Information regarding the conditions that can affect amounts, dates of
payment or reliability of future payments where such information is not directly evident from the consolidated or parent company’s
accounts or follows from common practice is given below.
Monetary items* in foreign currency in the balance sheet as at 31 May, 2004.
Group
Currency Payment/maturity Assets Liabilities Net
EUR 0-12 months 362.5 127.7 234.8
> 12 months 2.8 4.1 (1.3)
GBP 0-12 months 119.6 45.0 74.6
SEK 0-12 months 34.4 4.6 29.8
> 12 months - 0.7 (0.7)
JPY 0-12 months 20.4 4.2 16.2
> 12 months 0.9 - 0.9
CHF 0-12 months 33.9 7.4 26.5
USD 0-12 months 54.1 60.6 (6.5)
> 12 months 0.2 2.7 (2.5)
Other 0-12 months 32.9 5.9 27.0
> 12 months 0.1 - 0.1
* Monetary items are liquid funds etc., receivables and payables, which are settled in cash.
Parent company
Currency Payment/maturity Assets Liabilities Net
EUR 0-12 months 26.6 - 26.6
GBP 0-12 months 20.7 - 20.7
SEK 0-12 months 4.2 - 4.2
JPY 0-12 months 4.1 - 4.1
CHF 0-12 months 12.7 - 12.7
USD 0-12 months 3.8 0.3 3.5
Other 0-12 months 2.1 - 2.1
Hedging
Group
There are no forward contracts as at 31 May, 2004.
Parent company
There are no forward contracts as at 31 May, 2004.
Market value of financial assets and liabilities
Mortgage loans are recognised at the amortised cost price in the annual report. The market value of mortgage
loans totals DKK 318.5 million. For other financial assets and liabilities the market value corresponds to the book value.
Related parties
No parties have a decisive influence on the Bang & Olufsen Group. The Board of Directors and Management Board have received
remuneration, c.f. note 2, Employees.
In 2003/04, the Group purchased goods from the associated company, John Bjerrum Nielsen A/S, for a value of DKK 66 million.
Trading took place at market conditions.
Notes ...
28 ...
29 ...

94

96
Printing: SaloGruppen a/s Index no.: 3666588
