bandwidth study on energy use and potential …...1 the concept of an energy bandwidth, and its use...
TRANSCRIPT
Bandwidth Study on Energy Use and Potential Energy Saving Opportunities in U.S. Advanced High Strength Steels Manufacturing
September 2017

(This page intentionally left blank)


Preface i
Preface
Reducing energy consumption through investment in advanced technologies and practices can enhance
American manufacturing competitiveness. Energy bandwidth studies of U.S. manufacturing sectors serve as
general data references to help understand the range (or bandwidth) of potential energy savings opportunities.F0F0F
1
The U.S. Department of Energy (DOE)’s Advanced Manufacturing Office (AMO) has commissioned a series
of bandwidth studies to analyze the manufacturing of products that can be used for lightweighting applications,
and provide hypothetical, technology-based estimates of potential energy savings opportunities in the
manufacturing process. The consistent methodology used in the bandwidth studies provides a framework to
evaluate and compare energy savings potentials within and across manufacturing sectors at the macro-scale.
This study is being released as part of a series of six studies focusing on energy use in the manufacture of the
following lightweight structural materials: carbon fiber reinforced polymer composites, glass fiber reinforced
polymer composites, advanced high-strength steel alloys, aluminum alloys, magnesium alloys, and titanium
alloys. The boundaries of these analyses were drawn based on features of the manufacturing processes that are
unique to each material. Therefore, the results of the lightweight materials bandwidth studies cannot be directly
compared. In a separate study, Lightweight Materials Integrating Analysis, these boundaries are redrawn to
consistently include energy consumption for all phases of the product manufacturing life cycle, from the
energy embodied in the raw materials through finished part fabrication (for selected applications); energy
associated with end-of-life recycling is also considered. This allows the data to be integrated and compared
across all six materials. This separate study, currently under development, also develops a framework for
comparing manufacturing energy intensity on a material performance (e.g., effective weight) basis for
illustrative applications.
Four different energy bands (or measures) are used
consistently in this series to describe different levels
of on-site energy consumption to manufacture
specific products and to compare potential energy
savings opportunities in U.S. manufacturing
facilities (see figure below). Current typical (CT)
is the energy consumption in 2010; state of the art
(SOA) is the energy consumption that may be
possible through the adoption of existing best
technologies and practices available worldwide;
practical minimum (PM) is the energy
consumption that may be possible if applied
research and development (R&D) technologies
under development worldwide are deployed; and the
thermodynamic minimum (TM) is the least
amount of energy required under ideal conditions,
which typically cannot be attained in commercial
applications. CT energy consumption serves as the
benchmark of manufacturing energy consumption.
TM energy consumption serves as the baseline (or
theoretical minimum) that is used in calculating
energy savings potential. Feedstock energy (the nonfuel
use of fossil energy) is not included within the energy
consumption estimates.
1 The concept of an energy bandwidth, and its use as an analysis tool for identifying potential energy saving opportunities, originated in AMO in 2002
(when it was called the Office of Industrial Technologies). Most recently, revised and consistent versions of bandwidth studies for the Chemicals,
Petroleum Refining, Iron and Steel, and Pulp and Paper sectors were published in 2015.
Figure P-1. Energy consumption bands and
opportunity bandwidths estimated in this study
Source: EERE
BANDWIDTH STUDY ON ENERGY USE AND POTENTIAL ENERGY SAVING OPPORTUNITIES IN U.S. ADVANCED HIGH STRENGTH
STEELS MANUFACTURING
ii Preface
Two on-site energy savings opportunity bandwidths are estimated: the current opportunity spans the
bandwidth from CT energy consumption to SOA energy consumption, and the R&D opportunity spans the
bandwidth from SOA energy consumption to PM energy consumption. The total opportunity is the sum of the
R&D and the current opportunities. The difference between PM energy consumption and TM energy
consumption is labeled as impractical. The term impractical is used because the PM energy consumption is
based on today’s knowledge of R&D technologies tested between laboratory and demonstration scale; further
decreases in energy intensity have not been displayed at any physical scale. However, decreasing the PM
energy consumption with future R&D efforts and emerging technologies being investigated through modeling
and theoretical calculations may eventually bring the PM energy consumption closer to the TM energy
consumption. Significant investment in technology development and implementation would be needed to fully
realize the energy savings opportunities estimated. The costs associated with achieving SOA and PM energy
consumption are not considered in this report; a techno-economic analysis of the costs and benefits of future
R&D technologies was not in the scope of this study.
For each lightweighting material studied in the series, the four energy bands are estimated for select individual
subareas of the material manufacturing process. The estimation method involved a detailed review and
analytical synthesis of data from diverse industry, governmental, and academic sources. Where published data
were unavailable, best engineering judgment was used.

Acknowledgements iii
Acknowledgments
Joseph Cresko of DOE/AMO led the conceptual development and publication of the bandwidth study series
with support from Dr. Alberta Carpenter of the National Renewable Energy Laboratory. AMO recognizes the
efforts of Caroline Dollinger, Sabine Brueske, and Keith Jamison of Energetics Incorporated for conducting
the research and analysis and writing this study. AMO wishes to acknowledge the contributions made by
Lawrence W. Kavanagh of the Steel Market Development Institute and Mahmoud Y. Demeri for their work
reviewing this study.

BANDWIDTH STUDY ON ENERGY USE AND POTENTIAL ENERGY SAVING OPPORTUNITIES IN U.S. ADVANCED HIGH STRENGTH
STEELS MANUFACTURING
iv Acknowledgements
(This page intentionally left blank)
List of Acronyms and Abbreviations v
List of Acronyms and Abbreviations
AHSS Advanced High Strength Steels
AISI American Iron and Steel Institute
AMO Advanced Manufacturing Office
AOD Argon oxygen decarburization
BF Blast furnace
BFG Blast furnace gas
BOF Basic oxygen furnace
Btu British thermal unit
COE Cost of energy
COG Coke oven gas
CT Current typical energy consumption or energy intensity
DOE U.S. Department of Energy
DRI Direct-reduced iron
EAF Electric arc furnace
EERE DOE Office of Energy Efficiency and Renewable Energy
EIA U.S. Energy Information Administration
EPA U.S. Environmental Protection Agency
GJ Gigajoules
HHV Higher heating value
IEA International Energy Agency
K Kelvin
kWh Kilowatt hours
LHV Lower heating value
MECS Manufacturing Energy Consumption Survey
mm Millimeter
MMBtu Million British thermal units
NAICS North American Industry Classification System
PJ Petajoules
PM Practical minimum energy consumption or energy intensity
SOA State of the art energy consumption or energy intensity
TBtu Trillion British thermal units
TM Thermodynamic minimum energy consumption or energy intensity

BANDWIDTH STUDY ON ENERGY USE AND POTENTIAL ENERGY SAVING OPPORTUNITIES IN U.S. ADVANCED HIGH STRENGTH
STEELS MANUFACTURING
vi List of Acronyms and Abbreviations
(This page intentionally left blank)

Executive Summary vii
Executive Summary
The United States is a significant producer of iron and steel products, especially specialty grades such as
advanced high strength steels (AHSS). This bandwidth study examines energy consumption and potential
energy savings opportunities in U.S. AHSS manufacturing for lightweighting applications. Industrial,
government, and academic data are used to estimate the energy consumed in six of the most energy intensive
manufacturing subareas. Three different energy consumption bands (or levels) are estimated for these select
manufacturing subareas based on referenced energy intensities of current, state of the art, and R&D
technologies. A fourth theoretical minimum energy consumption band is also estimated. The bandwidth—the
difference between bands of energy consumption—is used to determine the potential energy savings
opportunity. The costs associated with realizing these energy savings was not in the scope of this study.
The purpose of this data analysis is to provide macro-scale estimates of energy savings opportunities for each
AHSS manufacturing subarea. This is a step toward understanding the processes that could most benefit from
technology and efficiency improvements to realize energy savings.
Study Organization and Approach: After providing an overview of the methodology and boundaries (Chapter
1) the 2010 production volumes (Chapter 2) and current energy consumption (current typical [CT], Chapter 3)
were estimated for six select subareas. In addition, the minimum energy consumption for these processes was
estimated assuming the adoption of best technologies and practices available worldwide (state of the art
[SOA], Chapter 4) and assuming the deployment of the applied research and development (R&D) technologies
available worldwide (practical minimum [PM], Chapter 5). The minimum amount of energy theoretically
required for these processes assuming ideal conditions was also estimated (thermodynamic minimum [TM)],
Chapter 6); in some cases, this is less than zero. The difference between the energy consumption bands (CT,
SOA, PM, TM) are the estimated energy savings opportunity bandwidths (Chapter 7).
In this study, CT, SOA, PM, and TM energy consumption for six individual subareas is estimated from
multiple referenced sources.
Study Results: Two energy savings opportunity bandwidths – current opportunity and R&D opportunity – are
presented in Table ES-1 and Figure ES-1.1F1F1
2 The current opportunity is the difference between the 2010 CT
energy consumption and SOA energy consumption; the R&D opportunity is the difference between SOA
energy consumption and PM energy consumption. Potential energy savings opportunities are presented for the
U.S. advanced high strength steel manufacturing subareas studied and as a total.
The U.S. iron and steel industry operated at relatively low capacity utilization and lower-than-typical
efficiencies in 2010, due in large part to the economic downturn. While the specific impacts of the economic
factors in 2010 are not directly identified in this report, it is reasonable to assume that the current opportunity
is likely somewhat exaggerated, as a portion of the current savings could be achieved by simply optimizing
production rates. For this reason the border between current opportunity and R&D opportunity is not explicitly
defined, and a dashed line and color fading is used in Figure ES-1. Also, AHSS production has seen growth in
the past several years, especially with increased application in the automotive sector. Therefore, it is important
to note that the total energy opportunities would scale with increasing production.
2 The energy estimates presented in this study are for macro-scale consideration; energy intensities and energy consumption values do not represent energy use in any specific facility or any particular region in the United States. The costs associated with achieving energy savings are not considered in this study.
All estimates are for on-site energy use (i.e., energy consumed within the plant boundary). Energy used as feedstocks (non-fuel inputs) to production is
excluded.

BANDWIDTH STUDY ON ENERGY USE AND POTENTIAL ENERGY SAVING OPPORTUNITIES IN U.S. ADVANCED HIGH STRENGTH
STEELS MANUFACTURING
viii Executive Summary
Table ES-1. Potential Energy Savings Opportunities in the U.S. Advanced High Strength
Steel Manufacturing Sector (Considering Production for Lightweighting Application
Areas only)*
Opportunity Bandwidths
Estimated Energy Savings Opportunity for
Select Advanced High Strength Steel
Manufacturing Subareas
(per year)
Current Opportunity – energy savings if the
best technologies and practices available are
used to upgrade production
7.4 TBtu3
(52% energy savings)4
R&D Opportunity – additional energy savings if
the applied R&D technologies under
development worldwide are deployed
3.22 TBtu5
(22% energy savings)6
* Calculated using the production values for lightweight structural application areas considered in this study only (see Section 1.4),and not all AHSS.
The PM energy consumption estimates are speculative because they are based on unproven technologies. The
estimates assume the successful deployment of R&D technologies that are under development; where multiple
technologies were considered for a similar application, only the most energy efficient technology was
considered in the energy savings estimate. The difference between PM and TM is labeled “impractical” in
Figure ES-1 because the PM energy consumption is based on today’s knowledge of R&D technologies tested
between laboratory and demonstration scale; further decreases in energy intensity have not been displayed at
any physical scale. However, it is shown as a dashed line with color fading because emerging technologies
being investigated through modeling and theoretical calculations may eventually bring the PM energy
consumption further into the faded region and closer to the TM energy consumption.
An estimated 22.65 TBtu of energy was consumed in 2010 to manufacture AHSS in the United States for the
structural applications considered in this study. Based on the results of this study, an estimated 7.4 TBtu of
energy could be saved each year if capital investments in the best technologies and practices available
worldwide were used to upgrade the advanced high strength steel manufacturing subareas studied; an
additional 3.2 TBtu could be saved through the adoption of applied R&D technologies under development
worldwide.
The top three current energy savings opportunities for AHSS are as follows:
Cold rolling – 3.3 TBtu (or 43% of the current opportunity)
Hot rolling – 2.1 TBtu (or 29% of the current opportunity)
Basic oxygen furnace steelmaking – 0.9 TBtu (or 13% of the current opportunity).
The top three R&D energy savings opportunities for AHSS are as follows:
Blast furnace ironmaking – 2.0 TBtu (or 63% of the R&D opportunity)
Cokemaking – 0.4 TBtu (or 13% of the R&D opportunity).
Cold rolling – 0.3 TBtu (or 11% of the R&D opportunity)
3 Current opportunity = CT – SOA, as shown in Table 4-3.
4 Current opportunity (or SOA) percentage = (𝐶𝑇−𝑆𝑂𝐴
𝐶𝑇−𝑇𝑀) 𝑥100, as shown in Table 4-3.
5 R&D opportunity = SOA – PM, as shown in Table 5-4.
6 R&D opportunity percentage = (𝑆𝑂𝐴−𝑃𝑀
𝐶𝑇−𝑇𝑀) 𝑥100, as shown in Table 5-4.
DOE researchers will continue to evaluate the energy consumption and opportunity bandwidths in U.S. advanced high strength steel manufacturing, along with bandwidth study results from other manufacturing sectors.

Executive Summary ix
Figure ES-1. Current and R&D energy savings opportunities for the advanced high strength steel manufacturing
subareas studied (considering lightweighting application area production only)
Source: EERE

BANDWIDTH STUDY ON ENERGY USE AND POTENTIAL ENERGY SAVING OPPORTUNITIES IN U.S. ADVANCED HIGH STRENGTH
STEELS MANUFACTURING
x Executive Summary
(This page intentionally left blank)
Table of Contents xi
Table of Contents
Preface ................................................................................................................................................................... i
Acknowledgments ............................................................................................................................................... iii
List of Acronyms and Abbreviations .................................................................................................................... v
Executive Summary ............................................................................................................................................ vii
Table of Contents ................................................................................................................................................. xi
List of Figures ..................................................................................................................................................... xii
List of Tables ...................................................................................................................................................... xii
1. Introduction .................................................................................................................................................. 1
1.1. Overview ............................................................................................................................................ 1 1.2. Definitions of Energy Consumption Bands and Opportunity Bandwidths ......................................... 1 1.3. Bandwidth Analysis Method .............................................................................................................. 2 1.4. Boundaries of the AHSS Bandwidth Study ........................................................................................ 3
2. Advanced High Strength Steel Production ................................................................................................... 5
2.1. Manufacturing Overview .................................................................................................................... 5 2.2. Production Values ............................................................................................................................... 7
3. Current Typical Energy Intensity and Energy Consumption ........................................................................ 9
3.1. Sources for Current Typical Energy Intensity .................................................................................... 9 3.2. Current Typical Energy Intensity and Energy Consumption ............................................................ 10
4. State of the Art Energy Intensity and Energy Consumption ...................................................................... 11
4.1. Sources for State of the Art Energy Intensity ................................................................................... 11 4.2. State of the Art Energy Intensity and Energy Consumption ............................................................. 12
5. Practical Minimum Energy Intensity and Energy Consumption ................................................................ 14
5.1. Sources for Practical Minimum Energy Intensity ............................................................................. 14 5.2. Practical Minimum Energy Intensity and Energy Consumption ...................................................... 14
6. Thermodynamic Minimum Energy Intensity and Energy Consumption .................................................... 18
6.1. Sources for Thermodynamic Minimum Energy Intensity ................................................................ 18 6.2. Thermodynamic Minimum Energy Intensity and Energy Consumption .......................................... 19
7. Current and R&D Opportunity Analysis/Bandwith Summary ................................................................... 21
8. References .................................................................................................................................................. 24
Appendix A1. Master AHSS Summary Table .................................................................................................... 31
Appendix A2: References for Production, CT, SOA, PM, TM .......................................................................... 32
Appendix A3: Practical Minimum Energy Intensity Calculation and Technologies Considered ....................... 33

BANDWIDTH STUDY ON ENERGY USE AND POTENTIAL ENERGY SAVING OPPORTUNITIES IN U.S. ADVANCED HIGH STRENGTH
STEELS MANUFACTURING
xii Table of Contents
List of Figures
Figure P-1. Energy consumption bands and opportunity bandwidths estimated in this study ............................... i
Figure ES-1. Current and R&D energy savings opportunities for the advanced high strength steel
manufacturing subareas studied (considering lightweighting application area production only) ........................ ix
Figure 1-1. Energy consumption bands and opportunity bandwidths estimated in this study .............................. 3
Figure 1-1. Estimated makeup of the AHSS market in 2010. ............................................................................... 4 Figure 2-1. Steelmaking flowlines for integrated (top) and mini mills (bottom) (AISI 2013b) ........................... 6 Figure 7-1. Current and R&D energy savings opportunities in U.S. AHSS manufacturing for the subareas and
application areas studied ..................................................................................................................................... 22
List of Tables
Table ES-1. Potential Energy Savings Opportunities in the U.S. Advanced High Strength Steel Manufacturing
Sector (Considering Production for Lightweighting Application Areas only)* ................................................ viii Table 2-1. Advanced High Strength Steel Manufacturing Process Areas Considered in Bandwidth Analysis .... 7 Table 2-2. U.S. Advanced High Strength Steel Subarea Products and Production in 2010 ................................. 8 Table 3-1. Main Sources Referenced in Identifying Current Typical Intensity by Subarea and Material Total .. 9 Table 3-2. On-site CT Energy Intensity and Calculated Energy Consumption and Calculated Primary CT
Energy Consumption for U.S. AHSS Manufacturing: Application Areas Studied (2010) ................................. 10 Table 4-1. Main Sources Referenced in Identifying State of the Art Intensity by Process Area and Material
Total .................................................................................................................................................................... 11 Table 4-2. SOA Energy Intensities and Calculated SOA Energy Consumption for AHSS Manufacturing:
Application Areas Studied .................................................................................................................................. 12 Table 4-3. Calculated SOA Energy Consumption for AHSS Manufacturing: Application Areas Studied ........ 13 Table 5-1. Sources Referenced in Identifying Practical Minimum Intensity by Process Area and Material Total
............................................................................................................................................................................ 14 Table 5-2. Calculated PM Energy Consumption for AHSS Manufacturing: Application Areas Studied........... 15 Table 5-3. Calculated PM Energy Consumption for AHSS Manufacturing: Application Areas Studied........... 16 Table 5-4. Calculated PM Energy Consumption, R&D Opportunity, and R&D Opportunity for AHSS
Manufacturing: Application Areas Studied ........................................................................................................ 17 Table 6-1. Calculated TM Energy Consumption for AHSS Manufacturing: Application Areas Studied .......... 20 Table 7-1. Current and R&D Opportunity for AHSS Manufacturing: Application Areas Studied .................... 21 Table A1-1. U.S. Production Volume of AHSS Processes in 2010 with Energy Intensity Estimates and
Calculated On-site Energy Consumption for the Four Bandwidth Measures (Excludes Feedstock Energy) ..... 31 Table A2-1. U.S. Production Volume of AHSS Processes in 2010 with Energy Intensity Estimates and
Calculated On-site Energy Consumption for the Four Bandwidth Measures (Excludes Feedstock Energy) ..... 32 Table A3-1. Calculated PM Energy Consumption for AHSS Manufacturing: Application Areas Considered .. 33 Table A3-2. Details of PM Technologies Considered ........................................................................................ 34 Table A3-3. Example Steel and AHSS R&D Technologies Considered for PM Energy Intensity Analysis ..... 38

Introduction 1
1. Introduction
1.1. Overview
The U.S. Department of Energy (DOE)’s Advanced Manufacturing Office (AMO) has commissioned a series
of bandwidth studies to analyze processes and products that are highly energy intensive, and provide
hypothetical, technology-based estimates of energy savings opportunities. Reducing energy consumption
through investment in advanced technologies and practices can enhance American manufacturing
competitiveness. Manufacturing energy bandwidth studies serve as general data references to help understand
the range (or bandwidth) of energy savings opportunities. DOE AMO commissioned this bandwidth study to
analyze the most energy consuming processes in manufacturing advanced high strength steels (AHSS).
This study is one in a series of six bandwidth studies characterizing energy use in manufacturing lightweight
structural materials in the United States. The other materials, studied in parallel, include: aluminum alloys,
magnesium alloys, titanium alloys, carbon fiber reinforced composites, and glass fiber reinforced composites.
Separate studies are available for these materials. As a follow-up to this work, an integrating analysis will be
conducted to compare the results across all six studies.
Similar energy bandwidth studies have also been prepared for four U.S. manufacturing sectors – chemicals
(DOE 2015a), iron and steel (DOE 2015b), petroleum refining (DOE 2015c), and pulp and paper (DOE
2015d). These studies follow the same analysis methodology and presentation format as the seven lightweight
structural material energy bandwidth studies.
1.2. Definitions of Energy Consumption Bands and Opportunity Bandwidths
The consistent methodology used in the bandwidth
studies provides a framework to evaluate and
compare energy savings potentials within and across
manufacturing sectors at the macro-scale.
As shown in the figure on the right, four different
energy bands (or measures) are used consistently in
this series to describe different levels of on-site
energy consumption to manufacture specific products
and to compare energy savings opportunities in U.S.
manufacturing facilities. Current typical (CT) is the
energy consumption in 2010; state of the art (SOA)
is the energy consumption that may be possible
through the adoption of existing best technologies
and practices available worldwide; practical
minimum (PM) is the energy consumption that may
be possible if applied R&D technologies under
development worldwide are deployed; and the
thermodynamic minimum (TM) is the least amount
of energy required under ideal conditions, which
typically cannot be attained in commercial
applications.
CT energy consumption serves as the benchmark of
manufacturing energy consumption. TM energy
consumption serves as the baseline (or theoretical minimum) that is used in calculating energy savings
potential. Feedstock energy (the nonfuel use of fossil energy) is not included in the energy consumption
estimates.
Figure 1-1. Energy consumption bands and
opportunity bandwidths estimated in this study
Source: EERE

BANDWIDTH STUDY ON ENERGY USE AND POTENTIAL ENERGY SAVING OPPORTUNITIES IN U.S. ADVANCED HIGH STRENGTH
STEELS MANUFACTURING
2 Introduction
Two on-site energy savings opportunity bandwidths are estimated: the current opportunity spans the
bandwidth from CT energy consumption to SOA energy consumption, and the R&D opportunity spans the
bandwidth from SOA energy consumption to PM energy consumption. The difference between PM energy
consumption and TM energy consumption is labeled as impractical. The term impractical is used because the
PM energy consumption is based on today’s knowledge of R&D technologies tested between laboratory and
demonstration scale; further decreases in energy intensity have not been displayed at any physical scale.
However, decreasing the PM energy consumption with future R&D efforts and emerging technologies being
investigated through modeling and theoretical calculations may eventually bring the PM energy consumption
closer to the TM energy consumption. Significant investment in technology development and implementation
would be needed to fully realize the energy savings opportunities estimated. The costs associated with
achieving SOA and PM energy consumption are not considered in this report; a techno-economic analysis of
the costs and benefits of future technologies was not in the scope of this study.
1.3. Bandwidth Analysis Method
This Section describes the method used in this bandwidth study to estimate the four bands of energy
consumption and the two corresponding energy savings opportunity bandwidths. This section can also be used
as a guide to understanding the structure and content of this report.
In this study, U.S. energy consumption is labeled as either “on-site energy” or “primary energy” and defined as
follows:
On-site energy (sometimes referred to as site or end use energy) is the energy consumed within the
manufacturing plant boundary (i.e., within the plant gates). Non-fuel feedstock energy is not included
in the on-site energy consumption values presented in this study.
Primary energy (sometimes referred to as source energy) includes energy that is consumed both off
site and on site during the manufacturing process. Off-site energy consumption includes generation
and transmission losses associated with bringing electricity and steam to the plant boundary. Non-fuel
feedstock energy is not included in the primary energy values. Primary energy is frequently referenced
by governmental organizations when comparing energy consumption across sectors.
The four bands of energy consumption described above are quantified for process subareas and for the material
total. The bands of energy consumption and the opportunity bandwidths presented herein consider on-
site energy consumption; feedstocks6F6
7 are excluded. To determine the total annual on-site CT, SOA, PM, and
TM energy consumption (TBtu per year), energy intensity values per unit weight (Btu per pound of material
manufactured) were estimated and multiplied by the production (pounds per year of material manufactured).
The year 2010 was used as a base year since it is the most recent year for which consistent energy consumption
and production data were available for all six lightweight materials analyzed in this series of bandwidth
studies. Unless otherwise noted, 2010 production data were used. Some production processes are exothermic
and are net producers of energy; the net energy was considered in the analysis.
Chapter 2 presents the U.S. production (million tons per year) in 2010, including an overview of major
application areas. Four structural application areas are included with the scope of this bandwidth report. The
production volumes for these application areas were estimated from market data.
Chapter 3 presents the calculated on-site CT energy intensity (MMBtu per ton and GJ per tonne) and CT
energy consumption (TBtu per year) for the process subareas studied and material total (along with sources).
Chapter 4 presents the estimated on-site SOA energy intensity (MMBtu per ton and GJ per tonne) and SOA
energy consumption (TBtu per year) for the process subareas studied and material total (along with sources).
7 Feedstock energy is the nonfuel use of combustible energy. Feedstocks are converted to iron and steel products (not used as a
fuel); MECS values reported as “feedstocks” exclude feedstocks converted to other energy products.

Introduction 3
Chapter 5 presents the estimated on-site PM energy intensity (MMBtu per ton and GJ per tonne) and PM
energy consumption for the process subareas studied and material total (along with sources).
Chapter 6 presents the estimated on-site TM energy intensity (MMBtu per ton and GJ per tonne) and TM
energy consumption for the process subareas studied and material total (along with sources).
Chapter 7 provides a summary of current and R&D opportunity analysis based on bandwidth study results.
1.4. Boundaries of the AHSS Bandwidth Study
The U.S. manufacturing sector is the physical boundary of study. It is recognized that the major benefits of
lightweight materials often occur outside of the manufacturing sector—for example, the energy benefits of a
lightweight automobile component are typically realized primarily through fuel savings during the vehicle’s
use phase. Economic impacts may also be important: an advanced lightweight aerospace component may be
more expensive than the conventional choice. While such impacts are recognized as important, they will not be
quantified as this is not a life cycle assessment study. Instead, this report focuses exclusively on the energy use
directly involved in the production of AHSS from the relevant input materials. The focus of this bandwidth
study is thus the on-site use of process energy (including purchased energy and on-site generated steam and
electricity) that is directly applied to AHSS manufacturing at a production facility.
This study does not consider life cycle energy consumed during raw material extraction, off-site treatment,
transportation of materials, product use, or disposal. For consistency with previous bandwidth studies,
feedstock energy and the energy associated with delivering feedstocks to the plant gate (e.g., producing,
conditioning, and transporting feedstocks) are excluded from the energy consumption bands in this analysis.
Steel is used in many diverse applications that differ substantially in product use, performance requirements,
and relevance to energy use. AHSS is widely used in transportation applications, where mass reductions can
provide substantial energy savings through improved fuel economy. These applications are of high relevance
to the DOE because of the potential life cycle energy savings. Other applications, such as in medical,
electronics and communications, computers and electrical equipment, construction and infrastructure, and
consumer goods and packaging, may be less relevant to DOE. In order to focus exclusively on structural
applications with strong relevance to energy use, this study was limited to four key application areas:
1) Automotive lightweighting (e.g., vehicle chassis, body, doors)
2) Compressed gas storage (e.g., hydrogen fuel tanks for electric vehicles)
3) Wind turbines (e.g., lighter and longer turbine blades)
4) Aerospace (e.g., aircraft fairings, fuselages, floor panels).
The first three of these application areas are consistent with the areas of interest outlined in the DOE
Composite Materials and Structures Funding Opportunity Announcement (DOE 2014). The last application
area (aerospace) is an additional high value-add market for lightweight structural materials. Based on the
production numbers available, it was assumed that approximately 100% of overall AHSS production in the
United States is for use in automotive lightweighting, as shown in Figure 1-2 (see Section 2.2 for more detail).

BANDWIDTH STUDY ON ENERGY USE AND POTENTIAL ENERGY SAVING OPPORTUNITIES IN U.S. ADVANCED HIGH STRENGTH
STEELS MANUFACTURING
4 Introduction
Figure 1-2. Estimated makeup of the AHSS market in 2010.
Data source: Abraham 2015, AISI 2015, Demeri 2013, and Marcus 2014

Advanced High Strength Steel Production 5
2. Advanced High Strength Steel Production
Steel is a vital domestic manufacturing product and is important for many applications including construction
(residential, commercial, transportation), automotive, machinery and equipment, containers, and national
security, among others. Steel is widely used in vehicles, making up over half of the composition of vehicles
today (WSA 2014). Advanced high strength steel (AHSS), while also used in vehicles today, offers weight
reduction possibilities of 25-39% compared to conventional steel, helping to reduce the lifecycle energy use
and emissions of vehicles even further (WSA 2014). This is why steelmakers are interested in producing
higher quantities and new grades of AHSS for the growing vehicle market.
2.1. Manufacturing Overview
Iron and steel operations are complex and large facilities that produce significant quantities of steel each year.
Steel mills in the United States are generally either integrated mills, or mini mills; the primary difference being
the proportion of recycled steel that is used (up to 99% in mini mills and was 91% in 2010 for all steel (USGS
2012c)). This proportion must be lower for grades of AHSS, which require less contaminants in order to gain
the resulting desired properties. There is little information on the properties of steel recycled in 2010, making it
difficult to determine what amounts and types of tramp elements and alloying elements are present during the
BOF and EAF steelmaking processes. Additionally, elements may be considered as tramp elements in one case
or an alloying element in another case, depending upon the grade of steel being produced (Worrell & Reuter
2014). There is no commercial refining process for tramp elements available today, and it is also possible for
these elements to enter the system through ore or reductants used (in addition to the steel scrap) (Worrell &
Reuter 2014). To compensate for the existence of tramp elements, producers of high quality grades of steel
such as AHSS must depend on a source of well sourced scrap, obsolete scrap, or the use of ore-based iron units
(such as direct reduced iron or hot briquetted iron) as input to the EAF in lieu of a portion of the scrap (Worrell
& Reuter 2014).
The distribution of many of the integrated and mini mills in the United States is shown in Figure 2-1.
Integrated steel mills produce steel from iron ore via the blast furnace (BF) and basic oxygen furnace (BOF)
steelmaking technology while mini steels mills produce steel mostly from recycled scrap steel via the electric
arc furnace (EAF) steelmaking technology. Figure 2-1 shows the steel industry process flowlines for integrated
mills and for mini mills.
In 2010, there were about 15 BF/BOF steelmaking facilities operated by five companies and 112 EAF
steelmaking facilities operated by over 50 companies in the United States (USGS 2012a). Most of these
steelmaking facilities in the United States are concentrated in Indiana, Ohio, Pennsylvania, Michigan, and
Illinois due to the close proximity to coal and iron ore suppliers, among other factors. In 2010, all iron and
steel manufacturing directly employed 135,000 workers and total employment (including both direct and
indirect employees in other industries) was estimated at 1,080,000 (AISI 2013a). It is unclear which of these
facilities produce AHSS grades in addition to carbon, stainless, and other types of steels, as well as the relative
amounts.

BANDWIDTH STUDY ON ENERGY USE AND POTENTIAL ENERGY SAVING OPPORTUNITIES IN U.S. ADVANCED HIGH STRENGTH
STEELS MANUFACTURING
6 Advanced High Strength Steel Production
Figure 2-1. Steelmaking flowlines for integrated (top) and mini mills (bottom)
Source: AISI 2013b

Advanced High Strength Steel Production 7
This study focuses on energy consumption in six energy intensive process areas in steel manufacturing. These
process areas are identified in Table 2-1, along with some of the major sub-processes. Energy intensity and
consumption is evaluated by subarea and sub-processes for CT, SOA, PM, and TM in Sections 3 through 6 of
this report. Current energy intensity for pelletizing iron ore is shown for reference purpose only because this
sub-process is outside the boundary of bandwidth analysis. Direct reduction ironmaking was not used in the
United States in 2010, and therefore not included in the CT, SOA, PM, and TM bandwidth measures and
savings summary.
Table 2-1. Advanced High Strength Steel Manufacturing Process
Areas Considered in Bandwidth Analysis
Subareas Sub-Processes
Agglomeration Sintering
Cokemaking
Ironmaking Blast Furnace
Basic Oxygen Furnace (BOF)
Steelmaking
Electric Arc Furnace (EAF)
Steelmaking
Casting/Rolling
Continuous Casting
Hot Rolling
Cold Rolling
There are two main processes for producing steel: integrated steelmaking, which combines a blast furnace (BF)
with a basic oxygen furnace (BOF), and electric arc furnace (EAF) steelmaking. These two processes are
distinctly different as the integrated BOF process consumes mostly agglomerated iron ore along with some
scrap steel (up to 30%; was 24% in 2010 for all steel (USGS 2012c)) while the EAF process consumes mostly
scrap steel as well as reduced iron, cast iron, and other iron containing materials to produce raw steel (WCA
2013). Steel grades such as AHSS require specific compositions, meaning that there is less of a possibility of
using an increased amount of recycled steel to produce AHSS.
It requires significantly more energy to produce a ton of steel from ore in a blast furnace and BOF (including
the energy for cokemaking, pelletizing, and sintering), compared to remelting scrap in an electric arc furnace
(not including losses for generating and transmitting electricity) (IPPC 2013; LBNL 2008). However, many
other factors come in to play in the economics of ore-based versus scrap-based steelmaking. For
agglomeration, pelletizing was not included in the production or energy intensity numbers because this process
occurs outside of the boundary of this bandwidth analysis (pelletizing is usually conducted near the ore mining
site, and not at the steel mill).
2.2. Production Values
Production data for total AHSS produced in the United States (or worldwide) is generally not available or
collected as a whole. However, sector-side iron and steel manufacturing production data is available by process
and sector-wide. The American Iron and Steel Institute (AISI) is the leading source for information on total
steel production in North America. The AISI Statistical Summary is released annually and provides production
data along with other statistical information. Total iron and steel sector production data for 2010 is summarized
in Table 2-2. The amount of AHSS that is cast and rolled, 1.307 million tons (1.186 million tonnes) as shown
in Table 2-2, was estimated based on the amount of AHSS that it shipped to automakers in North America.
Based on expert communications and sources, it was assumed that U.S. steel was shipped to about U.S.
automakers and half of the remaining North American automotive industry; the total was calculated using the
reference value of 156 lb of AHSS per vehicle which was also adjusted for processing losses (Abraham 2015, AISI 2015, Demeri 2013, and Marcus 2014). Based on figures provided by AISI 2015, it is assumed that all of
the AHSS produced in 2010 for the North American automotive market is cold rolled.
BANDWIDTH STUDY ON ENERGY USE AND POTENTIAL ENERGY SAVING OPPORTUNITIES IN U.S. ADVANCED HIGH STRENGTH
STEELS MANUFACTURING
8 Advanced High Strength Steel Production
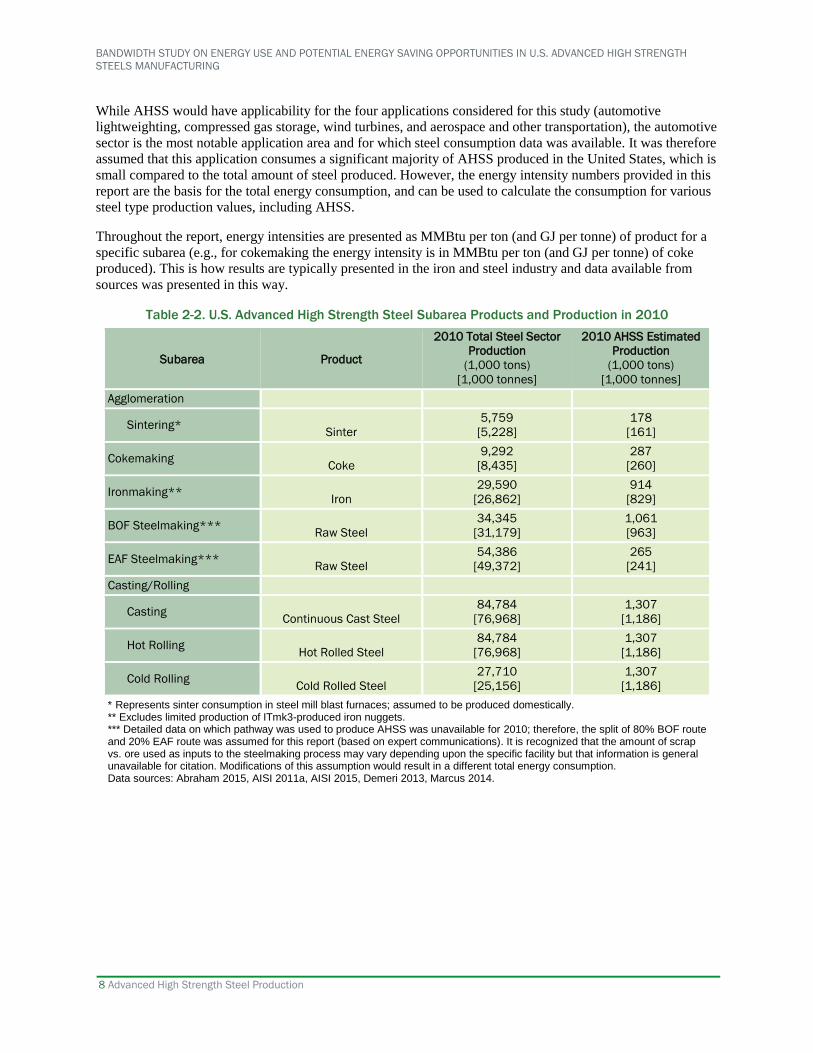
While AHSS would have applicability for the four applications considered for this study (automotive
lightweighting, compressed gas storage, wind turbines, and aerospace and other transportation), the automotive
sector is the most notable application area and for which steel consumption data was available. It was therefore
assumed that this application consumes a significant majority of AHSS produced in the United States, which is
small compared to the total amount of steel produced. However, the energy intensity numbers provided in this
report are the basis for the total energy consumption, and can be used to calculate the consumption for various
steel type production values, including AHSS.
Throughout the report, energy intensities are presented as MMBtu per ton (and GJ per tonne) of product for a
specific subarea (e.g., for cokemaking the energy intensity is in MMBtu per ton (and GJ per tonne) of coke
produced). This is how results are typically presented in the iron and steel industry and data available from
sources was presented in this way.
Table 2-2. U.S. Advanced High Strength Steel Subarea Products and Production in 2010
Subarea Product
2010 Total Steel Sector
Production
(1,000 tons)
[1,000 tonnes]
2010 AHSS Estimated
Production
(1,000 tons)
[1,000 tonnes]
Agglomeration
Sintering* Sinter
5,759
[5,228]
178
[161]
Cokemaking Coke
9,292
[8,435]
287
[260]
Ironmaking** Iron
29,590
[26,862]
914
[829]
BOF Steelmaking*** Raw Steel
34,345
[31,179]
1,061
[963]
EAF Steelmaking*** Raw Steel
54,386
[49,372]
265
[241]
Casting/Rolling
Casting Continuous Cast Steel
84,784
[76,968]
1,307
[1,186]
Hot Rolling Hot Rolled Steel
84,784
[76,968]
1,307
[1,186]
Cold Rolling Cold Rolled Steel
27,710
[25,156]
1,307
[1,186]
* Represents sinter consumption in steel mill blast furnaces; assumed to be produced domestically.** Excludes limited production of ITmk3-produced iron nuggets.*** Detailed data on which pathway was used to produce AHSS was unavailable for 2010; therefore, the split of 80% BOF routeand 20% EAF route was assumed for this report (based on expert communications). It is recognized that the amount of scrapvs. ore used as inputs to the steelmaking process may vary depending upon the specific facility but that information is generalunavailable for citation. Modifications of this assumption would result in a different total energy consumption.Data sources: Abraham 2015, AISI 2011a, AISI 2015, Demeri 2013, Marcus 2014.

Current Typical Energy Intensity and Energy Consumption 9
3. Current Typical Energy Intensity and Energy
Consumption
This chapter presents the energy consumption data for individual advanced high strength steel manufacturing
subareas in 2010 for the boundary application areas production. Energy consumption in a manufacturing
process can vary for diverse reasons. The energy intensity estimates reported herein are representative of
average U.S. advanced high strength steel manufacturing; they do not represent energy consumption in any
specific facility or any particular region in the United States.
3.1. Sources for Current Typical Energy Intensity
Appendix A1 presents the CT energy intensities and energy consumption for the subareas studied. Table 3-1
presents a summary of the main references consulted to identify CT energy intensity by subarea. Appendix A2
provides the references used for each subarea.
Because the steel sector is diverse, covering many products, a range of data sources were considered (see Table
3-1). In most cases, multiple references were considered for each process. Each iron and steel manufacturing
facility is unique and steel is produced in different scales and by different processes; thus, it is difficult to
ascertain an exact amount of energy necessary to produce a certain volume of a product. Plant size can also
impact operating practices and energy efficiency. Higher efficiency is often easier to achieve in larger plants.
Consequently, the values for energy intensity provided should be regarded as estimates based on the best
available information.
Table 3-1. Main Sources Referenced in Identifying Current Typical Intensity by Subarea and
Material Total
Source Abbreviation Description
AISI 2011a Summary for steel industry statistics, published by the American Iron and Steel
Institute. The report for year 2010 is referenced.
EIA 2013a
Manufacturing Energy Consumption Survey data released by EIA every four
years; this data comes from a survey that is taken by U.S. manufacturers. The
most recent year for which MECS data is published is 2010. The data is scaled
up to cover the entirety of U.S. manufacturing and for individual manufacturing
subsectors.
EIA 2013b Includes documentation for the model EIA utilizes to project industrial energy
use.
Energetics 2000
The Energy and Environmental Profile of the U.S. Iron and Steel Industry,
prepared by Energetics and published by DOE in 2000 provides a detailed
breakdown (including total processing energy) for key process areas.
EPA 2012 This 2012 report by the Environmental Protection Agency (EPA) provides a list of
energy efficiency improvement measures for use by the iron and steel industry.
IEA 2007 This 2007 report by the International Energy Agency (IEA) includes a chapter
focused on iron and steel.
IPPC 2013
While this bandwidth analysis focuses on the United States; specific European
energy consumption values or ranges are listed for select processes in this
report.
NRC 2007 Provides graphics showing actual consumption at multiple Canadian plants; also
addresses best available technologies.
Stubbles 2000 This report details energy consumption in the U.S. steel industry for various
processes.

BANDWIDTH STUDY ON ENERGY USE AND POTENTIAL ENERGY SAVING OPPORTUNITIES IN U.S. ADVANCED HIGH STRENGTH
STEELS MANUFACTURING
10 Current Typical Energy Intensity and Energy Consumption
3.2. Current Typical Energy Intensity and Energy Consumption
Table 3-2 presents the energy intensities and calculated on site and primary CT energy consumption for the
AHSS production subareas studied. Feedstock energy is excluded from the consumption values. The energy
intensities are presented in terms of MMBtu per ton (or GJ per tonne) of subarea product (listed in parenthesis
in the first column). The CT energy consumption for these subareas is estimated to account for 22.7 TBtu of
on-site energy and 27.6 TBtu of primary energy in 2010.
Primary energy is calculated from on-site CT energy consumption data based on an analysis of MECS data (DOE
2014), with scaling to include off-site electricity and steam generation and transmission losses (DOE 2014). To
determine primary energy, the net electricity and net steam portions of sector-wide on-site energy are scaled to
account for off-site generation and transmission losses and added to on-site energy (see the footnote in Table
3-2 for details on the scaling method).
Table 3-2. On-site CT Energy Intensity and Calculated Energy Consumption and Calculated Primary CT
Energy Consumption for U.S. AHSS Manufacturing: Application Areas Studied (2010)
Subarea
(product)
On-site CT
Energy
Intensity
(MMBtu/ton
product)
[GJ/tonne
product]
Production
(1,000 tons)
[1,000 tonnes]
On-site CT
Energy
Consumption,
Calculated
(TBtu/year)
Off-site Losses,
Calculated*
(TBtu/year)
Primary CT
Energy
Consumption,
Calculated
(TBtu/year)
Agglomeration
(sinter)
1.32
[1.54]
178
[161] 0.23 0.03 0.27
Cokemaking
(coke)
3.83
[4.45]
287
[260] 1.10 0.06 1.16
BF Ironmaking
(iron)
11.72
[13.63]
914
[829] 11.02 0.12 11.13
BOF Steelmaking
(raw steel)
0.58
[0.67]
1,061
[963] 0.61 0.24 0.85
EAF Steelmaking
(raw steel)
1.96
[2.28]
265
[241] 0.52 0.92 1.44
Casting/Rolling
(cast/rolled steel)
Casting 0.19
[0.22]
1,307
[1,186] 0.25 0.18 0.43
Hot Rolling 2.99
[3.48]
1,307
[1,186] 3.91 1. 06 5.14
Cold Rolling 3.48
[4.05]
1,307
[1,186] 5.02 2.29 7.30
Total for Process
Subareas Studied 22.65 4.9 27.55
Current typical (CT)
* Accounts for off-site electricity and steam generation and transmission losses. Off-site electrical losses are based on published
grid efficiency. EIA Monthly Energy Review, Table 2.4, lists electrical system losses relative to electrical retail sales. The energy
value of electricity from off-site sources including generation and transmission losses is determined to be 10,553 Btu/kWh. Off-site
steam generation losses are estimated to be 20% (Swagelok Energy Advisors, Inc. 2011. Steam Systems Best Practices) and off-
site steam transmission losses are estimated to be 10% (DOE 2007, Technical Guidelines Voluntary Reporting of Greenhouse
Gases and EPA 2011, ENERGY STAR Performance Ratings Methodology).
** CT energy consumption values for blast furnace and cold rolling each exclude a portion of nonfuel feedstock natural gas (based
on DOE 2014).
State of the Art Energy Intensity and Energy Consumption 11
4. State of the Art Energy Intensity and Energy
Consumption
As plants age, manufacturing processes and equipment are updated and replaced by newer, more energy-
efficient technologies. This results in a range of energy intensities among U.S. iron and steel mills. Iron and
steel mills will vary widely in size, age, efficiency, energy consumption, and types and amounts of products.
Modern iron and steel mills can benefit from more energy-efficient technologies and practices.
This chapter estimates the energy savings possible if U.S. AHSS producers adopt the best technologies and
practices available worldwide. State of the art (SOA) energy consumption is the minimum amount of energy
that could be used in a specific process using existing technologies and practices.
4.1. Sources for State of the Art Energy Intensity
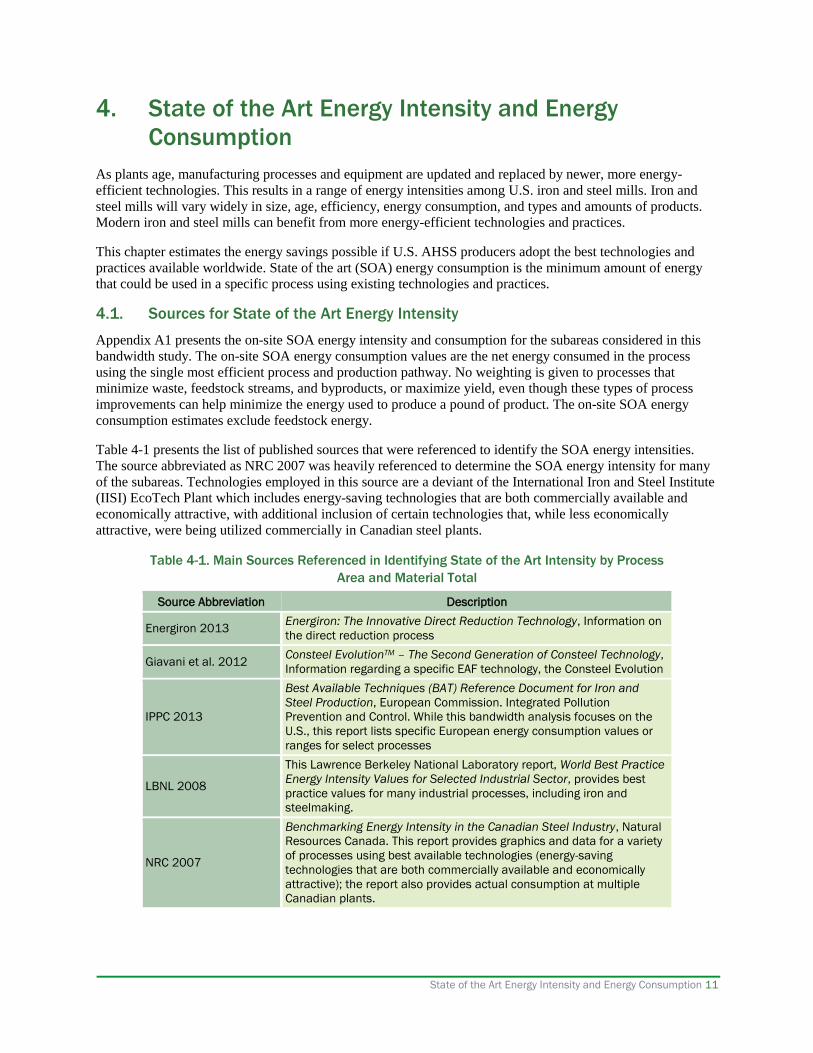
Appendix A1 presents the on-site SOA energy intensity and consumption for the subareas considered in this
bandwidth study. The on-site SOA energy consumption values are the net energy consumed in the process
using the single most efficient process and production pathway. No weighting is given to processes that
minimize waste, feedstock streams, and byproducts, or maximize yield, even though these types of process
improvements can help minimize the energy used to produce a pound of product. The on-site SOA energy
consumption estimates exclude feedstock energy.
Table 4-1 presents the list of published sources that were referenced to identify the SOA energy intensities.
The source abbreviated as NRC 2007 was heavily referenced to determine the SOA energy intensity for many
of the subareas. Technologies employed in this source are a deviant of the International Iron and Steel Institute
(IISI) EcoTech Plant which includes energy-saving technologies that are both commercially available and
economically attractive, with additional inclusion of certain technologies that, while less economically
attractive, were being utilized commercially in Canadian steel plants.
Table 4-1. Main Sources Referenced in Identifying State of the Art Intensity by Process
Area and Material Total
Source Abbreviation Description
Energiron 2013 Energiron: The Innovative Direct Reduction Technology, Information on
the direct reduction process
Giavani et al. 2012 Consteel EvolutionTM – The Second Generation of Consteel Technology,
Information regarding a specific EAF technology, the Consteel Evolution
IPPC 2013
Best Available Techniques (BAT) Reference Document for Iron and
Steel Production, European Commission. Integrated Pollution
Prevention and Control. While this bandwidth analysis focuses on the
U.S., this report lists specific European energy consumption values or
ranges for select processes
LBNL 2008
This Lawrence Berkeley National Laboratory report, World Best Practice
Energy Intensity Values for Selected Industrial Sector, provides best
practice values for many industrial processes, including iron and
steelmaking.
NRC 2007
Benchmarking Energy Intensity in the Canadian Steel Industry, Natural
Resources Canada. This report provides graphics and data for a variety
of processes using best available technologies (energy-saving
technologies that are both commercially available and economically
attractive); the report also provides actual consumption at multiple
Canadian plants.

BANDWIDTH STUDY ON ENERGY USE AND POTENTIAL ENERGY SAVING OPPORTUNITIES IN U.S. ADVANCED HIGH STRENGTH
STEELS MANUFACTURING
12 State of the Art Energy Intensity and Energy Consumption
4.2. State of the Art Energy Intensity and Energy Consumption
Table 4-2 presents the on-site SOA energy intensities and energy consumption for the AHSS manufacturing
subareas studied. The SOA energy intensities are presented as MMBtu per ton and GJ per tonne subarea
product and the on-site SOA energy consumption is presented as TBtu per year.
Table 4-2. SOA Energy Intensities and Calculated SOA Energy Consumption
for AHSS Manufacturing: Application Areas Studied
Subarea
(product)
On-site SOA Energy
Intensity
(MMBtu/ton product)
[GJ/tonne product]
On-site SOA Energy
Consumption,
Calculated
(TBtu/year)
Agglomeration
(sinter)
1.27
[1.47] 0.23
Cokemaking
(coke)
3.37
[3.92] 0.97
BF Ironmaking
(iron)
11.13
[12.94] 10.17
BOF Steelmaking
(raw steel)
-0.30
[-0.35] -0.32
EAF Steelmaking
(raw steel)
1.85
[2.16] 0.49
Casting/Rolling
(cast/rolled steel)
Casting
0.05
[0.06] 0.07
Hot Rolling
1.37
[1.59] 1.78
Cold Rolling
1.42
[1.65] 1.85
Total for Process Subareas
Studied 15.24
State of the Art (SOA)
Table 4-3 presents a comparison of the on-site CT energy consumption and SOA energy consumption for each
subarea and as a total. This is presented as the SOA energy savings (or current opportunity) and SOA energy
savings percent. It is useful to consider both TBtu energy savings and energy savings percent when comparing
the energy savings opportunity. Both are good measures of opportunity; however, the conclusions are not
always the same. Among the processes studied, the greatest current opportunity in terms of percent energy
savings is BOF steelmaking at 72% energy savings; the greatest current opportunity in terms of TBtu savings
is cold rolling at 3.2 TBtu per year savings.
If U.S AHSS manufacturing (for the 2010 production level of AHSS for application areas considered) were
able to attain on-site SOA energy intensities, it is estimated that 7.4 TBtu per year of energy could be saved
from the subareas alone, corresponding to a 52% energy savings overall (see formula below). This energy
savings estimate is based on adopting available SOA technologies and practices without accounting for future
gains in energy efficiency from R&D. This is a simple estimate for potential savings; it is not inferred that all
existing mills could achieve these state of the art values or that the improvements would prove to be cost
effective in all cases.

State of the Art Energy Intensity and Energy Consumption 13
Table 4-3. Calculated SOA Energy Consumption for AHSS Manufacturing: Application Areas Studied
Subarea
(product)
On-site CT Energy
Consumption,
Calculated
(TBtu/year)
On-site SOA
Energy
Consumption,
Calculated
(TBtu/year)
SOA Energy
Savings*
(CT-SOA)
(TBtu/year)
SOA Energy Savings
Percent**
(CT-SOA)/
(CT-TM)
Agglomeration
(sinter) 0.23 0.23 <0.1 19%
Cokemaking
(coke) 1.10 0.97 0.13 22%
BF Ironmaking
(iron) 11.02 10.17 0.85 26%
BOF Steelmaking
(raw steel) 0.61 -0.32 0.93 72%
EAF Steelmaking
(raw steel) 0.52 0.49 0.03 15%
Casting/Rolling
(cast/rolled steel) 9.17 3.71 5.46 63%
Casting 0.25 0.07 0.17 71%
Hot Rolling 3.91 1.78 2.12 60%
Cold Rolling 5.02 1.85 3.17 64%
Total for Process Subareas
Studied 22.65 15.24 7.41 52%
Current Typical (CT), State of the Art (SOA), Thermodynamic Minimum (TM) * SOA energy savings is also called Current Opportunity.** SOA energy savings percent is the SOA energy savings opportunity from transforming AHSS production processes. Energysavings percent is calculated using TM energy consumption shown in Table 6-1 as the minimum energy consumption. The energysavings percent, with TM as the minimum, is calculated as follows: (CT-SOA)/(CT-TM)
The SOA energy savings percent is the percent of energy saved with SOA energy consumption compared to
CT energy consumption, while referencing the thermodynamic minimum as the baseline energy consumption.
Thermodynamic minimum (TM), discussed further in Chapter 6, is considered to be equal to zero in an ideal
case with perfect efficiency (i.e., energy input to a system is considered fully recoverable with no friction
losses or change in surface energy). For manufacturing processes where there is an irreversible change to the
material, resulting in a change to the embodied free energy content of the material (i.e., chemical reaction or
permanent crystalline change due to deformation), TM is not necessarily equal to zero; in some cases the
change in theoretical free energy content of the material requires energy input (TM > 0) and in other cases the
change creates a theoretical free energy gain (TM < 0). Referencing TM as the baseline in comparing
bandwidths of energy consumption and calculating energy savings percent provides the most accurate measure
of absolute savings potential. The equation for calculating on-site SOA energy savings percent is:
𝑆𝑂𝐴 𝑆𝑎𝑣𝑖𝑛𝑔𝑠 % = 𝑐𝑢𝑟𝑟𝑒𝑛𝑡 𝑜𝑝𝑝𝑜𝑟𝑡𝑢𝑛𝑖𝑡𝑦 % = 𝐶𝑇 − 𝑆𝑂𝐴
𝐶𝑇 − 𝑇𝑀

BANDWIDTH STUDY ON ENERGY USE AND POTENTIAL ENERGY SAVING OPPORTUNITIES IN U.S. ADVANCED HIGH STRENGTH
STEELS MANUFACTURING
14 Practical Minimum Energy Intensity and Energy Consumption
5. Practical Minimum Energy Intensity and Energy
Consumption
Technology innovation is the driving force for economic growth. Across the globe, R&D is underway that can
be used to make steel in new ways and improve energy and feedstock efficiency. Commercialization of these
improvements will drive the competitiveness of U.S. AHSS manufacturing. In this chapter, the R&D energy
savings made possible through R&D advancements in AHSS manufacturing are estimated. Practical minimum
(PM) is the minimum amount of energy required assuming the deployment of applied R&D technologies under
development worldwide.
5.1. Sources for Practical Minimum Energy Intensity
In this study, PM energy intensity is the estimated minimum amount of energy consumed in a specific AHSS
production process assuming that the most advanced technologies under research or development around the
globe are deployed.
R&D progress is difficult to predict and potential gains in energy efficiency can depend on financial
investments and market priorities. To estimate PM energy consumption for this bandwidth analysis, a search of
R&D activities in the steel industry was conducted. The focus of this study’s search was applied research,
which was defined as investigating new technology with the intent of accomplishing a particular objective.
Basic research, the search for unknown facts and principles without regard to commercial objectives, was not
considered. Many of the technologies identified were disqualified from consideration due a lack of data from
which to draw energy savings conclusions. Appendix A3 provides an example of the range of technologies
considered for evaluation, and explains the calculation methodology.
Table 5-1 presents the key sources consulted to identify PM energy intensities in AHSS manufacturing.
Table 5-1. Sources Referenced in Identifying Practical Minimum Intensity by Process Area and Material
Total
Source Abbreviation Description
Birat et al. 2009 The “CO2 Tool”: CO2 emissions & energy consumption of existing & breakthrough
steelmaking routes.
Birat et al. 1999 CO2 Emissions and the Steel Industry’s Available Responses to the Greenhouse Effect.
Energetics 2005 Steel Industry Marginal Opportunity Study.
Gordon et al. 2010 Ironmaking Technology Selection for Site Specific Conditions.
LBNL 2013 Emerging Energy-efficiency and Carbon Dioxide Emissions-reduction Technologies for the
Iron and Steel Industry.
Sadoway 2008 Electrochemical Pathways Towards Carbon-free Metals Production.
UNIDO 2010 Global Technology Roadmap for CCS in Industry: Steel Sectoral Report.
Numerous fact sheets, case studies, reports, and other sources were referenced.
5.2. Practical Minimum Energy Intensity and Energy Consumption
Table 5-2 presents the on-site PM energy intensities and energy consumption for the AHSS manufacturing
subareas studied. The PM energy intensities are presented as MMBtu per ton and GJ per tonne subarea product
and the on-site PM energy consumption is presented as TBtu per year.

Practical Minimum Energy Intensity and Energy Consumption 15
Table 5-2. Calculated PM Energy Consumption for AHSS Manufacturing: Application
Areas Studied
Subarea
(product)
On-site PM Energy
Intensity
(MMBtu/ton product)
[GJ/tonne product]
On-site PM Energy
Consumption, Calculated
(TBtu/year)
Agglomeration
(sinter)
1.11
[1.29] 0.20
Cokemaking
(coke)
1.92
[2.23] 0.55
BF Ironmaking
(iron)
8.92
[10.38] 8.15
BOF Steelmaking
(raw steel)
-0.37
[-0.43] -0.39
EAF Steelmaking
(raw steel)
1.74
[2.02] 0.46
Casting/Rolling
(cast/rolled steel)
Casting
0.04
[0.05] 0.06
Hot Rolling
1.16
[1.35] 1.52
Cold Rolling
1.16
[1.35] 1.51
Total for Process Subareas
Studied 12.06
Practical Minimum (PM)
Table 5-3 presents a comparison of the on-site CT energy consumption and PM energy consumption for each
subarea and as a total. This is presented as the PM energy savings (the difference between CT energy
consumption and PM energy consumption) and PM energy savings percent. PM energy savings is equivalent
to the sum of current and R&D opportunity energy savings. Table 5-4 calculates the R&D opportunity for the
process subareas studied.
It is useful to consider both TBtu energy savings and energy savings percent when comparing the energy
savings opportunity. Both are good measures of opportunity; however, the conclusions are not always the
same. Among the processes studied, the greatest current plus R&D opportunity in terms of percent energy
savings is cokemaking at 90% energy savings; the greatest current plus R&D opportunity in terms of TBtu
savings is cold rolling at 3.5 TBtu per year savings.
If U.S. AHSS manufacturing (for the 2010 production level of AHSS for application areas considered) were
able to attain on-site PM energy intensities, it is estimated that 10.6 TBtu per year of energy could be saved
from the subareas alone, corresponding to a 75% energy savings overall. This energy savings estimate is based
on adopting available PM technologies and practices. This is a simple estimate for potential savings, it is not
inferred that all existing mills could achieve these PM energy intensity values or that the improvements would
prove to be cost effective in all cases.

BANDWIDTH STUDY ON ENERGY USE AND POTENTIAL ENERGY SAVING OPPORTUNITIES IN U.S. ADVANCED HIGH STRENGTH
STEELS MANUFACTURING
16 Practical Minimum Energy Intensity and Energy Consumption
Table 5-3. Calculated PM Energy Consumption for AHSS Manufacturing: Application Areas Studied
Subarea
(product)
On-site CT Energy
Consumption,
Calculated
(TBtu/year)
On-site PM Energy
Consumption,
Calculated
(TBtu/year)
PM Energy
Savings*
(CT-PM)
(TBtu/year)
PM Energy Savings
Percent**
(CT-PM)/
(CT-TM)
Agglomeration
(sinter) 0.23 0.20 0.04 73%
Cokemaking
(coke) 1.10 0.55 0.55 90%
BF Ironmaking
(iron) 11.02 8.15 2.86 86%
BOF Steelmaking
(raw steel) 0.61 -0.39 1.00 77%
EAF Steelmaking
(raw steel) 0.52 0.46 0.06 31%
Casting/Rolling
(cast/rolled steel) 9.17 3.09 6.08 70%
Casting 0.25 0.06 0.19 77%
Hot Rolling 3.91 1.52 2.39 68%
Cold Rolling 5.02 1.51 3.51 71%
Total for Process Subareas
Studied 22.65 12.06 10.59 75%
Current Typical (CT), Practical Minimum (PM), Thermodynamic Minimum (TM) * PM energy savings is the Current Opportunity plus the R&D Opportunity.** PM energy savings percent is the PM energy savings opportunity from transforming AHSS production processes. Energy savingspercent is calculated using TM energy consumption shown in Table 6-1 as the minimum energy consumption. The energy savingspercent, with TM as the minimum, is calculated as follows: (CT-PM)/(CT-TM)
The PM energy savings percent is the percent of energy saved with PM energy consumption compared to CT
energy consumption, while referencing the thermodynamic minimum as the baseline energy consumption.
Thermodynamic minimum (TM), discussed further in the following section, is considered to be equal to zero
in an ideal case with perfect efficiency (i.e., energy input to a system is considered fully recoverable with no
friction losses or change in surface energy). For manufacturing processes where there is an irreversible change
to the material, resulting in a change to the embodied free energy content of the material (i.e., chemical
reaction or permanent crystalline change due to deformation), TM is not necessarily equal to zero; in some
cases the change in theoretical free energy content of the material requires energy input (TM > 0) and in other
cases the change creates a theoretical free energy gain (TM < 0). Referencing TM as the baseline in
comparing bandwidths of energy consumption and calculating energy savings percent provides the most
accurate measure of absolute savings potential. The equations for calculating on-site R&D opportunity and PM
energy savings percent are:
𝑅&𝐷 𝑂𝑝𝑝𝑜𝑟𝑡𝑢𝑛𝑖𝑡𝑦 % = 𝑆𝑂𝐴 − 𝑃𝑀
𝐶𝑇 − 𝑇𝑀
𝑃𝑀 𝑆𝑎𝑣𝑖𝑛𝑔𝑠 % = 𝐶𝑇 − 𝑃𝑀
𝐶𝑇 − 𝑇𝑀

Practical Minimum Energy Intensity and Energy Consumption 17
R&D opportunity represents the opportunities for energy savings from technologies currently an R&D stage of
development (early TRL) and are not ready for deployment to manufacturing. It represents the energy savings
opportunities that can be achieved if the R&D is put into those technologies to get them to a high enough TRL
level that they can be deployed in the manufacturing sector. Table 5-4 shows the R&D opportunity total and
percent for the evaluated process subareas studied.
Table 5-4. Calculated PM Energy Consumption, R&D Opportunity, and R&D Opportunity for AHSS
Manufacturing: Application Areas Studied
Subarea
(product)
On-site SOA Energy
Consumption,
Calculated
(TBtu/year)
On-site PM Energy
Consumption,
Calculated
(TBtu/year)
R&D Opportunity
(SOA-PM)
(TBtu/year)
R&D Opportunity
Savings Percent*
(SOA-PM)/
(CT-TM)
Total for Process Subareas Studied 15.24 12.06 3.18 22%
Current Typical (CT), State of the Art (SOA), Practical Minimum (PM), Thermodynamic Minimum (TM) * R&D opportunity energy savings percent is the R&D energy savings opportunity from transforming AHSS production processes.Energy savings percent is calculated using TM energy consumption shown in Table 6-1 as the minimum energy consumption. Theenergy savings percent, with TM as the minimum, is calculated as follows: (SOA-PM)/(CT-TM)

BANDWIDTH STUDY ON ENERGY USE AND POTENTIAL ENERGY SAVING OPPORTUNITIES IN U.S. ADVANCED HIGH STRENGTH
STEELS MANUFACTURING
18 Thermodynamic Minimum Energy Intensity and Energy Consumption
6. Thermodynamic Minimum Energy Intensity and
Energy Consumption
Real world iron and steel production does not occur under theoretically ideal conditions; however,
understanding the theoretical minimal amount of energy required to manufacture AHSS can provide a more
complete understanding of the realistic opportunities for energy savings. This baseline can be used to establish
more realistic projections (and bounds) for the future R&D energy savings that may be achieved. This chapter
presents the thermodynamic minimum (TM) energy consumption required for the subareas studied.
TM energy consumption, which is based on Gibbs free energy (ΔG) calculations, assumes ideal conditions that
are unachievable in real-world applications. TM energy consumption assumes that all energy is used
productively, that there are no energy losses, and that energy is ultimately perfectly conserved by the system
(i.e., when cooling a material to room temperature or applying work to a process, the heat or work energy is
fully recovered – perfect efficiency). It is not anticipated that any manufacturing process would ever attain this
value in practice. A reasonable long-term goal for energy efficiency would be the practical minimum (see
Chapter 5).
For manufacturing processes where there is an irreversible change to the material, resulting in a change to the
embodied free energy content of the material (i.e., chemical reaction or permanent crystalline change due to
deformation), TM is not necessary equal to zero; in some cases the change in theoretical free energy content of
the material requires energy input (TM > 0) and in other cases the change creates a theoretical free energy gain
(TM < 0).
6.1. Sources for Thermodynamic Minimum Energy Intensity
The thermodynamic minimum energy intensity was calculated for each sub-process by determining the Gibbs
free energy associated with the chemical transformations involved, under ideal conditions for a manufacturing
process.8 The TM energy intensity is negative when the chemical reaction is net-exergonic and positive when
the chemical reaction is net-endergonic.8F8F8F8F8F8F
9 Changes in surface energy were not considered in the TM analysis.
The change in entropy was calculated based on the relative change in the number of molecules, and the change
in enthalpy was calculated based on the change in bond energy.F9 F9
10
The main source for the AHSS production subarea thermodynamic minimum energy intensities are the 2000
report Theoretical Minimum Energies to Produce Steel for Selected Conditions by Fruehan et al. This report
highlights minimum values based on theoretical models and specific compositions, and is derived from earlier
work conducted by Carnegie Mellon University for the DOE. In addition to basing the TM energy intensity
values on internal calculations, the 1998 source Future Technologies for Energy-Efficient Iron and Steel
Making by de Beer, Worrell, and Blok and which discusses theoretical values was consulted.
The TM energy intensity calculation is path independent (state function), but is directly related to the relative
energy levels of the substrate reactants and the products. The reported value depends only on the starting
material and the end product, and would not change if the process had greater or fewer process steps. It is
important to note that a negative TM value does not imply that the reaction will occur without being forced by
a manufacturing process.
BOF steelmaking can at times result in net energy gain through exothermic processes. For exergonic iron and
steel manufacturing processes, a zero baseline would result in negative percent savings, a physical
impossibility.
8 Unless otherwise noted, “ideal conditions” means a pressure of 1 atmosphere and a temperature of 77°F. 9 Exergonic (reaction is favorable) and endergonic (reaction is not favorable) are thermodynamic terms for total change in Gibbs free energy (delta G). This differs from exothermic (reaction is favorable) and endothermic (reaction is not favorable) terminology that are used in describing change in enthalpy
(delta H). 10 Note that the bond energy values are averages, not specific to the molecule in question.

Thermodynamic Minimum Energy Intensity and Energy Consumption 19
In this report, TM energy consumption is referenced as the baseline (or minimum amount of energy) when
calculating the absolute energy savings potential. The equations used to determine the absolute energy savings
for current opportunity (SOA), R&D, and PM are defined below. PM savings percent is the sum of the current
opportunity percent and the R&D opportunity percent.
𝐶𝑢𝑟𝑟𝑒𝑛𝑡 𝑜𝑝𝑝𝑜𝑟𝑡𝑢𝑛𝑖𝑡𝑦 % = 𝐶𝑇 − 𝑆𝑂𝐴
𝐶𝑇 − 𝑇𝑀
𝑅&𝐷 𝑜𝑝𝑝𝑜𝑟𝑡𝑢𝑛𝑖𝑡𝑦 % = 𝑆𝑂𝐴 − 𝑃𝑀
𝐶𝑇 − 𝑇𝑀
𝑃𝑀 𝑆𝑎𝑣𝑖𝑛𝑔𝑠 % = 𝐶𝑇 − 𝑃𝑀
𝐶𝑇 − 𝑇𝑀
For processes requiring an energy intensive transformation (e.g., blast furnace ironmaking), this percent energy
savings approach results more realistic and comparable energy savings estimates. Using zero as the baseline
(or minimum amount of energy) would exaggerate the total bandwidth to which SOA energy savings and PM
energy savings are compared to determine the energy savings percent. When TM energy consumption is
referenced as the baseline, SOA energy savings and PM energy savings are relatively more comparable,
resulting in more accurate energy savings percentages.
TM energy intensity is the least amount of energy required for each of the six process areas examined in this
report: ore agglomeration, cokemaking, ironmaking, BOF steelmaking, EAF steelmaking, and casting and
rolling. The full credit of off-gas chemical and thermal energy is considered.
6.2. Thermodynamic Minimum Energy Intensity and Energy Consumption
The minimum baseline of energy consumption for an AHSS production subarea is its TM energy consumption.
If the 2010 level of AHSS production occurred at TM energy intensity, there would be 100% savings. The
percentage of energy savings is determined by calculating the decrease in energy consumption and dividing it
by the total possible savings (CT energy consumption-TM energy consumption).
Table 6-1 provides the TM energy intensities and energy consumption for the subareas studied (excluding
feedstock energy). It is important to keep in mind that ideal conditions are unrealistic goals in practice and
these values serve only as a guide to estimating energy savings opportunities. As mentioned, the TM energy
consumption was used to calculate the current and R&D energy savings percentages (not zero).

BANDWIDTH STUDY ON ENERGY USE AND POTENTIAL ENERGY SAVING OPPORTUNITIES IN U.S. ADVANCED HIGH STRENGTH
STEELS MANUFACTURING
20 Thermodynamic Minimum Energy Intensity and Energy Consumption
Table 6-1. Calculated TM Energy Consumption for AHSS Manufacturing:
Application Areas Studied
Subarea
(product)
TM Energy
Intensity
(MMBtu/ton product)
[GJ/tonne product]
TM Energy
Consumption, Calculated
(TBtu/year)
Agglomeration
(sinter)
1.03
[1.20] 0.18
Cokemaking
(coke)
1.72
[2.00] 0.49
BF Ironmaking
(iron)
8.43
[9.80] 7.70
BOF Steelmaking
(raw steel)
-0.64
[-0.75] -0.68
EAF Steelmaking
(raw steel)
1.24
[1.44] 0.33
Casting/Rolling
(cast/rolled steel)
Casting <0.01 0.00
Hot Rolling
0.29
[0.34] 0.39
Cold Rolling
0.04
[0.05] 0.06
Total for Process Subareas
Studied 8.47
Thermodynamic minimum (TM)

Current and R&D Opportunity Analysis/Bandwidth Summary 21
7. Current and R&D Opportunity Analysis/Bandwith
Summary
Table 7-1 presents the current opportunity and R&D opportunity energy savings for the subareas studied
considering the AHSS production for the application area boundary considered for this study. Each row in
Table 7-1 shows the opportunity bandwidth for a specific AHSS manufacturing subarea and as a total.
As shown in Figure 7-1, two hypothetical opportunity bandwidths for energy savings are estimated (as defined
in Chapter 1). To complete the subareas studied, the analysis shows the following:
Current Opportunity – 7.4 TBtu per year of energy savings could be obtained if state of the art
technologies and practices are deployed.
R&D Opportunity – 3.2 TBtu per year of additional energy savings could be attained in the future if
applied R&D technologies under development worldwide are deployed (i.e., reaching the practical
minimum).
Figure 7-1 also shows the estimated current and R&D energy savings opportunities for individual AHSS
manufacturing subareas. The area between R&D opportunity and impractical is shown as a dashed line with
color fading because the PM energy savings impacts based on today’s knowledge of research tested between
laboratory and demonstration scale; emerging technologies being investigated through modeling and
theoretical calculations may eventually bring the PM energy consumption further into the faded region and
closer to the TM energy consumption.
Table 7-1. Current and R&D Opportunity for AHSS Manufacturing: Application Areas
Studied
Subarea
(product)
Current Opportunity
(CT-SOA)
(TBtu/year)
R&D Opportunity
(SOA-PM)
(TBtu/year)
Agglomeration
(sinter) 0.01 0.03
Cokemaking
(coke) 0.13 0.41
BF Ironmaking
(iron) 0.85 2.01
BOF Steelmaking
(raw steel) 0.93 0.07
EAF Steelmaking
(raw steel) 0.03 0.03
Casting/Rolling
(rolled steel)
Casting 0.17 0.01
Hot Rolling 2.12 0.27
Cold Rolling 3.17 0.34
Total for Process Subareas
Studied 7.41 3.18
Current typical (CT), state of the art (SOA), practical minimum (PM)

BANDWIDTH STUDY ON ENERGY USE AND POTENTIAL ENERGY SAVING OPPORTUNITIES IN U.S. ADVANCED HIGH STRENGTH
STEELS MANUFACTURING
22 Current and R&D Opportunity Analysis/Bandwidth Summary
Figure 7-1. Current and R&D energy savings opportunities in U.S. AHSS manufacturing for the subareas and
application areas studied
Source: EERE

Current and R&D Opportunity Analysis/Bandwidth Summary 23
The top three current energy savings opportunities for AHSS in the subareas studied are as follows:
Cold rolling – 3.3 TBtu (or 43% of the current opportunity)
Hot rolling – 2.1 TBtu (or 29% of the current opportunity)
Basic oxygen furnace steelmaking – 0.9 TBtu (or 13% of the current opportunity).
The top three R&D energy savings opportunities for AHSS in the subareas studied are as follows:
Blast furnace ironmaking – 2.0 TBtu (or 63% of the R&D opportunity)
Cokemaking – 0.4 TBtu (or 13% of the R&D opportunity).
Cold rolling – 0.3 TBtu (or 11% of the R&D opportunity)
The impractical bandwidth, or the difference between PM energy consumption and TM energy consumption,
represents the area that would require fundamental changes in AHSS manufacturing. The term impractical is
used because the PM energy consumption is based on current knowledge of R&D technologies tested between
laboratory and demonstration scale; further decreases in energy intensity have not been displayed at any
physical scale The TM energy consumption is based on ideal conditions that are typically unattainable in
commercial applications. It was used as the baseline for calculating the energy savings potentials (not zero) to
provide more accurate targets of energy savings opportunities.

BANDWIDTH STUDY ON ENERGY USE AND POTENTIAL ENERGY SAVING OPPORTUNITIES IN U.S. ADVANCED HIGH STRENGTH
STEELS MANUFACTURING
24 References
8. References
Abraham 2015 “Metallic Material Trends in the North American Light Vehicle.” Abraham, A. Presentation.
2015.
http://www.autosteel.org/~/media/Files/Autosteel/Great%20Designs%20in%20Steel/GDIS
%202015/Track%202%20-%20Abraham.pdf
AEHOF 2013 “ACIPCO’s 65-MW Contiarc Furnace.” Alabama Engineering Hall of Fame (AEHOF).
2013. http://aehof.eng.ua.edu/members/acipcos-65-megawatt-contiarc-furnace/
AISI 2011a 2010 Annual Statistical Report. American Iron and Steel Institute (AISI). 2011.
AISI 2011b Profile of the American Iron and Steel Institute 2010-2011. American Iron and Steel
Institute (AISI). 2011.
http://www.steel.org/~/media/Files/AISI/About%20AISI/Profile%20Brochure%20F-
singles_CX.pdf
AISI 2012 Profile of the American Iron and Steel Institute 2012. American Iron and Steel Institute
(AISI). 2012. http://www.steel.org/~/media/Files/AISI/Reports/2012%20Profile%20F4-
SDMIcrx-sm.pdf
AISI 2013a “2013 Steel Industry Profile.” American Iron and Steel Institute (AISI). 2013.
http://www.steel.org/About%20AISI/Industry%20Profile.aspx
AISI 2013b “Steelmaking Flowlines.” American Iron and Steel Institute (AISI). 2013.
http://www.steel.org/Making%20Steel/How%20Its%20Made/Steelmaking%20Flowlines.as
px
AISI 2015 Data on presentation slide provided by AISI. 2015.
AIST 2011 2011 Electric Arc Furnace Roundup. Association for Iron & Steel Technology (AIST).
2011.
APP 2010 The State–of-the-Art Clean Technologies (SOACT) for Steelmaking Handbook, 2nd Edition.
Asia Pacific Partnership on Clean Development and Climate (APP). 2010.
www.asiapacificpartnership.org/pdf/Projects/Steel/SOACT-Handbook-2nd-Edition.pdf
ArcelorMittal
2012
“Steel Industry Statistics.” ArcelorMittal. 2012.
http://usa.arcelormittal.com/sustainability/our-business/the-steel-industry/industry-statistics
Arvedi et al.
2008
“The Arvedi endless strip production line (ESP) from liquid steel to hot-rolled coil in seven
minutes.” Arvedi, G., Mazzolari, F., Bianchi, A., Holleis, G., Siegl, J, & Angerbauer, A. La
Revue de Métallurgie-CIT (July/August): 398–407. 2008.
Barati et al.
2011
“Energy recovery from high temperature slags.” Barati, M., S. Esfahani, & T. A. Utigard.
Energy 36(9): 5440–49. 2011.
Beraldo et al.
2003
“Implementation of Cold Tundish at CTS Continuous Casting Process.” Beraldo, A.K.,
Moreira, D.B., Duarte, J.C., Matos, M.F., & Nascimento, Z.D. La Revue de Métallurgie-
CIT. October, 955-960. 2003.

References 25
Birat et al.
1999
“CO2 Emissions and the Steel Industry’s available Responses to the Greenhouse Effect.”
Birat, J.-P., Vizioz, J.-P., de Lassat, Y., Schneider, M., & Jeanneau, M. IRSID. 1999.
http://www.ulcos.org/en/docs/Ref16%20-%20Sdiego.pdf
Birat et al.
2009
“The “CO2 Tool”: CO2 emissions & energy consumption of existing & breakthrough
steelmaking routes.” Birat, J.-P., Lorrain, J.-P., de Lassat, Y. La Revue de Metallurgie, 106
(09): 325-336.
BMWi 2008 Climate Protection and Energy Efficiency: Research, Development and Demonstration of
Modern Energy Technologies. German Federal Ministry of Economics and Technology
(BMWi). 2008. http://www.bmwi.de/Redaktion/EN/Publikationen/climate-protection-and-
energy-efficiency.pdf?__blob=publicationFile&v=1
Considine 2012 Economic Impacts of the American Steel Industry. Considine, T.J. 2012.
https://www.steel.org/Global/document-types/news/2012/americas-steel-industry-is-leading-
manufacturing-out-of-the-recession.aspx?siteLocation=17d77c91-adc3-4c5b-9158-
056d31998ed9
de Beer et al.
1998
Future Technologies for Energy-Efficient Iron and Steel Making. de Beer, J., Worrell, E., &
Blok, K. Annu. Rev. Energy Environ. 23:123-205. 1998.
Demeri 2013 Advanced High-Strength Steels: Science, Technology, and Applications. Demeri, Mahmoud
Y. ASM International: Materials Park, OH. 2013.
DOE 2002 Recycling and Reuse of BOF/BOP Steelmaking Slags. U.S. Department of Energy (DOE)
Office of Industrial Technology (OIT). 2002.
www.energy.gov/sites/prod/files/2014/05/f16/recycling_bof.pdf
DOE 2005 Process to Continuously Melt, Refine, and Cast High Quality Steel. U.S. Department of
Energy (DOE) Industrial Technologies Program (ITP). 2005.
www.energy.gov/sites/prod/files/2014/05/f16/dev_of_process.pdf
DOE 2010 IMPACTS: Industrial Technologies Program: Summary of Program Results for CY 2009.
U.S. Department of Energy (DOE) Industrial Technologies Program (ITP). 2010.
www1.eere.energy.gov/manufacturing/about/pdfs/impacts2009_full_report.pdf
DOE 2011 Grand Challenge Portfolio: Driving Innovations in Industrial Energy Efficiency. U.S.
Department of Energy (DOE), Industrial Technologies Program (ITP). 2011.
www1.eere.energy.gov/manufacturing/pdfs/grand_challenges_portfolio.pdf
DOE 2013 “Energy Savings Assessments (ESA).” Conducted by the U.S. Department of Energy (DOE)
and Oak Ridge National Laboratory (ORNL) between 2006 and 2011. Results obtained from
personal communications with Sachin Nimbalkar, Oak Ridge National Laboratory.
DOE 2014 Manufacturing Energy and Carbon Footprints. U.S. Department of Energy, Advanced
Manufacturing Office. 2014. http://energy.gov/eere/amo/manufacturing-energy-and-carbon-
footprints-2010-mecs
DOE 2015a Bandwidth Study on Energy Use and Potential Energy Saving Opportunities in U.S. Chemical Manufacturing. U.S. Department of Energy, Advanced Manufacturing Office.
Prepared by Energetics Incorporated. 2015. http://energy.gov/sites/prod/files/2015/08/f26/chemical_bandwidth_report.pdf

BANDWIDTH STUDY ON ENERGY USE AND POTENTIAL ENERGY SAVING OPPORTUNITIES IN U.S. ADVANCED HIGH STRENGTH
STEELS MANUFACTURING
26 References
DOE 2015b Bandwidth Study on Energy Use and Potential Energy Saving Opportunities in U.S. Iron and Steel Manufacturing. U.S. Department of Energy, Advanced Manufacturing Office.
Prepared by Energetics Incorporated. 2015.
http://energy.gov/sites/prod/files/2015/08/f26/iron_and_steel_bandwidth_report_0.pdf
DOE 2015c Bandwidth Study on Energy Use and Potential Energy Saving Opportunities in U.S. Petroleum Refining. U.S. Department of Energy, Advanced Manufacturing Office. Prepared
by Energetics Incorporated. 2015.
http://energy.gov/sites/prod/files/2015/08/f26/petroleum_refining_bandwidth_report.pdf
DOE 2015d Bandwidth Study on Energy Use and Potential Energy Saving Opportunities in U.S. Pulp and Paper Manufacturing. U.S. Department of Energy, Advanced Manufacturing Office.
Prepared by Energetics Incorporated. 2015.
http://energy.gov/sites/prod/files/2015/08/f26/pulp_and_paper_bandwidth_report.pdf
EIA 2009 “Manufacturing Energy and Consumption Survey (MECS) 2006.” U.S. Energy Information
Administration. 2009. http://www.eia.gov/consumption/manufacturing/data/2006/
EIA 2013a “Manufacturing Energy and Consumption Survey (MECS) 2010.” U.S. Energy Information
Administration (EIA). 2013. http://www.eia.gov/consumption/manufacturing/data/2010/
EIA 2013b Model Documentation Report: Industrial Demand Module of the National Energy Modeling System. U.S. Energy Information Administration (EIA). 2013.
http://www.eia.gov/outlooks/aeo/nems/documentation/industrial/pdf/m064(2013).pdf
Energetics
2000
Energy and Environmental Profile of the U.S. Steel Industry. Energetics, Inc. for U.S.
Department of Energy, Office of Industrial Technologies. 2000.
http://energy.gov/sites/prod/files/2013/11/f4/steel_profile.pdf
Energetics
2004
Steel Industry Energy Bandwidth Study. Energetics, Inc. for U.S. Department of Energy,
Industrial Technologies Program. 2004.
http://energy.gov/sites/prod/files/2013/11/f4/steelbandwidthstudy.pdf
Energetics
2005
Steel Industry Marginal Opportunity Study. Energetics, Inc. for U.S. Department of Energy,
Industrial Technologies Program. 2005.
http://energy.gov/sites/prod/files/2013/11/f4/steelmarginalopportunity.pdf
Energiron 2013 “Energiron: The Innovative Direct Reduction Technology.” Energiron. 2013.
http://www.energiron.com/
EPA 2011 “Location of U.S. Facilities.” U.S. Environmental Protection Agency (EPA). 2011.
EPA 2012 Available and Emerging Technologies for Reducing Greenhouse Gas Emissions from the
Iron and Steel Industry. U.S. Environmental Protection Agency (EPA). 2012.
https://www.epa.gov/sites/production/files/2015-12/documents/ironsteel.pdf
Fruehan et al.
2000
Theoretical Minimum Energies to Produce Steel for Selected Conditions. Fruehan, R.J.,
Fortini, O., Paxton, H.W., and Brindle, R. for the U.S. Department of Energy Office of
Industrial Technologies. 2000.
http://energy.gov/sites/prod/files/2013/11/f4/theoretical_minimum_energies.pdf

References 27
Giavani et al.
2012
“Consteel® EvolutionTM – The Second Generation of Consteel Technology.” Giavani, C.,
Malfa, E., & Memoli, F. Industrial Heating. 2012.
http://www.industrialheating.com/articles/90594-consteel-evolution---the-second-
generation-of-consteel-technology
Gordon et al.
2010
Ironmaking Technology Selection for Site Specific Conditions. Gordon, Y., Freislich, M., &
Els, J. AISTech 2010 Proceedings – Volume I: 519-528. 2010.
Griggs 2013 “Nucor’s La. plant near completion.” Griggs, T. The Advocate. 2013.
GTI 2011 Final Technical Report: Advanced Energy and Water Recovery Technology from Low
Grade Waste Heat. Gas Technology Institute (GTI). 2011.
www.osti.gov/bridge/servlets/purl/1031483/1031483.pdf
IEA 2007 Tracking Industrial Energy Efficiency and CO2 Emissions. International Energy Agency (IEA).
2007. http://www.iea.org/publications/freepublications/publication/tracking_emissions.pdf
IMP 2006 Verification of Steelmaking Slag Iron Content, Final Technical Progress Report. DE-FC36-
01ID14046. Institute of Materials Processing (IMP), Michigan Technological University.
2006.
www.ntis.gov/assets/pdf/st-on-cd/DE2006892748.pdf
Inoue 1995 “The Steel Industry in Japan: Progress in Continuous Casting.” In Energy Efficiency
Utilizing High Technology: As Assessment of Energy Use in Industry and Buildings, Appendix A: Case Studies. Inoue, K. 1995.
IPPC 2001 Reference Document on Best Available Techniques for the Production of Iron and Steel.
European Union. Integrated Pollution Prevention and Control Bureau (IPPC). 2001.
IPPC 2013 Best Available Techniques (BAT) Reference Document for Iron and Steel Production.
European Commission. Integrated Pollution Prevention and Control (IPPC). 2013.
http://eippcb.jrc.ec.europa.eu/reference/BREF/IS_Adopted_03_2012.pdf
JISF 2012 “Technologies to Reduce CO2 Emissions.” Japan Iron and Steel Federation (JISF). 2012.
www.jisf.or.jp/course50/tecnology01/index_en.html
KR Tec n.d. Environmental Preheating and Continuous Charging System (EP). KR Tec and CVS
Technology. n.d.
LBNL 2000 Emerging Energy-Efficient Industrial Technologies. Martin, N., Worrell, E., Ruth, M., Price,
L., Elliott, R.N., Shipley, A.M., & Thorne, J. for Lawrence Berkeley National Laboratory
(LBNL). 2000.
LBNL 2008 World Best Practice Energy Intensity Values for Selected Industrial Sectors. Worrell, E.,
Price, L., Neelis, M., Galitsky, C., & Nan, Z. for Lawrence Berkeley National Laboratory
(LBNL). 2008. http://ies.lbl.gov/sites/all/files/industrial_best_practice_en_0.pdf
LBNL 2010a Development of Bottom-up Representation of Industrial Energy Efficient Technologies in
Integrated Assessment Models for the Iron and Steel Sector. Xu, T., Sathaye, J., & Galitsky,
C. for Lawrence Berkeley National Laboratory (LBNL). 2010.
http://ies.lbl.gov/sites/all/files/lbnl-4314e_0.pdf
LBNL 2010b Energy Efficiency Improvement and Cost Saving Opportunities for the Iron and Steel
Industry: An ENERGY STAR Guide for Energy and Plant Managers. Neelis, M., Worrell,
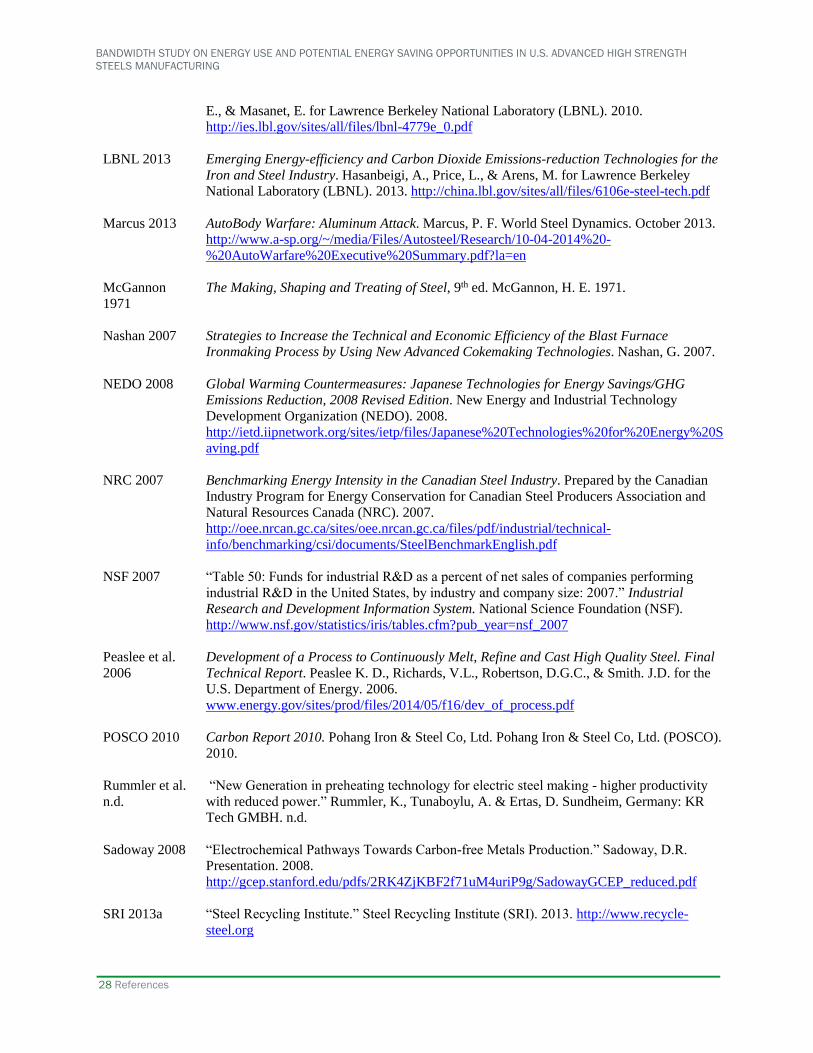
BANDWIDTH STUDY ON ENERGY USE AND POTENTIAL ENERGY SAVING OPPORTUNITIES IN U.S. ADVANCED HIGH STRENGTH
STEELS MANUFACTURING
28 References
E., & Masanet, E. for Lawrence Berkeley National Laboratory (LBNL). 2010.
http://ies.lbl.gov/sites/all/files/lbnl-4779e_0.pdf
LBNL 2013 Emerging Energy-efficiency and Carbon Dioxide Emissions-reduction Technologies for the
Iron and Steel Industry. Hasanbeigi, A., Price, L., & Arens, M. for Lawrence Berkeley
National Laboratory (LBNL). 2013. http://china.lbl.gov/sites/all/files/6106e-steel-tech.pdf
Marcus 2013 AutoBody Warfare: Aluminum Attack. Marcus, P. F. World Steel Dynamics. October 2013.
http://www.a-sp.org/~/media/Files/Autosteel/Research/10-04-2014%20-
%20AutoWarfare%20Executive%20Summary.pdf?la=en
McGannon
1971
The Making, Shaping and Treating of Steel, 9th ed. McGannon, H. E. 1971.
Nashan 2007 Strategies to Increase the Technical and Economic Efficiency of the Blast Furnace Ironmaking Process by Using New Advanced Cokemaking Technologies. Nashan, G. 2007.
NEDO 2008 Global Warming Countermeasures: Japanese Technologies for Energy Savings/GHG Emissions Reduction, 2008 Revised Edition. New Energy and Industrial Technology
Development Organization (NEDO). 2008.
http://ietd.iipnetwork.org/sites/ietp/files/Japanese%20Technologies%20for%20Energy%20S
aving.pdf
NRC 2007 Benchmarking Energy Intensity in the Canadian Steel Industry. Prepared by the Canadian
Industry Program for Energy Conservation for Canadian Steel Producers Association and
Natural Resources Canada (NRC). 2007.
http://oee.nrcan.gc.ca/sites/oee.nrcan.gc.ca/files/pdf/industrial/technical-
info/benchmarking/csi/documents/SteelBenchmarkEnglish.pdf
NSF 2007 “Table 50: Funds for industrial R&D as a percent of net sales of companies performing
industrial R&D in the United States, by industry and company size: 2007.” Industrial Research and Development Information System. National Science Foundation (NSF).
http://www.nsf.gov/statistics/iris/tables.cfm?pub_year=nsf_2007
Peaslee et al.
2006
Development of a Process to Continuously Melt, Refine and Cast High Quality Steel. Final
Technical Report. Peaslee K. D., Richards, V.L., Robertson, D.G.C., & Smith. J.D. for the
U.S. Department of Energy. 2006.
www.energy.gov/sites/prod/files/2014/05/f16/dev_of_process.pdf
POSCO 2010 Carbon Report 2010. Pohang Iron & Steel Co, Ltd. Pohang Iron & Steel Co, Ltd. (POSCO).
2010.
Rummler et al.
n.d.
“New Generation in preheating technology for electric steel making - higher productivity
with reduced power.” Rummler, K., Tunaboylu, A. & Ertas, D. Sundheim, Germany: KR
Tech GMBH. n.d.
Sadoway 2008 “Electrochemical Pathways Towards Carbon-free Metals Production.” Sadoway, D.R.
Presentation. 2008.
http://gcep.stanford.edu/pdfs/2RK4ZjKBF2f71uM4uriP9g/SadowayGCEP_reduced.pdf
SRI 2013a “Steel Recycling Institute.” Steel Recycling Institute (SRI). 2013. http://www.recycle-
steel.org

References 29
SRI 2013b “Steel Recycling Rates.” Steel Recycling Institute (SRI). 2013. http://www.recycle-
steel.org/Recycling%20Resources/Steel%20Recycling%20Rates.aspx
Steel
Dynamics, Inc.
n.d.
Welcome to Mesabi Nugget. Presentation. n.d.
Stelco 1993 Present and Future Use of Energy in the Canadian Steel Industry. Ottawa, Canada:
CANMET. Stelco. 1993.
Stubbles 2000 Energy Use in the U.S. Steel Industry: An Historical Perspective and Future Opportunities.
Stubbles, J. for the U.S. Department of Energy, Office of Industrial Technologies. 2000.
http://energy.gov/sites/prod/files/2013/11/f4/steel_energy_use.pdf
Thekdi 2010 Development of Next Generation Heating System For Scale Free Steel Reheating-Final
Technical Report. Thekdi, A. for the U.S Department of Energy. 2010.
www.osti.gov/scitech/servlets/purl/1004059
UNIDO 2010 Global Technology Roadmap for CCS in Industry: Steel Sectoral Report. Birat, JP for the
United Nations Industrial Development Organization (UNIDO). 2010.
https://hub.globalccsinstitute.com/sites/default/files/publications/15671/global-technology-
roadmap-ccs-industry-steel-sectoral-report.pdf
USCB 2012 “North American Industry Classification System.” United States Census Bureau (USCB).
2012. http://www.census.gov/eos/www/naics/index.html
USGS 2012a 2010 Minerals Yearbook: Iron and Steel [Advance Release]. U.S. Geological Survey
(USGS). 2012. http://minerals.usgs.gov/minerals/pubs/commodity/iron_&_steel/myb1-
2010-feste.pdf
USGS 2012b Mineral Commodity Summaries, January 2012: Iron and Steel. Prepared by Fenton, M.D.
for the U.S. Geological Survey (USGS). 2012.
http://minerals.er.usgs.gov/minerals/pubs/commodity/iron_&_steel/mcs-2012-feste.pdf
USGS 2012c 2010 Minerals Yearbook: Iron and Steel Scrap [Advance Release]. U.S. Geological Survey
(USGS). 2012.
http://minerals.usgs.gov/minerals/pubs/commodity/iron_%26_steel_scrap/myb1-2010-
fescr.pdf
Voestalpine
2013
“Voestalpine constructing direct reduction plan in Texas, USA.” Voestalpine. 2013.
http://www.voestalpine.com/group/en/media/press-releases/2013-07-04-voestalpine-
entrusts-construction-of-the-direct-reduction-plant-in-texas-to-siemens-and-
midrex/?year=2013
WCA 2013 “Coal & Steel.” World Coal Association (WCA). 2013. http://www.worldcoal.org/coal/uses-
of-coal/coal-steel
Worrell &
Reuter 2014
Handbook of Recycling: State-of-the-Art for Practitioners, Analysts, and Scientists. Worrell,
E. & M.A. Reuter. 2014. United States of America: Elsevier, Inc.
WSA 2012 Sustainable Steel: At the core of a green economy. World Steel Association (WSA). 2012.
https://www.worldsteel.org/en/dam/jcr:288d6eb6-4efc-493e-b9da-04a9a4258528/Sustainable+steel+at+the+core+of+a+green+economy.pdf

BANDWIDTH STUDY ON ENERGY USE AND POTENTIAL ENERGY SAVING OPPORTUNITIES IN U.S. ADVANCED HIGH STRENGTH
STEELS MANUFACTURING
30 References
WSA 2014 Fact Sheet: Advanced steel applications. World Steel Association (WSA). October 2014.
https://www.worldsteel.org/publications/fact-sheets.html
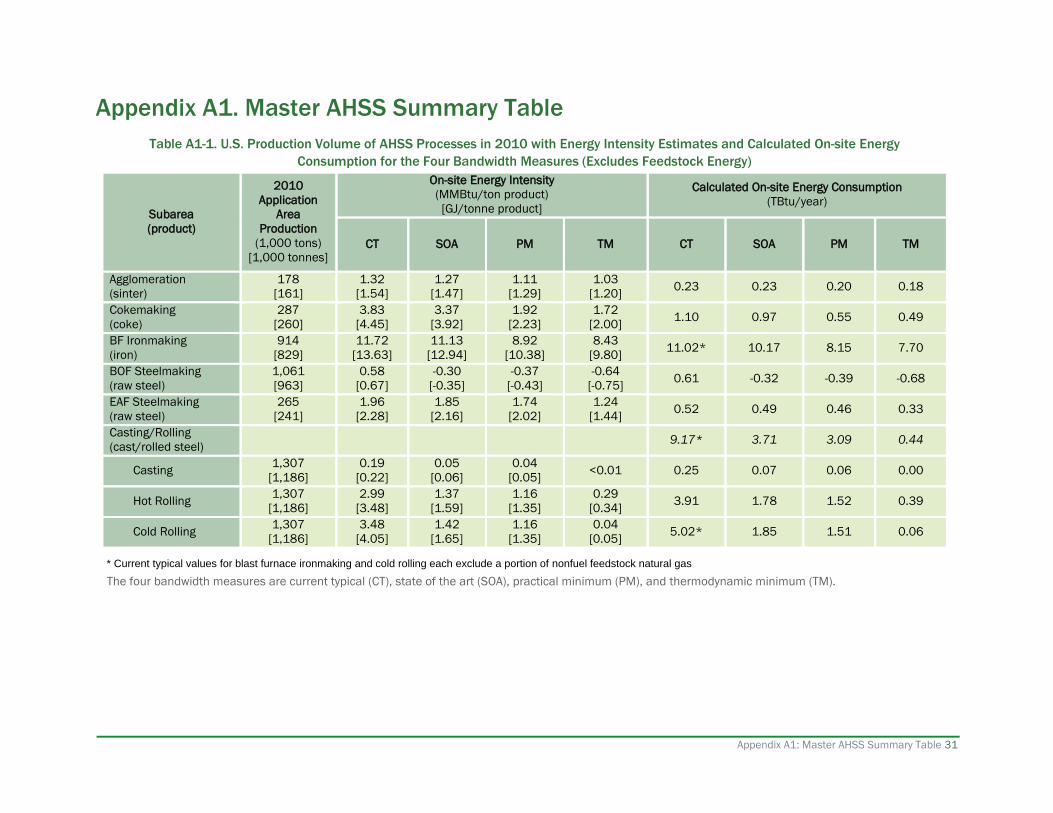
Appendix A1: Master AHSS Summary Table 31
Appendix A1. Master AHSS Summary Table
Table A1-1. U.S. Production Volume of AHSS Processes in 2010 with Energy Intensity Estimates and Calculated On-site Energy
Consumption for the Four Bandwidth Measures (Excludes Feedstock Energy)
Subarea
(product)
2010
Application
Area
Production
(1,000 tons)
[1,000 tonnes]
On-site Energy Intensity
(MMBtu/ton product)
[GJ/tonne product]
Calculated On-site Energy Consumption
(TBtu/year)
CT SOA PM TM CT SOA PM TM
Agglomeration
(sinter)
178
[161]
1.32
[1.54]
1.27
[1.47]
1.11
[1.29]
1.03
[1.20] 0.23 0.23 0.20 0.18
Cokemaking
(coke)
287
[260]
3.83
[4.45]
3.37
[3.92]
1.92
[2.23]
1.72
[2.00] 1.10 0.97 0.55 0.49
BF Ironmaking
(iron)
914
[829]
11.72
[13.63]
11.13
[12.94]
8.92
[10.38]
8.43
[9.80] 11.02* 10.17 8.15 7.70
BOF Steelmaking
(raw steel)
1,061
[963]
0.58
[0.67]
-0.30
[-0.35]
-0.37
[-0.43]
-0.64
[-0.75]0.61 -0.32 -0.39 -0.68
EAF Steelmaking
(raw steel)
265
[241]
1.96
[2.28]
1.85
[2.16]
1.74
[2.02]
1.24
[1.44] 0.52 0.49 0.46 0.33
Casting/Rolling
(cast/rolled steel) 9.17* 3.71 3.09 0.44
Casting 1,307
[1,186]
0.19
[0.22]
0.05
[0.06]
0.04
[0.05] <0.01 0.25 0.07 0.06 0.00
Hot Rolling 1,307
[1,186]
2.99
[3.48]
1.37
[1.59]
1.16
[1.35]
0.29
[0.34] 3.91 1.78 1.52 0.39
Cold Rolling 1,307
[1,186]
3.48
[4.05]
1.42
[1.65]
1.16
[1.35]
0.04
[0.05] 5.02* 1.85 1.51 0.06
* Current typical values for blast furnace ironmaking and cold rolling each exclude a portion of nonfuel feedstock natural gas
The four bandwidth measures are current typical (CT), state of the art (SOA), practical minimum (PM), and thermodynamic minimum (TM).

BANDWIDTH STUDY ON ENERGY USE AND POTENTIAL ENERGY SAVING OPPORTUNITIES IN U.S. ADVANCED HIGH STRENGTH STEELS MANUFACTURING
32 Appendix A2: References for Production, CT, SOA, PM, TM
Appendix A2: References for Production, CT, SOA, PM, TM
Table A2-1. U.S. Production Volume of AHSS Processes in 2010 with Energy Intensity Estimates and Calculated On-site Energy
Consumption for the Four Bandwidth Measures (Excludes Feedstock Energy)
Subarea Production Reference(s) CT Energy Intensity
Reference(s)
SOA Energy Intensity
Reference(s)
TM Energy Intensity
Reference(s)
Agglomeration
(sinter)
Estimated based on AISI 2011a,
Abraham 2015, expert
communications
IPPC 2013 LBNL 2008 Fruehan et al. 2000
Cokemaking
(coke)
Estimated based on AISI 2011a,
Demeri 2013, Abraham 2015,
expert communications
AISI 2011a; EIA 2013b NRC 2007 Fruehan et al. 2000
BF Ironmaking
(iron)
Estimated based on AISI 2011a,
Demeri 2013, Abraham 2015,
expert communications
AISI 2011a; IPPC 2013 NRC 2007 Fruehan et al. 2000
BOF Steelmaking
(raw steel)
Estimated based on AISI 2011a,
Abraham 2015, expert
communications
IPPC 2013 NRC 2007 Fruehan et al. 2000
EAF Steelmaking
(raw steel)
Estimated based on AISI 2011a,
Abraham 2015, expert
communications
AIST 2011 NRC 2007; Giavani et al. 2012 Fruehan et al. 2000
Casting/Rolling
(cast/rolled steel)
Casting Estimated based on AISI 2011a,
Abraham 2015, expert
communications
NRC 2007 NRC 2007; LBNL 2008 Fruehan et al. 2000
Hot Rolling Estimated based on AISI 2011a,
Abraham 2015, expert
communications
NRC 2007 NRC 2007 Fruehan et al. 2000
Cold Rolling Estimated based on AISI 2011a,
Abraham 2015, expert
communications
EIA 2013b LBNL 2008 Fruehan et al. 2000
The four bandwidth measures are current typical (CT), state of the art (SOA), practical minimum (PM), and thermodynamic minimum (TM)

Appendix A3: Practical Minimum Energy Intensity Calculation and Technologies Considered 33
Appendix A3: Practical Minimum Energy Intensity Calculation and Technologies
Considered To estimate PM energy consumption for this bandwidth analysis, a broad search of R&D activities in the iron and steel industry was conducted. A large
number and range of potential technologies were identified. If more than one technology was considered for a particular process, the technology that
resulted in the lowest energy intensity was conservatively selected for the PM energy intensity. The on-site PM energy intensity and consumption values
are shown in Table A3-1 below.
Table A3-1. Calculated PM Energy Consumption for AHSS Manufacturing: Application
Areas Considered
Subarea
(product)
On-site PM Energy Intensity
(MMBtu/ton product)
[GJ/tonne product]
On-site PM Energy
Consumption, Calculated
(TBtu/year)
Agglomeration (sinter) 1.11
[1.29] 0.10
Cokemaking (coke) 1.92
[2.23] 0.28
BF Ironmaking (iron) 8.92
[10.38] 4.08
BOF Steelmaking (raw steel) -0.37
[-0.43]-0.19
EAF Steelmaking (raw steel) 1.74
[2.02] 1.46
Casting/Rolling
(cast/rolled steel)
Casting 0.04
[0.05] 0.06
Hot Rolling 1.16
[1.35] 1.57
Cold Rolling 1.16
[1.35] 1.56
Total for Process Subareas
Studied 8.91
Practical Minimum (PM)

BANDWIDTH STUDY ON ENERGY USE AND POTENTIAL ENERGY SAVING OPPORTUNITIES IN U.S. ADVANCED HIGH STRENGTH STEELS MANUFACTURING
34 Appendix A3: Practical Minimum Energy Intensity Calculation and Technologies Considered
The PM energy intensity for AHSS manufacturing was determined based on the technologies outlined in Table A3-2. The applicability column indicates
the subarea/sub-process where the technology is considered for application. The percent savings over the PM baseline is estimated, along with a brief
explanation. Some technologies in Table A3-2 were considered but not included in the final PM model (in most of the cases the savings estimates were
too conservative). In some cases, likely due to the conservative estimates of researchers, the estimated PM energy intensity was higher than the SOA
energy intensity. For these cases, the crosscutting technology savings estimates were utilized. R&D in some process areas is more broadly applicable,
such as utility/power generation improvements and crosscutting technologies. Cross-cutting technologies applied during the PM analysis included new
high-temperature, low-cost ceramic media for natural gas combustion burners, advanced energy and water recovery technology from low-grade waste
heat, and control systems for recycling steel residues. The estimated energy savings from crosscutting improvements were assumed to be applicable to all
six processes studied. To calculate PM energy intensity, the SOA energy intensity and TM energy intensity were multiplied by the combined estimated
savings for crosscutting improvements (19%) and subtracted from the SOA energy consumption:
𝑃𝑀 = 𝑆𝑂𝐴 − (𝑆𝑂𝐴 − 𝑇𝑀) ∗ (19%)
Table A3-3 provides a more comprehensive list of some of the technologies considered in studying R&D technology opportunities for AHSS
manufacturing.
Table A3-2. Details of PM Technologies Considered
Technology Name Description Applicability
Explanation of
energy savings
assumptions
PM Energy Intensity
(Btu/lb) or Percent
savings (over baseline
energy)
Included
in PM
model?
Reason for
excluding (if
applicable)
Reference
Single-chamber-
system coking
reactors
Replace series of coking
ovens with a single large
volume oven
Cokemaking Thermal efficiency
improvement from
38% to 70%
1,186 Btu/lb Yes Dı́ez et al.
2002, IPPC
2001, EPA
2012, Nashan
2007, LBNL
2010b
Coal Moisture
Control
Drying of coal with waste
heat gases
Cokemaking Fuel savings of 0.3
GJ/tonne
1,778 Btu/lb No Single-chamber-
system coking
reactors
provides a lower
baseline energy
use.
APP 2010
Top Pressure
Recovery Turbines
Uses hot high pressure
gas from the furnace to
power a turbine; dust
removal from blast
furnace gases using dry
and wet methods.
BF
Ironmaking
Turbine could
produce additional
14-36 kWh/ton of
hot metal
(depending on
available pressure)
5,811 Btu/lb No Drum chute and
segregation slit
charging
provides a lower
baseline energy
use.
APP 2010, EPA
2012, Inoue
1995, NEDO
2008, Stelco
1993

Appendix A3: Practical Minimum Energy Intensity Calculation and Technologies Considered 35
Technology Name Description Applicability
Explanation of
energy savings
assumptions
PM Energy Intensity
(Btu/lb) or Percent
savings (over baseline
energy)
Included
in PM
model?
Reason for
excluding (if
applicable)
Reference
Drum Chute and
Segregation Slit
Charging
Use of a drum chute and
segregation slit wire to
control the particles
dropping into the furnace
BF
Ironmaking
Can decrease
coke use by 0.7
MMBtu/ton
5,509 Btu/lb Yes EPA 2012,
NEDO 2008,
LBNL 2010b
Heat recovery from
blast furnace slag
Capture of embedded
heat in blast furnace slag
through recovery as hot
air or steam, chemical
energy, or thermoelectric
power.
BF
Ironmaking
Savings of
approximately
0.35 GJ/tonne of
pig iron
5,709 Btu/lb No Drum chute and
segregation slit
charging
provides a lower
baseline energy
use.
Barati et al.
2011, IPPC
2013, JISF
2012, LBNL
2010b, POSCO
2010
Recycling and
reuse of basic
oxygen furnace slag
Separates BOF slag into
three products allowing
greater iron recovery and
recycling and uses low-
grade iron byproduct for
acid mine neutralization.
BOF
Steelmaking
Estimated savings
of 0.12
MMBtu/ton (0.14
GJ/tonne)
229 Btu/lb No Value is higher
than SOA energy
intensity
DOE 2002,
IMP 2006,
Energetics
2005
EPC System for
Side Charging and
Scrap Preheating
Design to allow
continuous charging of
preheated scarp into the
EAF, including separation
of preheating and cold
scrap charging. Reduces
gas flows, uses a totally
sealed system and
provides substantial
reduction in dust and
other emissions.
EAF
Steelmaking
Preheating of
scrap up to 700
°C reduces EAF
energy
consumption by up
to 100 kWh/tonne
of molten steel.
930 Btu/lb No Contiarc furnace
provides a lower
baseline energy
use.
KR Tec n.d.,
Rummler et al.
n.d.
Contiac Furnace Replaces the ladle
metallurgy furnace with a
continuous series of
vessels,
EAF
Steelmaking
Reduced energy
losses (200
kWh/ton) over
conventional
furnace
636 Btu/lb No PM energy
intensity only
just above TM
energy intensity
AEHOF 2013,
EPA 2012,
IPPC 2013
Continuous casting
for EAF
Casting Anticipated 10%
decrease in energy
consumption
85 Btu/lb No Value is higher
than SOA energy
intensity
Peaslee et al.
2006, DOE
2005

BANDWIDTH STUDY ON ENERGY USE AND POTENTIAL ENERGY SAVING OPPORTUNITIES IN U.S. ADVANCED HIGH STRENGTH STEELS MANUFACTURING
36 Appendix A3: Practical Minimum Energy Intensity Calculation and Technologies Considered
Technology Name Description Applicability
Explanation of
energy savings
assumptions
PM Energy Intensity
(Btu/lb) or Percent
savings (over baseline
energy)
Included
in PM
model?
Reason for
excluding (if
applicable)
Reference
Tundish heating
technologies (cold
tundish)
Using a cold tundish
(heating a tundish
inductively and not by
combustion)
Casting 78% decrease in
natural gas usage
85 Btu/lb No Value is higher
than SOA energy
intensity
Beraldo et al.
2003, EPA
2012, LBNL
2010b
Endless rolling New development in thin
slab casting and direct
rolling
Rolling Anticipated 40%
lower energy than
a traditional rolling
mill
897 Btu/lb (hot
rolling)
1,044 Btu/lb (cold
rolling)
No Value is higher
than SOA energy
intensity
Arvedi et al.
2008, EPA
2012
Next-generation
system for scale-
free steel reheating
Use of preheated or
oxygen-enriched air to
control flue gas. Improves
the quality and yield of
steel while increasing
energy and production
efficiency.
Rolling Consumes 22-32%
of current energy
used for reheating;
0.2 GJ/tonne
during reheating
1,410 Btu/lb (hot
rolling)
1,655 Btu/lb (cold
rolling)
No Endless rolling
provides a lower
baseline energy
use;
Thekdi 2010,
DOE 2010
High temperature
insulation materials
Innovative insulating
materials that will limit
their consumption in a
furnace.
Rolling Energy savings of
30-35% are
possible; likely
savings of 2-5% on
furnaces
1,425 Btu/lb (hot
rolling)
1,670 Btu/lb (cold
rolling)
No Endless rolling
provides a lower
baseline energy
use.
BMWi 2008,
EPA 2012
New High-
Temperature, Low-
Cost Ceramic
Media for Natural
Gas Combustion
Burners
Combining four different
technologies into a single
radiant burner package
that functions as both a
burner and a catalyst
support.
Crosscutting Potential to reduce
energy
consumption by
25% for process
heat.
16% Yes DOE 2011

Appendix A3: Practical Minimum Energy Intensity Calculation and Technologies Considered 37
Technology Name Description Applicability
Explanation of
energy savings
assumptions
PM Energy Intensity
(Btu/lb) or Percent
savings (over baseline
energy)
Included
in PM
model?
Reason for
excluding (if
applicable)
Reference
Advanced Energy
and Water
Recovery
Technology from
Low-Grade Waste
Heat
Recovery of high purity
water and energy from low
grade heat, high moisture
waste streams using
nanoporous membranes.
Will prove concept in
laboratory and evaluate in
"two different types of
industrial environments.
Crosscutting The amount of
energy savings
would depend on
the amount of
waste heat could
be recovered.
Using the
nanoporous
membrane
technology could
increase heat
recovery by 20-
30% it would
appear.
1% Yes DOE 2011c;
GTI 2011
Control systems for
energy-efficient
recycling of steel
residues
By utilizing computer-
aided control of the
process conditions,
changes can be made in
the prevailing conditions
to reduce recycling energy
consumption. In practical
trials this software helped
reduce energy
consumption by 10%. The
modular design of this
software also enables
changes to the processing
conditions to reflect the
desired product quality.
Crosscutting Opportunity
reduced to 2%.
2% Yes BMWi 2008
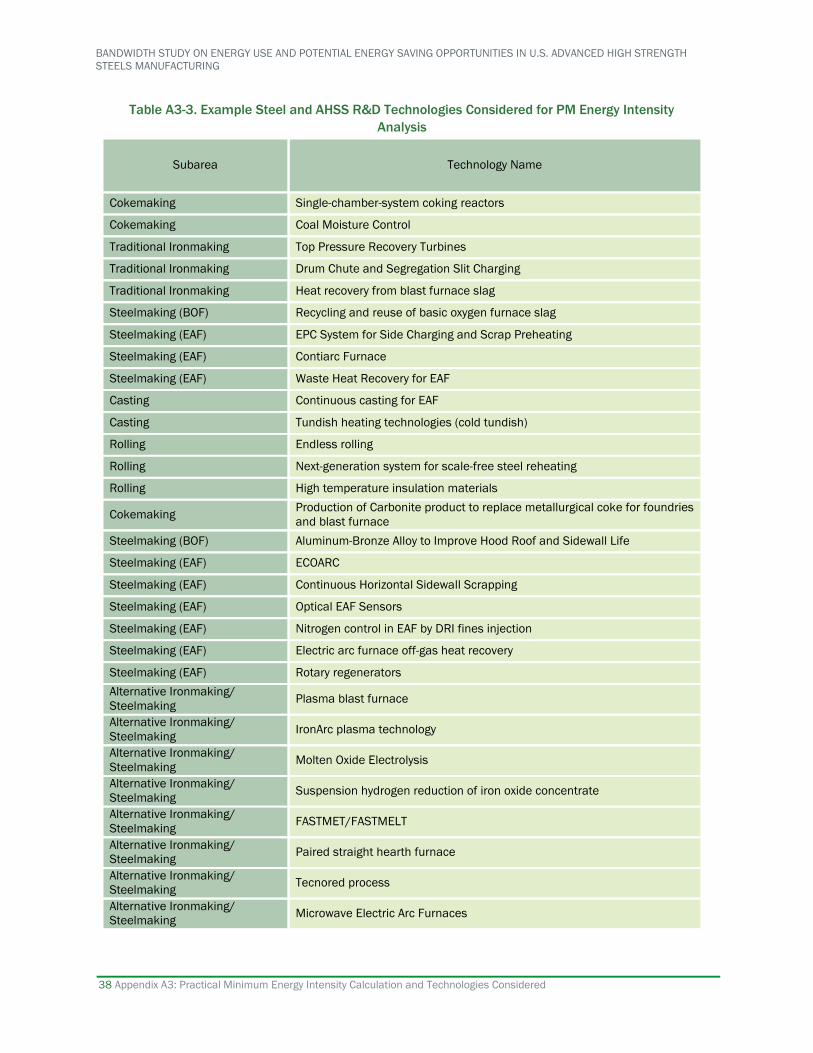
BANDWIDTH STUDY ON ENERGY USE AND POTENTIAL ENERGY SAVING OPPORTUNITIES IN U.S. ADVANCED HIGH STRENGTH
STEELS MANUFACTURING
38 Appendix A3: Practical Minimum Energy Intensity Calculation and Technologies Considered
Table A3-3. Example Steel and AHSS R&D Technologies Considered for PM Energy Intensity
Analysis
Subarea Technology Name
Cokemaking Single-chamber-system coking reactors
Cokemaking Coal Moisture Control
Traditional Ironmaking Top Pressure Recovery Turbines
Traditional Ironmaking Drum Chute and Segregation Slit Charging
Traditional Ironmaking Heat recovery from blast furnace slag
Steelmaking (BOF) Recycling and reuse of basic oxygen furnace slag
Steelmaking (EAF) EPC System for Side Charging and Scrap Preheating
Steelmaking (EAF) Contiarc Furnace
Steelmaking (EAF) Waste Heat Recovery for EAF
Casting Continuous casting for EAF
Casting Tundish heating technologies (cold tundish)
Rolling Endless rolling
Rolling Next-generation system for scale-free steel reheating
Rolling High temperature insulation materials
Cokemaking Production of Carbonite product to replace metallurgical coke for foundries
and blast furnace
Steelmaking (BOF) Aluminum-Bronze Alloy to Improve Hood Roof and Sidewall Life
Steelmaking (EAF) ECOARC
Steelmaking (EAF) Continuous Horizontal Sidewall Scrapping
Steelmaking (EAF) Optical EAF Sensors
Steelmaking (EAF) Nitrogen control in EAF by DRI fines injection
Steelmaking (EAF) Electric arc furnace off-gas heat recovery
Steelmaking (EAF) Rotary regenerators
Alternative Ironmaking/
Steelmaking Plasma blast furnace
Alternative Ironmaking/
Steelmaking IronArc plasma technology
Alternative Ironmaking/
Steelmaking Molten Oxide Electrolysis
Alternative Ironmaking/
Steelmaking Suspension hydrogen reduction of iron oxide concentrate
Alternative Ironmaking/
Steelmaking FASTMET/FASTMELT
Alternative Ironmaking/
Steelmaking Paired straight hearth furnace
Alternative Ironmaking/
Steelmaking Tecnored process
Alternative Ironmaking/
Steelmaking Microwave Electric Arc Furnaces

Appendix A3: Practical Minimum Energy Intensity Calculation and Technologies Considered 39
Table A3-3. Example Steel and AHSS R&D Technologies Considered for PM Energy Intensity
Analysis
Subarea Technology Name
Alternative Ironmaking/
Steelmaking Cyclone converter Furnace
Alternative Ironmaking/
Steelmaking Coal and natural gas based HYL process for DRI
Alternative Ironmaking/
Steelmaking FINEX Process
Casting Near-net-shape casting [thin slab or strip casting]
Rolling Thermochemical recuperation for steel reheating

For more information, visit: energy.gov/eere/amo
DOE/EE-1661 • September 2017